
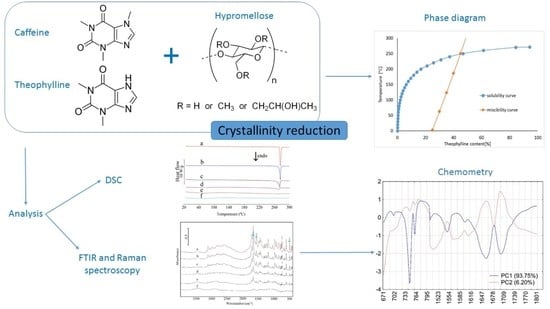
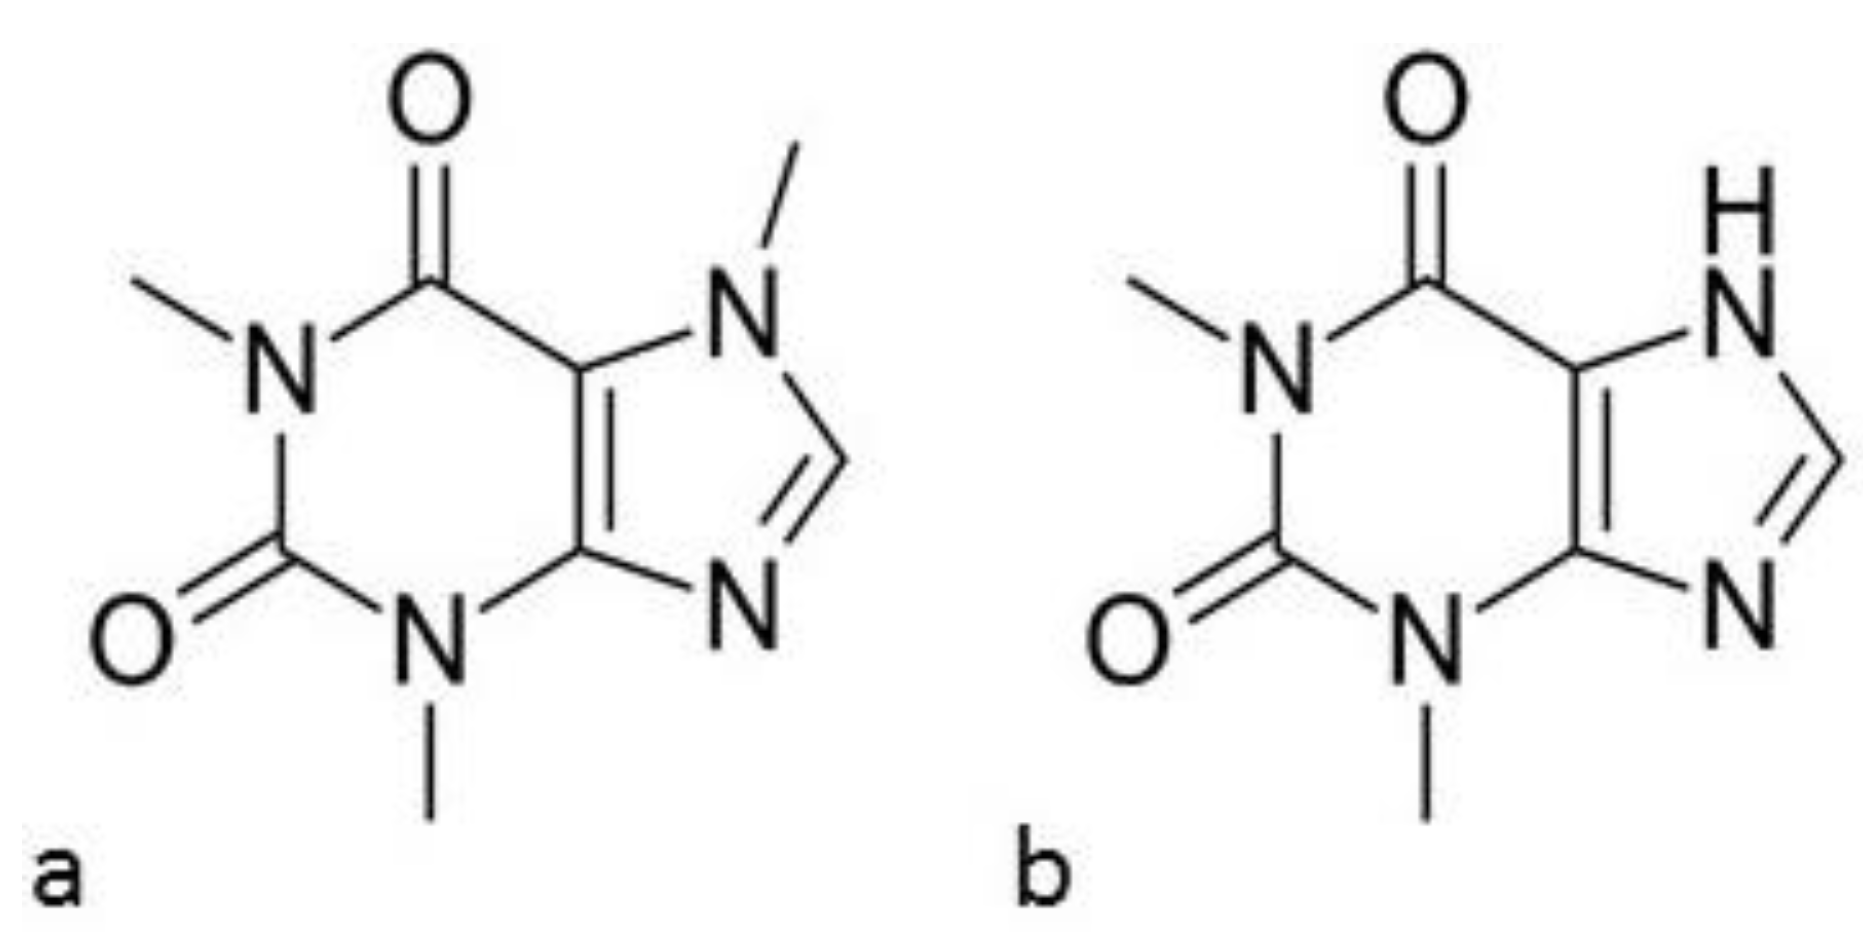
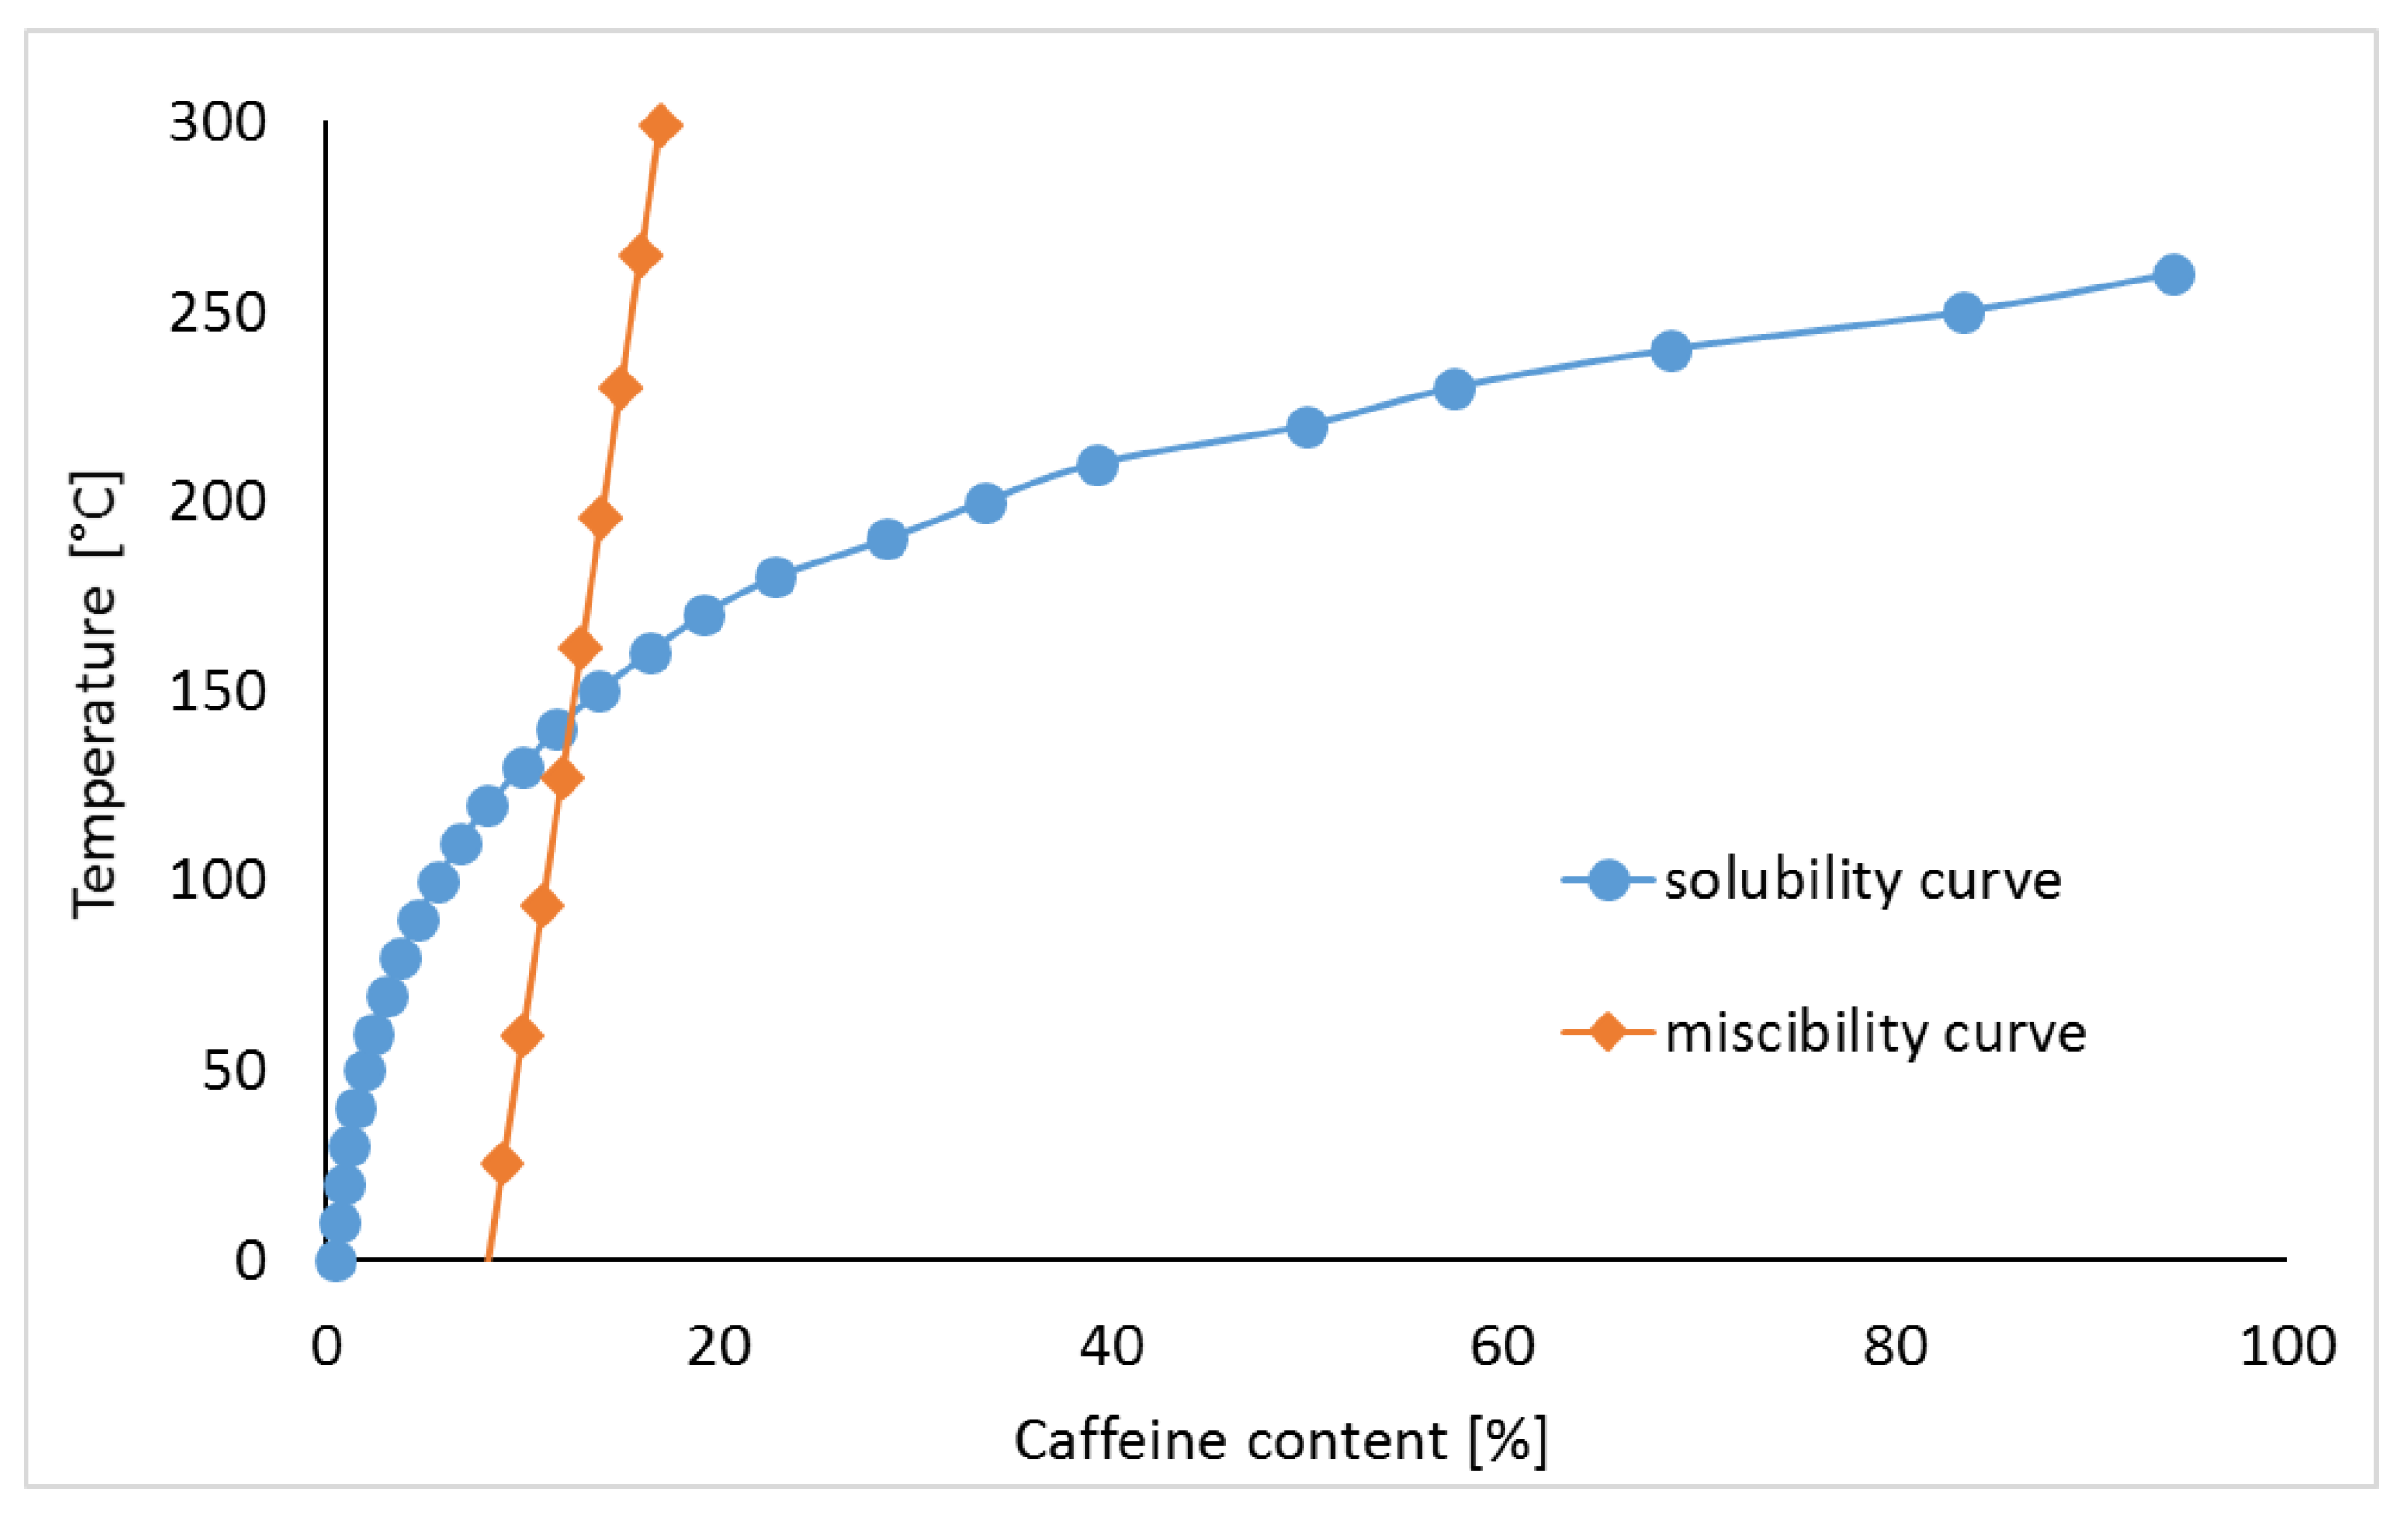
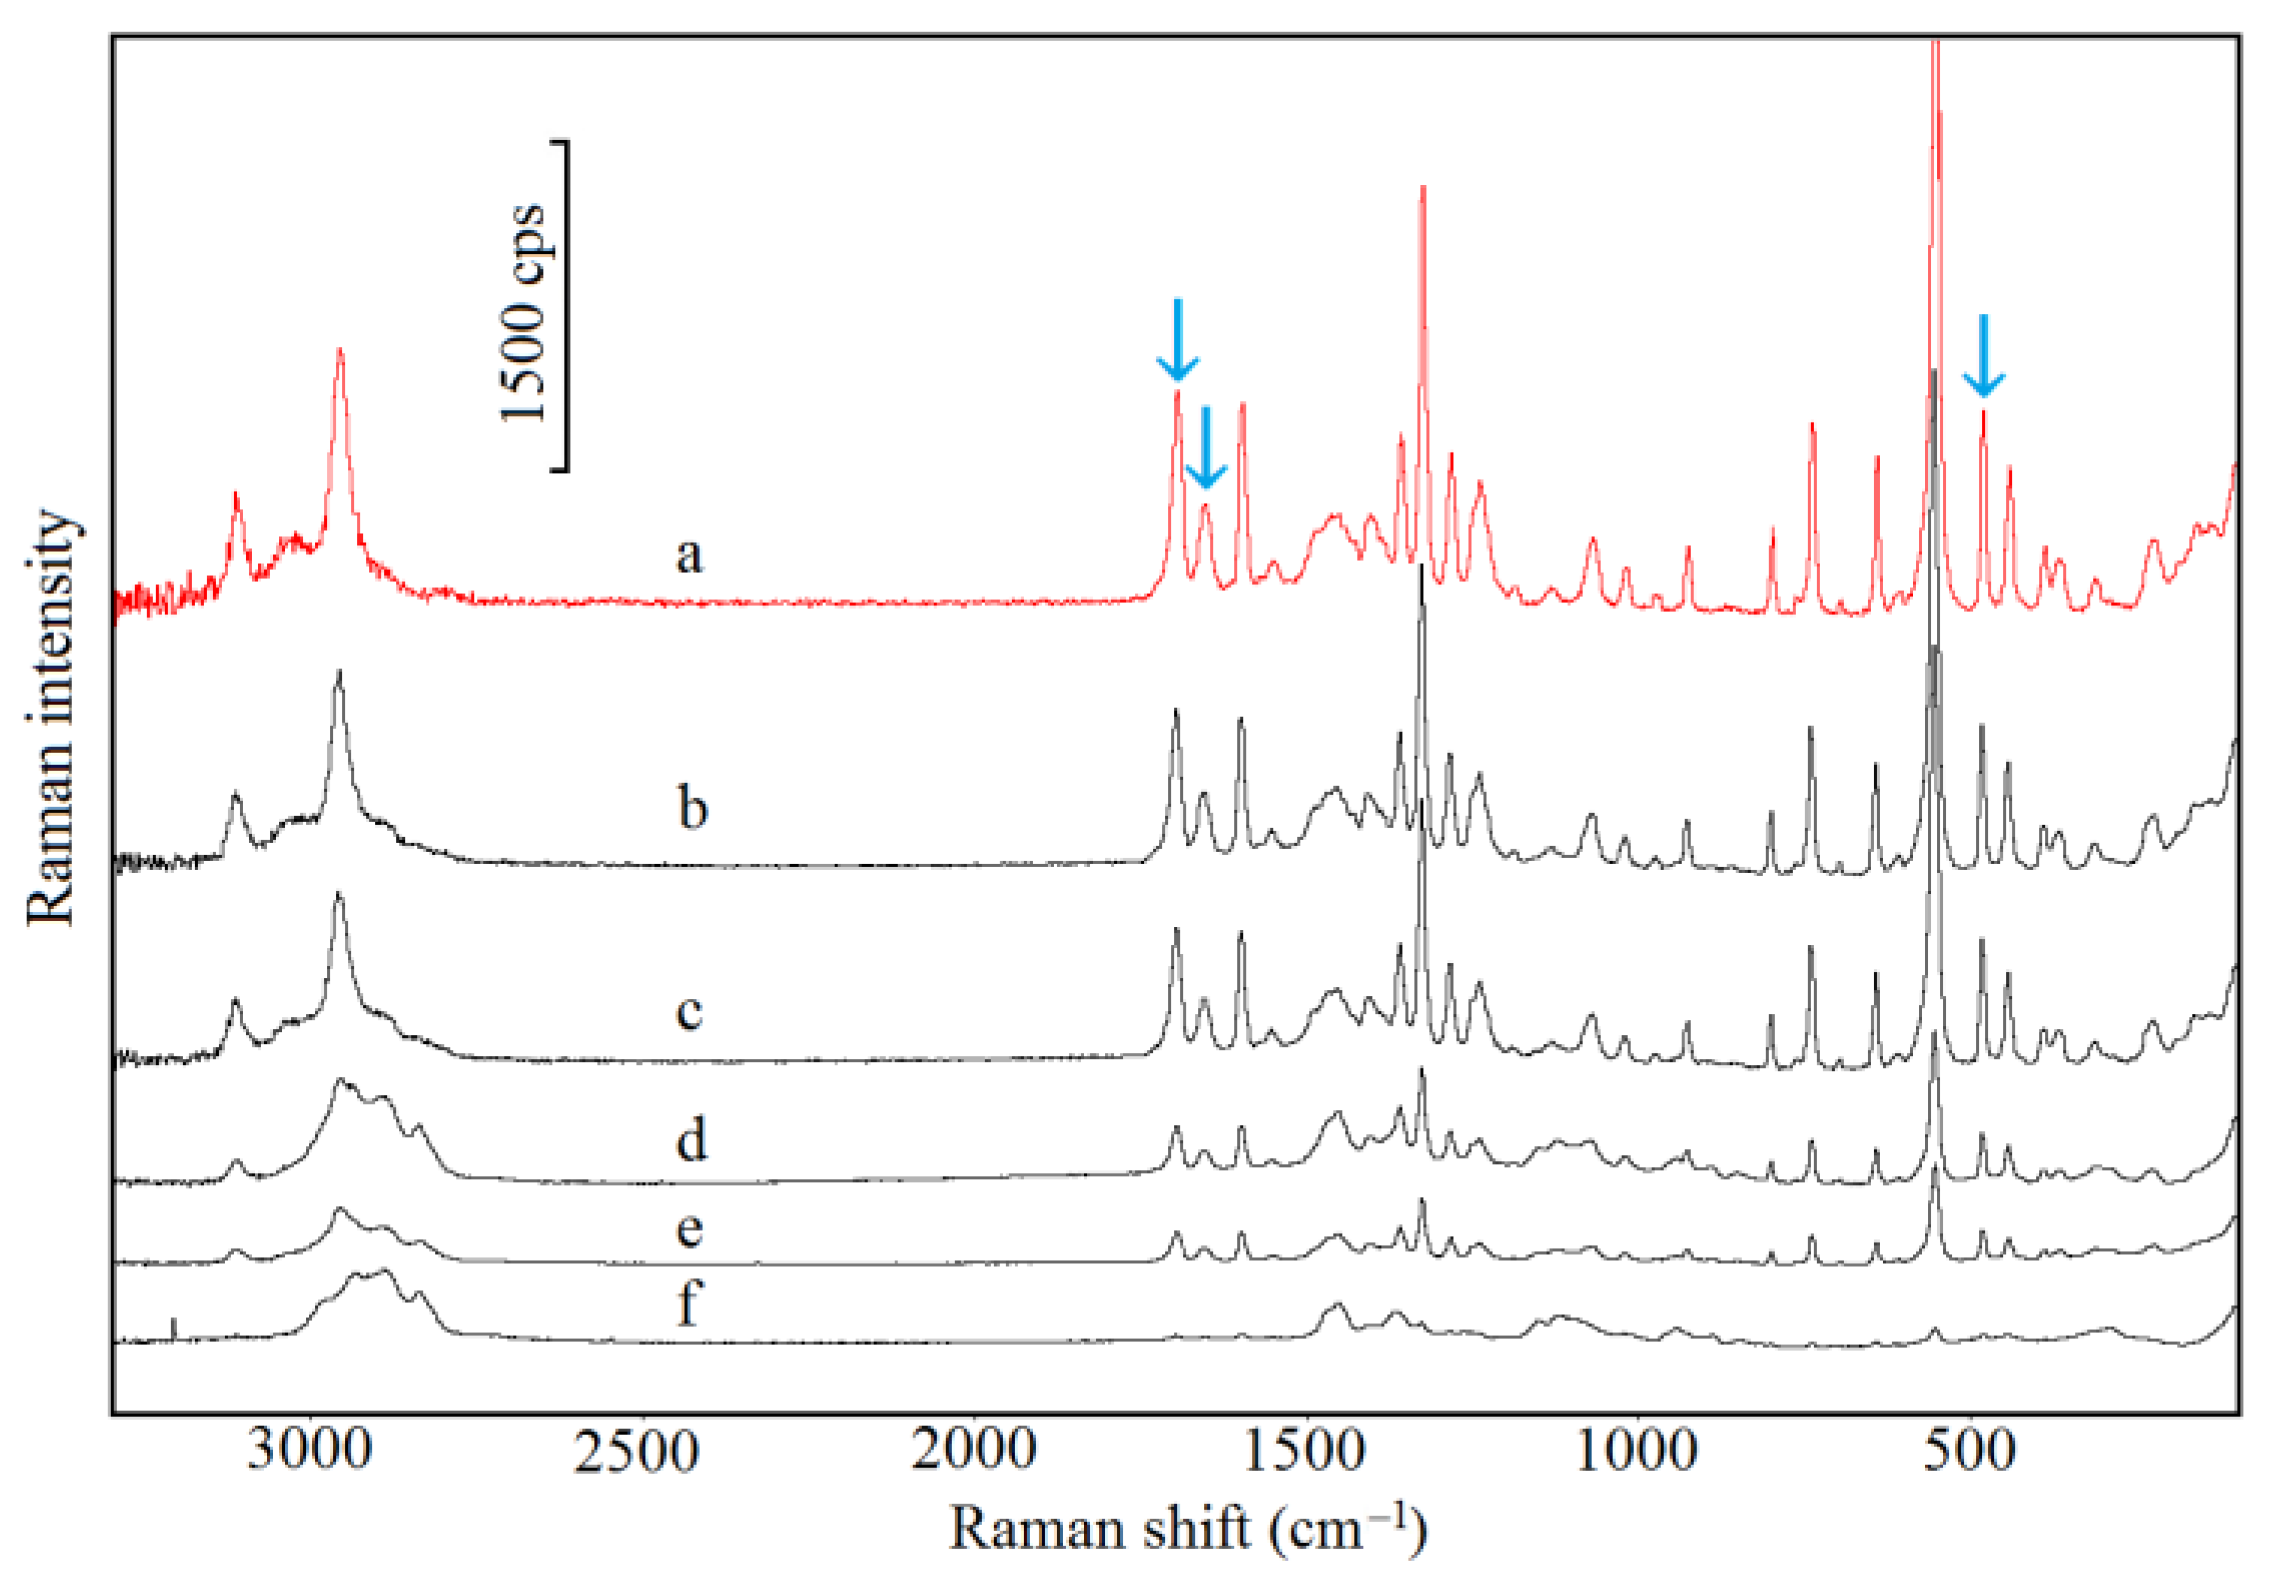
Miscibility and Solubility of Caffeine and Theophylline in Hydroxypropyl Methylcellulose


Abstract
:
1. Introduction
2. Materials and Methods
2.1. Drug Substances and Polymer
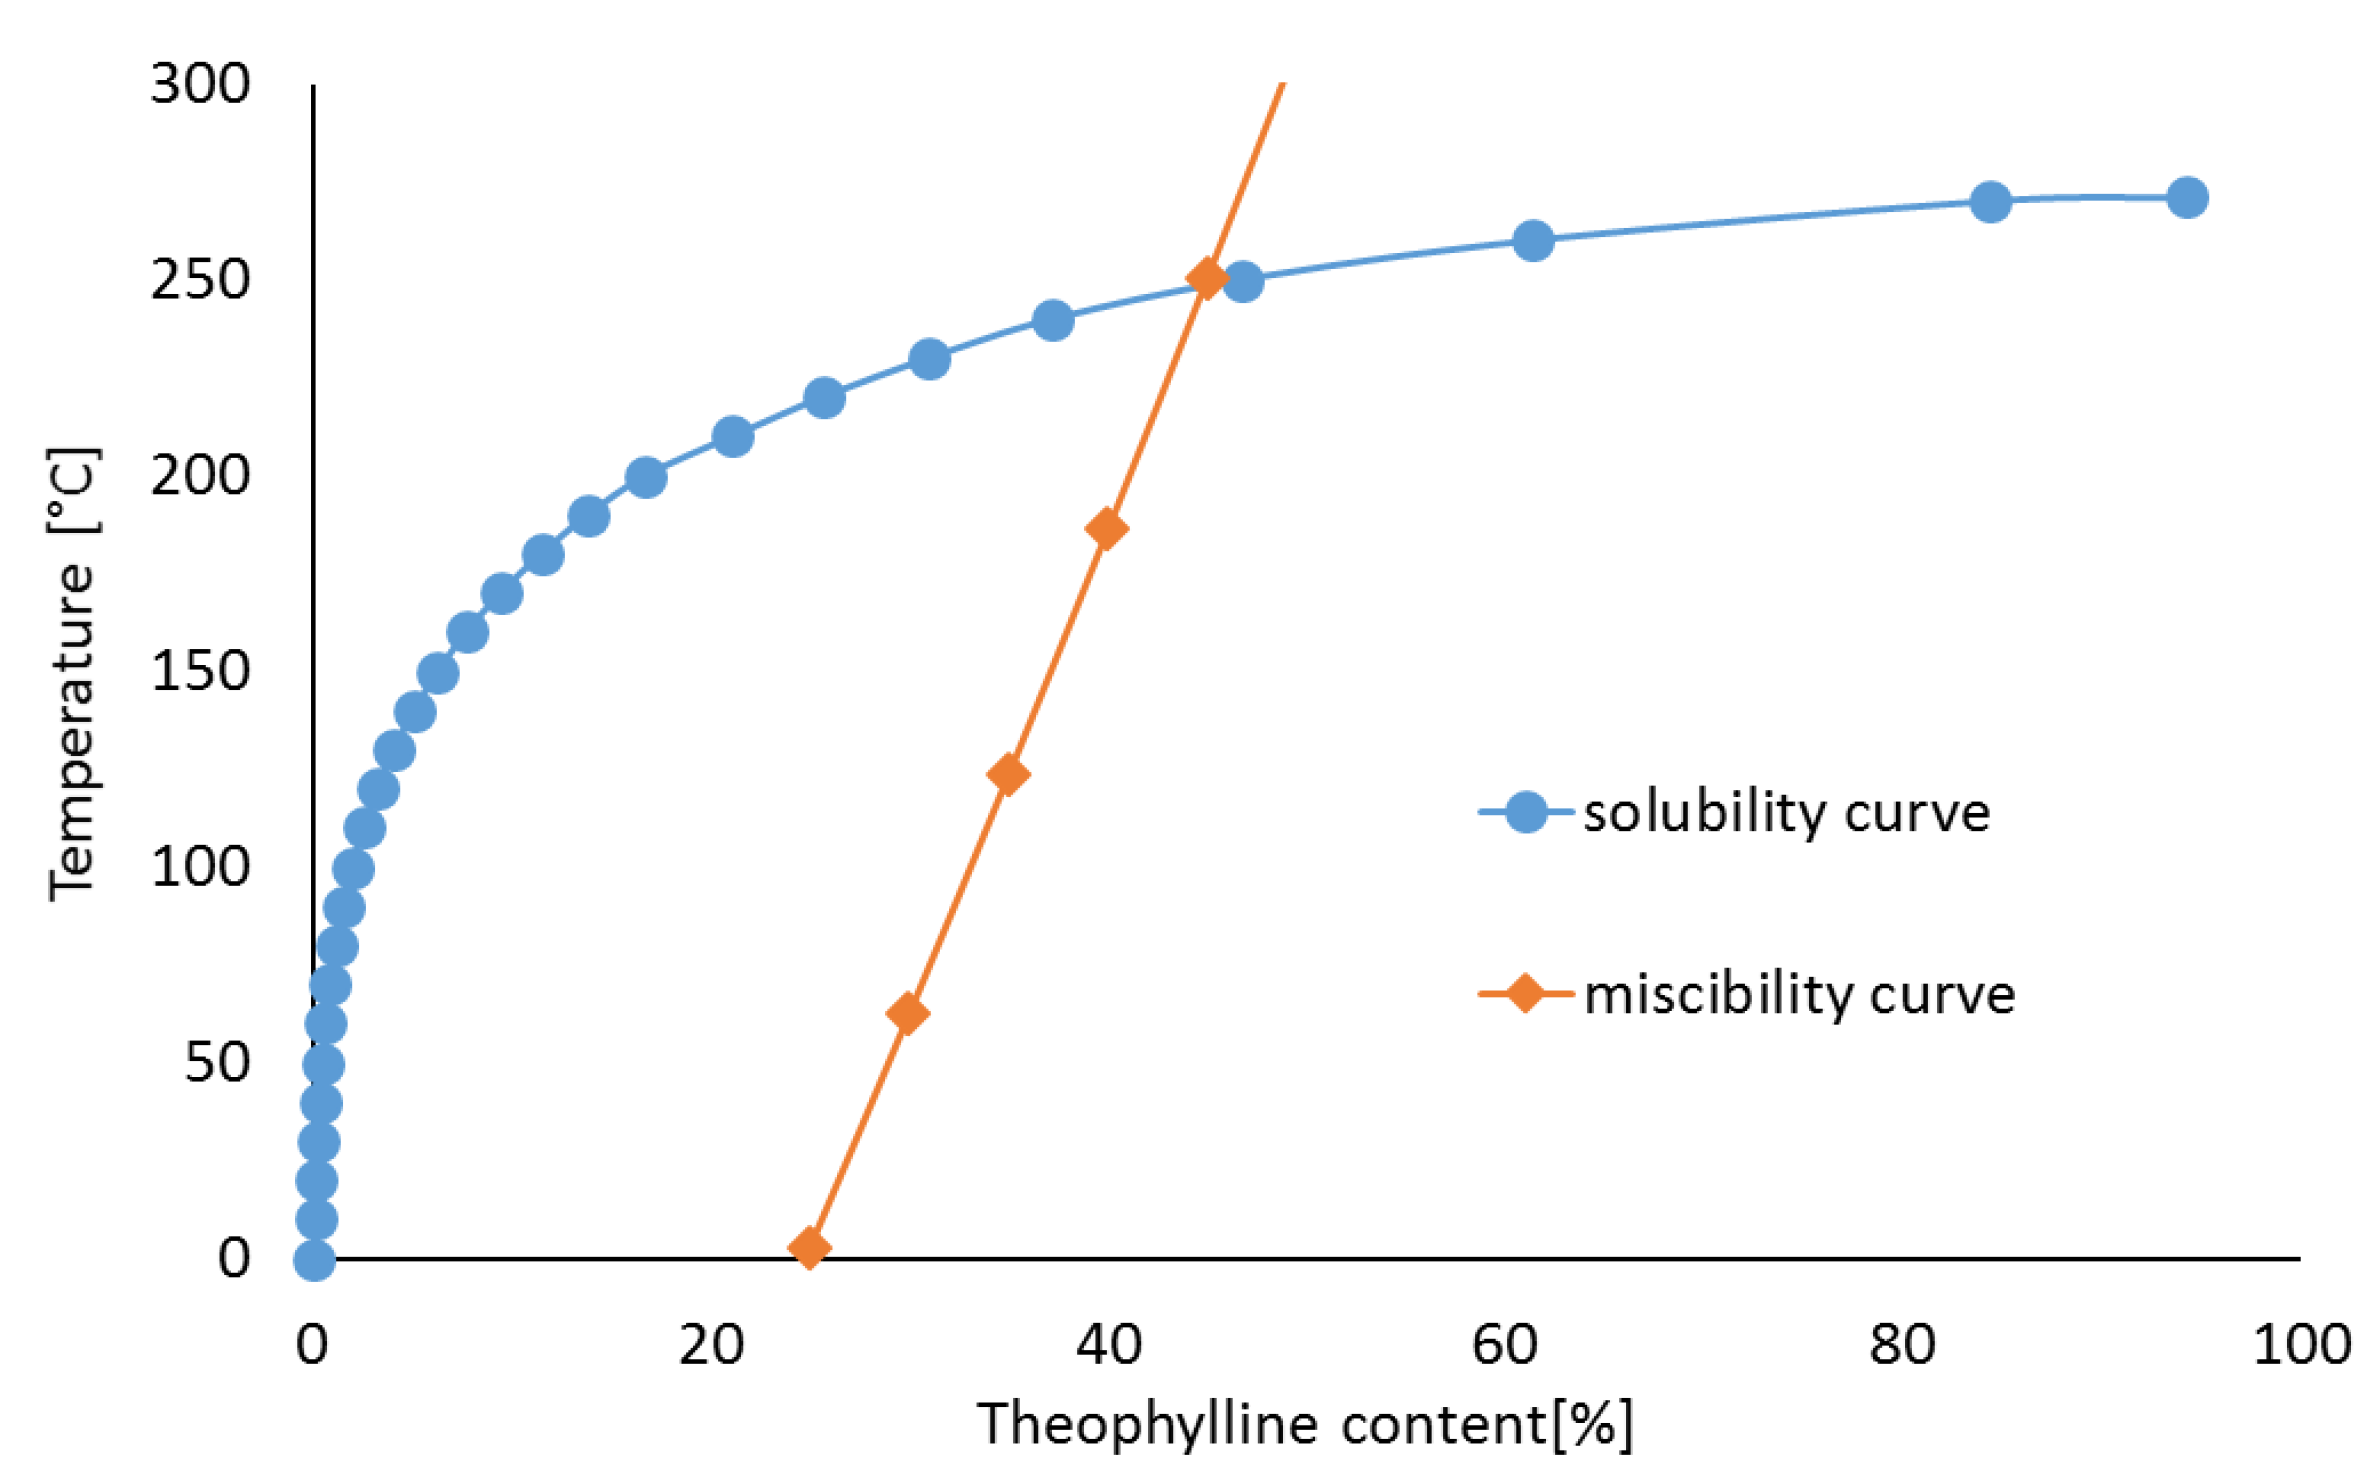
2.2. Calculations for Phase Diagrams
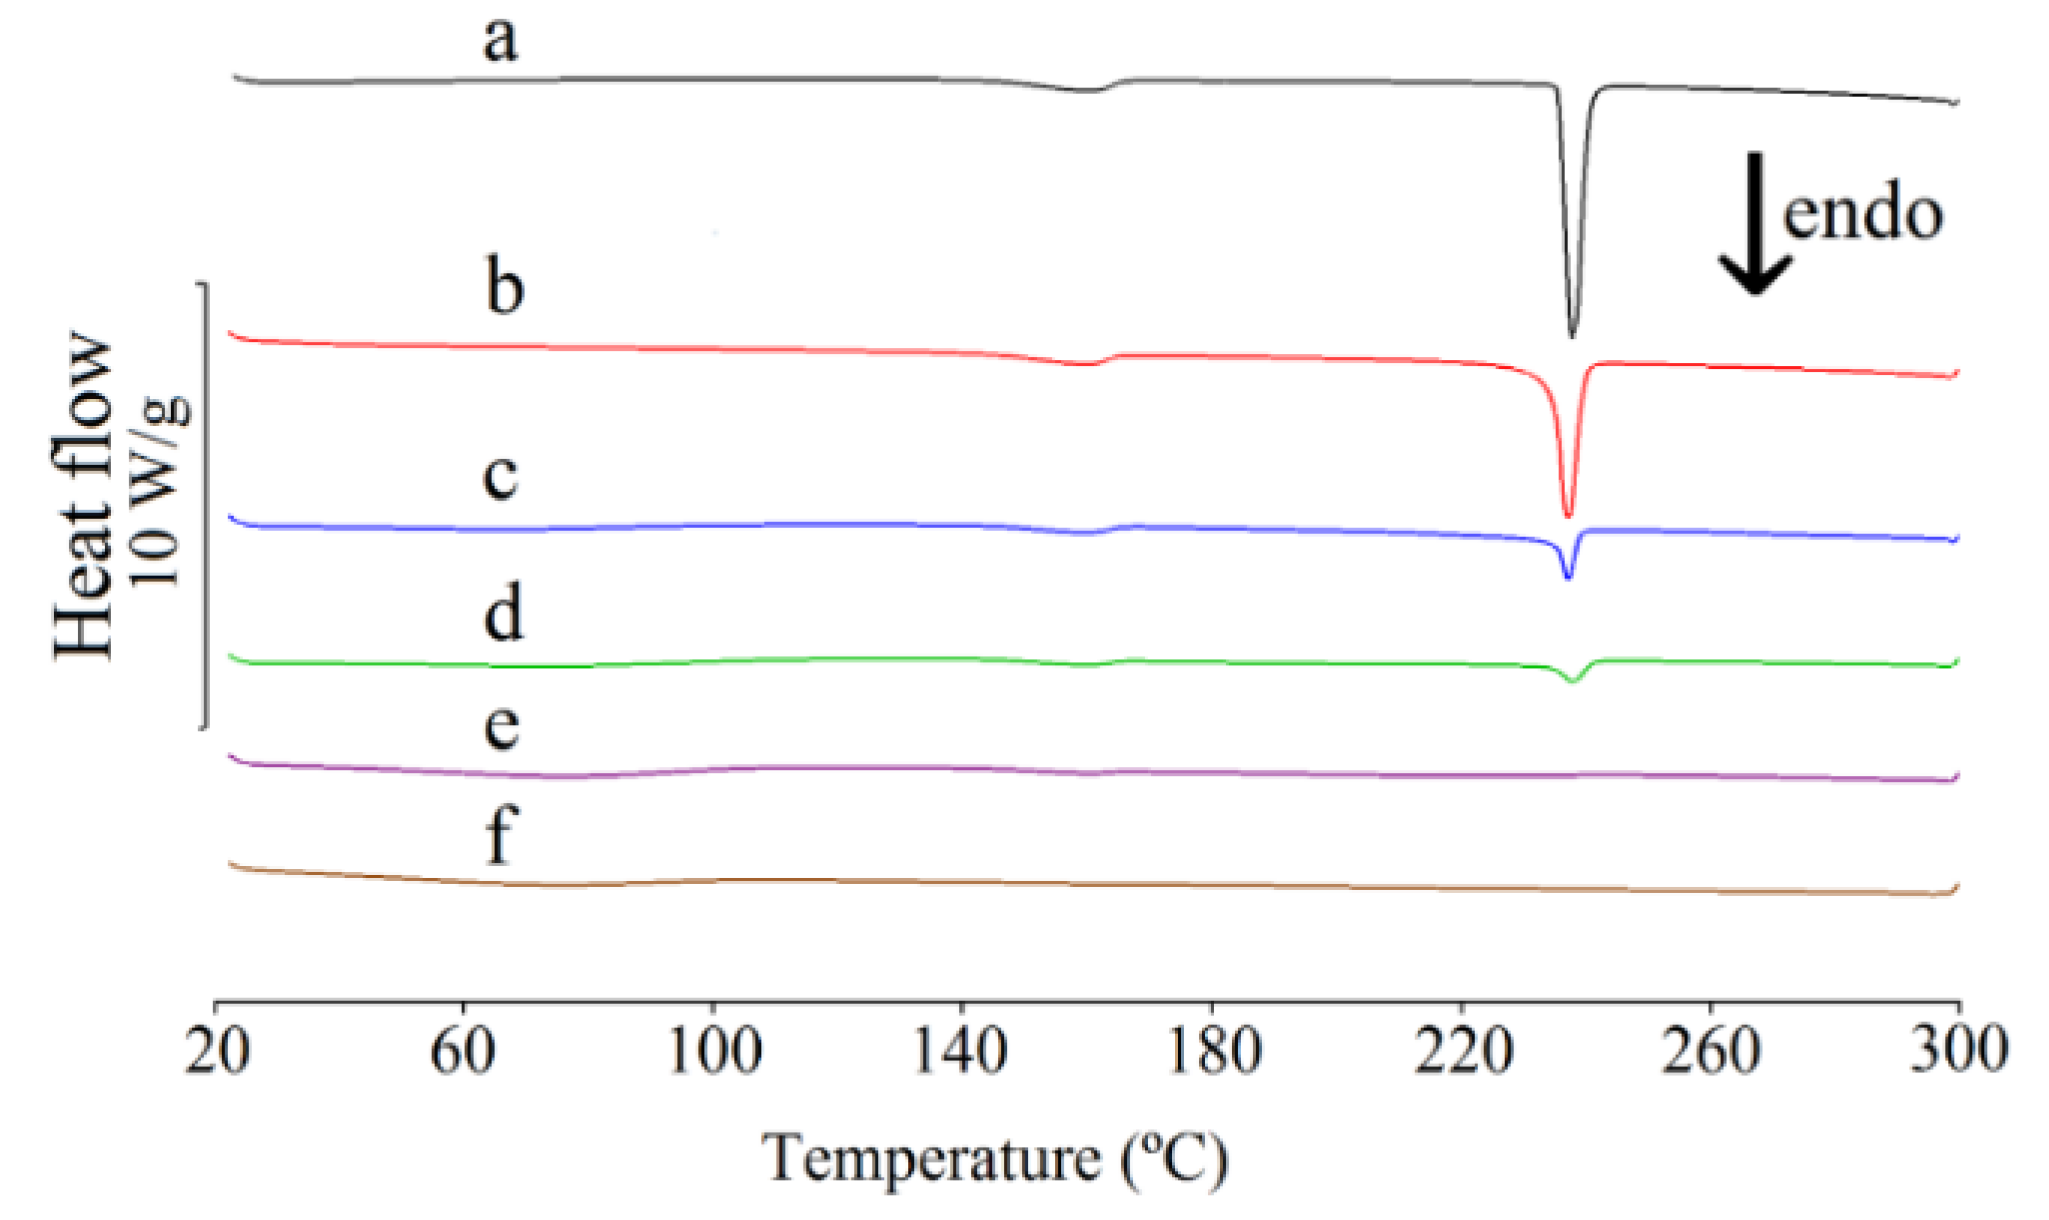
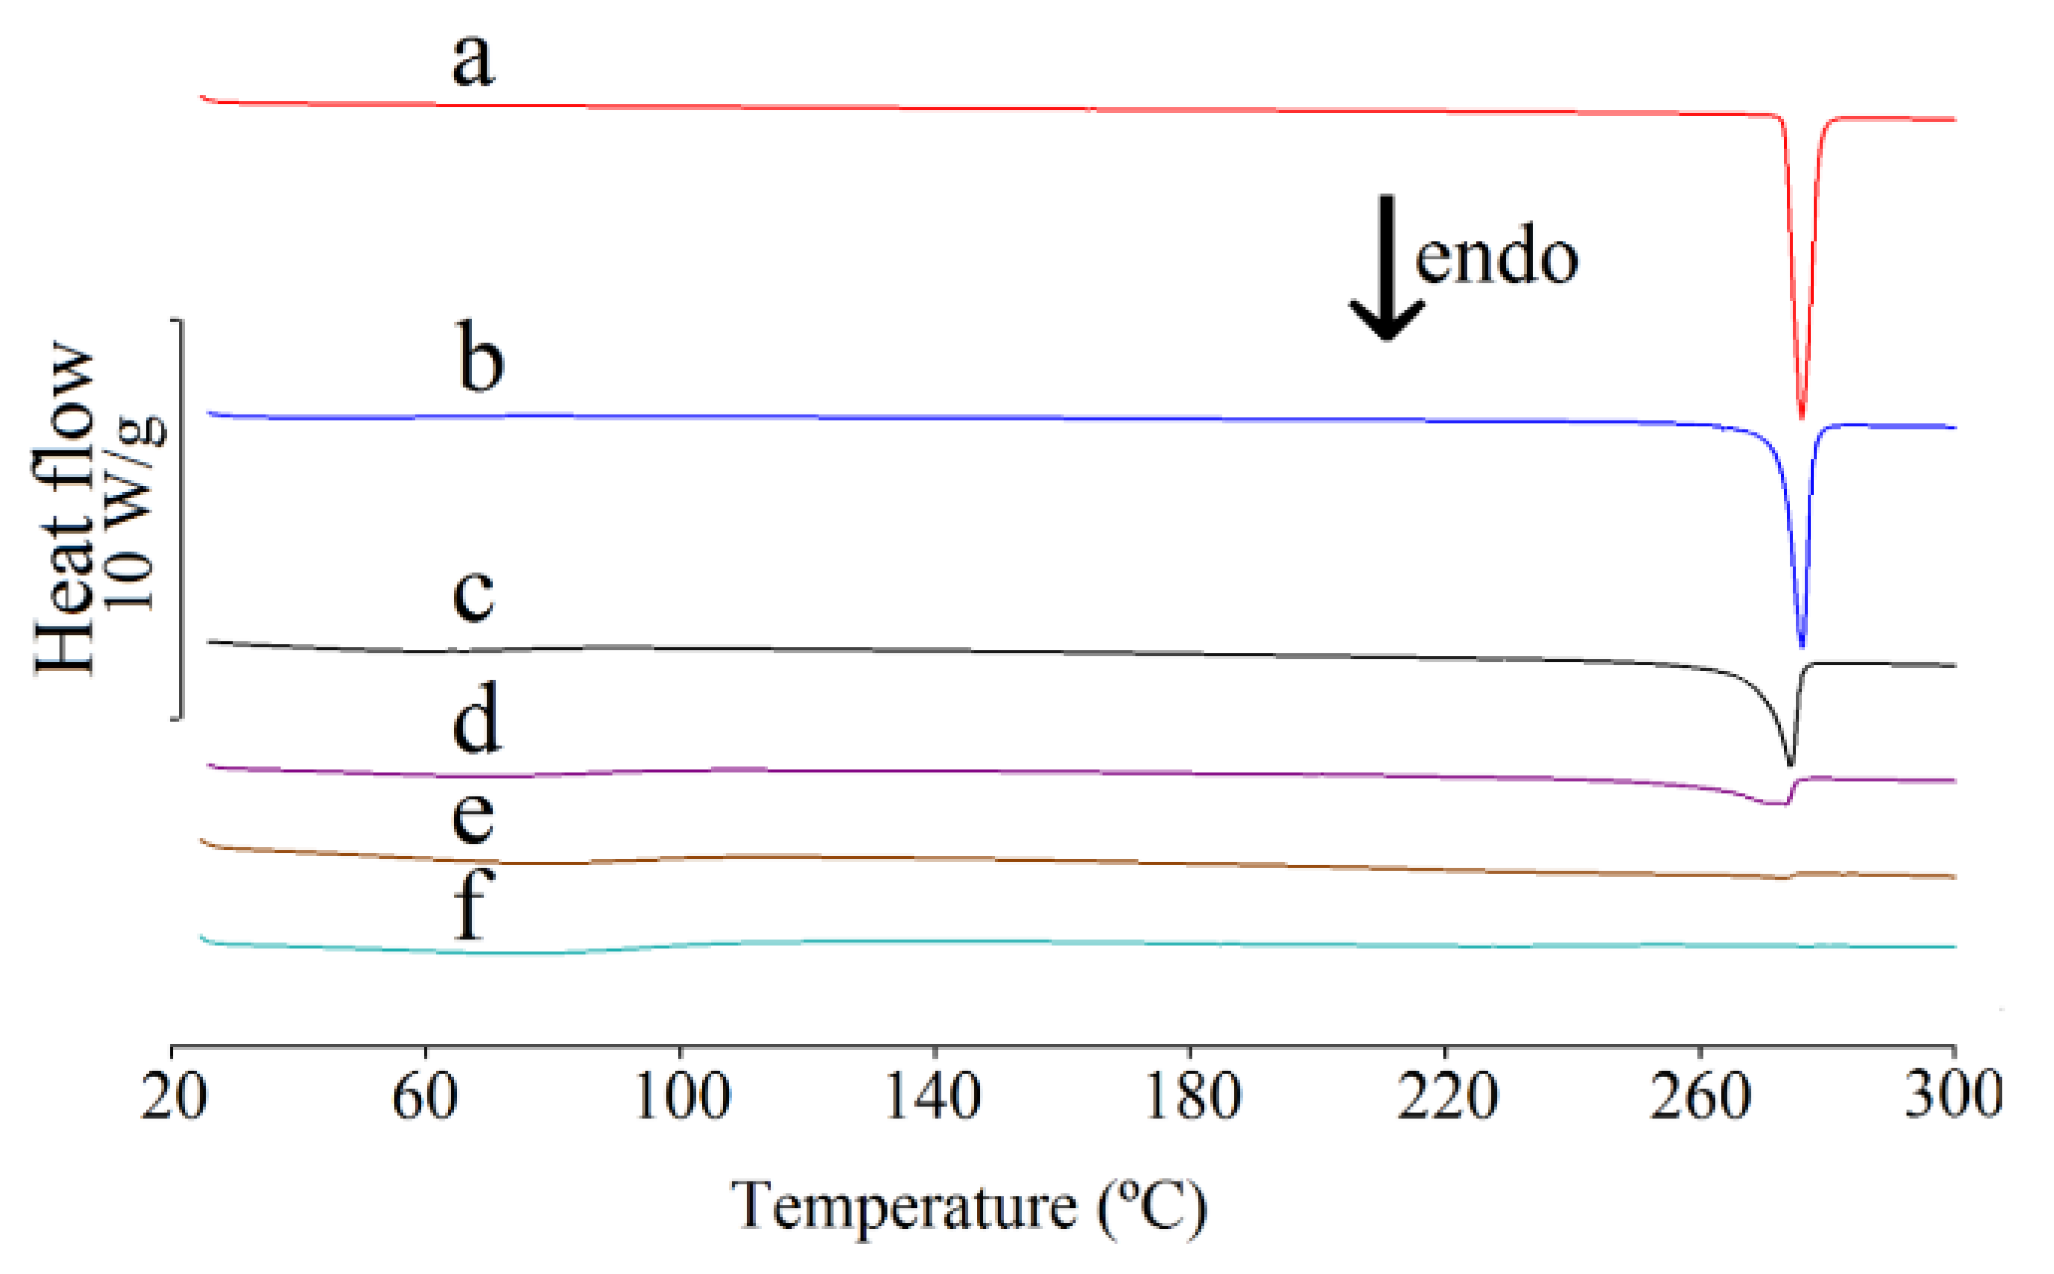
2.3. Differential Scanning Calorimetric Study
2.4. Hot-Stage Microscopic Study
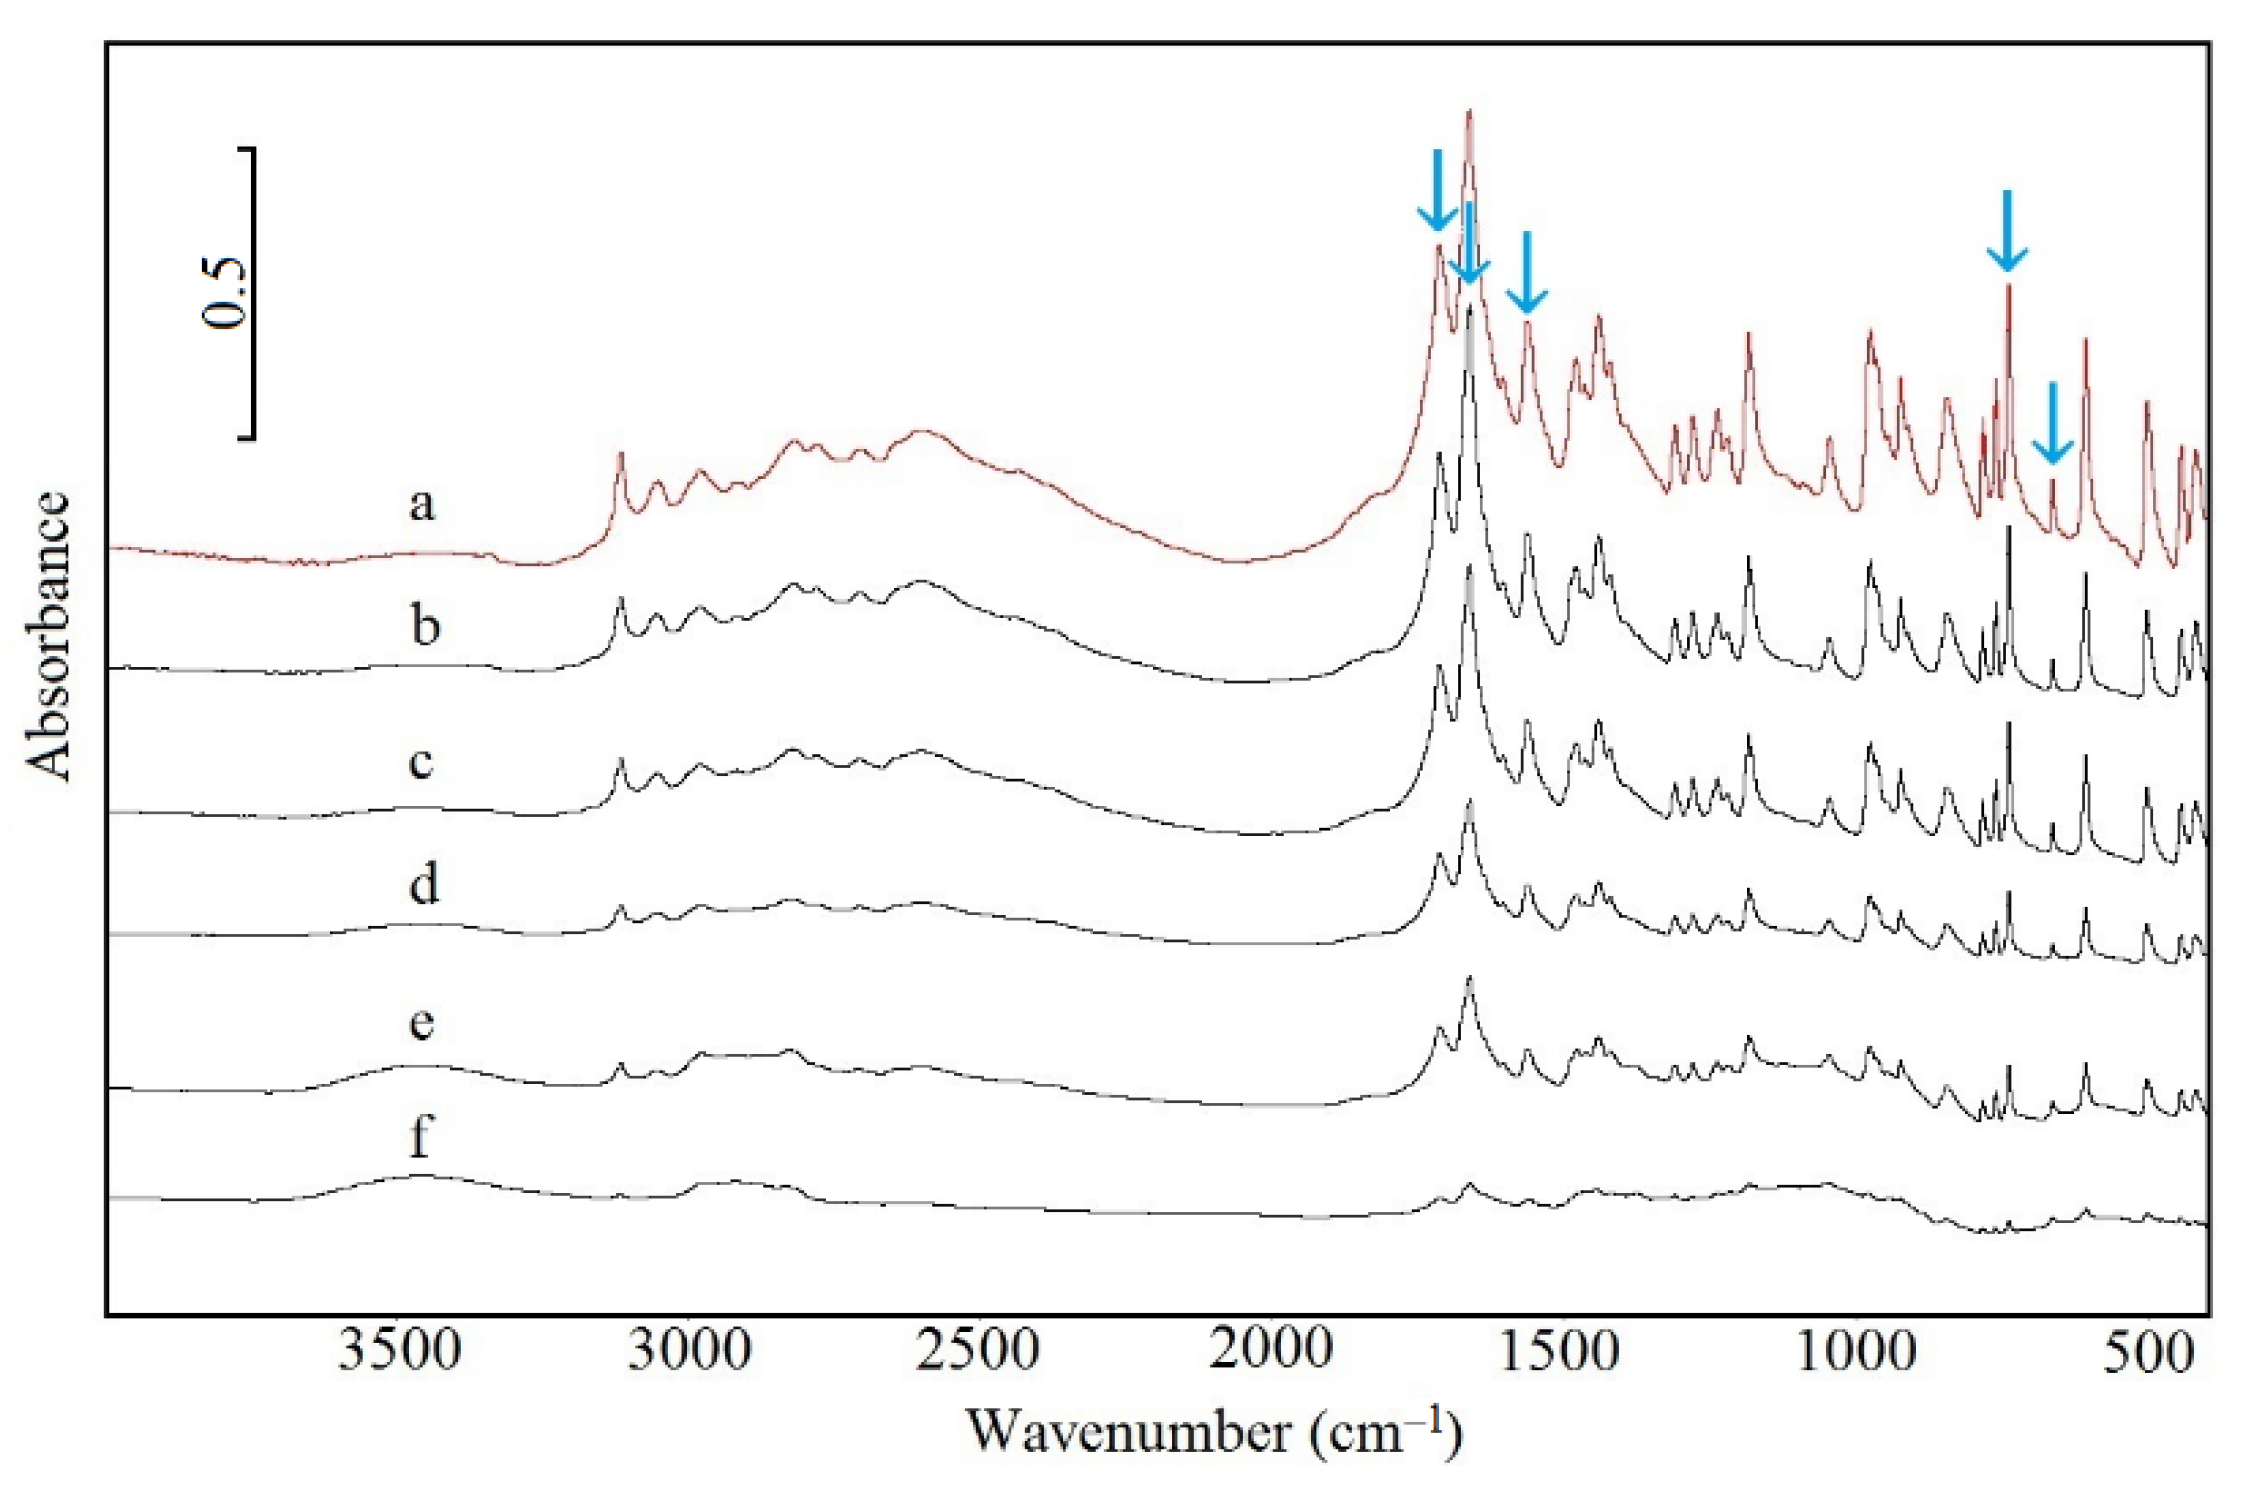
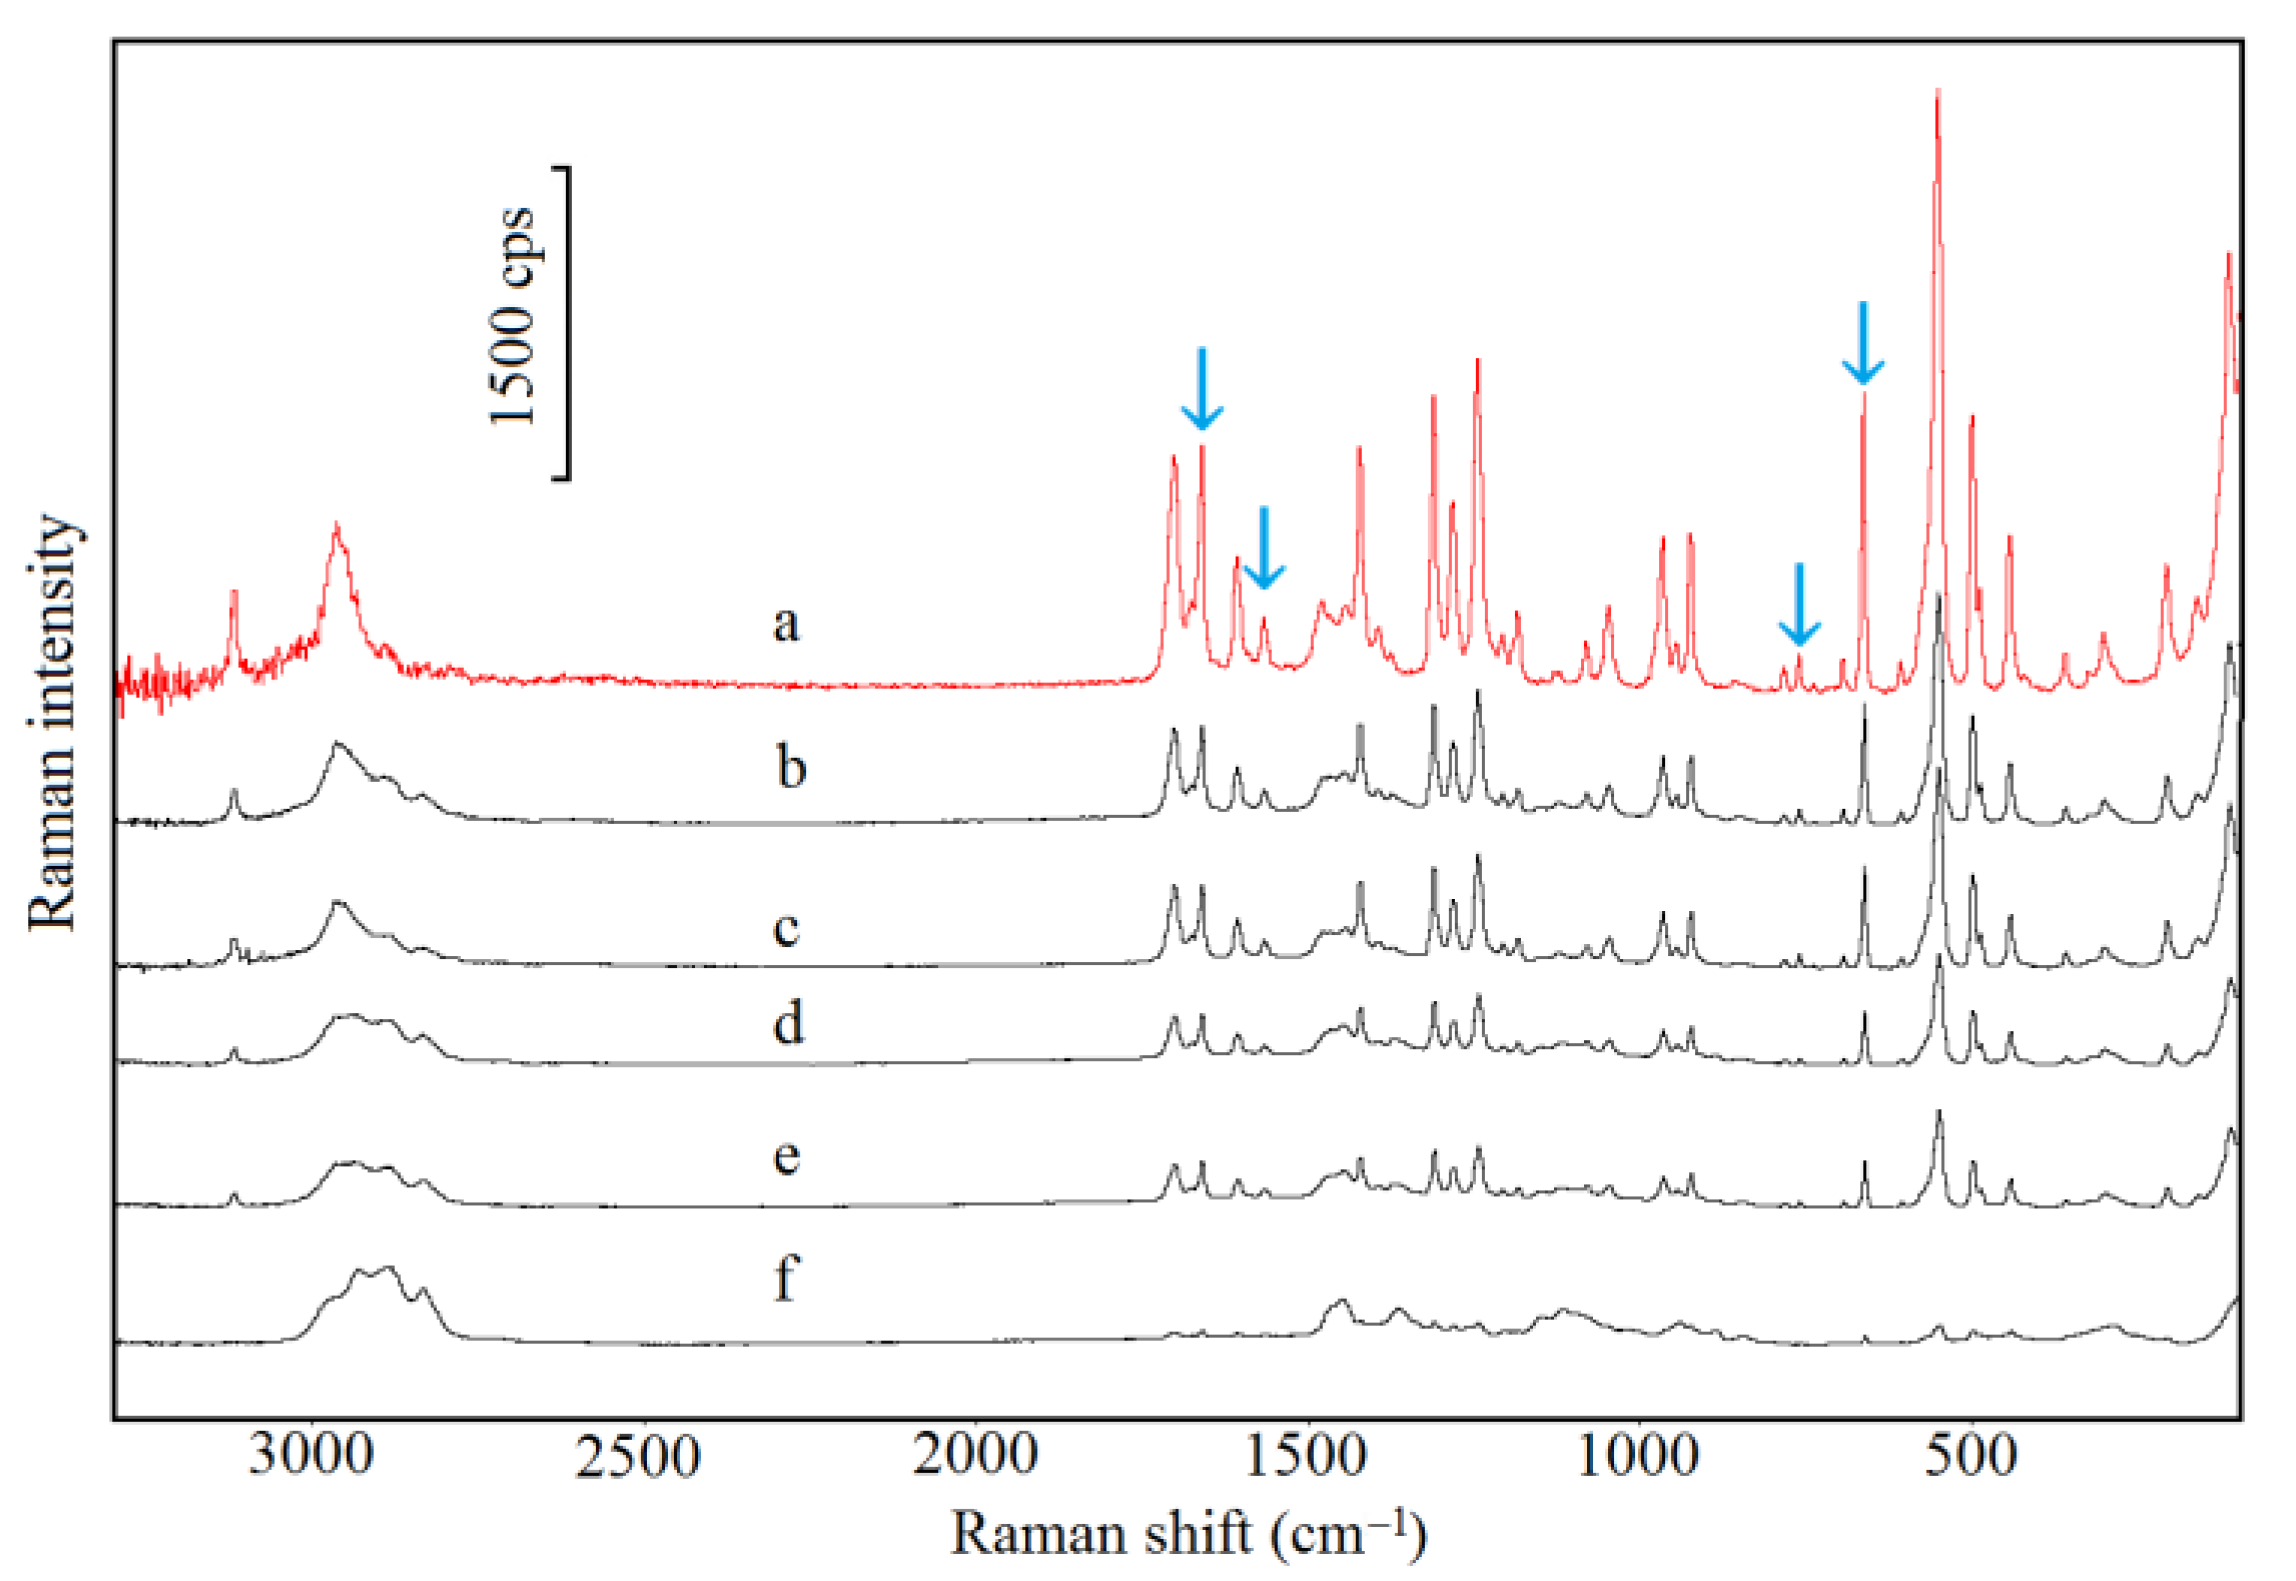
2.5. Spectroscopic Study
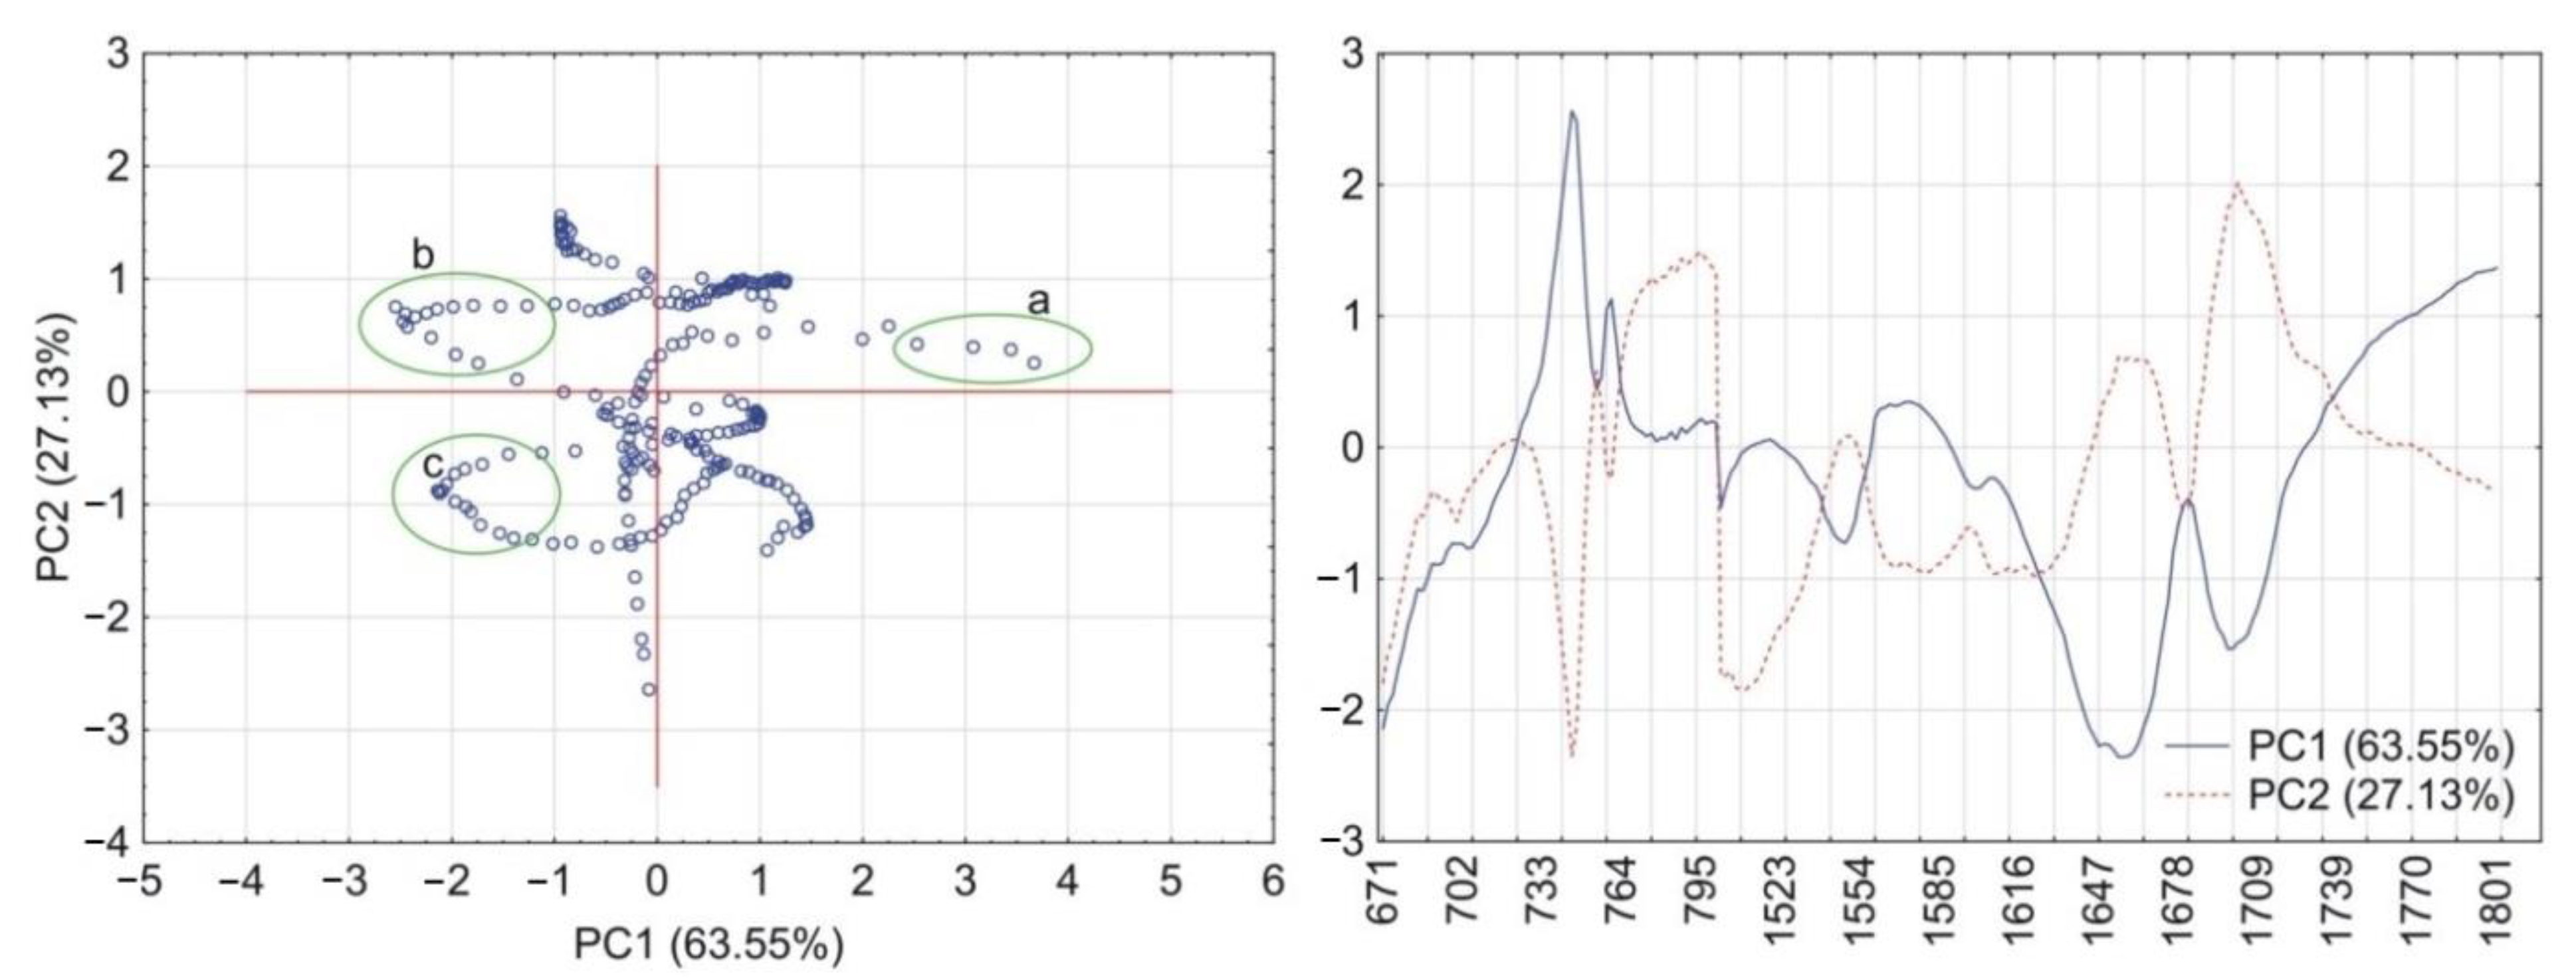
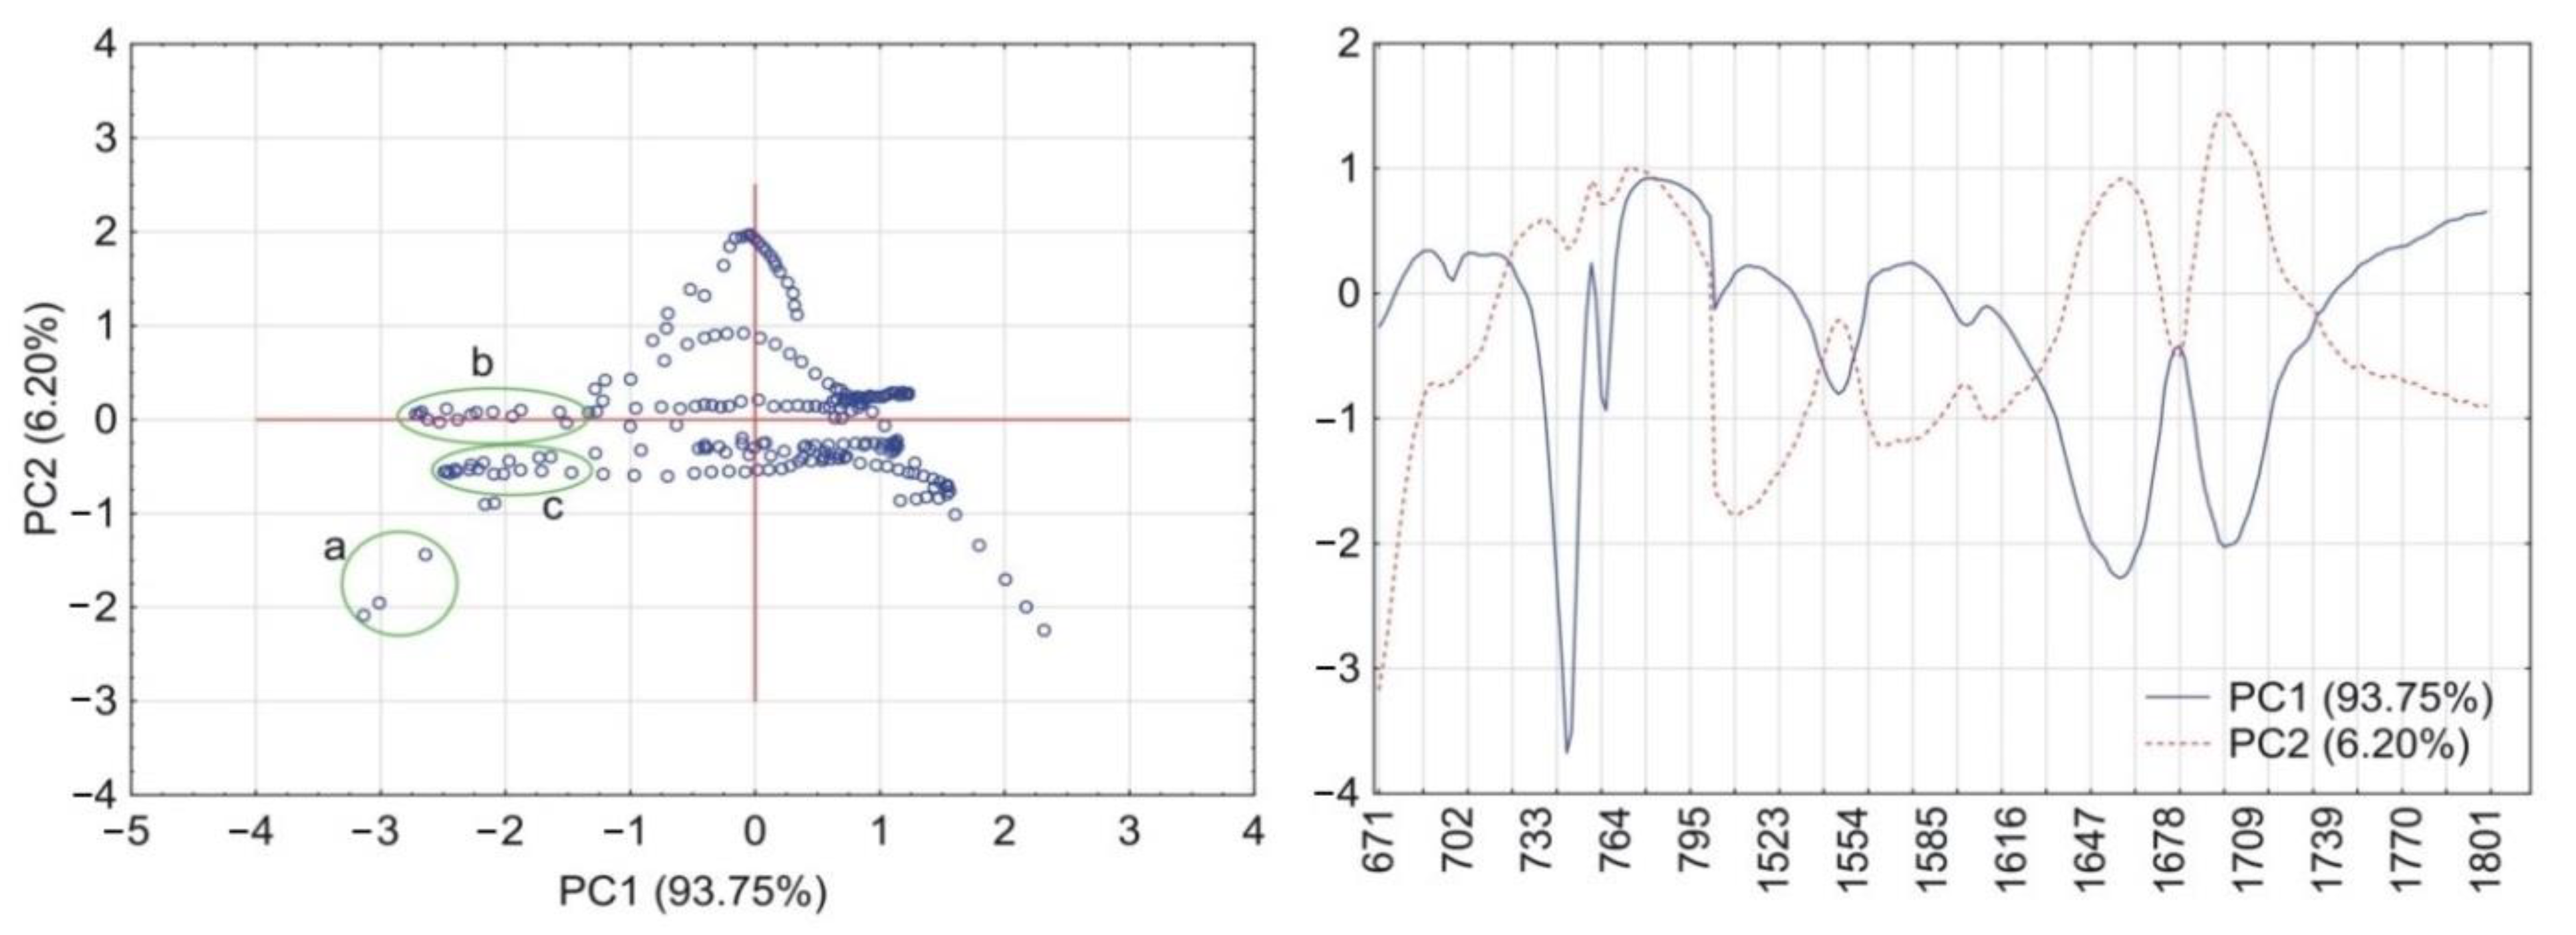
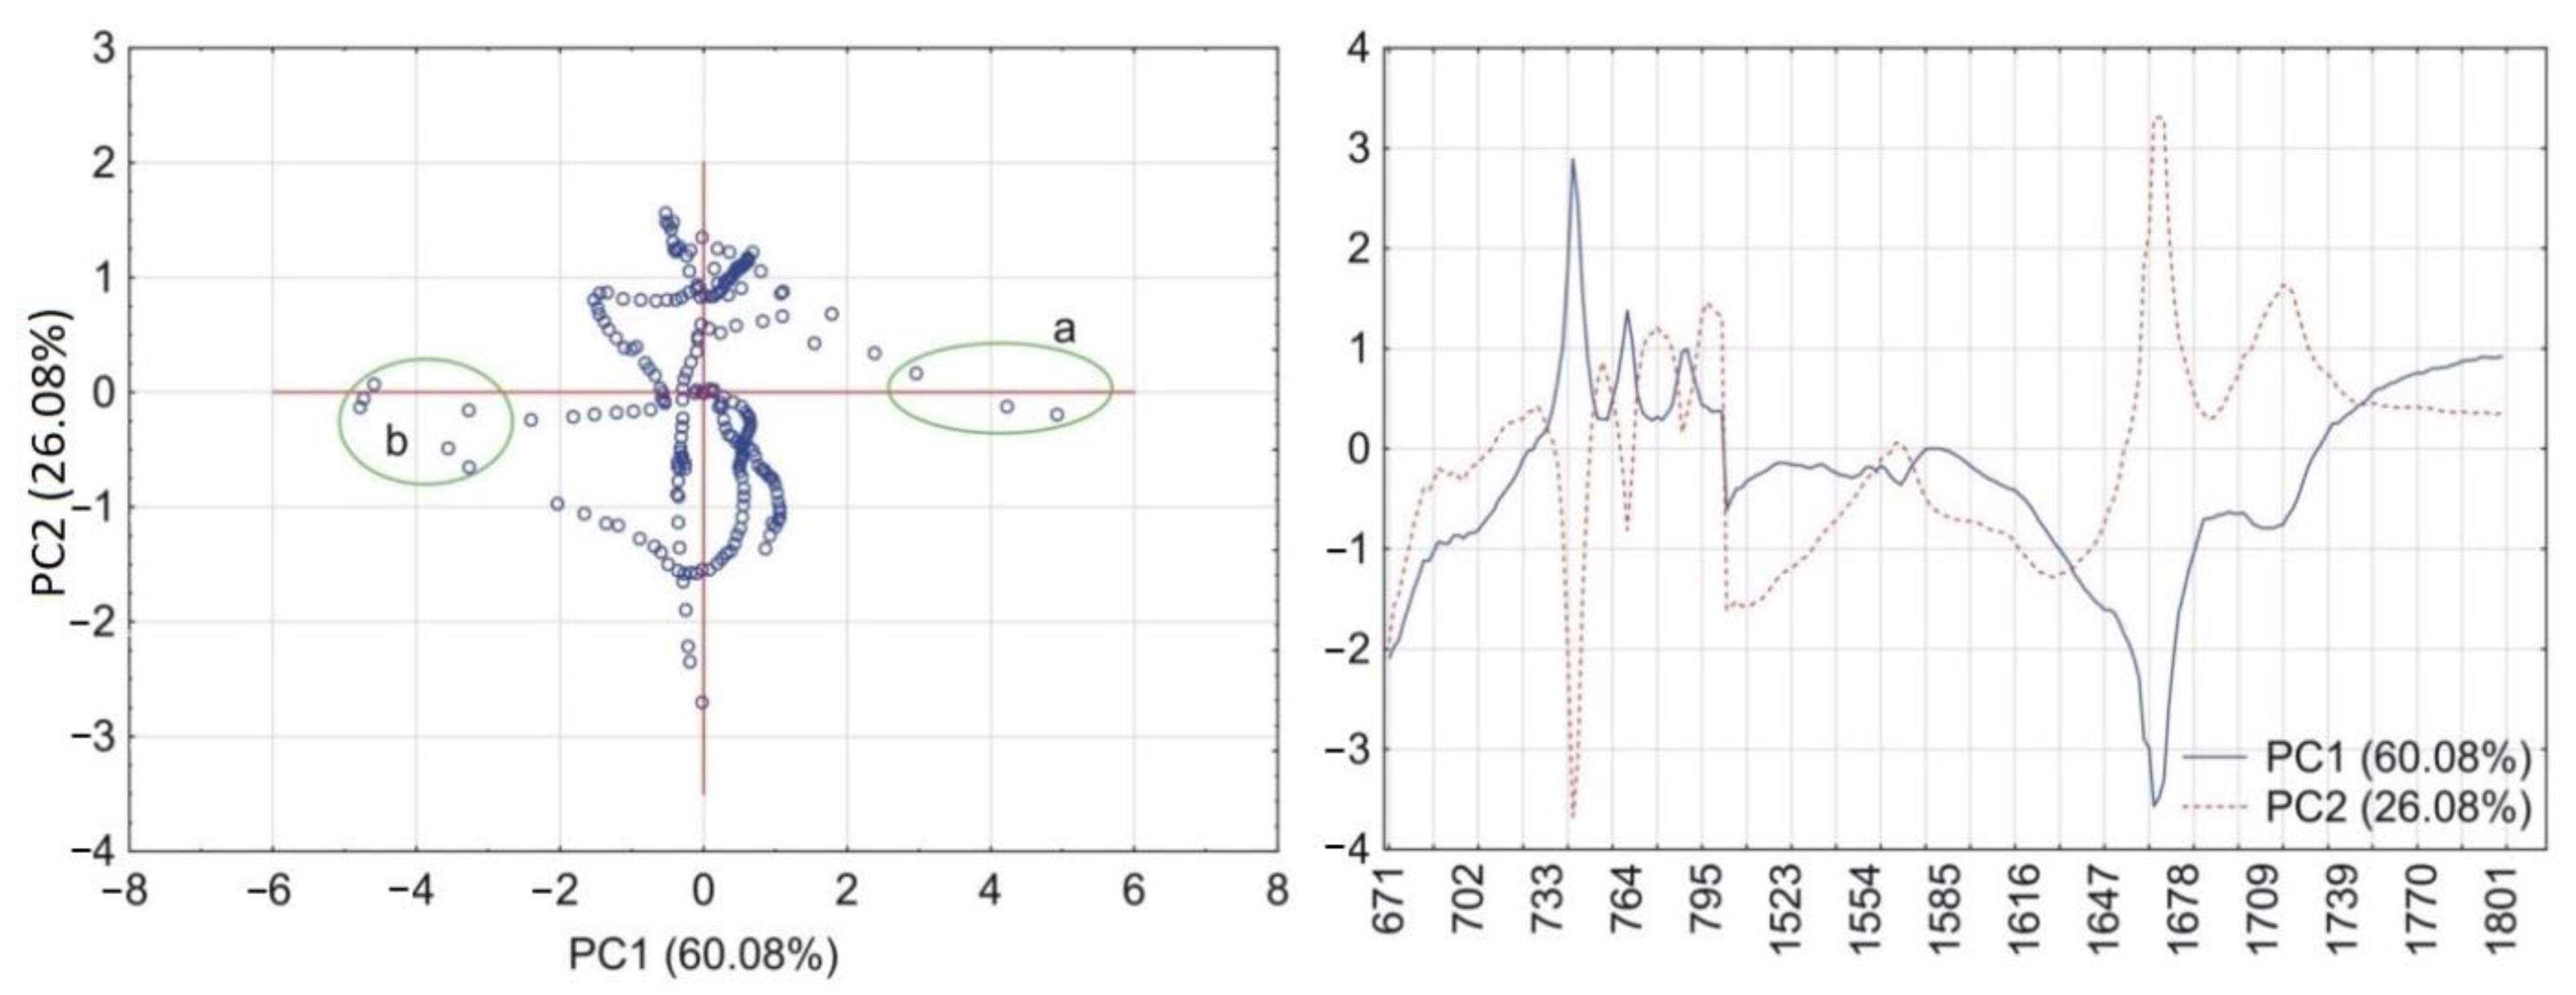
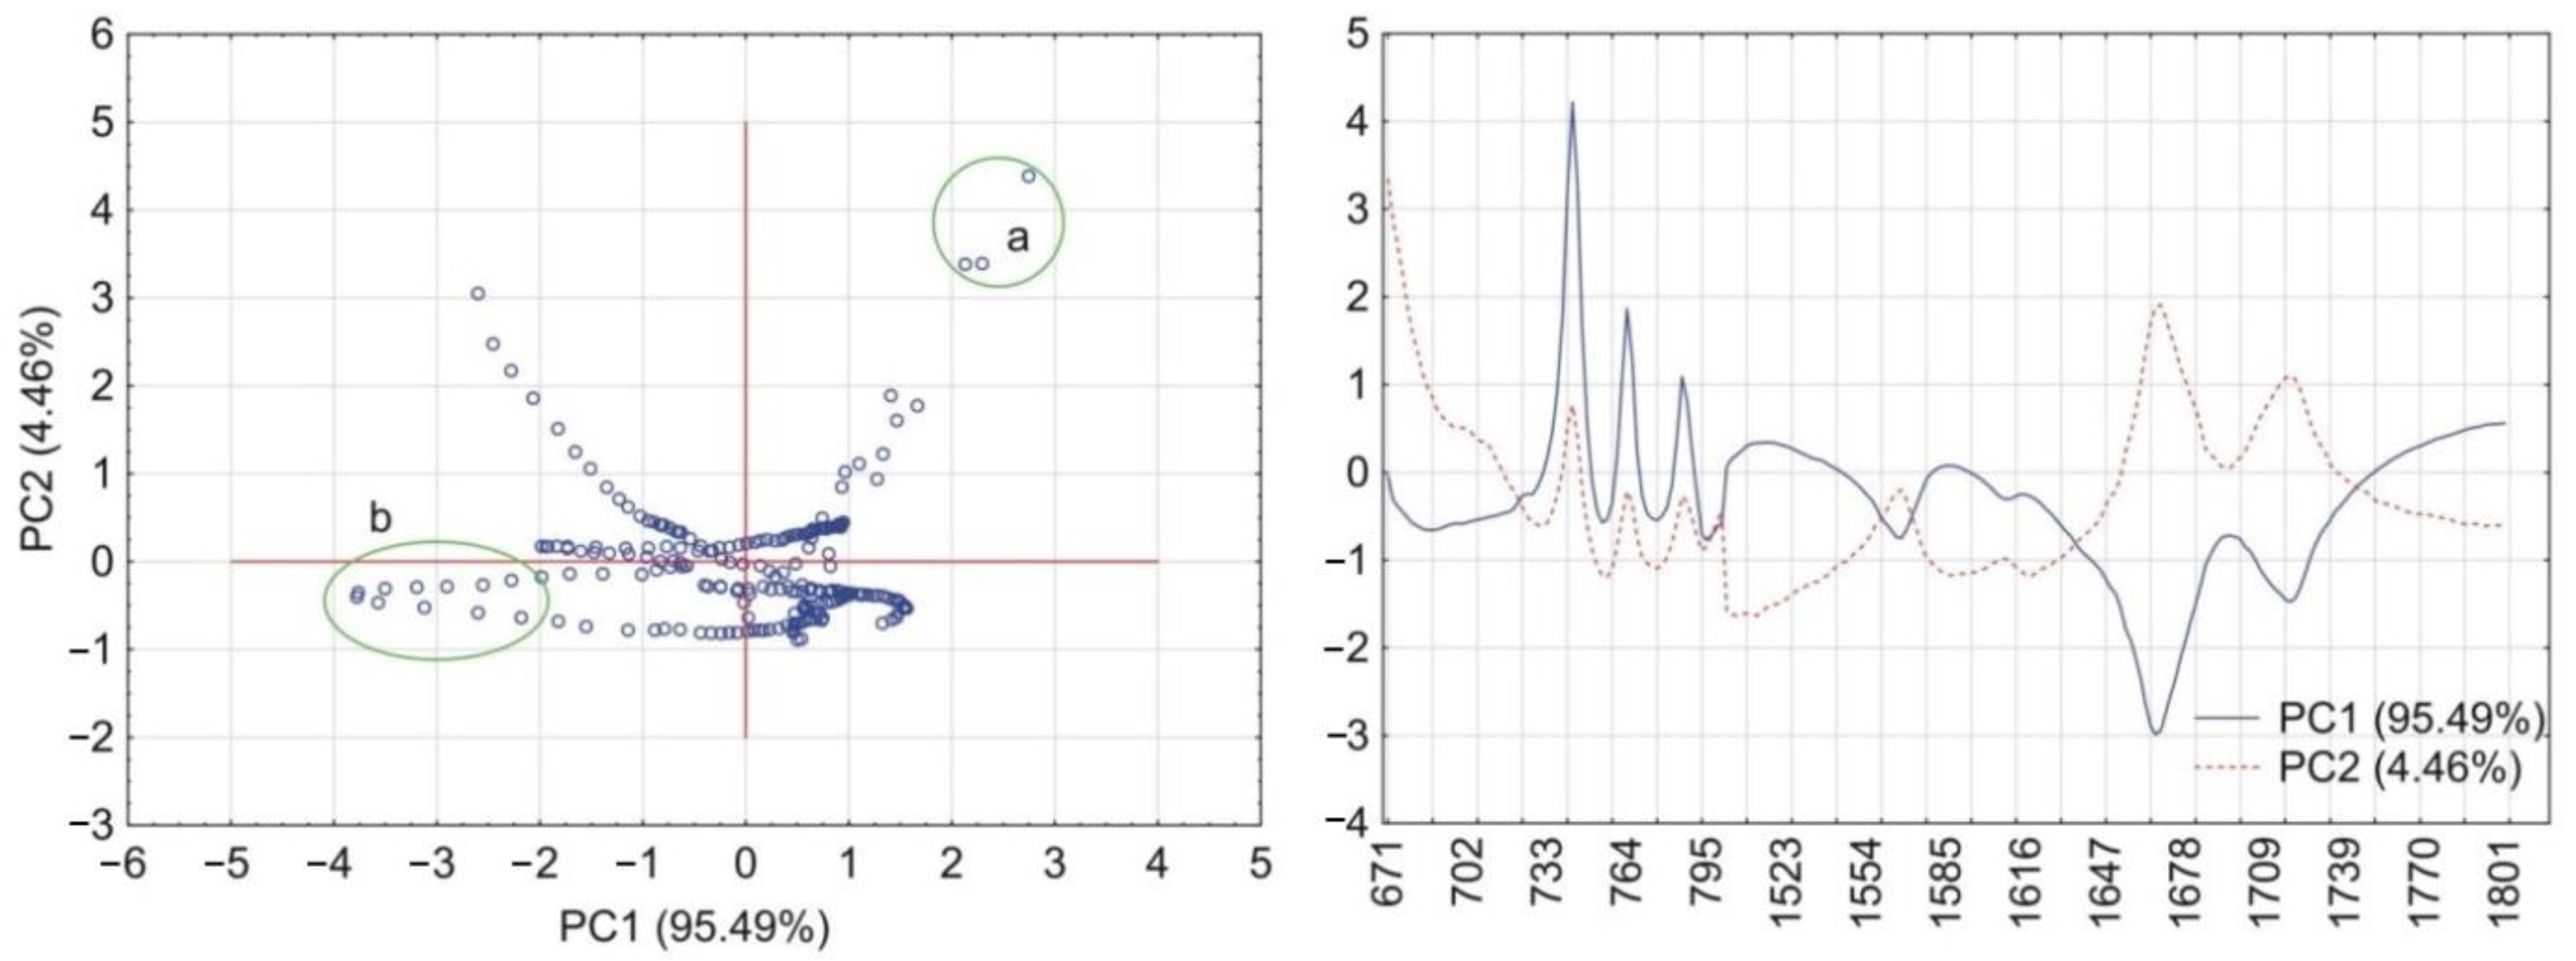
2.6. Principal Components Calculations
3. Results
3.1. Caffeine Mixtures with HPMC
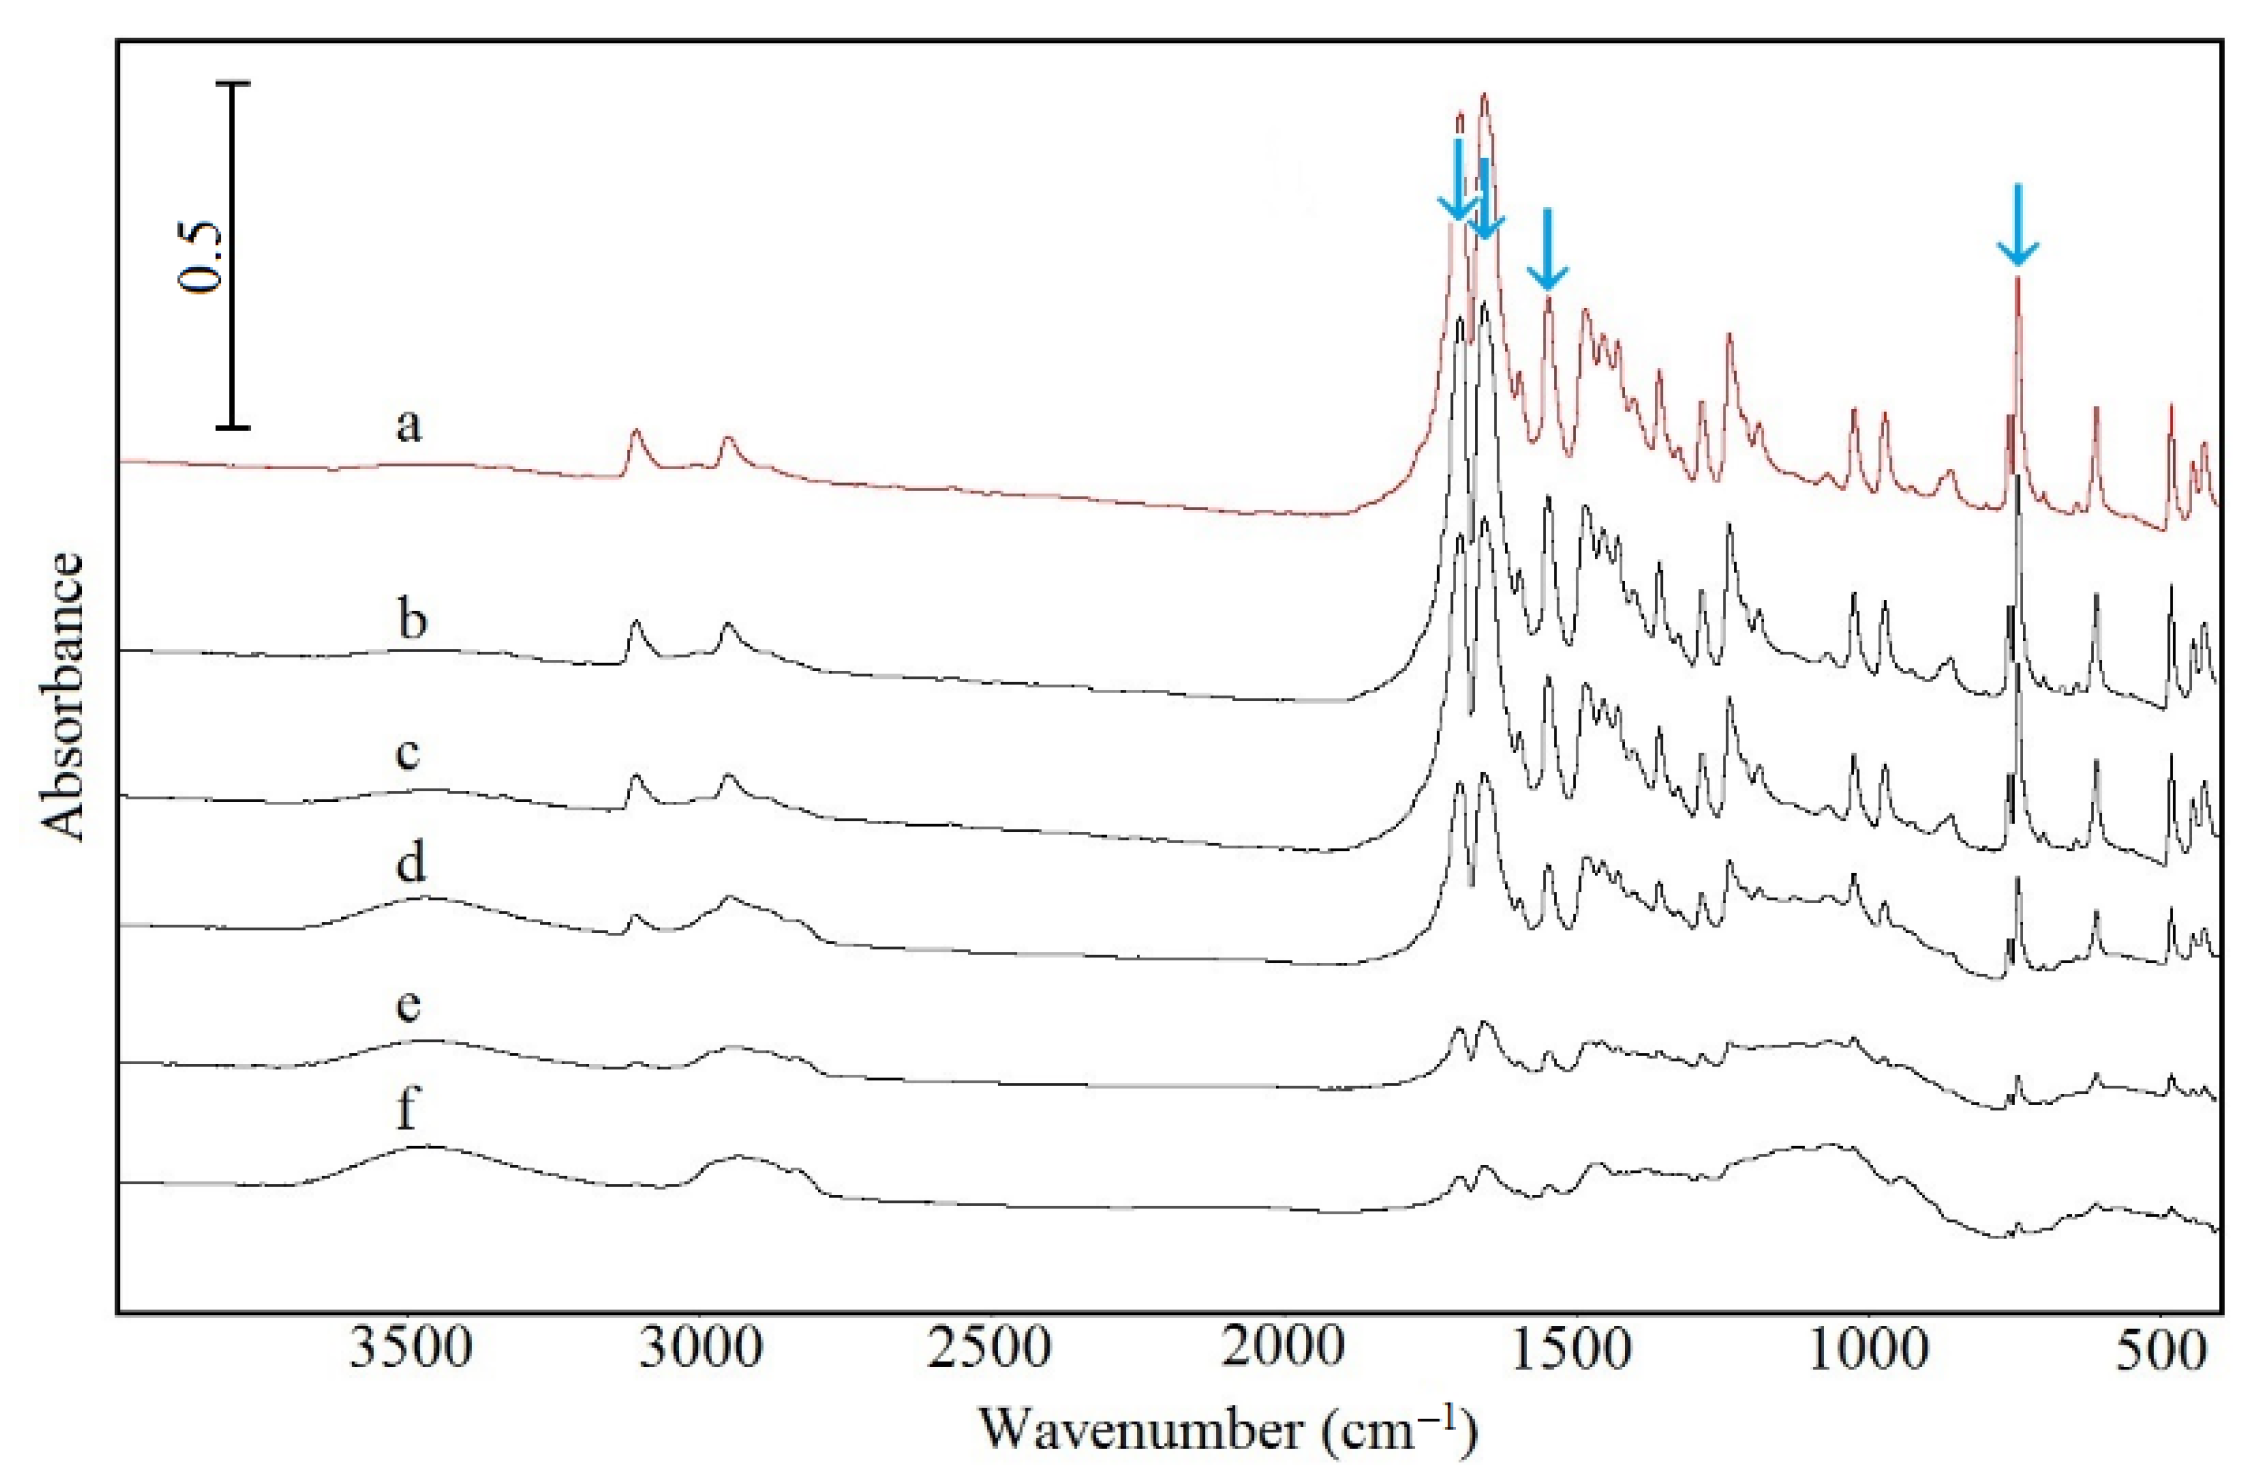
3.2. Theophylline Mixtures with HPMC
4. Discussion
5. Conclusions
Author Contributions
Funding
Institutional Review Board Statement
Informed Consent Statement
Data Availability Statement
Conflicts of Interest
References
- Censi, R.; Martino, P.D. Polymorph impact on the bioavailability and stability of poorly soluble drugs. Molecules 2015, 20, 18759–18776. [Google Scholar] [CrossRef] [Green Version]
- Vasconcelos, T.; Sarmento, B.; Costa, P. Solid dispersions as strategy to improve oral bioavailability of poor water soluble drugs. Drug Discov. Today 2007, 12, 1068–1075. [Google Scholar] [CrossRef]
- Schittny, A.; Huwyler, J.; Puchkov, M. Mechanisms of increased bioavailability through amorphous solid dispersions: A review. Drug Deliv. 2020, 27, 110–127. [Google Scholar] [CrossRef]
- Sinha, S.; Ali, M.; Baboota, S.; Ahuja, A.; Kumar, A.; Ali, J. Solid dispersion as an approach for bioavailability enhancement of poorly water-soluble drug ritonavir. AAPS PharmSciTech 2010, 11, 518–527. [Google Scholar] [CrossRef] [Green Version]
- Engers, D.; Teng, J.; Jimenez-Novoa, J.; Gent, P.; Hossack, S.; Campbell, C.; Tomson, J.; Ivanisevic, I.; Templeton, A.; Newman, A. A solid-state approach to enable early development compounds: Selection and animal bioavailability studies of an itraconazole amorphous solid dispersion. J. Pharm. Sci. 2010, 99, 3901–3922. [Google Scholar] [CrossRef] [PubMed]
- Dong, W.; Su, X.; Xu, M.; Hu, M.; Sun, Y.; Zhang, P. Preparation, characterization, and in vitro/vivo evaluation of polymer-assisting formulation of atorvastatin calcium based on solid dispersion technique. Asian J. Pharm. Sci. 2018, 13, 546–554. [Google Scholar] [CrossRef] [PubMed]
- Gao, N.; Guo, M.; Fu, Q.; He, Z. Application of hot melt extrusion to enhance the dissolution and oral bioavailability of oleanolic acid. Asian J. Pharm. Sci. 2017, 12, 66–72. [Google Scholar] [CrossRef] [Green Version]
- Alshehri, S.M.; Shakeel, F.; Ibrahim, M.A.; Elzayat, E.M.; Altamimi, M.; Mohsin, K.; Almeanazel, O.T.; Alkholief, M.; Alshetaili, A.; Alsulays, B.; et al. Dissolution and bioavailability improvement of bioactive apigenin using solid dispersions prepared by different techniques. Saudi Pharm. J. 2019, 27, 264–273. [Google Scholar] [CrossRef] [PubMed]
- Yang, G.; Zhao, Y.; Feng, N.; Zhang, Y.; Liu, Y.; Dang, B. Improved dissolution and bioavailability of silymarin delivered by a solid dispersion prepared using supercritical fluids. Asian J. Pharm. Sci. 2015, 10, 194–202. [Google Scholar] [CrossRef] [Green Version]
- Yan, Y.D.; Sung, J.H.; Kim, K.K.; Kim, D.W.; Kim, J.O.; Lee, B.J.; Yong, C.S.; Choi, H.G. Novel valsartan-loaded solid dispersion with enhanced bioavailability and no crystalline changes. Int. J. Pharm. 2012, 422, 202–210. [Google Scholar] [CrossRef]
- Rashid, R.; Kim, D.W.; Din, F.; Mustapha, O.; Yousaf, A.M.; Park, J.H.; Kim, J.O.; Yong, C.S.; Choi, H.G. Effect of hydroxypropylcellulose and Tween 80 on physicochemical properties and bioavailability of ezetimibe-loaded solid dispersion. Carbohydr. Polym. 2015, 130, 26–31. [Google Scholar] [CrossRef] [PubMed]
- Park, J.B.; Park, C.; Piao, Z.Z.; Amin, H.H.; Meghani, N.M.; Tran, P.H.L.; Tran, T.T.D.; Cui, J.H.; Cao, Q.R.; Oh, E.; et al. pH-independent controlled release tablets containing nanonizing valsartan solid dispersions for less variable bioavailability in humans. J. Drug Deliv. Sci. Technol. 2018, 46, 365–377. [Google Scholar] [CrossRef]
- Mohammadi, G.; Hemati, V.; Nikbakht, M.; Mirzaee, S.; Fattahi, A.; Ghanbari, K.; Adibkia, K. In vitro and in vivo evaluation of clarithromycin–urea solid dispersions prepared by solvent evaporation, electrospraying and freeze drying methods. Powder Technol. 2014, 257, 168–174. [Google Scholar] [CrossRef]
- Meng, F.; Dave, V.; Chauhan, H. Qualitative and quantitative methods to determine miscibility in amorphous drug-polymer systems. Eur. J. Pharm. Sci. 2015, 77, 106–111. [Google Scholar] [CrossRef]
- Tian, B.; Wang, X.; Zhang, Y.; Zhang, K.; Zhang, Y.; Tang, X. Theoretical prediction of a phase diagram for solid dispersions. Pharm. Res. 2015, 32, 840–851. [Google Scholar] [CrossRef] [PubMed]
- Marsac, P.J.; Shamblin, S.L.; Taylor, L.S. Theoretical and practical approaches for prediction of drug-polymer miscibility and solubility. Pharm. Res. 2006, 23, 2417–2426. [Google Scholar] [CrossRef] [PubMed]
- Zhao, Y.; Inbar, P.; Chokshi, H.P.; Malick, A.W.; Choi, D.S. Prediction of the thermal phase diagram of amorphous solid dispersions by Flory–Huggins theory. J. Pharm. Sci. 2011, 100, 3196–3207. [Google Scholar] [CrossRef] [PubMed]
- Lipton, R.B.; Diener, H.C.; Robbins, M.S.; Garas, S.Y.; Patel, K. Caffeine in the management of patients with headache. J. Headache Pain 2017, 18, 107. [Google Scholar] [CrossRef] [PubMed]
- Khamar, D.; Pritchard, G.; James, I. Polymorphs of anhydrous theophylline: Stable form IV consists of dimer pairs and metastable form I consists of hydrogen-bonded chains. Acta Crystallogr. C 2011, 67, 496–499. [Google Scholar] [CrossRef]
- Andrea, E.Y.; Dmitrienko, S.G.; Zolotov, Y.A. Methylxanthines: Properties and determination in various objects. Russ. Chem. Rev. 2012, 81, 397–414. [Google Scholar] [CrossRef]
- Forster, A.; Hempenstall, J.; Tucker, I.; Rades, T. Selection of excipients for melt extrusion with two poorly water-soluble drugs by solubility parameter calculation and thermal analysis. Int. J. Pharm. 2001, 226, 147–161. [Google Scholar] [CrossRef]
- Rokhade, A.P.; Shelke, N.B.; Patil, S.A.; Aminabhavi, T.M. Novel interpenetrating polymer network microspheres of chitosan and methylcellulose for controlled release of theophylline. Carbohydr. Polym. 2007, 69, 678–687. [Google Scholar] [CrossRef]
- Asada, M.; Takahashi, H.; Okamoto, H.; Tanino, H.; Danjo, K. Theophylline particle design using chitosan by the spray drying. Int. J. Pharm. 2004, 270, 167–174. [Google Scholar] [CrossRef] [PubMed]
- Djuris, J.; Nikolakakis, I.; Ibric, S.; Djuric, Z.; Kachrimanis, K. Preparation of carbamazepine-Soluplus® solid dispersions by hot-melt extrusion, and prediction of drug-polymer miscibility by thermodynamic model fitting. Eur. J. Pharm. Biopharm. 2013, 84, 228–237. [Google Scholar] [CrossRef]
- Maniruzzaman, M.; Islam, M.T.; Moradiya, H.G.; Halsey, S.A.; Slipper, I.J.; Chowdhry, B.Z.; Snowden, M.; Douroumis, D. Prediction of polymorphic transformations of paracetamol in solid dispersions. J. Pharm. Sci. 2014, 103, 1819–1828. [Google Scholar] [CrossRef] [PubMed]
- Baghel, S.; Cathcart, H.; O’Reilly, N.J. Theoretical and experimental investigation of drug-polymer interaction and miscibility and its impact on drug supersaturation in aqueous medium. Eur. J. Pharm. Biopharm. 2016, 107, 16–31. [Google Scholar] [CrossRef]
- Leyk, E.; Wesolowski, M. Interactions between paracetamol and hypromellose in the solid state. Front. Prarmacol. 2019, 10, 14. [Google Scholar] [CrossRef]
- Chan, A.; Coppens, K.; Hall, M.; He, V.; Jog, P.; Larsen, P.; Koblinski, B.; Read, M.; Rothe, D.; Somasi, S.; et al. Solubility parameters as a tool to predict API morphology in hot-melt-extruded (HME) formulations containing ethylcellulose, hypromellose and polyethylene oxide. In Proceedings of the Annual Meeting Exposition of the American Association of Pharmaceutical Scientists, San Antonio, TX, USA, 29 October–2 November 2006. [Google Scholar]
- Hansen, C.M. Hansen Solubility Parameters: A User’s Handbook, 2nd ed.; CRC Press: Boca Raton, FL, USA, 2007; pp. 349–369. [Google Scholar]
- Li, T. Understanding the polymorphism of aspirin with electronic calculations. J. Pharm. Sci. 2007, 96, 755–760. [Google Scholar] [CrossRef]
- Barton, A.F.M. Handbook of Solubility Parameters and Other Cohesion Parameters, 2nd ed.; CRC Press: Boca Raton, FL, USA, 1991; p. 356. [Google Scholar]
- Novena, L.M.; Kumar, S.S.; Athimoolam, S.; Saminathan, K.; Sridhar, B. Single crystal, vibrational and computational studies of theophylline (a bronchodilator drug) and its chloride salt. J. Mol. Struct. 2017, 1133, 294–306. [Google Scholar] [CrossRef]
- Caliandro, R.; Di Profio, G.; Nicolotti, O. Multivariate analysis of quaternary carbamazepine-saccharin mixtures by X-ray diffraction and infrared spectroscopy. J. Pharm. Biomed. Anal. 2013, 78, 269–279. [Google Scholar] [CrossRef]
- Dichi, E.; Sghaier, M.; Guiblin, N.; Dichi, E. Reinvestigation of the paracetamol–caffeine, aspirin–caffeine, and paracetamol–aspirin phase equilibria diagrams. J. Therm. Anal. Calorim. 2018, 131, 2141–2155. [Google Scholar] [CrossRef]
- Atici, E.B.; Karliga, B. Quantitative determination of two polymorphic forms of imatinib mesylate in a drug substance and tablet formulation by X-ray powder diffraction, differential scanning calorimetry and attenuated total reflectance Fourier transform infrared spectroscopy. J. Pharm. Biomed. Anal. 2015, 114, 330–340. [Google Scholar] [CrossRef]
- Bucci, R.; Magri, A.D.; Magri, A.L. DSC in the chemical analysis of drugs. Determination of diclofenac in pharmaceutical formulations. J. Therm. Anal. Calorim. 2000, 61, 369–376. [Google Scholar] [CrossRef]
- Campanella, L.; Valentina, M.; Tomassetti, M.; Vecchio, S. Quantitative determination of acetylsalicylic acid in commercial drugs using DSC Comparison with titration and UV spectrophotometric methods. J. Therm. Anal. Calorim. 2010, 102, 249–259. [Google Scholar] [CrossRef]
- Karthika, M.; Senthilkumar, L.; Kanakaraju, R. Theoretical studies on hydrogen bonding in caffeine-theophylline complexes. Comput. Theor. Chem. 2012, 979, 54–63. [Google Scholar] [CrossRef]
- Sahoo, S.; Chakraborti, C.K.; Mishra, S.C.; Naik, S. Analytical characterization of a gelling biodegradable polymer. Drug Invent. Today 2011, 3, 6. [Google Scholar]
- Szterner, P.; Legendre, B.; Sghaier, M. Thermodynamic properties of polymorphic forms of theophylline. Part I: DSC, TG, X-ray study. J. Therm. Anal. Calorim. 2010, 99, 325–335. [Google Scholar] [CrossRef]
- Gunasekaran, S.; Sankari, G.; Ponnusamy, S. Vibrational spectral investigation on xanthine and its derivatives–theophylline, caffeine and theobromine. Spectrochim. Acta A 2005, 61, 117–127. [Google Scholar] [CrossRef]
- Tavagnacco, L.; Schnupf, U.; Mason, E.P.; Saboungi, M.L.; Cesàro, A.; Brady, W.J. Molecular dynamics simulation studies of caffeine aggregation in aqueous solution. J. Phys. Chem. B 2011, 115, 10957–10966. [Google Scholar] [CrossRef] [PubMed] [Green Version]
- Yao, R.; Xu, J.; Lu, X.; Deng, S. Phase transition behavior of HPMC-AA and preparation of HPMC-PAA nanogels. J. Nanomater. 2011, 2011, 507542. [Google Scholar] [CrossRef]


| Drug Substance | Polymorphic/Amorphous Form | AUC (μg·h/mL) | Cmax (μg/mL) | Tmax (h) | Ref. |
|---|---|---|---|---|---|
| Itraconazole | crystalline | 10.5 ± 8.6 ** | 6.0 ± 2.0 | 5 | |
| amorphous (SD with HPMC-P) | 340.7 ± 27.2 ** | 1.7 ± 0.5 | |||
| Atorvastatin calcium | Lipitor (commercial product) | 534.5 ± 278.3 (1) * | 338.7 ± 80.4 ** | 0.7 ± 0.2 | 6 |
| amorphous (SD with Poloxamer 188) | 919.0 ± 315.1 (1) * | 972.2 ± 174.5 ** | 0.6 ± 0.2 | ||
| Oleanolic acid | commercial tablet | 761.8 ± 272.2 (2) * | 89.1 ± 33.1 ** | 1.8 ± 1.6 | 7 |
| amorphous (SD with PVP) | 1840 ± 381.8 (2) * | 498.7 ± 120.8 ** | 1.1 ± 0.5 | ||
| crystalline (PM with PVP) | 615.1 ± 115.5 (2) * | 134.4 ± 47.4 ** | 1.1 ± 1.0 | ||
| Apigenin | crystalline | 146.5 ± 62.4 (2) | 21.4 ± 6.4 | 3.6 ± 0.8 | 8 |
| commercial capsule | 142.0 ± 30.1 (2) | 17.5 ± 1.3 | 4.0 ± 0.7 | ||
| amorphous (SD with Pluronic F-127, microwave method) | 453.2 ± 328.8 (2) | 60.5 ± 24.7 | 2.8 ± 1.3 | ||
| amorphous (SD with Pluronic F-127, melted method) | 187.4 ± 83.4 (2) | 31.8 ± 21.2 | 2.8 ± 1.8 | ||
| partially amorphous (SD with Pluronic F-127, kneaded method) | 83.4 ± 19.4 (2) | 11.8 ± 4.4 | 3.2 ± 1.8 | ||
| Silymarin | crystalline | 2.1 ± 0.1 (3) | 0.6 ± 0.1 | 1.5 ± 0.4 | 9 |
| amorphous (SD with PVP K17) | 5.0 ± 0.4 (3) | 1.1 ± 0.2 | 0.5 ± 0.1 | ||
| Valsartan | crystalline | 10.6 ± 0.8 (4) | 0.7 ± 0.1 | 1.0 ± 0.2 | 10 |
| commercial product | 13.66 ± 2.9 (4) | 0.8 ± 0.1 | 1.2 ± 0.1 | ||
| amorphous (SD with HPMC and SLS) | 23.6 ± 2.6 (4) | 2.5 ± 0.2 | 0.7 ± 0.1 | ||
| Ezetimibe | crystalline | 3.1 ± 0.7 | 0.3 ± 0.3 | 1.4 ± 0.9 | 11 |
| amorphous (SD with HPC) | 4.9 ± 0.5 | 0.5 ± 0.1 | 0.7 ± 0.3 | ||
| amorphous (SD with HPC and Tween 80) | 5.4 ± 0.2 | 0.9 ± 0.1 | 1.2 ± 0.3 |
| Parameter | HPMC | Caffeine | Theophylline |
|---|---|---|---|
| Molar mass (g/mol) | 10,000 | 194.19 [28] | 180.16 [30] |
| Density (g/cm3) | 1.0 [27] | 1.23 [28] | 1.35 [30] |
| Heat of melting (J/mol) | – | 19,736 | 28,264 |
| Molar volume (cm3/mol) | – | 157.9 [28] | 133.45 |
| Volume of a lattice (Å3) | – | 827.1 [29] | 898.43 [31] |
| Glass transition (K) | 433.15 | - | - |
| Melting (K) | – | 509.34 | 544.97 |
| Solubility Parameters (MPa)1/2 | |||
| δd | 16.95 [27] | 19.5 [28] | 17.0 [30] |
| δp | 8.55 [27] | 10.1 [28] | 11.0 [30] |
| δh | 9.04 [27] | 13.0 [28] | 12.0 [30] |
| δ | 21.03 | 25.52 | 23.53 |
| Content of Drug Substance (%) | Mole Fraction (x) | Volume Fraction (ɸ) | Temperature of Miscibility (°C) | ||
|---|---|---|---|---|---|
| Caffeine | HPMC | Caffeine | HPMC | ||
| 9 | 0.8674 | 0.1326 | 0.073 | 0.927 | 25.60 |
| 10 | 0.8802 | 0.1198 | 0.081 | 0.919 | 59.38 |
| 11 | 0.8910 | 0.1090 | 0.089 | 0.911 | 93.27 |
| 12 | 0.9002 | 0.0998 | 0.098 | 0.902 | 127.28 |
| 13 | 0.9081 | 0.0919 | 0.106 | 0.894 | 161.40 |
| 14 | 0.9150 | 0.0850 | 0.114 | 0.886 | 195.65 |
| 15 | 0.9211 | 0.0789 | 0.123 | 0.877 | 230.01 |
| Theophylline | HPMC | Theophylline | HPMC | ||
| 25 | 0.9566 | 0.0434 | 0.209 | 0.791 | 2.87 |
| 30 | 0.9659 | 0.0341 | 0.254 | 0.746 | 62.41 |
| 35 | 0.9727 | 0.0273 | 0.299 | 0.701 | 123.49 |
| 40 | 0.9778 | 0.0222 | 0.346 | 0.654 | 186.13 |
| 45 | 0.9819 | 0.0181 | 0.394 | 0.606 | 250.35 |
| Temperature (°C) | 0 | 10 | 20 | 30 | 40 | 50 | 60 | 70 | 80 | 90 | 100 | 110 | 120 | 130 | 140 | 150 | 160 | 170 | 180 | 190 | 200 | 210 | 220 | 230 |
|---|---|---|---|---|---|---|---|---|---|---|---|---|---|---|---|---|---|---|---|---|---|---|---|---|
| Caffeine (%) | Caffeine Dissolved in HPMC at a Given Temperature (%) | |||||||||||||||||||||||
| 2 | 0.44 | 0.61 | 0.83 | 1.10 | 1.44 | 1.86 | ||||||||||||||||||
| 3 | 0.44 | 0.62 | 0.84 | 1.12 | 1.46 | 1.88 | 2.38 | 2.98 | ||||||||||||||||
| 4 | 0.45 | 0.63 | 0.85 | 1.13 | 1.48 | 1.91 | 2.41 | 3.02 | 3.72 | |||||||||||||||
| 5 | 0.46 | 0.64 | 0.86 | 1.15 | 1.50 | 1.93 | 2.45 | 3.05 | 3.77 | 4.59 | ||||||||||||||
| 6 | 0.46 | 0.64 | 0.88 | 1.17 | 1.52 | 1.96 | 2.48 | 3.09 | 3.81 | 4.65 | 5.61 | |||||||||||||
| 7 | 0.47 | 0.65 | 0.89 | 1.18 | 1.54 | 1.98 | 2.51 | 3.13 | 3.86 | 4.71 | 5.68 | 6.78 | ||||||||||||
| 8 | 0.48 | 0.66 | 0.90 | 1.20 | 1.56 | 2.01 | 2.54 | 3.17 | 3.91 | 4.76 | 5.74 | 6.86 | ||||||||||||
| 9 | 0.48 | 0.67 | 0.91 | 1.21 | 1.58 | 2.03 | 2.57 | 3.21 | 3.96 | 4.82 | 5.81 | 6.94 | 8.21 | |||||||||||
| 10 | 0.49 | 0.68 | 0.92 | 1.23 | 1.60 | 2.06 | 2.61 | 3.25 | 4.01 | 4.88 | 5.88 | 7.02 | 8.31 | |||||||||||
| 11 | 0.50 | 0.69 | 0.94 | 1.25 | 1.63 | 2.09 | 2.64 | 3.29 | 4.06 | 4.94 | 5.95 | 7.11 | 8.41 | |||||||||||
| 12 | 0.51 | 0.70 | 0.95 | 1.26 | 1.65 | 2.11 | 2.67 | 3.33 | 4.11 | 5.00 | 6.03 | 7.19 | 8.50 | 9.97 | ||||||||||
| 13 | 0.51 | 0.71 | 0.96 | 1.28 | 1.67 | 2.14 | 2.71 | 3.38 | 4.16 | 5.06 | 6.10 | 7.28 | 8.60 | 10.09 | 11.74 | |||||||||
| 14 | 0.52 | 0.72 | 0.98 | 1.30 | 1.69 | 2.17 | 2.74 | 3.42 | 4.21 | 5.12 | 6.17 | 7.36 | 8.70 | 10.20 | 11.87 | |||||||||
| 15 | 0.53 | 0.73 | 0.99 | 1.31 | 1.71 | 2.20 | 2.77 | 3.46 | 4.26 | 5.18 | 6.24 | 7.45 | 8.80 | 10.32 | 12.01 | 13.87 | ||||||||
| 16 | 0.53 | 0.74 | 1.00 | 1.33 | 1.73 | 2.22 | 2.81 | 3.50 | 4.31 | 5.25 | 6.32 | 7.53 | 8.91 | 10.44 | 12.14 | 14.02 | ||||||||
| 17 | 0.54 | 0.75 | 1.01 | 1.35 | 1.76 | 2.25 | 2.84 | 3.54 | 4.36 | 5.31 | 6.39 | 7.62 | 9.01 | 10.56 | 12.28 | 14.18 | ||||||||
| 18 | 0.55 | 0.76 | 1.03 | 1.36 | 1.78 | 2.28 | 2.88 | 3.59 | 4.42 | 5.37 | 6.47 | 7.71 | 9.11 | 10.68 | 12.42 | 14.34 | 16.45 | |||||||
| 19 | 0.56 | 0.77 | 1.04 | 1.38 | 1.80 | 2.31 | 2.91 | 3.63 | 4.47 | 5.44 | 6.54 | 7.80 | 9.22 | 10.80 | 12.56 | 14.50 | 16.63 | |||||||
| 20 | 0.56 | 0.78 | 1.05 | 1.40 | 1.82 | 2.34 | 2.95 | 3.68 | 4.52 | 5.50 | 6.62 | 7.89 | 9.32 | 10.92 | 12.70 | 14.66 | 16.81 | 19.16 | ||||||
| 25 | 0.60 | 0.83 | 1.12 | 1.49 | 1.94 | 2.48 | 3.13 | 3.90 | 4.79 | 5.83 | 7.01 | 8.35 | 9.86 | 11.54 | 13.41 | 15.48 | 17.74 | 20.21 | 22.89 | |||||
| 30 | 0.64 | 0.89 | 1.20 | 1.58 | 2.06 | 2.63 | 3.32 | 4.13 | 5.07 | 6.16 | 7.41 | 8.82 | 10.41 | 12.18 | 14.15 | 16.32 | 18.70 | 21.30 | 24.11 | |||||
| 35 | 0.68 | 0.94 | 1.27 | 1.68 | 2.18 | 2.79 | 3.51 | 4.37 | 5.36 | 6.51 | 7.82 | 9.31 | 10.98 | 12.85 | 14.92 | 17.20 | 19.69 | 22.42 | 25.38 | 28.57 | ||||
| 40 | 0.72 | 1.00 | 1.34 | 1.78 | 2.31 | 2.95 | 3.71 | 4.61 | 5.66 | 6.87 | 8.25 | 9.81 | 11.57 | 13.53 | 15.70 | 18.09 | 20.71 | 23.57 | 26.67 | 30.02 | 33.62 | |||
| 45 | 0.76 | 1.05 | 1.42 | 1.88 | 2.43 | 3.11 | 3.91 | 4.86 | 5.96 | 7.23 | 8.68 | 10.32 | 12.16 | 14.22 | 16.50 | 19.01 | 21.76 | 24.75 | 28.00 | 31.51 | 35.27 | 39.31 | ||
| 50 | 0.81 | 1.11 | 1.50 | 1.97 | 2.56 | 3.27 | 4.12 | 5.11 | 6.26 | 7.60 | 9.12 | 10.84 | 12.77 | 14.92 | 17.31 | 19.94 | 22.82 | 25.95 | 29.35 | 33.02 | 36.97 | 41.19 | ||
| 55 | 0.85 | 1.17 | 1.57 | 2.07 | 2.69 | 3.43 | 4.32 | 5.36 | 6.57 | 7.96 | 9.56 | 11.36 | 13.38 | 15.64 | 18.13 | 20.88 | 23.89 | 27.17 | 30.73 | 34.56 | 38.68 | 43.10 | ||
| 60 | 0.89 | 1.22 | 1.65 | 2.17 | 2.82 | 3.59 | 4.52 | 5.61 | 6.88 | 8.33 | 10.00 | 11.88 | 13.99 | 16.35 | 18.96 | 21.83 | 24.98 | 28.40 | 32.11 | 36.12 | 40.42 | 45.03 | 49.94 | |
| 65 | 0.93 | 1.28 | 1.72 | 2.27 | 2.94 | 3.75 | 4.72 | 5.86 | 7.18 | 8.70 | 10.43 | 12.40 | 14.60 | 17.06 | 19.78 | 22.78 | 26.06 | 29.63 | 33.50 | 37.68 | 42.17 | 46.97 | 52.10 | 57.54 |
| 70 | 0.97 | 1.33 | 1.79 | 2.36 | 3.06 | 3.91 | 4.91 | 6.09 | 7.47 | 9.05 | 10.86 | 12.91 | 15.20 | 17.76 | 20.60 | 23.72 | 27.14 | 30.86 | 34.89 | 39.24 | 43.92 | 48.92 | 54.25 | 59.92 |
| 75 | 1.00 | 1.38 | 1.85 | 2.45 | 3.18 | 4.05 | 5.10 | 6.33 | 7.75 | 9.40 | 11.28 | 13.40 | 15.79 | 18.45 | 21.40 | 24.64 | 28.19 | 32.06 | 36.26 | 40.78 | 45.65 | 50.85 | 56.40 | 62.30 |
| 80 | 1.03 | 1.42 | 1.92 | 2.53 | 3.28 | 4.19 | 5.27 | 6.54 | 8.02 | 9.73 | 11.68 | 13.88 | 16.35 | 19.11 | 22.17 | 25.54 | 29.23 | 33.24 | 37.60 | 42.30 | 47.35 | 52.75 | 58.52 | 64.65 |
| 85 | 1.06 | 1.46 | 1.97 | 2.60 | 3.38 | 4.31 | 5.43 | 6.74 | 8.27 | 10.04 | 12.05 | 14.33 | 16.89 | 19.74 | 22.91 | 26.40 | 30.22 | 34.38 | 38.89 | 43.76 | 49.00 | 54.61 | 60.59 | 66.95 |
| 90 | 1.08 | 1.49 | 2.02 | 2.67 | 3.46 | 4.43 | 5.57 | 6.93 | 8.50 | 10.32 | 12.39 | 14.74 | 17.39 | 20.33 | 23.60 | 27.21 | 31.16 | 35.46 | 40.13 | 45.17 | 50.59 | 56.39 | 62.59 | 69.17 |
| 95 | 1.10 | 1.52 | 2.05 | 2.72 | 3.53 | 4.52 | 5.70 | 7.08 | 8.70 | 10.57 | 12.70 | 15.12 | 17.84 | 20.87 | 24.24 | 27.96 | 32.03 | 36.47 | 38.43 | 46.49 | 52.09 | 58.09 | 64.49 | 71.31 |
| Content of Caffeine in Mixture (%) | Heat of Fusion (J/g) ΔHf | Onset Temperature (°C) Ton | Peak Temperature (°C) Tp |
| 10 | – | – | – |
| 30 | 3.7 | 220.6 | 233.5 |
| 50 | 20.5 | 235.3 | 239.2 |
| 70 | 34.2 | 235.9 | 238.3 |
| 90 | 82.5 | 235.5 | 237.3 |
| 100 | 103.5 | 236.9 | 237.9 |
| Content of Theophylline in Mixture (%) | Heat of Fusion (J/g) ΔHf | Onset Temperature (°C) Ton | Peak Temperature (°C) Tp |
| 10 | – | – | – |
| 30 | 20.9 | 249.5 | 268.0 |
| 50 | 62.1 | 261.8 | 270.2 |
| 70 | 83.8 | 268.4 | 272.3 |
| 90 | 125.7 | 271.0 | 273.4 |
| 100 | 155.3 | 271.9 | 273.1 |
| FTIR (cm–1) | Raman (cm–1) | ||||
|---|---|---|---|---|---|
| This Study | [38] | Assignment | This Study | [38] | Assignment |
| Caffeine | |||||
| 481 | 481 | δ a C–N–C | 226 | 225 | δ N–C–N |
| 610 | 611 | δ C=C–C | 442 | 444 | δ N–C–C |
| 745 | 743 | δ O=C–C | 481 | 488 | δ a C–N–C |
| 860 | 862 | δ N=C–H | 553 | 556 | δ C-N–CH3 |
| 973 | 973 | ν N–CH3 | 641 | 645 | δ C=C–N |
| 1025 | 1025 | ν a N–CH3 | 739 | 745 | δ C=C–C |
| 1188 | 1189 | ν CC, ν a CN | 799 | 800 | δ N–C–H |
| 1239 | 1237 | ν CN | 925 | 925 | ν s N–CH3 |
| 1286 | 1285 | ν CN | 1019 | 1020 | ν a N–CH3 |
| 1549 | 1548 | ν s C=O | 1240 | 1241 | ν CN |
| 1598 | 1600 | ν C=C | 1282 | 1288 | ν CN |
| 1659 | 1660 | ν a C=O | 1326 | 1331 | ν CN |
| 1699 | 1700 | ν C=N | 1598 | 1600 | ν C=C |
| 2953 | 2954 | ν CH | 1654 | 1656 | ν a C=O |
| 1696 | 1700 | ν C=N | |||
| 2958 | 2963 | ν CH | |||
| Theophylline | |||||
| 446 | 450 | δ N–C–C | 444 | 450 | δ a C–N–C |
| 504 | 500 | δ a C–N–C | 552 | 550 | δ C=C–C |
| 610 | 615 | δ C=C–N | 608 | 610 | δ C=C–N |
| 667 | 670 | δ O=C–N | 664 | 660 | δ O=C–N |
| 742 | 744 | δ O=C–C | 762 | 760 | δ O=C–C |
| 848 | 850 | δ C–N–H | 925 | 920 | δ N–C–N |
| 927 | 925 | ν s N–CH3 | 947 | 940 | ν s N–CH3 |
| 979 | 980 | ν a N–CH3 | 967 | 970 | δ N=C–H |
| 1241 | 1240 | ν CN | 1082 | 1088 | ν s C–N |
| 1284 | 1285 | ν CN | 1246 | 1244 | ν C–N |
| 1313 | 1310 | ν CN | 1284 | 1280 | ν C–N |
| 1567 | 1556 | ν s C=O | 1568 | 1570 | ν s C=O |
| 1667 | 1664 | ν a C=O | 1609 | 1613 | ν C=C |
| 1718 | 1710 | ν C=N | 1662 | 1663 | ν a C=O |
| 1704 | 1706 | ν C=N | |||
| 3121 | 3120 | ν N–H | |||
| Temperature (°C) | 0 | 10 | 20 | 30 | 40 | 50 | 60 | 70 | 80 | 90 | 100 | 110 | 120 | 130 | 140 | 150 | 160 | 170 | 180 | 190 | 200 | 210 | 220 | 230 | 240 | 250 | 260 | 270 |
|---|---|---|---|---|---|---|---|---|---|---|---|---|---|---|---|---|---|---|---|---|---|---|---|---|---|---|---|---|
| Theophylline (%) | Theophylline Dissolved in HPMC at a Given Temperature (%) | |||||||||||||||||||||||||||
| 2 | 0.06 | 0.09 | 0.15 | 0.22 | 0.32 | 0.45 | 0.62 | 0.85 | 1.14 | 1.50 | 1.95 | |||||||||||||||||
| 3 | 0.06 | 0.10 | 0.15 | 0.22 | 0.32 | 0.45 | 0.63 | 0.86 | 1.15 | 1.51 | 1.97 | 2.52 | ||||||||||||||||
| 4 | 0.06 | 0.10 | 0.15 | 0.22 | 0.32 | 0.46 | 0.64 | 0.87 | 1.16 | 1.53 | 1.99 | 2.55 | 3.22 | |||||||||||||||
| 5 | 0.06 | 0.10 | 0.15 | 0.22 | 0.33 | 0.46 | 0.64 | 0.88 | 1.17 | 1.55 | 2.01 | 2.57 | 3.26 | 4.07 | ||||||||||||||
| 6 | 0.06 | 0.10 | 0.15 | 0.23 | 0.33 | 0.47 | 0.65 | 0.89 | 1.19 | 1.56 | 2.03 | 2.60 | 3.29 | 4.11 | 5.08 | |||||||||||||
| 7 | 0.06 | 0.10 | 0.15 | 0.23 | 0.33 | 0.47 | 0.66 | 0.90 | 1.20 | 1.58 | 2.05 | 2.63 | 3.32 | 4.15 | 5.14 | 6.29 | ||||||||||||
| 8 | 0.06 | 0.10 | 0.16 | 0.23 | 0.34 | 0.48 | 0.67 | 0.91 | 1.21 | 1.60 | 2.08 | 2.66 | 3.36 | 4.20 | 5.19 | 6.35 | 7.70 | |||||||||||
| 9 | 0.07 | 0.10 | 0.16 | 0.24 | 0.34 | 0.49 | 0.67 | 0.92 | 1.23 | 1.62 | 2.10 | 2.69 | 3.39 | 4.24 | 5.24 | 6.42 | 7.78 | |||||||||||
| 10 | 0.07 | 0.11 | 0.16 | 0.24 | 0.35 | 0.49 | 0.68 | 0.93 | 1.24 | 1.63 | 2.12 | 2.71 | 3.43 | 4.29 | 5.30 | 6.48 | 7.86 | 9.44 | ||||||||||
| 11 | 0.07 | 0.11 | 0.16 | 0.24 | 0.35 | 0.50 | 0.69 | 0.94 | 1.26 | 1.65 | 2.14 | 2.74 | 3.47 | 4.33 | 5.35 | 6.55 | 7.94 | 9.54 | ||||||||||
| 12 | 0.07 | 0.11 | 0.16 | 0.24 | 0.36 | 0.50 | 0.70 | 0.95 | 1.27 | 1.67 | 2.17 | 2.77 | 3.50 | 4.38 | 5.41 | 6.61 | 8.02 | 9.63 | 11.48 | |||||||||
| 13 | 0.07 | 0.11 | 0.17 | 0.25 | 0.36 | 0.51 | 0.71 | 0.96 | 1.28 | 1.69 | 2.19 | 2.80 | 3.54 | 4.42 | 5.46 | 6.68 | 8.10 | 9.73 | 11.59 | |||||||||
| 14 | 0.07 | 0.11 | 0.17 | 0.25 | 0.36 | 0.51 | 0.71 | 0.97 | 1.30 | 1.71 | 2.22 | 2.83 | 3.58 | 4.47 | 5.52 | 6.75 | 8.18 | 9.83 | 11.71 | 13.84 | ||||||||
| 15 | 0.07 | 0.11 | 0.17 | 0.25 | 0.37 | 0.52 | 0.72 | 0.98 | 1.31 | 1.73 | 2.24 | 2.86 | 3.62 | 4.52 | 5.58 | 6.82 | 8.26 | 9.92 | 11.82 | 13.98 | ||||||||
| 16 | 0.07 | 0.11 | 0.17 | 0.26 | 0.37 | 0.53 | 0.73 | 0.99 | 1.33 | 1.75 | 2.26 | 2.89 | 3.66 | 4.56 | 5.64 | 6.89 | 8.35 | 10.02 | 11.94 | 14.12 | ||||||||
| 17 | 0.07 | 0.11 | 0.18 | 0.26 | 0.38 | 0.53 | 0.74 | 1.01 | 1.34 | 1.77 | 2.29 | 2.93 | 3.69 | 4.61 | 5.69 | 6.96 | 8.43 | 10.13 | 12.06 | 14.26 | 16.74 | |||||||
| 18 | 0.07 | 0.12 | 0.18 | 0.26 | 0.38 | 0.54 | 0.75 | 1.02 | 1.36 | 1.79 | 2.31 | 2.96 | 3.73 | 4.66 | 5.75 | 7.03 | 8.52 | 10.23 | 12.18 | 14.40 | 16.90 | |||||||
| 19 | 0.07 | 0.12 | 0.18 | 0.27 | 0.39 | 0.55 | 0.76 | 1.03 | 1.37 | 1.81 | 2.34 | 2.99 | 3.77 | 4.71 | 5.81 | 7.11 | 8.61 | 10.33 | 12.30 | 14.54 | 17.07 | |||||||
| 20 | 0.08 | 0.12 | 0.18 | 0.27 | 0.39 | 0.55 | 0.77 | 1.04 | 1.39 | 1.83 | 2.37 | 3.02 | 3.82 | 4.76 | 5.88 | 7.18 | 8.69 | 10.44 | 12.43 | 14.69 | 17.23 | |||||||
| 25 | 0.08 | 0.13 | 0.19 | 0.29 | 0.42 | 0.59 | 0.81 | 1.10 | 1.47 | 1.93 | 2.50 | 3.19 | 4.03 | 5.02 | 6.19 | 7.56 | 9.15 | 10.98 | 13.07 | 15.44 | 18.10 | 21.10 | ||||||
| 30 | 0.09 | 0.14 | 0.21 | 0.31 | 0.44 | 0.62 | 0.86 | 1.17 | 1.56 | 2.04 | 2.64 | 3.37 | 4.25 | 5.29 | 6.53 | 7.97 | 9.64 | 11.55 | 13.74 | 16.23 | 19.03 | 22.16 | 25.65 | |||||
| 35 | 0.09 | 0.14 | 0.22 | 0.32 | 0.47 | 0.66 | 0.91 | 1.24 | 1.65 | 2.16 | 2.79 | 3.56 | 4.49 | 5.59 | 6.88 | 8.40 | 10.15 | 12.16 | 14.46 | 17.07 | 20.00 | 23.29 | 26.95 | 31.00 | ||||
| 40 | 0.10 | 0.15 | 0.23 | 0.35 | 0.50 | 0.70 | 0.97 | 1.31 | 1.74 | 2.29 | 2.95 | 3.76 | 4.74 | 5.90 | 7.26 | 8.85 | 10.69 | 12.81 | 15.23 | 17.96 | 21.04 | 24.48 | 28.32 | 32.56 | 37.24 | |||
| 45 | 0.11 | 0.16 | 0.25 | 0.37 | 0.53 | 0.74 | 1.03 | 1.39 | 1.85 | 2.42 | 3.12 | 3.98 | 5.00 | 6.22 | 7.66 | 9.33 | 11.27 | 13.50 | 16.03 | 18.90 | 22.13 | 25.75 | 29.77 | 34.22 | 39.12 | |||
| 50 | 0.11 | 0.17 | 0.27 | 0.39 | 0.56 | 0.79 | 1.09 | 1.47 | 1.96 | 2.56 | 3.30 | 4.20 | 5.28 | 6.57 | 8.08 | 9.84 | 11.88 | 14.22 | 16.88 | 19.90 | 23.29 | 27.09 | 31.30 | 35.97 | 41.11 | 46.75 | ||
| 55 | 0.12 | 0.19 | 0.28 | 0.42 | 0.60 | 0.84 | 1.15 | 1.56 | 2.07 | 2.71 | 3.49 | 4.44 | 5.58 | 6.94 | 8.53 | 10.38 | 12.53 | 14.99 | 17.79 | 20.95 | 24.52 | 28.50 | 32.93 | 37.83 | 43.22 | 49.13 | ||
| 60 | 0.13 | 0.20 | 0.30 | 0.44 | 0.63 | 0.89 | 1.22 | 1.65 | 2.19 | 2.87 | 3.69 | 4.69 | 5.90 | 7.32 | 9.00 | 10.95 | 13.21 | 15.79 | 18.74 | 22.07 | 25.81 | 29.99 | 34.64 | 39.78 | 45.44 | 51.64 | ||
| 65 | 0.14 | 0.21 | 0.32 | 0.47 | 0.67 | 0.94 | 1.30 | 1.75 | 2.32 | 3.03 | 3.90 | 4.96 | 6.23 | 7.73 | 9.49 | 11.55 | 13.92 | 16.65 | 19.74 | 23.24 | 27.18 | 31.57 | 36.45 | 41.85 | 47.79 | 54.29 | 61.39 | |
| 70 | 0.14 | 0.22 | 0.34 | 0.50 | 0.71 | 1.00 | 1.37 | 1.85 | 2.45 | 3.20 | 4.12 | 5.24 | 6.57 | 8.16 | 10.02 | 12.18 | 14.68 | 17.54 | 20.80 | 24.48 | 28.61 | 33.23 | 38.36 | 44.03 | 50.26 | 57.09 | 64.54 | |
| 75 | 0.15 | 0.24 | 0.36 | 0.53 | 0.75 | 1.06 | 1.45 | 1.96 | 2.60 | 3.39 | 4.36 | 5.53 | 6.94 | 8.61 | 10.57 | 12.84 | 15.47 | 18.49 | 21.91 | 25.78 | 30.13 | 34.98 | 40.37 | 46.32 | 52.87 | 60.04 | 67.86 | |
| 80 | 0.16 | 0.25 | 0.38 | 0.56 | 0.80 | 1.12 | 1.54 | 2.07 | 2.74 | 3.58 | 4.60 | 5.84 | 7.32 | 9.08 | 11.14 | 13.54 | 16.30 | 19.47 | 23.08 | 27.15 | 31.72 | 36.82 | 42.48 | 48.73 | 55.61 | 63.14 | 71.35 | |
| 85 | 0.17 | 0.27 | 0.40 | 0.59 | 0.84 | 1.18 | 1.62 | 2.18 | 2.89 | 3.77 | 4.85 | 6.16 | 7.72 | 9.57 | 11.74 | 14.26 | 17.17 | 20.51 | 24.29 | 28.57 | 33.38 | 38.74 | 44.69 | 51.26 | 58.49 | 66.40 | 75.02 | |
| 90 | 0.18 | 0.28 | 0.42 | 0.62 | 0.89 | 1.25 | 1.71 | 2.30 | 3.05 | 3.98 | 5.11 | 6.49 | 8.13 | 10.08 | 12.36 | 15.01 | 18.08 | 21.58 | 25.57 | 30.06 | 35.11 | 40.75 | 47.00 | 53.91 | 61.50 | 69.81 | 78.87 | 88.70 |
| 95 | 0.19 | 0.30 | 0.45 | 0.66 | 0.94 | 1.31 | 1.80 | 2.43 | 3.21 | 4.19 | 5.38 | 6.83 | 8.55 | 10.60 | 13.00 | 15.79 | 19.01 | 22.70 | 20.81 | 31.61 | 36.92 | 42.84 | 49.41 | 56.67 | 64.65 | 73.38 | 82.89 | 93.22 |
Publisher’s Note: MDPI stays neutral with regard to jurisdictional claims in published maps and institutional affiliations. |
© 2021 by the authors. Licensee MDPI, Basel, Switzerland. This article is an open access article distributed under the terms and conditions of the Creative Commons Attribution (CC BY) license (https://creativecommons.org/licenses/by/4.0/).
Share and Cite
Leyk, E.; Wesolowski, M. Miscibility and Solubility of Caffeine and Theophylline in Hydroxypropyl Methylcellulose. Pharmaceutics 2021, 13, 1836. https://doi.org/10.3390/pharmaceutics13111836
Leyk E, Wesolowski M. Miscibility and Solubility of Caffeine and Theophylline in Hydroxypropyl Methylcellulose. Pharmaceutics. 2021; 13(11):1836. https://doi.org/10.3390/pharmaceutics13111836
Chicago/Turabian StyleLeyk, Edyta, and Marek Wesolowski. 2021. "Miscibility and Solubility of Caffeine and Theophylline in Hydroxypropyl Methylcellulose" Pharmaceutics 13, no. 11: 1836. https://doi.org/10.3390/pharmaceutics13111836
APA StyleLeyk, E., & Wesolowski, M. (2021). Miscibility and Solubility of Caffeine and Theophylline in Hydroxypropyl Methylcellulose. Pharmaceutics, 13(11), 1836. https://doi.org/10.3390/pharmaceutics13111836