Personalised 3D Printed Medicines: Optimising Material Properties for Successful Passive Diffusion Loading of Filaments for Fused Deposition Modelling of Solid Dosage Forms


 ,
,  ,
,  and
and
Abstract
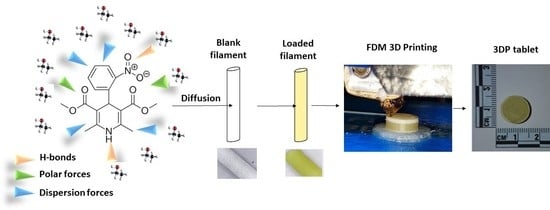
1. Introduction
2. Materials and Methods
2.1. Materials
2.2. Methods
2.2.1. Diffusion Kinetic Studies
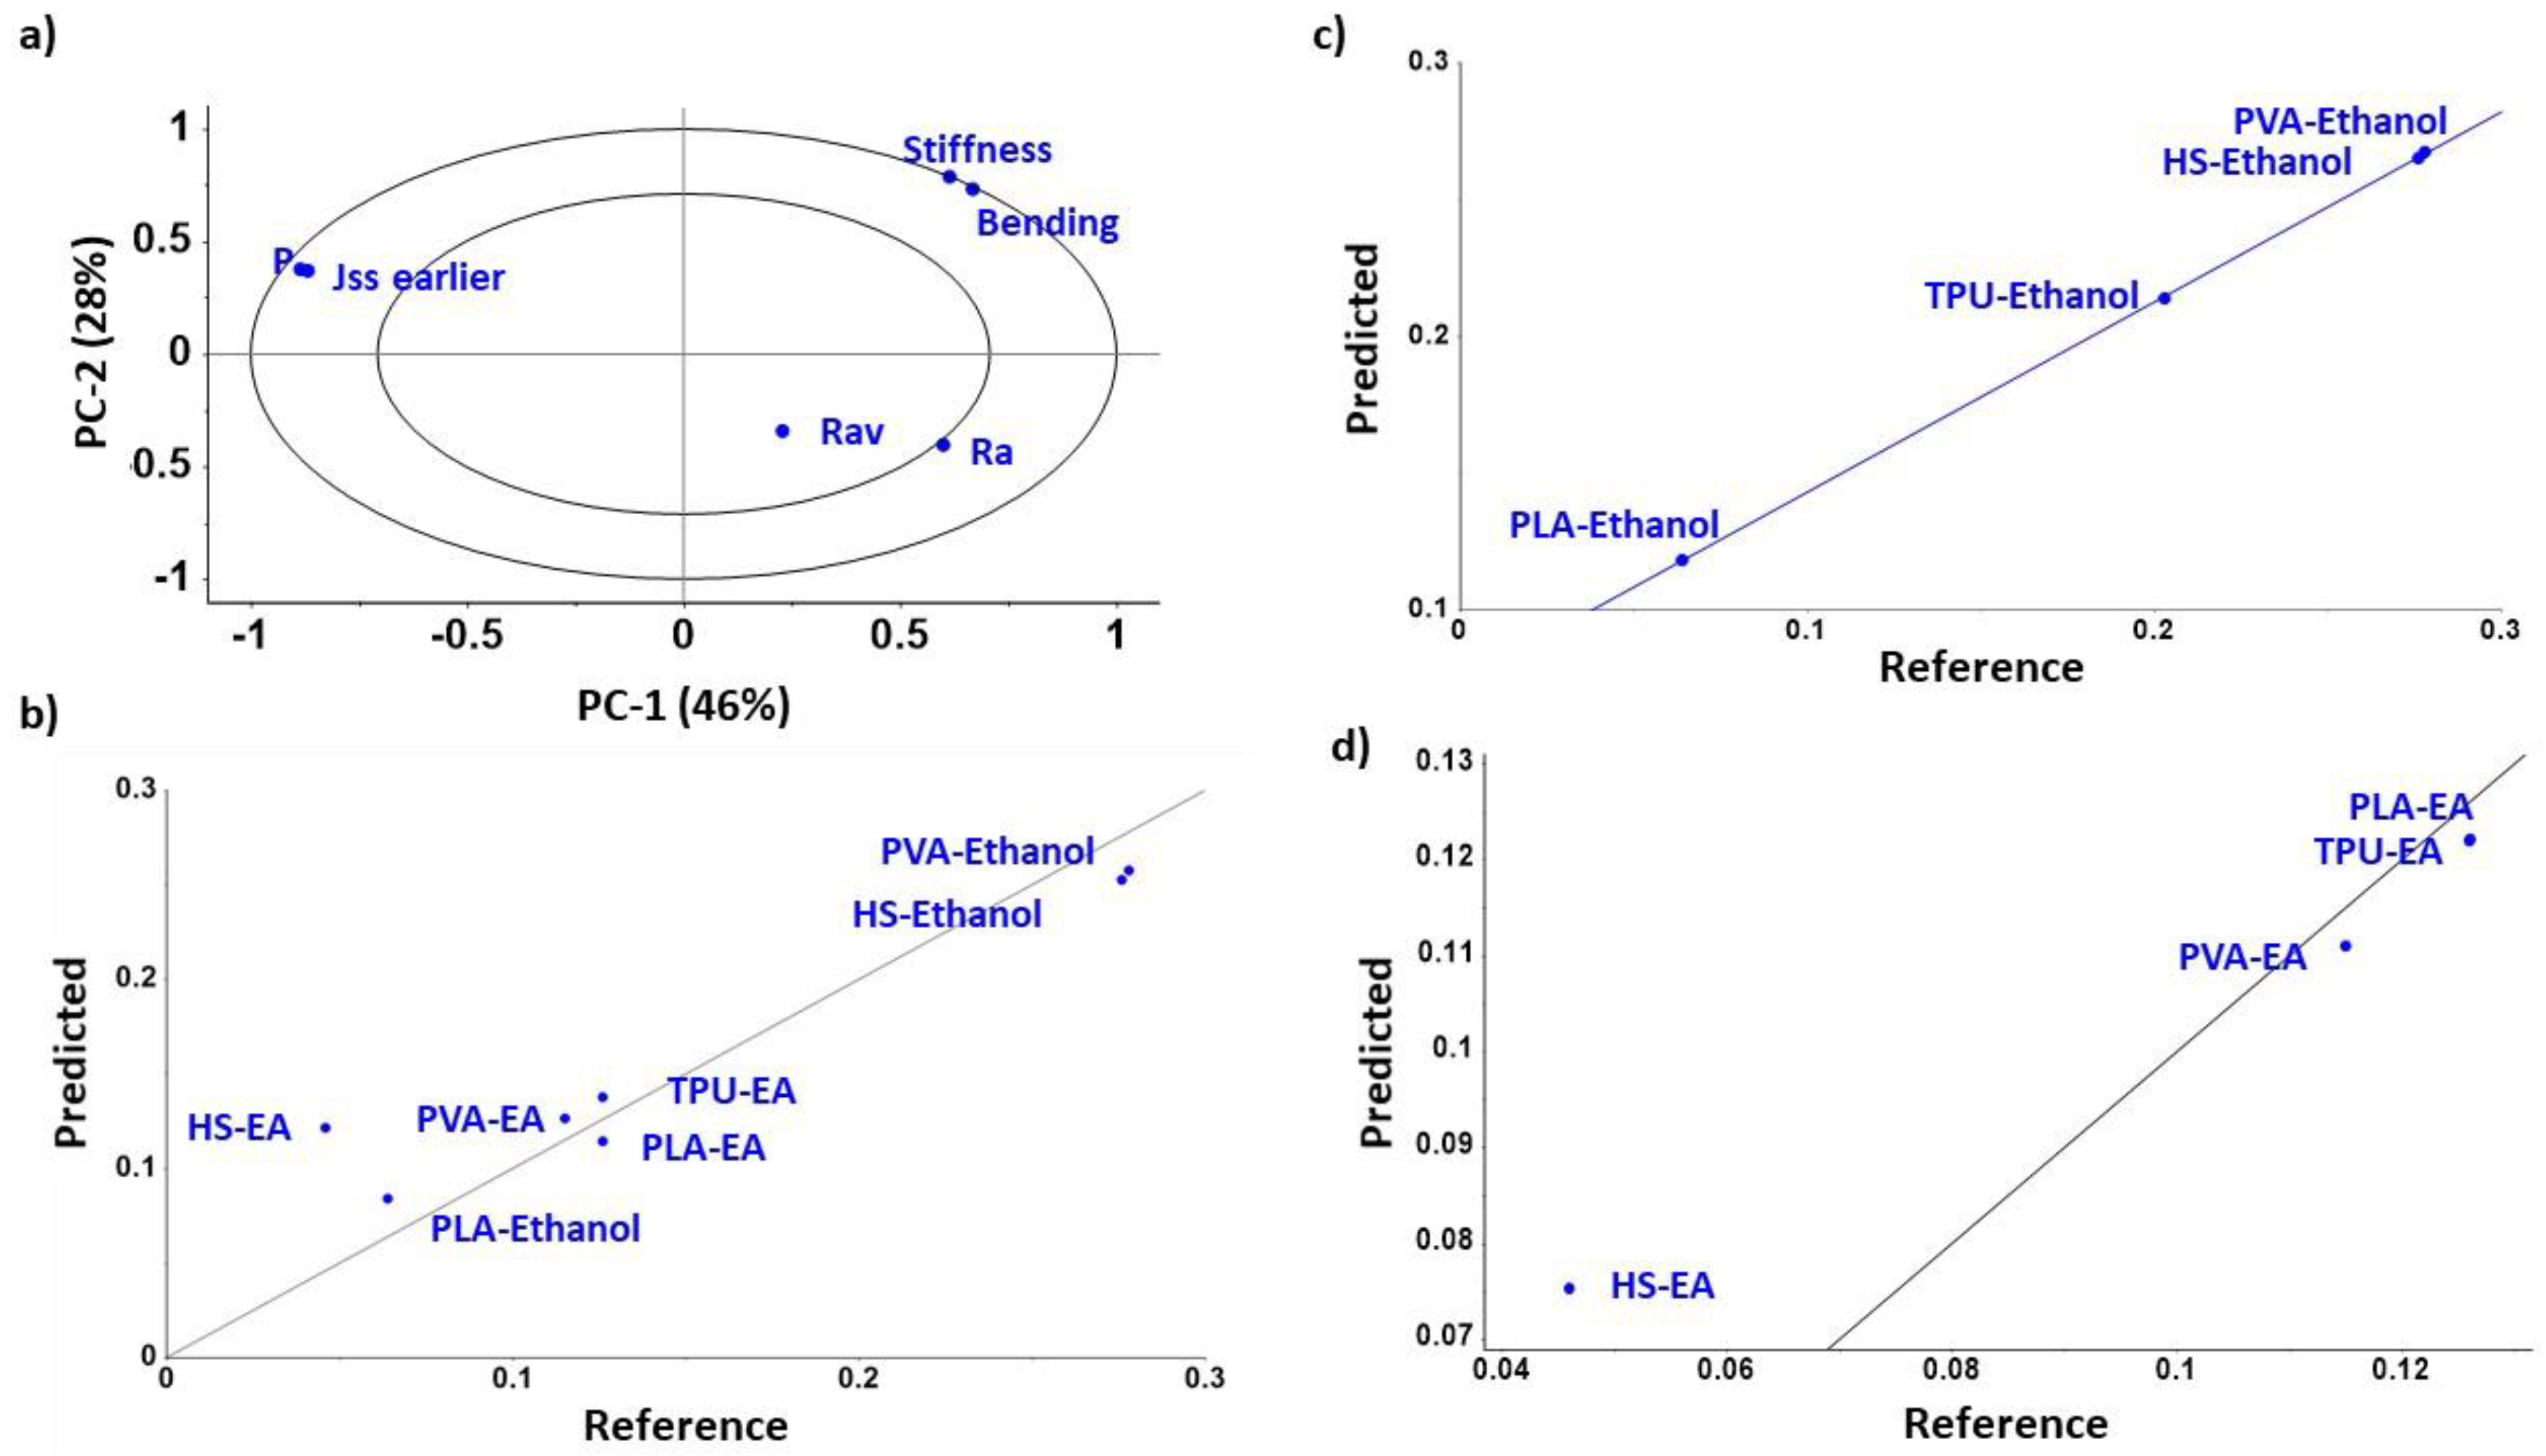
2.2.2. Diffusion Kinetics, Mathematical Modelling
2.2.3. Optimisation of Filament Drug Loading
2.2.4. Tablet Design and 3D Printing
Geometric Design
Slicing and 3D Printing
2.2.5. Physico-Chemical Characterisation of Filaments and Tablets
Imaging
Surface Roughness
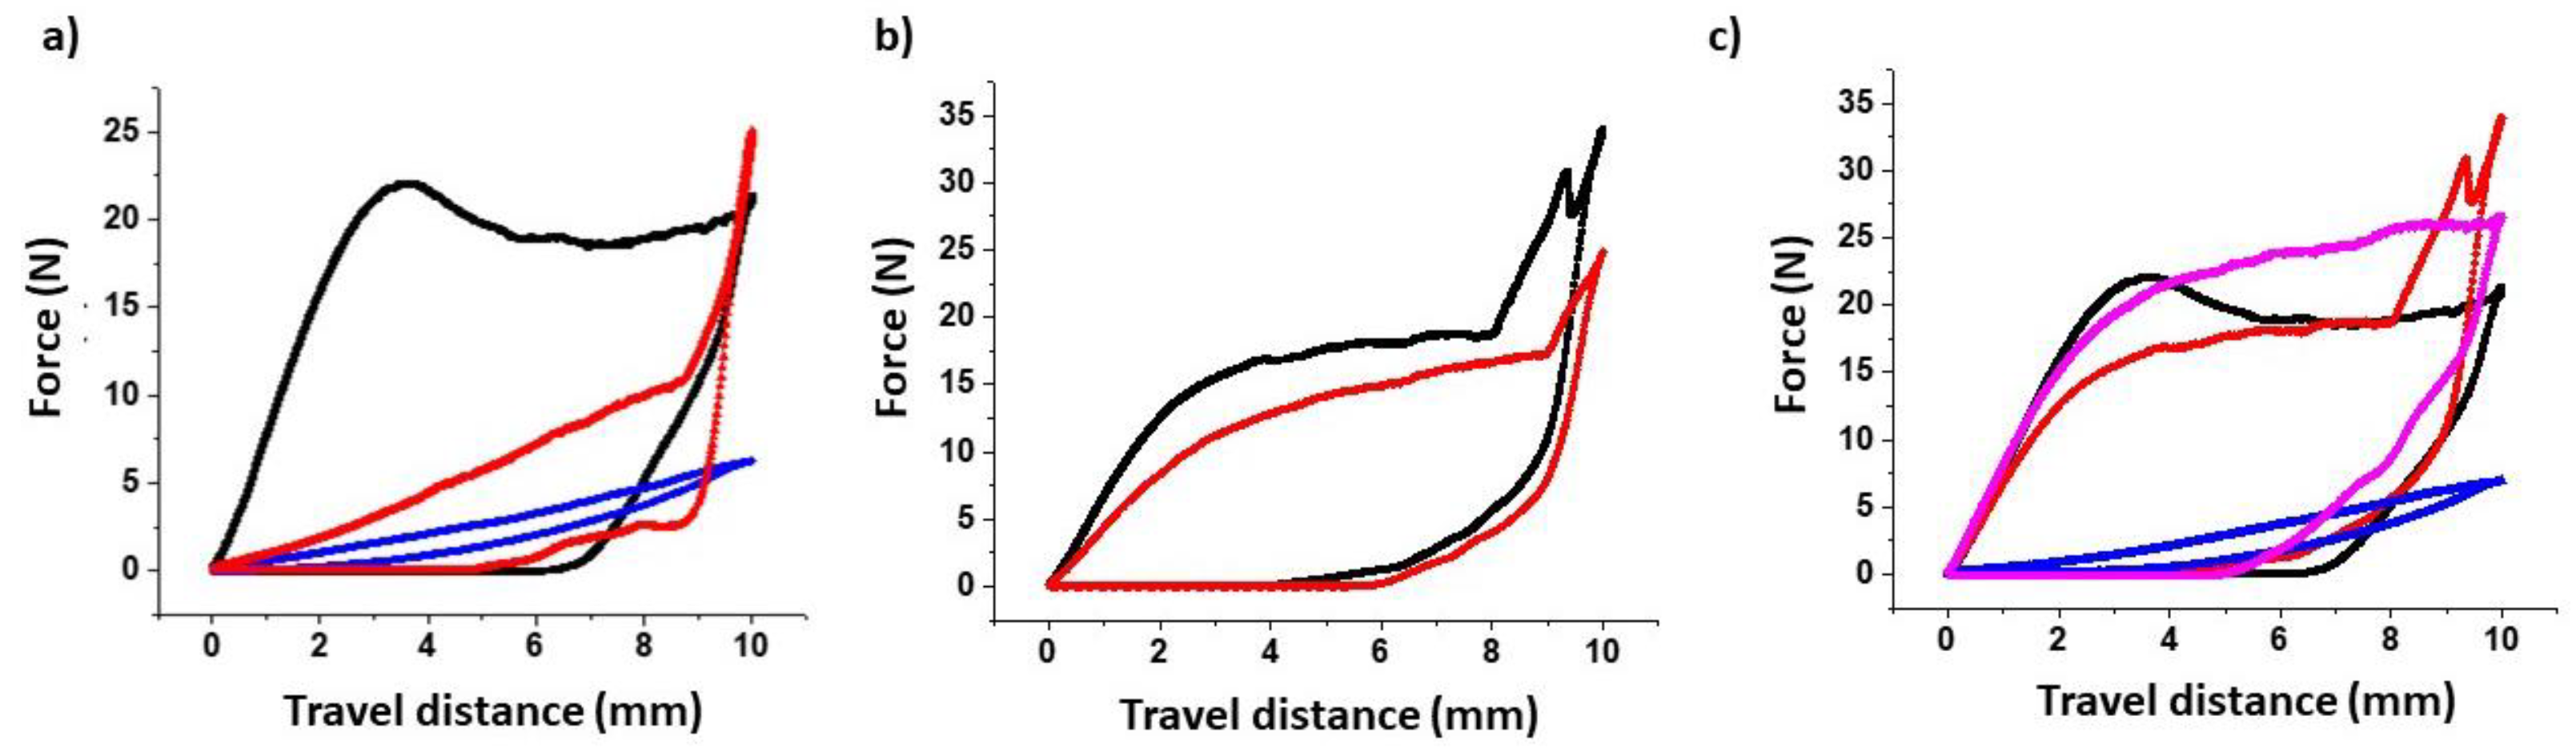
Flexural Strength and Filament Toughness
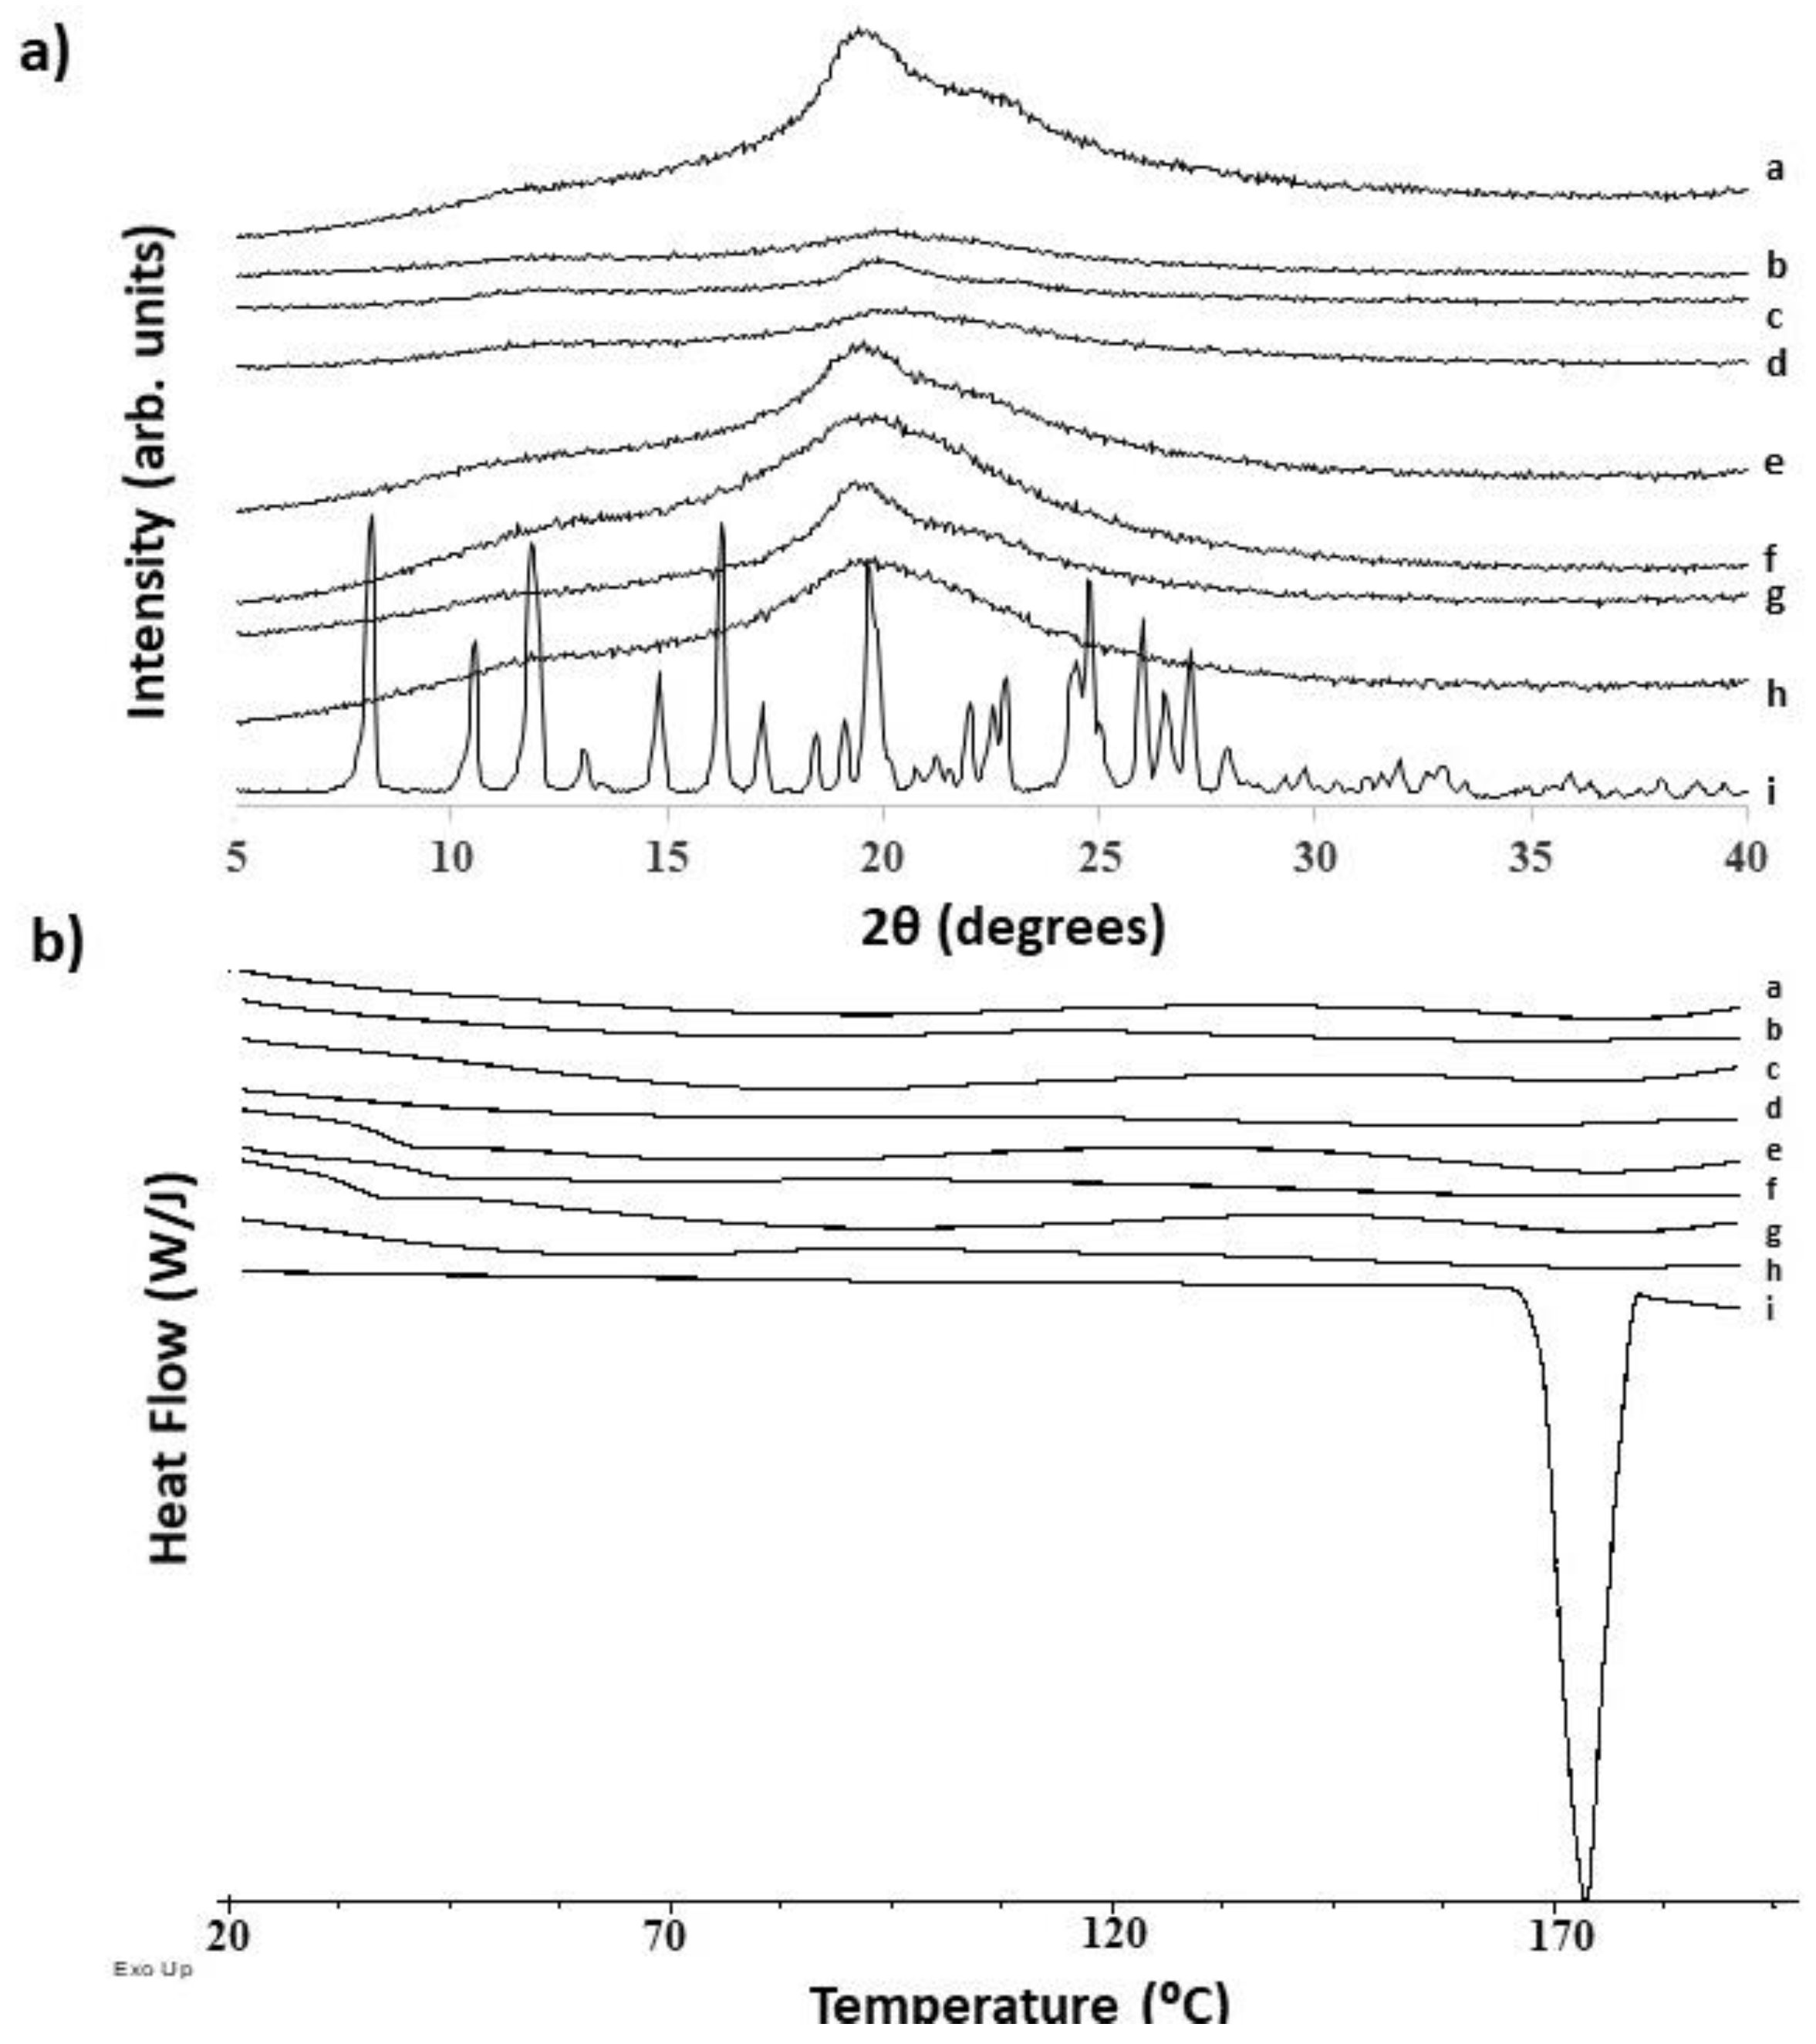
Powder X Ray Diffraction (PRXD)
Modulated Temperature DSC (MTDSC)
Thermogravimetric Analysis (TGA)
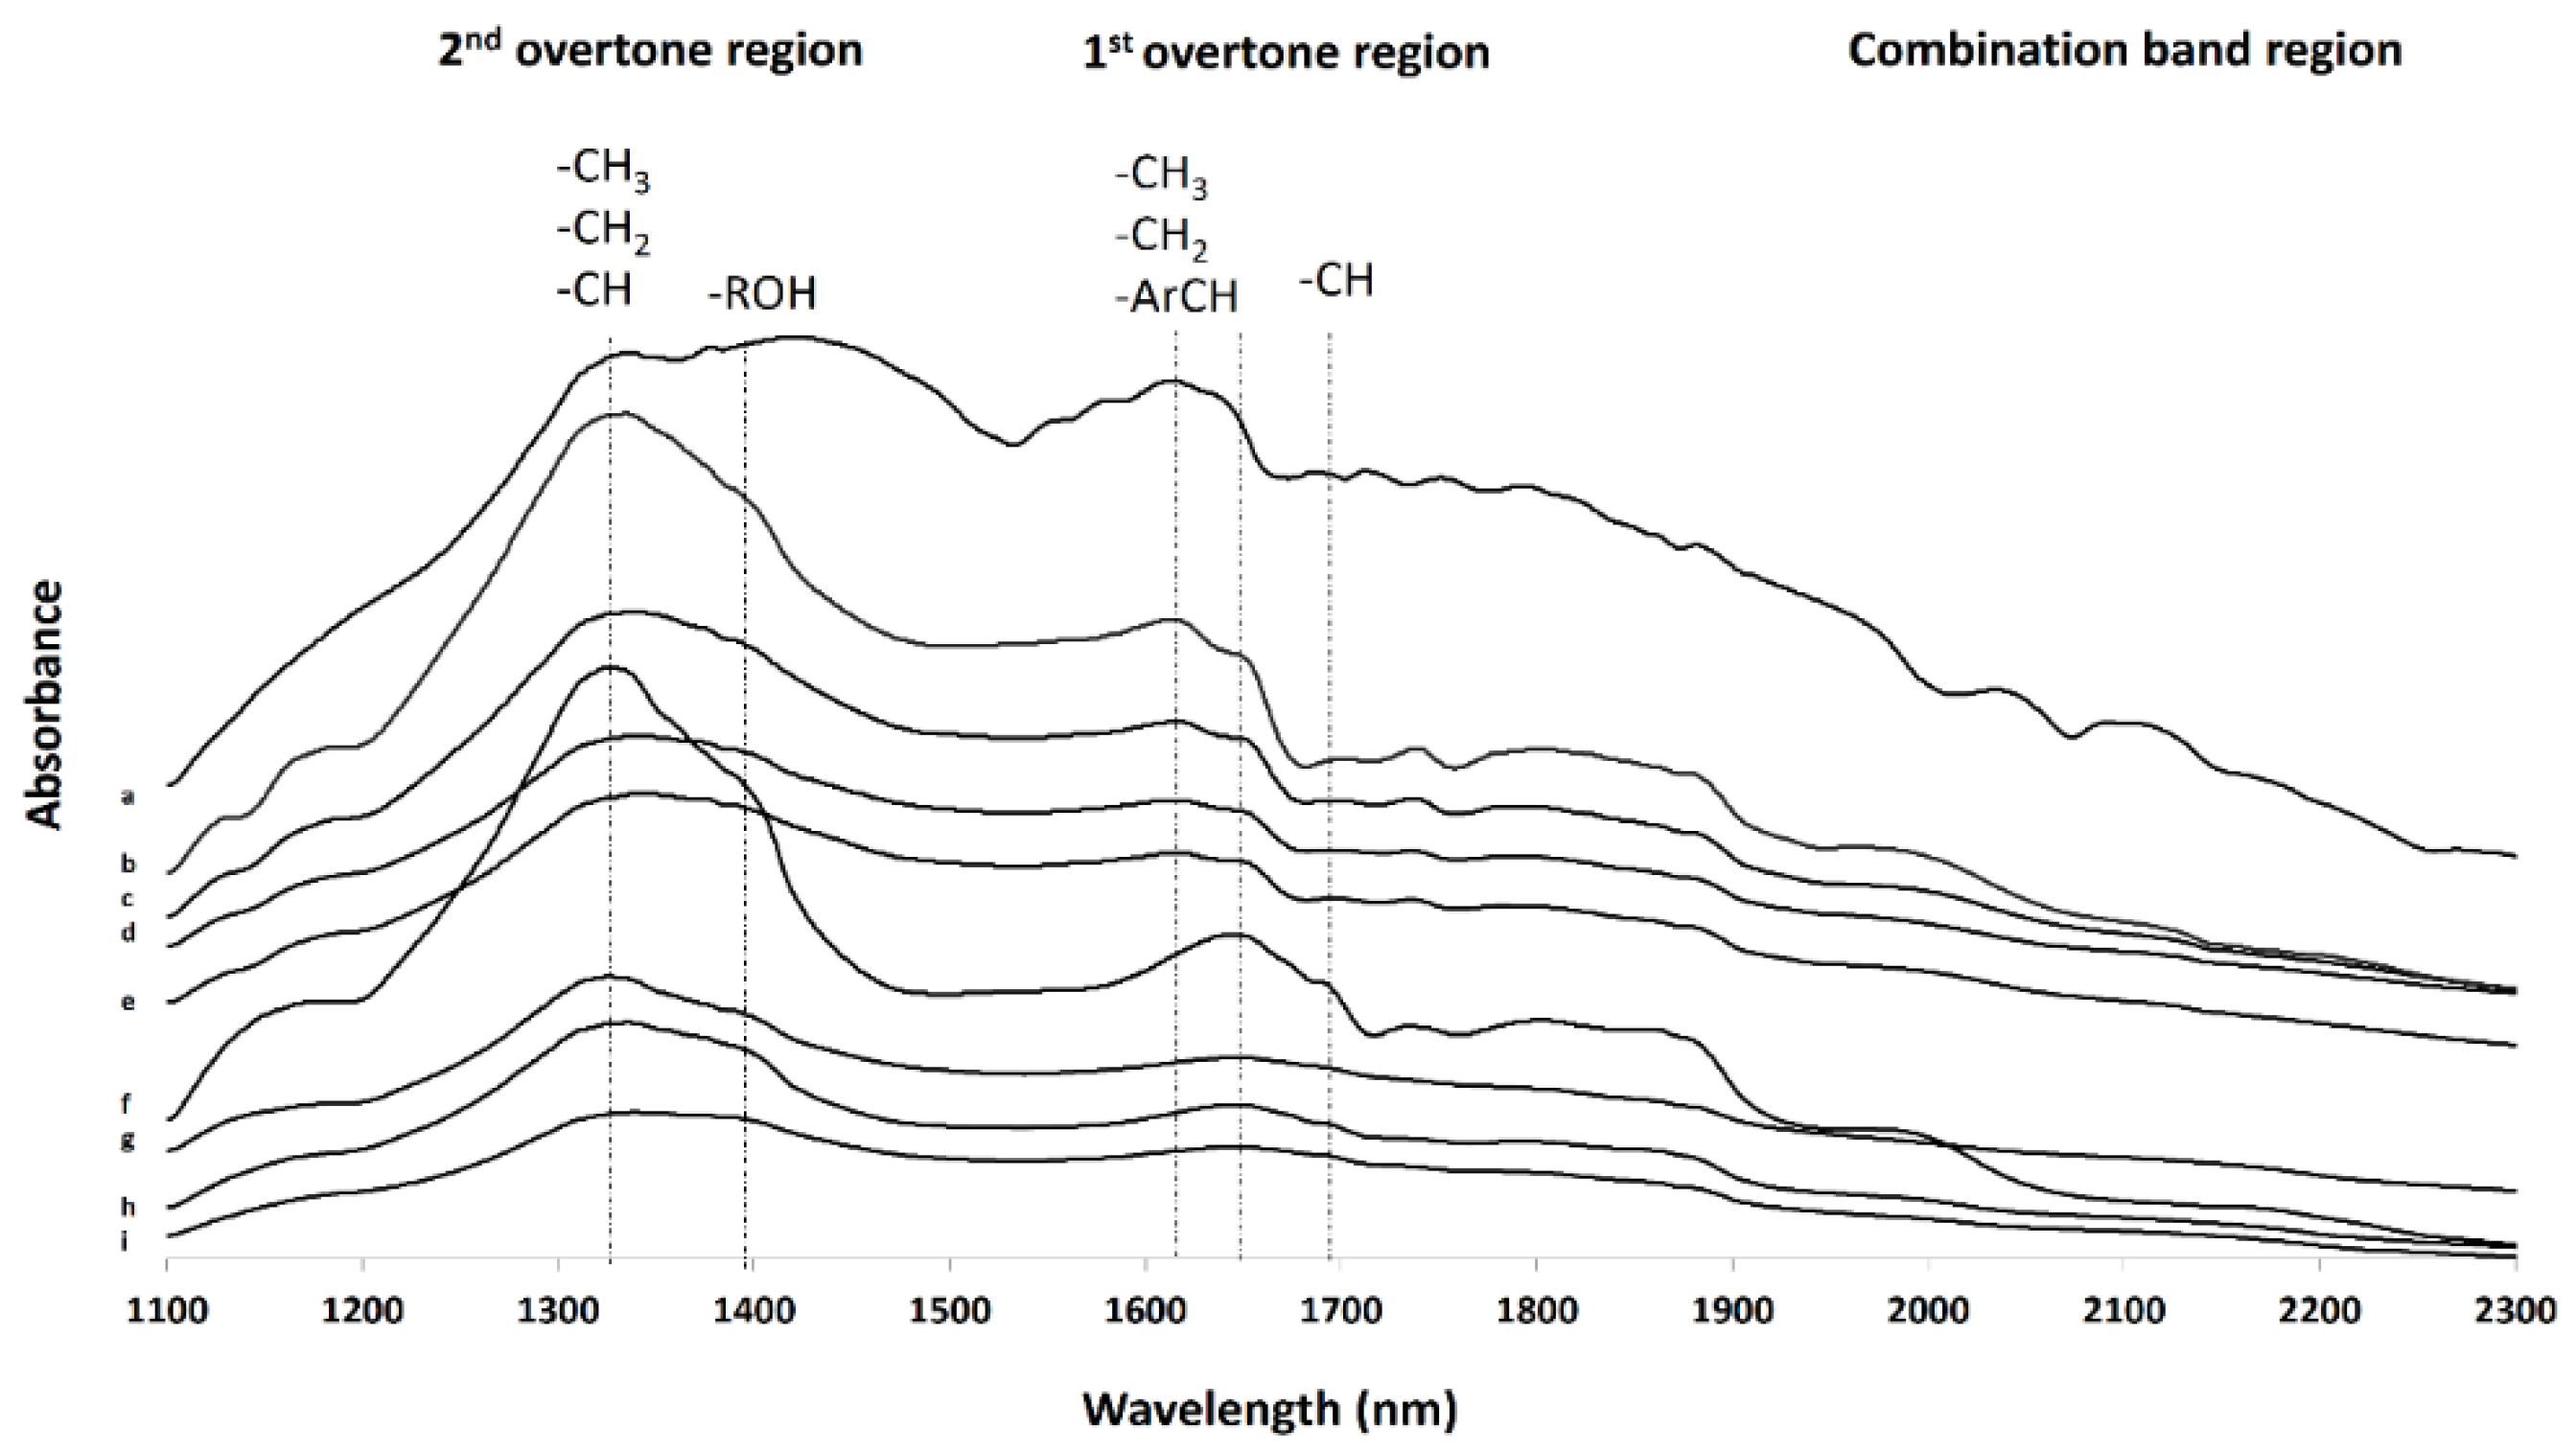
Near-Infrared (NIR) Spectroscopy
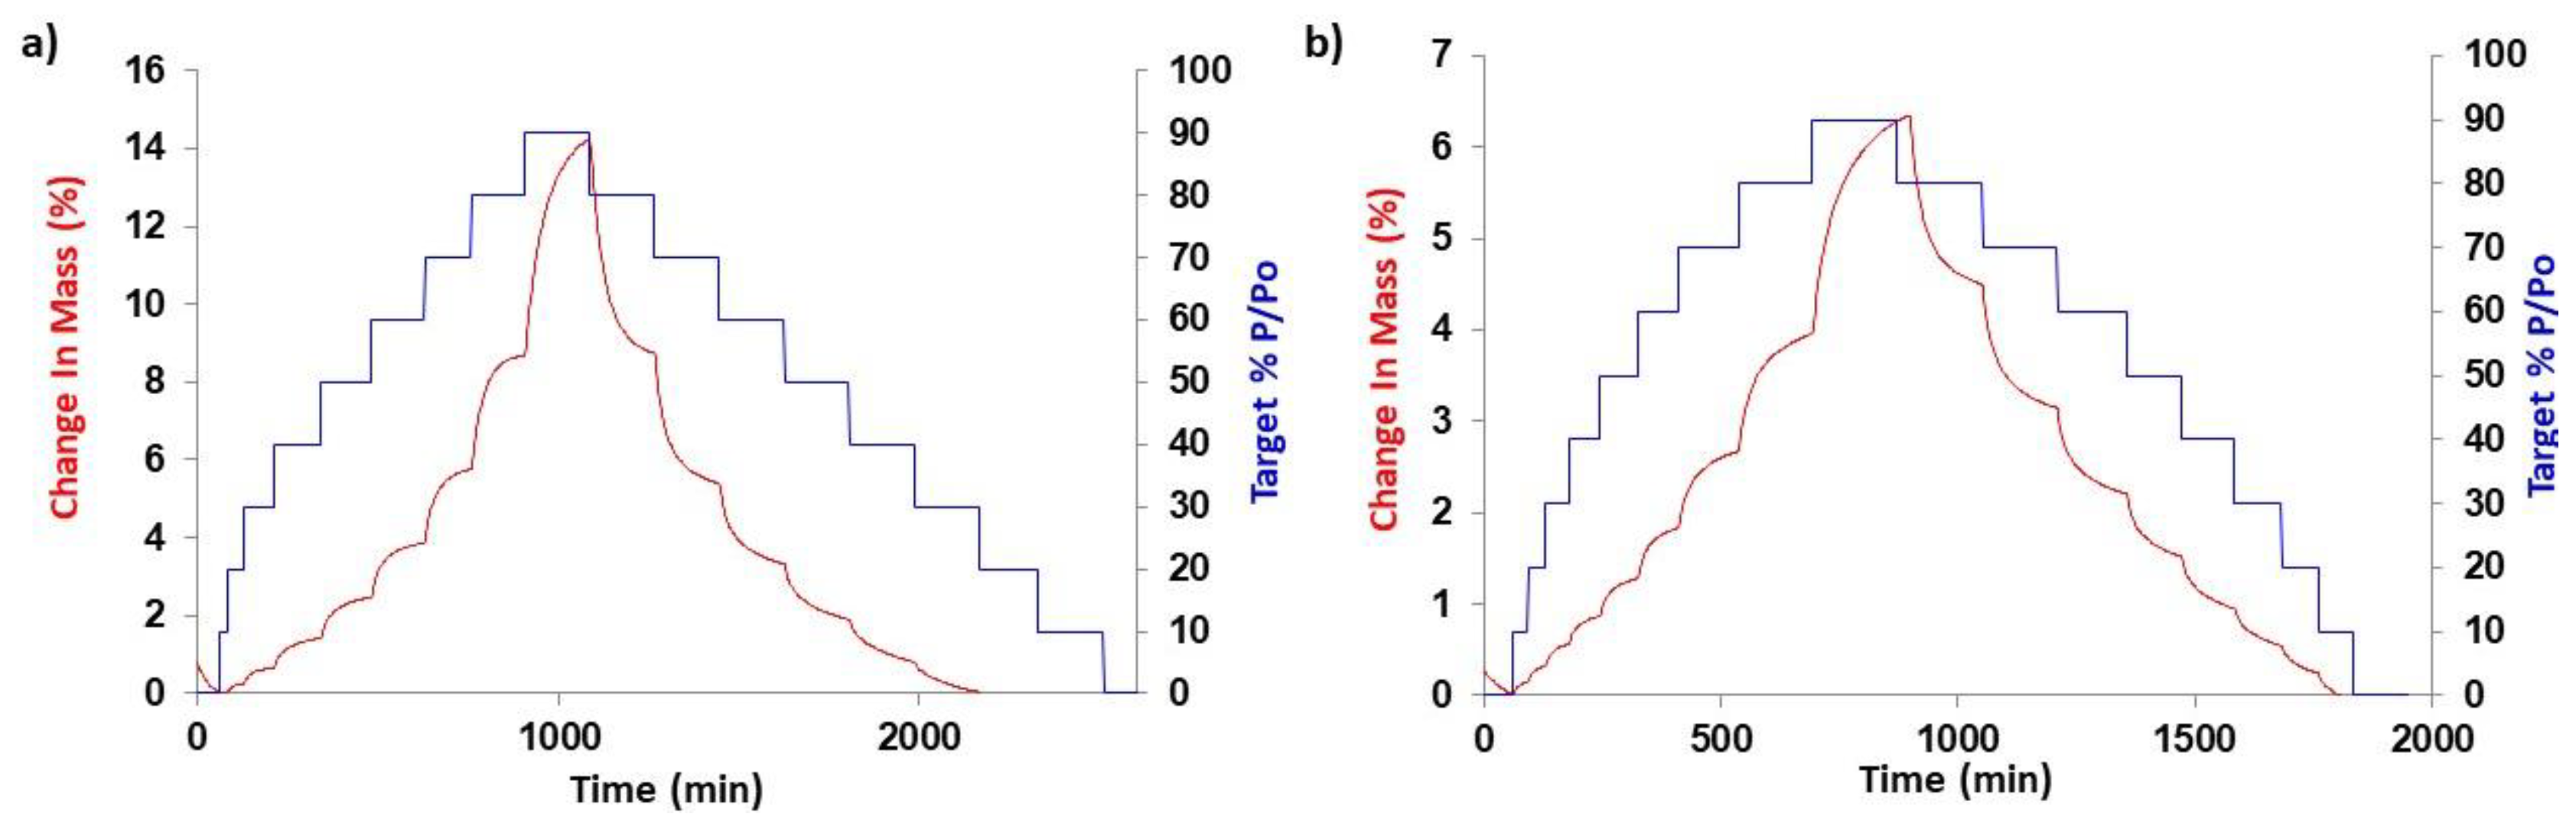
Dynamic Vapour Sorption (DVS)
Friability and Hardness
Uniformity of Content and HPLC Analysis
2.2.6. Dissolution Studies
Mechanistic Mathematical Models
2.2.7. Accelerated Stability Studies
2.2.8. Statistical Analysis
3. Results
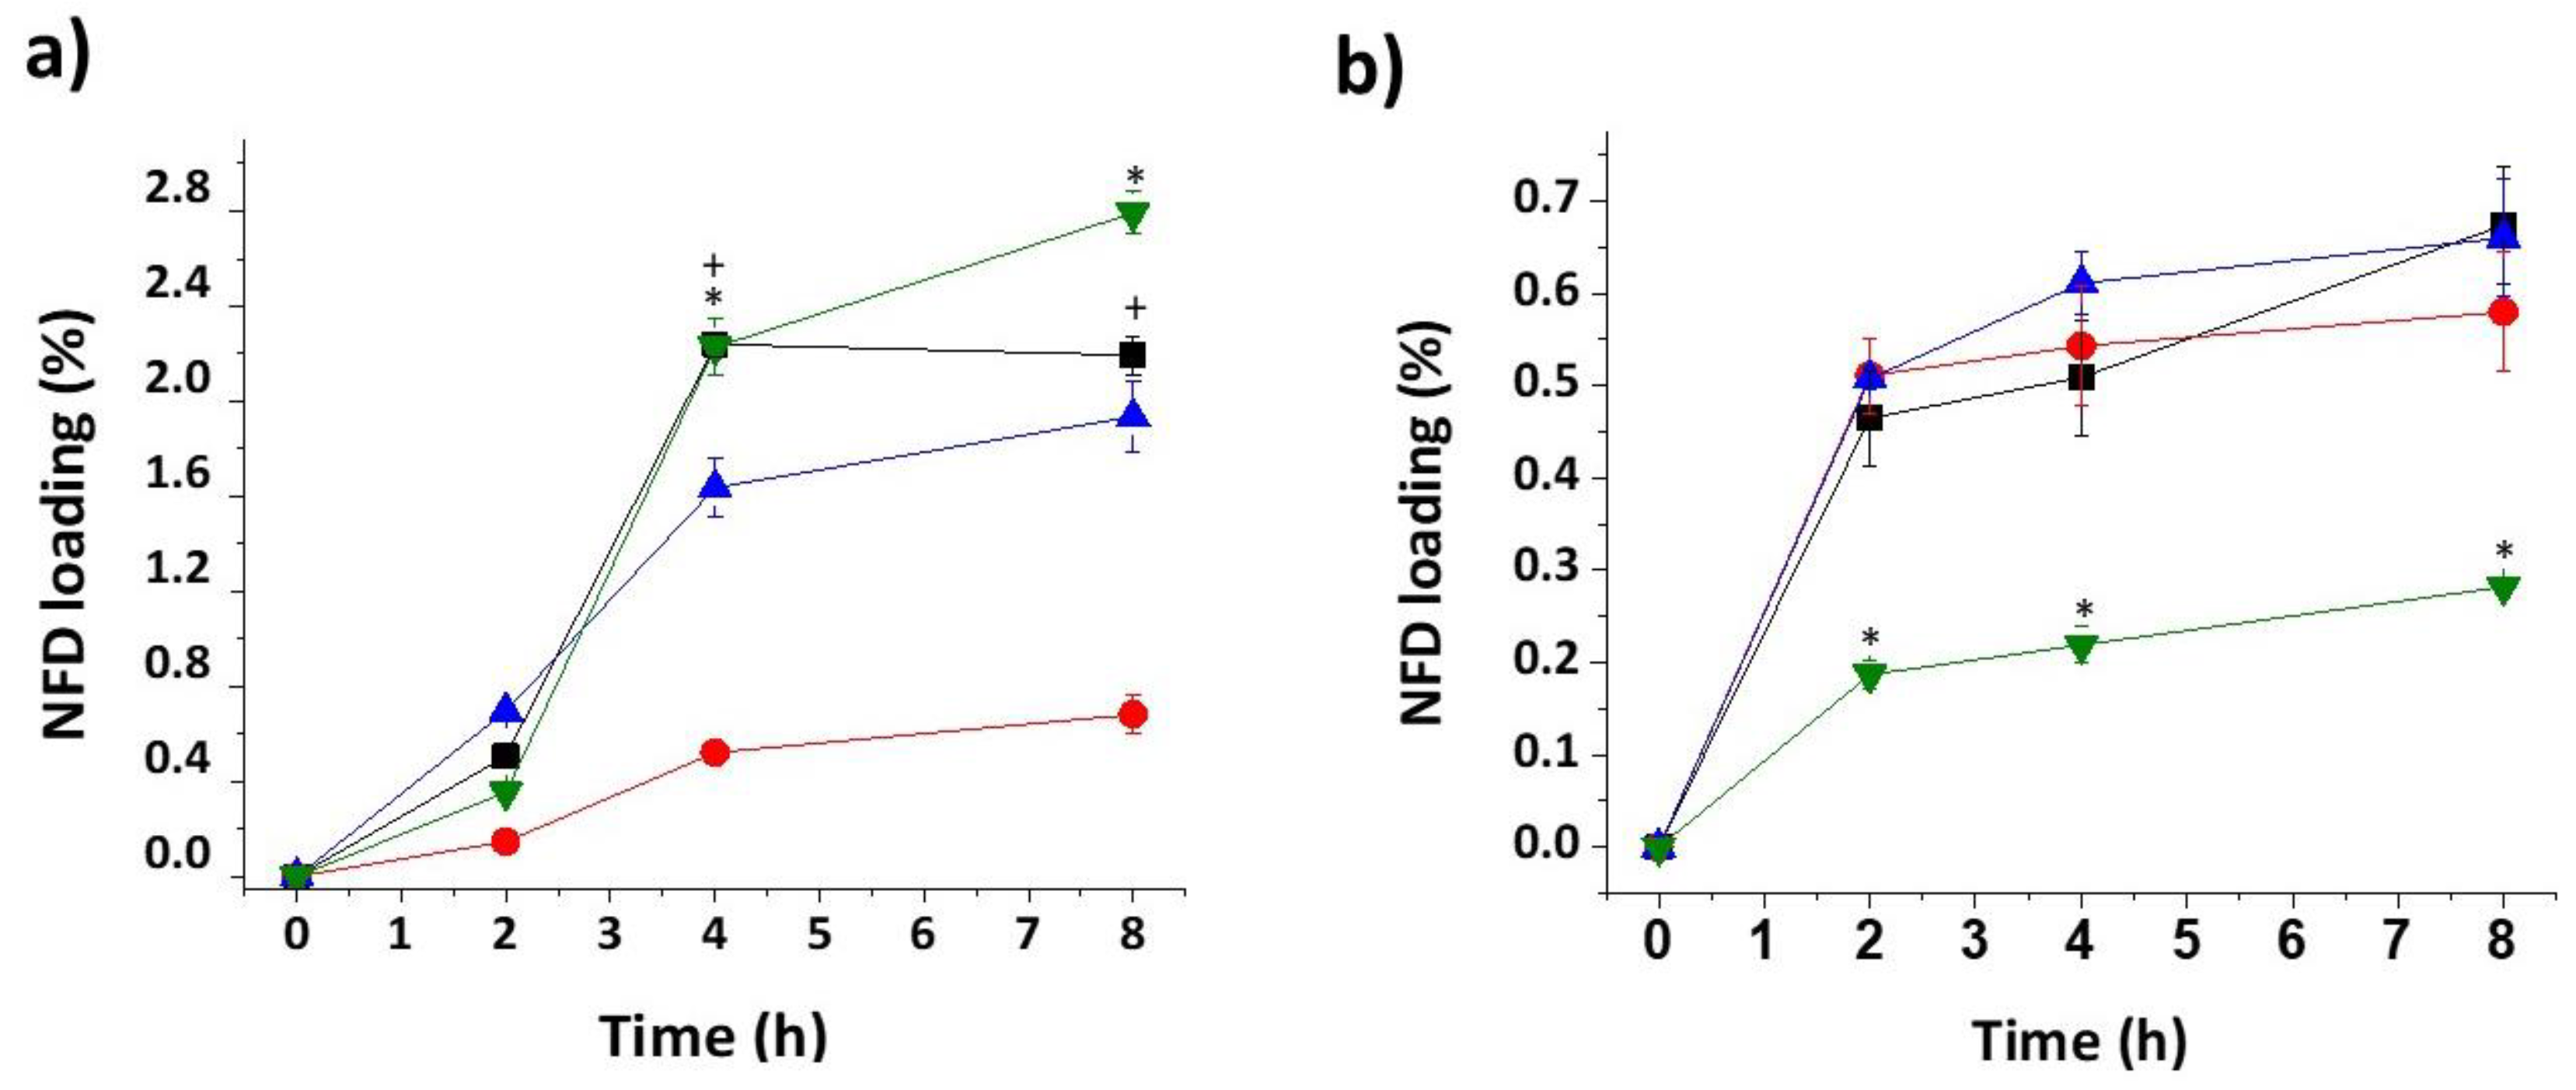
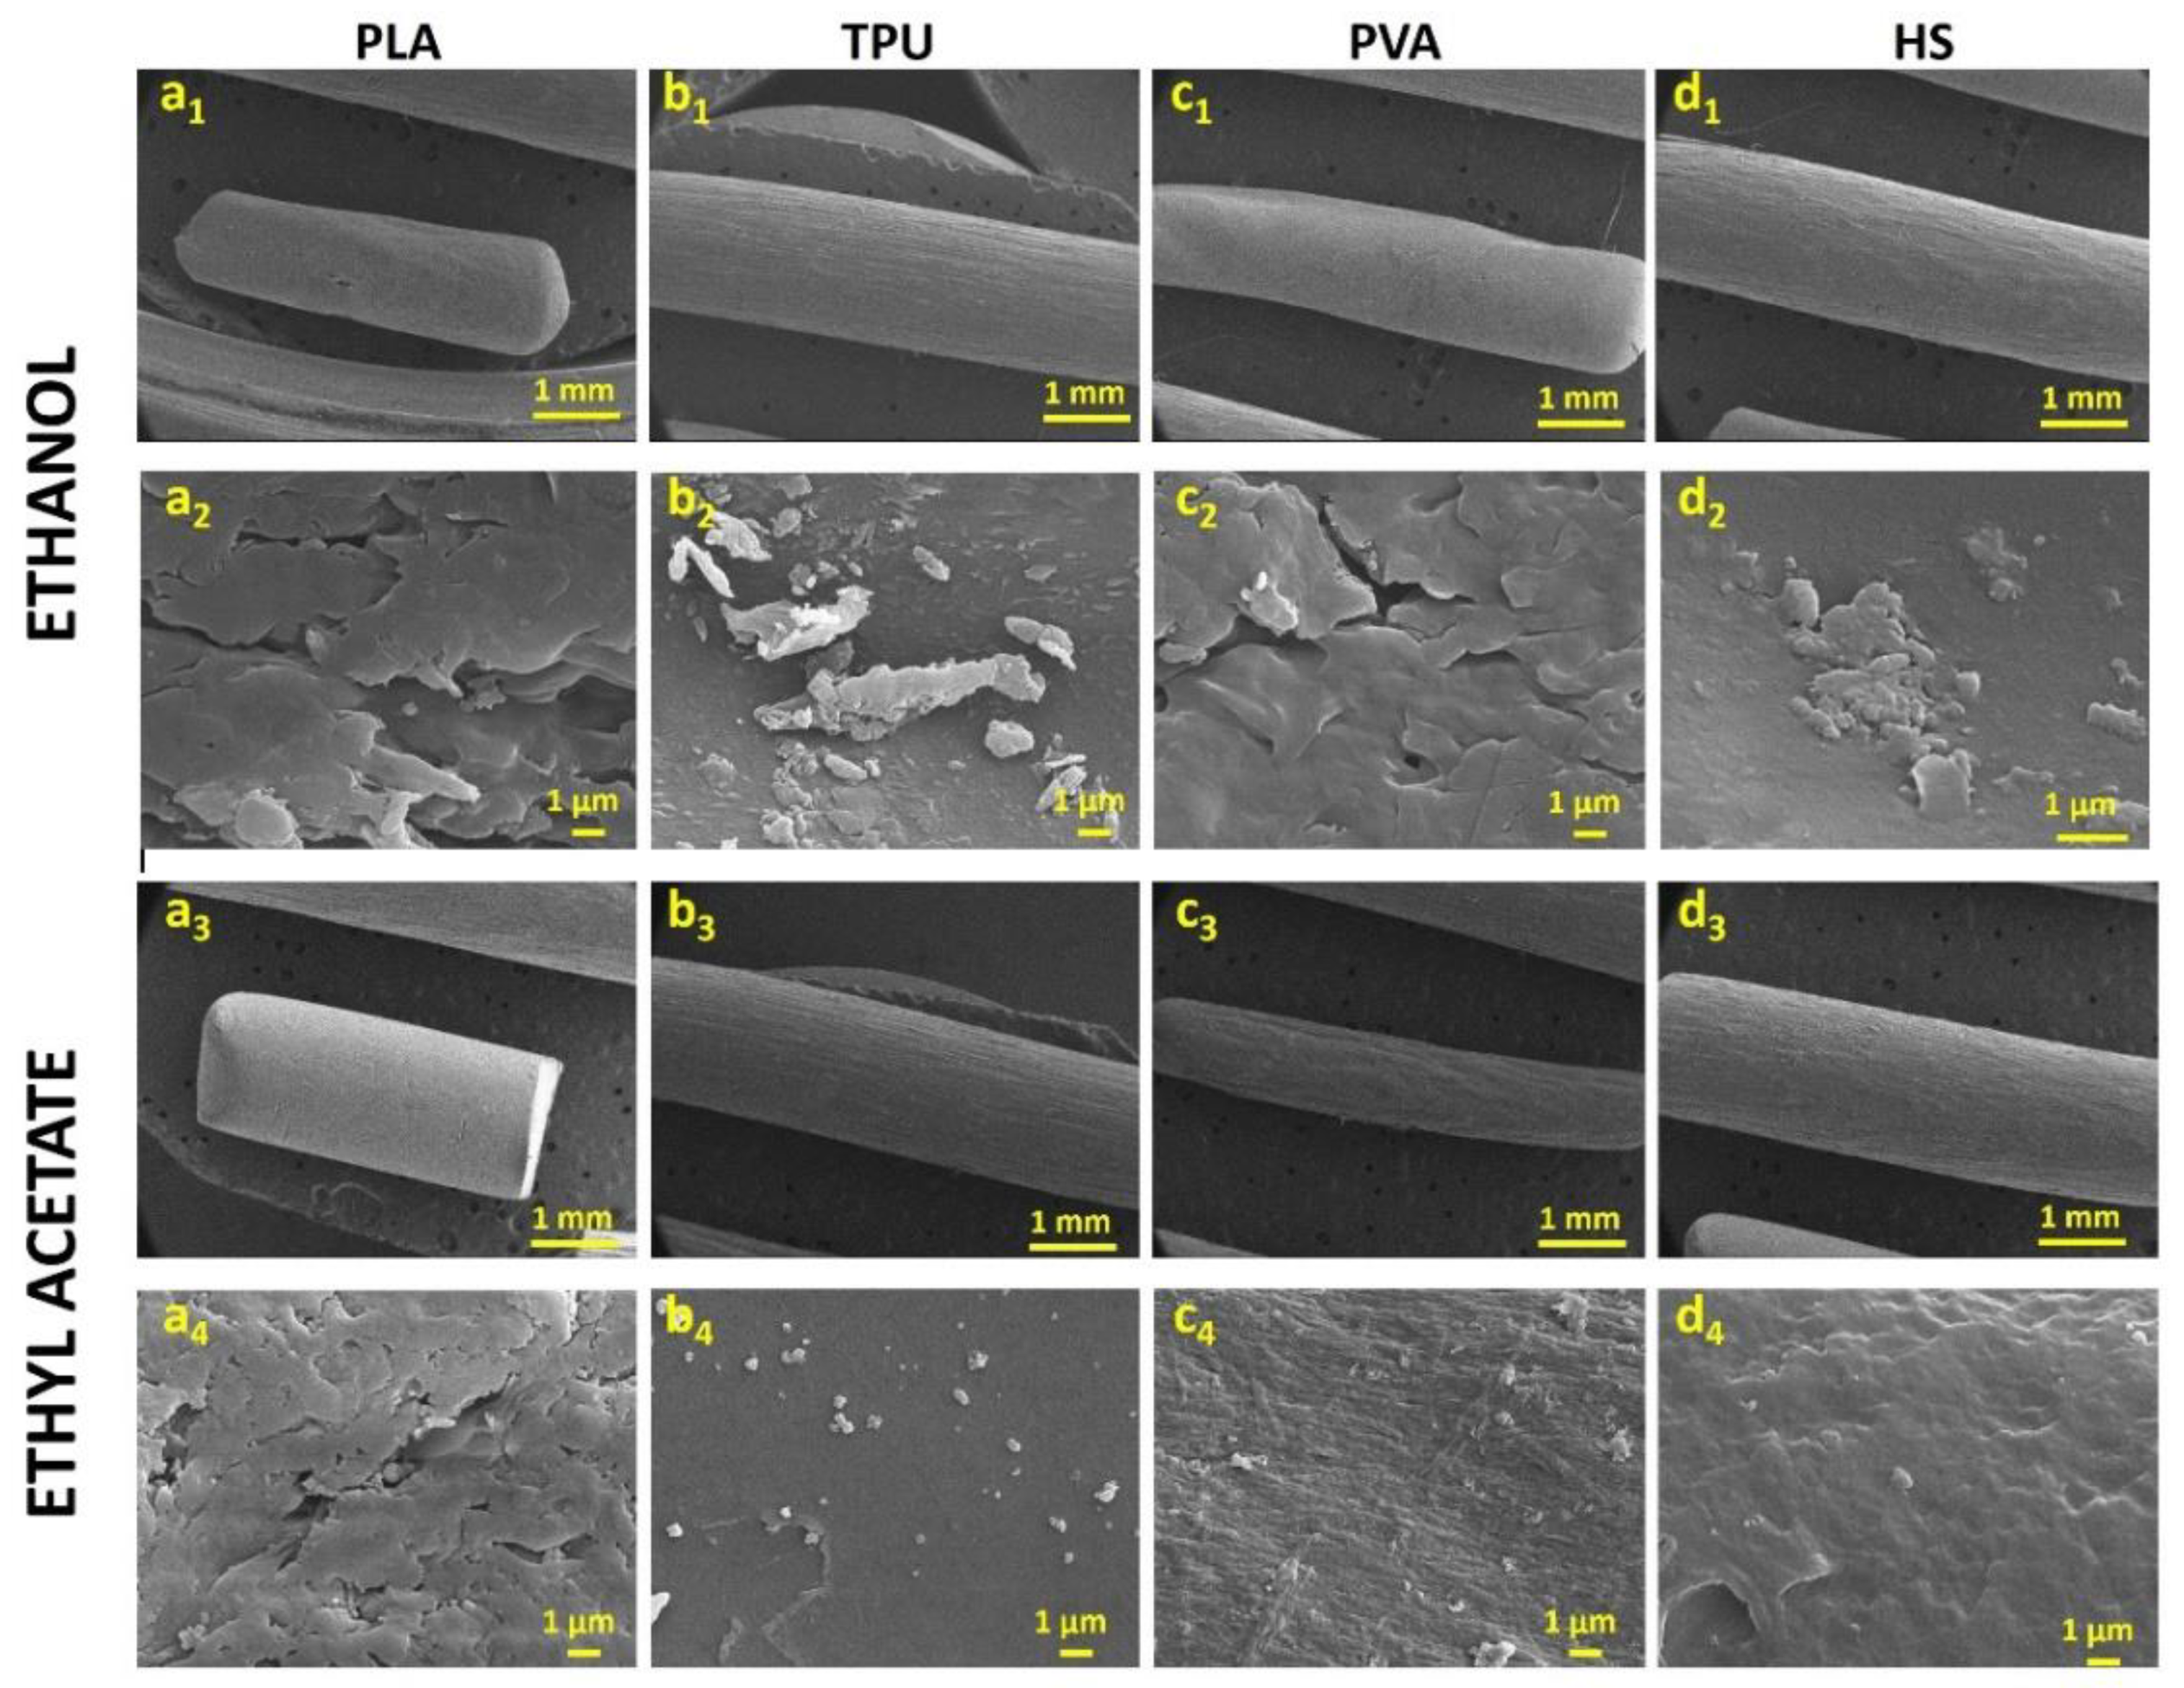
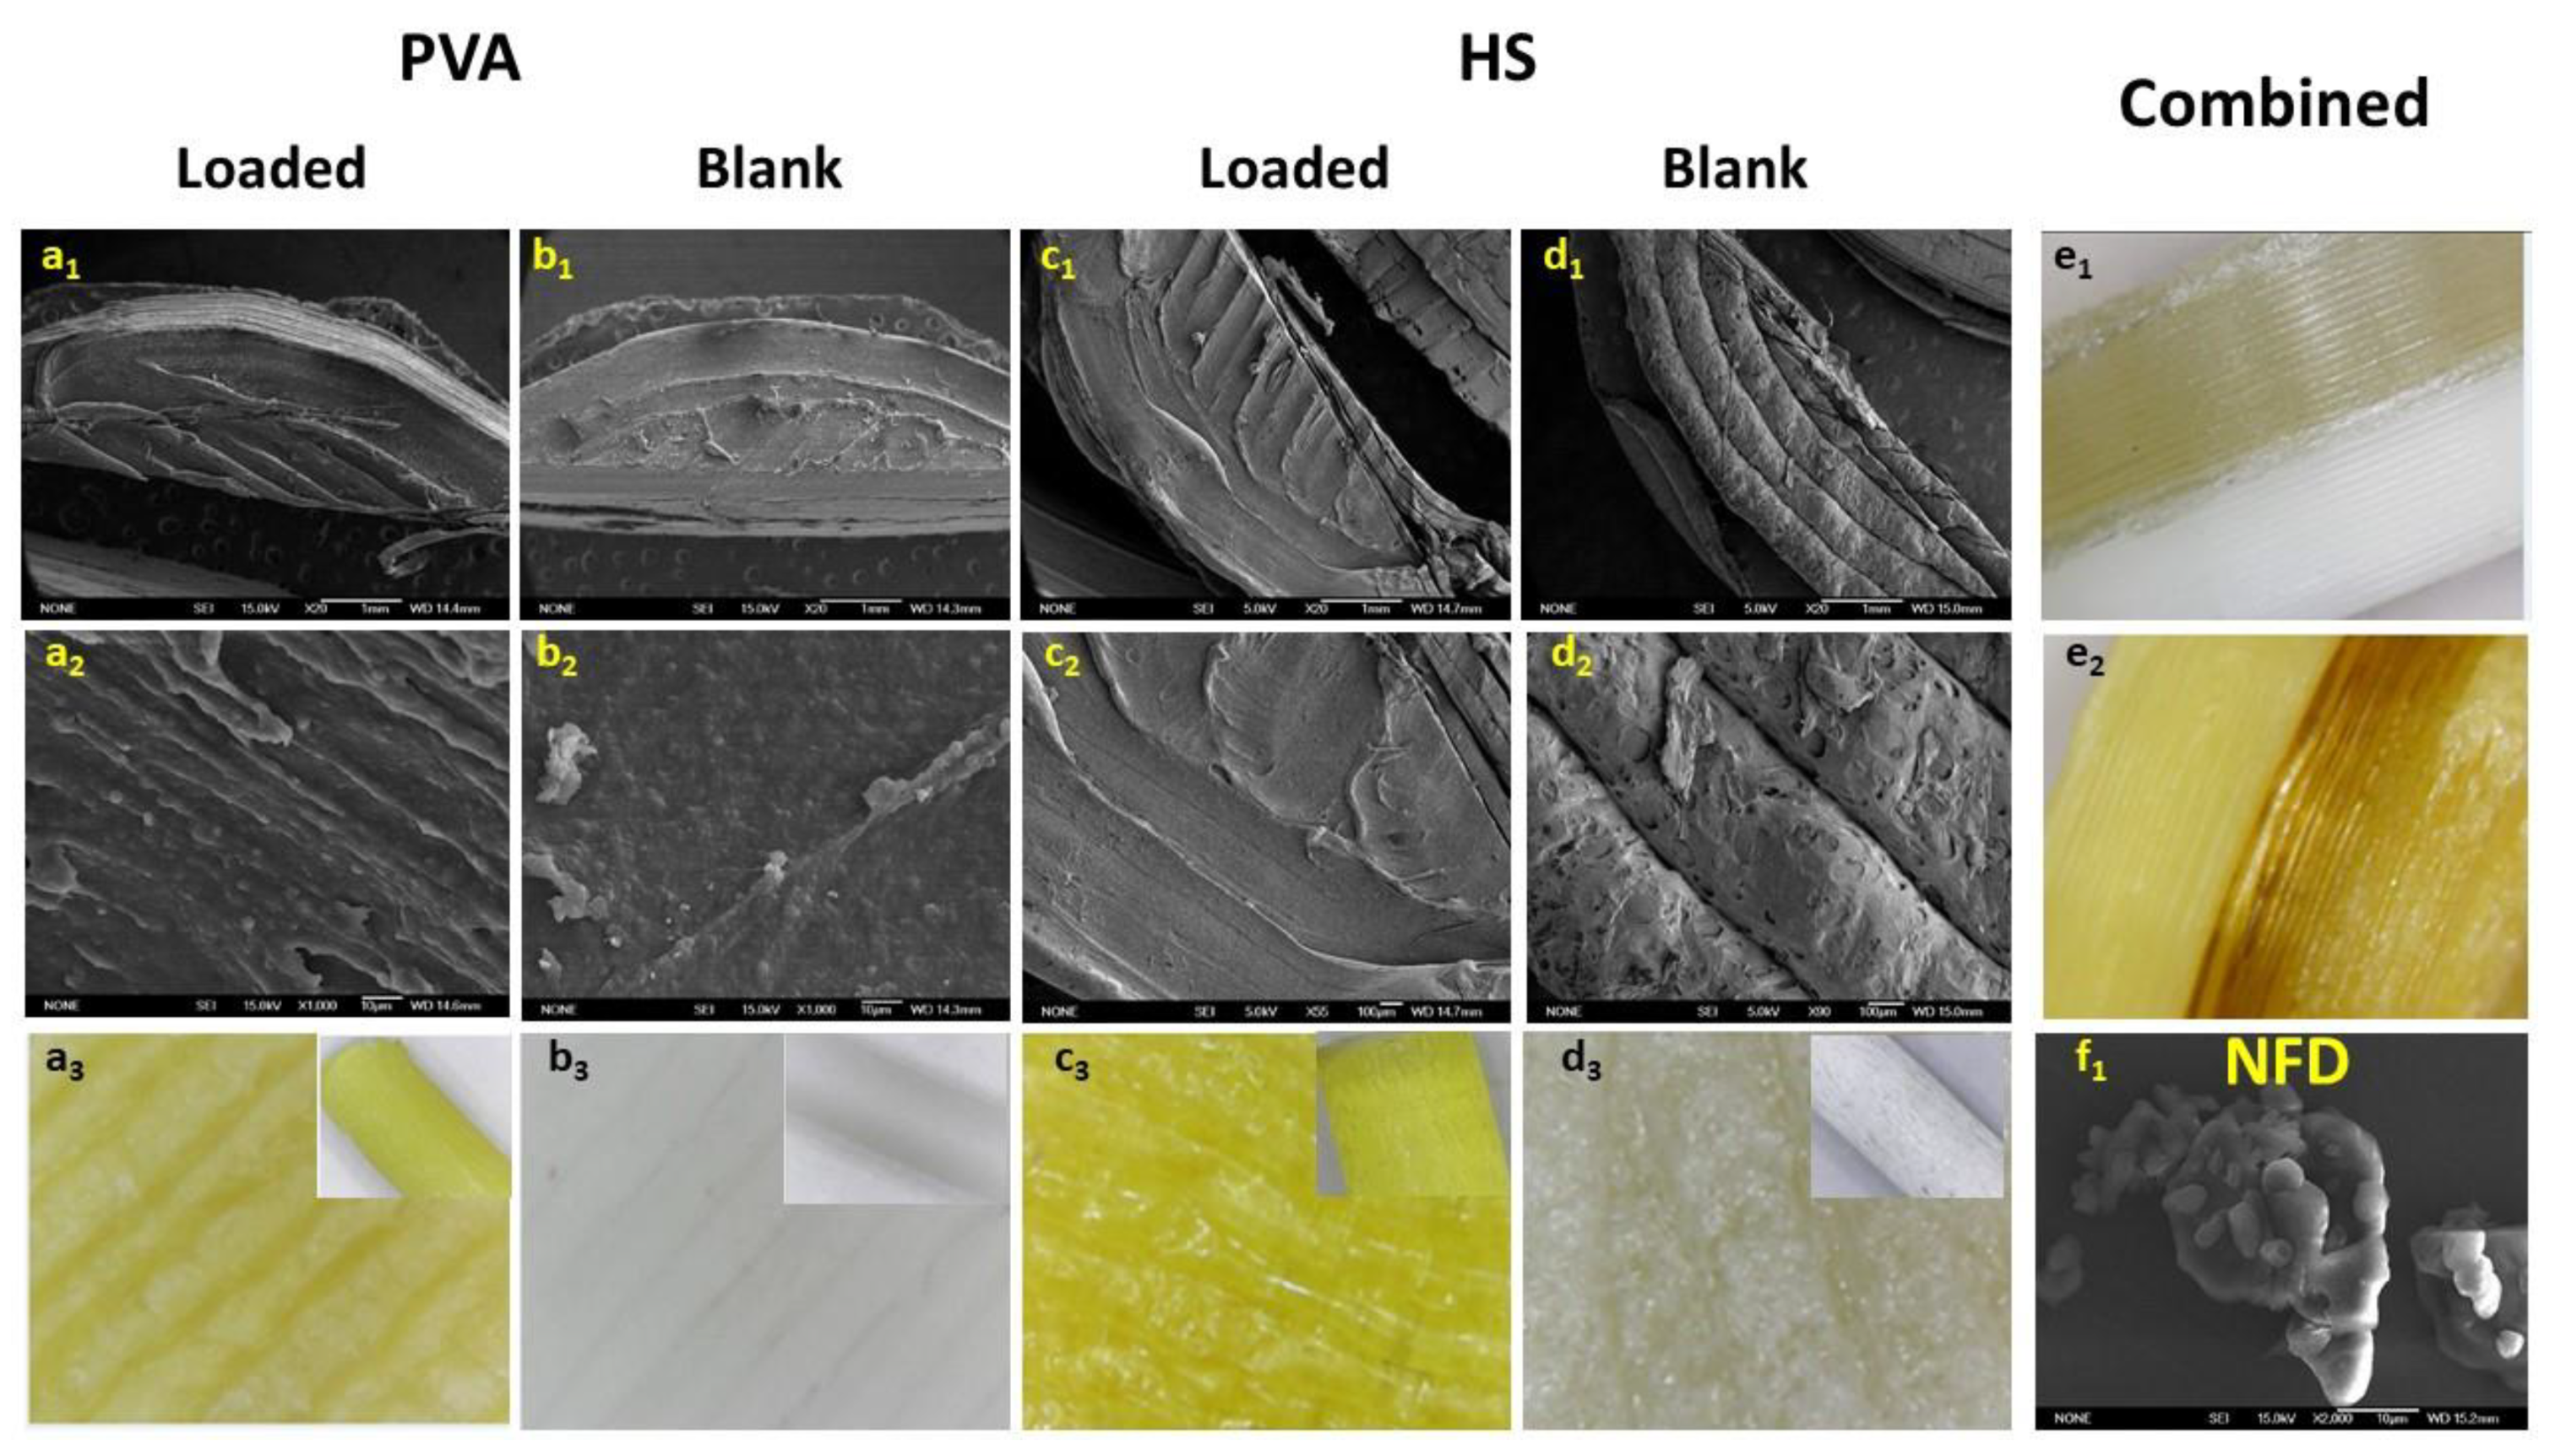
3.1. Diffusion Kinetic Studies and Physicochemical Characterisation
3.2. Further Physicochemical Characterisation
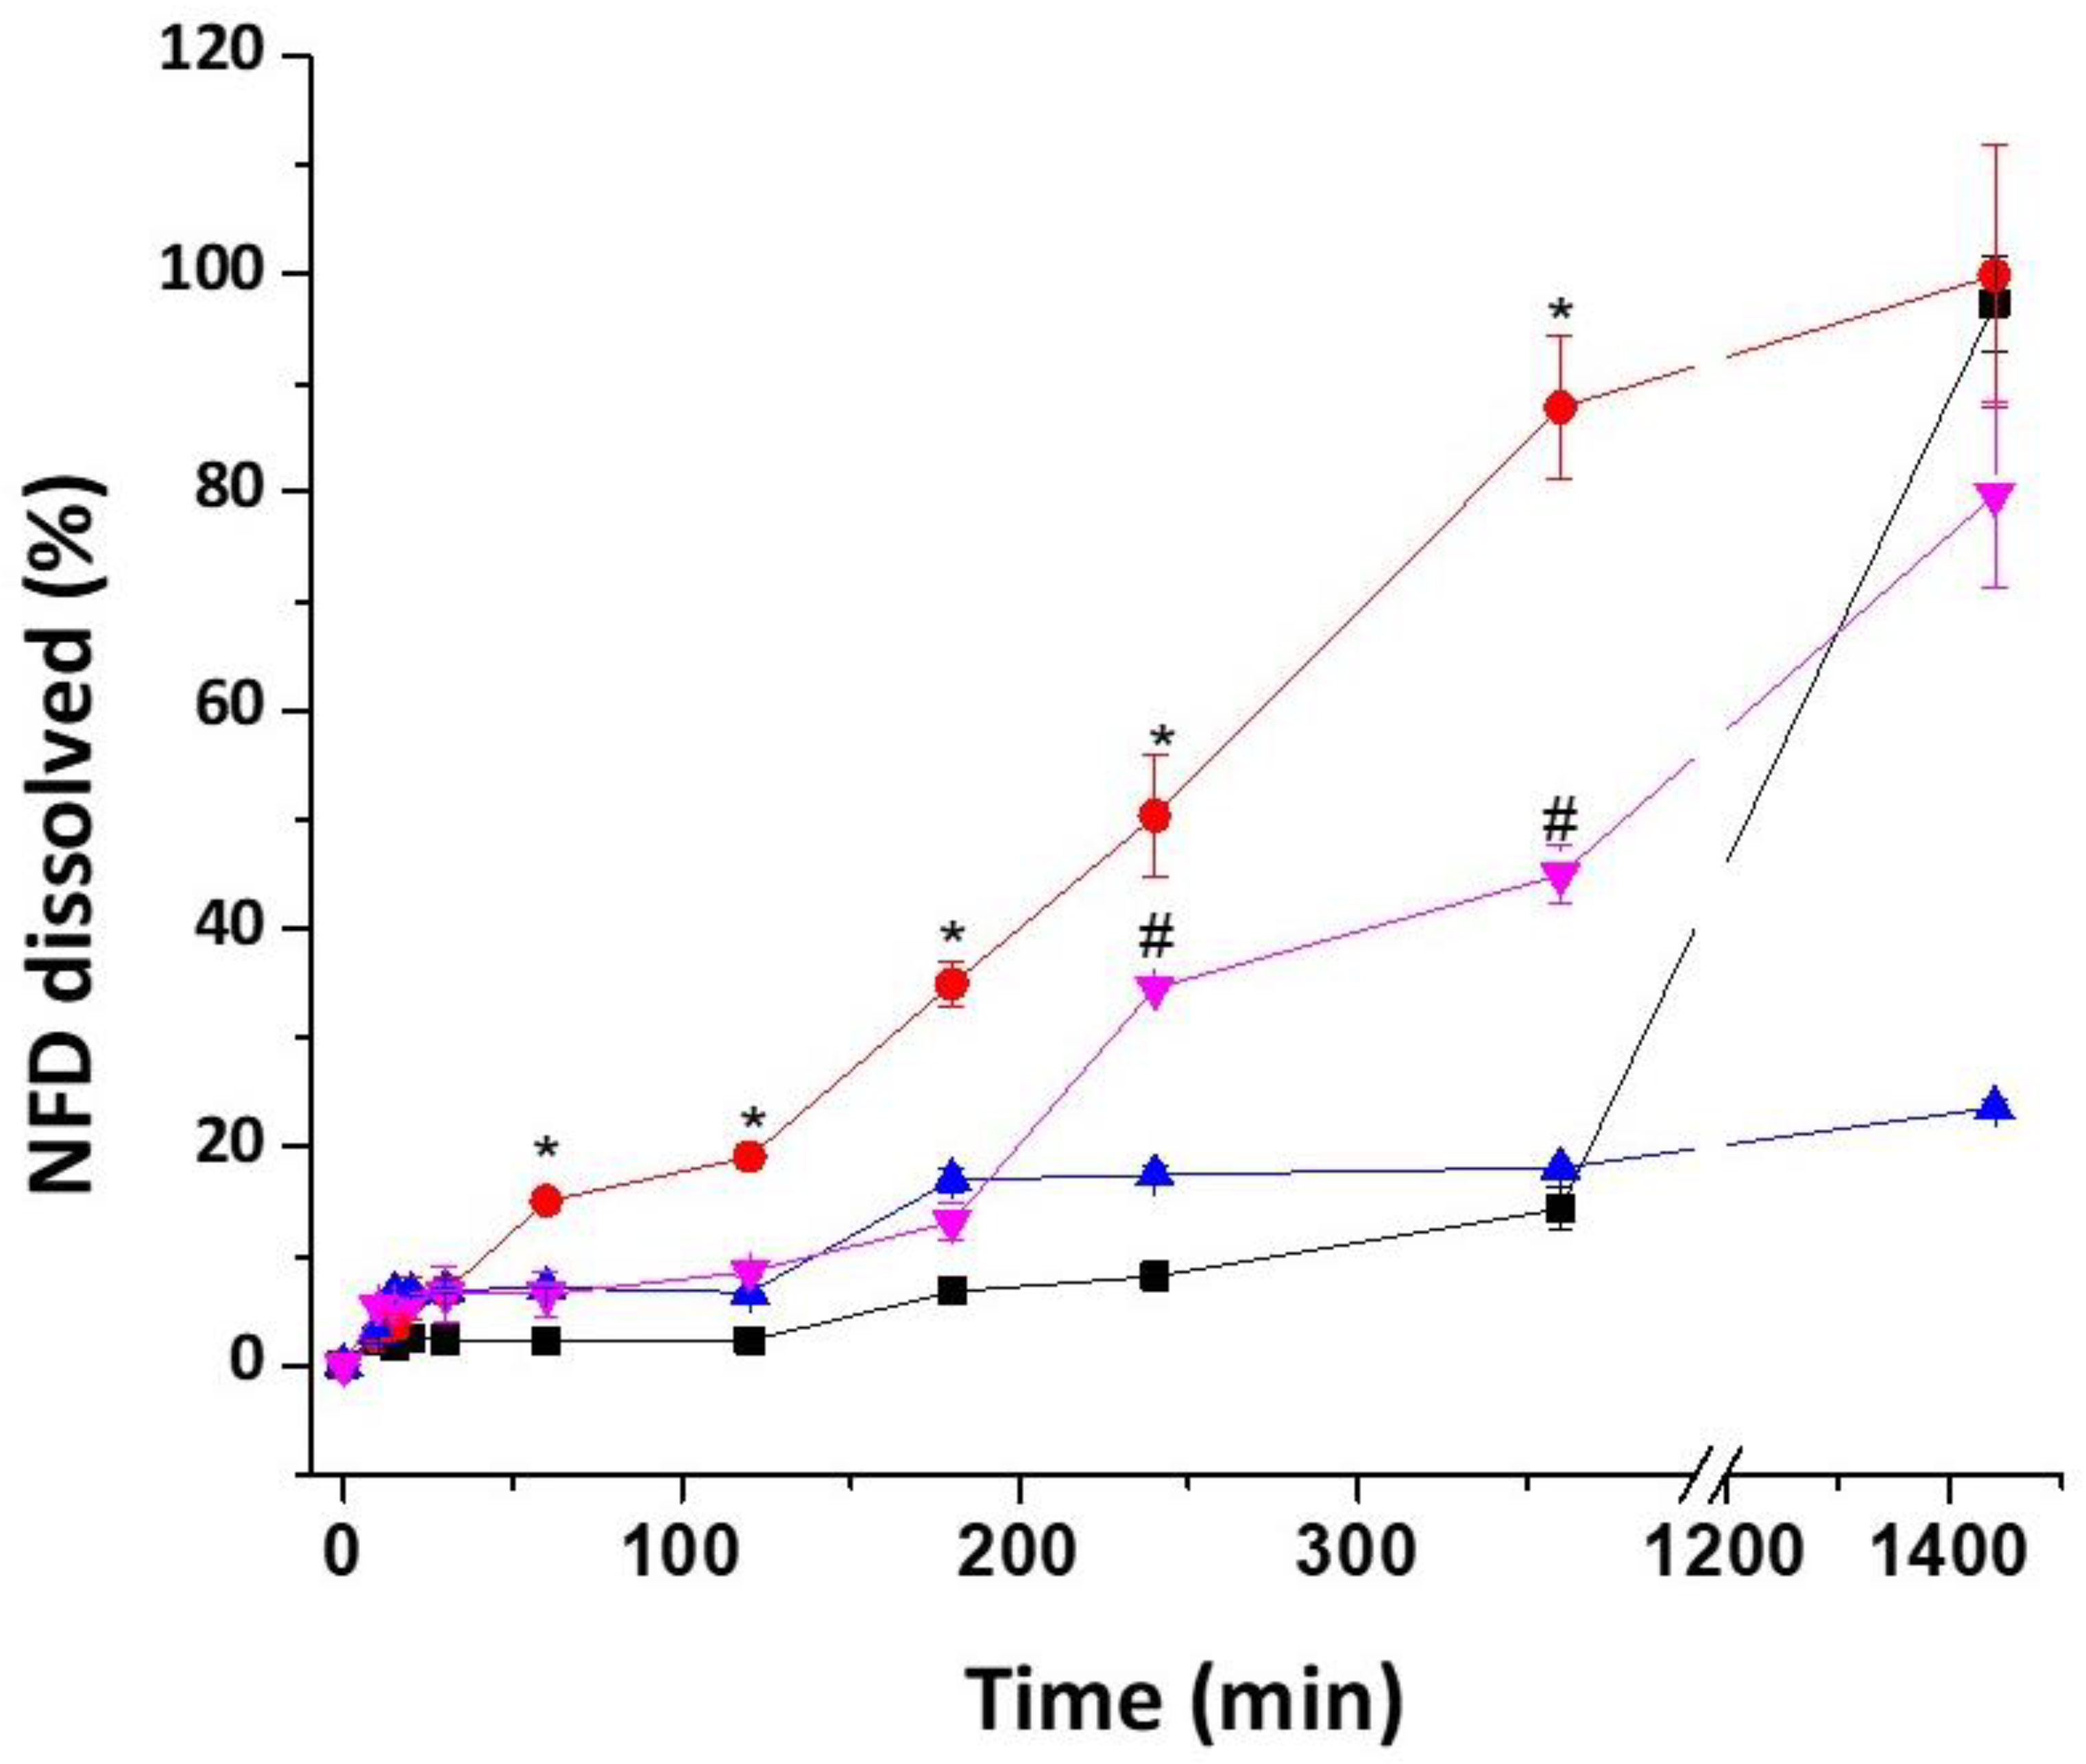
3.3. Dissolution Studies
3.4. Stability Studies
4. Discussion
5. Conclusions
Supplementary Materials
Author Contributions
Funding
Acknowledgments
Conflicts of Interest
References
- Gonzalez, D.; Rao, G.G.; Bailey, S.C.; Brouwer, K.L.R.; Cao, Y.; Crona, D.J.; Kashuba, A.D.M.; Lee, C.R.; Morbitzer, K.; Patterson, J.H.; et al. Precision Dosing: Public Health Need, Proposed Framework, and Anticipated Impact. Clin. Transl. Sci. 2017, 10, 443–454. [Google Scholar] [CrossRef] [PubMed]
- Serrano, D.R.; Terres, M.C.; Lalatsa, A. Applications of 3D Printing in Cancer. J. 3D Print. Med. 2018, 2, 1–26. [Google Scholar] [CrossRef]
- Konta, A.A.; Garcia-Pina, M.; Serrano, D.R. Personalised 3D Printed Medicines: Which Techniques and Polymers Are More Successful? Bioengineering (Basel) 2017, 4, 79. [Google Scholar] [CrossRef] [PubMed]
- Goole, J.; Amighi, K. 3D printing in pharmaceutics: A new tool for designing customized drug delivery systems. Int. J. Pharm. 2016, 499, 376–394. [Google Scholar] [CrossRef]
- Prasad, L.K.; Smyth, H. 3D Printing technologies for drug delivery: a review. Drug Dev. Ind. Pharm. 2016, 42, 1019–1031. [Google Scholar] [CrossRef]
- Serrano, D.R.; Cerda, J.R.; Fernandez-García, R.; Pérez-Ballesteros, L.F.; Ballesteros, M.P.; Lalatsa, A. Chapter 9: Market Demands in 3D Printing Pharmaceuticals Products. In 3D Printing Technology in Nanomedicine; Ahmad, N., Gopinath, P., Dutta, R., Eds.; Elsevier: Amsterdam, The Netherlands, 2019; pp. 165–183. [Google Scholar]
- Fasto, M.M.; Genina, N.; Kaae, S.; Kalvemark Sporrong, S. Perceptions, preferences and acceptability of patient designed 3D printed medicine by polypharmacy patients: a pilot study. Int. J. Clin. Pharm. 2019, 41, 1290–1298. [Google Scholar] [CrossRef]
- Goyanes, A.; Scarpa, M.; Kamlow, M.; Gaisford, S.; Basit, A.W.; Orlu, M. Patient acceptability of 3D printed medicines. Int. J. Pharm. 2017, 530, 71–78. [Google Scholar] [CrossRef]
- Oblom, H.; Zhang, J.; Pimparade, M.; Speer, I.; Preis, M.; Repka, M.; Sandler, N. 3D-Printed Isoniazid Tablets for the Treatment and Prevention of Tuberculosis-Personalized Dosing and Drug Release. AAPS PharmSciTech 2019, 20, 52. [Google Scholar] [CrossRef]
- Goyanes, A.; Fina, F.; Martorana, A.; Sedough, D.; Gaisford, S.; Basit, A.W. Development of modified release 3D printed tablets (printlets) with pharmaceutical excipients using additive manufacturing. Int. J. Pharm. 2017, 527, 21–30. [Google Scholar] [CrossRef]
- Goyanes, A.; Buanz, A.B.; Hatton, G.B.; Gaisford, S.; Basit, A.W. 3D printing of modified-release aminosalicylate (4-ASA and 5-ASA) tablets. Eur. J. Pharm. Biopharm. 2015, 89, 157–162. [Google Scholar] [CrossRef]
- Goyanes, A.; Buanz, A.B.; Basit, A.W.; Gaisford, S. Fused-filament 3D printing (3DP) for fabrication of tablets. Int. J. Pharm. 2014, 476, 88–92. [Google Scholar] [CrossRef] [PubMed]
- Skowyra, J.; Pietrzak, K.; Alhnan, M.A. Fabrication of extended-release patient-tailored prednisolone tablets via fused deposition modelling (FDM) 3D printing. Eur. J. Pharm. Sci. 2015, 68, 11–17. [Google Scholar] [CrossRef] [PubMed]
- HUNTSMAN. A Guide to Thermoplastic Polyurethanes (TPU). Available online: http://www.huntsman.com/polyurethanes/Media%20Library/global/files/guide_tpu.pdf (accessed on 20 December 2019).
- Maafi, W.; Maafi, M. Modelling nifedipine photodegradation, photostability and actinometric properties. Int. J. Pharm. 2013, 456, 153–164. [Google Scholar] [CrossRef] [PubMed]
- Ghanbarzadeh, S.; Hariri, R.; Kouhsoltani, M.; Shokri, J.; Javadzadeh, Y.; Hamishehkar, H. Enhanced stability and dermal delivery of hydroquinone using solid lipid nanoparticles. Colloids Surf. B Biointerfaces 2015, 136, 1004–1010. [Google Scholar] [CrossRef]
- Lalatsa, A.; Patel, P.V.; Sun, Y.; Kiun, C.C.; Karimi, F.; Zekonyte, J.; Emeriewen, K.; Saleh, G.M. Transcutaneous anaesthetic nano-enabled hydrogels for eyelid surgery. Int. J. Pharm. 2020, 577, 119003. [Google Scholar] [CrossRef]
- Lalatsa, A.; Emeriewen, K.; Protopsalti, V.; Skelton, G.; Saleh, G.M. Developing transcutaneous nanoenabled anaesthetics for eyelid surgery. Br. J. Ophthalmol. 2016, 100, 871–876. [Google Scholar] [CrossRef]
- Kaur, L.; Singh, K.; Paul, S.; Singh, S.; Singh, S.; Jain, S.K. A Mechanistic Study to Determine the Structural Similarities Between Artificial Membrane Strat-M and Biological Membranes and Its Application to Carry Out Skin Permeation Study of Amphotericin B Nanoformulations. AAPS PharmSciTech 2018. [Google Scholar] [CrossRef]
- Mitragotri, S.; Anissimov, Y.G.; Bunge, A.L.; Frasch, H.F.; Guy, R.H.; Hadgraft, J.; Kasting, G.B.; Lane, M.E.; Roberts, M.S. Mathematical models of skin permeability: an overview. Int. J. Pharm. 2011, 418, 115–129. [Google Scholar] [CrossRef]
- Walsh, D.; Serrano, D.R.; Worku, Z.A.; Norris, B.A.; Healy, A.M. Production of cocrystals in an excipient matrix by spray drying. Int. J. Pharm. 2018, 536, 467–477. [Google Scholar] [CrossRef]
- Yani, Y.; Kanaujia, P.; Chow, P.S.; Hna, R.B.H. Effect of API-Polymer Miscibility and Interaction on the Stabilization of Amorphous Solid Dispersion: A Molecular Simulation Study. Ind. Eng. Chem. Res. 2017, 55, 12698–12707. [Google Scholar] [CrossRef]
- Alhalaweh, A.; Alzghoul, A.; Kaialy, W. Data mining of solubility parameters for computational prediction of drug-excipient miscibility. Drug Dev. Ind. Pharm. 2014, 40, 904–909. [Google Scholar] [CrossRef] [PubMed]
- Hansen, C.M. The three dimensional solubility parameter-key to paint component affinities: solvents, plasticizers, polymers, and resins II. Dyes, emulsifiers, mutual solubility and compatibility, and pigments. III. Independent calculation of the parameter components. J. Paint. Technol. 1967, 39, 505–510. [Google Scholar]
- Salman, R.K.; Salih, J.M. A New Approach to Estimate Hansen Solubility Parameters using Maple Software. Int. J. Appl. Eng. Res. 2017, 12, 4858–4863. [Google Scholar]
- Tirado, D.F.; Tenorio, M.J.; Cabañas, A.; Calvo, l. Prediction of the best cosolvents to solubilise fatty acids in supercritical CO2 using the Hansen solubility theory. Chem. Eng. Sci. 2018, 190, 14–20. [Google Scholar] [CrossRef]
- Serrano, D.R.; Hernandez, L.; Fleire, L.; Gonzalez-Alvarez, I.; Montoya, A.; Ballesteros, M.P.; Dea-Ayuela, M.A.; Miro, G.; Bolas-Fernandez, F.; Torrado, J.J. Hemolytic and pharmacokinetic studies of liposomal and particulate amphotericin B formulations. Int. J. Pharm. 2013, 447, 38–46. [Google Scholar] [CrossRef]
- Yoshino, H.; Hara, Y.; Dohi, M.; Yamashita, K.; Hakomori, T.; Kimura, S.I.; Iwao, Y.; Itai, S. A Scale-up Approach for Film Coating Process Based on Surface Roughness as the Critical Quality Attribute. AAPS PharmSciTech 2018, 19, 1243–1253. [Google Scholar] [CrossRef]
- Three Point Bend Testing Using a Texture Analyser—Calculating Fundamental Parameters. Available online: https://textureanalysisprofessionals.blogspot.com/2018/10/three-point-bend-testing-using-texture.html (accessed on 5 January 2020).
- Serrano, D.R.; Walsh, D.; O’Connell, P.; Mugheirbi, N.A.; Worku, Z.A.; Bolas-Fernandez, F.; Galiana, C.; Dea-Ayuela, M.A.; Healy, A.M. Optimising the in vitro and in vivo performance of oral cocrystal formulations via spray coating. Eur. J. Pharm. Biopharm. 2018, 124, 13–27. [Google Scholar] [CrossRef]
- United States Pharmacopeia and National Formulary (USP 38-NF 33). General Chapters: <1217>. In TABLET BREAKING FORCE; USP: Rockville, MD, USA, 2015. [Google Scholar]
- United States Pharmacopeia and National Formulary (USP 38-NF 33). General Chapters: <1216>. In TABLET FRIABILITY; USP: Rockville, MD, USA, 2018; M.U.S.P.C.A.d. [Google Scholar]
- United States Pharmacopeia and National Formulary (USP 38-NF 33). Reagents: Test Solutions; USP: Rockville, MD, USA, 2018. [Google Scholar]
- Nifedipine Extended Release Tablets. Available online: https://www.uspnf.com/sites/default/files/usp_pdf/EN/USPNF/revisions/nifedipine-extended-release-tablets-rb-notice-9-29-17.pdf (accessed on 1 October 2017).
- Costa, P.; Sousa Lobo, J.M. Modeling and comparison of dissolution profiles. Eur. J. Pharm. Sci. 2001, 13, 123–133. [Google Scholar] [CrossRef]
- Siepmann, J.; Siepmann, F. Mathematical modeling of drug dissolution. Int. J. Pharm. 2013, 453, 12–24. [Google Scholar] [CrossRef] [PubMed]
- Lao, L.L.; Peppas, N.A.; Boey, F.Y.; Venkatraman, S.S. Modeling of drug release from bulk-degrading polymers. Int. J. Pharm. 2011, 418, 28–41. [Google Scholar] [CrossRef] [PubMed]
- Greenspan, L. Humidity Fixed Points of Binary Saturated Aqueous Solutions. J. Res. Natl. Bur. Stand. 1977, 81, 89–96. [Google Scholar] [CrossRef]
- Serrano, D.R.; Fernandez-Garcia, R.; Mele, M.; Healy, A.M.; Lalatsa, A. Designing Fast-Dissolving Orodispersible Films of Amphotericin B for Oropharyngeal Candidiasis. Pharmaceutics 2019, 11, 369. [Google Scholar] [CrossRef] [PubMed]
- Alonso, T.R.; Gagol, A.; Scherer, M.; Matji, A.; Torrado-Santiago, S.; Serrano, D.R.; Garcia-Arieta, A.; Torrado, J.J. A multivariate investigation into the relationship between pharmaceutical characteristics and patient preferences of bioequivalent ibuprofen tablets. Patient Prefer. Adherence 2018, 12, 1927–1935. [Google Scholar] [CrossRef] [PubMed]
- Matji, A.; Donato, N.; Gagol, A.; Morales, E.; Carvajal, L.; Serrano, D.R.; Worku, Z.A.; Healy, A.M.; Torrado, J.J. Predicting the critical quality attributes of ibuprofen tablets via modelling of process parameters for roller compaction and tabletting. Int. J. Pharm. 2019, 565, 209–218. [Google Scholar] [CrossRef] [PubMed]
- SIGMA. Nifedipine Product Information. Available online: https://www.sigmaaldrich.com/content/dam/sigma-aldrich/docs/Sigma/Product_Information_Sheet/2/n7634pis.pdf (accessed on 2 February 2020).
- Van Krevelen, D.W.; te NIjenhuis, K. Properties of Polymers. Available online: https://www.unpa.edu.mx/~aramirez/propiedades%20de%20polimeros.pdf (accessed on 20 February 2009).
- Abbott, S. Hansen Solubility Parameters. Available online: https://www.stevenabbott.co.uk/practical-adhesion/hsp.php (accessed on 18 February 2020).
- Markl, D.; Zeitler, J.A.; Rasch, C.; Michaelsen, M.H.; Mullertz, A.; Rantanen, J.; Rades, T.; Botker, J. Analysis of 3D Prints by X-ray Computed Microtomography and Terahertz Pulsed Imaging. Pharm. Res. 2017, 34, 1037–1052. [Google Scholar] [CrossRef] [PubMed]
- Sadia, M.; Sosnicka, A.; Arafat, B.; Isreb, A.; Ahmed, W.; Kelarakis, A.; Alhnan, M.A. Adaptation of pharmaceutical excipients to FDM 3D printing for the fabrication of patient-tailored immediate release tablets. Int. J. Pharm. 2016, 513, 659–668. [Google Scholar] [CrossRef]
- Zhang, J.; Feng, X.; Patil, H.; Tiwari, R.V.; Repka, M.A. Coupling 3D printing with hot-melt extrusion to produce controlled-release tablets. Int. J. Pharm. 2017, 519, 186–197. [Google Scholar] [CrossRef]
- Chih-Wei, H.; Chih-Chung, C.; Chih-Jeh, L. A Practical Guide to Support Vector Classification. 2009. Available online: http://www.csie.ntu.edu.tw/~cjlin (accessed on 14 March 2020).
- Guirguis, O.W.; Moselhey, M.T.H. Thermal and structural studies of poly(vinyl alcohol) and hydroxypropyl cellulose blends. Nat. Sci. 2012, 4, 1–11. [Google Scholar] [CrossRef]
- Muller, A.J.; Avila, M.; Saenz, G.; Salazar, J. Chapter 3: Crystallisation of PLA-based materials. In Poly(lactic acid) Science and Technology: Processing, Properties, Additives and Applications; Royal Society of Chemsitry: London, UK, 2014; pp. 66–98. [Google Scholar]
- Gupta, P.; Chawla, G.; Bansal, A.K. Physical stability and solubility advantage from amorphous celecoxib: the role of thermodynamic quantities and molecular mobility. Mol. Pharm. 2004, 1, 406–413. [Google Scholar] [CrossRef]
- Miyazaki, T.; Yoshioka, S.; Aso, Y.; Kawanishi, T. Crystallization rate of amorphous nifedipine analogues unrelated to the glass transition temperature. Int. J. Pharm. 2007, 336, 191–195. [Google Scholar] [CrossRef]
- Schindler, W.D.; Hauser, P.J. Hand Building Finishes. In Chemical Finishing of Textiles; Woodhead Publishing: Cambridge, UK, 2004; pp. 43–50. [Google Scholar]
- Connor, D.F.; Steingard, R.J. New formulations of stimulants for attention-deficit hyperactivity disorder: therapeutic potential. CNS Drugs 2004, 18, 1011–1030. [Google Scholar] [CrossRef]
- Robles-Martinez, P.; Xu, X.; Trenfield, S.J.; Awad, A.; Goyanes, A.; Telford, R.; Basit, A.W.; Gaisford, S. 3D Printing of a Multi-Layered Polypill Containing Six Drugs Using a Novel Stereolithographic Method. Pharmaceutics 2019, 11, 274. [Google Scholar] [CrossRef]
- Technical Data Sheet Adalat Oros. Available online: https://cima.aemps.es/cima/dochtml/ft/59538/FT_59538.html (accessed on 7 January 2020).
- Nukala, P.K.; Palekar, S.; Solanki, N.; Fu, Y.; Patki, M.; Shohatee, A.A.; Trombetta, L.; Patel, K. Investigating the application of fused deposition modeling 3D printing pattern in preparation of patient-tailored dosage forms. J. 3D Print. Med. 2019, 3, 1–16. [Google Scholar]
- Chai, X.; Chai, H.; Wang, X.; Yang, J.; Li, J.; Zhao, Y.; Cai, W.; Tao, T.; Xiang, X. Fused Deposition Modeling (FDM) 3D Printed Tablets for Intragastric Floating Delivery of Domperidone. Sci. Rep. 2017, 7, 2829. [Google Scholar] [CrossRef] [PubMed]
- Lamichhane, S.; Park, J.B.; Sohn, D.H.; Lee, S. Customized Novel Design of 3D Printed Pregabalin Tablets for Intra-Gastric Floating and Controlled Release Using Fused Deposition Modeling. Pharmaceutics 2019, 11, 564. [Google Scholar] [CrossRef]
- Okwuosa, T.C.; Stefaniak, D.; Arafat, B.; Isreb, A.; Wan, K.W.; Alhnan, M.A. A Lower Temperature FDM 3D Printing for the Manufacture of Patient-Specific Immediate Release Tablets. Pharm. Res. 2016, 33, 2704–2712. [Google Scholar] [CrossRef] [PubMed]


| Environmental Conditions | Sampling Time (Day) | Humidity Control Method |
|---|---|---|
| 80 °C, 75% RH | 14, 28, 48 | Saturated sodium chloride aq. soln. |
| 80 °C, 10% RH | 14, 28, 48 | Silica gel (3–5 mm) |
| 70 °C, 50% RH | 14, 28, 48 | Saturated sodium bromide aq. soln. |
| 70 °C, 10% RH | 14, 28, 48 | Silica gel (3–5 mm) |
| 60 °C, 75% RH | 14, 28, 48 | Saturated sodium chloride aq. soln. |
| 50 °C, 50% RH | 14, 28, 48 | Saturated sodium bromide aq. soln. |
| Solvent | Filament | Jss0–4h (mg/cm2/h) | P0–4h (cm/h) × 103 | ER |
|---|---|---|---|---|
| Ethanol | PVA | 0.278 * ± 0.065 | 8.794 * ± 0.741 | 2.4 |
| PLA | 0.064 ± 0.012 | 2.044 * ± 0.315 | 0.5 | |
| TPU | 0.203 * ± 0.054 | 6.424 * ± 0.568 | 1.6 | |
| HS | 0.276 * ± 0.078 | 8.744 * ± 0.874 | 5.9 | |
| Ethyl acetate | PVA | 0.115 ± 0.018 | 1.615 ± 0.058 | - |
| PLA | 0.126 * ± 0.045 | 1.771 ± 0.084 | - | |
| TPU | 0.126 ± 0.032 | 1.771 ± 0.077 | - | |
| HS | 0.046 ± 0.014 | 0.652 ± 0.029 | - |
| Material | Total HSP (MPa1/2) | δd (MPa1/2) | δp (MPa1/2) | δh (MPa1/2) | Ra NFD (MPa1/2) | Ra Ethanol (MPa1/2) | Ra Ethyl acetate (MPa1/2) |
|---|---|---|---|---|---|---|---|
| NDF | 18.3 | 16.6 | 2.4 | 7.4 | NA | NA | NA |
| Ethanol | 26.5 | 15.8 | 8.8 | 19.4 | 13.7 | NA | NA |
| Ethyl acetate | 18.1 | 15.8 | 5.3 | 7.2 | 3.3 | NA | NA |
| PVA | 28.9 | 15.0 | 17.2 | 17.8 | 18.4 | 9.5 | 13.9 |
| HS | 29.0 | 15.1 | 16.9 | 18.1 | 18.3 | 9.7 | 14.1 |
| PLA | 21.9 | 18.6 | 9.9 | 6.0 | 8.6 | 16.2 | 21.8 |
| TPU | 20.8 | 18.1 | 9.3 | 4.5 | 8.1 | 17.8 | 25.1 |
| System | Rav (μm) | Rz (μm) | Filament Bending Modulus (N mm) | Filament Toughness—AUC (N mm) |
|---|---|---|---|---|
| HS blank tablet | 29.95 ± 3.40 | 215.03 ± 27.18 | - | - |
| HS NFD-loaded tablet | 32.86 ± 4.12 | 254.72 ± 45.12 | - | - |
| HS blank filament | 2.99 * ± 0.14 | 15.2 * ± 0.51 | 7.86 ± 0.33 | 141.80 # ± 5.94 |
| HS NFD-loaded filament | 3.47 * ± 0.19 | 26.18 * ± 3.28 | 1.29 + ± 0.37 (0.61 + ± 0.03) | 44.11 # ± 10.62 (8.91 # ± 1.36) |
| PVA blank tablet | 25.14 ± 3.12 | 156.24 ± 14.87 | - | - |
| PVA loaded tablet | 27.56 ± 2.77 | 172.95 ± 11.95 | - | - |
| PVA blank filament | 1.84 * ± 0.66 | 13.05 *± 3.54 | 7.11 ± 1.22 | 130.82 # ± 13.50 |
| PVA NFD-loaded filament | 2.38 * ± 0.60 | 15.69 * ± 0.19 | 3.69 + ± 0.59 (3.62 ± 0.48) | 102.98 # ± 5.02 (100.45 ± 4.98) |
| PLA blank filament | 2.79 ± 0.08 | 15.39 ± 0.71 | 6.84 ± 0.05 | 157.50 # ± 2.02 |
| TPU blank filament | 2.24 ± 0.12 | 14.58 ± 0.42 | 0.72 + ± 0.05 | 12.26 # ± 4.50 |
| System | Tg (°C) | ΔCp (J/g °C) | Percentage of Water Loss (%) |
|---|---|---|---|
| PVA blank filament | 104.20 ± 0.16 | 0.158 ± 0.007 | 0.57 ± 0.14 |
| PVA blank tablet | 103.4 ± 0.57 39.48 ± 6.26 | 0.147 ± 0.014 0.194 ± 0.039 | 0.83 ± 0.21 |
| PVA NFD-loaded filament | 93.97 * ± 1.06 | 0.206 * ± 0.032 | 0.69 ± 0.11 |
| PVA NFD-loaded tablet | 89.09 * ± 0.99 | 0.206 *± 0.002 | 1.12 * ± 0.13 |
| HS blank filament | 34.63 ± 1.58 | 0.458 ± 0.004 | 0.69 ± 0.18 |
| HS blank tablet | 36.99 * ± 0.01 | 0.735 * ± 0.022 | 2.58 * ± 0.32 |
| HS NFD-loaded filament | - | - | 0.78 ± 0.24 |
| HS NFD-loaded tablet | - | - | 2.28 * ± 0.31 |
| Parameter | Raw NFD | HS NFD-Loaded 3DP Tablet |
|---|---|---|
| Ea (Kcal/mol) | 23.38 ± 3.45 | 10.25 ± 1.64 |
| B | 0.008 ± 0.003 | 0.022 ± 0.008 |
| R2 | 0.894 | 0.920 |
| Kinetic model | Zero order | Avrami order |
| Shelf life | >3 years | >3 years |
© 2020 by the authors. Licensee MDPI, Basel, Switzerland. This article is an open access article distributed under the terms and conditions of the Creative Commons Attribution (CC BY) license (http://creativecommons.org/licenses/by/4.0/).
Share and Cite
Cerda, J.R.; Arifi, T.; Ayyoubi, S.; Knief, P.; Ballesteros, M.P.; Keeble, W.; Barbu, E.; Healy, A.M.; Lalatsa, A.; Serrano, D.R. Personalised 3D Printed Medicines: Optimising Material Properties for Successful Passive Diffusion Loading of Filaments for Fused Deposition Modelling of Solid Dosage Forms. Pharmaceutics 2020, 12, 345. https://doi.org/10.3390/pharmaceutics12040345
Cerda JR, Arifi T, Ayyoubi S, Knief P, Ballesteros MP, Keeble W, Barbu E, Healy AM, Lalatsa A, Serrano DR. Personalised 3D Printed Medicines: Optimising Material Properties for Successful Passive Diffusion Loading of Filaments for Fused Deposition Modelling of Solid Dosage Forms. Pharmaceutics. 2020; 12(4):345. https://doi.org/10.3390/pharmaceutics12040345
Chicago/Turabian StyleCerda, Jose R., Talaya Arifi, Sejad Ayyoubi, Peter Knief, Maria Paloma Ballesteros, William Keeble, Eugen Barbu, Anne Marie Healy, Aikaterini Lalatsa, and Dolores R. Serrano. 2020. "Personalised 3D Printed Medicines: Optimising Material Properties for Successful Passive Diffusion Loading of Filaments for Fused Deposition Modelling of Solid Dosage Forms" Pharmaceutics 12, no. 4: 345. https://doi.org/10.3390/pharmaceutics12040345
APA StyleCerda, J. R., Arifi, T., Ayyoubi, S., Knief, P., Ballesteros, M. P., Keeble, W., Barbu, E., Healy, A. M., Lalatsa, A., & Serrano, D. R. (2020). Personalised 3D Printed Medicines: Optimising Material Properties for Successful Passive Diffusion Loading of Filaments for Fused Deposition Modelling of Solid Dosage Forms. Pharmaceutics, 12(4), 345. https://doi.org/10.3390/pharmaceutics12040345