Next Article in Journal
L-Type Amino Acid Transporter 1-Utilizing Prodrugs of Ketoprofen Can Efficiently Reduce Brain Prostaglandin Levels
Next Article in Special Issue
β-Sitosterol Loaded Nanostructured Lipid Carrier: Physical and Oxidative Stability, In Vitro Simulated Digestion and Hypocholesterolemic Activity
Previous Article in Journal
Personalised 3D Printed Medicines: Optimising Material Properties for Successful Passive Diffusion Loading of Filaments for Fused Deposition Modelling of Solid Dosage Forms
Previous Article in Special Issue
Neuroprotective Effect of Bergamot Juice in 6-OHDA-Induced SH-SY5Y Cell Death, an In Vitro Model of Parkinson’s Disease
 
 
Retraction published on 30 January 2024, see Pharmaceutics 2024, 16(2), 194.
Article

RETRACTED: Optimized Icariin Phytosomes Exhibit Enhanced Cytotoxicity and Apoptosis-Inducing Activities in Ovarian Cancer Cells

1
Department of Pharmaceutics, Faculty of Pharmacy, King Abdulaziz University, Jeddah 21589, Saudi Arabia
2
Center of Excellence for Drug Research and Pharmaceutical Industries, King Abdulaziz University, Jeddah 21589, Saudi Arabia
3
King Fahd Medical Research Center, King Abdulaziz University, Jeddah 21589, Saudi Arabia
4
Advanced drug delivery research group, Faculty of Pharmacy, King Abdulaziz University, Jeddah 21589, Saudi Arabia
5
Department of Pharmaceutics and Industrial Pharmacy, Faculty of Pharmacy, Cairo University, Cairo 11562, Egypt
6
Department of Medical Microbiology and Parasitology, Faculty of Medicine, King Abdulaziz University, Jeddah 21589, Saudi Arabia
7
Department of Biological Sciences, Faculty of Science, King Abdulaziz University, Jeddah 21579, Saudi Arabia
8
Department of Pharmacology and Toxicology, Faculty of Pharmacy, King Abdulaziz University, Jeddah 21589, Saudi Arabia
9
Department of Clinical Biochemistry, Faculty of Medicine, King Abdulaziz University, Jeddah 21589, Saudi Arabia
10
Department of Pharmaceutics, Faculty of Pharmacy, Jouf University, Skaka 2014, Saudi Arabia
11
Department of Pharmaceutics and Industrial Pharmacy, Military Medical Academy, Cairo 11757, Egypt
*
Author to whom correspondence should be addressed.
Pharmaceutics 2020, 12(4), 346; https://doi.org/10.3390/pharmaceutics12040346
Submission received: 25 March 2020 / Revised: 6 April 2020 / Accepted: 9 April 2020 / Published: 11 April 2020 / Retracted: 30 January 2024

Abstract

:
Icariin (ICA) is a flavonol glycoside that has pleiotropic pharmacological actions. It has cytotoxic effects against ovarian cancer cells and increases their chemosensitivity to chemotherapeutic drugs. Phytosomes are identified for their potential in drug delivery of cytotoxic agents. Thus, the purpose of this study was to determine the potential enhancement of ICA cytotoxicity activity in OVCAR-3 ovarian cancer cells via its formulation in phytosomes. ICA-phytosomal formulation was optimized using a Box–Behnken design. Particle size, shape, and in vitro drug release were used to characterize the optimized formula. The optimized formulation exhibited enhanced in vitro drug release. ICA-phytosomes exhibited enhanced cytotoxicity against ovarian cancer cells. Cell cycle analysis indicated accumulation of cells challenged with ICA-phytosomes in G2/M and pre-G1 phases. Staining of cells with annexin V indicated significant elevation of percentage cells with early and late apoptosis as well as total cell death. In addition, the formulation significantly disturbed mitochondrial membrane potential and cellular content of caspase 3. In addition, intracellular release of reactive oxygen species (ROS) was enhanced by ICA-phytosomes. In conclusion, phytosome formulation of ICA significantly potentiates its cytotoxic activities against OVCAR-3 cells. This is mediated, at least partly, by enhanced ICA cellular permeation, apoptosis, and ROS.

Graphical Abstract

1. Introduction

Treatment of cancer involves the use the use of several approaches that include surgery, radiotherapy, chemotherapy, and others. Chemotherapeutic agents suffer severe toxicities and the emergence of resistance. Therefore, exploration of medicinal plants and/or their products is currently an attractive area of research. In particular, ovarian cancer is a major health problem. In females, ovarian cancer is the fifth most common tumor worldwide. Indeed, it is the main gynecological cancer since it lacks early symptoms and has insufficient treatments [1]. Unfortunately, it is the leading fatal gynecologic malignancy [2].
Icariin (ICA), chemically classified as a flavonol glycoside, is a major component of Epimedium grandiflorum [3]. Traditionally, it has been used for erectile dysfunction in ancient Chinese medicine [4]. ICA is therapeutically effective in cases of atherosclerosis, as well as neurodegenerative disorders [3,5,6]. It demonstrates neuroprotective potential and was found to enhance memory in a model of Alzheimer’s disease (AD) in mice. Furthermore, the compound has been shown to possess antioxidant [7], anti-inflammatory [8], cardioprotective [8], hepatoprotective [9], anti-osteoporotic [10], and antidepressant [11] activities. Recently, the anti-tumor activity of ICA was reviewed [12]. It exhibited appreciable cytotoxicity against several types of cancer cells [13,14]. ICA demonstrates apoptotic effect via the intrinsic pathway [15]. It also causes cancer cell arrest by modulating the expression of regulatory cell cycle proteins [16]. In addition, it exhibits anti-angiogenic, anti-metastatic, and immunomodulating effects [17,18]. In addition to its cytotoxic activity, ICA has been demonstrated to enhance chemosensitivity of ovarian cancer cells [19,20]. Thus, accumulating evidence highlights a potential of ICA as a cytotoxic and anti-cancer. ICA has poor bioavailability which can be attributed to its chemical structure. It is a diglycoside and not readily absorbed [14,21]. Its oral half-life is 3.15 h and its serum level after intravenous administration suffers rapid decline with a half-life of 0.56 h [22,23]. These pharmacokinetic properties limit its clinical applications. In this regard, nanotechnology finds a major application [24]. Polymeric nanoparticles have been widely studied for tumor-targeted drug delivery [25,26]. Furthermore, lipid-based nanoparticles have demonstrated peculiar advantages such as prolonged circulation [27,28,29]. Phytosomes are phyto-phospholipid complexes that are currently studied for many nanomedicine-based therapies [30]. Phytosomes are generally formed by complexation between the phytoconstituent and the polar part of the lipid. This type of interaction leaves the fatty acid chains free, so they can further move to encapsulate the polar portion of the complex forming a lipophilic surface [30]. Thus, phytosomes have the potential to enhance the oral bioavailability of plant-derived bioactives [31]. Phytosome use in transdermal drug delivery has also been reported [32]. Phytosomes have additional therapeutic benefits owing to their phospholipidic content [33]. Thus, phytosomes represent a promising nanocarrier for a variety of phytochemical delivery applications. Therefore, this study aimed at enhancing the cytotoxic activity of ICA-phytosomes against OVCAR-3 ovarian cancer cell.

2. Materials and Methods

2.1. Materials

ICA, purity 99%, was obtained from Sigma-Aldrich Inc. (St. Louis, MO, USA). Phospholipon® 90H (Hydrogenated phosphatidylcholine from soybean origin, content 90%) was obtained as a gift sample from Lipoid GmbH (Ludwigshafen, Germany). The remaining chemicals were of an analytical grade.

2.2. Experimental Design and Optimization

A three factor Box–Behnken experimental design was used to formulate ICA-phytosomes. ICA to phospholipid molar ratio (X1), process temperature (°C, X2) and reflux time (h, X3) constituted the independent variables, while vesicle size (nm, Y) was studied as the response. The coded levels of each factor nominated as (−1, 0, +1) and their actual values, respectively, are listed in Table 1. Design-Expert software (Version 12; Stat-Ease Inc., Minneapolis, MN, USA) was used to generate 15 experiments. Table 2 show the composition of the experimental runs and the measured vesicle sizes. Adequate precision ratio as well as predicted and adjusted determination coefficients were computed and utilized for selection of the best fitting model for the measured response. The equation representing the best fitting model was generated. Analysis of variance (ANOVA) was applied to statistically analyze the measured response to estimate the significance of the studied variables at p ≤ 0.05. Three-dimensional and interaction plots were produced to explore the interaction between the investigated variables.
A numerical method was used to optimize the formulation and process parameters. The goal of the optimization process was to minimize vesicle size.

2.3. Preparation of Icariin (ICA) Phytosomes

ICA-phytosomes were prepared using refluxing followed by anti-solvent precipitation. Accurately weighed amounts of ICA (27 mg) and Phospholipon® 90H (32, 64, or 96 mg) in the specified molar ratios (according to the experimental design) were dissolved in dichloromethane (20 mL). The solution was refluxed at the temperature and time period specified according to the experimental design, and then evaporated to obtain a concentrate of about 5 mL. The concentrate was lyophilized for 72 h to obtain the phytosomal complex. The dried complex was then stored in an airtight amber colored glass container at 4 °C until further use.

2.4. Vesicle Size Measurement

Dynamic light scattering technique (DLS) was used to determine the vesicle size using Zetatrac® nanosizer (Microtrac Inc., Montgomeryville, PA, USA). The phytosomal samples were dispersed in deionized water before measurements are carried out. The results were expressed as the average of five determinations. The parameters were the following: laser wavelength of 633 nm, scattering angle of 173°, temperature of 25 °C, medium viscosity of 0.8872 cP, and medium refractive index of 1.33.

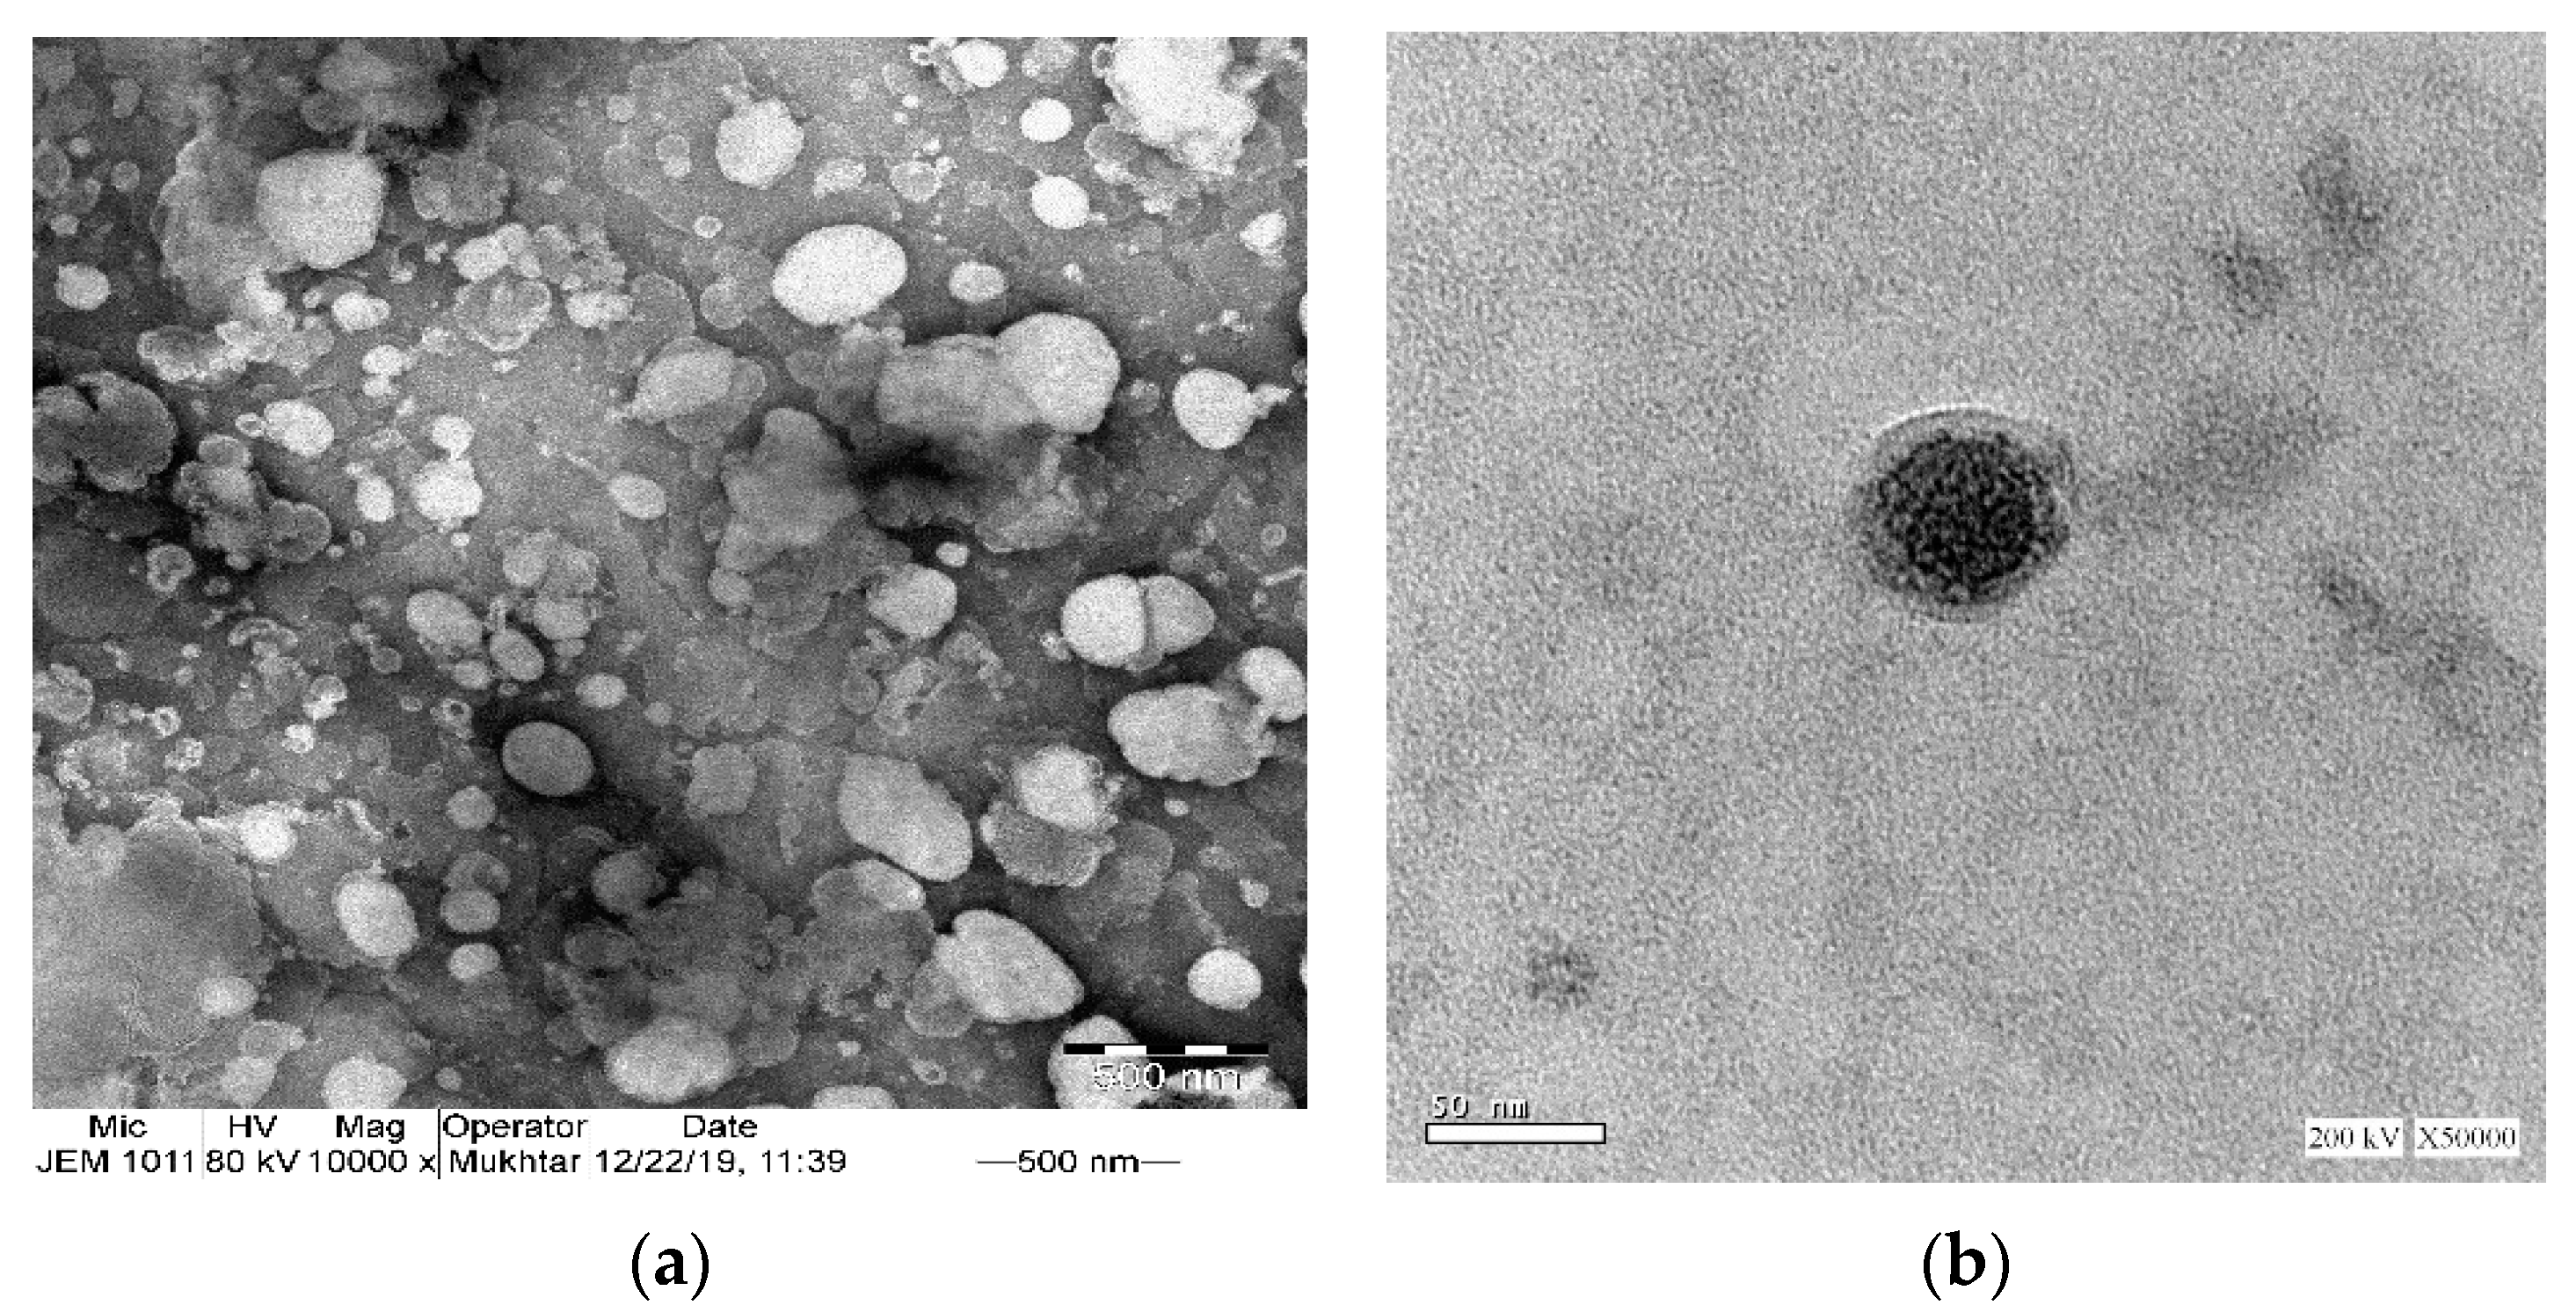
2.5. Transmission Electron Microscopy

Transmission electron microscope JEOL-JEM-1011 (JEOL-Tokyo, Tokyo, Japan) was used explore the shape and aggregation of the optimized ICA-phytosomes. The phytosomes sample was suspended in distilled water and one drop of the sample was spread on a carbon-coated grid. In addition, 1% phosphotungstic acid was used for negative staining of the sample. Then, the sample was dried at ambient temperature for 15 min before visualization.

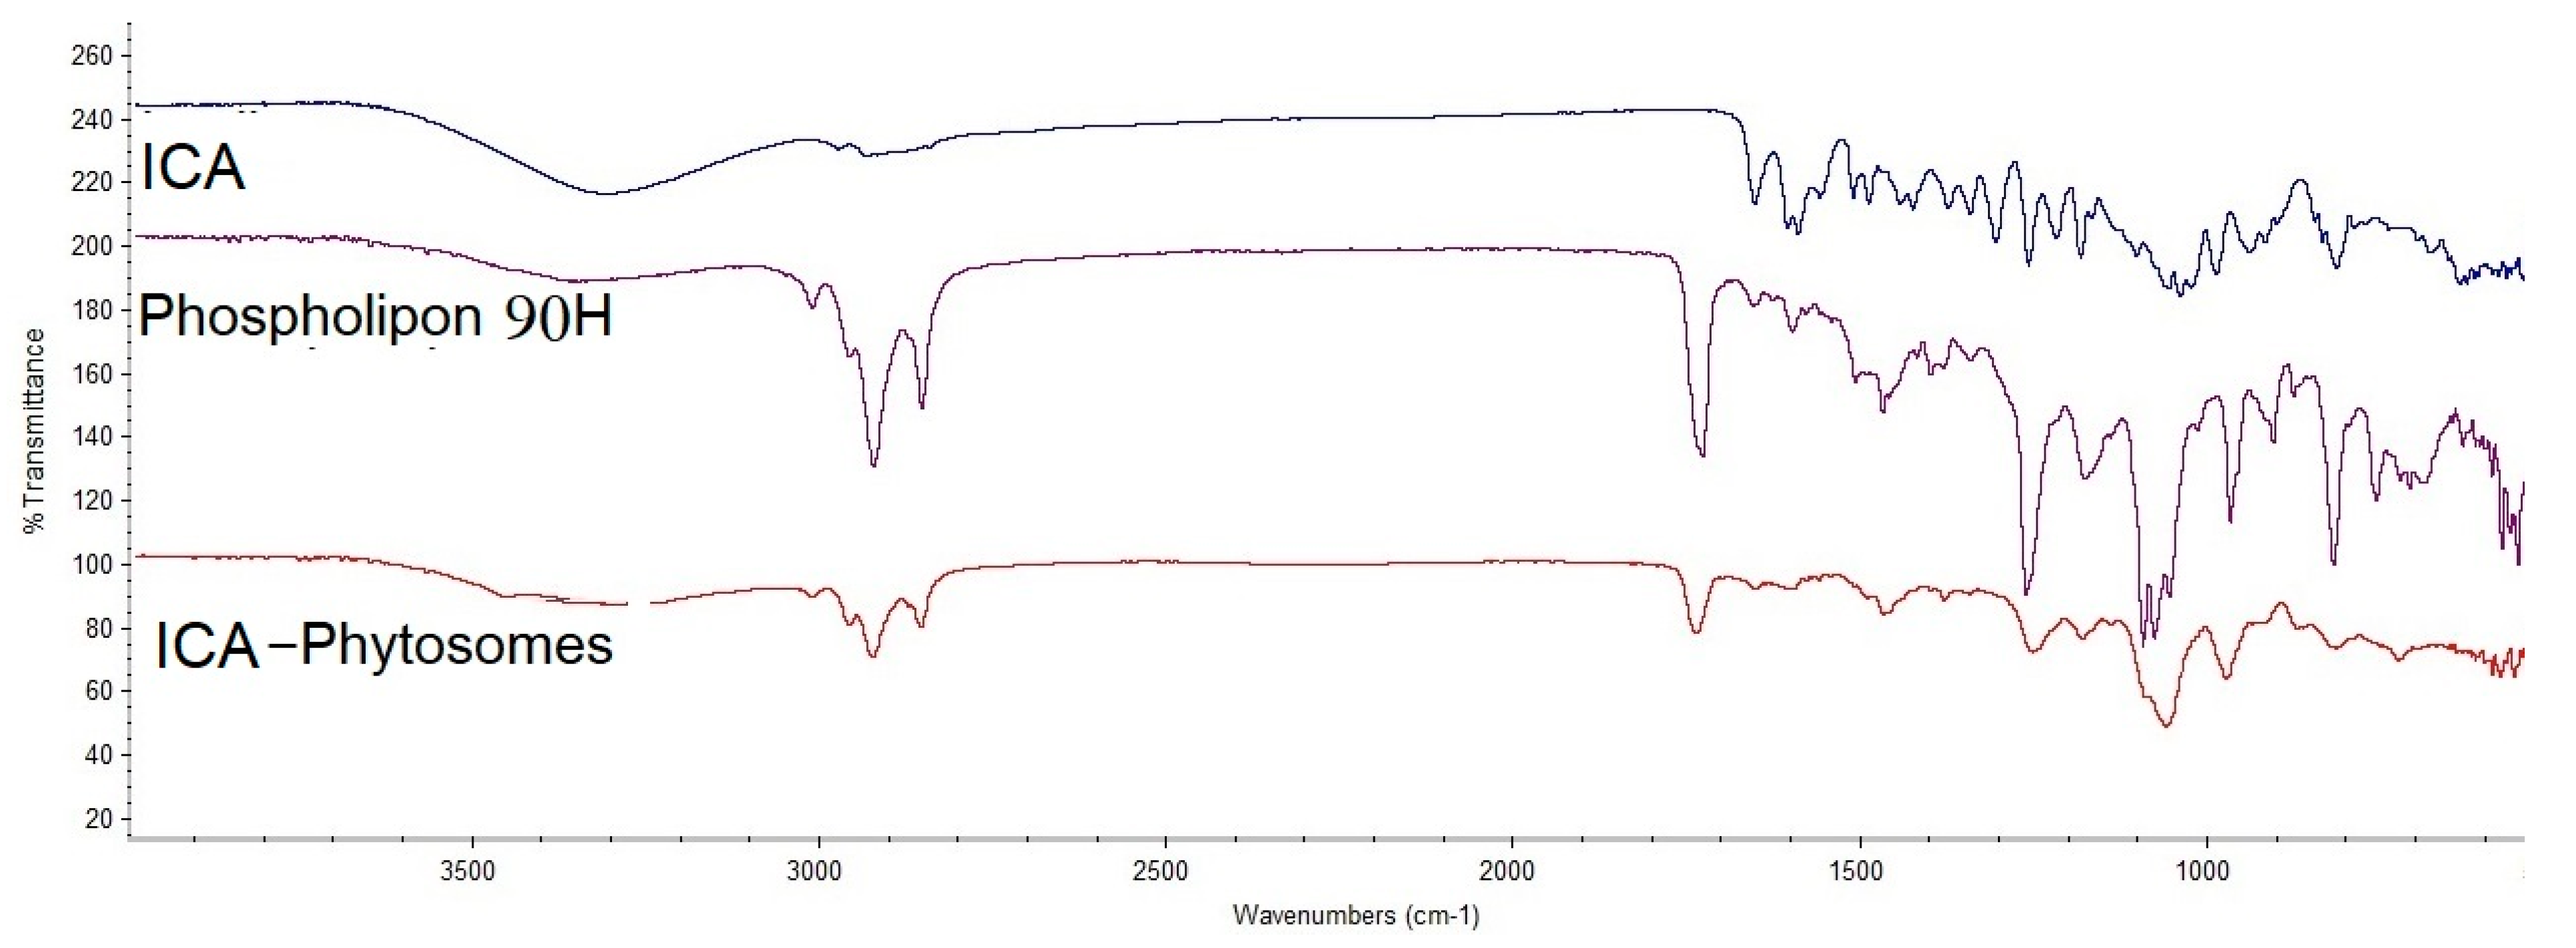
2.6. Fourier-Transform Infrared (FTIR) Spectroscopy Study

Fourier-transform infrared (FTIR) analysis was utilized to investigate the interaction between ICA and Phospholipon® 90H. ICA, Phospholipon® 90H, and optimized ICA-phytosomes spectra were measured in the range of 4000–400 cm−1 using an FTIR spectrophotometer (Nicolet IZ 10, Thermo Fisher Scientific, Waltham, MA, USA).

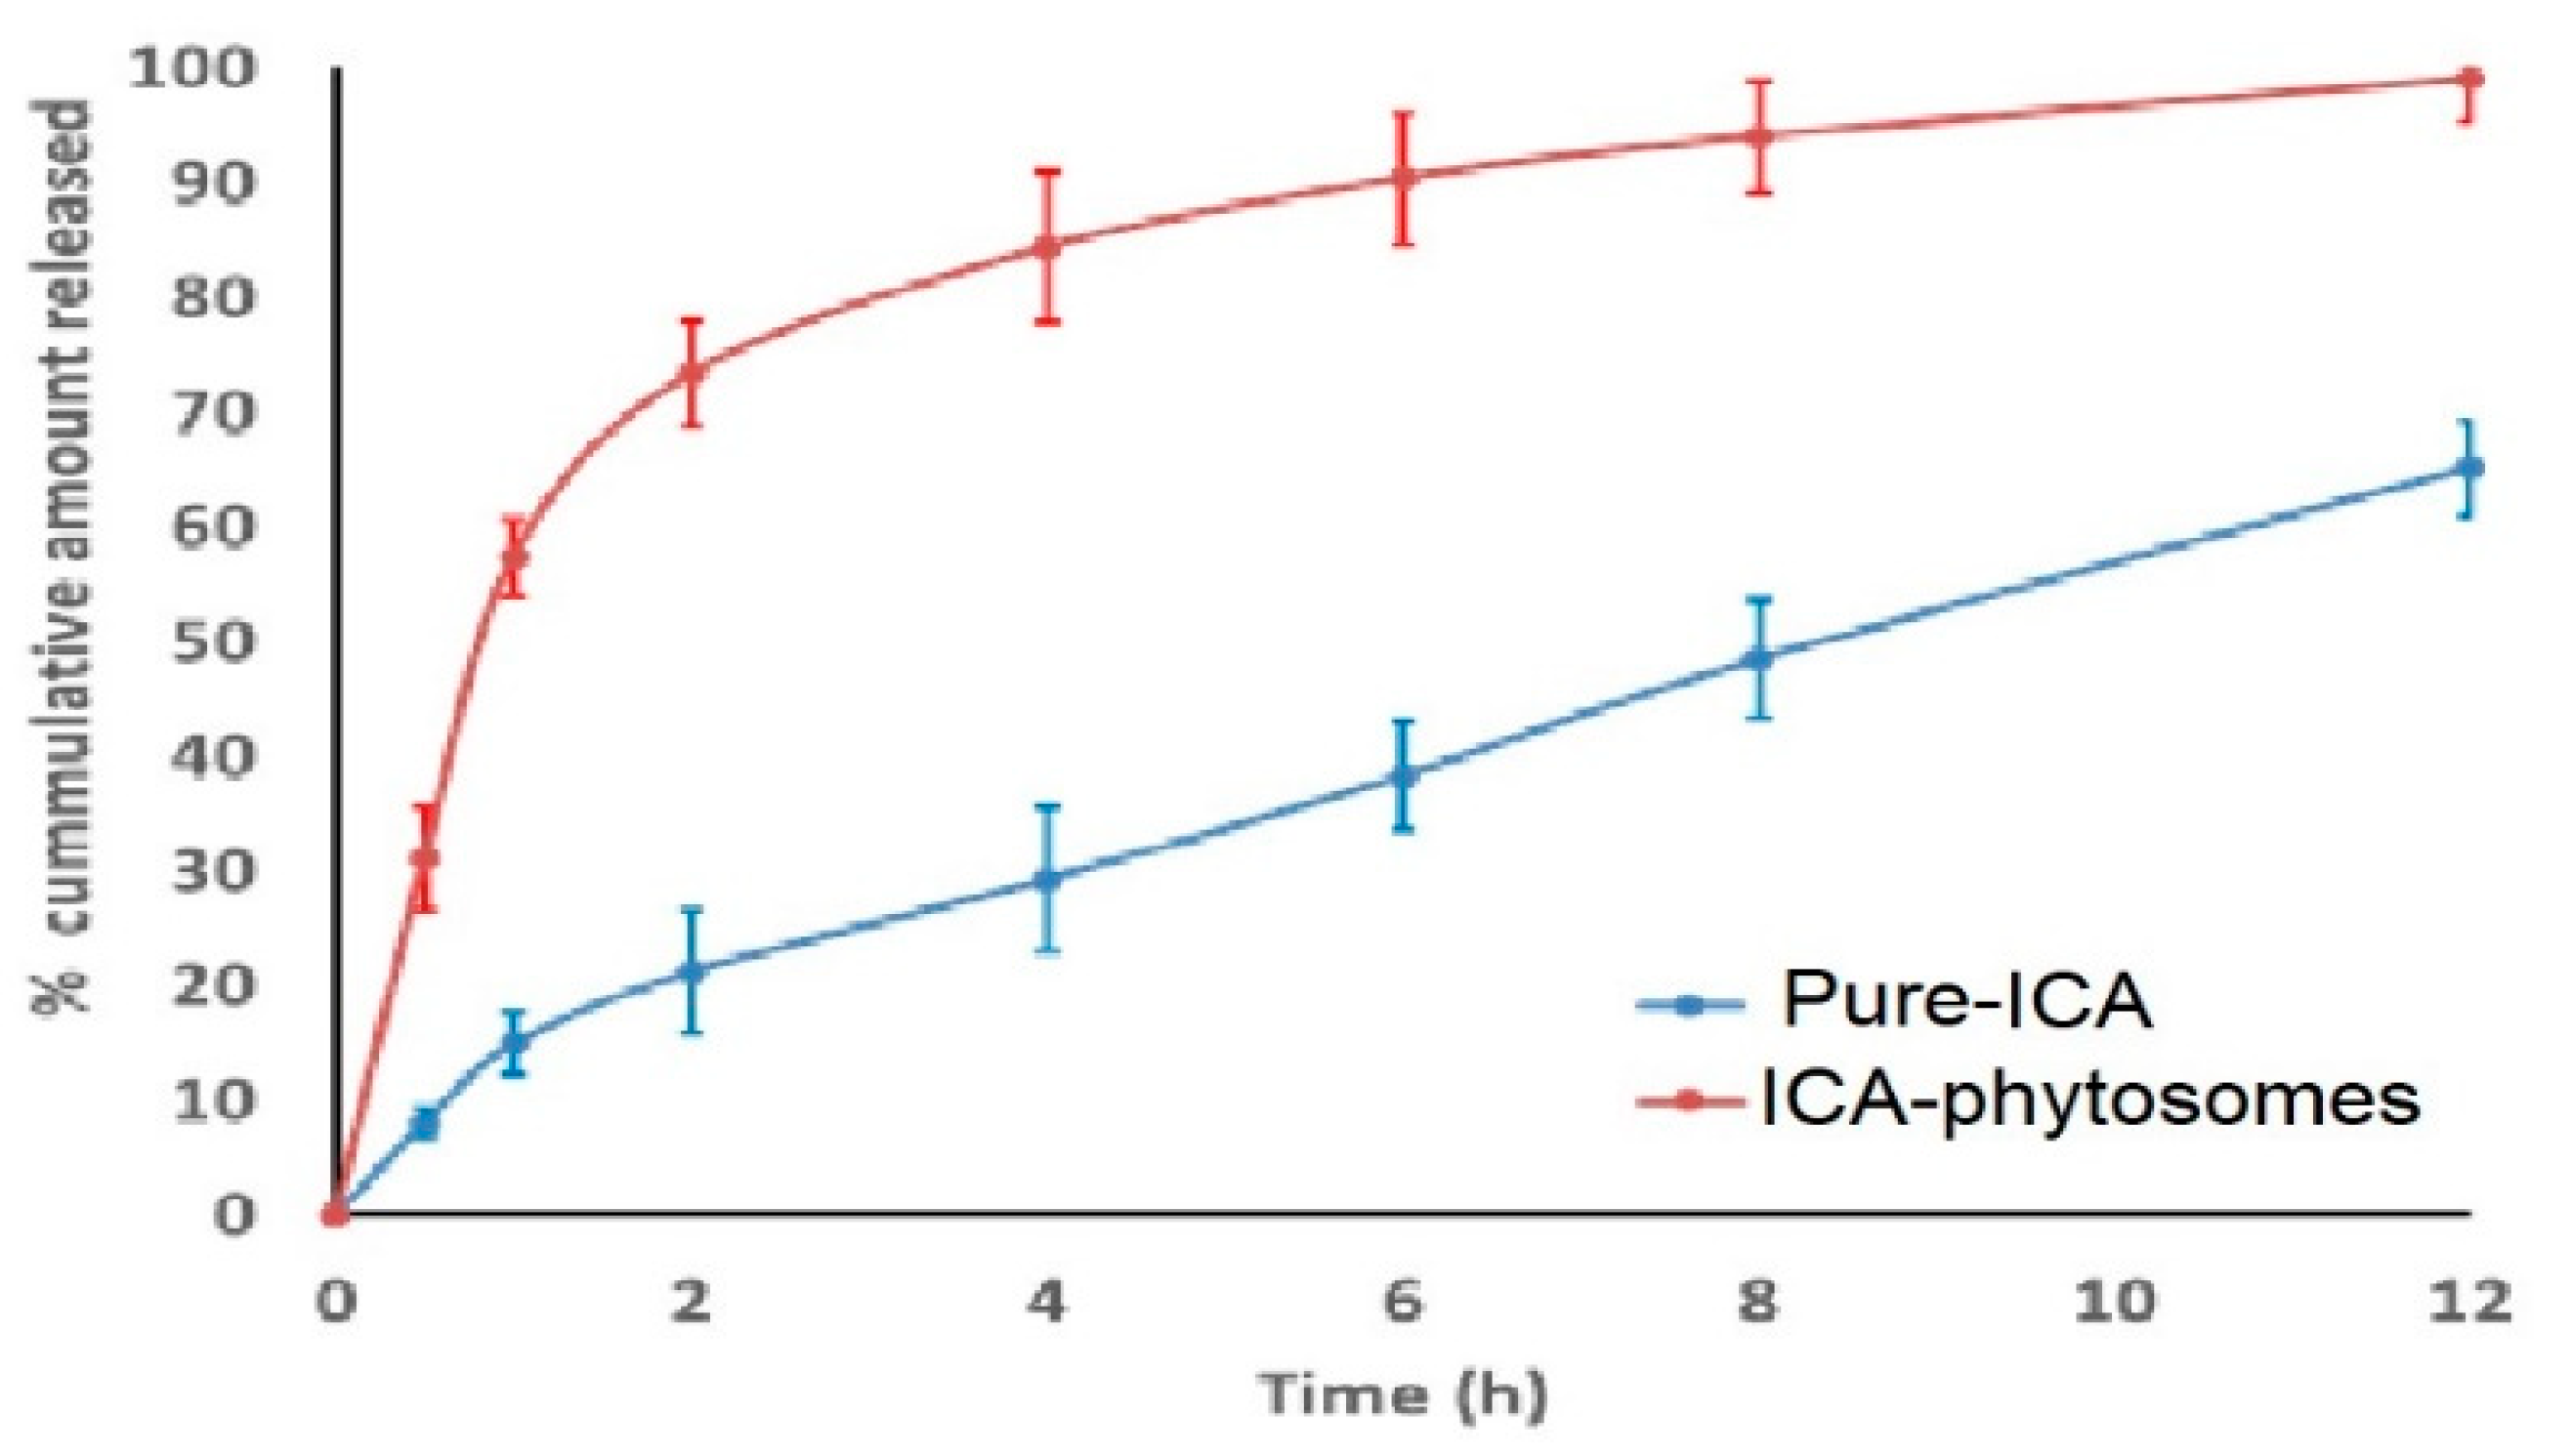
2.7. In Vitro Release

In vitro drug release of pure-ICA and ICA-phytosomes was studied using the dialysis bag technique [34]. In the dialysis bag method, pre-weighed samples of pure-ICA and ICA-phytosomes (equivalent to 1 mg ICA) were introduced separately into two pre-soaked dialysis bags (molecular weight cut-off (MWCO) of –14 KDa; Sigma-Aldrich, St. Louis, Missouri, USA). The release was performed in 100 mL of phosphate-buffered saline (PBS) buffer pH 7.4 at 37 ± 0.5 °C with continuous stirring at 100 rpm using a magnetic stirrer [35]. Samples were withdrawn at time points of 0.5, 1, 2, 4, 6, 8, and 12 h and immediately replaced with equivalent amount of fresh medium. The withdrawn samples were analyzed by HPLC for ICA content [36]. The experiment was carried out in triplicate and the results were expressed as mean ± SD. The release efficiency after 12 h (RE12h) was computed for both pure-ICA and optimized ICA-phytosomes and statistically compared using an unpaired Student’s t-test (two-tailed) at p < 0.05.

2.8. Cytotoxic Effects of Optimized ICA Phytosomes on Ovarian Cancer Cells

2.8.1. Cell Culture and Determination of IC50 using MTT Assay

Cell lines were maintained in a humidified incubator at 37 °C with 5% CO2. OVCAR-3 were cultured in Roswell Park Memorial Institute (RPMI) Medium 1640 (1×) supplemented with 10% fetal calf serum (FCS), 1X non-essential amino acids (Sigma-Aldrich, Irvine, UK), 100 µL/mL (v/v) penicillin-streptomycin, 1 mM sodium pyruvate (Sigma-Aldrich), and 1 µL/mL bovine insulin (Sigma-Aldrich). Cell lines were passaged using 0.05% trypsin- Ethylenediaminetetraacetic acid (EDTA) (1×). All experiments were carried out with cell lines no more than 10 passages apart to ensure biological repeats and limit the mutational effect of passaging. Cell lines were not synchronized prior to experimentation. For determining IC50 values, 1 × 10⁵ cells were seeded into a 96-well plate. The seeded OVCAR-3 cells were then incubated for 24 h at 37 °C in a 5% CO2 incubator. The cells were then incubated with the ICA-phytosomes, placebo-phytosomes, and pure-ICA separately for 24 h. Different samples equivalent to different concentrations of ICA ranging from 0.1 to 1000 µM were tested. IC50 values were determined using Thiazolyl Blue Tetrazolium Bromide (MTT) assay using commercially available kit (ABCAM, Cambridge, UK). The experiments were carried out in triplicate.

2.8.2. Cell Cycle Analysis

Cell cycle analysis was studied by flow cytometry experiments following reported methods [37,38]. The cells were incubated with the samples: ICA-phytosomes, pure drug, and placebo-phytosomes. A control sample with cells alone was also included in the study. The samples were incubated for 24 h. After incubation with the samples, separation of cells was carried out by centrifuging the samples. The cells were then fixed with 70% cold ethanol. The cells were again separated by centrifugation and their washing was carried out with PBS buffer. The cells were then stained using propidium iodide (in PBS buffer) and RNAse staining buffer before carrying out flow cytometry analysis.

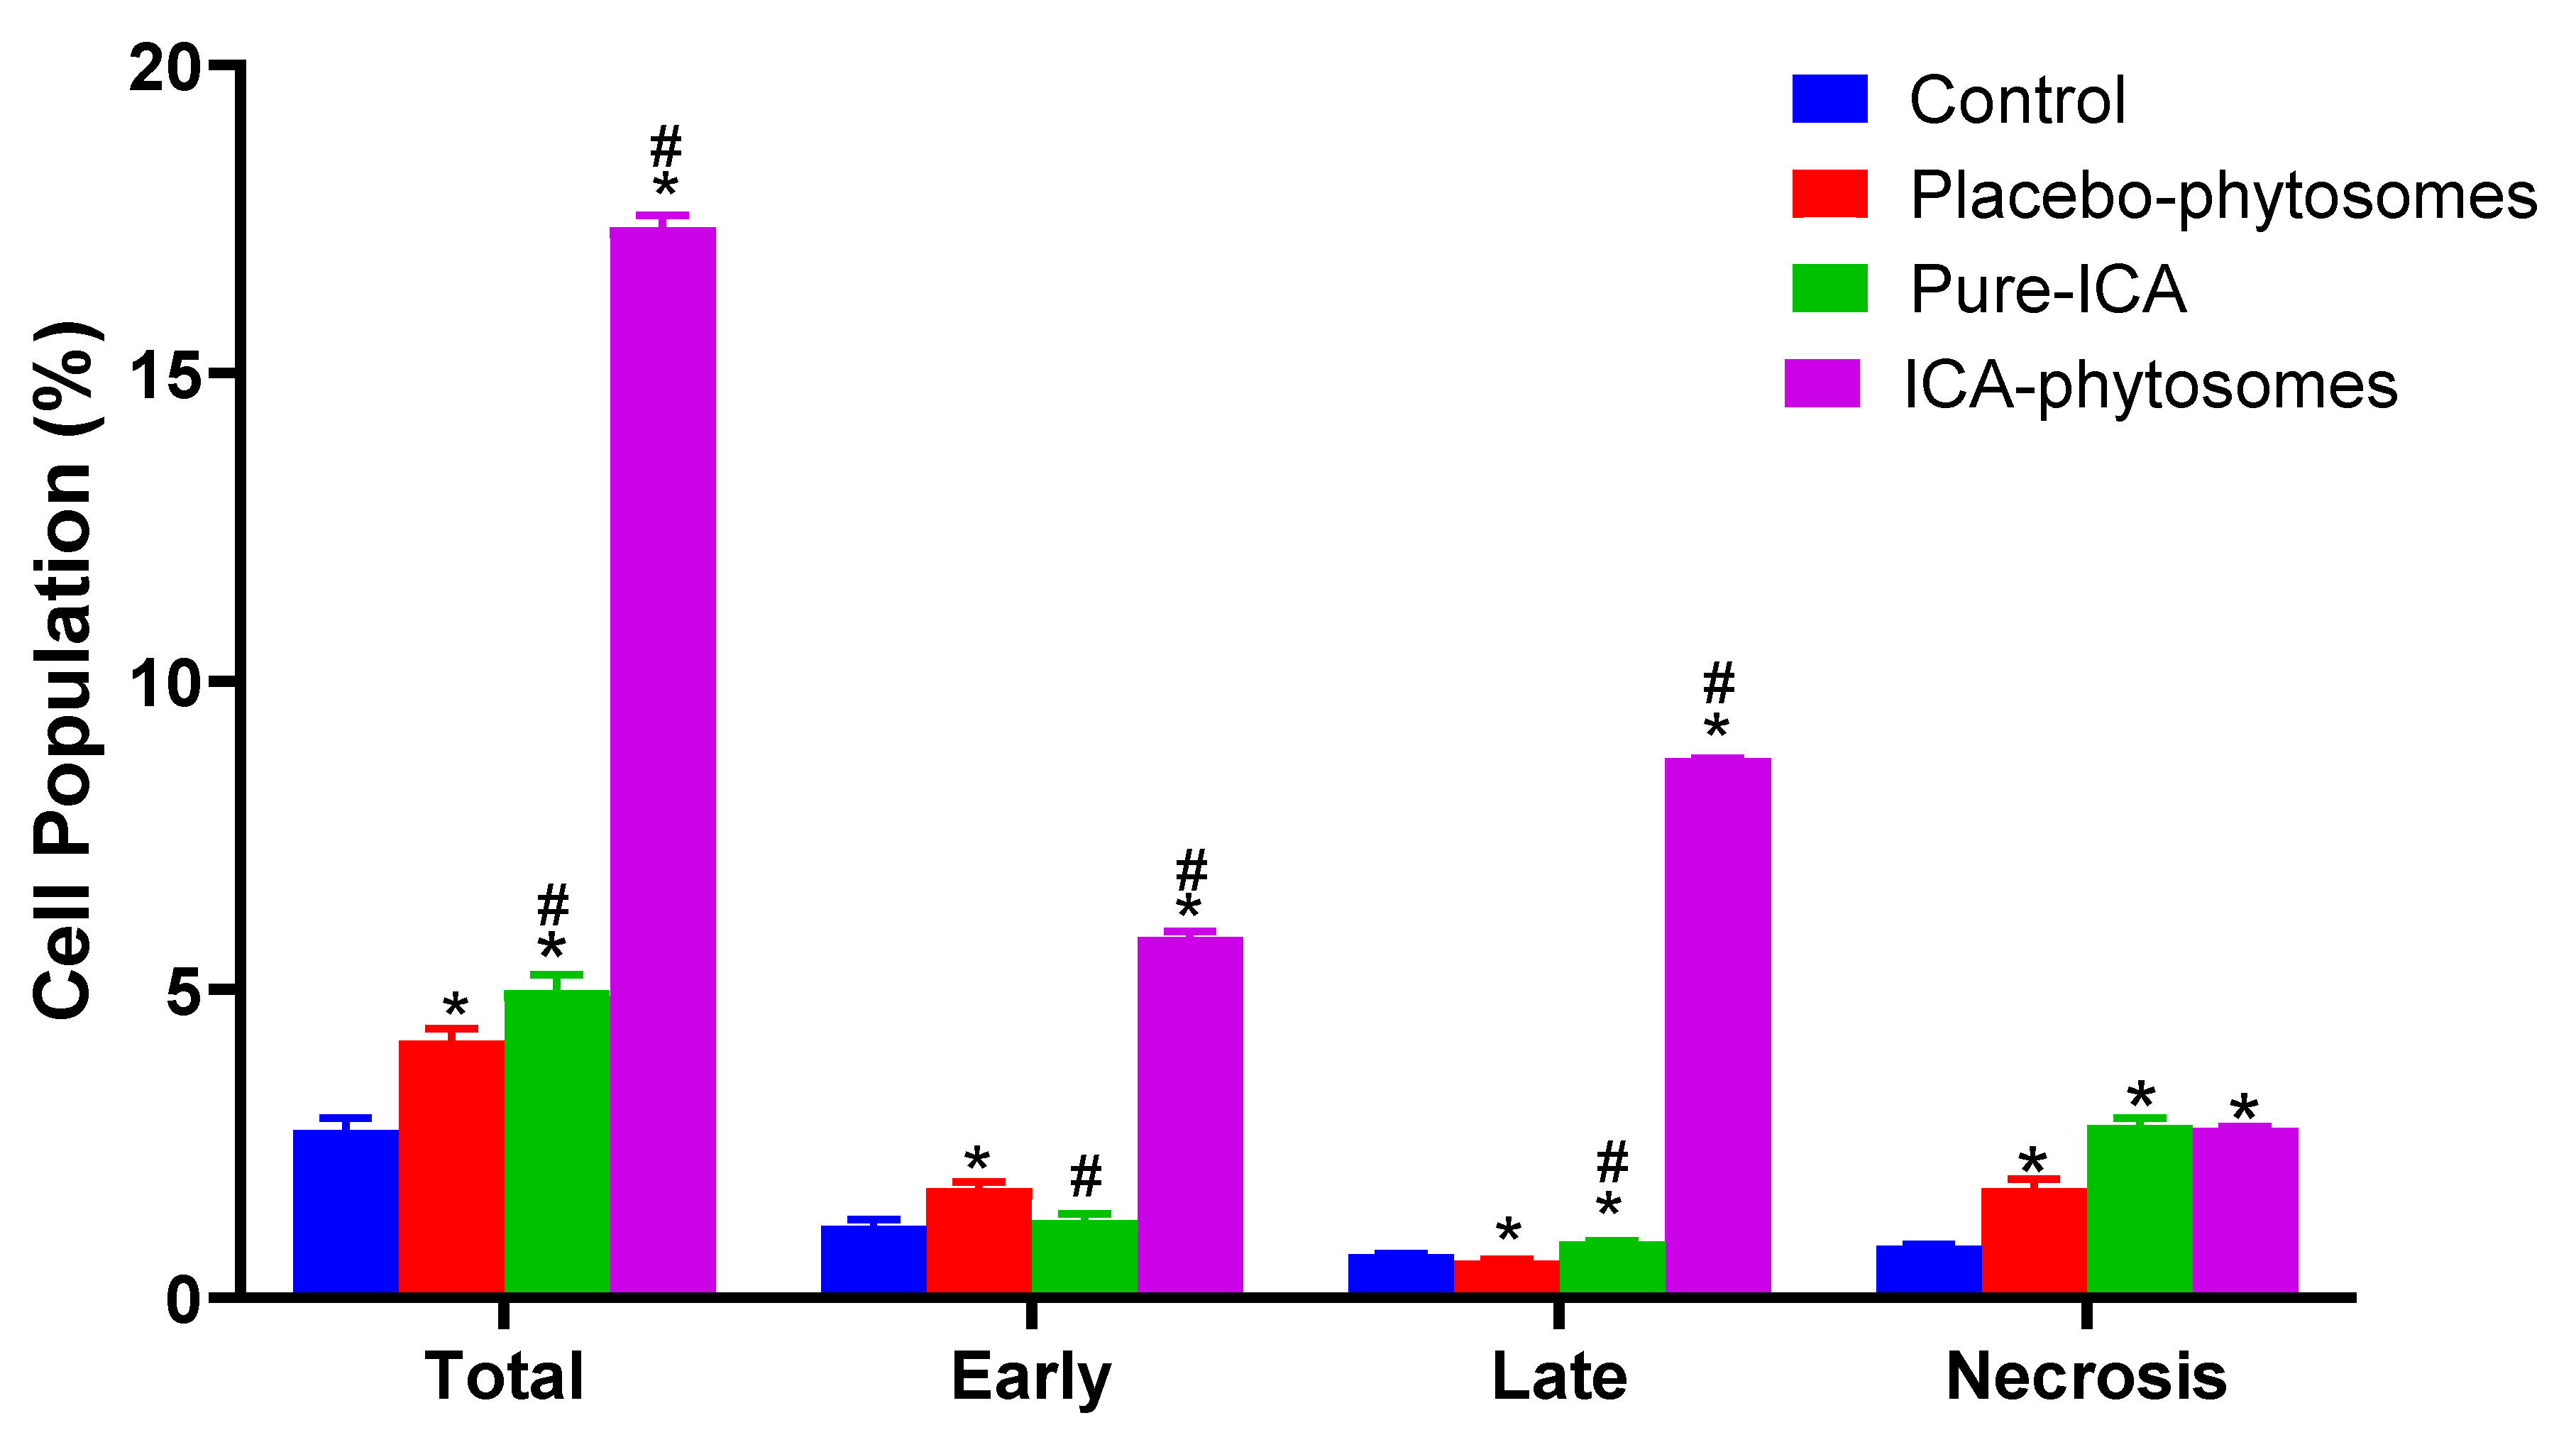
2.8.3. Annexin V Staining

The dual staining technique was performed to assess apoptosis as previously published [39]. Cells were incubated with the samples, ICA-phytosomes, pure drug, and placebo-phytosomes, in a 6-well plate with a cell density of 1 × 10⁵ cells per well. A control sample with cells alone was also included in the study. The staining was carried out using a commercially available kit (BD Bioscience, San Jose, CA, USA). After incubation for 24 h, the cells were collected by centrifugation. The cells were then resuspended in 500 μL of 1X binding buffer.
Then, 5 μL each of Annexin V- Fluorescein isothiocyanate Fluorescein FITC and propidium iodide (BD Bioscience) were added and incubated at room temperature for 5 min in the dark. Flow cytometry (FACS Calibur, BD Bioscience) was carried out for the analysis. The data were studied using Multicycle software (Phoenix Flow Systems, San Diego, CA, USA).

2.8.4. Mitochondrial Membrane Potential

In the present study, the tetramethylrhodamine methyl ester (TMRM) assay kit was used for the determination of mitochondrial membrane potential. This method uses TMRM as the probe. The cells were prepared for the assay by incubating with the samples for 24 h. ICA-phytosomes and pure drug were studied along with a control sample with cells alone. A 96-well plate with a cell density of 1 × 10⁵ OVCAR-3 cells per well was used. The working solution of TMRM was prepared and the cells were bathed with this solution after removing the medium in cells. The cells were then incubated in the dark. Finally, the TMRM solution was replaced with the live-cell imaging buffer before performing the assay using a flow cytometer [40,41].

2.8.5. Caspase-3 Assay

The caspase-3 content of the optimized ICA-phytosomes was determined using a ready-to-use kit available commercially (BD Biosciences). For evaluation of the caspase-3 activity, the OVCAR-3 cells (5 × 10⁴ cells per well) were incubated with the samples. ICA-phytosomes and pure drug were studied along with a control sample with cells alone. Caspase-3 content in the samples was determined by assessing absorbance of the cell lysate at 405 nm.

2.8.6. Reactive Oxygen Species (ROS) Determination

ROS determination was carried out in OVCAR-3 cells. A 96-well plate with a cell density of 1 × 10⁵ OVCAR-3 cells per well was used. The cells were prepared for the assay by incubating with the samples for 24 h. ICA-phytosomes and pure drug were studied along with a control sample with cells alone. The incubated cells were continuously incubated for another 30 min with 10 μM 2,7-dichlorofluorescein diacetate. After incubation, PBS buffer was used to wash the cells and the fluorescence intensity was measured using 485 nm as the excitation wavelength and 530 nm as the emission wavelength using a microplate reader [42].

2.8.7. Statistical Analysis

Data are presented as the mean ± SD. Statistical tests were carried out using IBM SPSS® statistics software, version 25 (SPSS Inc., Chicago, IL, USA). Analysis of variance (ANOVA) followed by Tukey’s post hoc test were used to compare means. p < 0.05 indicated statistical significance.

3. Results

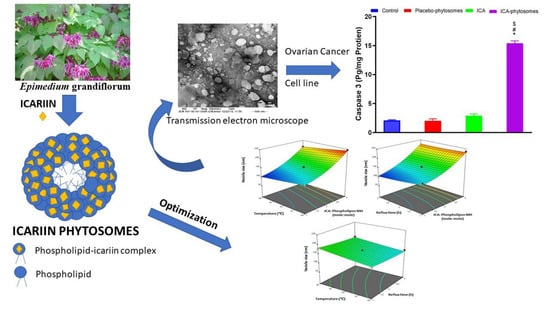
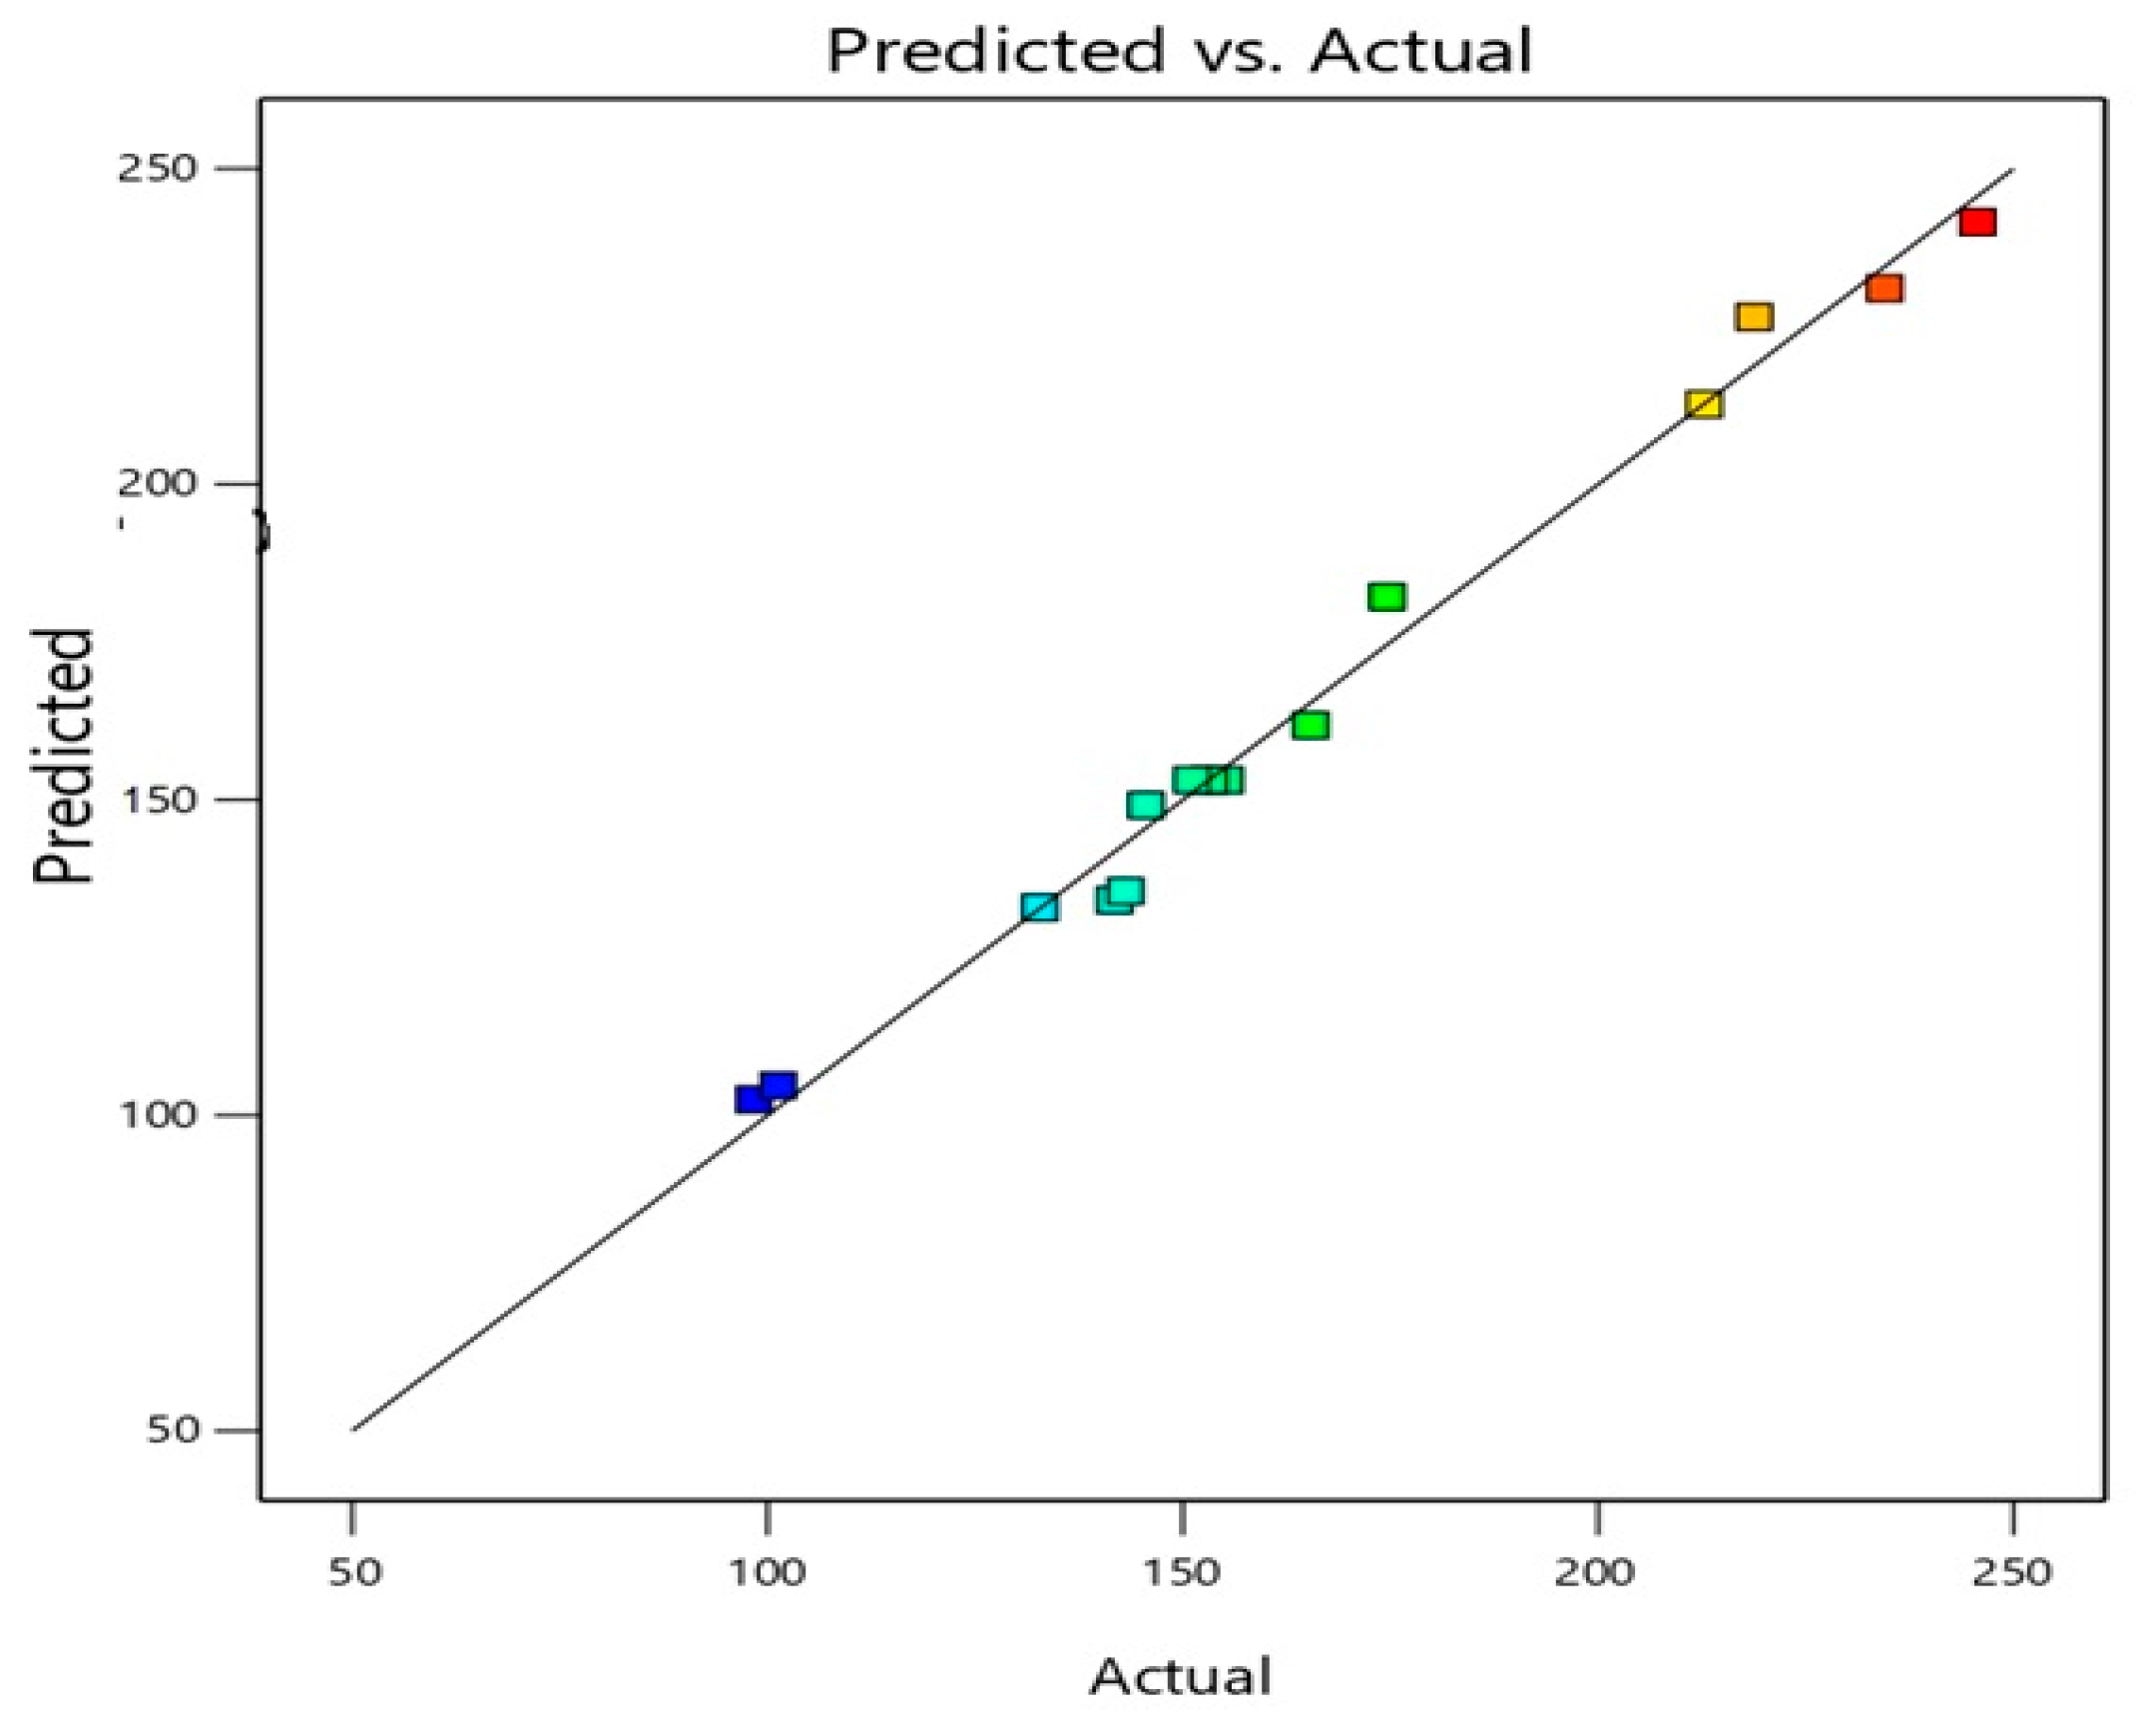
3.1. ICA Phytosomes Optimization

The data in Table 3 and Figure 1 illustrate the observed (actual) versus predicted values of the vesicle size of different experimental runs. It can be noted that the observed and predicted values are similar (Figure 1). This further validates the selected design model and its possible useful application in predicting the optimized formula with the desired criteria.

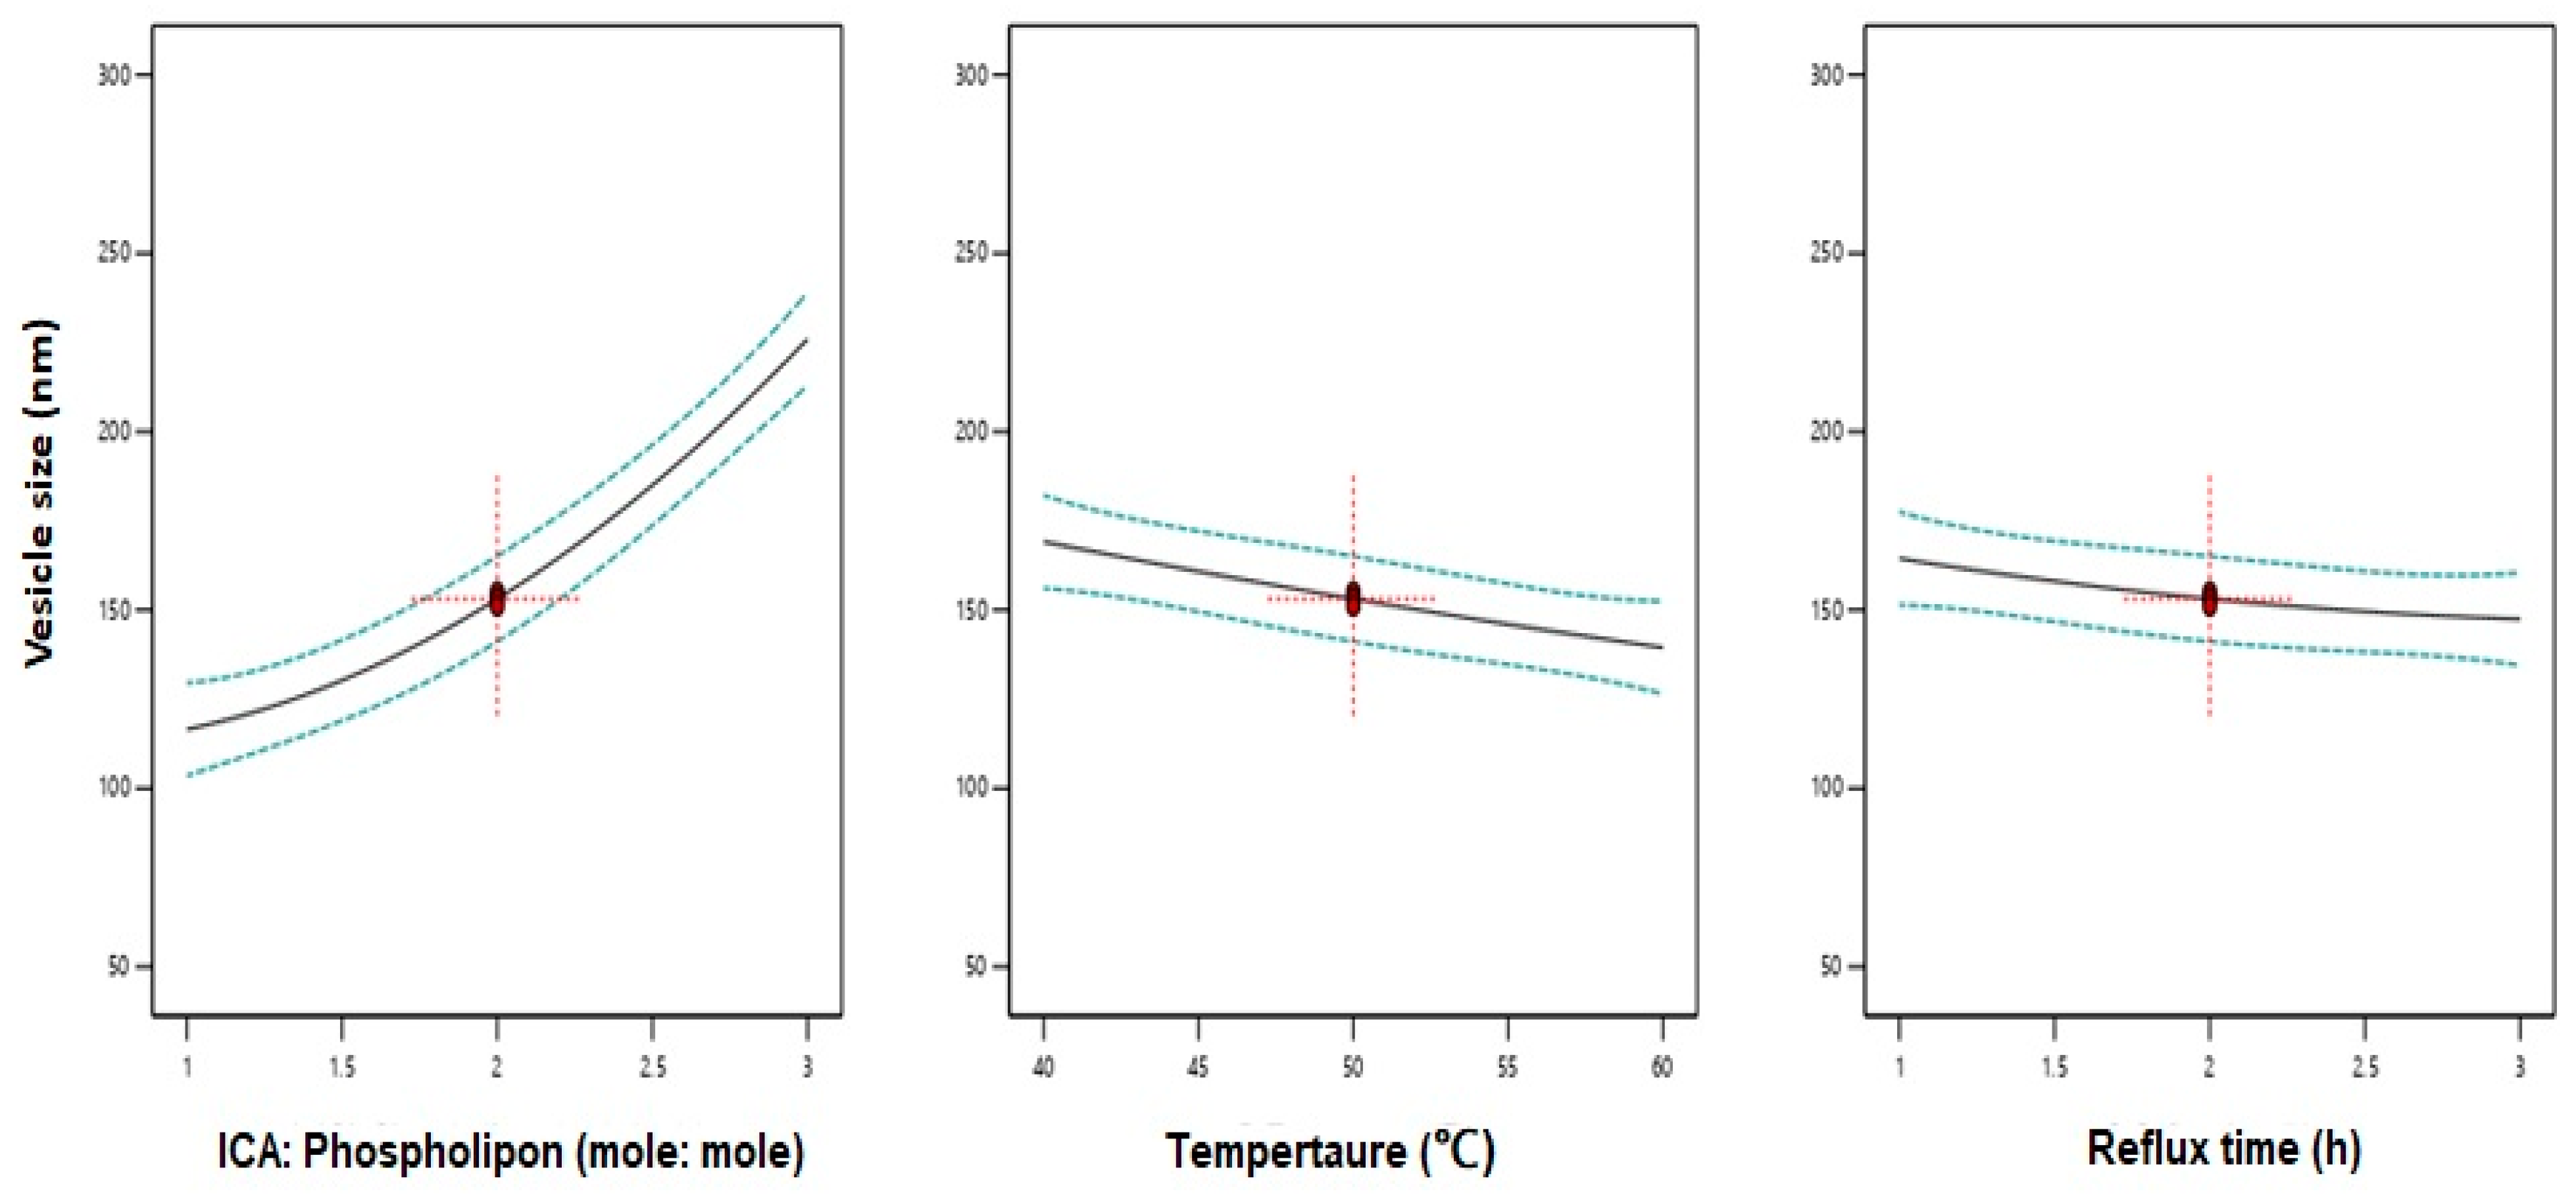
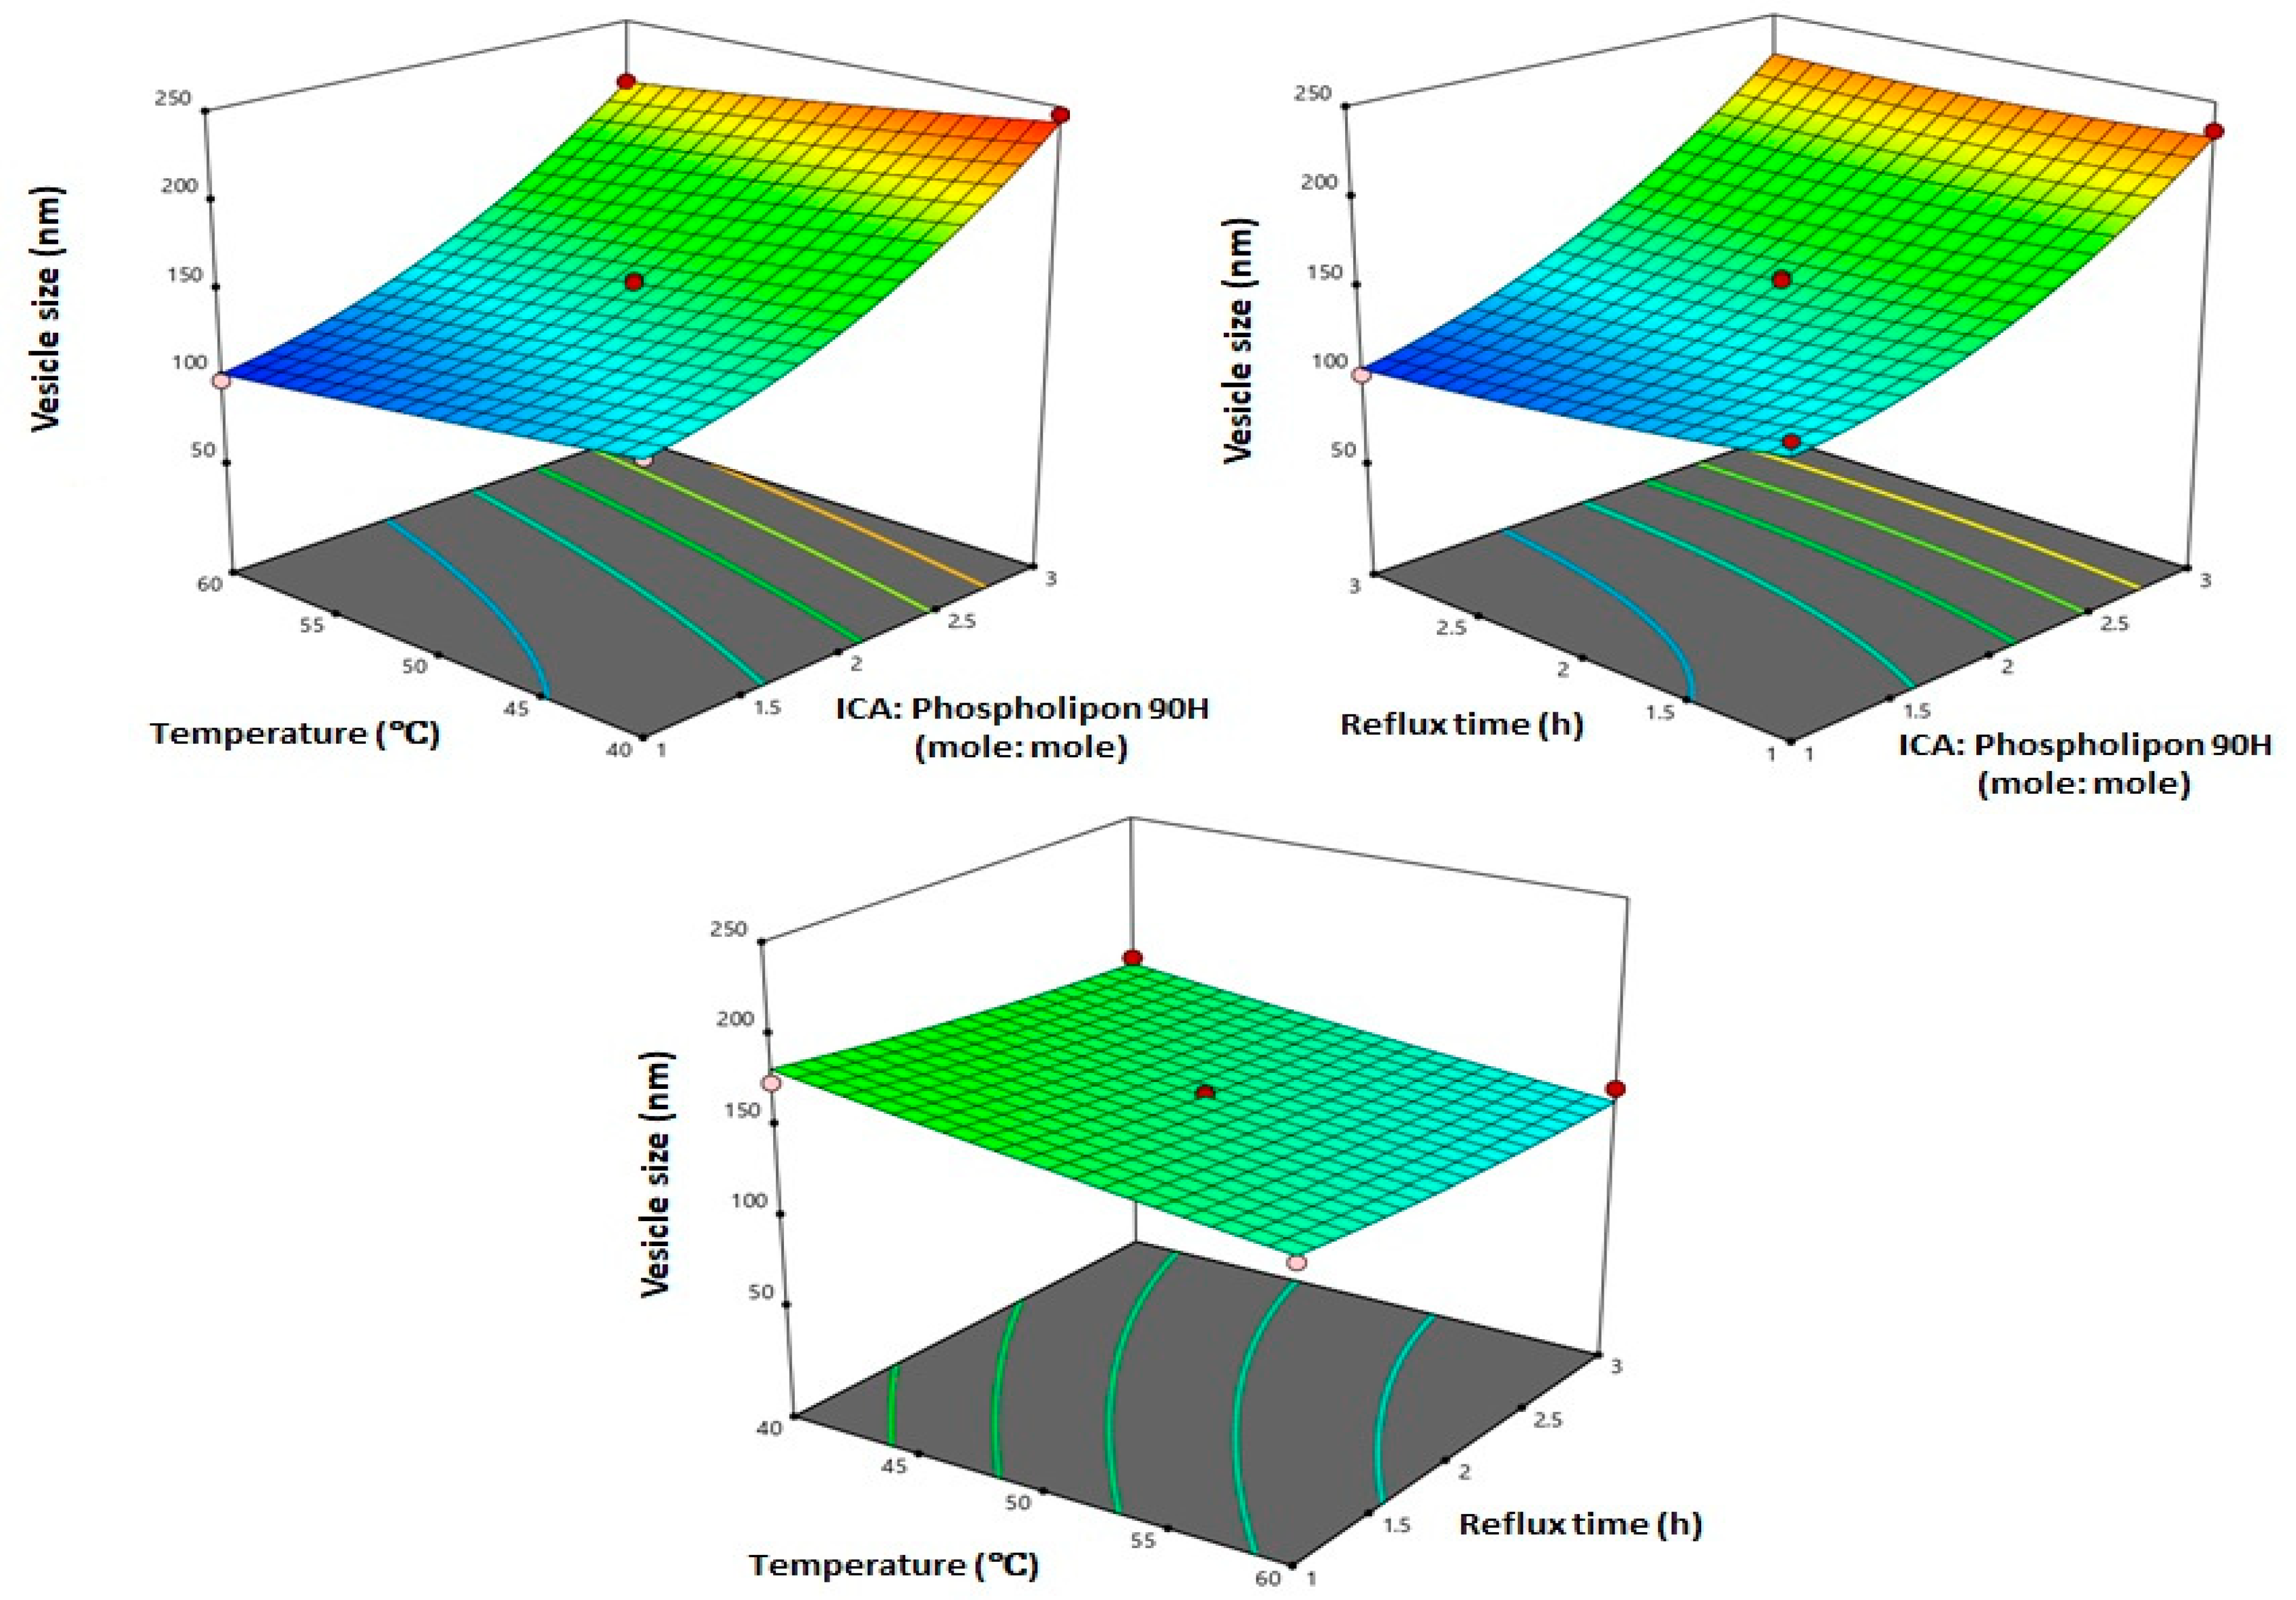
3.2. Influence of Variables on Vesicle Size

Vesicle size below 200 nm is considered suitable for a prolonged effect after intravenous administration [43,44]. The prepared ICA-phytosomes exhibited nano vesicular size ranging from 98.4 ± 3.2 to 245.7 ± 9.8 nm. The polynomial equation giving the sequential model in terms of coded factors is given as follows:
Y = +153.13 + 54.69X1 – 14.83X2 – 8.49X3 + 0.375X1X2 + 6.20X1X3 + 1.67X2X3 + 18.11X12 + 1.18X22 + 2.86X32
Data analysis using ANOVA showed a significant effect of the linear terms X1 (ICA:Phospholipon® 90H), X2 (temperature), and X3 (reflux time) on the vesicle size at p < 0.05 (Table 3). In addition, the quadratic term X12 corresponding to ICA:Phospholipon® 90H molar ratio was significant at the same significance level. Figure 2 shows the effects of the independent variables on the vesicle size. A negative slope was observed for both variables X2 and X3 indicating an inverse relationship between the variable and the response. A positive slope was observed for the variable X1 confirming that a higher ICA to phospholipid molar ratio causes an increase in the vesicle size. The positive sign of the linear term X1 and the negative sign of the linear terms X1 and X3 confirms the observed trend.
Three-dimensional (3D) response surface plots for the effect of the investigated variables on the vesicle size (Figure 3) illustrate that ICA:Phospholipon® 90H molar ratio exhibited the most significant effect on vesicle size. This observation is supported by the highest coefficient of the term X1 in the generated equation. The observed increase in vesicle size with increasing ICA:Phospholipon® 90H molar ratio could be attributed to increasing phospholipid content of the phytosomes. Various other vesicular formulations gave similar results. Dubey et al. [45] reported positive effect of Phospholipon® (PL) % on the vesicle size of ethosomes loaded with an anti-psoriatic agent. In a previous study [46] it was reported that there was an increase in the vesicle size of avanafil invasomes with increasing Phospholipon concentration. In general, the results observed in our study were very much consistent with previously reported vesicular systems [47].

3.3. Optimization of ICA Phytosomes

Design Expert software® was utilized to predict the composition optimized formulation by numerical optimization based on the goal of minimizing particle size. The composition of the optimized ICA-phytosomes is presented in Table 4. The measured vesicle size was similar to the predicted value with % error of 6.01% confirming the suitability of the design for the optimization process.

3.4. In Vitro Characterization of Optimized ICA Phytosomes

3.4.1. Transmission Electron Microscopy

TEM micrographs of phytosomes (Figure 4a) further confirmed the particle size analysis result obtained by the dynamic light scattering technique. The particles appeared nearly spherical in shape. TEM images show some sort of aggregation of the phytosomes that could be attributed to the relatively low zeta potential value of −5.6 mV; the generally accepted value of ±30 mV is required for a stable system [48]. Successful phytosomal systems with low values for zeta potential were previously described [49]. In Figure 4b, placebo-phytosomes provide evidence of vesicle formation, displaying a uniform, spherical shape with smooth outer surfaces and with little or no signs of agglomeration.

3.4.2. Fourier-Transform Infrared (FTIR) Spectroscopy

As represented in Figure 5, ICA showed a characteristic broad bond between 3000 and 3500 cm−1 due to the polyhydroxy structure, while this was slightly polished in the formula at the same region. Phospholipon® 90H, showed a sharp peak before 3000, which dramatically decreased in intensity, which indicates the engagement of the function groups of ICA and Phospholipon® 90H together in the prepared phytosomes.

3.4.3. In Vitro Release

The in vitro dissolution profile of pure-ICA and optimized ICA-phytosomes is shown in Figure 6. It was evident that phytosomes could enhance the dissolution of ICA. Although a burst release of ICA was observed in both profiles, the release was much higher from the phytosomes formulation. After 2 h, around 70% of ICA was released from phytosomes, whereas the release of the pure drug was around 20% only. Thus, at 2 h, the drug release was more than double from the phytosomes as compared to the pure drug. At the end of 12 h, ICA release was almost complete from phytosomes compared to pure-ICA release of only 65%.

3.5. Cytotoxic Activity

3.5.1. Determination of IC50 Values

The IC50 values obtained for the samples are shown in Table 5. ICA-phytosomes had the least IC50 value which amounted to 6.31 µM, whereas pure-ICA had an IC50 value of 13.1 ± 4.0 µM. Thus, there was a reduction to about half of the IC50 value of ICA when loaded in the phytosome.

3.5.2. Cell Cycle Analysis

The results of cell cycle analysis are shown in Figure 7. A significant difference in the cell cycle was observed. From the observations, the ICA-phytosome was found to perform as expected. There was no significant effect of the ICA-phytosome on the G0-G1 phase. The percent of cells in the G2-M phase showed marked enhancement on incubation with ICA-phytosomes. These effects were more significant than other samples. A similar effect was observed with pre-G1 apoptosis (Figure S1, Supplementary Materials).

3.5.3. Annexin V staining

Annexin V-FITC apoptosis detection kit was used to study the apoptosis determination by flow cytometry. Figure 8 shows that ICA-phytosomes exhibited a distinct and much higher early, late, and total cell apoptosis as well as necrotic cell death when compared with other treatments (Figure S2, Supplementary Materials).

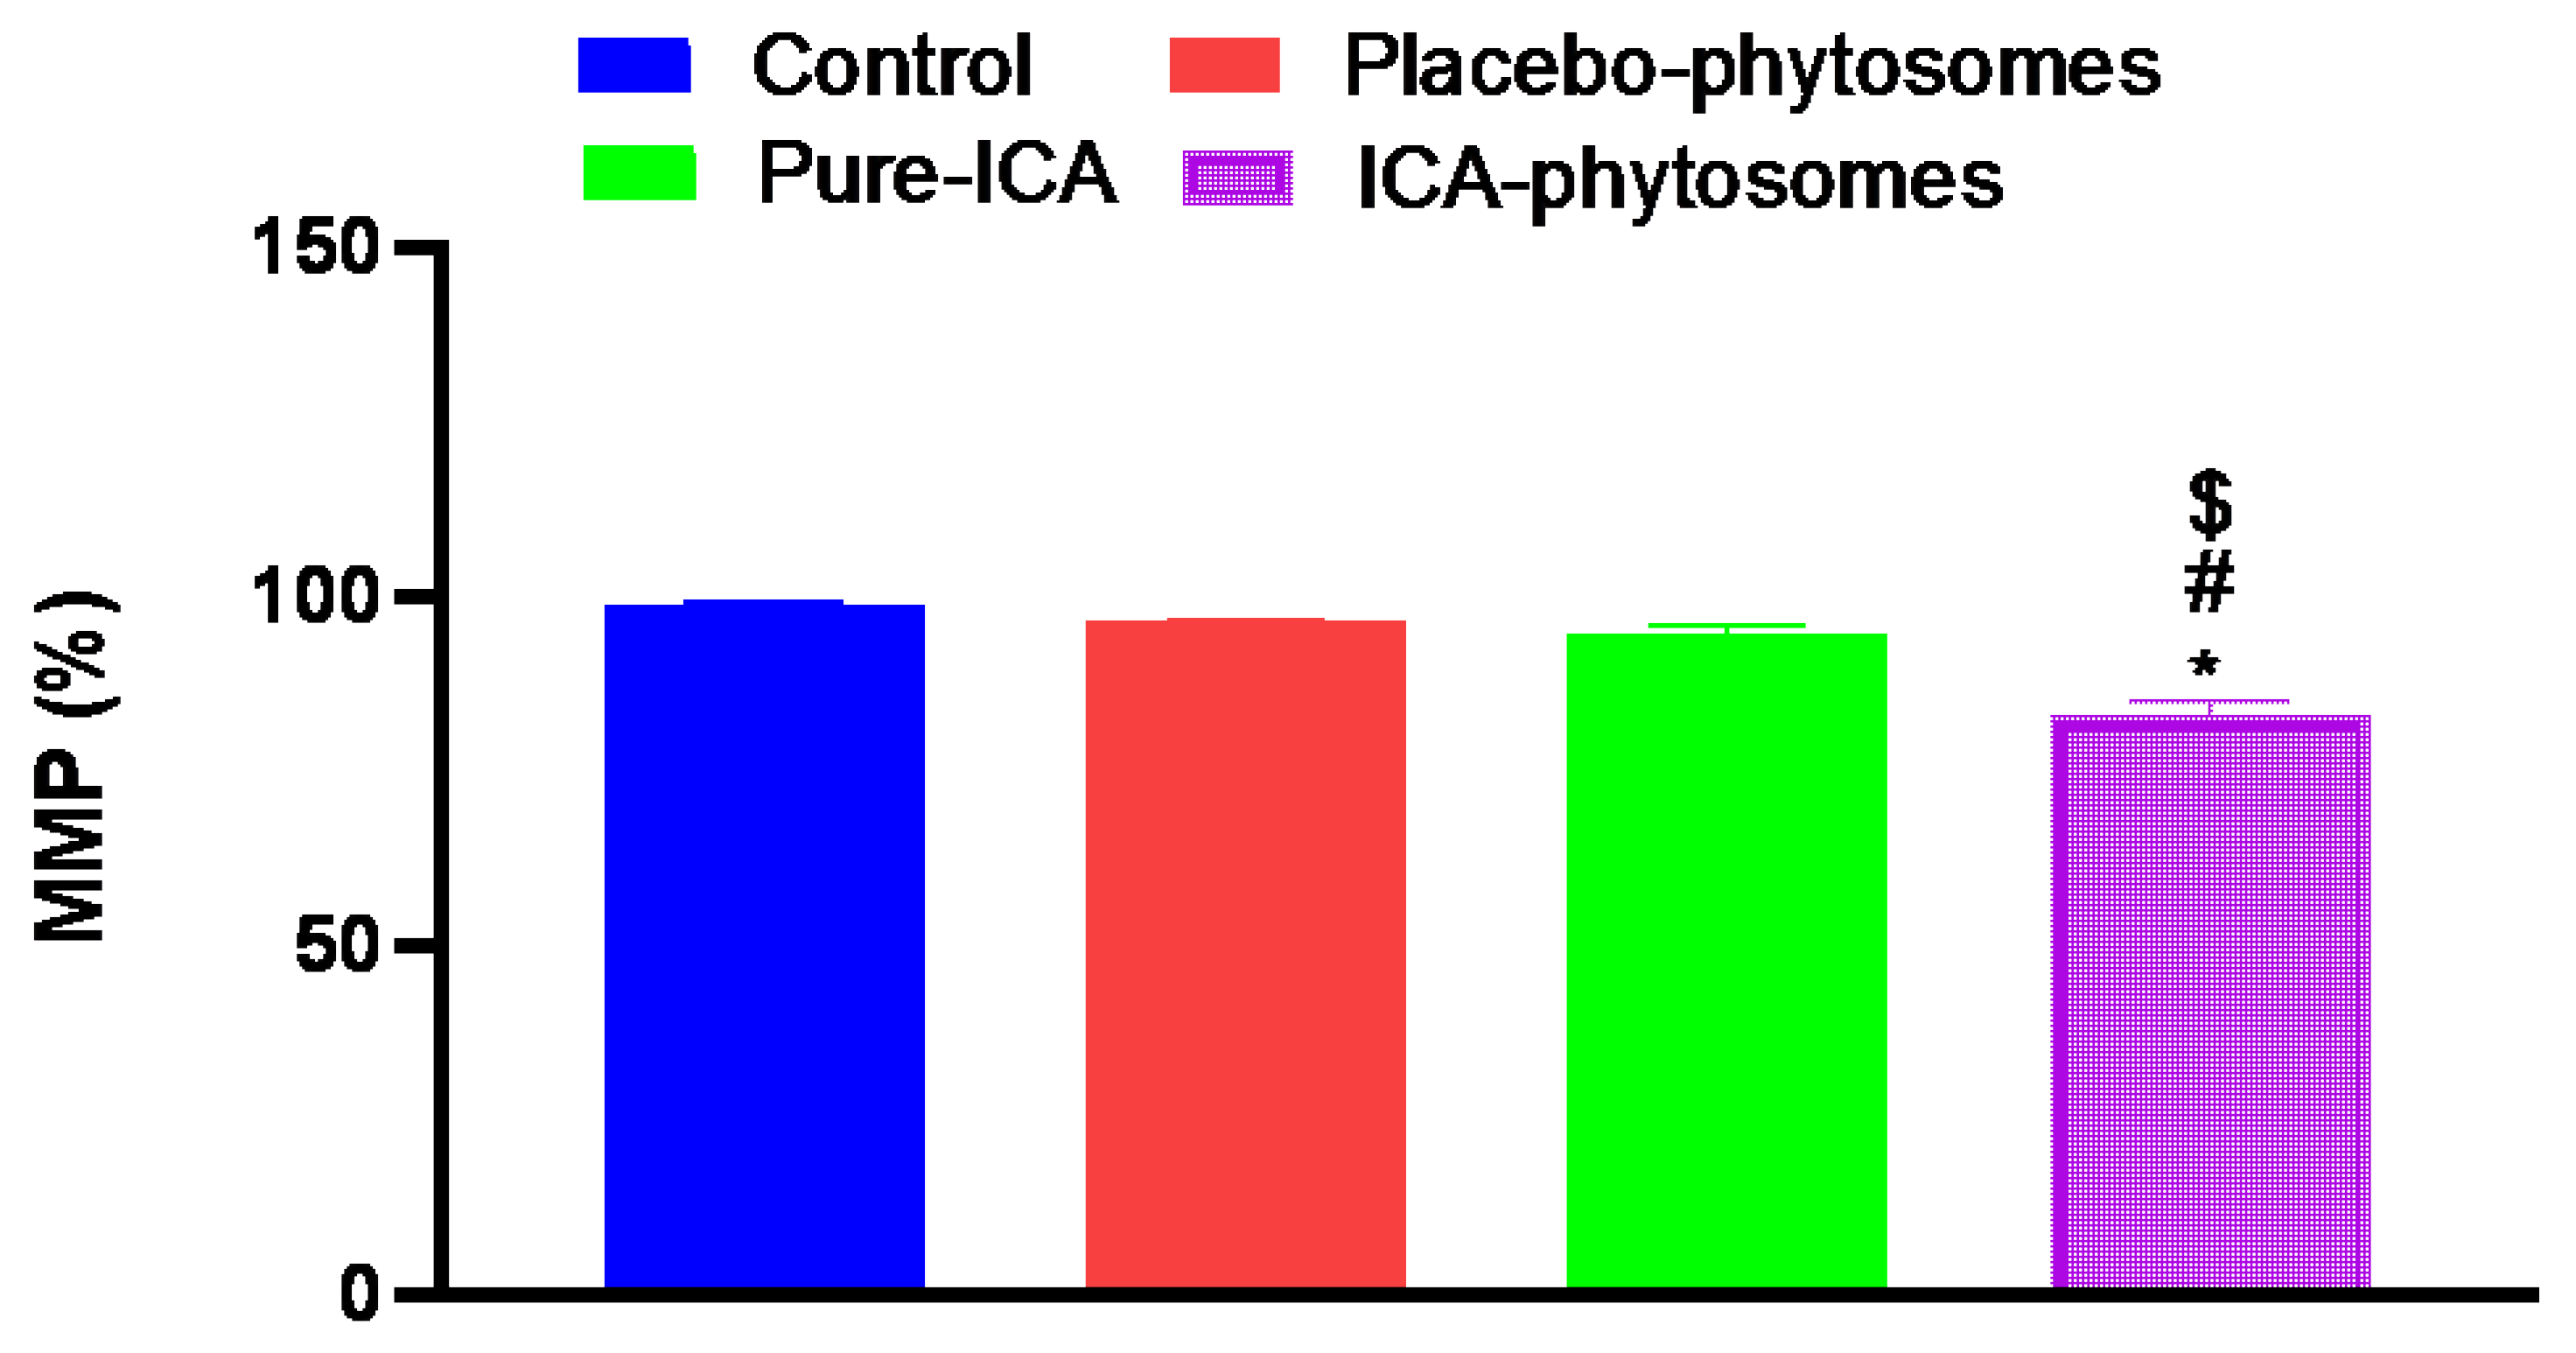
3.5.4. Mitochondrial Membrane Potential (MMP)

Figure 9 shows that change in MMP was only significant in the cells exposed to ICA-phytosomes. MMP was significantly reduced by 15% of the control value. Neither placebo-phytosomes nor pure-ICA were able to induce detectable alterations in MMP as compared to controlled incubations.

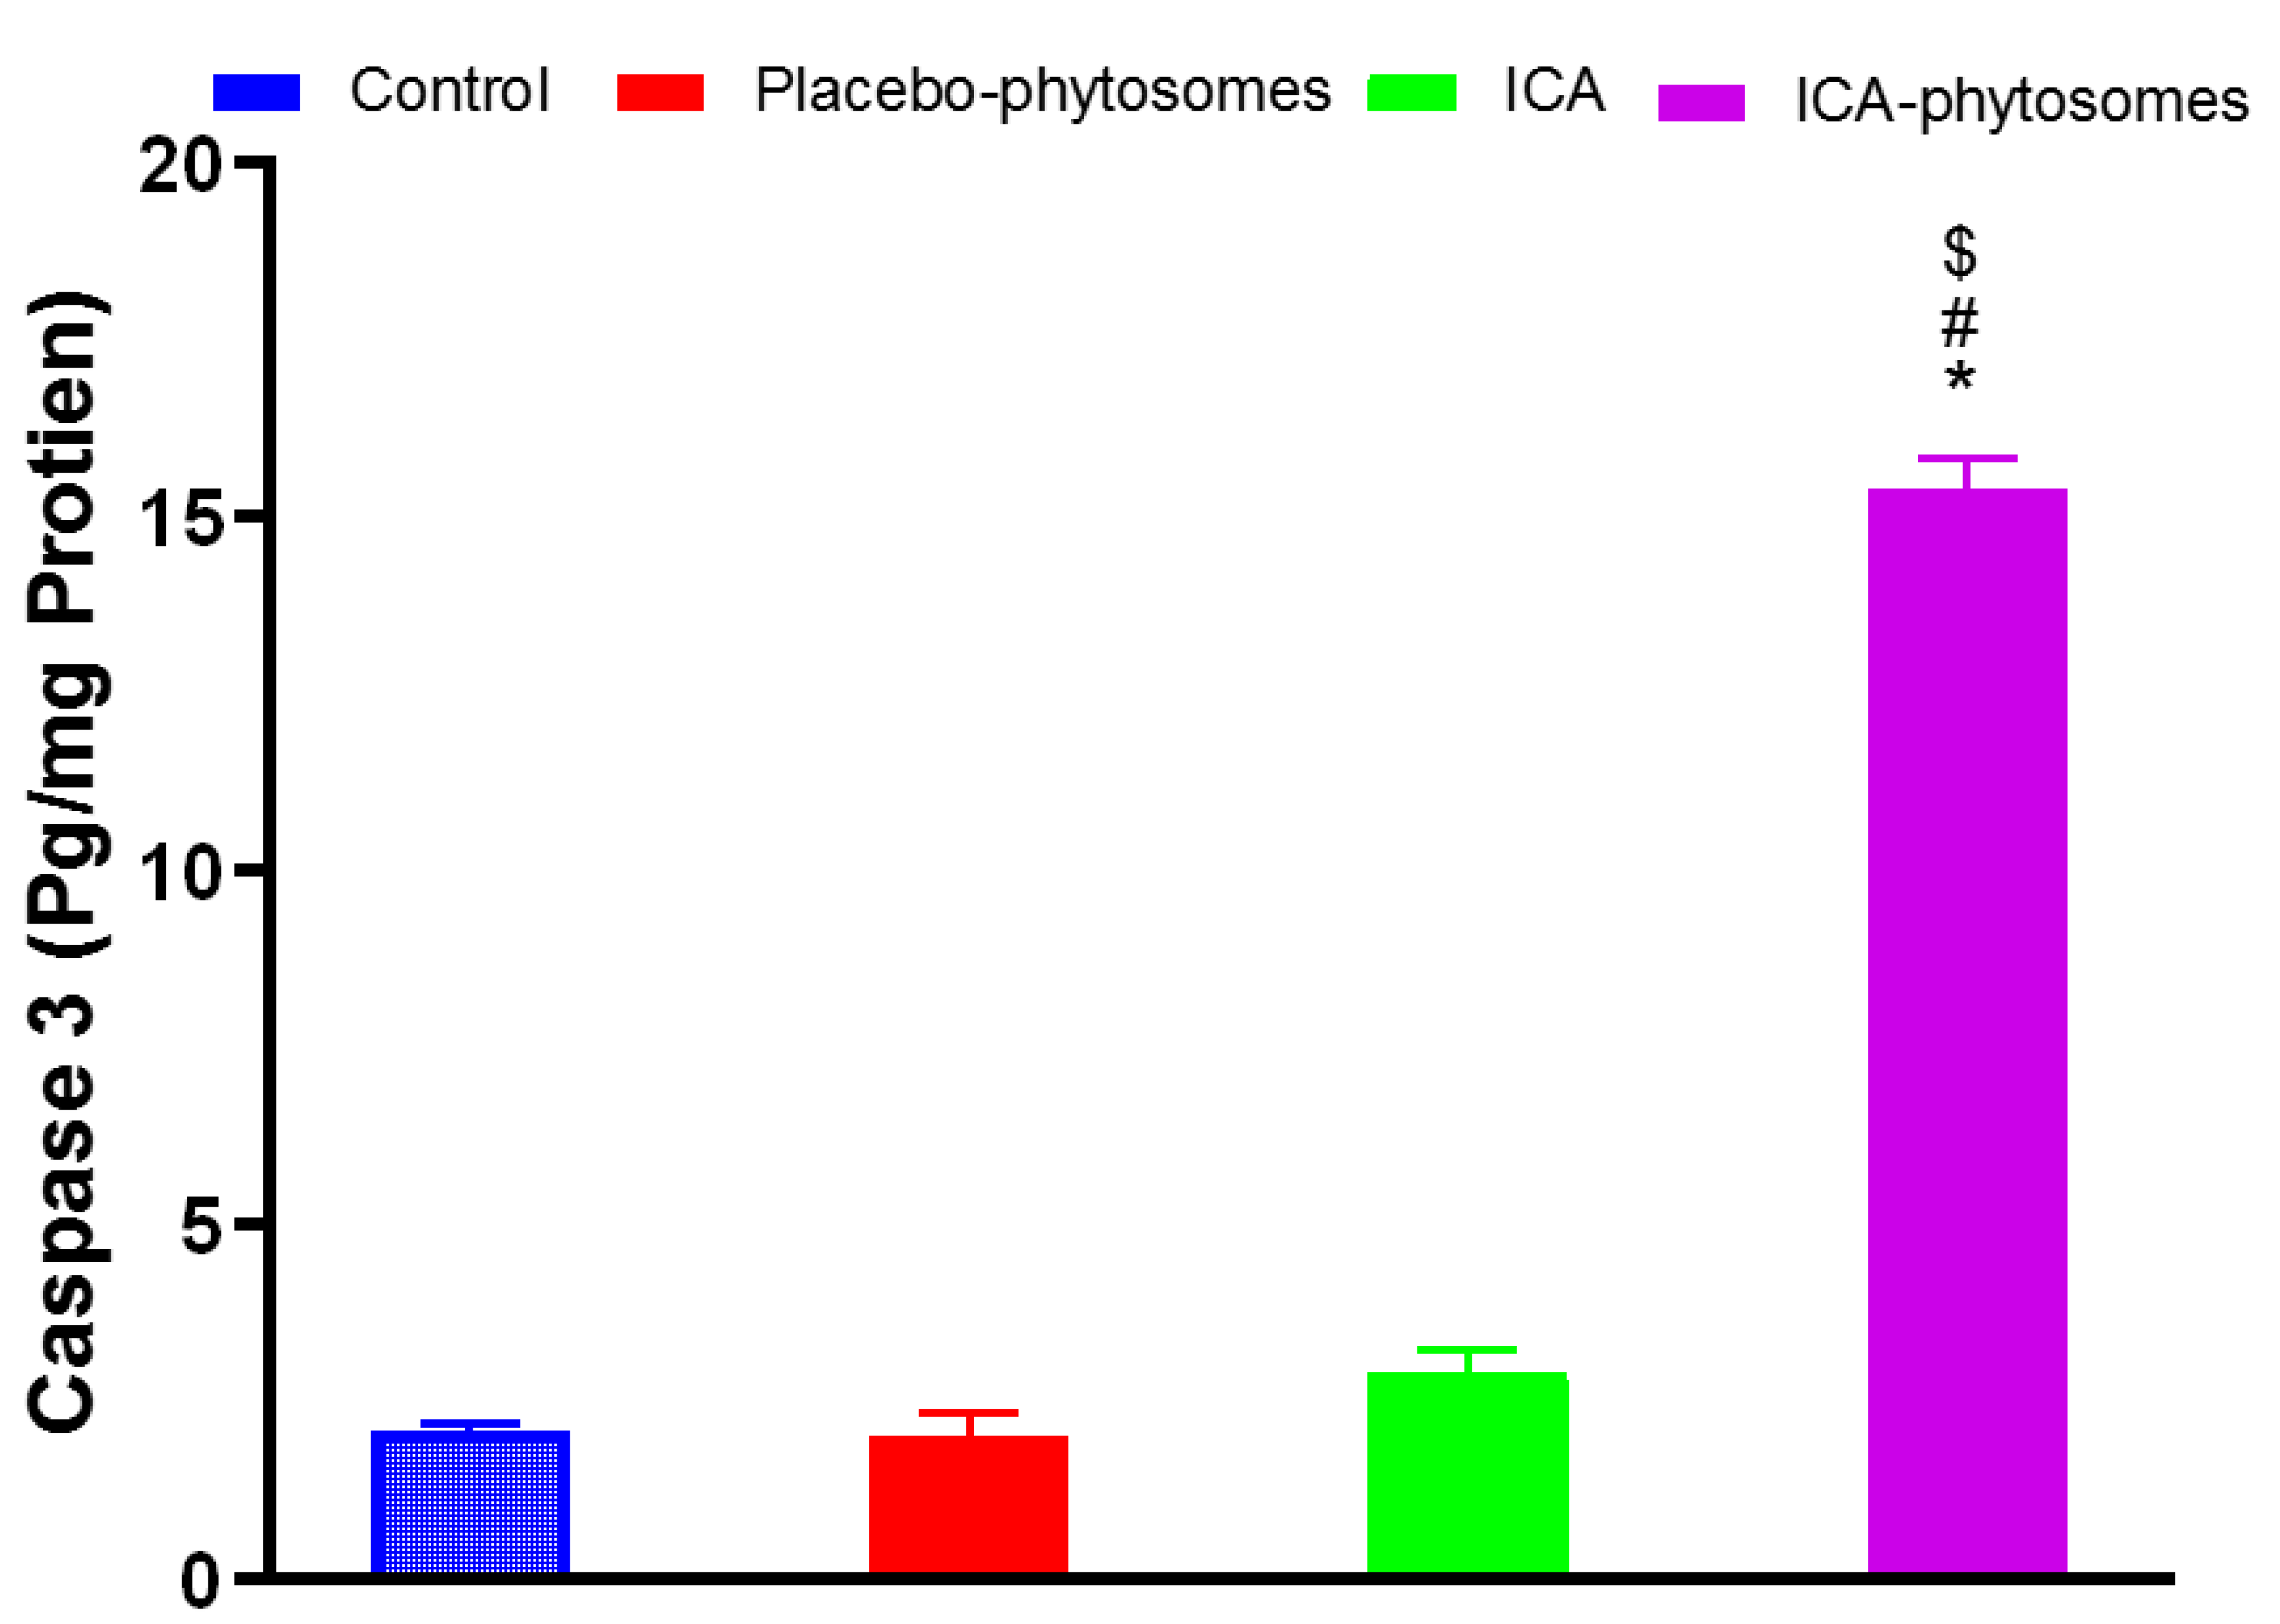
3.5.5. Caspase-3 Assay

The data in Figure 10 indicate that ICA-phytosomes caused a significant enhancement in caspase-3 content amounting to an approximately four-fold increase from that of the pure-ICA-treated cells. Placebo-phytosomes did not induce any changes in caspase-3 content as compared to control value.

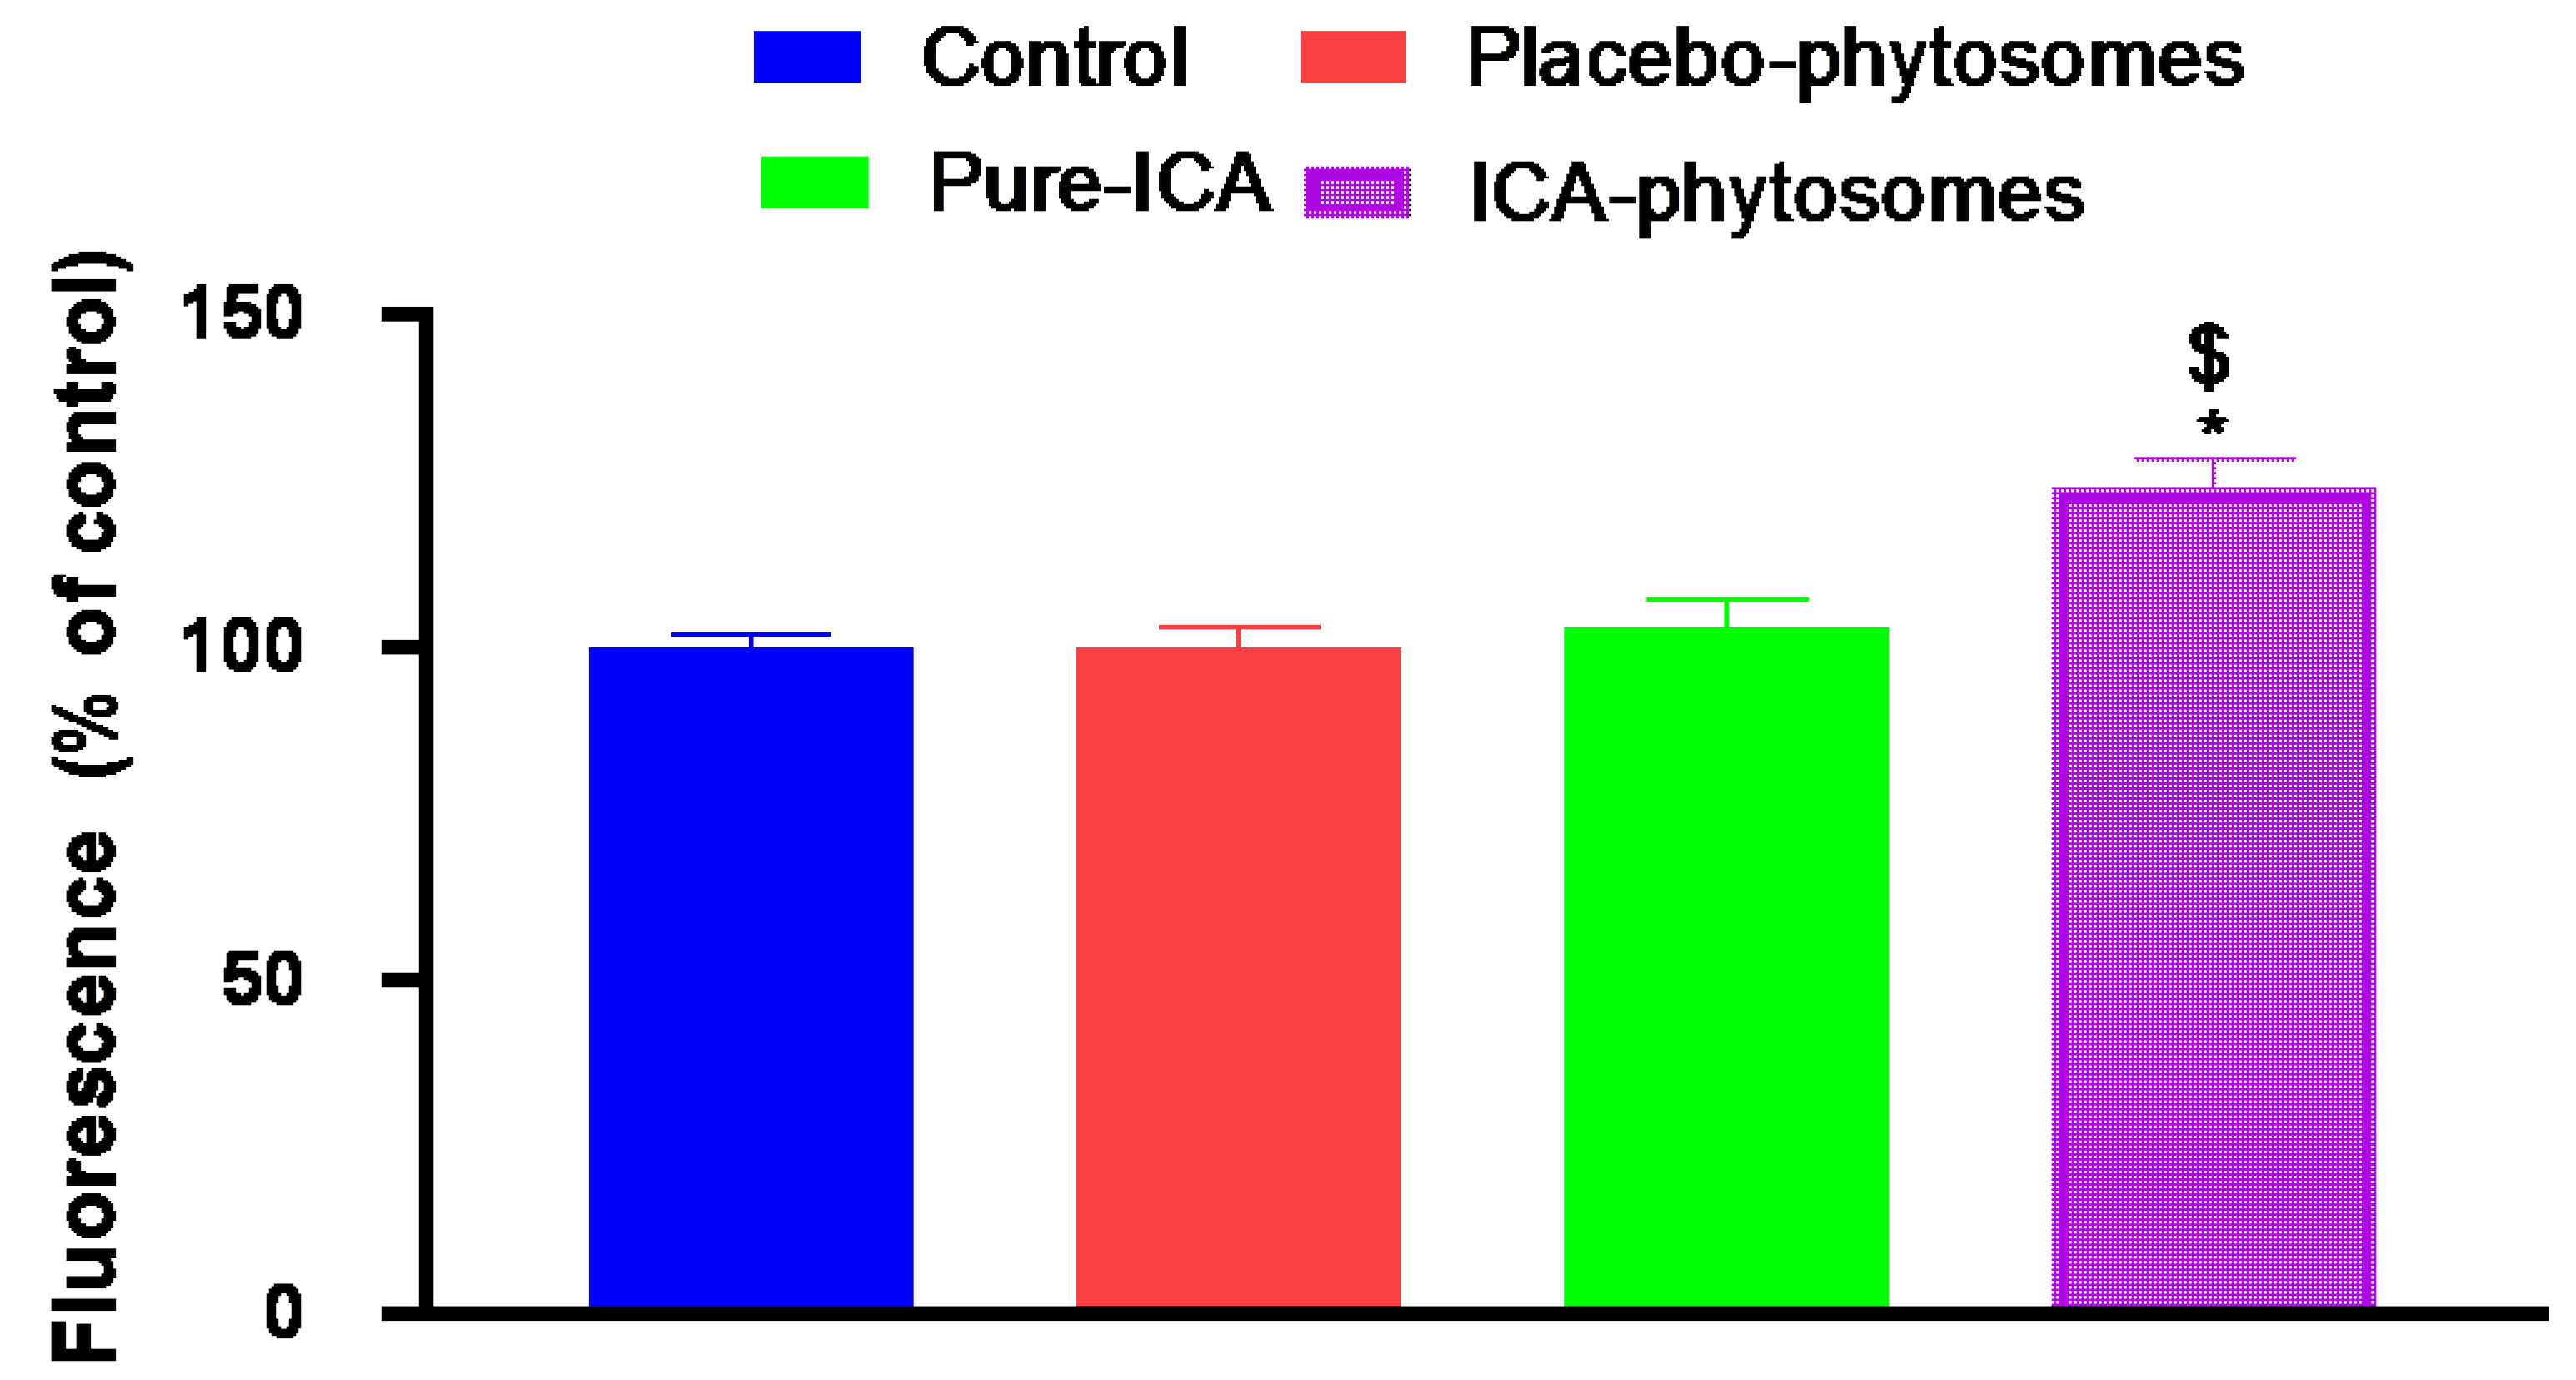
3.5.6. ROS Determination

Dichloro-dihydro-fluorescein diacetate (DCFH-DA) was used to study the extent of the formation of ROS. Conversion of DCFH-DA to fluorescent DCF gives a measure of ROS [42]. Figure 11 demonstrates that ICA-phytosomes-treated cells produced the highest fluorescence (124.8% of control) indicating a higher generation of ROS. Pure-ICA and placebo-phytosomes had fluorescence values almost similar to that of the untreated control cells.

4. Discussion

Box–Behnken is an independent, rotatable or nearly rotatable three-level response surface design that is widely utilized for optimization in pharmaceutical research [50]. In this study, a three-level Box–Behnken design was applied for formulation and optimization of ICA-phytosomes with minimized vesicle size. The independent factors selected in the present study were previously established to influence the phytosomes formulation [30]. The combinations at the center mid points of edges of the design space represent the composition of the experimental runs. The adequate model fitting the vesicle size data was the quadratic model based on its highest determination coefficient R2. In addition, the values of predicted and adjusted R2 were in good agreement ensuring the validity of the model. Signal-to-noise ratio is given by the adequate precision measure. A ratio over four indicates that the selected model can be used to navigate the design space. Accordingly, the experimental design proved valid to predict the optimized formula according to the experimental runs that were based on the selected independent variables. The in vitro release results indicated that phytosomes could enhance the dissolution of ICA. After 2 h, the drug release was more than double from the phytosomes when compared to the pure-ICA. At the end of 12 h, ICA release was almost complete from phytosomes compared to pure-ICA release of only 65%. Phospholipon® 90H is hydrogenated phosphatidylcholine that can increase the dissolution and solubility of ICA. Phospholipon® 90H might enhance the wettability of ICA [51] resulting in increased dissolution in the release medium. Hydrogenated phosphatidylcholine potential of enhancing solubility of poorly soluble drugs has been reported in other studies [52]. In addition, the nano size of the phytosomes could contribute to the enhanced release of ICA via the dialysis membrane. Our data indicate that ICA-phytosome had the most potent cytotoxic activity as compared to pure-ICA. This implies that formulation of ICA to phytosome significantly increases cytotoxicity. This can be explained on the basis of the higher cellular permeability of phytosomes compared with that of pure-ICA [53]. Further, the optimized formula of ICA-phytosomes exhibited significantly higher cell fraction in both G2-M and Pre-G1 phases indicating an augmentation of the cytotoxic property of ICA by the phytosome structure. A large proportion of cells at the pre-G1 phase is a characteristic feature of apoptosis. Thus, pre-G1 apoptosis and cell cycle arrest at the G2-M phase could explain the enhanced cytotoxic effect of ICA-phytosome. This is supported by other observations on nanoparticles [37]. Encapsulation of silver nanoparticles in lipids has been reported to enhance apoptosis [54]. Moreover, the observed responses are indicative of ICA-triggered intrinsic apoptosis. This was further substantiated by annexin V staining of OVCAR-3 cells which revealed increases in early, late, and total cell death induced by the optimized formula. In addition, our data show that ICA-phytosomes exhibited significant disruption of MMP which suggests a compromised integrity of the mitochondrial membrane [55]. Disruption of MMP indicates compromised integrity and enhanced permeability of the mitochondrial membrane [40]. Increased mitochondrial membrane permeability is an initial step in apoptosis [56]. These observations are in harmony with our data on cell cycle analysis and annexin V staining studies. It is noteworthy to report that fractions of dead cells determined by annexin V staining are relatively lower than expected with reference to IC50 values. This can be attributed to the loss of the floating and already dead cells before addition of trypsin to cells attached to cells. Hence it could be concluded that the formulation of ICA to phytosomes enhances modulation of membrane potential and eventually initiates apoptosis of OVCAR-3 cells. Caspase-3 is an end executioner caspase in apoptosis as it regulates DNA fragmentation and destruction of cellular proteins. Therefore, it is considered an excellent marker of apoptosis. [37]. Therefore, augmentation of cytotoxicity by formulating ICA into phytosomes is further supported by these data. Enhancement of caspase-3 by nanostructured formulations has been previously reported [37,57,58]. In addition, caspase-3 results are consistent in that the observed MMP disturbances that initiate caspase-3 activation promote typical apoptotic features. In addition, ICA-phytosomes-treated cells exhibited significant elevation in the generation of ROS. This also supports the observed enhanced cytotoxicity and apoptosis induced by ICA-phytosomes. Other related reports were observed with chitosan nanoparticles [42]. Increased ROS adds more of an explanation for the observed augmentation of ICA cytotoxicity [59].

5. Conclusions

The Box–Behnken design was successfully used to optimize ICA-phytosomes with minimized vesicle size. The optimized phytosomes were almost spherical in shape. In vitro release of ICA from phytosomes was markedly higher than the pure-ICA, predicting a better presentation to the tumor cells. Phytosome formulation of ICA significantly enhances its cytotoxic activities against OVCAR-3 cells. This is mediated, at least partly, by enhanced apoptosis as evidenced by cell cycle analysis, annexin V staining, and determination of caspase 3. In addition, generation of ROS and disrupting MMP contribute to improved cytotoxicity of ICA-phytosomes. Additional in vitro and in vivo studies are recommended to further explore the potential of ICA-phytosomes in combating tumor cells.

Supplementary Materials

The following are available online at https://www.mdpi.com/1999-4923/12/4/346/s1, Figure S1: Flow cytometry analysis results for cell cycle analysis; (a) control, (b) placebo phytosome, (c) pure ICA, and (d) ICA phytosomes. Figure S2: Assessment of OVCAR3 cell death using flow cytometric analysis after annexin V-staining; (a) control, (b) placebo phytosome pure drug, (c) pure-ICA, and (d) ICA phytosomes.

Author Contributions

Conceptualization, N.A.A., M.M.A. and O.A.A.A.; methodology, U.A.F., M.M.A. and S.M.B.-E.; software, H.Z.A.; validation, H.M.A., N.K.A., and U.A.F.; formal analysis, A.I.M.; investigation, M.M.A.; resources, B.G.E.; data curation, A.B.A.-N.; writing—original draft preparation, Z.A.A.; writing—review and editing, O.A.A.A.; visualization, U.A.F.; supervision, N.K.A.; project administration, O.A.A.A.; funding acquisition, U.A.F. All authors have read and agreed to the published version of the manuscript.

Funding

This project was funded by the Deanship of Scientific Research (DSR) at King Abdulaziz University, Jeddah, under grant no. (RG-10-166-38). The authors, therefore, acknowledge with thanks DSR for technical and financial support.

Conflicts of Interest

The authors declare no conflicts of interest, the funders had no role in the design of the study; in the collection, analyses, or interpretation of data; in the writing of the manuscript, or in the decision to publish the results.

References

  1. Dong, X.; Men, X.; Zhang, W.; Lei, P. Advances in tumor markers of ovarian cancer for early diagnosis. Indian J. Cancer 2014, 51, 72. [Google Scholar]
  2. Chobanian, N.; Dietrich, C.S. Ovarian Cancer. Surg. Clin. North Am. 2008, 88, 285–299. [Google Scholar] [CrossRef] [PubMed]
  3. Jin, J.; Wang, H.; Hua, X.; Chen, D.; Huang, C.; Chen, Z. An outline for the pharmacological effect of icariin in the nervous system. Eur. J. Pharmacol. 2019, 842, 20–32. [Google Scholar] [CrossRef] [PubMed]
  4. Tan, H.-M.; Low, W.Y.; Ng, C.J.; Chen, K.-K.; Sugita, M.; Ishii, N.; Marumo, K.; Lee, S.W.; Fisher, W.; Sand, M. Prevalence and correlates of erectile dysfunction (ED) and treatment seeking for ED in Asian Men: The Asian Men’s Attitudes to Life Events and Sexuality (MALES) study. J. Sex. Med. 2007, 4, 1582–1592. [Google Scholar] [CrossRef] [PubMed]
  5. Angeloni, C.; Barbalace, M.C.; Hrelia, S. Icariin and Its Metabolites as Potential Protective Phytochemicals Against Alzheimer’s Disease. Front. Pharm. 2019, 10, 271. [Google Scholar] [CrossRef]
  6. Fang, J.; Zhang, Y. Icariin, an Anti-atherosclerotic Drug from Chinese Medicinal Herb Horny Goat Weed. Front. Pharmacol. 2017, 8, 734. [Google Scholar] [CrossRef]
  7. Jia, G.; Zhang, Y.; Li, W.; Dai, H. Neuroprotective role of icariin in experimental spinal cord injury via its antioxidant, anti-neuroinflammatory and anti-apoptotic properties. Mol. Med. Rep. 2019, 20, 3433–3439. [Google Scholar] [CrossRef]
  8. Kong, L.; Liu, J.; Wang, J.; Luo, Q.; Zhang, H.; Liu, B.; Xu, F.; Pang, Q.; Liu, Y.; Dong, J. Icariin inhibits TNF-α/IFN-γ induced inflammatory response via inhibition of the substance P and p38-MAPK signaling pathway in human keratinocytes. Int. Immunopharmacol. 2015, 29, 401–407. [Google Scholar] [CrossRef]
  9. Zhou, H.; Yuan, Y.; Liu, Y.; Deng, W.; Zong, J.; Bian, Z.-Y.; Dai, J.; Tang, Q.-Z. Icariin attenuates angiotensin II-induced hypertrophy and apoptosis in H9c2 cardiomyocytes by inhibiting reactive oxygen species-dependent JNK and p38 pathways. Exp. Ther. Med. 2014, 7, 1116–1122. [Google Scholar] [CrossRef]
  10. Algandaby, M.M.; Breikaa, R.M.; Eid, B.G.; Neamatallah, T.A.; Abdel-Naim, A.B.; Ashour, O.M. Icariin protects against thioacetamide-induced liver fibrosis in rats: Implication of anti-angiogenic and anti-autophagic properties. Pharmacol. Rep. 2017, 69, 616–624. [Google Scholar] [CrossRef]
  11. Wong, M.S.; Mok, S.K.; Chen, W.F.; Lai, W.P.; Leung, P.C.; Wang, X.L.; Yao, X.S. Icariin protects against bone loss induced by oestrogen deficiency and activates oestrogen receptor-dependent osteoblastic functions in UMR 106 cells. Br. J. Pharmacol. 2010, 159, 939–949. [Google Scholar]
  12. Zhang, X.; Sun, H.; Su, Q.; Lin, T.; Zhang, H.; Zhang, J.; Dang, S.; Zhu, Z. Antidepressant-like activity of icariin mediated by group I mGluRs in prenatally stressed offspring. Brain Dev. 2017, 39, 593–600. [Google Scholar] [CrossRef] [PubMed]
  13. Tan, H.-L.; Chan, K.-G.; Pusparajah, P.; Saokaew, S.; Duangjai, A.; Lee, L.-H.; Goh, B.-H. Anti-Cancer Properties of the Naturally Occurring Aphrodisiacs: Icariin and Its Derivatives. Front. Pharmacol. 2016, 7, 191. [Google Scholar] [CrossRef] [PubMed]
  14. Jung, Y.Y.; Lee, J.H.; Nam, D.; Narula, A.S.; Namjoshi, O.A.; Blough, B.E.; Um, J.-Y.; Sethi, G.; Ahn, K.S. Anti-myeloma Effects of Icariin Are Mediated Through the Attenuation of JAK/STAT3-Dependent Signaling Cascade. Front. Pharmacol. 2018, 9, 531. [Google Scholar] [CrossRef] [PubMed]
  15. He, C.; Wang, Z.; Shi, J. Pharmacological effects of icariin. Adv. Pharmacol. 2020, 87, 179–203. [Google Scholar]
  16. Li, S.; Dong, P.; Wang, J.; Zhang, J.; Gu, J.; Wu, X.; Wu, W.; Fei, X.; Zhang, Z.; Wang, Y.; et al. Icariin, a natural flavonol glycoside, induces apoptosis in human hepatoma SMMC-7721 cells via a ROS/JNK-dependent mitochondrial pathway. Cancer Lett. 2010, 298, 222–230. [Google Scholar] [CrossRef]
  17. Da, Z. Suppressive Effect of Icaritin on Angiogenesis and Its Mechanisms. J. Int. Transl. Med. 2014, 2, 385–388. [Google Scholar]
  18. Di, S.; Fan, C.; Yang, Y.; Jiang, S.; Liang, M.; Wu, G.; Wang, B.; Xin, Z.; Hu, W.; Zhu, Y.; et al. Activation of endoplasmic reticulum stress is involved in the activity of icariin against human lung adenocarcinoma cells. Apoptosis 2015, 20, 1229–1241. [Google Scholar] [CrossRef]
  19. Li, J.; Jiang, K.; Zhao, F. Icariin regulates the proliferation and apoptosis of human ovarian cancer cells through microRNA-21 by targeting PTEN, RECK and Bcl-2. Oncol. Rep. 2015, 33, 2829–2836. [Google Scholar] [CrossRef]
  20. Jiang, S.; Chang, H.; Deng, S.; Fan, D. Icariin enhances the chemosensitivity of cisplatin-resistant ovarian cancer cells by suppressing autophagy via activation of the AKT/mTOR/ATG5 pathway. Int. J. Oncol. 2019, 54, 1933–1942. [Google Scholar] [CrossRef]
  21. Jiang, H.L.; Zhu, K.J. Bioadhesive fluorescent microspheres as visible carriers for local delivery of drugs. I: Preparation and characterization of insulin-loaded PCEFB/PLGA microspheres. J. Microencapsul. 2002, 19, 451–461. [Google Scholar] [CrossRef] [PubMed]
  22. Xie, X.; Tao, Q.; Zou, Y.; Zhang, F.; Guo, M.; Wang, Y.; Wang, H.; Zhou, Q.; Yu, S. PLGA nanoparticles improve the oral bioavailability of curcumin in rats: Characterizations and mechanisms. J. Agric. Food Chem. 2011, 59, 9280–9289. [Google Scholar] [CrossRef] [PubMed]
  23. Bansal, T.; Mishra, G.; Jaggi, M.; Khar, R.K.; Talegaonkar, S. Effect of P-glycoprotein inhibitor, verapamil, on oral bioavailability and pharmacokinetics of irinotecan in rats. Eur. J. Pharm. Sci. 2009, 36, 580–590. [Google Scholar] [CrossRef] [PubMed]
  24. Soares, S.; Sousa, J.; Pais, A.; Vitorino, C. Nanomedicine: Principles, Properties, and Regulatory Issues. Front. Chem. 2018, 6, 360. [Google Scholar] [CrossRef] [PubMed]
  25. Li, B.; Li, Q.; Mo, J.; Dai, H. Drug-Loaded Polymeric Nanoparticles for Cancer Stem Cell Targeting. Front. Pharmacol. 2017, 8, 51. [Google Scholar] [CrossRef] [PubMed]
  26. Parveen, S.; Sahoo, S.K. Polymeric nanoparticles for cancer therapy. J. Drug Target. 2008, 16, 108–123. [Google Scholar] [CrossRef]
  27. Alhakamy, N.A.; Ahmed, O.A.A.; Aldawsari, H.M.; Alfaifi, M.Y.; Eid, B.G.; Abdel-Naim, A.B.; Fahmy, U.A. Encapsulation of Lovastatin in Zein Nanoparticles Exhibits Enhanced Apoptotic Activity in HepG2 Cells. Int. J. Mol. Sci. 2019, 20, 5788. [Google Scholar] [CrossRef]
  28. Algandaby, M.M.; Al-Sawahli, M.M.; Ahmed, O.A.A.; Fahmy, U.A.; Abdallah, H.M.; Hattori, M.; Ashour, O.M.; Abdel-Naim, A.B. Curcumin-zein nanospheres improve liver targeting and antifibrotic activity of curcumin in carbon tetrachloride-induced mice liver fibrosis. J. Biomed. Nanotechnol. 2016, 12, 1746–1757. [Google Scholar] [CrossRef]
  29. Ahmed, O.A.A.; Fahmy, U.A.; Al-Ghamdi, A.S.; Aljaeid, B.M.; Aldawsari, H.; Fahmy, O.; Sarhan, H.A.; Khairul Asri, M.G. Finasteride-loaded biodegradable nanoparticles: Near-infrared quantification of plasma and prostate levels. J. Bioact. Compat. Polym. 2017, 32, 557–567. [Google Scholar] [CrossRef]
  30. Lu, M.; Qiu, Q.; Luo, X.; Liu, X.; Sun, J.; Wang, C.; Lin, X.; Deng, Y.; Song, Y. Phyto-phospholipid complexes (phytosomes): A novel strategy to improve the bioavailability of active constituents. Asian J. Pharm. Sci. 2019, 14, 265–274. [Google Scholar] [CrossRef]
  31. Gnananath, K.; Sri Nataraj, K.; Ganga Rao, B. Phospholipid Complex Technique for Superior Bioavailability of Phytoconstituents. Adv. Pharm. Bull. 2017, 7, 35–42. [Google Scholar] [CrossRef] [PubMed]
  32. Damle, M.; Mallya, R. Development and Evaluation of a Novel Delivery System Containing Phytophospholipid Complex for Skin Aging. AAPS PharmSciTech 2016, 17, 607–617. [Google Scholar] [CrossRef] [PubMed]
  33. Azeez, N.A.; Deepa, V.S.; Sivapriya, V. Phytosomes: Emergent promising nano vesicular drug delivery system for targeted tumor therapy. Adv. Nat. Sci. Nanosci. Nanotechnol. 2018, 9, 33001. [Google Scholar] [CrossRef]
  34. Alfaifi, M.Y.; Shati, A.A.; Elbehairi, S.E.I.; Fahmy, U.A.; Alhakamy, N.A.; Md, S. Anti-tumor effect of PEG-coated PLGA nanoparticles of febuxostat on A549 non-small cell lung cancer cells. 3 Biotech 2020, 10, 133. [Google Scholar] [CrossRef]
  35. Zheng, Y.; Lu, L.; Yan, Z.; Jiang, S.; Yang, S.; Zhang, Y.; Xu, K.; He, C.; Tao, X.; Zhang, Q. mPEG-icariin nanoparticles for treating myocardial ischaemia. Artif. Cells Nanomed. Biotechnol. 2019, 47, 799–809. [Google Scholar] [CrossRef]
  36. Deng, G.; Wang, H.; Yao, T. Simultaneous determination of four saponins and icariin in “Qihuotongqiao” tablets by a high performance liquid chromatography - DAD method. Asian J. Pharm. Sci. 2009, 4, 115–120. [Google Scholar]
  37. Anwar, M.M.; Abd El-Karim, S.S.; Mahmoud, A.H.; Amr, A.E.-G.E.; Al-Omar, M.A. A Comparative Study of the Anticancer Activity and PARP-1 Inhibiting Effect of Benzofuran-Pyrazole Scaffold and Its Nano-Sized Particles in Human Breast Cancer Cells. Molecules 2019, 24, 2413. [Google Scholar] [CrossRef]
  38. Hu, G.; Cun, X.; Ruan, S.; Shi, K.; Wang, Y.; Kuang, Q.; Hu, C.; Xiao, W.; He, Q.; Gao, H. Utilizing G2/M retention effect to enhance tumor accumulation of active targeting nanoparticles. Sci. Rep. 2016, 6, 27669. [Google Scholar] [CrossRef]
  39. Hsiao, K.Y.; Wu, Y.-J.; Liu, Z.N.; Chuang, C.W.; Huang, H.H.; Kuo, S.M. Anticancer Effects of Sinulariolide-Conjugated Hyaluronan Nanoparticles on Lung Adenocarcinoma Cells. Molecules 2016, 21, 297. [Google Scholar] [CrossRef]
  40. Xue, Y.; Chen, Q.; Ding, T.; Sun, J. SiO₂ nanoparticle-induced impairment of mitochondrial energy metabolism in hepatocytes directly and through a Kupffer cell-mediated pathway in vitro. Int. J. Nanomed. 2014, 9, 2891–2903. [Google Scholar]
  41. Hussain, S. Measurement of Nanoparticle-Induced Mitochondrial Membrane Potential Alterations BT. In Nanotoxicity: Methods and Protocols; Zhang, Q., Ed.; Springer New York: New York, NY, USA, 2019; pp. 123–131. ISBN 978-1-4939-8916-4. [Google Scholar]
  42. Jiang, Y.; Yu, X.; Su, C.; Zhao, L.; Shi, Y. Chitosan nanoparticles induced the antitumor effect in hepatocellular carcinoma cells by regulating ROS-mediated mitochondrial damage and endoplasmic reticulum stress. Artif. Cells Nanomed. Biotechnol. 2019, 47, 747–756. [Google Scholar] [CrossRef] [PubMed]
  43. Maruyama, K. Passive targeting with liposomal drug carriers. Drug Deliv. Syst. 1999, 14, 433–447. [Google Scholar] [CrossRef]
  44. Angelico, R.; Ceglie, A.; Sacco, P.; Colafemmina, G.; Ripoli, M.; Mangia, A. Phyto-liposomes as nanoshuttles for water-insoluble silybin–phospholipid complex. Int. J. Pharm. 2014, 471, 173–181. [Google Scholar] [CrossRef] [PubMed]
  45. Dubey, V.; Mishra, D.; Dutta, T.; Nahar, M.; Saraf, D.K.; Jain, N.K. Dermal and transdermal delivery of an anti-psoriatic agent via ethanolic liposomes. J. Control. Release 2007, 123, 148–154. [Google Scholar] [CrossRef]
  46. Ahmed, O.A.A.; Badr-Eldin, S.M. Development of an optimized avanafil-loaded invasomal transdermal film: Ex vivo skin permeation and in vivo evaluation. Int. J. Pharm. 2019, 570, 118657. [Google Scholar] [CrossRef]
  47. Saoji, S.D.; Raut, N.A.; Dhore, P.W.; Borkar, C.D.; Popielarczyk, M.; Dave, V.S. Preparation and Evaluation of Phospholipid-Based Complex of Standardized Centella Extract (SCE) for the Enhanced Delivery of Phytoconstituents. AAPS J. 2016, 18, 102–114. [Google Scholar] [CrossRef]
  48. Clogston, J.D.; Patri, A.K. Zeta Potential Measurement BT. In Characterization of Nanoparticles Intended for Drug Delivery; McNeil, S.E., Ed.; Humana Press: Totowa, NJ, USA, 2011; pp. 63–70. ISBN 978-1-60327-198-1. [Google Scholar]
  49. Mazumder, A.; Dwivedi, A.; du Preez, J.L.; du Plessis, J. In vitro wound healing and cytotoxic effects of sinigrin–phytosome complex. Int. J. Pharm. 2016, 498, 283–293. [Google Scholar] [CrossRef]
  50. Khuri, A.I.; Mukhopadhyay, S. Response surface methodology. WIREs Comput. Stat. 2010, 2, 128–149. [Google Scholar] [CrossRef]
  51. Freag, M.S.; Saleh, W.M.; Abdallah, O.Y. Self-assembled phospholipid-based phytosomal nanocarriers as promising platforms for improving oral bioavailability of the anticancer celastrol. Int. J. Pharm. 2018, 535, 18–26. [Google Scholar] [CrossRef]
  52. Rupp, C.; Steckel, H.; Müller, B.W. Solubilization of poorly water-soluble drugs by mixed micelles based on hydrogenated phosphatidylcholine. Int. J. Pharm. 2010, 395, 272–280. [Google Scholar] [CrossRef]
  53. Xu, L.; Xu, D.; Li, Z.; Gao, Y.; Chen, H. Synthesis and potent cytotoxic activity of a novel diosgenin derivative and its phytosomes against lung cancer cells. Beilstein J. Nanotechnol. 2019, 10, 1933–1942. [Google Scholar] [CrossRef] [PubMed]
  54. Yusuf, A.; Brophy, A.; Gorey, B.; Casey, A. Liposomal encapsulation of silver nanoparticles enhances cytotoxicity and causes induction of reactive oxygen species-independent apoptosis. J. Appl. Toxicol. 2018, 38, 616–627. [Google Scholar] [CrossRef] [PubMed]
  55. Sakamuru, S.; Attene-Ramos, M.S.; Xia, M. Mitochondrial Membrane Potential Assay. Methods Mol. Biol. 2016, 1473, 17–22. [Google Scholar] [PubMed]
  56. Costantini, P.; Jacotot, E.; Decaudin, D.; Kroemer, G. Mitochondrion as a Novel Target of Anticancer Chemotherapy. J. Natl. Cancer Inst. 2000, 92, 1042–1053. [Google Scholar] [CrossRef]
  57. Yassemi, A.; Kashanian, S.; Zhaleh, H. Folic acid receptor-targeted solid lipid nanoparticles to enhance cytotoxicity of letrozole through induction of caspase-3 dependent-apoptosis for breast cancer treatment. Pharm. Dev. Technol. 2020, 25, 397–407. [Google Scholar] [CrossRef] [PubMed]
  58. Kim, C.G.; Castro-Aceituno, V.; Abbai, R.; Lee, H.A.; Simu, S.Y.; Han, Y.; Hurh, J.; Kim, Y.-J.; Yang, D.C. Caspase-3/MAPK pathways as main regulators of the apoptotic effect of the phyto-mediated synthesized silver nanoparticle from dried stem of Eleutherococcus senticosus in human cancer cells. Biomed. Pharmacother. 2018, 99, 128–133. [Google Scholar] [CrossRef] [PubMed]
  59. Yang, H.; Villani, R.M.; Wang, H.; Simpson, M.J.; Roberts, M.S.; Tang, M.; Liang, X. The role of cellular reactive oxygen species in cancer chemotherapy. J. Exp. Clin. Cancer Res. 2018, 37, 266. [Google Scholar] [CrossRef]
Figure 1. Predicted versus actual values of the vesicle size of different experimental runs of ICA-phytosomes.
Pharmaceutics 12 00346 g001
Figure 2. Main effect plots of ICA:Phospholipon® 90H molar ratio (X1), temperature (X2), and reflux time (X3) on the vesicle size of ICA-phytosomes.
Pharmaceutics 12 00346 g002
Figure 3. Three-dimensional (3D) surface plots for the effect of ICA:Phospholipon® 90H molar ratio (X1), temperature (X2), and reflux time (X3) on the vesicle size of ICA-phytosomes.
Pharmaceutics 12 00346 g003
Figure 4. Transmission electron microscope images of (a) optimized ICA-phytosomes (×10,000) and (b) placebo-phytosomes (×50,000).
Pharmaceutics 12 00346 g004
Figure 5. Fourier-transform infrared (FTIR) of ICA, Phospholipon® 90H, and ICA-phytosomes.
Pharmaceutics 12 00346 g005
Figure 6. In vitro release profile of optimized ICA-phytosomes compared to pure-ICA in phosphate-buffered saline (PBS) buffer pH 7.4 at 37 ± 0.5 °C. (Results are presented as mean ± SD, n = 3).
Pharmaceutics 12 00346 g006
Figure 7. Flow cytometry analysis results for cell cycle analysis. * Significantly different from control at p < 0.05, # significantly different from placebo-phytosomes at p < 0.05, $ significantly different from ICA at p < 0.05.
Pharmaceutics 12 00346 g007
Figure 8. Assessment of OVCAR-3 cell death using flow cytometric analysis after annexin V staining. * Significantly different from control at p < 0.05, # significantly different from placebo-phytosomes at p < 0.05.
Pharmaceutics 12 00346 g008
Figure 9. Effect of ICA-phytosomes on mitochondrial membrane potential (MMP) in OVCAR-3 cells. * Significantly different from control at p < 0.05, # significantly different from placebo-phytosomes at p < 0.05, $ significantly different from pure-ICA at p < 0.05.
Pharmaceutics 12 00346 g009
Figure 10. Effect of ICA-phytosomes on caspase-3 content in OVCAR-3 cells. * Significantly different from control at p < 0.05, # significantly different from placebo-phytosomes at p < 0.05, $ significantly different from pure-ICA at p < 0.05.
Pharmaceutics 12 00346 g010
Figure 11. Bar diagram of fluorescence during reactive oxygen species (ROS) determination. * Significantly different from control at p < 0.05, $ significantly different from pure-ICA at p < 0.05.
Pharmaceutics 12 00346 g011
Table 1. Independent variables and responses of Box–Behnken design employed for the formulation of ICA-phytosomes.
Independent VariableLevels
(0)(−1)(+1)
X1: ICA:Phospholipon® 90H molar ratio1:11:21:3
X2: Temperature (°C)405060
X3: Reflux time (h)123
ResponseDesirability constraints
Y: Vesicle size (nm)Minimize
Abbreviations: ICA = Icariin.
Table 2. Experimental runs of ICA-phytosomes prepared according to Box–Behnken design and their measured mean vesicle size.
Run #Independent VariablesVesicle Size (nm)
ICA:Phospholipon® 90H Molar RatioTemperature (°C)Reflux Time (h)
11:3402245.7 ± 9.8
21:160298.4 ± 3.2
31:2502151.1 ± 6.5
41:2603143.1 ± 4.9
51:3602212.8 ± 10.9
61:1503101.3 ± 3.8
71:2601145.6 ± 4.1
81:1402132.8 ± 4.7
91:3503218.8 ± 6.9
101:1501141.8 ± 2.9
111:3501234.5 ± 8.7
121:2403165.4 ± 6.5
131:2502153.2 ± 7.4
141:2502155.1 ± 6.1
151:2401174.6 ± 8.3
Abbreviations: ICA = Icariin.
Table 3. Statistical analysis output of the measured vesicle size of ICA-phytosomes.
R2Adjusted R2Predicted R2Adequate PrecisionSequential p-ValueLack of Fit p-Value
0.98840.96760.818521.14910.03790.0368
p-value of significant termsX1X2X3X12
<0.00010.00340.03070.0076
Abbreviations: ICA = Icariin.
Table 4. Composition of the optimized formulation and its predicted and observed vesicle size.
VariablesX1: ICA:Phospholipon® 90H Molar RatioX2: Temperature (°C)X3: Reflux Time (h)
Optimum values1:1.0758.70 °C2.67 h
Vesicle size (nm)Predicted valueObserved valueError %
98.25104.156.01%
Table 5. Cytotoxicity of ICA-phytosomes in OVCAR-3 cells.
SampleIC50 Value (µM)
Placebo-phytosomes94.85 ± 3.12
Pure-ICA13.1 ± 4.0 *
ICA-phytosomes6.31 ± 0.21 *#
* Significantly different from placebo-phytosomes at p < 0.05. # Significantly different from ICA at p < 0.05.

