Abstract
Background: Atherosclerosis is a chronic inflammatory condition that underlies both cardiovascular and cerebrovascular complications. Emerging evidence suggests that COVID-19 may play a role in its progression. Purpose: The aim of the study was to evaluate the potential impact of SARS-CoV-2 infection on the development of atherosclerosis. Patients and Methods: Common carotid artery (CCA) intima media thickness (IMT) was measured by ultrasonography twice, 12–18 months apart, in a cohort of 92 patients (47 with COVID-19 and 45 controls). Clinical data were collected from medical histories, physical examinations, and laboratory findings. Results: Baseline IMT values were comparable between the study groups (0.85 mm vs. 0.78 mm). However, the COVID-19 group exhibited a significantly greater increase in IMT over time, with a median change of 0.13 mm compared to 0.05 mm in the controls (p = 0.018). Furthermore, 69.2% of COVID-19 patients exceeded the median IMT progression threshold compared to 36% in the control group (p = 0.017). An elevated level of C-reactive protein (CRP) and a higher triglyceride (Tg)-to-High-Density Lipoprotein Cholesterol (HDL) ratio were significantly associated with increased IMT in the COVID-19 group. Age and heart rate were identified as significant predictors of IMT progression across both groups. Conclusions: COVID-19 may accelerate the progression of subclinical atherosclerosis. The strong associations of CRP and the TG/HDL ratio with IMT highlight the potential roles of chronic inflammation and metabolic dysregulation in driving these vascular changes. Further large-scale, multicenter studies are needed to elucidate the underlying mechanisms, confirm these observations, and guide targeted preventive and therapeutic strategies for individuals with an increased cardiovascular and cerebrovascular risk.
1. Background
Atherosclerosis (AS) is a chronic inflammatory disease of the arteries characterized by the accumulation of lipids, immune cells, and fibrous tissue within the vascular wall, leading to progressive narrowing of the arterial lumen. This process significantly increases the risk of cardiovascular and cerebrovascular complications, which are among the leading and increasingly prevalent causes of morbidity and mortality worldwide [1,2,3,4,5].
The development of atherosclerosis is a multifactorial and complex process involving numerous pathophysiological mechanisms [6,7]. Well-established risk factors include hypercholesterolemia, hypertension, diabetes mellitus, and smoking. Despite efforts to address these traditional risk factors, the global burden of atherosclerotic cardiovascular disease (ASCVD) remains high [8,9,10]. Furthermore, atherosclerosis is frequently diagnosed in individuals without recognized risk factors [11], prompting researchers to investigate novel contributing mechanisms. One such area of interest is the role of inflammation in the pathogenesis of atherosclerosis [12].
Recent studies have also suggested associations between subclinical atherosclerosis and chronic infections caused by viruses such as hepatitis C virus (HCV), human immunodeficiency virus (HIV), influenza virus, cytomegalovirus (CMV), Epstein–Barr virus (EBV), herpes simplex virus types 1 and 2 (HSV-1, HSV-2), human T cell leukemia virus type 1 (HTLV-1), and even Mycobacterium tuberculosis [13,14,15,16].
Preclinical atherosclerosis refers to early arterial wall changes that may be present before the onset of clinical symptoms [17]. Carotid intima–media thickness (IMT) is widely accepted as a non-invasive marker of subclinical atherosclerosis and a strong predictor of future cardiovascular and cerebrovascular events [18]. IMT is measured using carotid ultrasound and enables the identification of individuals who may benefit from early cardiovascular risk assessments and interventions. Moreover, serial IMT assessments are valuable for monitoring disease progression and evaluating therapeutic efficacy [19,20].
Severe acute respiratory syndrome coronavirus 2 (SARS-CoV-2), the virus responsible for COVID-19, emerged in December 2019 in Wuhan, China, and rapidly overwhelmed healthcare systems worldwide [21]. It is now evident that SARS-CoV-2 infection can lead to persistent, multisystem complications, collectively referred to as long COVID [22,23,24,25,26,27,28,29,30,31,32,33,34]. Millions of individuals worldwide are affected, and the number continues to grow [35]. Although the long-term trajectory of post-COVID complications remains unclear, emerging data suggest a sustained increase in the risk of ASCVD, persisting up to one-year post-infection [36,37,38].
Some studies propose that SARS-CoV-2 may contribute to atherosclerosis development through mechanisms including systemic inflammation, chronic endothelial dysfunction, disruption of the endothelial barrier, increased oxidative stress, and a prothrombotic state [39,40,41,42,43,44,45,46,47]. While a direct causal relationship between COVID-19 and atherosclerosis has not been definitively established, it is plausible that the known consequences of SARS-CoV-2 infection may exacerbate traditional risk factors for atherosclerosis [48,49,50].
In addition, lifestyle changes during the pandemic—such as prolonged isolation, increased psychological stress, and reduced physical activity—have led to greater incidences of sedentary behavior, weight gain, and obesity, all of which are independently associated with atherosclerosis risks [51,52].
Our study addresses one of the major challenges in contemporary medicine: the early detection and prevention of atherosclerosis. It is imperative to determine whether SARS-CoV-2 infection influences carotid IMT, as this could have significant implications for cardiovascular risk stratification and management. To this end, we evaluated changes in IMT using Doppler-enhanced ultrasonography.
The aim of the study was to determine the potential impact of SARS-CoV-2 infection on the development of subclinical atherosclerosis, as assessed by changes in common carotid artery intima–media thickness.
2. Materials and Methods
2.1. Study Design and Participants
We present a single-center, prospective cohort study conducted at the Department of Internal Medicine and Hypertension, Medical University of Bialystok, Poland. Patient recruitment was carried out between 26 October 2021 and 30 September 2024.
Participants were consecutively enrolled among individuals hospitalized for various medical conditions during the study period.
Participants eligible for inclusion were adults over 18 years of age with no prior diagnosis of carotid atherosclerosis who provided written informed consent. Exclusion criteria included pregnancy or breastfeeding, a previous diagnosis of carotid atherosclerosis, or failure to provide informed consent.
The study was approved by the Bioethics Committee of the Medical University of Bialystok (Resolution No. APK.002.256.2022).
A total of 92 participants were enrolled and stratified into two groups based on SARS-CoV-2 infection history. The COVID-19 group included individuals with a confirmed current or past SARS-CoV-2 infection, verified via medical records, patient history, or laboratory test results. The control group comprised participants with no reported history of COVID-19.
Within the COVID-19 group, disease severity was categorized based on the clinical course as follows:
Mild: Patients who experienced a mild, ambulatory illness without requiring hospitalization.
Moderate/Severe: Patients who required hospitalization due to COVID-19, indicating a more severe disease course.
2.2. Clinical Data Collection
Clinical and laboratory data were collected retrospectively from electronic medical records. The extracted variables included demographic information (age and sex), vital signs on admission (heart rate and respiratory rate), and laboratory parameters such as C-reactive protein (CRP), creatinine, total cholesterol, Triglycerides (TG), high-density lipoprotein cholesterol (HDL), and low-density lipoprotein cholesterol (LDL). No additional blood samples were obtained for the purpose of this study. To enhance the assessment of lipid metabolism, lipid ratios were calculated, including TG/HDL, total cholesterol/HDL, and LDL/HDL. A detailed review of each patient’s medical history was also performed. This included smoking status, the presence of comorbidities (e.g., hypertension, diabetes mellitus, heart failure, and prior thrombotic events such as myocardial infarction or stroke), and current pharmacological treatments. Medications assessed comprised statins, angiotensin-converting enzyme (ACE) inhibitors, angiotensin receptor blockers (ARBs), beta-blockers, digitalis glycosides, calcium channel blockers, alpha-blockers, diuretics, aldosterone antagonists, anticoagulants, hypoglycemic agents, sedatives, and acetylsalicylic acid. All clinical and historical data were collected at the time of the first intima–media thickness (IMT) assessment.
2.3. Intima–Media Thickness (IMT) Assessment
IMT measurements were performed in accordance with the guidelines of the Polish Society of Vascular Surgery for duplex Doppler ultrasound examination of the carotid and vertebral arteries. A Philips EPIQ 7 Elite ultrasound system equipped with a Philips L12-3 linear transducer operating at 12–13 MHz was used.
IMT was assessed in the distal segment of the common carotid artery (CCA), approximately 10 mm proximal to the carotid bulb, using longitudinal views. High-resolution images were obtained for both left and right CCAs, and the final IMT value was calculated as the average of three measurements on each side.
All assessments were performed by a single experienced sonographer, who completed specific training in vascular ultrasound to ensure methodological consistency and minimize interobserver variability.
IMT measurements were performed twice, with an interval of 12 to 18 months between the first and follow-up examination, to assess the progression of subclinical atherosclerosis.
2.4. Follow-Up
Follow-up data on intima–media thickness (IMT) were successfully obtained for 26 participants in the COVID-19 group and for 25 participants in the control group.
Reduced follow-up participation was primarily due to logistical challenges, including transportation difficulties. Many participants resided in remote areas without access to private vehicles or hospital-arranged transport.
2.5. Statistical Analysis
All statistical analyses adhered to a significance level of α = 0.05.
The distribution of numerical variables was assessed using non-parametric methods to account for the lack of normality in clinical parameters. These variables were summarized as medians with interquartile ranges (IQR). Categorical variables were described as absolute counts and percentages within specific groups. Statistical differences in numerical variables between two independent groups were determined using the Wilcoxon rank-sum test, while the Kruskal–Wallis test was applied to assess differences among three or more independent groups. Independence between categorical variables was evaluated using Pearson’s Chi-square test; when expected frequencies were low, Fisher’s exact test was utilized.
The relationships between two continuous variables were explored using Spearman’s rank correlation coefficient (Rho). For these analyses, the confidence interval (95% CI) at 95% and p-values were calculated using asymptotic approximations of the t-test.
To examine the adjusted effects of predictors while accounting for potential confounders, multiple linear regression models with robust estimators were employed. These models estimated the association between predictor variables and continuous outcomes, providing 95% CIs and p-values derived from the t-test. For dichotomous outcomes, a multiple logistic regression with a logit link function was used to estimate the adjusted effects of predictors. The significance of these associations was assessed using Wald z-statistics, with 95% CIs and p-values reported.
No formal correction for multiple comparisons was applied. This decision is based on the exploratory nature of the study and the relatively small sample size, where conservative adjustments such as Bonferroni or FDR could substantially increase the risk of a Type II error and obscure potentially meaningful associations.
Analyses were conducted using the R Statistical language (version 4.3.3) on Windows 11 pro 64 bit, using the packages sjPlot (version 2.8.15), parameters (version 0.22.2), performance (version 0.12.3), report (version 0.5.8), correlation (version 0.8.5), gtsummary (version 1.7.2), MASS (version 7.3.60.0.1), and dplyr (version 1.1.4).
3. Results
3.1. Studied Population
The analyzed group included 92 patients aged 30–92 years, with a female-to-male ratio of 1.56:1. Among them, 47 (51.1%) had a history of COVID-19 while 45 (48.9%) served as the control group. Table 1 presents the clinical characteristics of the studied population.

Table 1.
Clinical characteristics of the study population.
The median age was 70 years (IQR: 57.75–78.25), with no significant difference between the COVID-19 and control groups (p = 0.392). Females constituted 60.87% of the overall sample, with similar distributions in both groups (COVID-19: 63.83%, control: 57.78%, and p = 0.552). The age and sex distribution was comparable. Heart rate was significantly higher in the COVID-19 group (73 bpm vs. 70 bpm, p = 0.047).
CRP levels were significantly elevated in the COVID-19 group (8.45 mg/L vs. 1.08 mg/L, p = 0.003). The triglyceride-to-HDL ratio was also higher (2.59 vs. 1.82, p = 0.045). Medication use, including statins, antihypertensives, and anticoagulants, was similar across groups, as shown Table 2.
Table 2.
Medication use in the study population.
3.2. IMT Measurements
Among COVID-19 patients, 66% were in the acute stage at the time of examination, and 59.6% had moderate to severe disease; these proportions are shown in Figure 1.
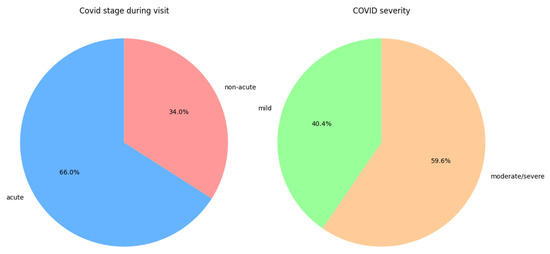
Figure 1.
Distribution of disease stage during the first IMT measurement and the distribution of disease severity in the COVID-19 group.
At baseline, the median IMT was 0.85 mm in the COVID-19 group and 0.78 mm in the control group. IMT on the first and second measurement in every sample is shown in Figure 2.
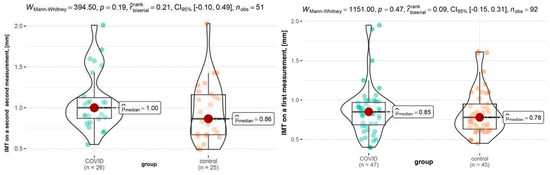
Figure 2.
IMT on the first and second measurement.
The COVID-19 group exhibited a greater IMT increase (1.00 mm vs. 0.86 mm, p = 0.19). Notably, 69.2% of COVID-19 patients had an IMT increase above the median value (0.08 mm), compared to only 36% of the control group (p = 0.017), which is illustrated in Figure 3.
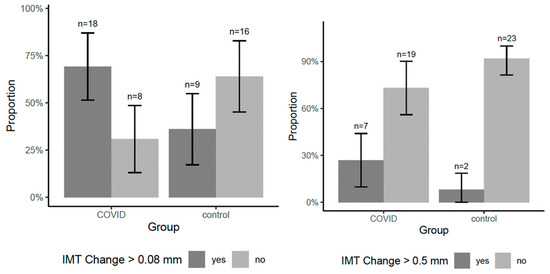
Figure 3.
Group-wise proportion of participants with IMT progression exceeding the median and 0.5 mm.
The difference in IMT (Δt2 − t1) was significantly greater in the COVID-19 group (median: 0.13 mm) than in the control group (median: 0.05 mm, p = 0.018). The variation is shown in Figure 4.
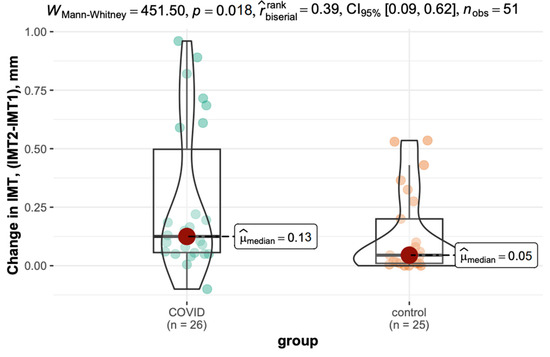
Figure 4.
Inter-measurement variation in IMT in the COVID-19 and control groups.
Figure 5 displays IMT differences at the first measurement and its progression across disease phases in the COVID-19 group.
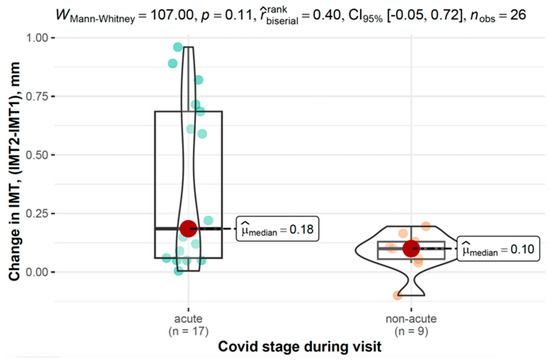
Figure 5.
Differences in IMT between the first and second measurements across the disease phase in the COVID-19 group.
3.3. The Relationship Between IMT at the First Measurement and Clinical and Demographic Parameters
Table 3 highlights factors associated with the baseline IMT. Age emerged as the strongest predictor across all groups, showing a significant positive correlation in the overall sample (Rho = 0.53, p < 0.001), as well as within the COVID-19 (Rho = 0.49, p < 0.001) and control groups (Rho = 0.58, p < 0.001).
Table 3.
Correlations between numerical parameters and IMT at first measurement.
Among metabolic markers, the triglyceride-to-HDL (TG/HDL) ratio showed a significant positive correlation with IMT in the overall sample (Rho = 0.22, p = 0.038), with a stronger correlation in the COVID-19 group (Rho = 0.34, p = 0.022).
In the COVID-19 group, lipid profiles correlated with IMT and HDL cholesterol showed a negative association (Rho = −0.33, p = 0.029); LDL cholesterol (Rho = −0.31, p = 0.039) and total cholesterol (Rho = −0.30, p = 0.044) were also inversely related to IMT.
Additionally, in the control group, a longer time between measurements was inversely correlated with the baseline IMT (Rho = −0.43, p = 0.031).
3.4. Association Between IMT Changes Across Measurements and Clinical and Demographic Parameters
The change in IMT between the second and first measurements reported in Table 4 was evaluated for associations with various clinical and demographic parameters. In the overall sample, heart rate (HR) showed a significant positive correlation with IMT progression (Rho = 0.35, 95% CI: 0.07 –0.57, and p = 0.013).
Table 4.
Correlations between numerical variables and inter-measurement change in IMT (Δt2 − t1).
HDL cholesterol levels demonstrated a significant negative correlation with IMT progression in the overall sample (Rho = −0.32, 95% CI: −0.56–−0.04, and p = 0.022).
In the COVID-19 group, heart rate was also significantly correlated with IMT progression (Rho = 0.39, 95% CI: −0.01–0.68, and p = 0.049). Additionally, the HDL cholesterol level was inversely associated with the change in IMT (Rho = -0.43, 95% CI: −0.71–−0.03, and p = 0.032).
In the control group, no parameter was significantly associated with IMT progression.
Table 5 and Table 6 present the differences in intima–media thickness (IMT) values at the first measurement across groups defined by selected categorical parameters. In both tables, the analysis was conducted for the overall sample and separately within the COVID-19 and control groups. For each comparison, Group 1 refers to individuals presenting a given characteristic (e.g., smokers, patients with hypertension, and individuals taking a specific medication), whereas Group 2 comprises individuals without that characteristic (e.g., non-smokers, patients without hypertension, or those not receiving the respective drug). Each table displays the median IMT values (with interquartile ranges) for both groups, along with p-values assessing the statistical significance of the differences observed.
Table 5.
Changes in IMT between the second and first measurements across demographic and clinical categorical parameters.
Table 6.
Changes in IMT between the second and first measurements across medications taken.
A significant difference was observed in IMT changes between the COVID-19 and control groups. The COVID-19 group exhibited a greater increase in IMT over time (0.13 mm, 95% CI: 0.06–0.50) compared to those without COVID-19 (0.05 mm, 95% CI: 0.01–0.20, and p = 0.018).
In the COVID-19 group, changes in IMT were analyzed based on disease stage and severity. While not reaching statistical significance, individuals with acute COVID-19 showed a trend toward greater IMT increases (0.19 mm, 95% CI: 0.06–0.69) compared to those with non-acute disease (0.10 mm, 95% CI: 0.06–0.13, and p = 0.106). Similarly, those with moderate to severe COVID-19 tended to exhibit higher IMT progression (0.19 mm, 95% CI: 0.09–0.63) compared to those with mild disease (0.08 mm, 95% CI: 0.05–0.12, and p = 0.087).
In the control group, no statistically significant differences were found in IMT changes over time across the analyzed parameters.
3.5. Changes in IMT Between Second and First Measurements Based on Baseline IMT Levels
Patients were categorized into three groups based on their initial IMT values: ≤0.6 mm, 0.6–1.0 mm, and >1.0 mm, with comparisons conducted separately for the COVID-19 and control groups.
In the COVID-19 group, IMT progression varied across baseline IMT categories, as shown in Figure 6 and Figure 7.
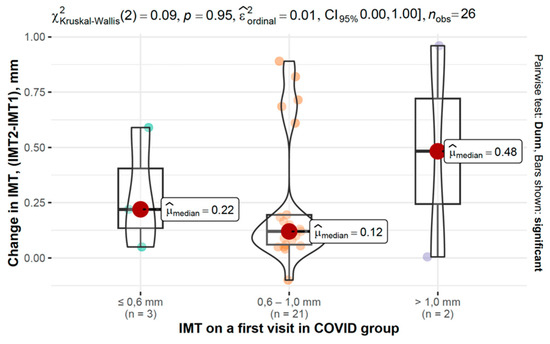
Figure 6.
Changes in IMT between second and first measurements based on baseline IMT in the COVID-19 group.
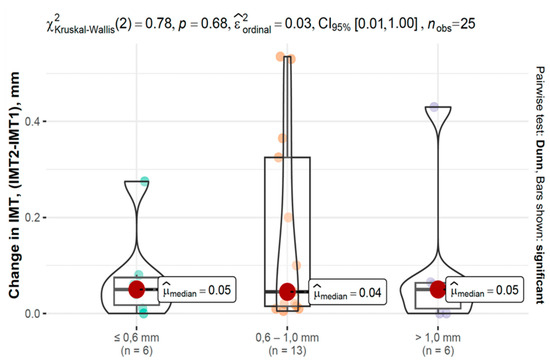
Figure 7.
Changes in IMT between second and first measurements based on baseline IMT in the control group.
3.6. The Estimation of the Adjusted Effects of Demographic and Clinical Parameters on the Change in IMT
The estimation of the adjusted effects of demographic and clinical parameters on the change in IMT is shown in Table 7 and Table 8.
Table 7.
Adjusted effects of predictors on changes in IMT values in the overall cohort, COVID-19 group, and control group.
Table 8.
Adjusted effects of medications taken on changes in IMT in the overall cohort, COVID-19 group, and control group.
In the overall cohort, higher HR and a history of vascular incidents were significantly associated with an increase in IMT over time ((β = 5.90 × 10⁻³, 95% CI: 2.50 × 10⁻³–9.30 × 10⁻³, and p = 0.001), (β = 0.28, 95% CI: 0.07–0.49, and p = 0.011)).
In the COVID-19 group, acute infection at the time of the first measurement was a significant predictor of a smaller change in IMT over time compared to the non-acute group (β = −0.27, 95% CI: −0.54–−1.30 × 10⁻³, and p = 0.049).
A trend was observed for greater IMT increases in individuals with moderate to severe COVID-19 courses compared to those with mild disease (β = 0.24, 95% CI: −0.04–0.51, and p = 0.092), though this did not reach statistical significance. A higher HR was also associated with IMT progression in the COVID-19 group (β = 0.01, 95% CI: 7.00 × 10⁻⁴–0.01, and p = 0.033).
In the control group, no significant predictors of IMT changes were identified.
4. Discussion
Since the onset of the COVID-19 pandemic, caused by the SARS-CoV-2 virus, the disease has been the subject of extensive research, primarily due to its significant impact on human health. Growing evidence points to long-term health consequences, particularly involving the cardiovascular system. Among these potential sequelae are chronic inflammation, metabolic disturbances, and endothelial dysfunction—all of which have been observed in individuals who have recovered from COVID-19. These factors are recognized contributors to the progression of atherosclerosis, a fundamental pathological process underlying cardiovascular disease.
However, the specific mechanisms and risk factors underlying vascular changes in post-COVID-19 patients remain poorly understood. Therefore, the aim of this study was to investigate the potential association between prior COVID-19 infection and subclinical atherosclerosis, assessed through changes in carotid intima–media thickness (IMT).
Our findings demonstrate significant differences in vascular changes between individuals with a history of COVID-19 and those in the control group. The most notable observation was a markedly accelerated increase in IMT among the COVID-19 group, suggesting a more rapid progression of atherosclerosis. Specifically, patients with prior COVID-19 infection exhibited a mean IMT increase of 0.12 mm compared to only 0.04 mm in the control group. Furthermore, 69.2% of patients in the COVID-19 group showed an IMT increase above the median value (0.08 mm), in contrast to 36% in the control group.
Studies have shown that COVID-19 may accelerate atherosclerosis through multiple, interconnected mechanisms. SARS-CoV-2 infects endothelial cells via ACE2, reducing nitric oxide availability, impairing vasodilation, and increasing vascular stiffness [53,54]. The infection triggers a systemic inflammatory response, including elevated IL-6, TNF-α, and IL-1β, which amplifies vascular injury [55]. Dysregulation of the renin–angiotensin–aldosterone system further promotes vasoconstriction, inflammation, and smooth muscle proliferation, while a prothrombotic state increases the risk of plaque formation and instability [53,54].
Persistent vascular damage can remain after viral clearance, driven by low-grade inflammation, extracellular matrix remodeling, endothelial-to-mesenchymal transition, and immune dysregulation, potentially sustained by epigenetic changes [56,57]. In some patients with long COVID, either PCR-negative or trace PCR-positive viral detection has been reported, with rare cases of persistent PCR-positive shedding beyond 3 months after the initial infection [58]. Such persistence may be associated with an expanded and sustained SARS-CoV-2-specific CD8+ T cell response, as observed in Danish post-COVID cohorts, which could further contribute to chronic vascular inflammation and remodeling long after the acute infection has resolved. This supports and justifies the validity of our findings [58,59,60].
Moreover, elevated CRP levels in COVID-19 patients support the hypothesis that persistent inflammation plays a role in atherosclerosis progression [61]. Although CRP was measured only during the initial visit, this finding is consistent with prior studies, such as that by Yi-Ping Gao et al. [62], who found persistently elevated hsCRP and TNF-α levels in COVID-19 survivors nearly a year after infection. This reinforces the notion that chronic inflammation may persist long after recovery, continuing to impact vascular health.
Our analysis suggests that age may modulate the extent of IMT changes in the context of SARS-CoV-2 infection, consistent with prior studies showing increased vascular susceptibility in older individuals, because age is a well-known independent risk factor for atherosclerosis and vascular remodeling [63].
In our regression analysis, acute infection at the baseline was associated with a smaller change in IMT over time, which may seem counterintuitive One possible explanation is that, as less time had elapsed since infection, there was less opportunity for vascular remodeling to occur. The effects of COVID-19 on IMT likely develop over a longer period of time, so patients infected earlier show a greater progression. However, this interpretation remains tentative and should be viewed with caution, as it is based on a relatively small subgroup and may be influenced by chance variation. Confirmation with larger longitudinal cohorts will be essential.
Among the lipid parameters analyzed, the TG/HDL ratio showed the strongest association with IMT thickening in the COVID-19 group. This finding suggests that metabolic abnormalities, such as insulin resistance and dyslipidemia, may substantially contribute to atherosclerotic lesion development in this population. Importantly, this ratio may serve as a valuable marker for identifying individuals with an increased cardiovascular risk [64].
Another noteworthy finding was the significant inverse relationship between HDL levels and IMT progression in the COVID-19 group, underscoring the protective role of HDL and the need for lipid profile optimization in post-COVID-19 patients [65]. These results align with emerging evidence suggesting that individuals recovering from COVID-19 may be at an increased risk of early-onset atherosclerosis and underscore the importance of preventive measures [66,67,68,69]. Reports of increased rates of ischemic stroke and myocardial infarction following COVID-19 support this concern [66]. Additionally, genetic studies have revealed overlapping genetic pathways between COVID-19 and atherosclerosis, suggesting potential shared mechanisms underlying both conditions [70,71].
Although limited, the existing literature offers some comparative data. A meta-analysis of vascular function in post-COVID-19 patients demonstrated an impaired brachial artery flow-mediated dilation and altered pulse wave velocity, both of which indicate endothelial dysfunction and subclinical atherosclerosis [72]. These changes are predictive of future ASCVD events [73,74,75]. In a study by Danuta Loboda et al. [76], post-COVID-19 patients demonstrated a significant correlation between arterial stiffness and 10-year atherosclerotic cardiovascular disease (ASCVD) risks based on the SCORE2 algorithm. Similarly, Mario Podrug et al. [77] documented significant vascular changes within three months after infection when compared with pre-pandemic baseline measurements.
To the best of our knowledge, only five studies have investigated IMT in the context of COVID-19 in relation to atherosclerosis and cardiovascular risk. Jud et al. [78] found increased IMT (0.59 (0.52–0.68)) in post-COVID-19 patients compared with controls (0.44 (0.40–0.45)), though lower than in patients with known ASCVD (0.72 (0.60–1.01)). However, their cross-sectional design precluded the longitudinal assessment of IMT changes or the determination of causality. Szeghby et al. [79] reported no significant difference in IMT in young, healthy adults within weeks of infection, although markers of arterial stiffness were elevated. A follow-up study by the same group noted a slight increase in IMT at six months, though not statistically significant [80]. However, the findings are limited by the small sample size, lack of a control group, and absence of serial IMT measurements. Bezerra et al. [81] observed both increases and subsequent decreases in IMT among severely ill COVID-19 patients, suggesting that IMT may fluctuate depending on disease severity and recovery. Chen et al. [82] conducted a longitudinal study and found higher IMT in both asymptomatic/mild and severe/critical COVID-19 groups compared to controls. A modest IMT increase was observed over time in the asymptomatic/mild group, although the reasons remain unclear.
Taken together, only two of these studies showed statistically significant IMT elevations post-COVID-19, which aligns with our findings. Nevertheless, the work of Szeghby et al. [79,80] suggests a possible long-term risk that may manifest later. These findings support the hypothesis that COVID-19 infection may accelerate atherosclerotic changes, even in patients without overt cardiovascular disease. While our results indicate a statistically significant difference in carotid IMT progression between individuals with and without prior COVID-19, this finding alone does not fully establish the primary role of SARS-CoV-2 in accelerating atherosclerosis. Unmeasured factors, such as lipoprotein(a) levels or subtle differences in cardiovascular risk and comorbidities, may have influenced the results [83]. However, our multivariable regression analysis (Table 7) partially addresses these concerns by adjusting for several demographic and clinical parameters. In the overall cohort, a higher heart rate and history of vascular incidents were independently associated with a greater IMT progression, while in the COVID-19 group, disease severity showed a trend toward a greater increase in IMT, and a higher heart rate remained a significant predictor. These results indicate that while traditional risk factors remain important, COVID-19 may have an additional, independent effect. Nevertheless, future studies incorporating a broader panel of vascular and biochemical markers, including lipoprotein(a) and imidazole propionate, will be essential to more precisely quantify the independent impact of SARS-CoV-2 infection [84].
4.1. Limitations
The primary limitation of our study is its relatively small sample size, which may have limited the statistical power to detect subtle differences and reduced the generalizability of the findings. The lack of serological testing (e.g., anti-nucleocapsid antibodies) represents an additional limitation, as it may have led to the inclusion of participants with prior asymptomatic SARS-CoV-2 infection in the control group. Given the high local seroprevalence (>90%), such misclassification is likely [85]. However, this would be expected to attenuate, rather than inflate, between-group differences, suggesting that the true effect may be underestimated. This context justifies our decision to define groups based on symptomatic status, while also underscoring the importance of incorporating serological screening in future studies to improve group classification accuracy.
A further limitation is that, in some cases, the initial IMT measurement was conducted during the acute phase of infection. Nevertheless, our comparative analysis between acute-phase and post-recovery measurements did not show significant differences, suggesting only a minimal influence of acute-phase vascular changes.
Moreover, we did not collect detailed information on other important determinants of atherosclerosis progression, such as dietary habits, physical activity levels, and socioeconomic status. While pandemic-related lifestyle changes (e.g., reduced physical activity, altered diet) could have confounded the interpretation of vascular changes, we were unable to adjust for these factors in our analysis. Importantly, the study groups did not differ significantly in key baseline characteristics, including BMI and the prevalence of comorbidities, which suggests broadly similar lifestyle patterns. Nevertheless, unmeasured lifestyle differences remain a potential limitation and should be addressed in future longitudinal studies.
A drawback of our study is the potential for an inflated Type I error due to multiple statistical tests. Because of the exploratory nature of the analyses and the relatively small sample size, we did not apply formal multiple comparison corrections, which would have substantially reduced the statistical power and ability to detect potential associations. Instead, the interpretation of findings was based on effect sizes, confidence intervals, and their consistency with prior evidence, rather than on p-values alone. It will be necessary for future studies with larger cohorts to confirm these associations under more stringent statistical adjustments.
One further limitation concerns the relatively high loss to follow-up (45%), which raises the possibility of attrition bias. Although the primary reasons for dropout were logistical, participants who were lost may have differed systematically from those who remained, which could have influenced the observed associations. Therefore, the results should be interpreted with caution, and replication in larger cohorts with better follow-up retention is warranted.
4.2. Strengths
Despite its limitations, the study provides novel insights into IMT changes in post-COVID-19 patients, addressing a gap in the current literature. Among studies of this nature, our work stands out due to its relatively large COVID-19 group and matched control cohort.
The longitudinal design—with follow-up IMT measurements taken 12–18 months apart—allowed for an assessment of vascular changes over time. Furthermore, all ultrasound assessments were performed by the same experienced investigator using a standardized protocol recommended by the Polish Society of Vascular Surgery [86]. This consistency enhances the reliability and comparability of the data.
4.3. Future Research Directions
To build upon our findings, future studies should include larger cohorts to improve the statistical power and enhance the accuracy of mechanistic insights into COVID-19-associated vascular changes. Prospective, multicenter investigations will be critical in validating our results and in identifying causal links between COVID-19 and atherosclerosis progression.
In particular, a focus on metabolic dysfunction—including insulin resistance, chronic inflammation, and lipid disturbances—may help elucidate the pathophysiological mechanisms involved. While our study focused on IMT, the tunica media-to-intima thickness ratio is also an important early predictor of atherosclerosis [87]. Our imaging protocol did not permit separate measurements, but we note its relevance and recommend it for future research. The use of advanced imaging techniques, endothelial function assessments, and genetic profiling could provide additional layers of understanding.
The results of large-scale projects, such as the CARTESIAN study (“COVID-19 Effects on Arterial Stiffness and Vascular Aging”), expected in 2033, are eagerly anticipated and may shed light on long-term vascular aging and cardiovascular risk following COVID-19 [88].
We hope that the present findings stimulate further inquiry and contribute to the development of effective prevention and treatment strategies for individuals with an elevated cardiovascular risk following SARS-CoV-2 infection.
5. Conclusions
Our study suggests that symptomatic COVID-19 infection may accelerate the progression of subclinical atherosclerosis, as indicated by increased carotid IMT. This effect appears to be influenced by metabolic disturbances—particularly elevated TG/HDL ratios—and chronic inflammation, marked by raised CRP levels.
Despite limitations such as a small sample size and lack of variant-specific data, the findings support the need for cardiovascular monitoring in post-COVID-19 patients, especially those with metabolic risk factors. Larger long-term studies are needed to clarify the underlying mechanisms and guide prevention strategies.
Author Contributions
Conceptualization, P.S. and E.B.; methodology, P.S.; validation, E.B., P.P., and E.Z.; formal analysis, E.B. and E.Z.; investigation, E.B.; resources, P.P. and S.A.F.; data curation, E.B.; writing—original draft preparation, E.B.; writing—review and editing, E.B. and S.A.F.; visualization, S.A.F.; supervision, E.Z.; funding acquisition, E.B. All authors have read and agreed to the published version of the manuscript.
Funding
This research received no external funding.
Institutional Review Board Statement
The study was conducted in accordance with the Declaration of Helsinki and approved by the Bioethics Committee of the Medical University of Bialystok (Resolution No. APK.002.256.2022, 23 June 2022).
Informed Consent Statement
Informed consent was obtained from all subjects involved in the study.
Data Availability Statement
The original contributions presented in this study are included in the article. Further inquiries can be directed to the corresponding author.
Conflicts of Interest
The authors declare no conflicts of interest.
Correction Statement
This article has been republished with a minor correction to the Data Availability Statement. This change does not affect the scientific content of the article.
References
- Harrison, D.G.; Griendling, K.K. Pathophysiology of Hypertension. Hypertension 2016, 67, 1203–1210. [Google Scholar] [CrossRef]
- Odden, M.C.; Coxson, P.G.; Moran, A.; Lightwood, J.M.; Goldman, L.; Bibbins-Domingo, K. The Impact of the Aging Population on Coronary Heart Disease in the United States. Am. J. Med. 2011, 124, 827–833.e5. [Google Scholar] [CrossRef]
- Garrett, N.; Martini, E.M. The Boomers Are Coming: A Total Cost of Care Model of the Impact of Population Aging on the Cost of Chronic Conditions in the United States. Dis. Manag. 2007, 10, 51–60. [Google Scholar] [CrossRef]
- Lozano, R.; Naghavi, M.; Foreman, K.; Lim, S.; Shibuya, K.; Aboyans, V.; Abraham, J.; Adair, T.; Aggarwal, R.; Ahn, S.Y.; et al. Global and Regional Mortality from 235 Causes of Death for 20 Age Groups in 1990 and 2010: A Systematic Analysis for the Global Burden of Disease Study 2010. Lancet 2012, 380, 2095–2128. [Google Scholar] [CrossRef] [PubMed]
- Burton, W.N.; Schultz, A.B.; Chen, C.; Edington, D.W. The Association of Worker Productivity and Mental Health: A Review of the Literature. Int. J. Workplace Health Manag. 2008, 1, 78–94. [Google Scholar] [CrossRef]
- Frontiers|Smooth Muscle Cell—Macrophage Interactions Leading to Foam Cell Formation in Atherosclerosis: Location, Location, Location. Available online: https://www.frontiersin.org/journals/physiology/articles/10.3389/fphys.2022.921597/full (accessed on 6 November 2024).
- Malekmohammad, K.; Bezsonov, E.E.; Rafieian-Kopaei, M. Role of Lipid Accumulation and Inflammation in Atherosclerosis: Focus on Molecular and Cellular Mechanisms. Front. Cardiovasc. Med. 2021, 8, 707529. [Google Scholar] [CrossRef] [PubMed]
- Fularski, P.; Czarnik, W.; Dąbek, B.; Lisińska, W.; Radzioch, E.; Witkowska, A.; Młynarska, E.; Rysz, J.; Franczyk, B. Broader Perspective on Atherosclerosis—Selected Risk Factors, Biomarkers, and Therapeutic Approach. Int. J. Mol. Sci. 2024, 25, 5212. [Google Scholar] [CrossRef]
- Poznyak, A.V.; Sadykhov, N.K.; Kartuesov, A.G.; Borisov, E.E.; Melnichenko, A.A.; Grechko, A.V.; Orekhov, A.N. Hypertension as a Risk Factor for Atherosclerosis: Cardiovascular Risk Assessment. Front. Cardiovasc. Med. 2022, 9, 959285. [Google Scholar] [CrossRef]
- Nahmias, A.; Stahel, P.; Xiao, C.; Lewis, G.F. Glycemia and Atherosclerotic Cardiovascular Disease: Exploring the Gap Between Risk Marker and Risk Factor. Front. Cardiovasc. Med. 2020, 7, 100. [Google Scholar] [CrossRef]
- Libby, P.; Ridker, P.M.; Hansson, G.K. Progress and Challenges in Translating the Biology of Atherosclerosis. Nature 2011, 473, 317–325. [Google Scholar] [CrossRef]
- Bäck, M.; Yurdagul, A.; Tabas, I.; Öörni, K.; Kovanen, P.T. Inflammation and Its Resolution in Atherosclerosis: Mediators and Therapeutic Opportunities. Nat. Rev. Cardiol. 2019, 16, 389–406. [Google Scholar] [CrossRef]
- Bailey, A.L.; Al-Adwan, S.; Sneij, E.; Campbell, N.; Wiisanen, M.E. Atherosclerotic Cardiovascular Disease in Individuals with Hepatitis C Viral Infection. Curr. Cardiol. Rep. 2021, 23, 52. [Google Scholar] [CrossRef]
- Post, W.S.; Budoff, M.; Kingsley, L.; Palella, F.J.; Witt, M.D.; Li, X.; George, R.T.; Brown, T.T.; Jacobson, L.P. Associations Between HIV Infection and Subclinical Coronary Atherosclerosis. Ann. Intern. Med. 2014, 160, 458–467. [Google Scholar] [CrossRef]
- Latent Tuberculosis Infection and Subclinical Coronary Atherosclerosis in Peru and Uganda|Clinical Infectious Diseases|Oxford Academic. Available online: https://academic.oup.com/cid/article/73/9/e3384/6060062 (accessed on 6 November 2024).
- Yamanashi, H.; Koyamatsu, J.; Nagayoshi, M.; Shimizu, Y.; Kawashiri, S.-Y.; Kondo, H.; Fukui, S.; Tamai, M.; Sato, S.; Yanagihara, K.; et al. Human T-Cell Leukemia Virus-1 Infection Is Associated With Atherosclerosis as Measured by Carotid Intima-Media Thickness in Japanese Community-Dwelling Older People. Clin. Infect. Dis. 2018, 67, 291–294. [Google Scholar] [CrossRef] [PubMed]
- Ludwig, M.; von Petzinger-Kruthoff, A.; von Buquoy, M.; Stumpe, K.O. Intima media thickness of the carotid arteries: Early pointer to arteriosclerosis and therapeutic endpoint. Ultraschall Med. 2003, 24, 162–174. [Google Scholar] [CrossRef] [PubMed]
- Nezu, T.; Hosomi, N.; Aoki, S.; Matsumoto, M. Carotid Intima-Media Thickness for Atherosclerosis. J. Atheroscler. Thromb. 2016, 23, 18–31. [Google Scholar] [CrossRef]
- Naqvi, T.Z.; Lee, M.-S. Carotid Intima-Media Thickness and Plaque in Cardiovascular Risk Assessment. JACC Cardiovasc. Imaging 2014, 7, 1025–1038. [Google Scholar] [CrossRef]
- Jäger, K.A. Early detection of arteriosclerosis. Ultraschall Med. 2003, 24, 151–152. [Google Scholar] [CrossRef]
- Coronavirus Disease (COVID-19)—World Health Organization. Available online: https://www.who.int/emergencies/diseases/novel-coronavirus-2019 (accessed on 6 November 2024).
- Al-Aly, Z.; Xie, Y.; Bowe, B. High-Dimensional Characterization of Post-Acute Sequelae of COVID-19. Nature 2021, 594, 259–264. [Google Scholar] [CrossRef] [PubMed]
- Al-Aly, Z.; Topol, E. Solving the Puzzle of Long Covid. Science 2024, 383, 830–832. [Google Scholar] [CrossRef]
- Davis, H.E.; McCorkell, L.; Vogel, J.M.; Topol, E.J. Long COVID: Major Findings, Mechanisms and Recommendations. Nat. Rev. Microbiol. 2023, 21, 133–146. [Google Scholar] [CrossRef] [PubMed]
- Xie, Y.; Xu, E.; Bowe, B.; Al-Aly, Z. Long-Term Cardiovascular Outcomes of COVID-19. Nat. Med. 2022, 28, 583–590. [Google Scholar] [CrossRef] [PubMed]
- Xie, Y.; Al-Aly, Z. Risks and Burdens of Incident Diabetes in Long COVID: A Cohort Study. Lancet Diabetes Endocrinol. 2022, 10, 311–321. [Google Scholar] [CrossRef] [PubMed]
- Xie, Y.; Xu, E.; Al-Aly, Z. Risks of Mental Health Outcomes in People with Covid-19: Cohort Study. BMJ 2022, 376, e068993. [Google Scholar] [CrossRef]
- Al-Aly, Z.; Bowe, B.; Xie, Y. Long COVID after Breakthrough SARS-CoV-2 Infection. Nat. Med. 2022, 28, 1461–1467. [Google Scholar] [CrossRef]
- Xu, E.; Xie, Y.; Al-Aly, Z. Long-Term Neurologic Outcomes of COVID-19. Nat. Med. 2022, 28, 2406–2415. [Google Scholar] [CrossRef]
- Bowe, B.; Xie, Y.; Xu, E.; Al-Aly, Z. Kidney Outcomes in Long COVID. J. Am. Soc. Nephrol. 2021, 32, 2851–2862. [Google Scholar] [CrossRef]
- Xie, Y.; Bowe, B.; Al-Aly, Z. Burdens of Post-Acute Sequelae of COVID-19 by Severity of Acute Infection, Demographics and Health Status. Nat. Commun. 2021, 12, 6571. [Google Scholar] [CrossRef]
- Xu, E.; Xie, Y.; Al-Aly, Z. Risks and Burdens of Incident Dyslipidaemia in Long COVID: A Cohort Study. Lancet Diabetes Endocrinol. 2023, 11, 120–128. [Google Scholar] [CrossRef]
- Xu, E.; Xie, Y.; Al-Aly, Z. Long-Term Gastrointestinal Outcomes of COVID-19. Nat. Commun. 2023, 14, 983. [Google Scholar] [CrossRef]
- Taquet, M.; Dercon, Q.; Luciano, S.; Geddes, J.R.; Husain, M.; Harrison, P.J. Incidence, Co-Occurrence, and Evolution of Long-COVID Features: A 6-Month Retrospective Cohort Study of 273,618 Survivors of COVID-19. PLoS Med. 2021, 18, e1003773. [Google Scholar] [CrossRef]
- Carlile, O.; Briggs, A.; Henderson, A.D.; Butler-Cole, B.F.C.; Tazare, J.; Tomlinson, L.A.; Marks, M.; Jit, M.; Lin, L.-Y.; Bates, C.; et al. Impact of Long COVID on Health-Related Quality-of-Life: An OpenSAFELY Population Cohort Study Using Patient-Reported Outcome Measures (OpenPROMPT). Lancet Reg. Health–Eur. 2024, 40, 100908. [Google Scholar] [CrossRef]
- Farshidfar, F.; Koleini, N.; Ardehali, H. Cardiovascular Complications of COVID-19. JCI Insight 2021, 6, e148980. [Google Scholar] [CrossRef] [PubMed]
- Palazzuoli, A.; Giustozzi, M.; Ruocco, G.; Tramonte, F.; Gronda, E.; Agnelli, G. Thromboembolic Complications in Covid-19: From Clinical Scenario to Laboratory Evidence. Life 2021, 11, 395. [Google Scholar] [CrossRef] [PubMed]
- Łoboda, D.; Sarecka-Hujar, B.; Wilczek, J.; Gibiński, M.; Zielińska-Danch, W.; Szołtysek-Bołdys, I.; Paradowska-Nowakowska, E.; Nowacka-Chmielewska, M.; Grabowski, M.; Lejawa, M.; et al. Cardiac Status and Atherosclerotic Cardiovascular Risk of Convalescents after COVID-19 in Poland. Pol. Arch. Intern. Med. 2023, 133, 16449. [Google Scholar] [CrossRef]
- Guo, T.; Fan, Y.; Chen, M.; Wu, X.; Zhang, L.; He, T.; Wang, H.; Wan, J.; Wang, X.; Lu, Z. Cardiovascular Implications of Fatal Outcomes of Patients with Coronavirus Disease 2019 (COVID-19). JAMA Cardiol. 2020, 5, 811–818. [Google Scholar] [CrossRef]
- Koleva, D.I.; Orbetzova, M.M.; Nikolova, J.G.; Deneva, T.I. Pathophysiological Role of Adiponectin, Leptin and Asymmetric Dimethylarginine in the Process of Atherosclerosis. Folia Med. 2016, 58, 234–240. [Google Scholar] [CrossRef]
- Freitas Lima, L.C.; Braga, V.d.A.; do Socorro de França Silva, M.; Cruz, J.d.C.; Sousa Santos, S.H.; de Oliveira Monteiro, M.M.; Balarini, C.d.M. Adipokines, Diabetes and Atherosclerosis: An Inflammatory Association. Front. Physiol. 2015, 6, 304. [Google Scholar] [CrossRef]
- Montezano, A.C.; Nguyen Dinh Cat, A.; Rios, F.J.; Touyz, R.M. Angiotensin II and Vascular Injury. Curr. Hypertens. Rep. 2014, 16, 431. [Google Scholar] [CrossRef] [PubMed]
- Varga, Z.; Flammer, A.J.; Steiger, P.; Haberecker, M.; Andermatt, R.; Zinkernagel, A.S.; Mehra, M.R.; Schuepbach, R.A.; Ruschitzka, F.; Moch, H. Endothelial Cell Infection and Endotheliitis in COVID-19. Lancet 2020, 395, 1417–1418. [Google Scholar] [CrossRef]
- Panigada, M.; Bottino, N.; Tagliabue, P.; Grasselli, G.; Novembrino, C.; Chantarangkul, V.; Pesenti, A.; Peyvandi, F.; Tripodi, A. Hypercoagulability of COVID-19 Patients in Intensive Care Unit: A Report of Thromboelastography Findings and Other Parameters of Hemostasis. J. Thromb. Haemost. 2020, 18, 1738–1742. [Google Scholar] [CrossRef]
- Pine, A.B.; Meizlish, M.L.; Goshua, G.; Chang, C.-H.; Zhang, H.; Bishai, J.; Bahel, P.; Patel, A.; Gbyli, R.; Kwan, J.M.; et al. Circulating Markers of Angiogenesis and Endotheliopathy in COVID-19. Pulm. Circ. 2020, 10, 1–4. [Google Scholar] [CrossRef]
- Verdecchia, P.; Cavallini, C.; Spanevello, A.; Angeli, F. The Pivotal Link between ACE2 Deficiency and SARS-CoV-2 Infection. Eur. J. Intern. Med. 2020, 76, 14–20. [Google Scholar] [CrossRef] [PubMed]
- Li, H.; Horke, S.; Förstermann, U. Vascular Oxidative Stress, Nitric Oxide and Atherosclerosis. Atherosclerosis 2014, 237, 208–219. [Google Scholar] [CrossRef]
- Wu, Q.; Zhou, L.; Sun, X.; Yan, Z.; Hu, C.; Wu, J.; Xu, L.; Li, X.; Liu, H.; Yin, P.; et al. Altered Lipid Metabolism in Recovered SARS Patients Twelve Years after Infection. Sci. Rep. 2017, 7, 9110. [Google Scholar] [CrossRef]
- Kimura, L.F.; Sant’Anna, M.B.; Andrade, S.A.; Ebram, M.C.; Lima, C.F.G.; Celano, R.M.G.; Viégas, R.F.M.; Picolo, G. COVID-19 Induces Proatherogenic Alterations in Moderate to Severe Non-Comorbid Patients: A Single-Center Observational Study. Blood Cells Mol. Dis. 2021, 92, 102604. [Google Scholar] [CrossRef] [PubMed]
- Emiroglu, C.; Dicle, M.; Yesiloglu, C.; Gorpelioglu, S.; Aypak, C. Association between Newly Diagnosed Hyperglycemia/Diabetes Mellitus, Atherogenic Index of Plasma and Obesity in Post-COVID-19 Syndrome Patients. Endocrine 2024, 84, 470–480. [Google Scholar] [CrossRef] [PubMed]
- Ahmad, S.J.; Feigen, C.M.; Vazquez, J.P.; Kobets, A.J.; Altschul, D.J. Neurological Sequelae of COVID-19. J. Integr. Neurosci. 2022, 21, 77. [Google Scholar] [CrossRef]
- Zhang, X.; Yao, S.; Sun, G.; Yu, S.; Sun, Z.; Zheng, L.; Xu, C.; Li, J.; Sun, Y. Total and Abdominal Obesity among Rural Chinese Women and the Association with Hypertension. Nutrition 2012, 28, 46–52. [Google Scholar] [CrossRef]
- Collins, S.P.; Chappell, M.C.; Files, D.C. The Renin–Angiotensin–Aldosterone System in COVID-19–Related and Non–COVID-19–Related Acute Respiratory Distress Syndrome: Not So Different after All? Am. J. Respir. Crit. Care Med. 2021, 204, 1007–1008. [Google Scholar] [CrossRef]
- COVID-19 in the Initiation and Progression of Atherosclerosis: Pathophysiology During and Beyond the Acute Phase|JACC: Advances. Available online: https://www.jacc.org/doi/10.1016/j.jacadv.2024.101107 (accessed on 14 August 2025).
- Riyaz Tramboo, S.; Elkhalifa, A.M.E.; Quibtiya, S.; Ali, S.I.; Nazir Shah, N.; Taifa, S.; Rakhshan, R.; Hussain Shah, I.; Ahmad Mir, M.; Malik, M.; et al. The Critical Impacts of Cytokine Storms in Respiratory Disorders. Heliyon 2024, 10, e29769. [Google Scholar] [CrossRef]
- Ngai, J.C.; Ko, F.W.; Ng, S.S.; To, K.; Tong, M.; Hui, D.S. The Long-term Impact of Severe Acute Respiratory Syndrome on Pulmonary Function, Exercise Capacity and Health Status. Respirology 2010, 15, 543–550. [Google Scholar] [CrossRef]
- Kamdar, A.; Sykes, R.; Thomson, C.R.; Mangion, K.; Ang, D.; Lee, M.A.; Van Agtmael, T.; Berry, C. Vascular Fibrosis and Extracellular Matrix Remodelling in Post-COVID 19 Conditions. Infect. Med. 2024, 3, 100147. [Google Scholar] [CrossRef] [PubMed]
- Desai, A.D.; Lavelle, M.; Boursiquot, B.C.; Wan, E.Y. Long-Term Complications of COVID-19. Am. J. Physiol. Cell Physiol. 2022, 322, C1–C11. [Google Scholar] [CrossRef]
- Carfì, A.; Bernabei, R.; Landi, F. Persistent Symptoms in Patients After Acute COVID-19. JAMA 2020, 324, 603–605. [Google Scholar] [CrossRef]
- Shang, J.; Ye, G.; Shi, K.; Wan, Y.; Luo, C.; Aihara, H.; Geng, Q.; Auerbach, A.; Li, F. Structural Basis of Receptor Recognition by SARS-CoV-2. Nature 2020, 581, 221–224. [Google Scholar] [CrossRef]
- Park, S.; Lakatta, E.G. Role of Inflammation in the Pathogenesis of Arterial Stiffness. Yonsei Med. J. 2012, 53, 258. [Google Scholar] [CrossRef]
- Gao, Y.-P.; Zhou, W.; Huang, P.-N.; Liu, H.-Y.; Bi, X.-J.; Zhu, Y.; Sun, J.; Tang, Q.-Y.; Li, L.; Zhang, J.; et al. Persistent Endothelial Dysfunction in Coronavirus Disease-2019 Survivors Late After Recovery. Front. Med. 2022, 9, 809033. [Google Scholar] [CrossRef] [PubMed]
- Wang, J.C.; Bennett, M. Aging and Atherosclerosis. Circ. Res. 2012, 111, 245–259. [Google Scholar] [CrossRef] [PubMed]
- Bampi, A.B.A.; Rochitte, C.E.; Favarato, D.; Lemos, P.A.; da Luz, P.L. Comparison of Non-Invasive Methods for the Detection of Coronary Atherosclerosis. Clinics 2009, 64, 675. [Google Scholar] [CrossRef]
- Gordon, T.; Castelli, W.P.; Hjortland, M.C.; Kannel, W.B.; Dawber, T.R. High Density Lipoprotein as a Protective Factor against Coronary Heart Disease. The Framingham Study. Am. J. Med. 1977, 62, 707–714. [Google Scholar] [CrossRef] [PubMed]
- Saeed, S.; Mancia, G. Arterial Stiffness and COVID-19: A Bidirectional Cause-effect Relationship. J. Clin. Hypertens. 2021, 23, 1099–1103. Available online: https://onlinelibrary.wiley.com/doi/10.1111/jch.14259 (accessed on 6 November 2024). [CrossRef]
- Cai, M.; Xie, Y.; Topol, E.J.; Al-Aly, Z. Three-Year Outcomes of Post-Acute Sequelae of COVID-19. Nat. Med. 2024, 30, 1564. [Google Scholar] [CrossRef]
- Mahmoud, E.O.; Elsabagh, Y.A.; Abd El Ghaffar, N.; Fawzy, M.W.; Hussein, M.A. Atherosclerosis Associated With COVID-19: Acute, Tends to Severely Involve Peripheral Arteries, and May Be Reversible. Angiology 2025, 76, 77–84. [Google Scholar] [CrossRef] [PubMed]
- Jalili, M.; Sayehmiri, K.; Ansari, N.; Pourhossein, B.; Fazeli, M.; Azizi Jalilian, F. Association between Influenza and COVID-19 Viruses and the Risk of Atherosclerosis: Meta-Analysis Study and Systematic Review. Adv. Respir. Med. 2022, 90, 338–348. [Google Scholar] [CrossRef] [PubMed]
- Das, D.; Podder, S. Unraveling the Molecular Crosstalk between Atherosclerosis and COVID-19 Comorbidity. Comput. Biol. Med. 2021, 134, 104459. [Google Scholar] [CrossRef]
- Zhang, J.; Zhang, L. Bioinformatics Approach to Identify the Influences of SARS-COV2 Infections on Atherosclerosis. Front. Cardiovasc. Med. 2022, 9, 907665. [Google Scholar] [CrossRef] [PubMed]
- Ratchford, S.M.; Stickford, J.L.; Province, V.M.; Stute, N.; Augenreich, M.A.; Koontz, L.K.; Bobo, L.K.; Stickford, A.S. Vascular Alterations among Young Adults with SARS-CoV-2. Am. J. Physiol.—Heart Circ. Physiol. 2020, 320, H404–H410. [Google Scholar] [CrossRef] [PubMed]
- Evans, P.C.; Rainger, G.E.; Mason, J.C.; Guzik, T.J.; Osto, E.; Stamataki, Z.; Neil, D.; Hoefer, I.E.; Fragiadaki, M.; Waltenberger, J.; et al. Endothelial Dysfunction in COVID-19: A Position Paper of the ESC Working Group for Atherosclerosis and Vascular Biology, and the ESC Council of Basic Cardiovascular Science. Cardiovasc. Res. 2020, 116, 2177–2184. [Google Scholar] [CrossRef]
- Thijssen, D.H.J.; Bruno, R.M.; van Mil, A.C.C.M.; Holder, S.M.; Faita, F.; Greyling, A.; Zock, P.L.; Taddei, S.; Deanfield, J.E.; Luscher, T.; et al. Expert Consensus and Evidence-Based Recommendations for the Assessment of Flow-Mediated Dilation in Humans. Eur. Heart J. 2019, 40, 2534–2547. [Google Scholar] [CrossRef]
- Xu, Y.; Arora, R.C.; Hiebert, B.M.; Lerner, B.; Szwajcer, A.; McDonald, K.; Rigatto, C.; Komenda, P.; Sood, M.M.; Tangri, N. Non-Invasive Endothelial Function Testing and the Risk of Adverse Outcomes: A Systematic Review and Meta-Analysis. Eur. Heart J. Cardiovasc. Imaging 2014, 15, 736–746. [Google Scholar] [CrossRef] [PubMed]
- Loboda, D.; Sarecka-Hujar, B.; Nowacka-Chmielewska, M.; Szoltysek-Boldys, I.; Zielinska-Danch, W.; Gibinski, M.; Wilczek, J.; Gardas, R.; Grabowski, M.; Lejawa, M.; et al. Relationship of Non-Invasive Arterial Stiffness Parameters with 10-Year Atherosclerotic Cardiovascular Disease Risk Score in Post-COVID-19 Patients-The Results of a Cross-Sectional Study. Life 2024, 14, 1105. [Google Scholar] [CrossRef]
- Podrug, M.; Koren, P.; Maras, E.D.; Podrug, J.; Čulić, V.; Perissiou, M.; Bruno, R.M.; Mudnić, I.; Boban, M.; Jerončić, A. Long-Term Adverse Effects of Mild COVID-19 Disease on Arterial Stiffness, and Systemic and Central Hemodynamics: A Pre-Post Study. J. Clin. Med. 2023, 12, 2123. [Google Scholar] [CrossRef]
- Jud, P.; Gressenberger, P.; Muster, V.; Avian, A.; Meinitzer, A.; Strohmaier, H.; Sourij, H.; Raggam, R.B.; Stradner, M.H.; Demel, U.; et al. Evaluation of Endothelial Dysfunction and Inflammatory Vasculopathy After SARS-CoV-2 Infection—A Cross-Sectional Study. Front. Cardiovasc. Med. 2021, 8, 750887. [Google Scholar] [CrossRef] [PubMed]
- Szeghy, R.E.; Province, V.M.; Stute, N.L.; Augenreich, M.A.; Koontz, L.K.; Stickford, J.L.; Stickford, A.S.L.; Ratchford, S.M. Carotid Stiffness, Intima-Media Thickness and Aortic Augmentation Index among Adults with SARS-CoV-2. Exp. Physiol. 2022, 107, 694–707. [Google Scholar] [CrossRef]
- Szeghy, R.E.; Stute, N.L.; Province, V.M.; Augenreich, M.A.; Stickford, J.L.; Stickford, A.S.L.; Ratchford, S.M. Six-Month Longitudinal Tracking of Arterial Stiffness and Blood Pressure in Young Adults Following SARS-CoV-2 Infection. J. Appl. Physiol. 2022, 132, 1297–1309. [Google Scholar] [CrossRef]
- Bezerra, C.S.; Leite, A.A.; da Costa, T.R.; Lins, E.M.; Godoi, E.T.A.M.; Cordeiro, L.H.d.O.; Raposo, M.C.F.; Brandão, S.C.S. Ultrasound Findings in Severe COVID-19: A Deeper Look through the Carotid Arteries. Radiol. Bras. 2022, 55, 329–336. [Google Scholar] [CrossRef]
- Chen, J.; Smith, K.; Xu, Q.; Ali, T.; Cavallazzi, R.; Ghafghazi, S.; Clifford, S.P.; Arnold, F.W.; Kong, M.; Huang, J. Long-Term Effects of COVID-19 on Vascular Parameters—A Prospective Longitudinal Ultrasound Clinical Study. J. Vasc. Ultrasound 2024, 48, 95–102. [Google Scholar] [CrossRef]
- Rehberger Likozar, A.; Zavrtanik, M.; Šebeštjen, M. Lipoprotein(a) in Atherosclerosis: From Pathophysiology to Clinical Relevance and Treatment Options. Ann. Med. 2020, 52, 162–177. [Google Scholar] [CrossRef]
- Dahl, T.B.; Aftab, F.; Prebensen, C.; Berdal, J.-E.; Ueland, T.; Barratt-Due, A.; Riise, A.M.D.; Ueland, P.M.; Hov, J.R.; Trøseid, M.; et al. Imidazole Propionate Is Increased in Severe COVID-19 and Correlates with Cardiac Involvement. J. Infect. 2025, 90, 106494. [Google Scholar] [CrossRef] [PubMed]
- Grzegorz Juszczyk, A.Z. Ogólnopolskie Badanie Seroepidemiologiczne COVID-19: OBSER-CO Raport Końcowy z Badania; Narodowy Instytut Zdrowia Publicznego–Państwowy Zakład Higieny (PZH–PIB): Warszawa, Poland, 2022. Available online: https://www.pzh.gov.pl/wp-content/uploads/2023/02/OBSERCO-Raport-koncowy-z-badania.pdf (accessed on 12 March 2023).
- Madycki, G.; Gabriel, M.; Hawro, P.; Pawlaczyk, K.; Kuczmik, W.; Urbanek, T. Duplex Doppler Ultrasound Examination of Carotid and Vertebral Arteries: Guidelines of the Polish Society for Vascular Surgery. Pol. Heart J. (Kardiol. Pol.) 2014, 72, 288–309. [Google Scholar] [CrossRef] [PubMed]
- Rodriguez-Macias, K.A.; Lind, L.; Naessen, T. Thicker Carotid Intima Layer and Thinner Media Layer in Subjects with Cardiovascular Diseases: An Investigation Using Noninvasive High-Frequency Ultrasound. Atherosclerosis 2006, 189, 393–400. [Google Scholar] [CrossRef] [PubMed]
- Bruno, R.M.; Spronck, B.; Hametner, B.; Hughes, A.; Lacolley, P.; Mayer, C.C.; Muiesan, M.L.; Rajkumar, C.; Terentes-Printzios, D.; Weber, T.; et al. Covid-19 Effects on ARTErial StIffness and Vascular AgeiNg: CARTESIAN Study Rationale and Protocol. Artery Res. 2020, 27, 59–68. [Google Scholar] [CrossRef] [PubMed]
Disclaimer/Publisher’s Note: The statements, opinions and data contained in all publications are solely those of the individual author(s) and contributor(s) and not of MDPI and/or the editor(s). MDPI and/or the editor(s) disclaim responsibility for any injury to people or property resulting from any ideas, methods, instructions or products referred to in the content. |
© 2025 by the authors. Licensee MDPI, Basel, Switzerland. This article is an open access article distributed under the terms and conditions of the Creative Commons Attribution (CC BY) license (https://creativecommons.org/licenses/by/4.0/).