
Investigation of P1/HC-Pro-Mediated ABA/Calcium Signaling Responses via Gene Silencing through High- and Low-Throughput RNA-seq Approaches


Abstract
:1. Introduction
2. Materials and Methods
2.1. Plant Materials and Transgenic Plants
2.2. cDNA Library Construction and RNA Sequencing
2.3. Differential Gene Expression Analysis and Functional Annotation
2.4. Quantification of Endogenous ABA and ABA Sensitivity Assay
2.5. Real-Time Quantitative PCR
2.6. Expression-Based Heatmaps and Principal Component Analysis (PCA)
3. Results
3.1. P1/HC-ProTu Suppressor Triggers Plant Defense Responses
3.2. P1/HC-ProTu Alters ABA-Induced Immune Responses
3.3. Quantification of Endogenous ABA and ABA Sensitivity Assay
3.4. P1/HC-ProTu Triggers Immune Responses in a Calcium-Dependent Manner
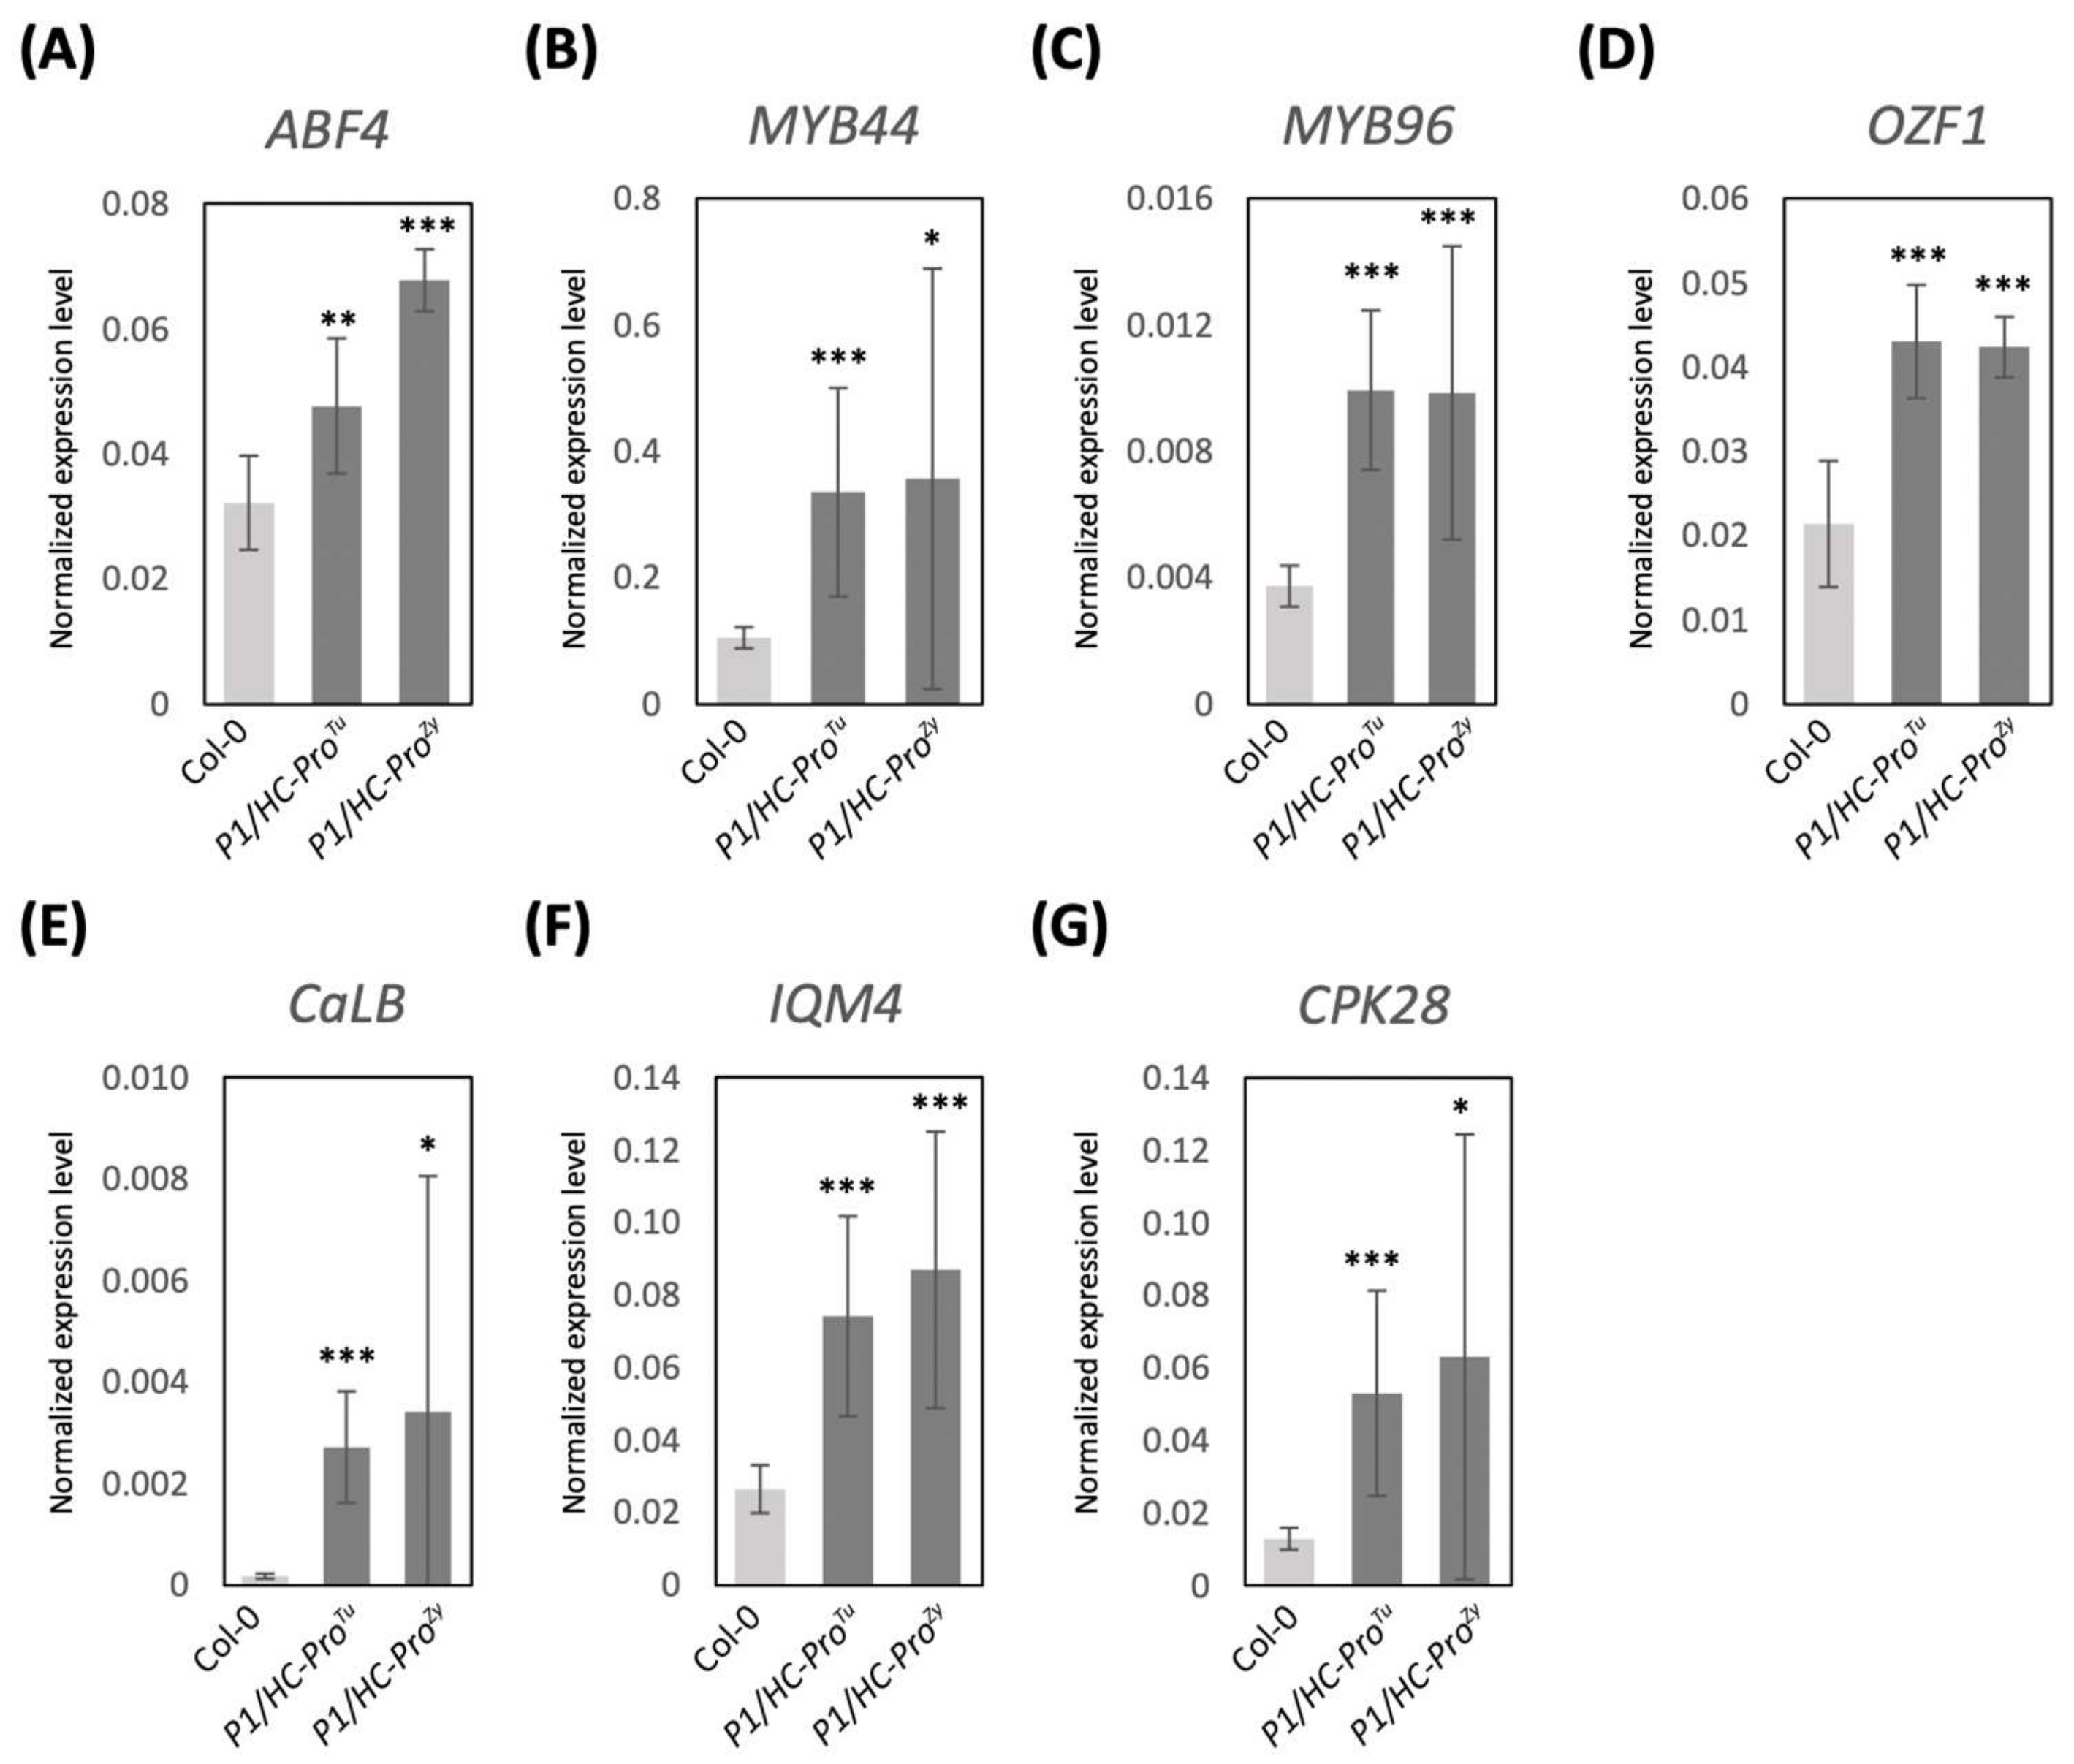
3.5. Validation of DEGs in the ABA and Ca2+ Pathways
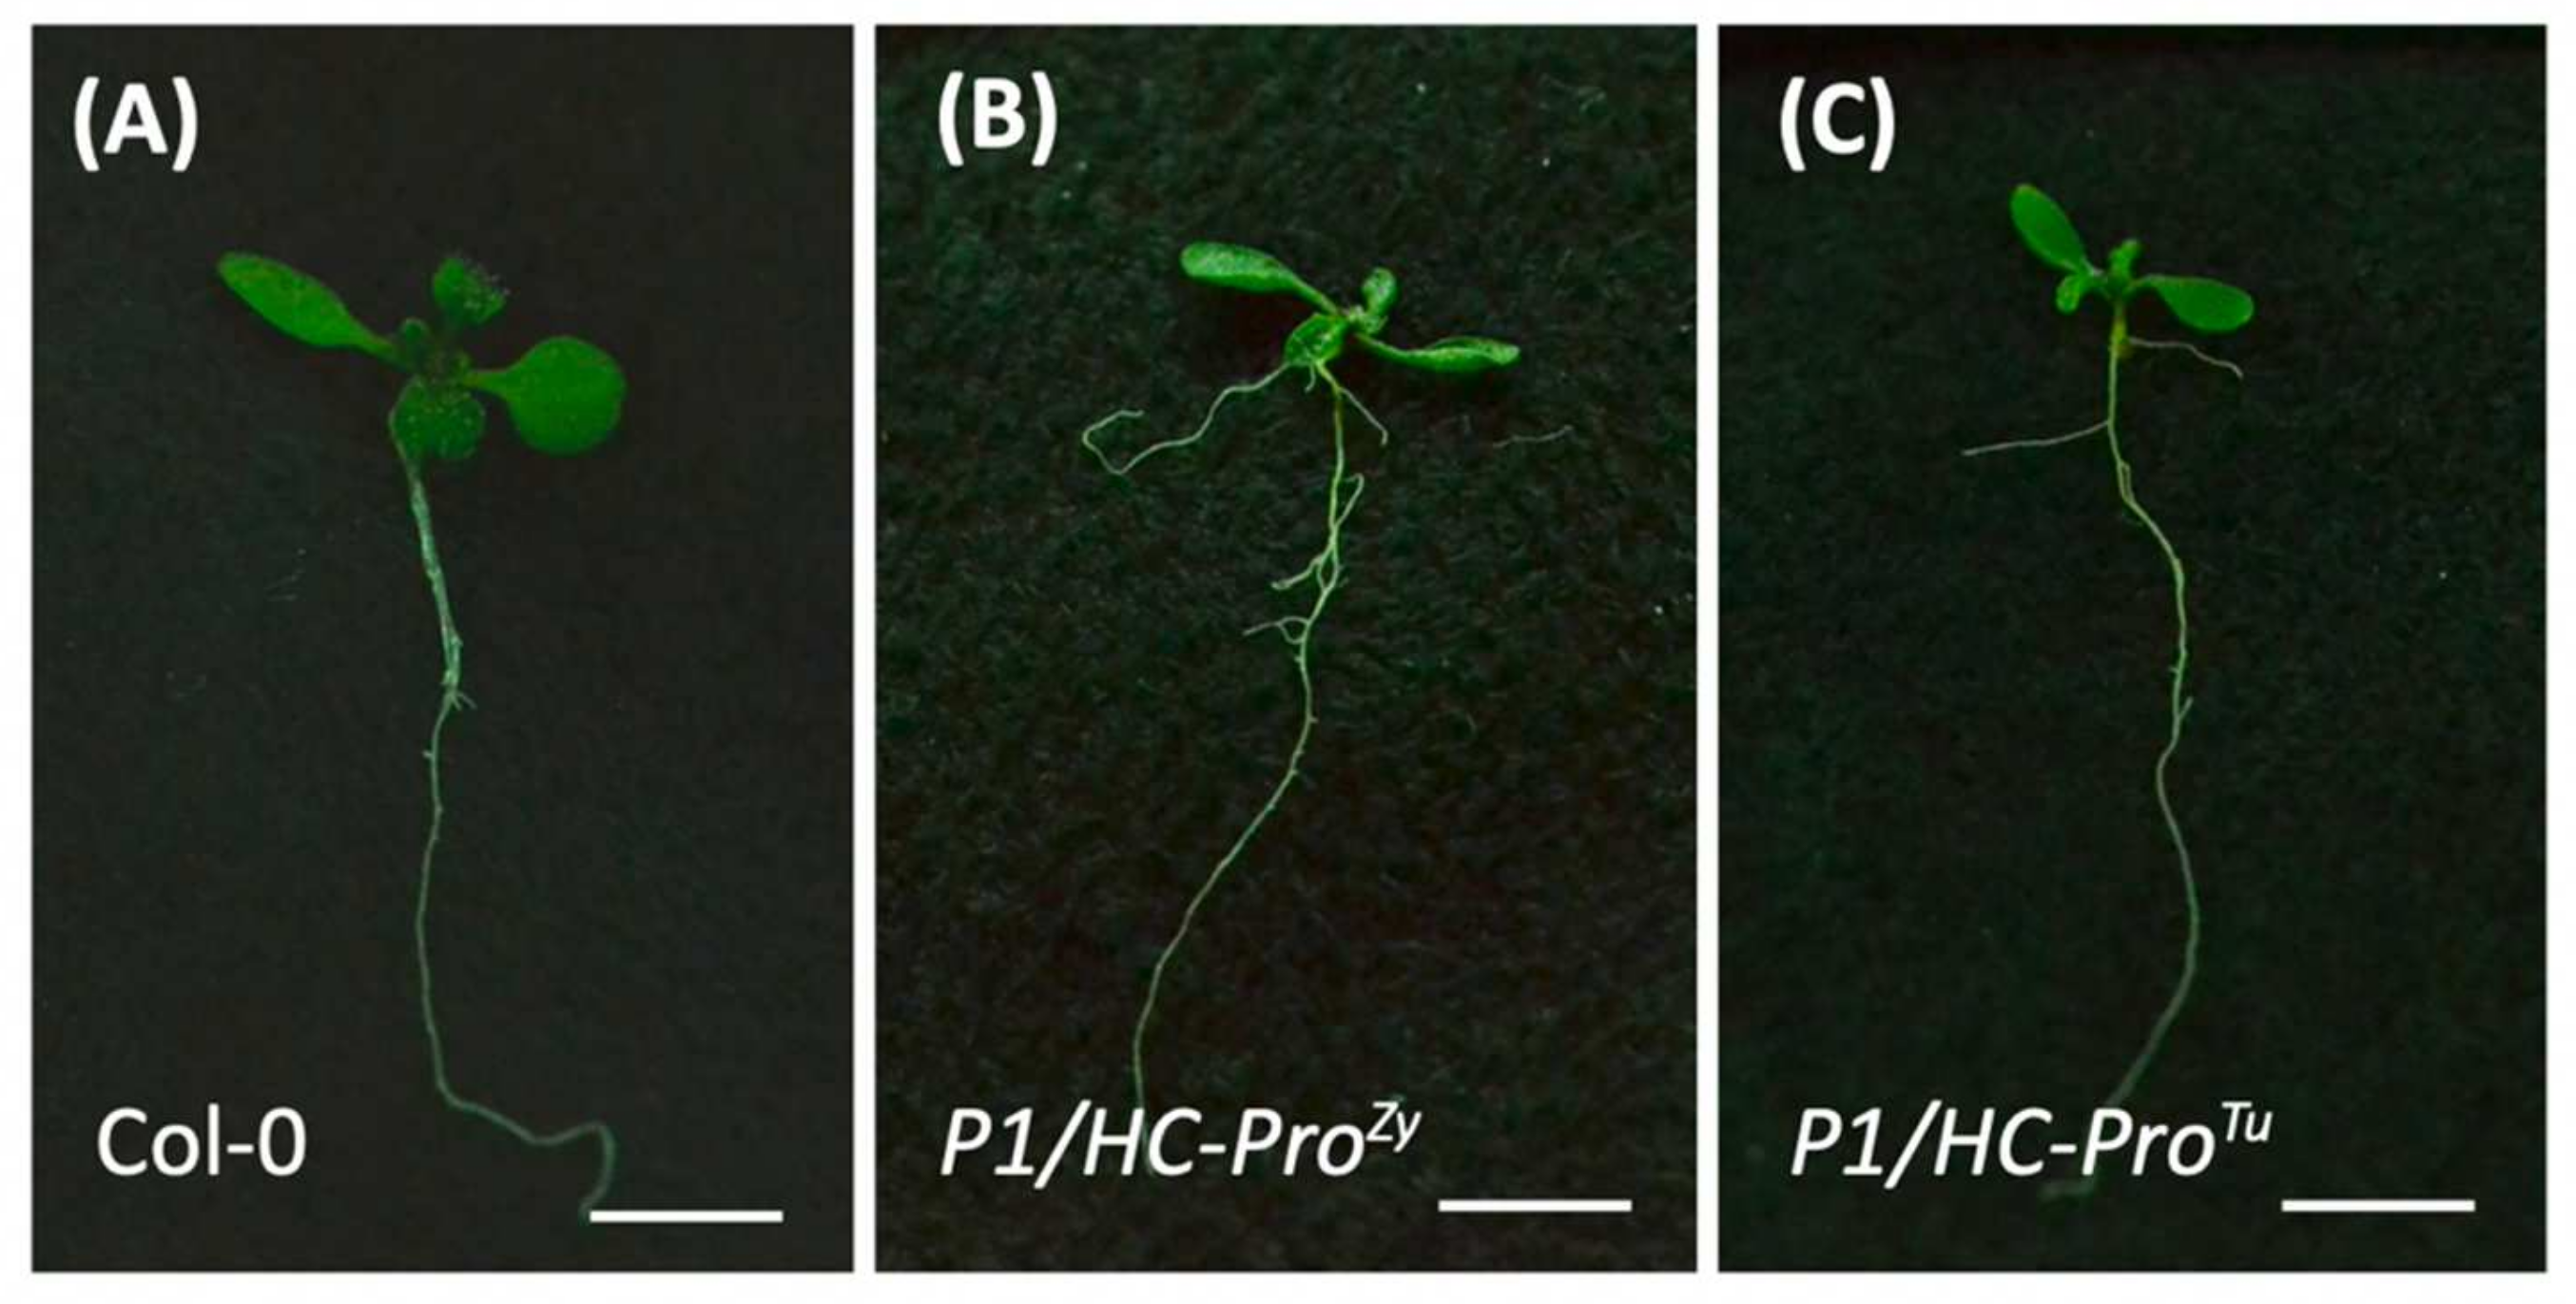
3.6. P1/HC-ProTu Triggers Drought Response and Stomatal Closure
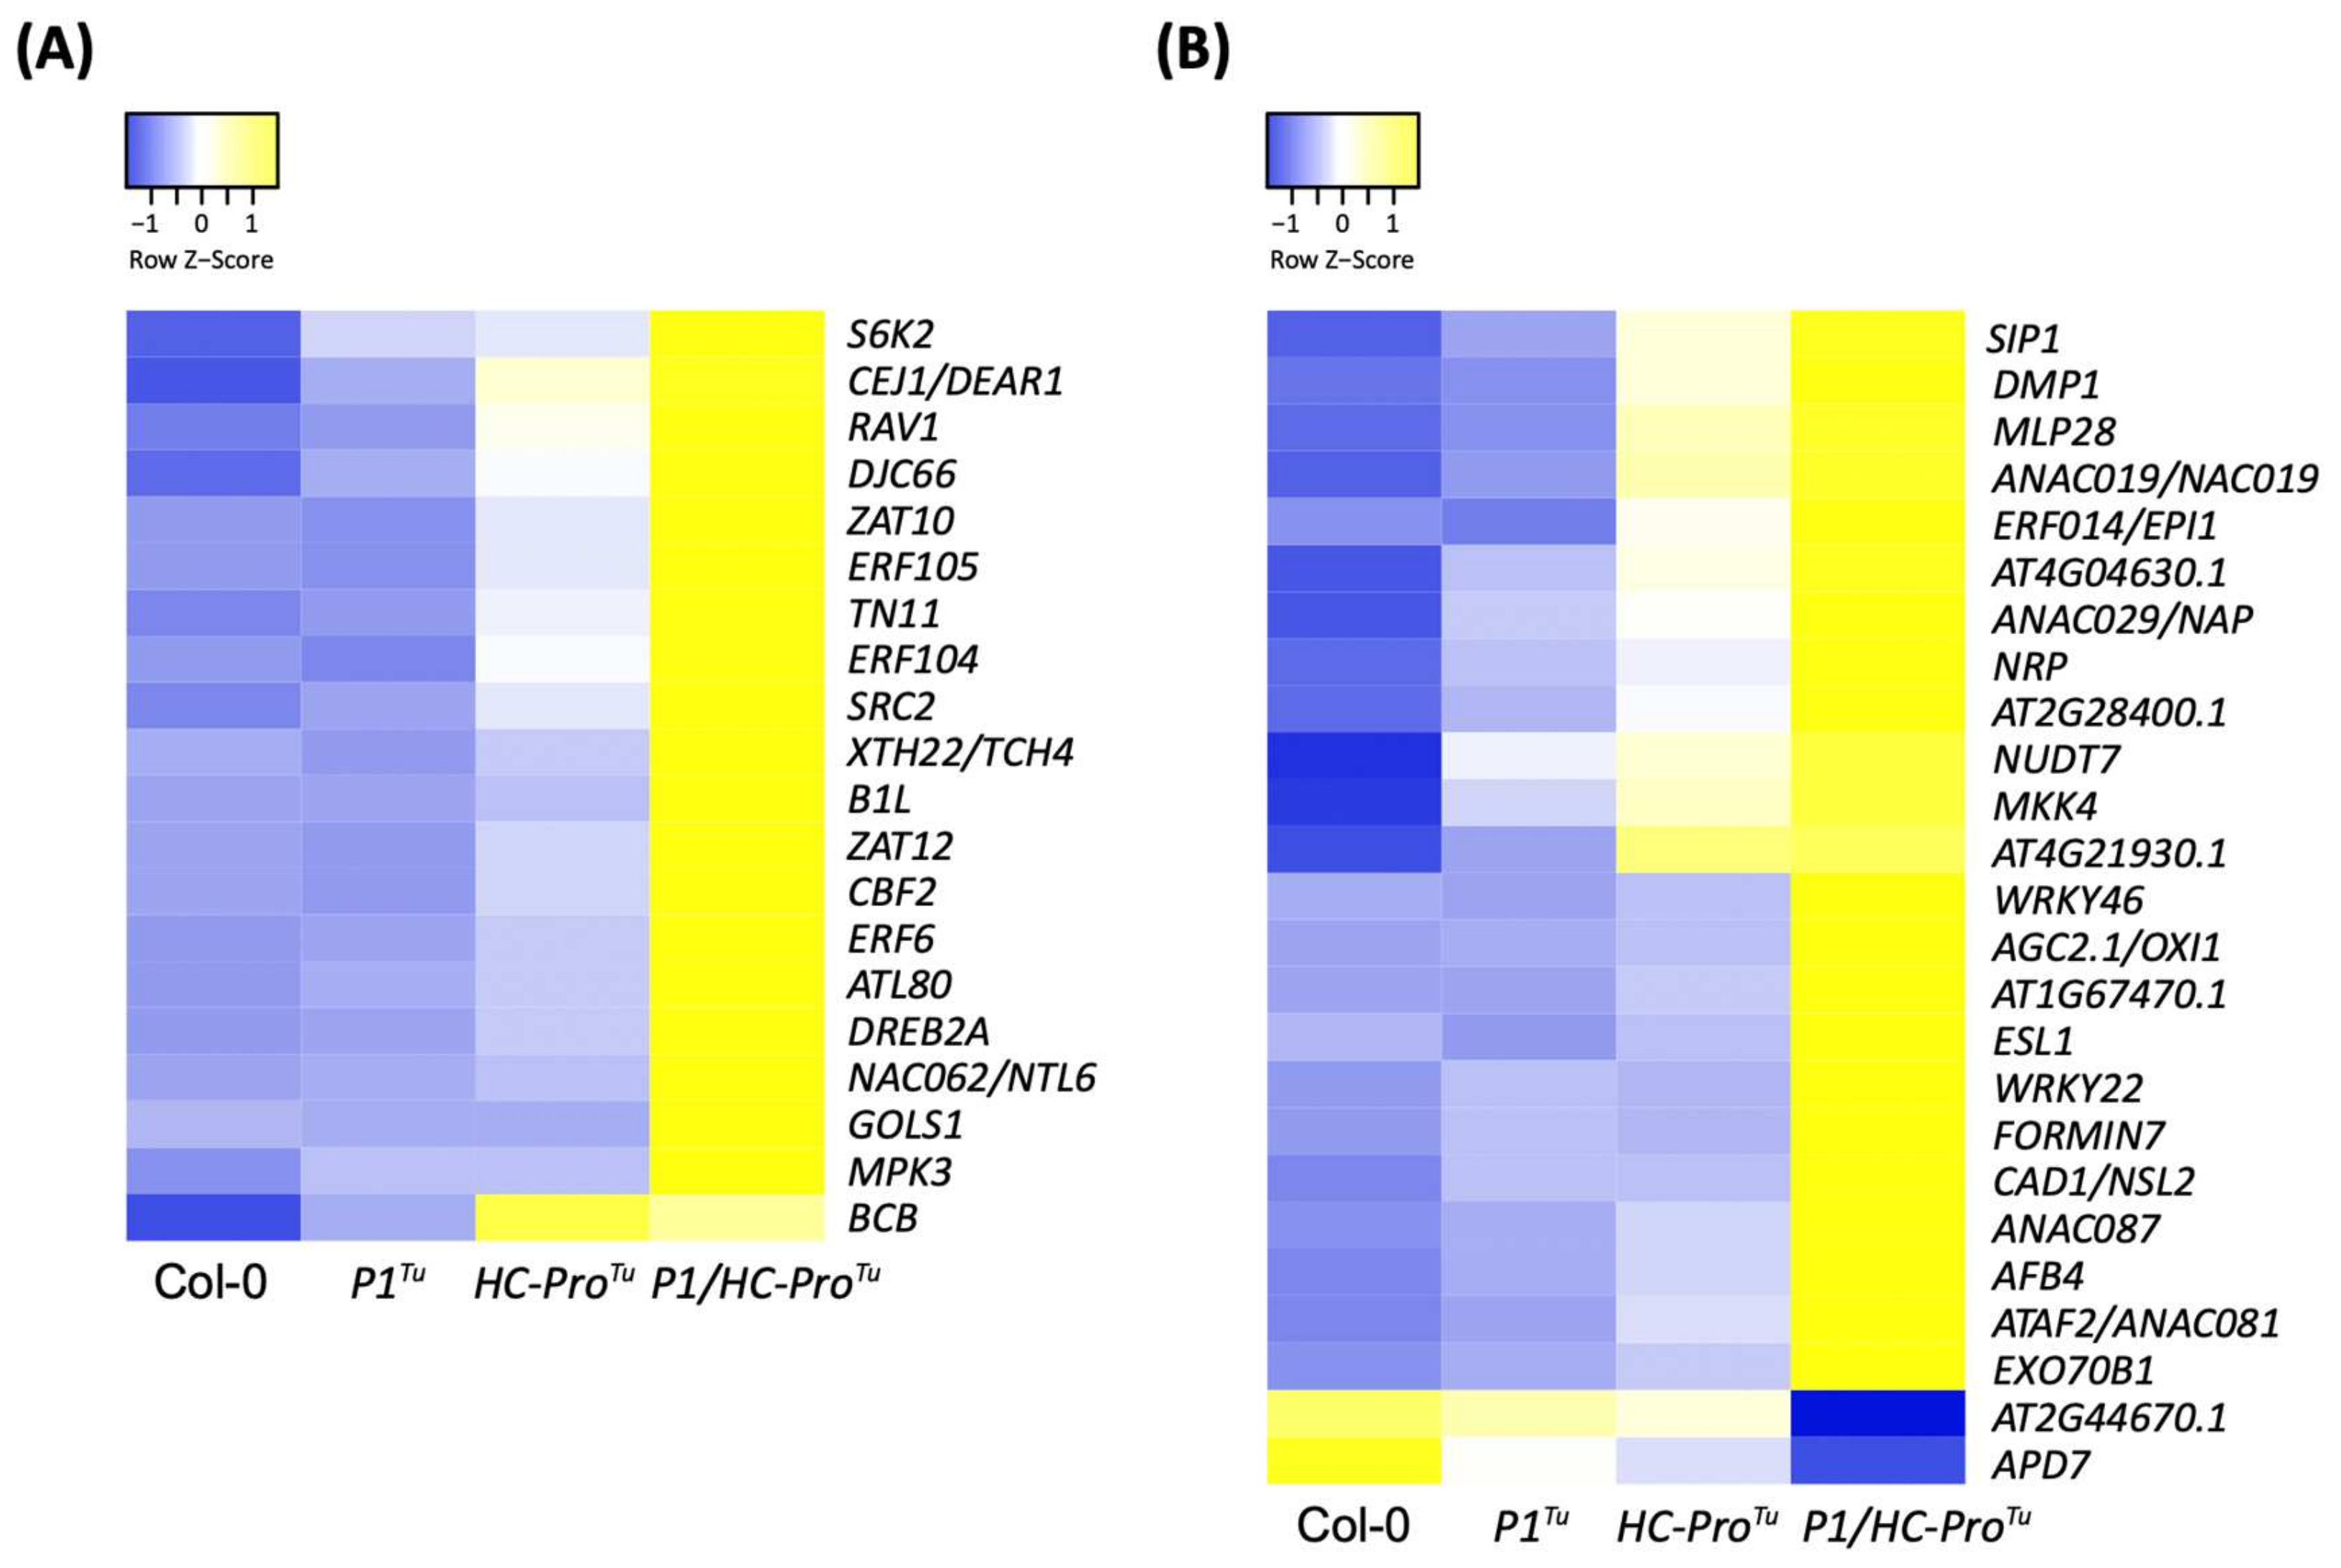
3.7. P1/HC-ProTu Stimulates Cold Response and Leaf Senescence
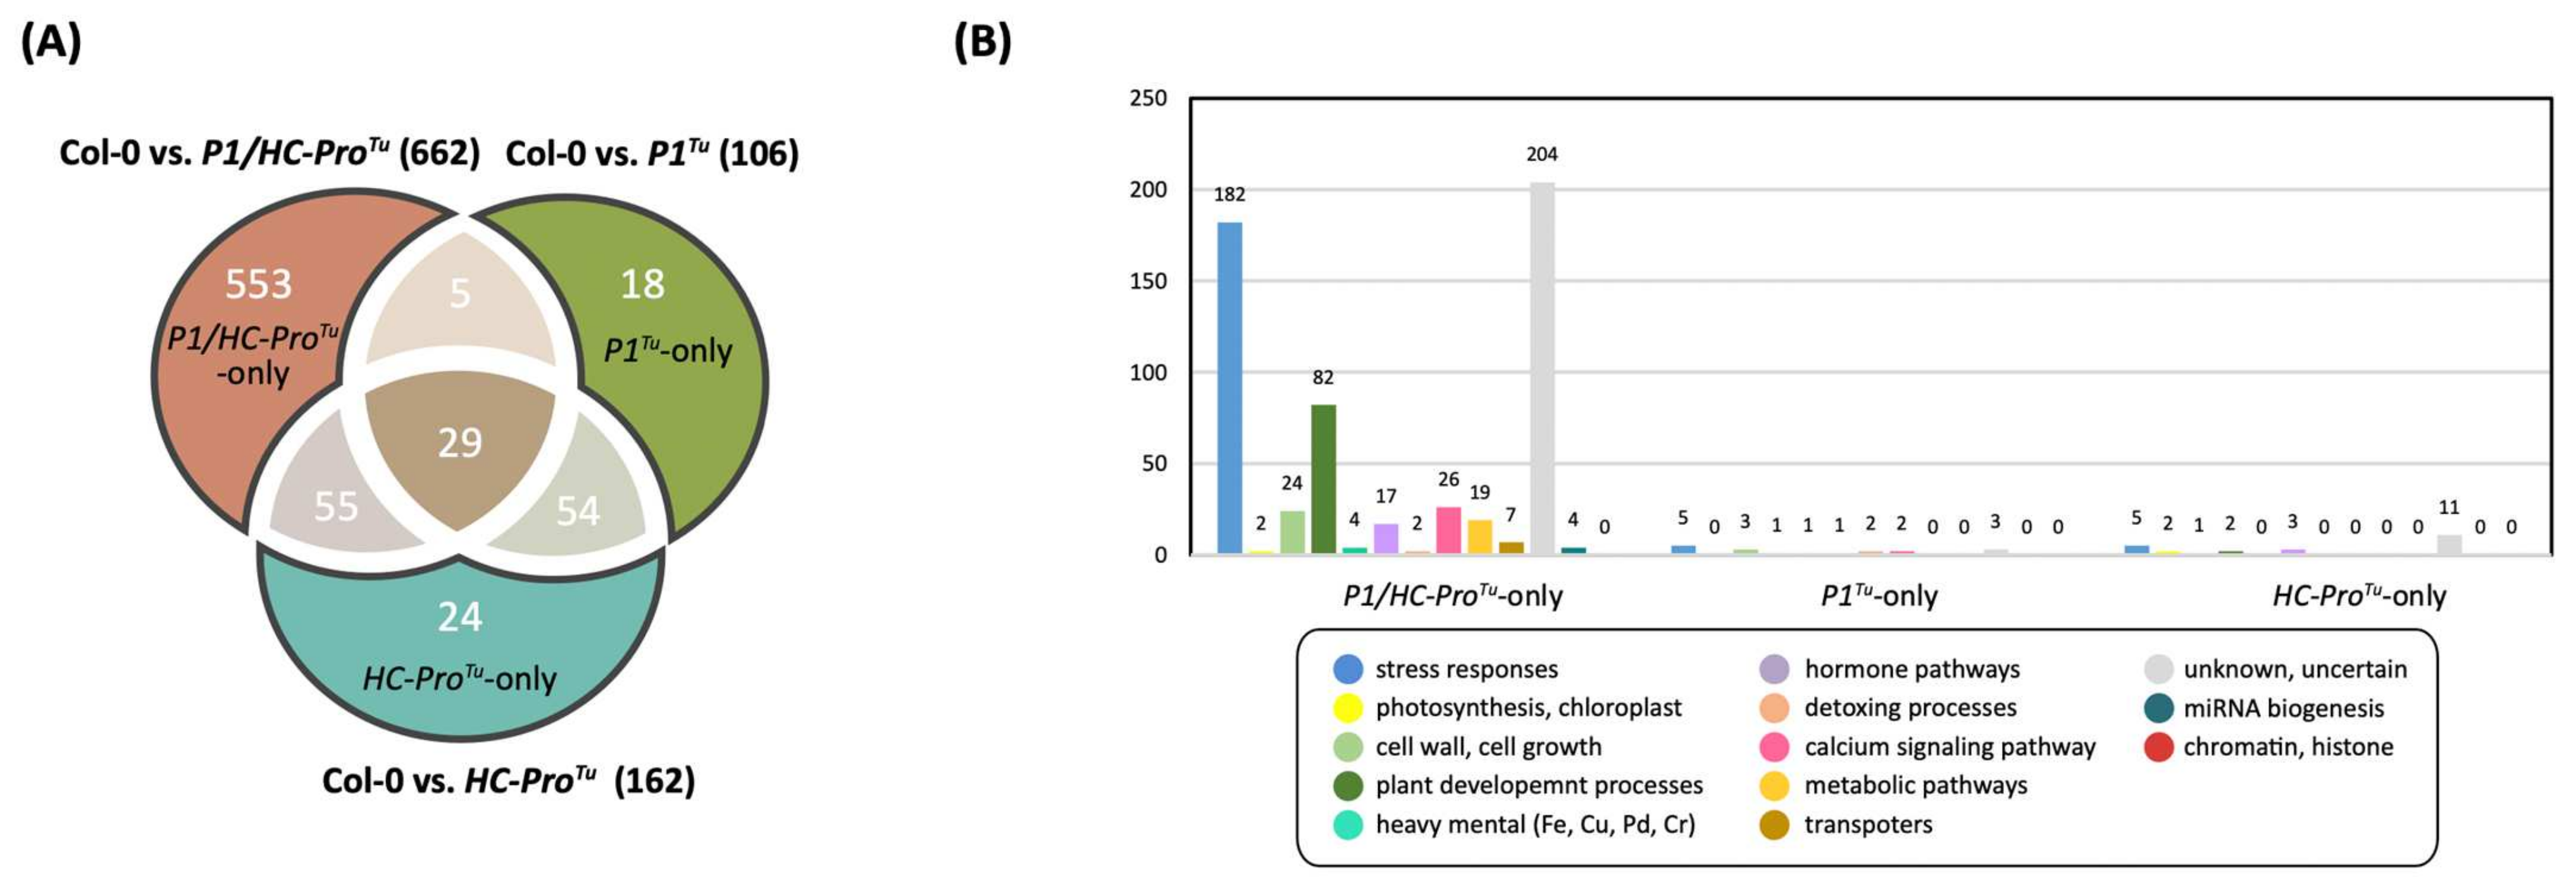
3.8. Comparison of the HTP and LTP Profiles
3.9. Functional Classification of the DEGs Identified from the LTP Profile
4. Discussion
4.1. P1/HC-ProTu Alters ABA and the Other Hormones Accumulations
4.2. P1/HC-ProTu Might Alter ABA and Calcium Signaling Crosstalk during Stomatal Closure and Drought Stress
4.3. The LTP NGS Strategy Enables the Collection of a Miniature of the HTP Sequencing Data
5. Conclusions
Author Contributions
Funding
Institutional Review Board Statement
Informed Consent Statement
Data Availability Statement
Acknowledgments
Conflicts of Interest
References
- Hu, S.F.; Wei, W.L.; Hong, S.F.; Fang, R.Y.; Wu, H.Y.; Lin, P.C.; Sanobar, N.; Wang, H.P.; Sulistio, M.; Wu, C.T.; et al. Investigation of the effects of P1 on HC-pro-mediated gene silencing suppression through genetics and omics approaches. Bot. Stud. 2020, 61, 22. [Google Scholar] [CrossRef]
- Kung, Y.J.; Lin, P.C.; Yeh, S.D.; Hong, S.F.; Chua, N.H.; Liu, L.Y.; Lin, C.P.; Huang, Y.H.; Wu, H.W.; Chen, C.C.; et al. Genetic analyses of the FRNK motif function of Turnip mosaic virus uncover multiple and potentially interactive pathways of cross-protection. Mol. Plant Microbe Interact. 2014, 27, 944–955. [Google Scholar] [CrossRef] [PubMed] [Green Version]
- Wu, H.W.; Lin, S.S.; Chen, K.C.; Yeh, S.D.; Chua, N.H. Discriminating mutations of HC-Pro of zucchini yellow mosaic virus with differential effects on small RNA pathways involved in viral pathogenicity and symptom development. Mol. Plant Microbe Interact. 2010, 23, 17–28. [Google Scholar] [CrossRef] [Green Version]
- Sanobar, N.; Lin, P.C.; Pan, Z.J.; Fang, R.Y.; Tjita, V.; Chen, F.F.; Wang, H.C.; Tsai, H.L.; Wu, S.H.; Shen, T.L.; et al. Investigating the Viral Suppressor HC-Pro Inhibiting Small RNA Methylation through Functional Comparison of HEN1 in Angiosperm and Bryophyte. Viruses 2021, 13, 1837. [Google Scholar] [CrossRef]
- Pasin, F.; Shan, H.; García, B.; Müller, M.; San León, D.; Ludman, M.; Fresno, D.H.; Fátyol, K.; Munné-Bosch, S.; Rodrigo, G.; et al. Abscisic Acid Connects Phytohormone Signaling with RNA Metabolic Pathways and Promotes an Antiviral Response that Is Evaded by a Self-Controlled RNA Virus. Plant Commun. 2020, 1, 100099. [Google Scholar] [CrossRef] [PubMed]
- Li, W.; Cui, X.; Meng, Z.; Huang, X.; Xie, Q.; Wu, H.; Jin, H.; Zhang, D.; Liang, W. Transcriptional regulation of Arabidopsis MIR168a and argonaute1 homeostasis in abscisic acid and abiotic stress responses. Plant Physiol. 2012, 158, 1279–1292. [Google Scholar] [CrossRef] [PubMed] [Green Version]
- Langmead, B.; Salzberg, S.L. Fast gapped-read alignment with Bowtie 2. Nat. Methods 2012, 9, 357–359. [Google Scholar] [CrossRef] [Green Version]
- Roberts, A.; Pachter, L. Streaming fragment assignment for real-time analysis of sequencing experiments. Nat. Methods 2013, 10, 71–73. [Google Scholar] [CrossRef] [Green Version]
- Untergasser, A.; Cutcutache, I.; Koressaar, T.; Ye, J.; Faircloth, B.C.; Remm, M.; Rozen, S.G. Primer3—New capabilities and interfaces. Nucleic Acids Res. 2012, 40, e115. [Google Scholar] [CrossRef] [PubMed] [Green Version]
- Metsalu, T.; Vilo, J. ClustVis: A web tool for visualizing clustering of multivariate data using Principal Component Analysis and heatmap. Nucleic Acids Res. 2015, 43, W566–W570. [Google Scholar] [CrossRef]
- Nakashima, K.; Yamaguchi-Shinozaki, K. ABA signaling in stress-response and seed development. Plant Cell Rep. 2013, 32, 959–970. [Google Scholar] [CrossRef]
- Edel, K.H.; Kudla, J. Integration of calcium and ABA signaling. Curr. Opin. Plant Biol. 2016, 33, 83–91. [Google Scholar] [CrossRef]
- Kutter, C.; Schob, H.; Stadler, M.; Meins, F., Jr.; Si-Ammour, A. MicroRNA-mediated regulation of stomatal development in Arabidopsis. Plant Cell 2007, 19, 2417–2429. [Google Scholar] [CrossRef] [PubMed] [Green Version]
- Knight, M.R.; Campbell, A.K.; Smith, S.M.; Trewavas, A.J. Transgenic plant aequorin reports the effects of touch and cold-shock and elicitors on cytoplasmic calcium. Nature 1991, 352, 524–526. [Google Scholar] [CrossRef]
- Zhang, Y.; Wang, H.L.; Li, Z.; Guo, H. Genetic Network between Leaf Senescence and Plant Immunity: Crucial Regulatory Nodes and New Insights. Plants 2020, 9, 495. [Google Scholar] [CrossRef] [Green Version]
- Chung, K.; Nakano, T.; Fujiwara, S.; Mitsuda, N.; Otsuki, N.; Tsujimoto-Inui, Y.; Naito, Y.; Ohme-Takagi, M.; Suzuki, K. The ERF transcription factor EPI1 is a negative regulator of dark-induced and jasmonate-stimulated senescence in Arabidopsis. Plant Biotechnol. 2016, 33, 235–243. [Google Scholar] [CrossRef] [Green Version]
- Zhou, X.; Jiang, Y.; Yu, D. WRKY22 transcription factor mediates dark-induced leaf senescence in Arabidopsis. Mol. Cells 2011, 31, 303–313. [Google Scholar] [CrossRef] [PubMed] [Green Version]
- Daneva, A.; Gao, Z.; Van Durme, M.; Nowack, M.K. Functions and Regulation of Programmed Cell Death in Plant Development. Annu. Rev. Cell Dev. Biol. 2016, 32, 441–468. [Google Scholar] [CrossRef] [PubMed]
- Khanna-Chopra, R. Leaf senescence and abiotic stresses share reactive oxygen species-mediated chloroplast degradation. Protoplasma 2012, 249, 469–481. [Google Scholar] [CrossRef] [PubMed]
- Asada, Y.; Yamamoto, M.; Tsutsui, T.; Yamaguchi, J. The Arabidopsis NSL2 negatively controls systemic acquired resistance via hypersensitive response. Plant Biotechnol. 2011, 28, 9–15. [Google Scholar] [CrossRef] [Green Version]
- Straus, M.R.; Rietz, S.; Ver Loren van Themaat, E.; Bartsch, M.; Parker, J.E. Salicylic acid antagonism of EDS1-driven cell death is important for immune and oxidative stress responses in Arabidopsis. Plant J. 2010, 62, 628–640. [Google Scholar] [CrossRef] [PubMed]
- Chinnusamy, V.; Gong, Z.; Zhu, J.K. Abscisic acid-mediated epigenetic processes in plant development and stress responses. J. Integr. Plant Biol. 2008, 50, 1187–1195. [Google Scholar] [CrossRef]
- Ton, J.; Flors, V.; Mauch-Mani, B. The multifaceted role of ABA in disease resistance. Trends Plant Sci. 2009, 14, 310–317. [Google Scholar] [CrossRef]
- Lim, C.W.; Baek, W.; Jung, J.; Kim, J.H.; Lee, S.C. Function of ABA in Stomatal Defense against Biotic and Drought Stresses. Int. J. Mol. Sci. 2015, 16, 15251–15270. [Google Scholar] [CrossRef] [Green Version]
- Allen, G.J.; Chu, S.P.; Harrington, C.L.; Schumacher, K.; Hoffmann, T.; Tang, Y.Y.; Grill, E.; Schroeder, J.I. A defined range of guard cell calcium oscillation parameters encodes stomatal movements. Nature 2001, 411, 1053–1057. [Google Scholar] [CrossRef] [PubMed]
- Fu, Z.Q.; Yan, S.; Saleh, A.; Wang, W.; Ruble, J.; Oka, N.; Mohan, R.; Spoel, S.H.; Tada, Y.; Zheng, N.; et al. NPR3 and NPR4 are receptors for the immune signal salicylic acid in plants. Nature 2012, 486, 228–232. [Google Scholar] [CrossRef] [Green Version]
- Wang, D.; Yang, C.; Wang, H.; Wu, Z.; Jiang, J.; Liu, J.; He, Z.; Chang, F.; Ma, H.; Wang, X. BKI1 Regulates Plant Architecture through Coordinated Inhibition of the Brassinosteroid and ERECTA Signaling Pathways in Arabidopsis. Mol. Plant 2017, 10, 297–308. [Google Scholar] [CrossRef] [Green Version]
- Baulcombe, D. RNA silencing in plants. Nature 2004, 431, 356–363. [Google Scholar] [CrossRef] [PubMed]
- Martínez de Alba, A.E.; Elvira-Matelot, E.; Vaucheret, H. Gene silencing in plants: A diversity of pathways. Biochim. Biophys. Acta 2013, 1829, 1300–1308. [Google Scholar] [CrossRef] [PubMed]
- Anandalakshmi, R.; Pruss, G.J.; Ge, X.; Marathe, R.; Mallory, A.C.; Smith, T.H.; Vance, V.B. A viral suppressor of gene silencing in plants. Proc. Natl. Acad. Sci. USA 1998, 95, 13079–13084. [Google Scholar] [CrossRef] [PubMed] [Green Version]
- Kasschau, K.D.; Carrington, J.C. A counterdefensive strategy of plant viruses: Suppression of posttranscriptional gene silencing. Cell 1998, 95, 461–470. [Google Scholar] [CrossRef] [Green Version]
- Kontra, L.; Csorba, T.; Tavazza, M.; Lucioli, A.; Tavazza, R.; Moxon, S.; Tisza, V.; Medzihradszky, A.; Turina, M.; Burgyán, J. Distinct Effects of p19 RNA Silencing Suppressor on Small RNA Mediated Pathways in Plants. PLoS Pathog. 2016, 12, e1005935. [Google Scholar] [CrossRef] [PubMed] [Green Version]
- Mallory, A.C.; Reinhart, B.J.; Bartel, D.; Vance, V.B.; Bowman, L.H. A viral suppressor of RNA silencing differentially regulates the accumulation of short interfering RNAs and micro-RNAs in tobacco. Proc. Natl. Acad. Sci. USA 2002, 99, 15228–15233. [Google Scholar] [CrossRef] [PubMed] [Green Version]
- Baráth, D.; Jaksa-Czotter, N.; Molnár, J.; Varga, T.; Balássy, J.; Szabó, L.K.; Kirilla, Z.; Tusnády, G.E.; Preininger, É.; Várallyay, É. Small RNA NGS Revealed the Presence of Cherry Virus A and Little Cherry Virus 1 on Apricots in Hungary. Viruses 2018, 10, 318. [Google Scholar] [CrossRef] [Green Version]
- Hadidi, A.; Flores, R.; Candresse, T.; Barba, M. Next-Generation Sequencing and Genome Editing in Plant Virology. Front. Microbiol. 2016, 7, 1325. [Google Scholar] [CrossRef] [PubMed]
- Pesti, R.; Kontra, L.; Paul, K.; Vass, I.; Csorba, T.; Havelda, Z.; Várallyay, É. Differential gene expression and physiological changes during acute or persistent plant virus interactions may contribute to viral symptom differences. PLoS ONE 2019, 14, e0216618. [Google Scholar] [CrossRef]


| HTP | LTP | |||||
|---|---|---|---|---|---|---|
| Col-0 vs. P1/HC-ProTu | Col-0 vs. P1Tu | Col-0 vs. HC-ProTu | Col-0 vs. P1/HC-ProTu | Col-0 vs. P1Tu | Col-0 vs. HC-ProTu | |
| Passing rate | 80 | 80 | 80 | 80 | 80 | 80 |
| Fold change | 2 | 2 | 2 | 2 | 2 | 2 |
| (+) correlation | 97.5 | 97.5 | 97.5 | 95 | 95 | 95 |
| (−) correlation | 92.5 | 92.5 | 92.5 | 90 | 90 | 90 |
| Sample sets | 10/12 | 10/12 | 10/12 | 10/12 | 10/12 | 10/12 |
| Filtered DEGs | 1601 | 559 | 777 | 700 | 621 | 587 |
| Network genes | 662 | 106 | 162 | 188 | 243 | 193 |
| Categories | Subcategories | AGI Locus Code | Gene Name | Annotations |
|---|---|---|---|---|
| Homeostasis | Biosynthesis | AT3G02570 | PMI1/MEE31 | Mannose-6-phosphate isomerase, type I |
| AT3G51895 | SULTR3;1 | sulfate transporter 3;1 | ||
| Catabolism | AT5G45340 | CYP707A3 | Cytochrome P450, family 707, subfamily A, polypeptide 3 | |
| Transport | AT5G52050 | DTX50 | MATE efflux family protein | |
| Regulation | Posttranscriptional regulation | AT5G66070 | ATL27/ATARRE | RING/U-box superfamily protein |
| AT3G52450 | PUB22 | Plant U-box 22 | ||
| AT2G35930 | PUB23 | Plant U-box 23 | ||
| AT3G46620 | RDUF1 | Zinc finger (C3HC4-type RING finger) family protein | ||
| AT5G59550 | RDUF2/BTL09 | Zinc finger (C3HC4-type RING finger) family protein | ||
| Transcriptional regulation | AT3G61890 | HB12 | Homeobox 12 | |
| ABA-responses | Biotic | AT1G69480 | EXS | EXS (ERD1/XPR1/SYG1) family protein |
| AT1G32640 | MYC2 | Basic helix-loop-helix (bHLH) DNA-binding family protein | ||
| AT2G32030 | NA a | Acyl-CoA N-acyltransferases (NAT) superfamily protein | ||
| AT2G19810 | OZF1/TZF2 | CCCH-type zinc finger family protein | ||
| Cold | AT4G25470 | CBF2 | C-repeat/DRE binding factor 2 | |
| Cold | AT5G61600 | ERF104 | Ethylene response factor 104 | |
| Cold | AT5G51190 | ERF105 | Integrase-type DNA-binding superfamily protein | |
| Cold, Development | AT1G74670 | GASA6 | Gibberellin-regulated family protein | |
| Development | AT1G56170 | NF-YC2/HAP5B | Nuclear factor Y, subunit C2 | |
| Development | AT5G23220 | NIC3 | Nicotinamidase 3 | |
| Development | AT5G42050 | NRP | DCD (Development and Cell Death) domain protein, NRP has a positive role in ABA-mediated seed germination. | |
| Development, Drought | AT1G13260 | RAV1 | Related to ABI3/VP1 1 | |
| Development, Drought | AT5G39760 | HB23 | Homeobox protein 23 | |
| Drought | AT2G46510 | AIB/BHLH017 | ABA-inducible BHLH-type transcription factor | |
| Drought | AT2G25900 | ATCTH/TZF1 | Zinc finger C-x8-C-x5-C-x3-H type family protein | |
| Drought | AT1G74930 | ERF018/ORA47 | Integrase-type DNA-binding superfamily protein | |
| Drought | AT5G62470 | MYB96 | MYB domain protein 96 | |
| Drought | AT5G67300 | MYBR1/MYB44 | MYB domain protein r1 | |
| Drought | AT3G56880 | NA a | VQ motif-containing protein | |
| Drought | AT1G54160 | NF-YA5 | Nuclear factor Y, subunit A5 | |
| Drought | AT2G39800 | P5CS1 | Delta1-pyrroline-5-carboxylate synthase 1 | |
| Drought | AT3G11820 | SYR1/SYP121 | Syntaxin of plants 121 | |
| Drought | AT2G46400 | WRKY46 | WRKY DNA-binding protein 46 | |
| Drought, Cold | AT5G65300 | SUPA | Unknown protein | |
| Drought, Cold | AT1G72240 | SUPA-like | Unknown protein | |
| Drought, Senescence | AT1G08920 | ESL1 | ERD (early response to dehydration) six-like 1 | |
| Drought, Senescence, Chlorophyll degradation | AT1G69490 | ANAC029/NAP | NAC-like, activated by AP3/PI | |
| Multiple stress | AT3G48360 | BT2 | BTB and TAZ domain protein 2 | |
| Senescence | AT1G53170 | ERF8 | Ethylene response factor 8 | |
| Senescence, Chlorophyll degradation | AT4G24390 | AFB4 | RNI-like superfamily protein | |
| Uncertain | AT3G54200 | NHL39 | Late embryogenesis abundant (LEA) hydroxyproline-rich glycoprotein family |
| Categories | Subcategories | AGI Locus Code | Gene Name | Annotations |
|---|---|---|---|---|
| Transporter | Uniporter | AT1G27770 | ACA1 | Autoinhibited Ca2+-ATPase 1 |
| AT2G24610 | CNGC14 | Cyclic nucleotide-gated channel 14 | ||
| AT5G15410 | CNGC2/DND1 | Cyclic nucleotide-regulated ion channel family protein | ||
| AT5G17850 | CCX2 | Sodium/calcium exchanger family protein | ||
| AT5G66650 | CMCU | Protein of unknown function (DUF607) | ||
| Sensor | CaMs/CaMLs | AT1G66400 | CML23 | Calmodulin like 23 |
| AT1G76650 | CML38 | Calmodulin-like 38 | ||
| AT2G43290 | CML5/MSS3 | Calcium-binding EF-hand family protein | ||
| AT3G22930 | CML11 | Calmodulin-like 11 | ||
| AT5G37770 | CML24/TCH2 | EF hand calcium-binding protein family | ||
| AT5G39670 | CML46 | Calcium-binding EF-hand family protein | ||
| Other calcium-binding proteins | AT3G01830 | NA a | Calcium-binding EF-hand family protein | |
| AT3G16510 | CaLB | Calcium-dependent lipid-binding (CaLB domain) family protein | ||
| AT3G25600 | NA a | Calcium-binding EF-hand family protein | ||
| AT4G34150 | CaLB | Calcium-dependent lipid-binding (CaLB domain) family protein | ||
| Calmodulin-binding proteins | AT2G26190 | IQM4 | Calmodulin-binding family protein | |
| AT2G41010 | CAMBP25 | Calmodulin (CAM)-binding protein of 25 kDa | ||
| AT3G13600 | NA a | Calmodulin-binding family protein | ||
| AT3G16490 | IQD26 | IQ-domain 26 | ||
| AT5G26920 | CBP60G | Cam-binding protein 60-like G | ||
| AT5G35670 | IQD33 | IQ-domain 33 | ||
| AT5G57010 | NA a | Calmodulin-binding family protein | ||
| AT5G62570 | CBP60A | Calmodulin binding protein-like | ||
| CDPKs/CIPK | AT2G30360 | CIPK11/PKS5 | SOS3-interacting protein 4 | |
| AT3G57530 | CPK32 | Calcium-dependent protein kinase 32 | ||
| AT5G66210 | CPK28 | Calcium-dependent protein kinase 28 |
| AGI | Gene Name | Annotations | Categories b | ABA/Ca c |
|---|---|---|---|---|
| AT2G39800 | P5CS1 | Delta1-pyrroline-5-carboxylate synthase 1 | drought/stomata | ABA |
| AT3G46620 | RDUF1 | Zinc finger (C3HC4-type RING finger) family protein | drought/stomata | ABA |
| AT5G59550 | RDUF2/BTL09 | Zinc finger (C3HC4-type RING finger) family protein | drought/stomata | ABA |
| AT3G11820 | SYR1/SYP121 | Syntaxin of plants 121 | drought/stomata | ABA |
| AT2G46400 | WRKY46 | WRKY DNA-binding protein 46 | drought/stomata | ABA |
| AT1G32640 | MYC2 | Basic helix-loop-helix (bHLH) DNA-binding family protein | drought/stomata | ABA |
| AT3G57230 | AGL16 | AGAMOUS-like 16 | drought/stomata | |
| AT3G23920 | BAM1 | Beta-amylase 1 | drought/stomata | |
| AT1G34245 | EPF2 | Putative membrane lipoprotein | drought/stomata | |
| AT5G10720 | HK5 | Histidine kinase 5 | drought/stomata | |
| AT5G22920 | RZPF34/CHYR1 | CHY-type/CTCHY-type/RING-type Zinc finger protein | drought/stomata | |
| AT3G52400 | SYP122 | Syntaxin of plants 122 | drought/stomata | |
| AT1G74950 | TIFY10B/JAZ2 | TIFY domain/Divergent CCT motif family protein | drought/stomata | |
| AT1G80080 | TMM | Leucine-rich repeat (LRR) family protein | drought/stomata | |
| AT1G52890 | ANAC019/NAC019 | NAC domain containing protein 19 | drought/stomata | |
| AT1G69490 | ANAC029/NAP | NAC-like, activated by AP3/PI | drought | ABA |
| AT2G25900 | ATCTH/TZF1 | Zinc finger C-x8-C-x5-C-x3-H type family protein | drought | ABA |
| AT5G45340 | CYP707A3 | Cytochrome P450, family 707, subfamily A, polypeptide 3 | drought | ABA |
| AT5G52050 | DTX50 | MATE efflux family protein | drought | ABA |
| AT1G74930 | ERF018/ORA47 | Integrase-type DNA-binding superfamily protein | drought | ABA |
| AT1G08920 | ESL1 | ERD (early response to dehydration) six-like 1 | drought | ABA |
| AT5G39760 | HB23 | Homeobox protein 23 | drought | ABA |
| AT5G62470 | MYB96 | MYB domain protein 96 | drought | ABA |
| AT5G67300 | MYBR1/MYB44 | MYB domain protein r1 | drought | ABA |
| AT1G54160 | NF-YA5 | Nuclear factor Y, subunit A5 | drought | ABA |
| AT5G42050 | NRP | DCD (Development and Cell Death) domain protein | drought | ABA |
| AT3G52450 | PUB22 | Plant U-box 22 | drought | ABA |
| AT2G35930 | PUB23 | Plant U-box 23 | drought | ABA |
| AT1G13260 | RAV1 | Related to ABI3/VP1 1 | drought | ABA |
| AT5G65300 | SUPA | Unknown protein | drought | ABA |
| AT2G41010 | CAMBP25 | Calmodulin (CAM)-binding protein of 25 kDa | drought | Ca |
| AT2G26190 | IQM4 | Calmodulin-binding family protein | drought | Ca |
| AT5G17850 | CCX2 | Sodium/calcium exchanger family protein | drought | Ca |
| AT5G66650 | CMCU | Protein of unknown function (DUF607) | drought | Ca |
| AT2G33860 | ARF3/ETT | Transcriptional factor B3 family protein/auxin-responsive factor AUX/IAA-related | drought | |
| AT4G02200 | AtDi19-5 | Drought-responsive family protein | drought | |
| AT3G08760 | ATSIK | Protein kinase superfamily protein | drought | |
| AT5G49450 | BZIP1 | Basic leucine-zipper 1 | drought | |
| AT4G36880 | CP1/RDL1 | Cysteine proteinase1 | drought | |
| AT5G04340 | CZF2/ZAT6 | Zinc finger of Arabidopsis thaliana 6 | drought | |
| AT5G04760 | DIV2 | Duplicated homeodomain-like superfamily protein | drought | |
| AT1G73330 | DR4 | Drought-repressed 4 | drought | |
| AT5G05410 | DREB2A | DRE-binding protein 2A | drought | |
| AT2G45180 | DRN1 | Bifunctional inhibitor/lipid-transfer protein/seed storage 2S albumin superfamily protein | drought | |
| AT4G17490 | ERF6 | Ethylene responsive element binding factor 6 | drought | |
| AT2G47180 | GOLS1 | Galactinol synthase 1 | drought | |
| AT4G18880 | HSF A4A | Heat shock transcription factor A4A | drought | |
| AT5G12030 | HSP17.6A | Heat shock protein 17.6A | drought | |
| AT4G02410 | LPK1/LECRK-IV.3 | Concanavalin A-like lectin protein kinase family protein | drought | |
| AT3G49580 | LSU1 | Response to low sulfur 1 | drought | |
| AT1G73500 | MKK9 | MAP kinase kinase 9 | drought | |
| AT3G45640 | MPK3 | Mitogen-activated protein kinase 3 | drought | |
| AT5G61290 | NA a | Flavin-binding monooxygenase family protein | drought | |
| AT3G27150 | NA a | Galactose oxidase/kelch repeat superfamily protein | drought | |
| AT5G26260 | NA a | TRAF-like family protein | drought | |
| AT4G33070 | PDC1 | Thiamine pyrophosphate dependent pyruvate decarboxylase family protein | drought | |
| AT3G62260 | PP2C49 | Protein phosphatase 2C family protein | drought | |
| AT5G64905 | PROPEP3 | Elicitor peptide 3 precursor | drought | |
| AT3G18710 | PUB29 | plant U-box 29 | drought | |
| AT3G49810 | PUB30 | ARM repeat superfamily protein | drought | |
| AT1G68840 | RAV2/TEM2 | Related to ABI3/VP1 2 | drought | |
| AT3G08720 | S6K2 | Serine/threonine protein kinase 2 | drought | |
| AT5G62520 | SRO5 | Similar to RCD one 5 | drought | |
| AT3G55980 | SZF1/TZF11 | Salt-inducible zinc finger 1 | drought | |
| AT2G40140 | SZF2 | Zinc finger (CCCH-type) family protein | drought | |
| AT1G27730 | ZAT10 | Salt tolerance zinc finger | drought |
| AGI | Gene Name | Annotations | Categories a | ABA/Ca b |
|---|---|---|---|---|
| AT5G61600 | ERF104 | Ethylene response factor 104 | cold | ABA |
| AT5G51190 | ERF105 | Integrase-type DNA-binding superfamily protein | cold | ABA |
| AT1G13260 | RAV1 | Related to ABI3/VP1 1 | cold/drought | ABA |
| AT4G25470 | CBF2 | C-repeat/DRE binding factor 2 | cold | ABA/Ca |
| AT3G50260 | CEJ1/DEAR1 | Cooperatively regulated by ethylene and jasmonate 1 | cold | Ca |
| AT5G59820 | ZAT12 | C2H2-type zinc finger family protein | cold | Ca |
| AT1G27730 | ZAT10 | Salt tolerance zinc finger | cold/drought | Ca |
| AT5G05410 | DREB2A | DRE-binding protein 2A | cold/drought | |
| AT4G17490 | ERF6 | Ethylene responsive element binding factor 6 | cold/drought | |
| AT2G47180 | GOLS1 | Galactinol synthase 1 | cold/drought | |
| AT3G45640 | MPK3 | Mitogen-activated protein kinase 3 | cold/drought | |
| AT3G08720 | S6K2 | Serine/threonine protein kinase 2 | cold/drought | |
| AT1G20823 | ATL80 | RING/U-box superfamily protein | cold | |
| AT1G18740 | B1L | Protein of unknown function (DUF793) | cold | |
| AT5G20230 | BCB | Blue-copper-binding protein | cold | |
| AT3G13310 | DJC66 | Chaperone DnaJ-domain superfamily protein | cold | |
| AT3G49530 | NAC062/NTL6 | NAC domain containing protein 62 | cold | |
| AT1G09070 | SRC2 | Soybean gene regulated by cold-2 | cold | |
| AT1G72940 | TN11 | Toll-Interleukin-Resistance (TIR) domain-containing protein | cold | |
| AT5G57560 | XTH22/TCH4 | Xyloglucan endotransglucosylase/hydrolase family protein | cold |
| AGI | Gene Name | Annotations | Categories b |
|---|---|---|---|
| AT5G42050 | NRP | DCD (Development and Cell Death) domain protein | cell death |
| AT3G25250 | AGC2-1/OXI1 | AGC (cAMP-dependent, cGMP-dependent and protein kinase C) kinase family protein | cell death |
| AT5G18270 | ANAC087 | Arabidopsis NAC domain containing protein 87 | cell death |
| AT1G29690 | CAD1/NSL2 | MAC/Perforin domain-containing protein | cell death |
| AT5G58430 | EXO70B1 | Exocyst subunit exo70 family protein B1 | cell death |
| AT1G59910 | FORMIN7 | Actin-binding FH2 (formin homology 2) family protein | cell death |
| AT1G70830 | MLP28 | MLP-like protein 28 | cell death |
| AT4G12720 | NUDT7 | MutT/nudix family protein | cell death |
| AT1G08920 | ESL1 | ERD (early response to dehydration) six-like 1 | senescence |
| AT2G46400 | WRKY46 | WRKY DNA-binding protein 46 | senescence |
| AT5G02760 | APD7 | Protein phosphatase 2C family protein | senescence |
| AT5G08790 | ATAF2/ANAC081 | NAC (No Apical Meristem) domain transcriptional regulator superfamily protein | senescence |
| AT1G44830 | ERF014/EPI1 | Integrase-type DNA-binding superfamily protein | senescence |
| AT1G51660 | MKK4 | Mitogen-activated protein kinase kinase 4 | senescence |
| AT1G67470 | NA a | Protein kinase superfamily protein | senescence |
| AT2G28400 | NA a | Protein of unknown function, DUF584 | senescence |
| AT4G21930 | NA a | Protein of unknown function, DUF584 | senescence |
| AT2G44670 | NA a | Protein of unknown function, DUF581 | senescence |
| AT4G04630 | NA a | Protein of unknown function, DUF584 | senescence |
| AT1G55740 | SIP1 | Seed imbibition 1 | senescence |
| AT4G01250 | WRKY22 | WRKY family transcription factor | senescence |
| AT3G21520 | DMP1 | DUF679 domain membrane protein 1 | senescence/cell death |
| AT1G52890 | ANAC019/NAC019 | NAC domain containing protein 19 | senescence/chloroplast degradation |
| AT1G69490 | ANAC029/NAP | NAC-like, activated by AP3/PI | senescence/chloroplast degradation |
| AT4G24390 | AFB4 | RNI-like superfamily protein | senescence/chloroplast degradation |
| Samples a | Read Length (bp) | Raw Reads | Clear Reads | Mapped Rates (% of Total) | |
|---|---|---|---|---|---|
| HTP | Col-0-1 | 125 | 23,692,678 | 23,692,678 | 82.09 |
| Col-0-2 | 125 | 23,536,690 | 23,536,690 | 81.41 | |
| Col-0-3 | 125 | 24,361,660 | 24,361,660 | 84.04 | |
| P1Tu-1 | 125 | 24,270,634 | 24,270,634 | 79.83 | |
| P1Tu-2 | 125 | 23,727,160 | 23,727,160 | 79.97 | |
| P1Tu-3 | 125 | 24,663,280 | 24,663,280 | 79.54 | |
| HC-ProTu-1 | 125 | 23,502,832 | 23,502,832 | 77.45 | |
| HC-ProTu-2 | 125 | 23,074,688 | 23,074,688 | 80.87 | |
| HC-ProTu-3 | 125 | 23,817,246 | 23,817,246 | 79.23 | |
| P1/HC-ProTu-1 | 125 | 23,104,480 | 23,104,480 | 75.27 | |
| P1/HC-ProTu-2 | 125 | 23,766,692 | 23,766,692 | 73.56 | |
| P1/HC-ProTu-3 | 125 | 21,935,512 | 21,935,512 | 77.24 | |
| LTP | Col-0-1 | 75 | 2,732,672 | 2,611,636 | 78.17 |
| Col-0-2 | 75 | 3,027,192 | 2,895,782 | 78.97 | |
| Col-0-3 | 75 | 2,974,324 | 2,844,916 | 79.84 | |
| P1Tu-1 | 75 | 3,072,748 | 2,899,822 | 80.16 | |
| P1Tu-2 | 75 | 3,100,226 | 2,956,540 | 79.33 | |
| P1Tu-3 | 75 | 2,309,898 | 2,151,492 | 80.63 | |
| HC-ProTu-1 | 75 | 2,300,776 | 2,196,490 | 77.28 | |
| HC-ProTu-2 | 75 | 2,814,492 | 2,664,142 | 78.34 | |
| HC-ProTu-3 | 75 | 1,967,520 | 1,888,408 | 77.94 | |
| P1/HC-ProTu-1 | 75 | 2,738,024 | 2,609,924 | 76.81 | |
| P1/HC-ProTu-2 | 75 | 3,012,322 | 2,866,212 | 77.07 | |
| P1/HC-ProTu-3 | 75 | 2,973,652 | 2,817,066 | 77.53 | |
| AGI | Gene Name | Annotation | Functional Classification b | ABA/Ca c | Stresses d |
|---|---|---|---|---|---|
| AT1G48410 | AGO1 | Stabilizer of iron transporter SufD/Polynucleotidyl transferase | ▇ | ||
| AT1G31280 | AGO2 | Argonaute family protein | ▇ | ||
| AT4G12720 | NUDT7 | MutT/nudix family protein | ▇ | cell death | |
| AT3G49530 | NAC062/NTL6 | NAC domain containing protein 62 | ▇ | cold | |
| AT5G57560 | XTH22/TCH4 | Xyloglucan endotransglucosylase/hydrolase family protein | ▇ | cold | |
| AT5G67300 | MYBR1/MYB44 | MYB domain protein r1 | ▇ | ABA | drought |
| AT3G08760 | ATSIK | Protein kinase superfamily protein | ▇ | drought | |
| AT1G73330 | DR4 | Drought-repressed 4 | ▇ | drought | |
| AT4G18880 | HSF A4A | Heat shock transcription factor A4A | ▇ | drought | |
| AT3G49810 | PUB30 | ARM repeat superfamily protein | ▇ | drought | |
| AT3G08720 | S6K2 | Serine/threonine protein kinase 2 | ▇ | drought, cold | |
| AT1G51660 | MKK4 | mitogen-activated protein kinase kinase 4 | ▇ | senescence | |
| AT4G01250 | WRKY22 | WRKY family transcription factor | ▇ | senescence | |
| AT3G48360 | BT2 | BTB and TAZ domain protein 2 | ▇ | ABA | |
| AT1G33560 | ADR1 | Disease resistance protein (CC-NBS-LRR class) family | ▇ | ||
| AT1G08830 | CSD1 | Copper/zinc superoxide dismutase 1 | ▇ | ||
| AT2G28190 | CSD2 | Copper/zinc superoxide dismutase 2 | ▇ | ||
| AT5G41750 | DM1 | Disease resistance protein (TIR-NBS-LRR class) family | ▇ | ||
| AT5G41080 | GDPD2 | PLC-like phosphodiesterases superfamily protein | ▇ | ||
| AT1G25550 | HHO3/NIGT1.1 | MYB-like transcription factor family protein | ▇ | ||
| AT3G10020 | HUP26 | Unknown protein; response to oxidative stress, anaerobic respiration | ▇ | ||
| AT1G17420 | LOX3 | Lipoxygenase 3 | ▇ | ||
| AT1G72520 | LOX4 | PLAT/LH2 domain-containing lipoxygenase family protein | ▇ | ||
| AT2G01180 | LPP1 | Phosphatidic acid phosphatase 1 | ▇ | ||
| AT1G01560 | MPK11 | MAP kinase 11 | ▇ | ||
| AT4G37260 | MYB73 | MYB domain protein 73 | ▇ | ||
| AT1G66090 | TIR-NBS-LRR | Disease resistance protein (TIR-NBS class) | ▇ | ||
| AT5G04720 | PHX21/ADR1-L2 | ADR1-like 2 | ▇ | ||
| AT4G17230 | SCL13 | SCARECROW-like 13 | ▇ | ||
| AT1G19020 | SDA1/HUP35 | Unknown protein | ▇ | ||
| AT2G23810 | TET8 | Tetraspanin8 | ▇ | ||
| AT2G33770 | UBC24/PHO2 | Phosphate 2 | ▇ | ||
| AT1G56250 | VBF/PP2-B14 | Phloem protein 2-B14 | ▇ | ||
| AT1G12520 | CCS | Copper chaperone for SOD1 | ▇ | ||
| AT1G70830 | MLP28 | MLP-like protein 28 | ▇ | cell death | |
| AT5G02760 | APD7 | Protein phosphatase 2C family protein | ▇ | senescence | |
| AT1G74670 | GASA6 | Gibberellin-regulated family protein | ▇ | ABA | |
| AT5G27420 | ATL31/CNI1 | Carbon/nitrogen insensitive 1 | ▇ | ||
| AT2G22840 | GRF1 | Growth-regulating factor 1 | ▇ | ||
| AT3G05690 | NF-YA2/HAP2B | Nuclear factor Y, subunit A2 | ▇ | ||
| AT3G14020 | NF-YA6 | Nuclear factor Y, subunit A6 | ▇ | ||
| AT5G50570 | SPL13A | Squamosa promoter-binding protein-like (SBP domain) transcription factor family protein | ▇ | ||
| AT2G33810 | SPL3 | Squamosa promoter binding protein-like 3 | ▇ | ||
| AT5G60120 | TOE2 | Target of early activation tagged (EAT) 2 | ▇ | ||
| AT1G69530 | EXPA1 | Expansin A1 | ▇ | ||
| AT2G26190 | IQM4 | Calmodulin-binding family protein | ▇ | Ca | drought |
| AT4G34150 | CaLB | Calcium-dependent lipid-binding (CaLB domain) family protein | ▇ | Ca | |
| AT3G16510 | CaLB | Calcium-dependent lipid-binding (CaLB domain) family protein | ▇ | Ca | |
| AT5G26920 | CBP60G | Cam-binding protein 60-like G | ▇ | Ca | |
| AT5G37770 | CML24/TCH2 | EF hand calcium-binding protein family | ▇ | Ca | |
| AT5G66210 | CPK28 | Calcium-dependent protein kinase 28 | ▇ | Ca | |
| AT3G57530 | CPK32 | Calcium-dependent protein kinase 32 | ▇ | Ca | |
| AT1G27770 | ACA1 | Autoinhibited Ca2+-ATPase 1 | ▇ | Ca | |
| AT5G45340 | CYP707A3 | Cytochrome P450, family 707, subfamily A, polypeptide 3 | ▇ | ABA | drought |
| AT5G08790 | ATAF2/ANAC081 | NAC (No Apical Meristem) domain Transcriptional regulator superfamily protein | ▇ | senescence | |
| AT5G66070 | ATL27/ATARRE | RING/U-box superfamily protein | ▇ | ABA | |
| AT3G25780 | AOC3 | Allene oxide cyclase 3 | ▇ | ||
| AT1G28370 | ERF11 | ERF domain protein 11 | ▇ | ||
| AT4G36040 | J11 | Chaperone DnaJ-domain superfamily protein | ▇ | ||
| AT4G23180 | CRK10/RLK4 | Cysteine-rich RLK (RECEPTOR-like protein kinase) 10 | |||
| AT3G26200 | CYP71B22 | Cytochrome P450, family 71, subfamily B, polypeptide 22 | |||
| AT1G80610 | NAa | Unknown protein | |||
| AT1G63750 | TIR-NBS-LRR | Disease resistance protein (TIR-NBS-LRR class) family | |||
| AT4G32480 | NA a | Protein of unknown function (DUF506) | |||
| AT3G15450 | NA a | Aluminium induced protein with YGL and LRDR motifs | |||
| AT4G23870 | NA a | Unknown protein | |||
| AT5G46780 | NA a | VQ motif-containing protein | |||
| AT2G39650 | NA a | Protein of unknown function (DUF506) | |||
| AT1G77270 | NA a | Unknown protein | |||
| AT2G29300 | NA a | NAD(P)-binding Rossmann-fold superfamily protein | |||
| AT3G07350 | NAa | Protein of unknown function (DUF506) | |||
| AT1G52820 | NA a | 2-oxoglutarate (2OG) and Fe(II)-dependent oxygenase superfamily protein | |||
| AT3G44400 | NA a | Disease resistance protein (TIR-NBS-LRR class) family | |||
| AT5G44572 | PROSCOOP6 | Unknown protein | |||
| AT1G16110 | WAKL6 | Wall associated kinase-like 6 |
Publisher’s Note: MDPI stays neutral with regard to jurisdictional claims in published maps and institutional affiliations. |
© 2021 by the authors. Licensee MDPI, Basel, Switzerland. This article is an open access article distributed under the terms and conditions of the Creative Commons Attribution (CC BY) license (https://creativecommons.org/licenses/by/4.0/).
Share and Cite
Chiu, Y.-H.; Hung, Y.-L.; Wang, H.-P.; Wei, W.-L.; Shang, Q.-W.; Pham, T.H.; Huang, C.-K.; Pan, Z.-J.; Lin, S.-S. Investigation of P1/HC-Pro-Mediated ABA/Calcium Signaling Responses via Gene Silencing through High- and Low-Throughput RNA-seq Approaches. Viruses 2021, 13, 2349. https://doi.org/10.3390/v13122349
Chiu Y-H, Hung Y-L, Wang H-P, Wei W-L, Shang Q-W, Pham TH, Huang C-K, Pan Z-J, Lin S-S. Investigation of P1/HC-Pro-Mediated ABA/Calcium Signaling Responses via Gene Silencing through High- and Low-Throughput RNA-seq Approaches. Viruses. 2021; 13(12):2349. https://doi.org/10.3390/v13122349
Chicago/Turabian StyleChiu, Yen-Hsin, Yu-Ling Hung, Hsin-Ping Wang, Wei-Lun Wei, Qian-Wen Shang, Thanh Ha Pham, Chien-Kang Huang, Zhao-Jun Pan, and Shih-Shun Lin. 2021. "Investigation of P1/HC-Pro-Mediated ABA/Calcium Signaling Responses via Gene Silencing through High- and Low-Throughput RNA-seq Approaches" Viruses 13, no. 12: 2349. https://doi.org/10.3390/v13122349
APA StyleChiu, Y.-H., Hung, Y.-L., Wang, H.-P., Wei, W.-L., Shang, Q.-W., Pham, T. H., Huang, C.-K., Pan, Z.-J., & Lin, S.-S. (2021). Investigation of P1/HC-Pro-Mediated ABA/Calcium Signaling Responses via Gene Silencing through High- and Low-Throughput RNA-seq Approaches. Viruses, 13(12), 2349. https://doi.org/10.3390/v13122349