Article

MaxEnt Modelling for Predicting the Potential Distribution of an Endangered and Nationally Protected Tree Species (Machilus nanmu) Under Climate Change and Human Activities

1
Yunnan Key Laboratory of Plateau Wetland Conservation, Restoration and Ecological Services, Southwest Forestry University, Kunming 650233, China
2
College of Ecology and Environment (College of Wetlands), Southwest Forestry University, Kunming 650233, China
3
National Plateau Wetlands Research Center, Kunming 650224, China
4
Napahai Provincial Nature Reserve Management Bureau, Shangri-La 674400, China
5
Southwest Survey and Planning Institute of National Forestry and Grassland Administration, Kunming 650031, China
*
Authors to whom correspondence should be addressed.
Forests 2026, 17(9), 1071; https://doi.org/10.3390/f17091071
Submission received: 8 July 2026 / Revised: 28 August 2026 / Accepted: 3 September 2026 / Published: 7 September 2026
(This article belongs to the Section Forest Biodiversity)

Abstract

Global climate change and intensifying anthropogenic pressures pose unprecedented challenges to global biodiversity, with endangered species often experiencing particularly severe reductions in suitable habitats. In this study, we used the MaxEnt model to predict and evaluate the potential suitable habitats of Machilus nanmu in China under current and future climate scenarios. After parameter optimization (RM = 0.5, FC = LQH), the model showed excellent predictive performance, with a mean AUC of 0.946 and a CBI value of 0.988. The analysis of key environmental variables indicated that Mean UV-B of the High-est Month (Uvb3, 24.5% contribution), Temperature Seasonality (bio4, 19.6%), and Population Distribution (human_pd, 19.5%) were the dominant factors shaping habitat suitability, while Temperature Seasonality had the highest permutation importance (34.1%). Under current conditions, the highly suitable habitat area was estimated to be approximately 21,109.94 km2, accounting for 0.22% of the total study area, and was mainly concentrated in the Sichuan Basin and the Yunnan-Guizhou Plateau. Under future climate scenarios, the highly suitable area of M. nanmu under the low-emission scenario (SSP1–2.6) showed an overall fluctuating trend, with an initial decline followed by a later expansion, resulting in an approximately 6.3% increase by the 2090s relative to the current period. In contrast, under the medium-emission scenario (SSP2–4.5), the highly suitable area also exhibited fluctuations but ultimately increased by approximately 3.9% by the 2090s. Centroid shift analysis further revealed an oscillatory east–west migration pattern of distribution centroids under SSP1–2.6, with a brief southwestward shift between the 2050s and 2070s, whereas under SSP2–4.5 the centroid trajectory was more complex: it first shifted westward and northward, then moved significantly southwestward, and finally turned eastward. These findings highlight the significant impacts of climate change on the suitable habitats of M. nanmu and provide a scientific basis for its conservation and sustainable management.

1. Introduction

Currently, accelerating global climate change and intensified human activity are posing unprecedented challenges to Earth’s biodiversity [1]. Human activity has generated multiple environmental pressures, including habitat alteration, pollution, and climate change, thereby exerting unprecedented impacts on biodiversity [2,3]. Global climate change, together with habitat destruction caused by human activity, is accelerating biodiversity loss at an unprecedented rate [4,5]. This crisis is driving thousands of species to-ward extinction and disrupting critical ecological networks [6,7]. Approximately 21% of higher plant species globally are at risk of extinction, and more than 4000 plant species in China are endangered, making the conservation situation exceptionally urgent [8,9]. These endangered species hold irreplaceable significance for maintaining local and global biodiversity and ecosystem functions, and their loss would pose a major threat to ecological security. In the context of the Anthropocene, the suitable ranges of many species are expected to change significantly, accompanied by increasing habitat fragmentation [10,11]. Meanwhile, occurrence data for the vast majority of species are often extremely scarce, particularly for endangered species, for which such data are either unavailable or very limited [12]. Therefore, understanding the geographical shifts of endangered tree species in response to climate change is of great importance for developing appropriate conservation strategies.
Species Distribution Models (SDMs) are widely used to estimate species distributions across geographic space based on known occurrence records and to predict relationships between species distributions and environmental factors [13,14]. With the advancement of information technology, the number of species distribution models has increased substantially. Among the various algorithms available for SDMs, Maxent has proven highly effective for modeling rare species with narrow distributions and limited presence-only data [15]. The maximum entropy (MaxEnt) model is widely recognized for its high predictive performance and its ability to provide robust results using presence-only data, and it has been extensively applied in endangered species conservation, invasion biology, and climate change ecology [16,17,18]. The MaxEnt model has been widely used by researchers around the world to assess the habitat suitability of endangered species. For example, it has been employed to predict the potential distribution of Aquilaria sinensis (Lour.) Spreng. [19], Ilex nanchuanensis Z.M.Tan [20] and Woonyoungia septentrionalis (Dandy) Y. W. Law [21] in China under current and future climate scenarios, providing valuable insights for plant conservation, introduction, and management. Despite these advantages, potential overfitting caused by inadequate regularization and sensitivity to sampling bias still require careful consideration [22].
Machilus nanmu (Oliv.) Hemsl. is an evergreen tree species belonging to the genus Machilus within the family Lauraceae [23]. It is a rare plant endemic to China, listed as a National Class II Key Protected Wild Plant and categorized as endangered (EN) on the IUCN Red List [9]. M. nanmu is endemic to southwestern China, primarily distributed in Xizang, Yunnan, and Sichuan, particularly in mountainous areas along the western edge of the Sichuan, at elevations ranging from 500 to 1600 m. Its populations are small and exhibit a scattered, fragmented distribution pattern [24]. This species is rich in various bioactive metabolites and has shown significant efficacy in alleviating symptoms such as dermatitis, edema, and diarrhea. Polysaccharides extracted from its leaves display notable antioxidant and antitumor activities [25]. The Chinese term “Nanmu” does not refer to a specific type of wood but is a collective name for timber from certain tree species within the genera Phoebe, Machilus, and Nothaphoebe in the family Lauraceae. These species possess broad application potential in the fields of industrial timber, landscaping, medicine, spice production, chemical engineering, and cosmetics [25,26]. M. nanmu is highly valued for its high-quality wood and represents an important economic forest resource in southern China, with these species showing extensive potential for use in industrial timber, landscaping, medicine, spice production, chemical engineering, and cosmetics [26,27]. In recent years, driven by market speculation around “golden-thread Nanmu”, the market price of nanmu wood has increased dramatically, leading to recurrent incidents of illegal harvesting of wild nanmu trees. M. nanmu is also employed in traditional Chinese medicine due to its anti-infective, anti-inflammatory, antibacterial, and analgesic properties [28,29,30,31]. Plants of the genus Machilus contain flavonoids, lignans, terpenoids, alkaloids and so on [32,33]. Flavonoids constitute an essential class of secondary metabolites and their structures can be classified as flavones, flavonols, isoflavones, anthocyanins, flavanols, flavanones, and chalcones [34]. In humans, flavonoids have the functions of free radical scavengers, antimicrobial agents, and antioxidants [35].
Despite strengthened national protection efforts for M. nanmu, market demand for the species continues to grow, leading to severe supply shortages and rising prices. Consequently, there is an urgent need to rapidly expand the cultivation of M. nanmu. Current solutions rely on artificial planting [36]; however, critical questions regarding the species’ capacity to adapt to climate change and the identification of optimal future planting sites remain unanswered. Most existing studies have focused on the cultivation techniques and chemical composition analysis of M. nanmu, while systematic prediction of its potentially suitable areas remains insufficient [37]. To address this gap, the present study employed the MaxEnt model optimized with the ENMeval package and integrated multidimensional environmental data, including climatic variables, to predict the potential suitable areas for M. nanmu in the future. The objectives of this study were: (1) to apply the optimized MaxEnt model to predict the potential suitable areas and centroid shift trends of M. nanmu under current and future climate scenarios, and to identify the dominant environmental factors limiting its distribution; (2) to identify stable (i.e., areas suitable under both current and future conditions), highly suitable habitats and potential climate change refugia based on the analysis of its spatiotemporal dynamics, thereby providing scientific guidance for the conservation of this species. The results of this study offer important theoretical support for the conservation of wild germplasm resources, the scientifically informed siting of plantations, and the sustainable development and utilization of M. nanmu.

2. Materials and Methods

2.1. Occurrences and Environment Data

This study obtained the geographic distribution data of M. nanmu by integrating multiple data sources. The occurrences of native wild M. nanmu were assessed in Chinese Virtual Herbarium (http://www.cvh.ac.cn/ (accessed on 25 January 2026)), National Specimen Information Infrastructure (http://www.nsii.org.cn/ (accessed on 25 January 2026)), Germplasm Bank of Wild Species (http://www.genobank.org/ (accessed on 25 January 2026)), and Global Biodiversity Information Facility (http://www.gbif.org/ GBIF Occurrence Download. Available online: https://doi.org/10.15468/dl.c4zzkz (accessed on 30 January 2026)). Occurrences that were artificially planted or incorrectly recorded were excluded. After removing duplicate records and observations with imprecise location data, we initially collected 30 distribution records of M. nanmu.
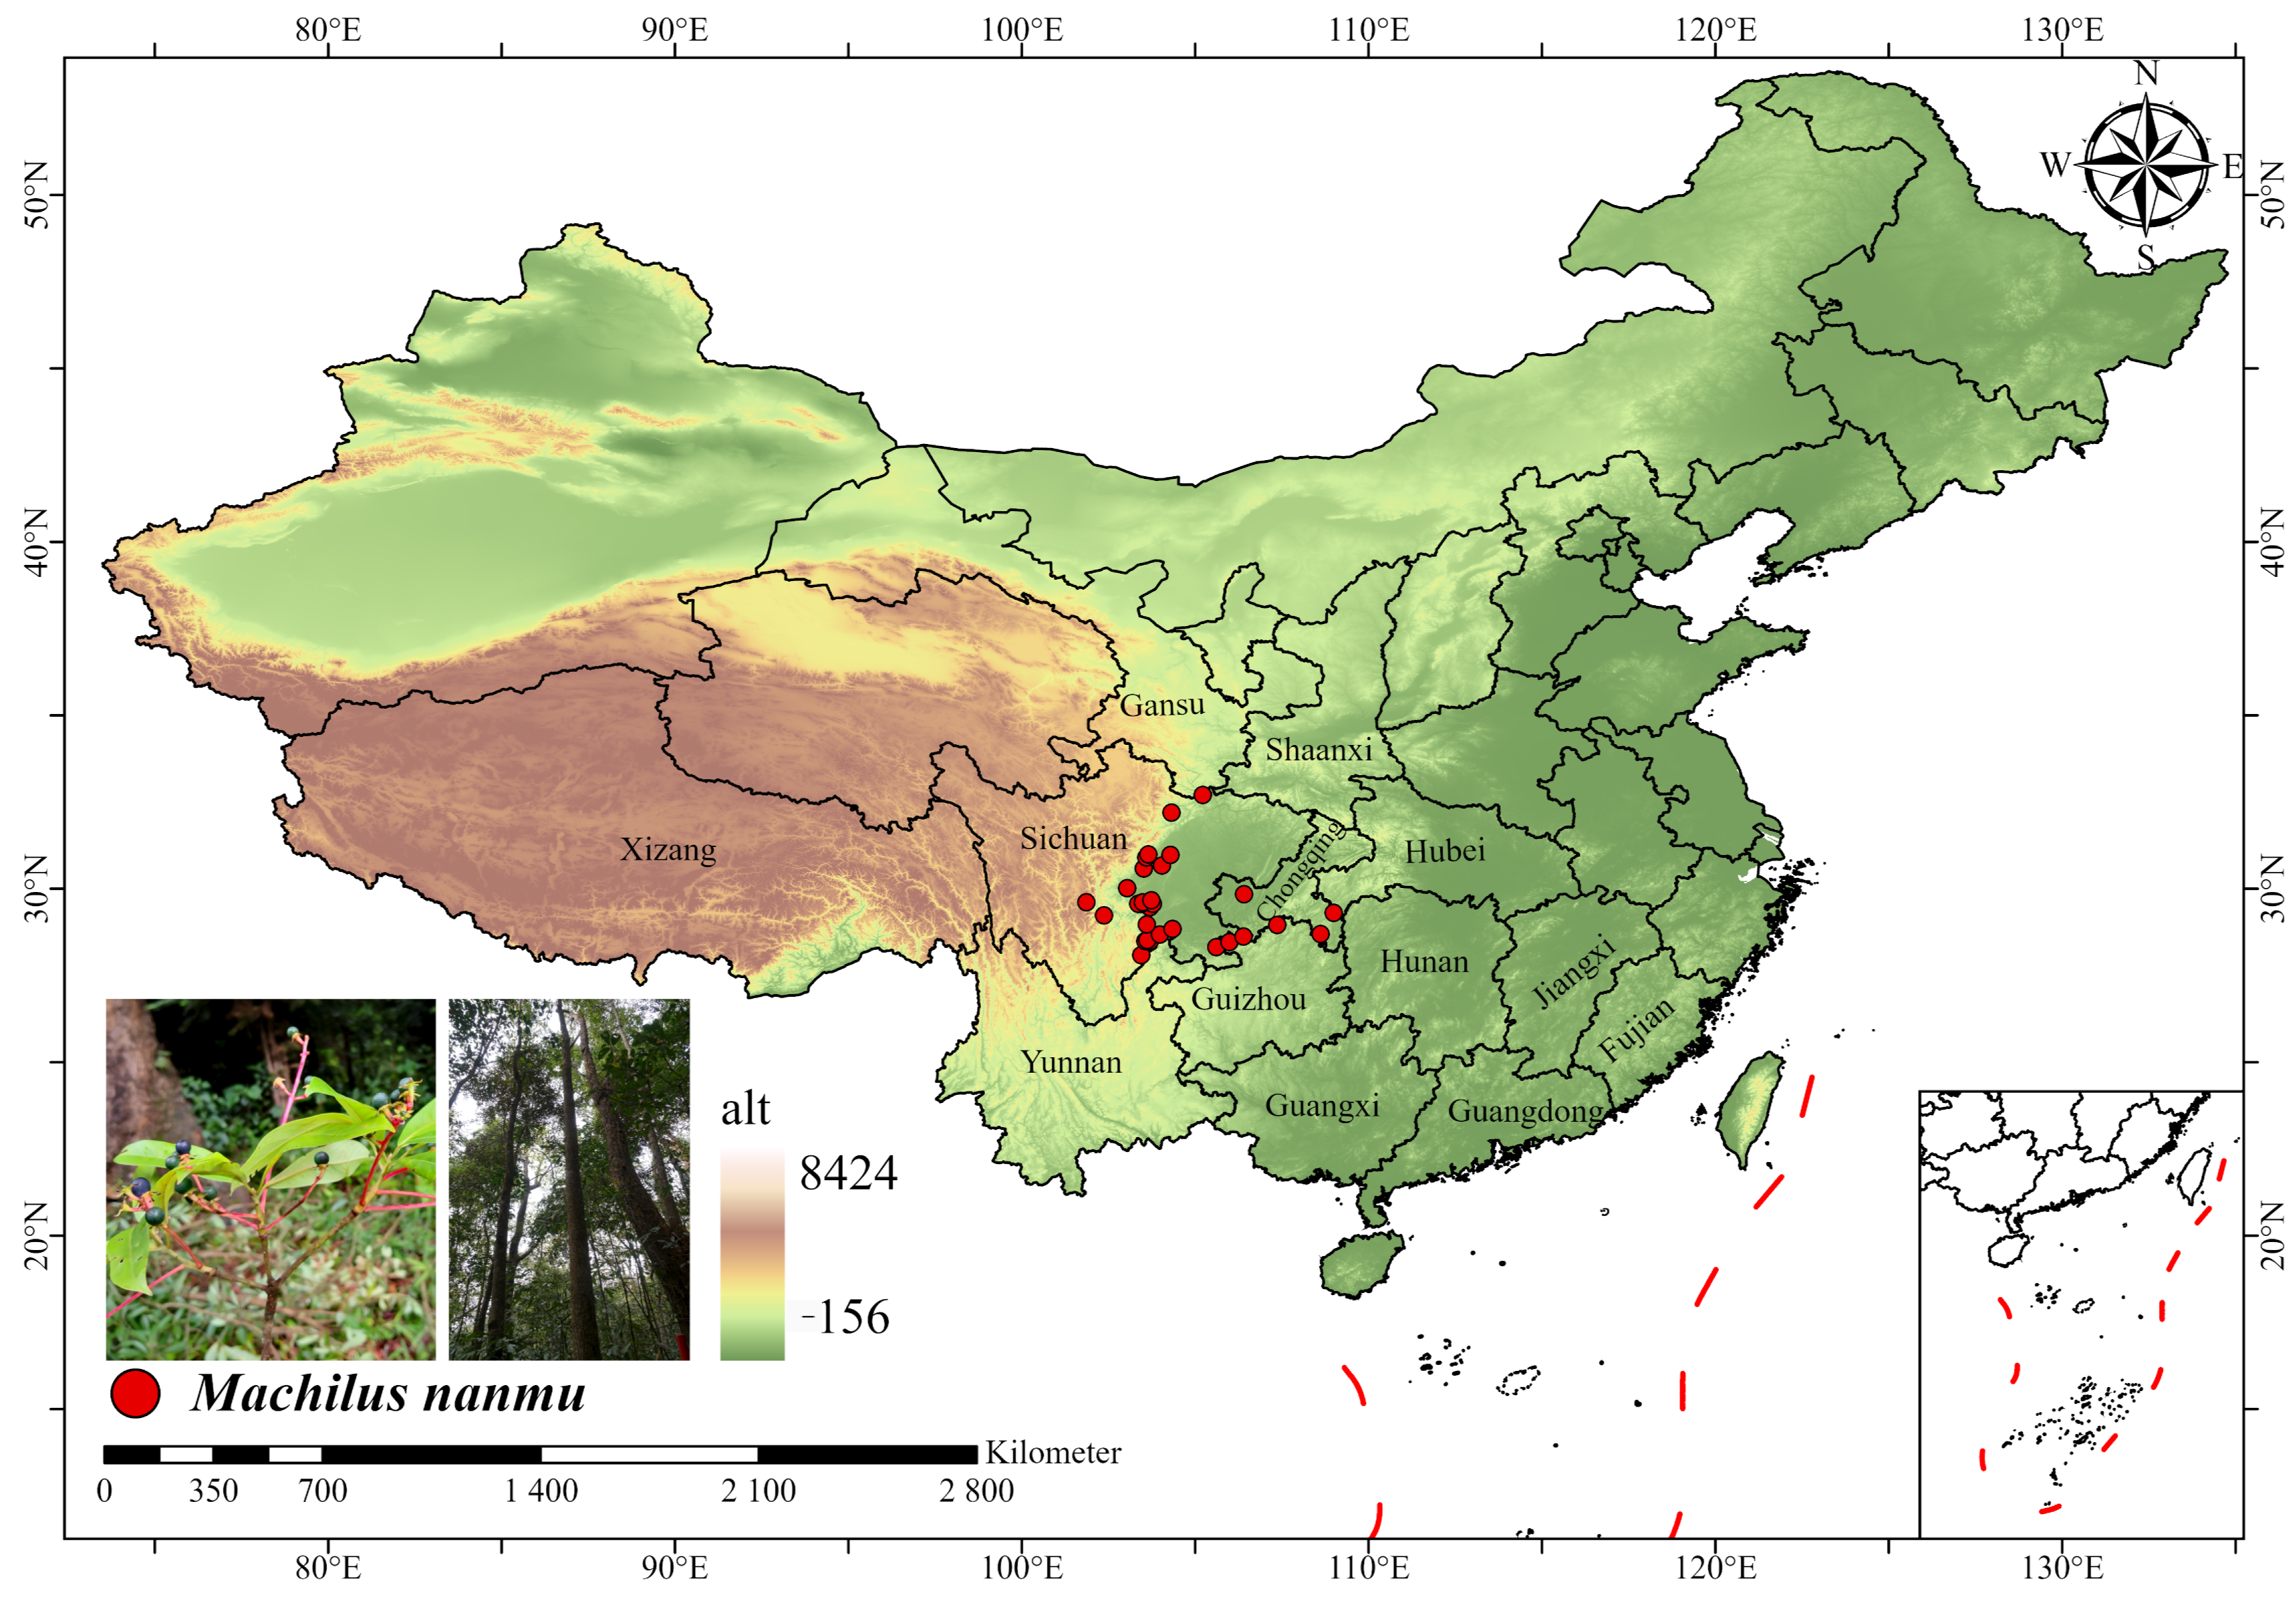
A spatial filtering approach was implemented to address the issue of sampling bias, which was deemed to be an inherent concern given the observed spatial clustering of occurrences. This methodological decision was motivated by the objective of enhancing the model’s precision and accuracy [38]. Duplicate occurrences within 10 km × 10 km were excluded to reduce the bias resulting from the administrative division of the county-level data. It has been demonstrated that when the number of simulated species exceeds 25, the model’s deviation will decrease significantly [39]. In the end, a total of 30 occurrence points were selected for the construction of the model (Figure 1).

2.2. Environmental Predictors

To identify the main environmental drivers of M. nanmu, a total of 41 initial environ-mental variables were selected as preliminary inputs for model screening and construction (Table S1). Climatic variables encompassed both current conditions (1970s–2000s) and future projected scenarios, including 19 bioclimatic variables obtained from the World-Clim dataset (http://www.worldclim.org (accessed on 5 May 2026)) [40]. Soil data (8 variables) were sourced from the Harmonized World Soil Database v2.0 (http://www.fao.org/soils-portal/data-hub/en/ (accessed on 15 May 2026)) [41], and two UV-B variables—namely annual mean UV-B radiation (uvb1) and mean UV-B of the highest month (uvb3)—were derived from the glUV database (http://www.ufz.de/gluv/ (accessed on 20 May 2026)) [42]. Given the recognized importance of habitat heterogeneity in shaping biodiversity patterns, four vegetation-based metrics closely associated with plant distribution were acquired from the EarthEnv database (https://www.earthenv.org/texture (accessed on 24 May 2026)) [43]: the coefficient of variation (habitat_cv), evenness (habitat_evenness), range (habitat_range), and Shannon diversity index (habitat_shannon) of the Enhanced Vegetation Index (EVI). Additionally, six terrain heterogeneity indicators were extracted from the same database: aspect cosine (terrain_aspectcosine), elevation (terrain_elev), roughness (terrain_roughness), slope (terrain_slope), topographic position index (terrain_tpi), and terrain ruggedness index (terrain_tri).
This study selected two indicators to characterize the impact of human activities on biodiversity: the Land Use/Land Cover variable (human_lulc) and the Population Distribution variable (human_pd). Land use/land cover variables (hereafter collectively referred to as “land use variables”) are derived from the global spatial heterogeneity dataset of land use and land cover, as developed by Zhang [44]. The population distribution variable is derived from the global gridded population dataset developed by Wang [45], which employs the Random Forest (RF) algorithm to cover 248 countries or regions. Considering that the topographic factors, soil parameters, and UV-B radiation data were only available for the current period and are expected to remain relatively stable in the near future, these nonclimatic variables were held constant during the future projection modeling process [46,47].
All environmental layers were obtained at their native spatial resolutions of 30 arc-seconds (~1 km) for climatic, soil, vegetation, and terrain variables; 15 arcminutes (~25 km) for UV-B variables; and 1 km for land use and population variables. To ensure consistency across predictors, all layers were resampled to a unified resolution of 30 arc-seconds using bilinear interpolation for continuous variables and nearest-neighbor assignment for the categorical variable. The resampling was implemented using the ArcGIS Resample tool (ArcGIS 10.8, ESRI Inc., Redlands, CA, USA).
To assess the uncertainties of SDMs on species distribution modeling in the China, we utilized one high-resolution GCMs (BCC–CSM2–MR) under two available shared socioeconomic pathways (low radiative forcing scenario SSP1–26 and medium radiative forcing scenario SSP2–4.5) and four future time periods (2030s, 2050s, 2070s, and 2090s) [48]. Climate simulations were performed using the BCC–CSM2–MR, which can reasonably represent the characteristics of climate distribution, and its prediction results show a high correlation coefficient with actual observed data, demonstrating very high reliability [19].
The reliability of SDMs depends on the ecological relevance of the environmental variables to the target species. Strong correlations among environmental variables may lead to model overfitting and reduce predictive performance [49]. To minimize multicollinearity and improve model robustness, a two-step variable selection procedure was implemented. First, occurrence records of M. nanmu and 41 environmental variables (Table S1) were incorporated into preliminary MaxEnt models. Species occurrence data were randomly divided into training (75%) and testing (25%) subsets [47]. Default model settings were applied, with ten replicate runs conducted using a cross-validation approach. The number of background points was set to 10,000, and the maximum number of iterations was set to 1000. Variable importance was evaluated using jackknife tests, which quantified percentage contribution and permutation importance [50]. Subsequently, Pearson correlation analysis was performed to assess collinearity among environmental variables. When strong correlations were detected (|r| ≥ 0.7), variables with higher percentage contributions were preferentially retained. If two correlated variables exhibited similar contribution values, the variable with higher permutation importance was selected [19]. Ultimately, eleven environmental variables were retained for final model construction (Table S1).

2.3. Optimization and Evaluation

Previous studies have demonstrated that the predictive performance and spatial transferability of the MaxEnt model are highly sensitive to model complexity, and substantial differences may arise between predictions generated using default and optimized parameter settings [51]. Inappropriate parameter selection can lead to overfitting and unreliable predictions. Model complexity in MaxEnt is primarily controlled by the regularization multiplier (RM) and feature combination (FC) parameters [52]. Optimizing these parameters can effectively reduce overfitting while improving model accuracy. Accordingly, the ENMeval package in R was used to optimize the MaxEnt model in this study. The optimization process was conducted as follows. The regularization multiplier (RM) varied from 0.5 to 4.0 at increments of 0.5, and three feature combinations (LQ, LQH, and LQT) were evaluated [47]. These parameter combinations were systematically assessed using ENMeval.
Using the optimal parameter combination, the occurrence records of M. nanmu and the eleven selected environmental variables were incorporated into the MaxEnt model, while all other settings were kept consistent with those described in Section 2.2. Model performance was evaluated using the area under the receiver operating characteristic curve (AUC) [53]. AUC values range from 0 to 1, and higher values indicate a stronger correlation between predicted species distribution and environmental factors, reflecting superior model performance. According to established criteria, AUC values ≥ 0.9 indicate high predictive accuracy, whereas values < 0.7 suggest poor model performance [53]. For models constructed using the cross-validation method, the continuous Boyce index (CBI) was used to evaluate the performance [54].
The ASCII (ASC) output files generated by MaxEnt were imported into ArcGIS for visualization and spatial analysis. Habitat suitability was reclassified into four categories based on predicted probability values: highly suitable (p ≥ 0.6), moderately suitable (0.4 ≤ p < 0.6), low suitability (0.2 ≤ p < 0.4), and unsuitable (p < 0.2) [19]. The areas of different suitability classes were calculated using raster analysis tools. In addition, spatial statistical tools, including SDMTools [55] and ArcGIS, were used to identify the centroid of suitable areas and their directional shifts across different periods, so as to characterize the spatial aggregation center and dynamic changes in the overall suitable habitat.

3. Results

3.1. Accuracy Evaluation of the Maxent Model

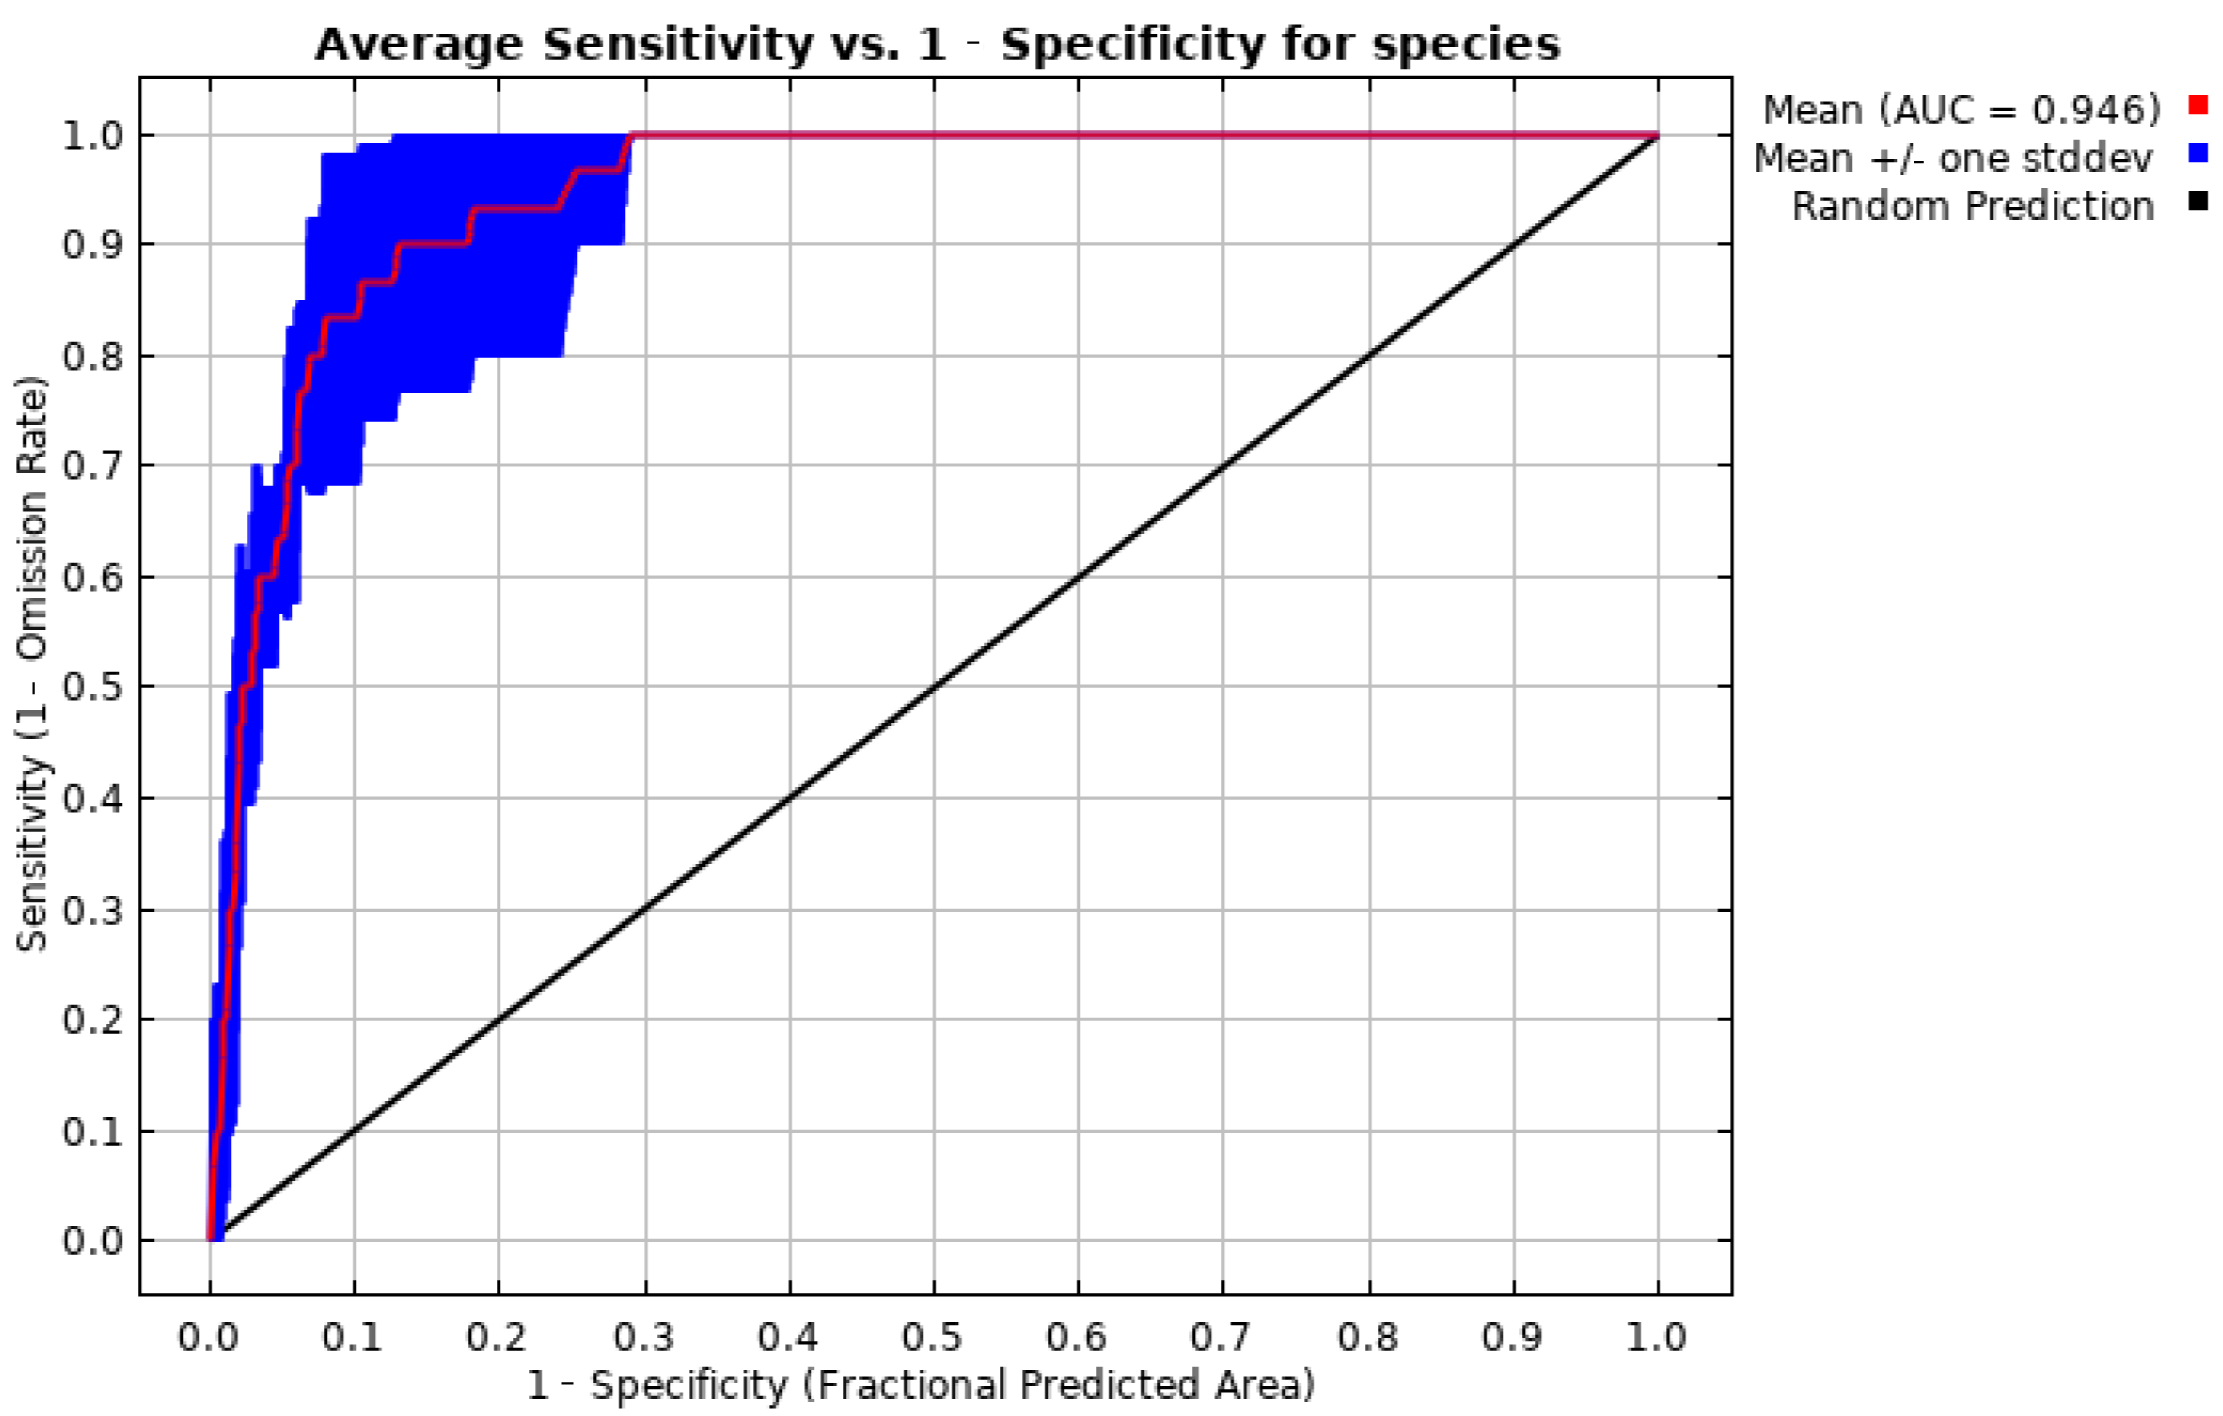
The MaxEnt model demonstrated high predictive effectiveness in predicting the potential suitable habitats of M. nanmu. Prior to optimization, the default parameter settings of MaxEnt were adopted, with the regularization multiplier (RM) set to 1 and the feature combination (FC) set to LQT. After parameter tuning, the optimal model configuration was determined as RM = 0.5 and FC = LQH. Parameter optimization effectively reduced model complexity and prevented overfitting in the MaxEnt analysis. The area under the receiver operating characteristic curve (AUC) is shown in Figure 2. The mean AUC value obtained from ten replicate runs was 0.946, indicating excellent predictive performance of the model for the geographic distribution of the species. In addition, the CBI value was calculated, yielding a CBI of 0.988, which indicates strong predictive capability of the model. Overall, the high AUC value (>0.9) and very good CBI score confirmed the stability and reliability of the model for predicting suitable habitats of M. nanmu in China (Figure 2 and Table S1).

3.2. Relative Importance and Influence of Environmental Predictors

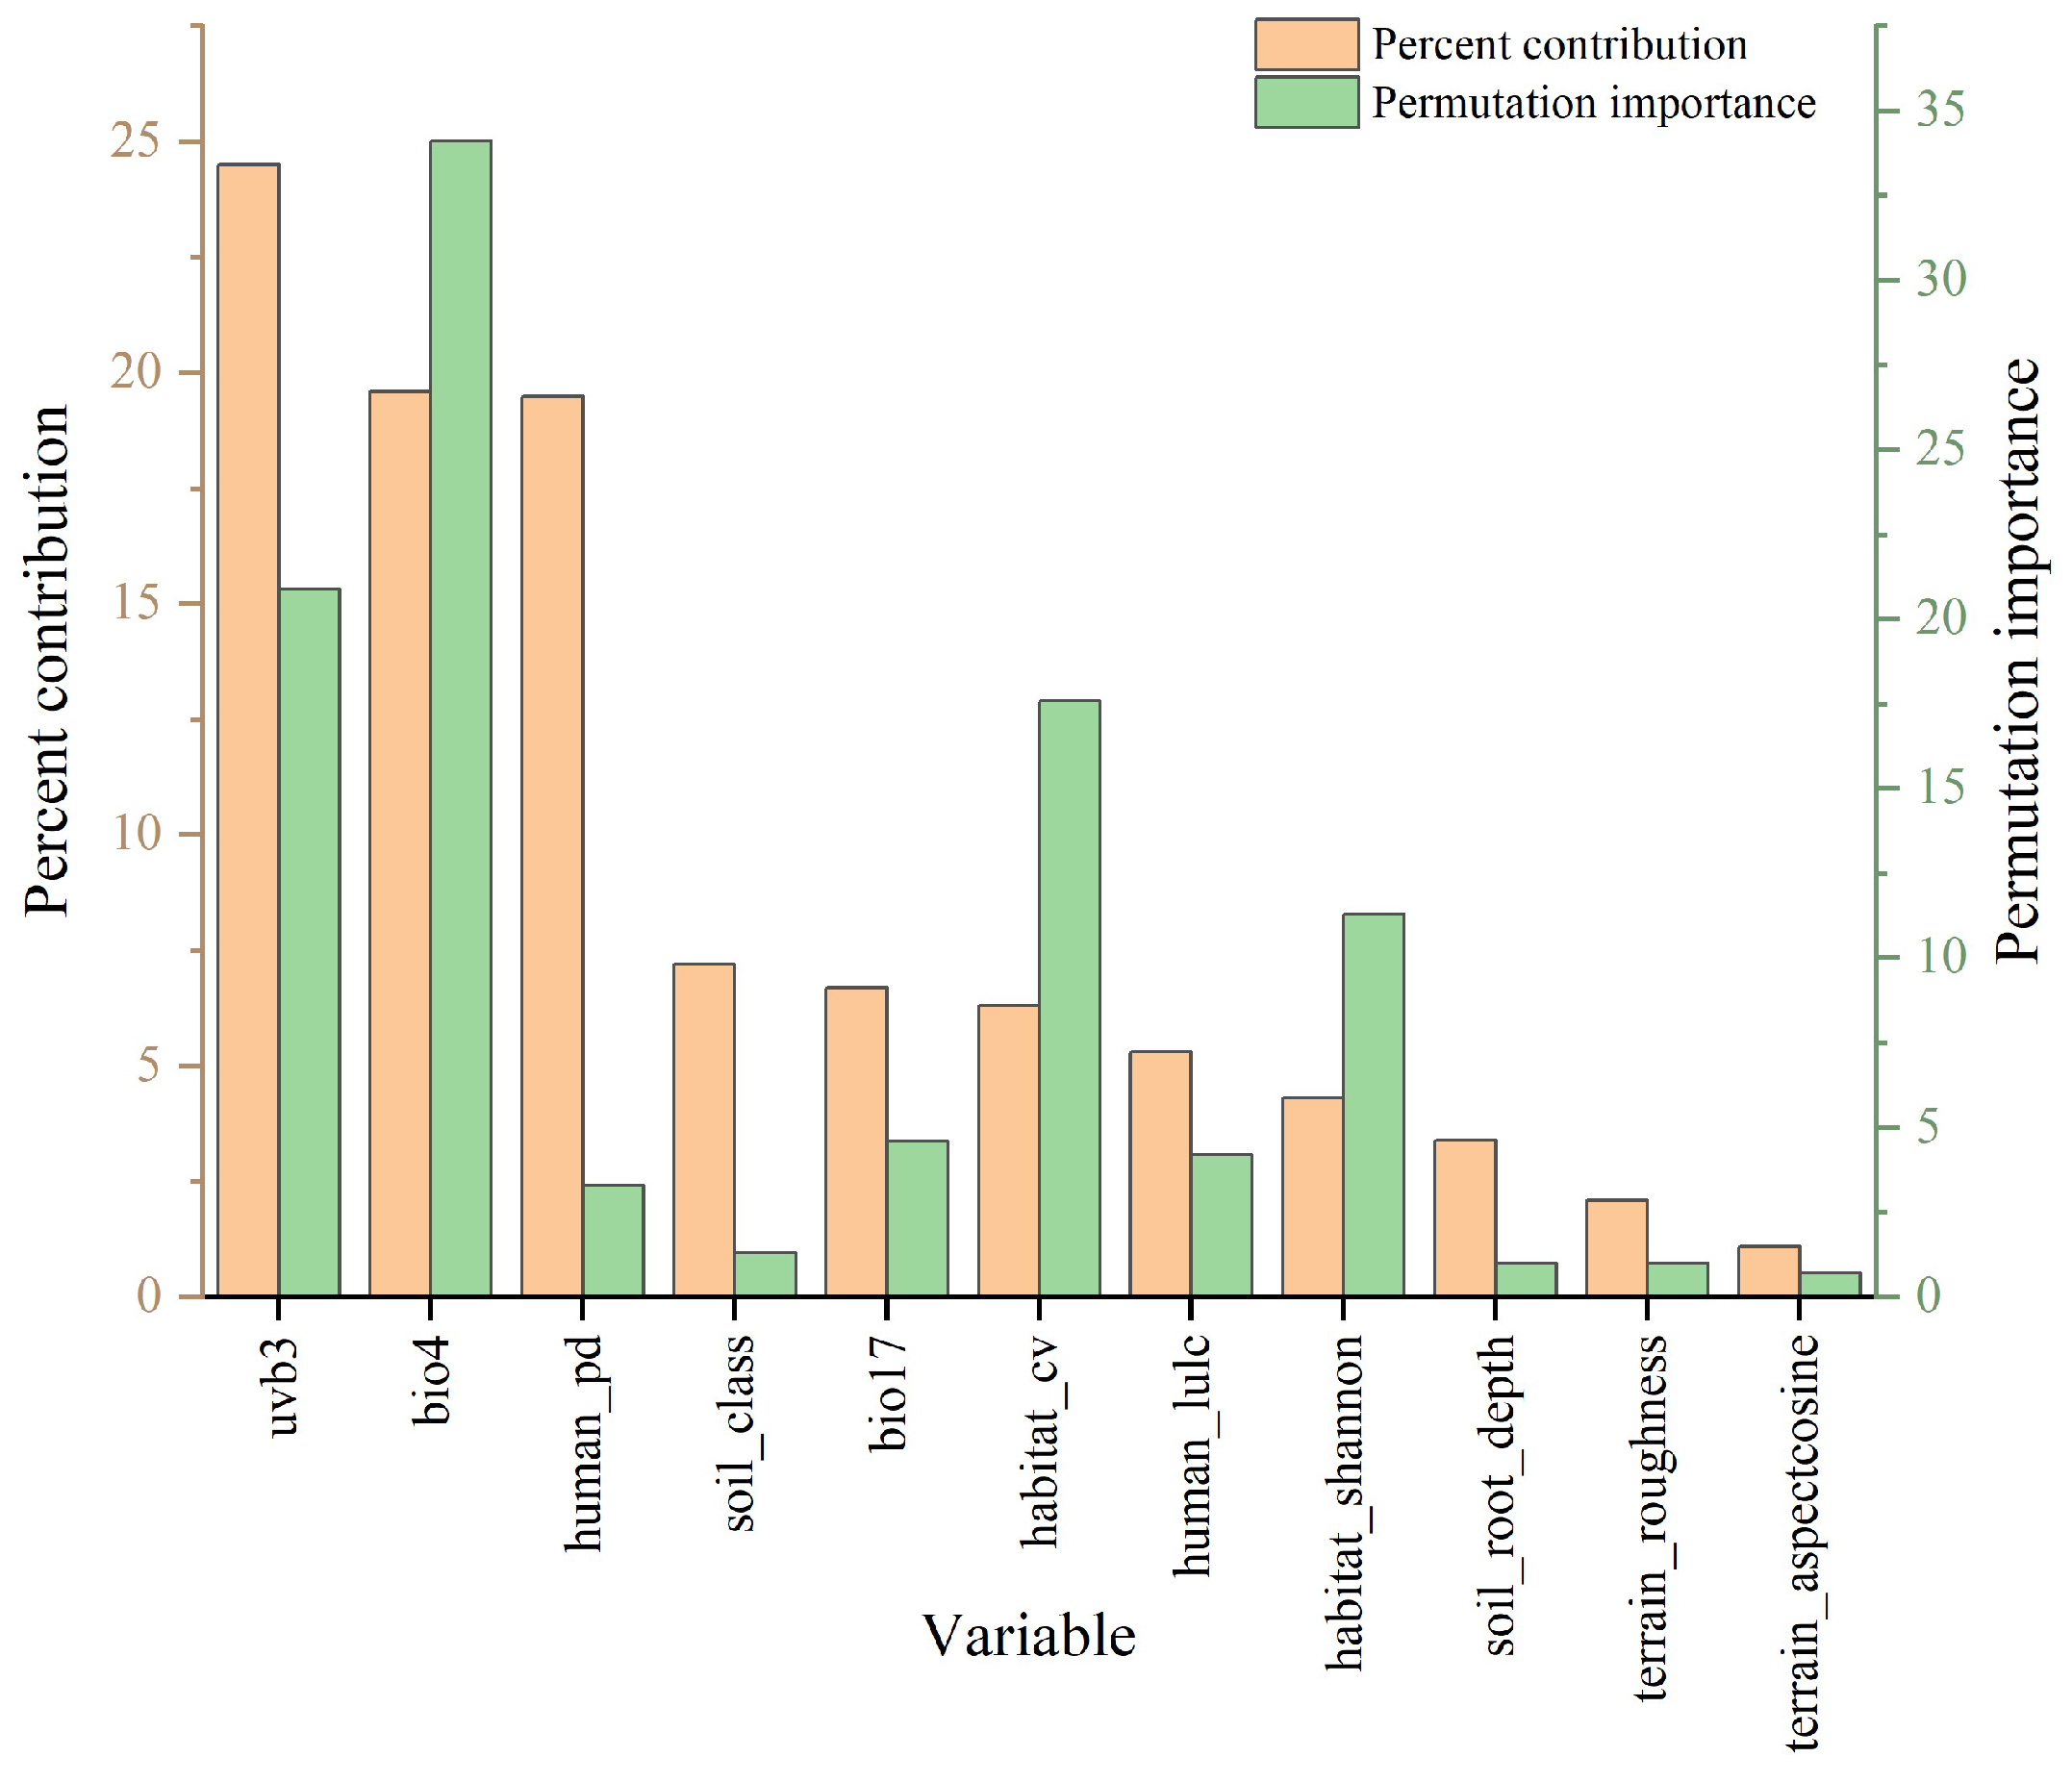
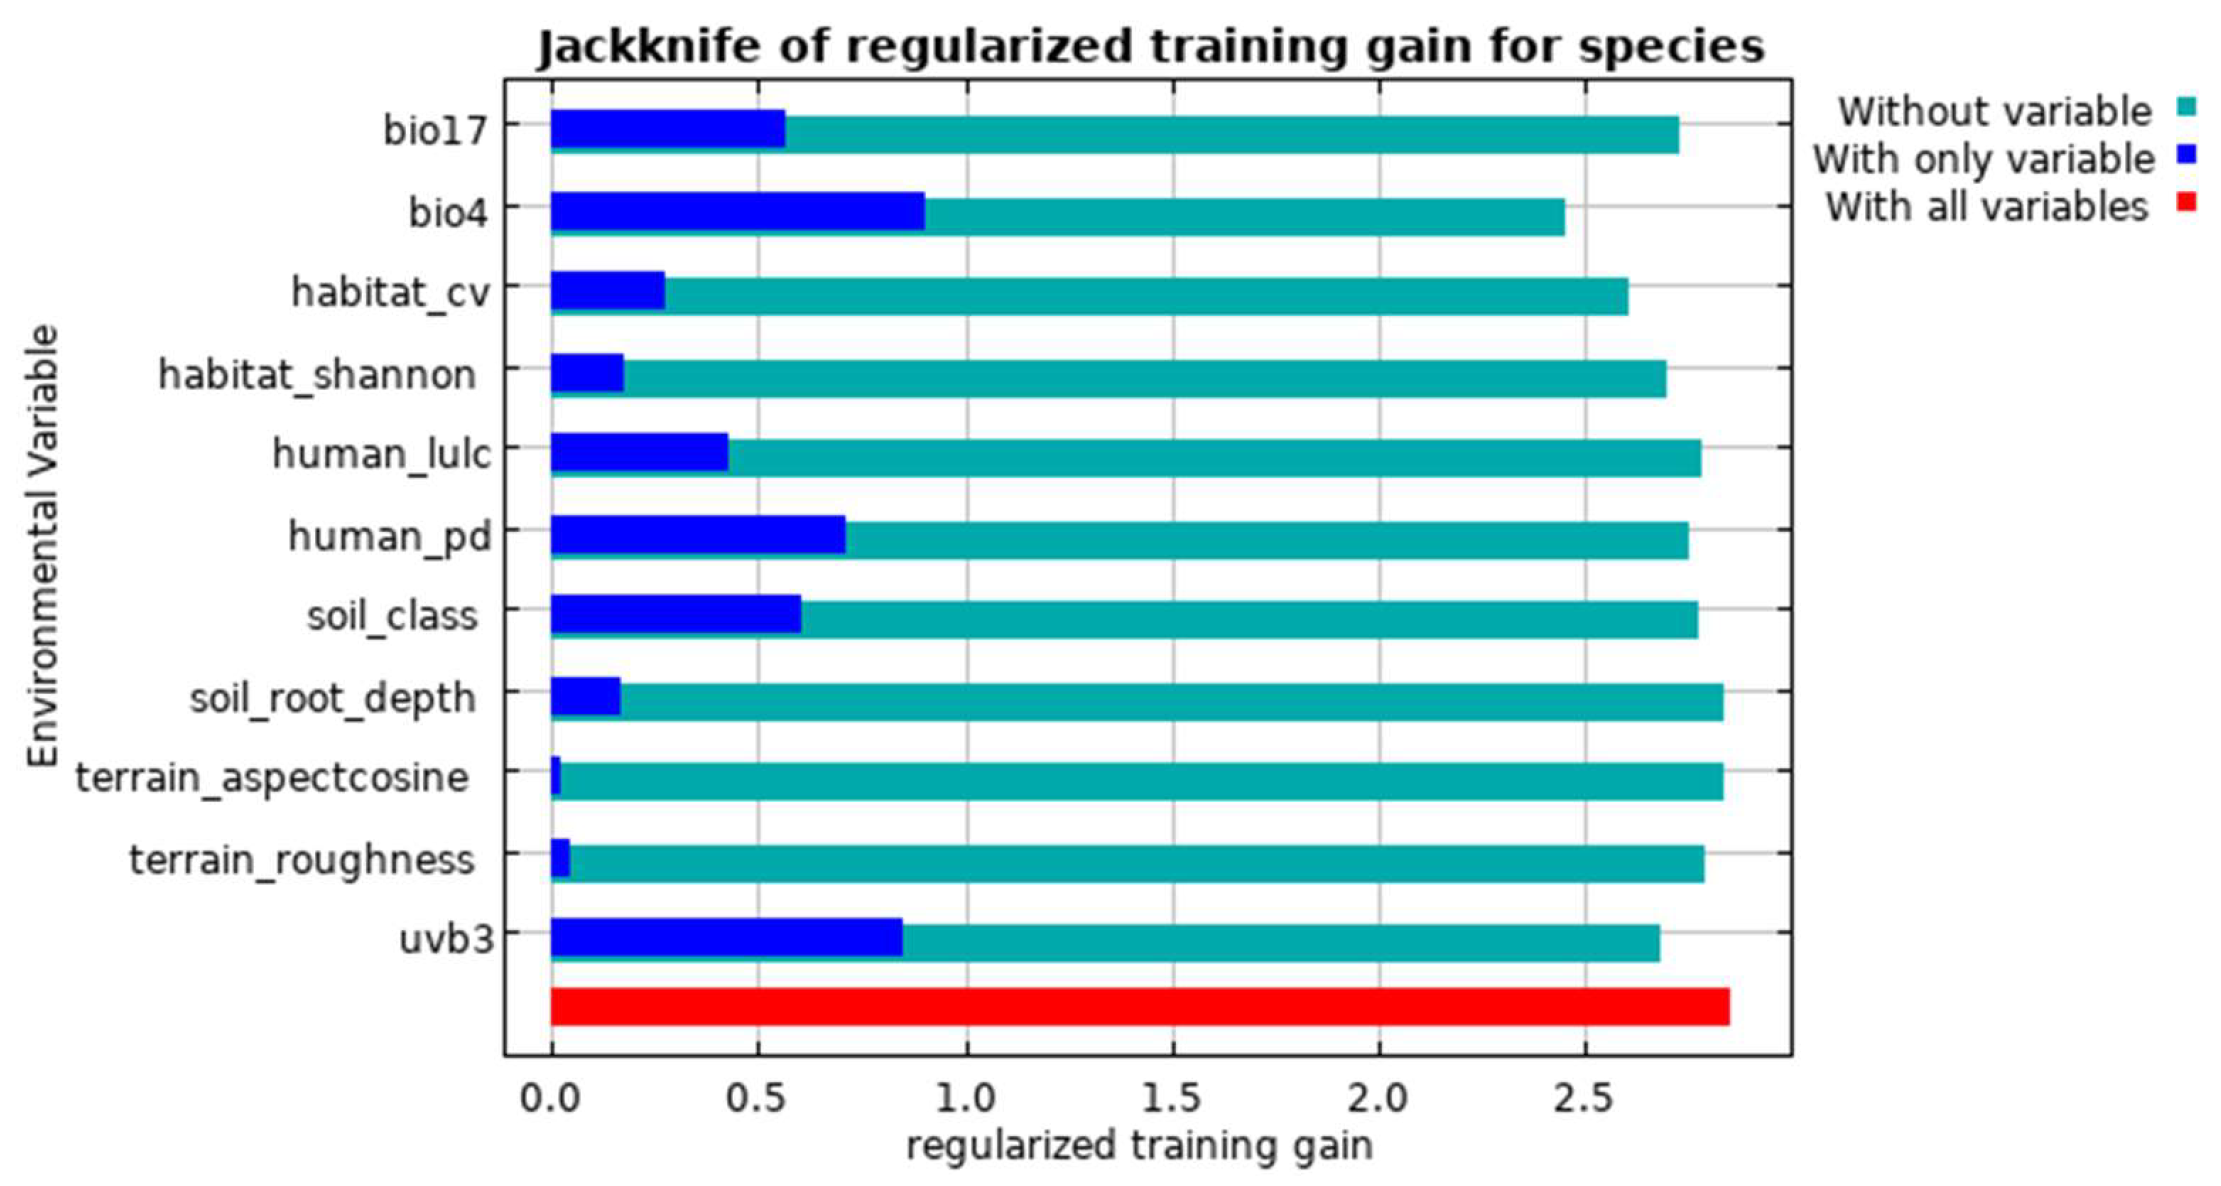
The variable contribution analysis in the MaxEnt model, combined with permutation importance and jackknife tests, identified a series of key environmental factors determining the potential distribution of M. nanmu. In terms of percent contribution (Figure 3), Mean UV-B of the Highest Month (uvb3, 24.5%), Temperature Seasonality (bio4, 19.6%), and Population Distributions (human_pd, 19.5%) were the most influential variables, collectively accounting for nearly 63.6% of the total contribution. This was followed by Soil Classification (soil_class, 7.2%), Precipitation of the Driest Quarter (bio17, 6.7%), Coefficient of Variation (habitat_cv, 6.3%), Land-Use and Land-Cover (human_lulc, 5.3%), En-hanced Vegetation Index Shannon diversity (habitat_shannon, 4.3%), Rootable Soil Depth (soil_root_depth, 3.4%), Roughness (terrain_roughness, 2.1%), and Aspect Cosine (ter-rain_aspectcosine, 1.1%). Notably, permutation importance (reflecting the independent contribution of each variable to the model’s predictive capability) revealed distinct patterns: Temperature Seasonality (bio4, 34.1%), Mean UV-B of the Highest Month (Uvb3, 20.9%), Coefficient of Variation (habitat_cv, 17.6%), and Enhanced Vegetation Index Shannon diversity (habitat_shannon, 4.3%) were substantially higher, highlighting their critical roles in enhancing the model’s discriminative ability. In contrast, other population distribution, soil, land-use/land-cover, and vegetation factors (e.g., human_pd: 3.3%, soil_class: 1.3%, bio17: 4.6%, human_lulc: 4.2%) as well as topographic factors (≤1%) exhibited relatively low permutation importance. The jackknife test of regularized training gain (Figure 4) further validated the importance of these variables. For instance, bio17, when included (Orange bar), significantly increased training gain compared to when omitted (green bar), indicating its unique contribution to model performance. Similarly, bio4, habitat_cv, and habitat_shannon showed marked improvements when evaluated in isolation, consistent with their high percent contributions. Overall, ultraviolet radiation variables (uvb3), climatic variables (especially bio4 and bio17), and human population distribution (human_pd) dominated the determination of suitable habitats for M. nanmu, as evidenced by both percent contributions and training gains from the jackknife test (Figure 3 and Figure 4). Although other factors contributed less in terms of percent contribution, they still contributed to predictive accuracy, as reflected by their nonnegligible permutation importance and their performance across cross-validation folds.

3.3. Predicted Distribution of M. nanmu Under Current and Future Climatic Scenarios

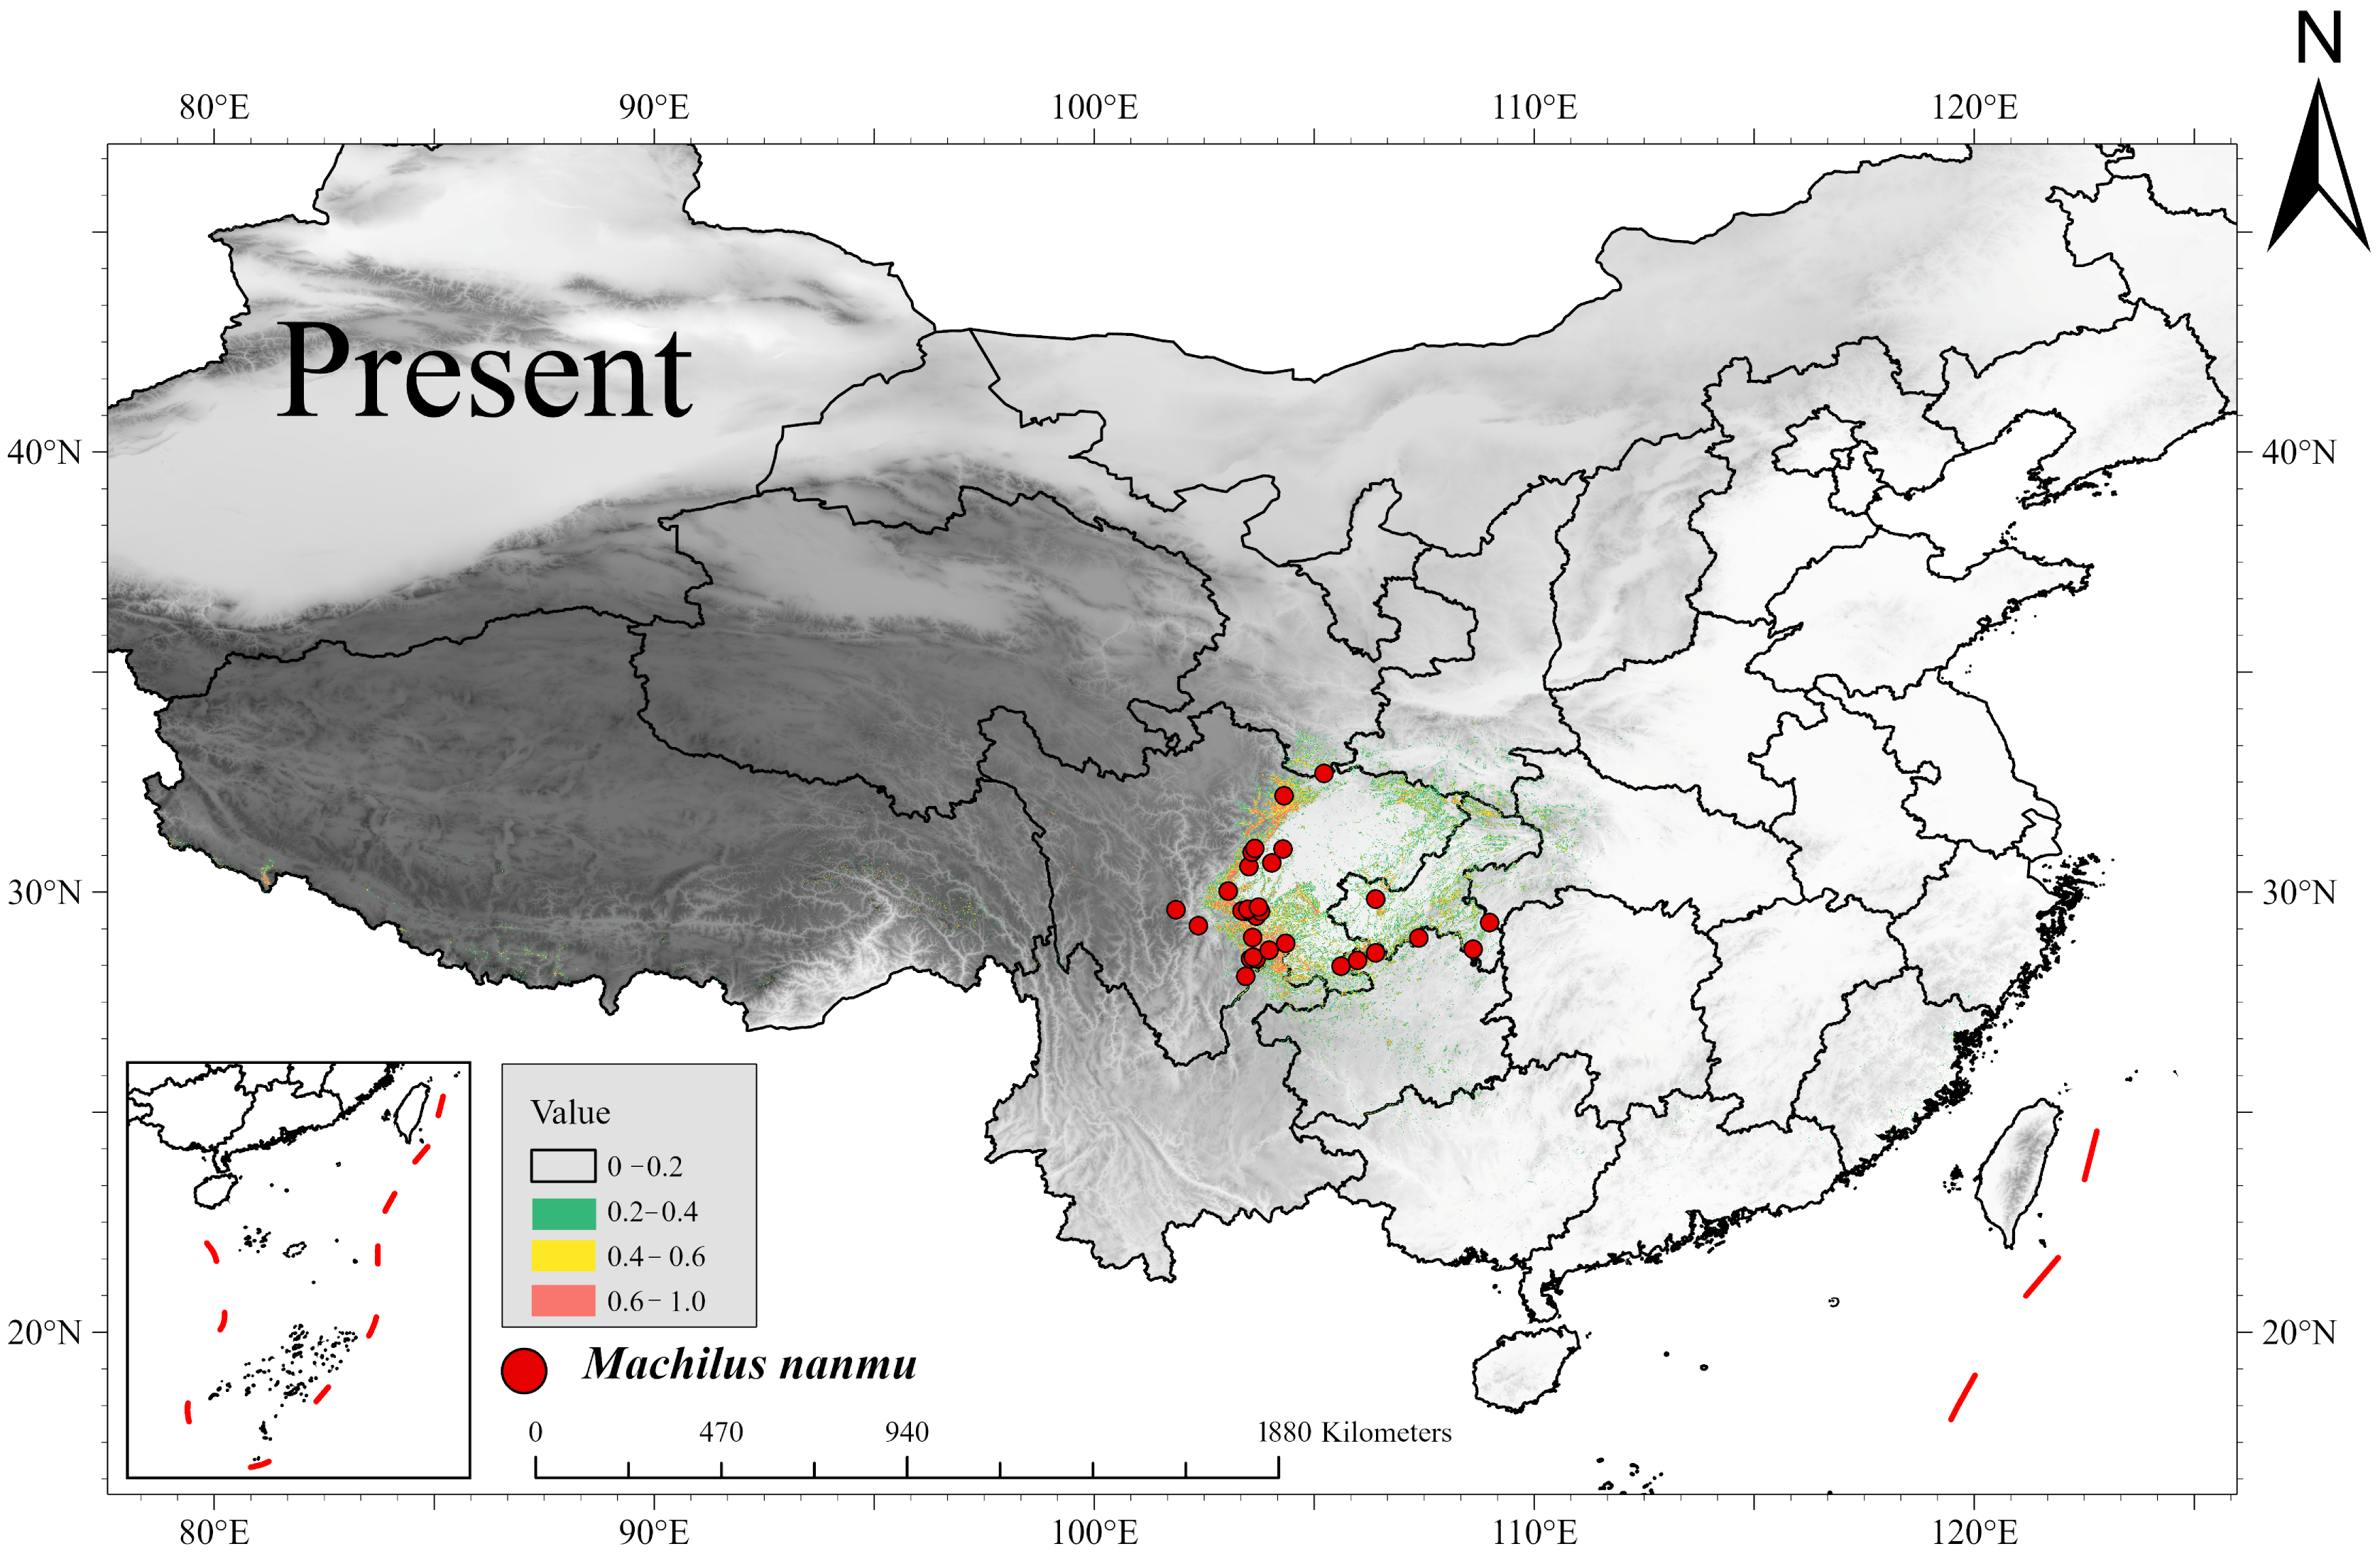
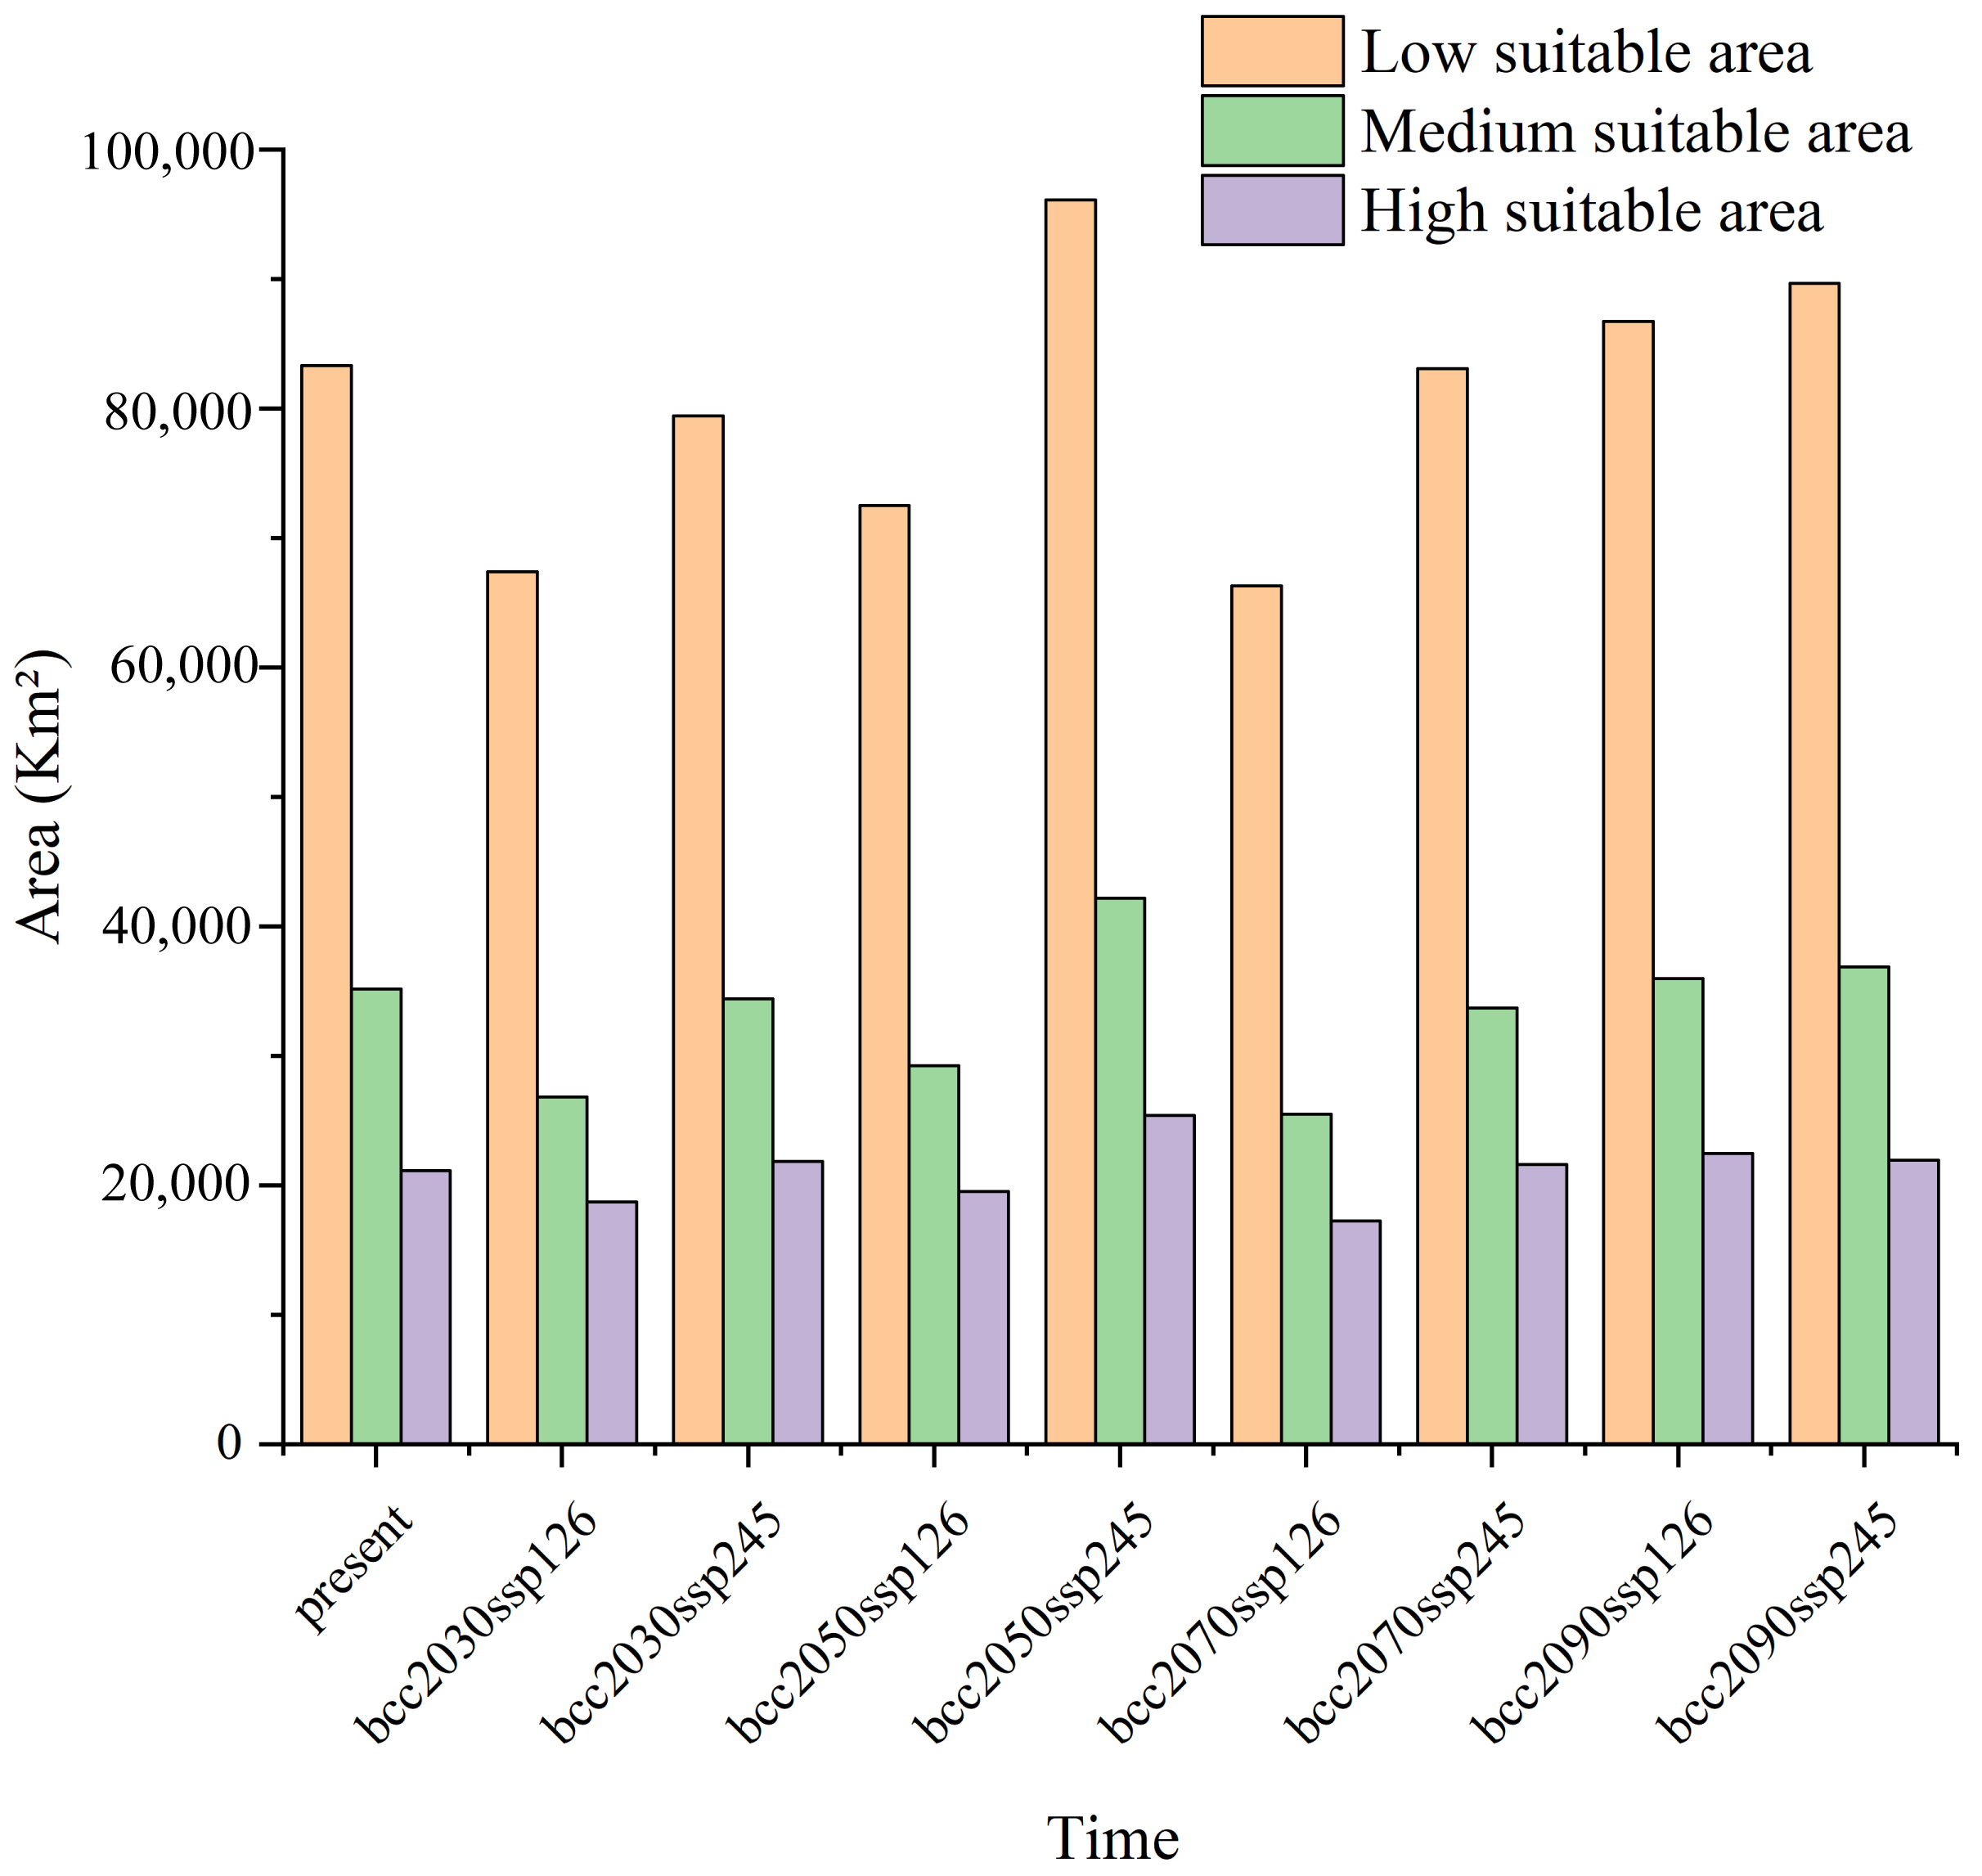
The optimized MaxEnt model exhibited a high degree of spatial congruence with the current distribution records of M. nanmu (Figure 5). Currently, highly suitable habitats encompass 21,109.94 km2, accounting for 0.22% of the study area, and are predominantly concentrated in Sichuan, Chongqing, Yunnan, and parts of Guizhou. Geographically, highly suitable habitats are concentrated in Sichuan and its surrounding areas, encompassing central Sichuan, northern Guizhou, northeastern Yunnan, southern Gansu, southern Shaanxi, and western Hubei, and even extending to certain areas of Xizang. The core areas predicted by the model align closely with the majority of known occurrence records, thereby validating the model outputs. Moderately suitable and low-suitability habitats cover 35,135.05 km2 (7.35%) and 83,299.92 km2 (12.96%), respectively (Figure 5 and Figure 6). Furthermore, the suitable areas extend from this core into adjacent regions, notably parts of Chongqing, Guizhou, Gansu, Shaanxi, and Hubei (Figure 5).

3.4. Distribution Patterns in Future Climate Scenarios

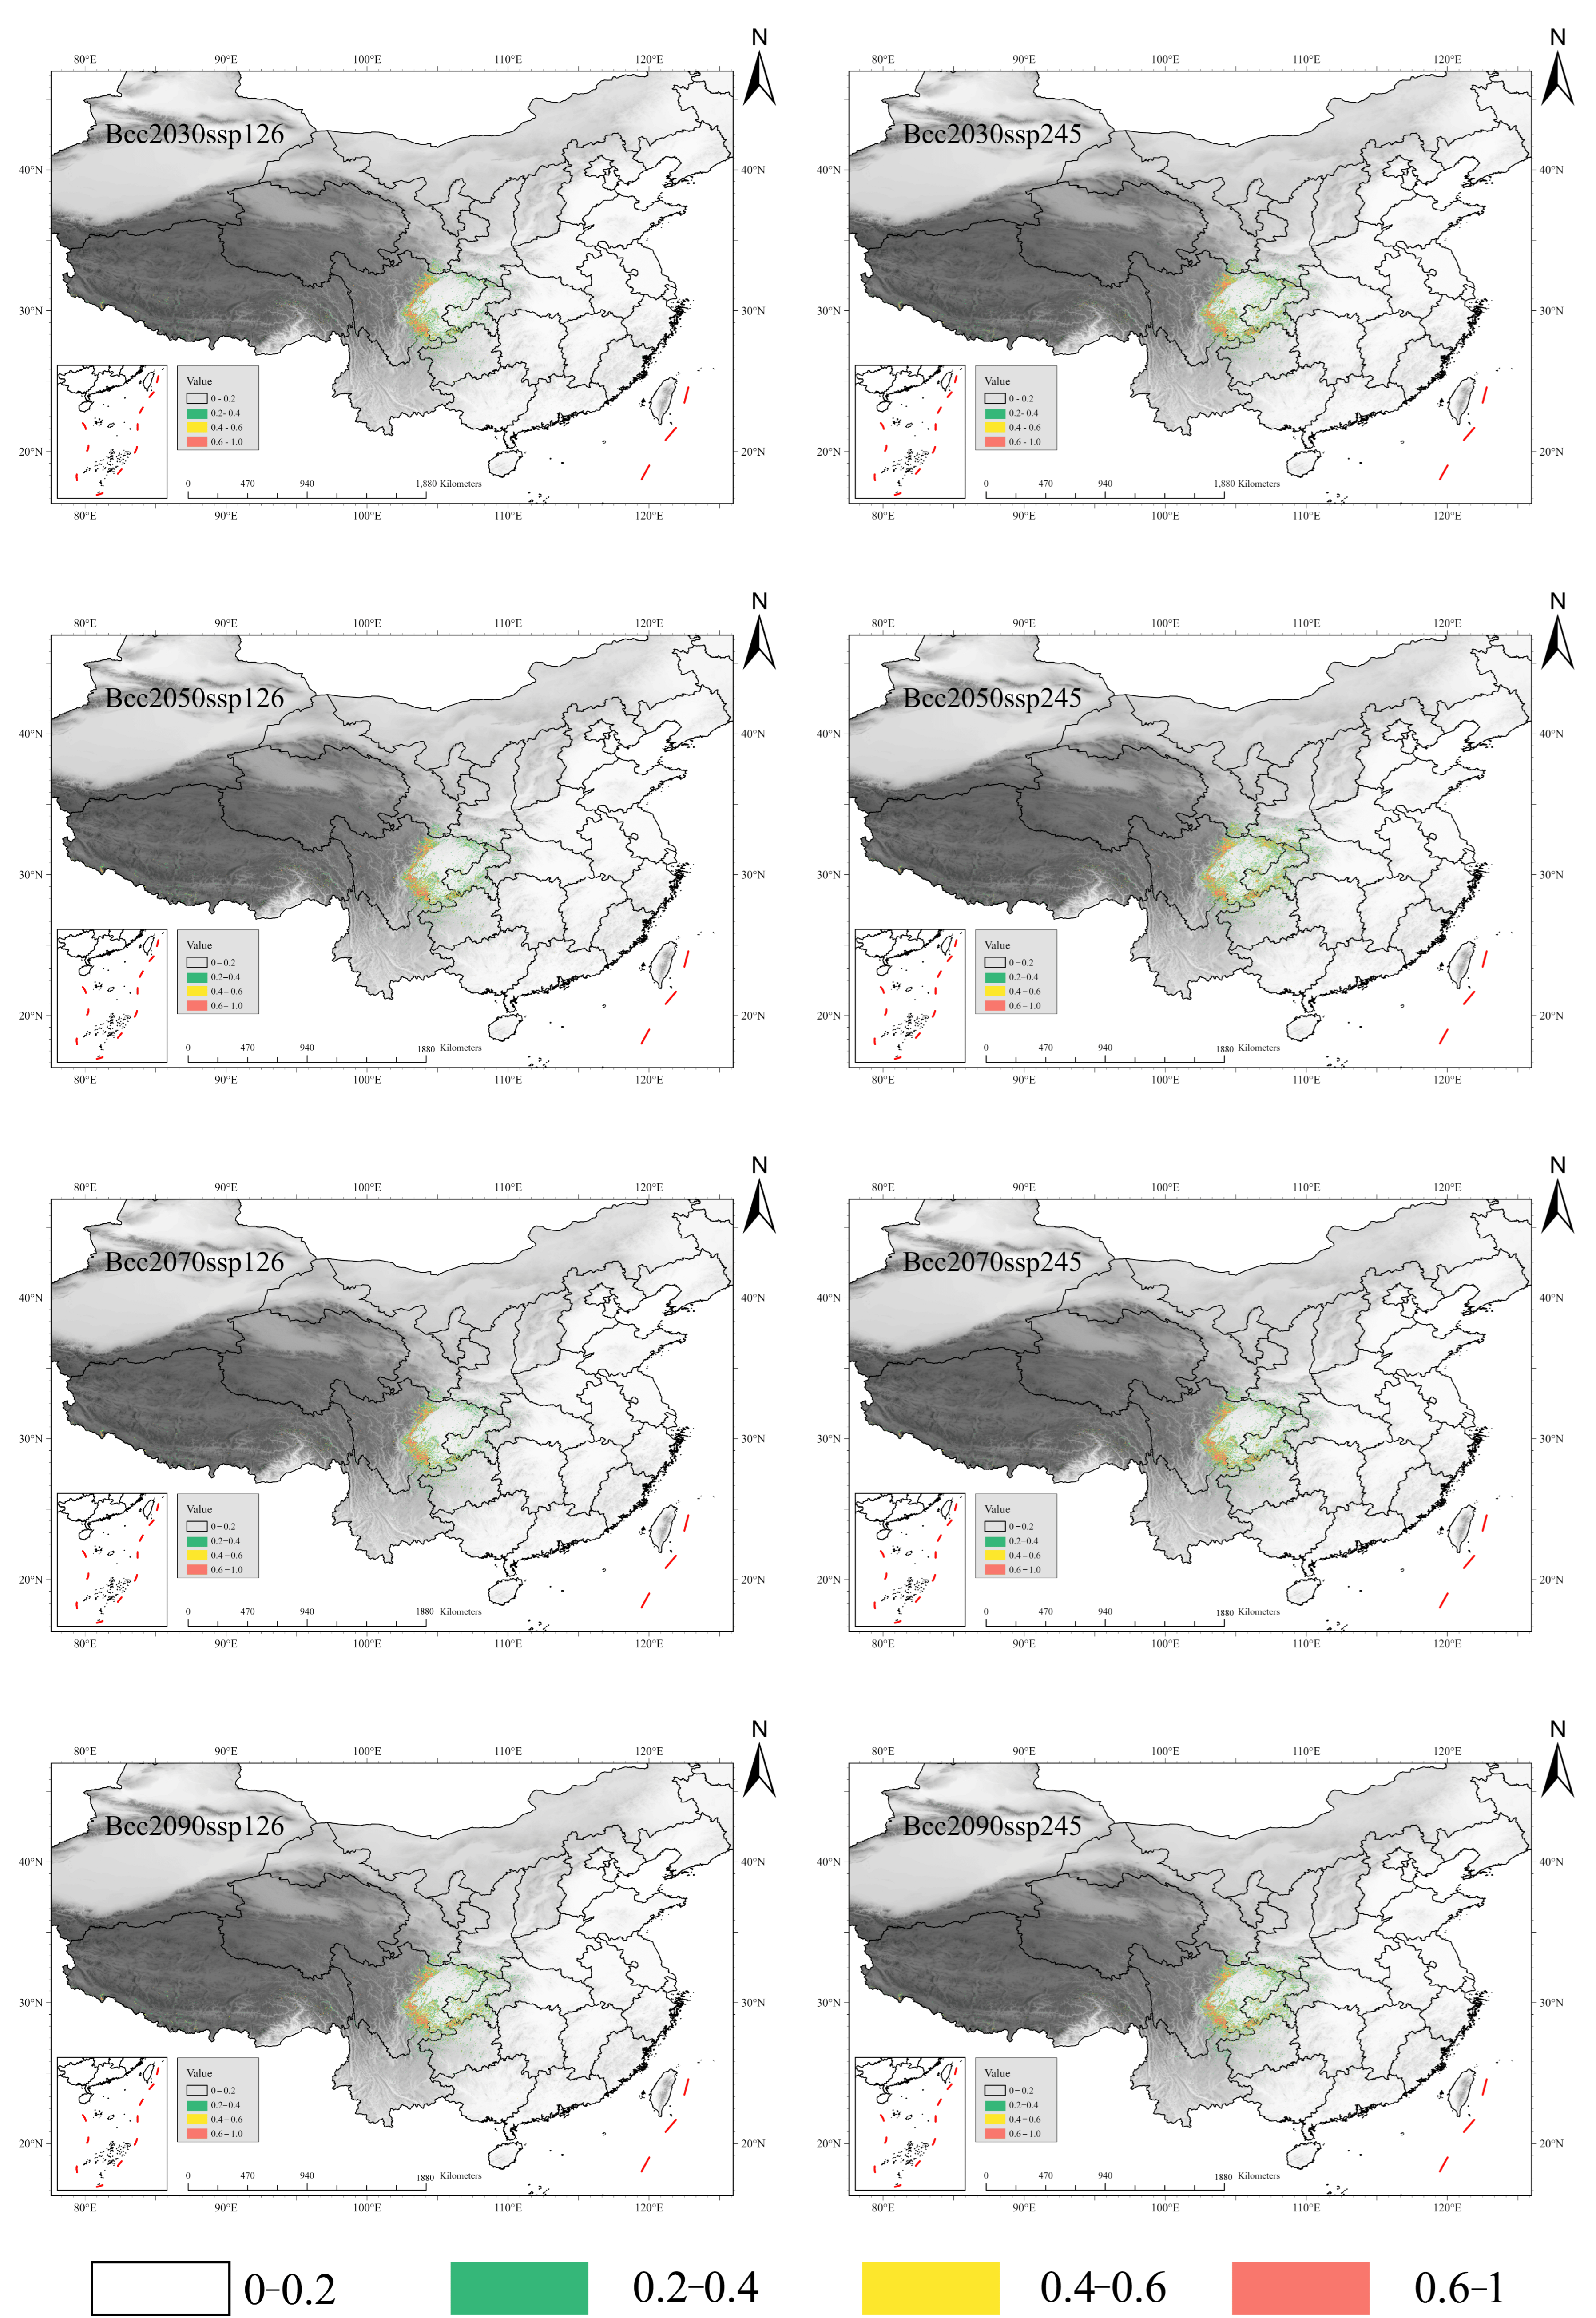
To predict the future potential distribution of M. nanmu, MaxEnt was used to simulate habitat suitability under two contrasting Shared Socioeconomic Pathway (SSP) scenarios, namely SSP1–2.6 and SSP2–4.5, for the 2030s, 2050s, 2070s, and 2090s (Figure 6). The simulation results showed that, except for the 2090s, the spatiotemporal patterns of habitat change differed between the two scenarios. Under the SSP1–2.6 scenario, highly suitable habitats were mainly predicted in Sichuan, Chongqing, Yunnan, Gansu, and Xizang. Although parts of Hunan, Hubei, Jiangxi, and Fujian were also predicted to contain suitable habitats, these areas were relatively scattered. The total suitable habitat area of the species showed clear fluctuations. Compared with the current period (139,544.90 km2), the suitable area sharply decreased to 112,893.31 km2 in the 2030s, representing a decline of approximately 19.1%. It then increased to 121,275.94 km2 in the 2050s, although it still did not recover to the current level, and decreased again to 109,024.13 km2 in the 2070s. By the 2090s, the suitable area increased substantially to 145,185.06 km2, representing an expansion of approximately 4.0% relative to the current period. In the 2090s, the suitable distribution of the species expanded, showing the largest extent of highly suitable habitat (22,446.98 km2) and a relatively large total suitable area (145,185.06 km2) (Figure 5, Figure 6 and Figure 7).
Under the medium-emission SSP2–4.5 scenario, the total suitable habitat area of M. nanmu exhibited a fluctuating trend of ‘essentially stable–significant increase–decline–partial recovery’, rather than a monotonic increase or decrease. It reached a peak in the 2050s, declined in the 2070s, and partially recovered in the 2090s, but did not return to the peak level of the 2050s. Compared with the current period (139,544.91 km2), the suitable area was 135,634.95 km2 in the 2030s, a decrease of approximately 2.8%; it increased to 163,713.78 km2 in the 2050s, an increase of approximately 17.3%; then it declined to 138,362.75 km2 in the 2070s, slightly below the current level (−0.85%); and by the 2090s, it reached 148,484.94 km2, representing an increase of approximately 6.4% relative to the current period. By the 2090s, highly suitable habitats were mainly restricted to Sichuan, Chongqing, Yunnan, Guizhou, Hunan, Shannxi, and Gansu, with Sichuan retaining the largest core area. These results indicate that, under this medium-emission scenario (SSP2–4.5), climate change would exert a fluctuating influence on the suitable distribution of M. nanmu, with its suitable area significantly increasing and peaking in the 2050s, followed by a decline but recovering somewhat by the 2090s. These findings further demonstrate that emission scenarios have an influence on the future distribution of M. nanmu, and that the trends of change differ markedly under different emission pathways.

3.5. Climate Impacts on the Geographical and Spatial Patterns of M. nanmu

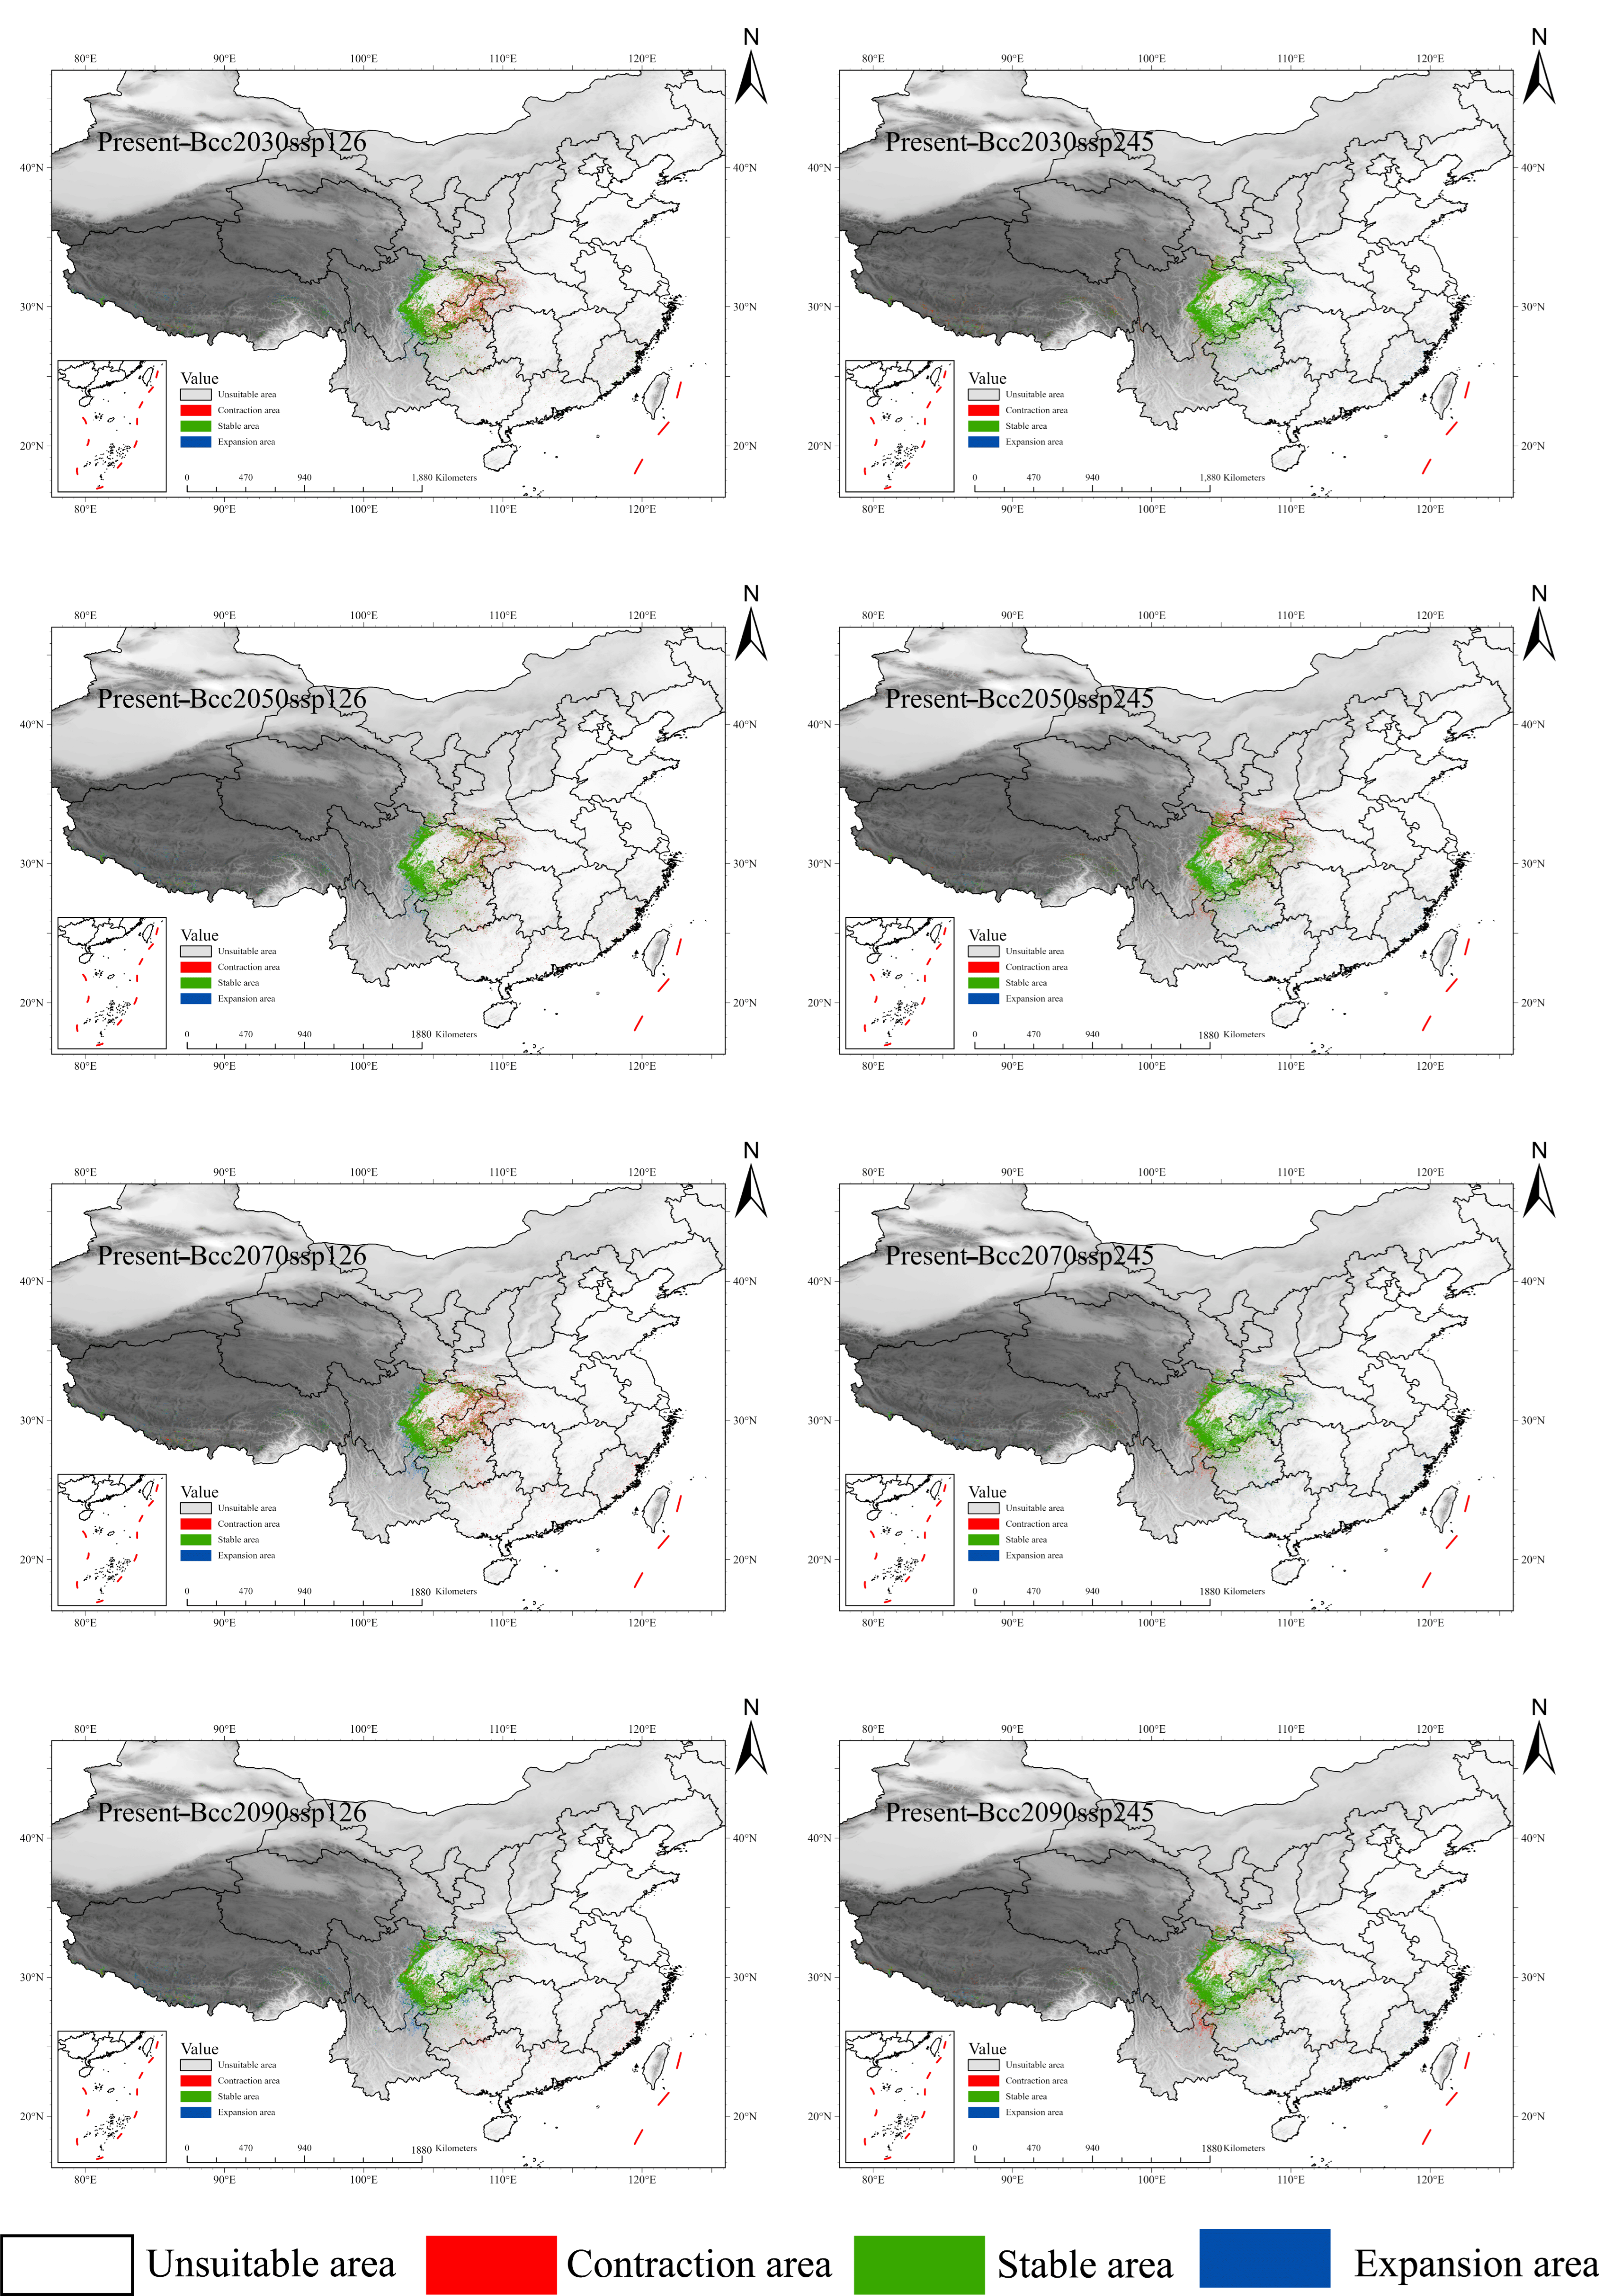
Using the optimized MaxEnt model, we projected potential changes in the distribution of M. nanmu under the SSP1–2.6 and SSP2–4.5 climate scenarios for the 2030s, 2050s, 2070s, and 2090s, and further analyzed the expansion and contraction patterns of suitable habitats under different future scenarios (Figure 8). Under the low-emission SSP1–2.6 scenario, the future suitable habitats of M. nanmu exhibited a V-shaped trend, characterized by an initial decline followed by subsequent recovery. Although the area of highly suitable habitat experienced periodic fluctuations and contraction from the 2030s to the 2070s, reaching its lowest level in the 2070s, it recovered substantially by the 2090s and even exceeded the current level. Spatially, the core habitats remained relatively stable, while considerable expansion occurred in marginal areas. These results suggest that, under a pathway in which climate warming is effectively mitigated, M. nanmu may exhibit strong ecological resilience and recovery potential, and its long-term suitable habitats are likely to be well preserved. The medium-emission SSP2–4.5 scenario was relatively similar to the low-emission SSP1–2.6 scenario. Under the SSP2–4.5 scenario, the change in suitable habitats did not show a continuous severe contraction; rather, the total area fluctuated over time. Spatially, although some core areas may have contracted during certain periods, marginal expansions were sufficient to compensate for these losses, and overall habitat availability remained largely stable or even slightly expanded (Figure 8). These results indicate that, under the SSP2–4.5 scenario, M. nanmu may not face a severe survival crisis; however, the area of highly suitable habitat in the 2090s was lower than that under the low-emission scenario and did not exceed its own peak in the 2050s, suggesting that higher emission intensity may weaken its long-term recovery capacity.
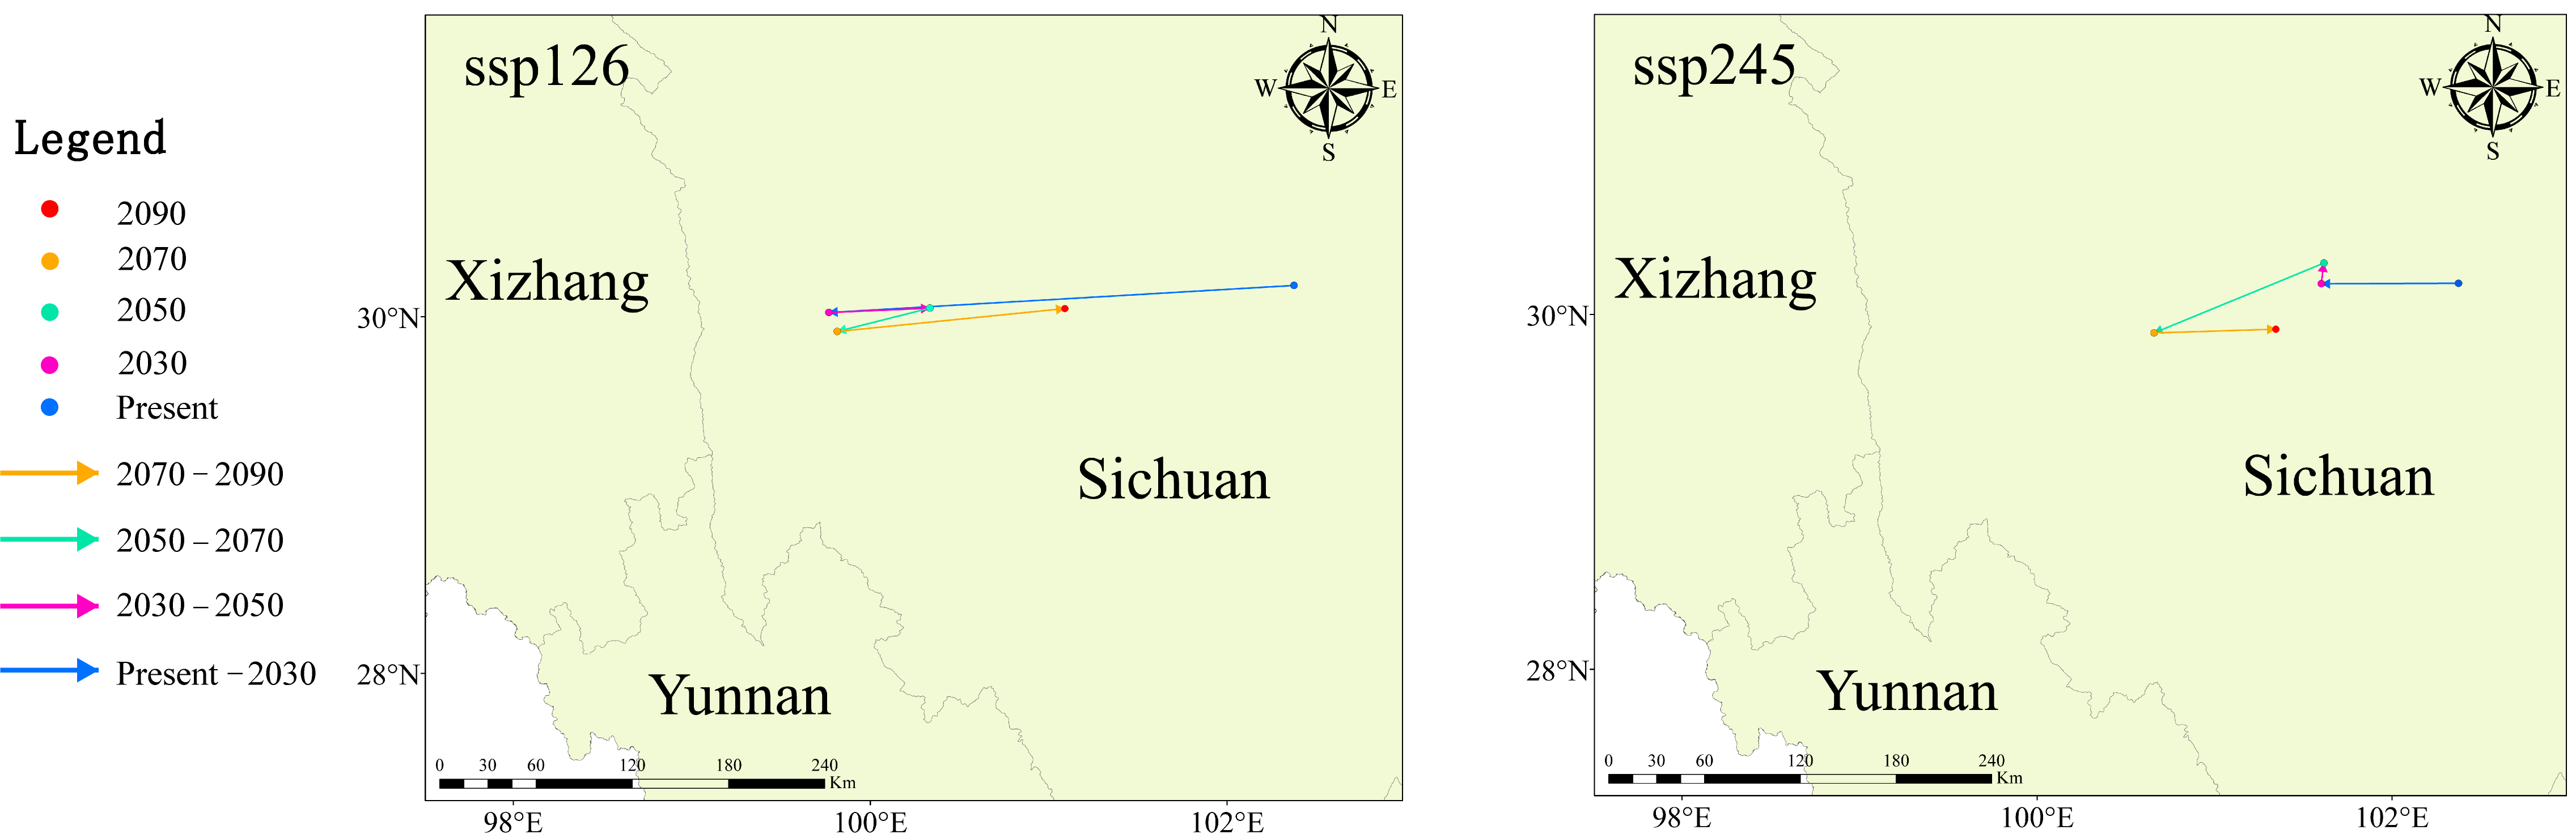
As shown in Figure 9, we calculated the centroid positions of the suitable distribution areas of M. nanmu and determined their migration directions and distances. Under the SSP1–2.6 scenario, the centroid moved 252.08 km westward from the current position to the 2030s, then shifted 54.65 km eastward in the 2050s, followed by a southwestward migration of 52.04 km in the 2070s, and finally moved eastward again by 123.91 km in the 2090s. Overall, the centroid under the SSP1–2.6 scenario exhibited an alternating east–west migration pattern, with a brief southwestward shift occurring between the 2050s and 2070s. Under the SSP2–4.5 scenario, the centroid first moved 74.55 km westward from the current position to the 2030s, then shifted 12.99 km northward in the 2050s, followed by a southwestward migration of 102.14 km in the 2070s, and then moved eastward by 66.37 km in the 2090s. Therefore, the centroid trajectory under the SSP2–4.5 scenario was more complex, with an initial westward and northward adjustment, followed by a significant southwestward migration, and finally a turn to the east (Figure 9 and Table 1).

4. Discussion

4.1. Model Reliability

The MaxEnt algorithm has been widely used for species distribution modeling due to its ability to maintain high predictive accuracy even when species occurrence records are scarce [19,22,56]. However, the performance of this model is susceptible to sampling bias and tends to exhibit overfitting, thereby undermining its transferability [57]. In this study, the cross-validation results were highly consistent with the independent test results, further demonstrating the model’s good robustness and low risk of overfitting. Moreover, spatial filtering was applied to the distribution data of M. nanmu, retaining only one valid occurrence record per 5 km × 5 km grid cell [58], which also significantly mitigated the risk of model overfitting caused by excessive clustering of distribution data. The complexity of the MaxEnt model is closely related to its regularization multiplier and feature combination parameters [59,60]. We optimized the model using the ENMeval package in R [52] and obtained the optimal parameters of RM = 0.5 and FC = LQH, with an average AUC of 0.946 over 10 replicate runs, indicating that the optimization effectively alleviated overfitting tendencies and enhanced predictive accuracy, and that the model exhibited high reliability [61,62].

4.2. Analysis of Key Environmental Variables

The MaxEnt model indicated that the future distribution of M. nanmu is mainly determined by climatic variables (bio4), ultraviolet radiation (Uvb3), and variables related to human activity, while topographic and soil variables had relatively minor effects. This suggests that the growth, development, and geographical distribution of M. nanmu are highly dependent on suitable thermal conditions. For M. thunbergii, a species within the genus Machilus, temperature seasonality (bio4) has been identified as a determinant environmental factor affecting its distribution, with very high percent contribution and per-mutation importance [63]. Meanwhile, species in the genus Machilus are known to be highly sensitive to temperature changes. Relevant studies have shown that a temperature increase of 1.5 °C and 3 °C may favor the establishment and growth of M. gamblei seedlings during a two-year experimental period, but a 4 °C increase would threaten their survival and development [64]. This is consistent with the ecological characteristics of this tree species: M. nanmu is mainly suitable for growing in regions with moderate annual temperatures, distinct seasons, long and rainy summers, and short, wet, and cool winters. In such regions, the annual mean temperature ranges from 19.2 to 28.7 °C, with abundant sunshine throughout the year and favorable light conditions for photosynthesis. Precipitation is ample, with annual rainfall between 1450 and 2000 mm, and rainfall and heat occur in the same season, providing favorable thermal and moisture conditions for the growth and development of M. nanmu [24,65,66]. This hydrothermal combination precisely satisfies its strong dependence on moderate heat conditions and further supports the key role of climatic factors such as Temperature Seasonality (bio4) in shaping its distribution.
Meanwhile, relevant studies have shown that, in terms of resource allocation, M. nanmu seedlings under different canopy environments tend to allocate more biomass to organs responsible for light acquisition in order to balance resource limitations [67]. This suggests that appropriate light conditions are crucial for the growth of M. nanmu. Only when light resources are sufficient do seedlings not need to invest substantial biomass into light-harvesting organs such as leaves, thereby allowing more resources to be allocated to root and stem development. This enables more balanced and robust plant growth, enhancing their competitive ability and survival capacity within the community. Nevertheless, it should be noted that the interactions between climatic and biotic factors are complex. Excessive ultraviolet radiation often leads to elevated leaf temperatures in M. nanmu, inducing heat stress. Such high temperatures induced by intense light precisely touch upon the sensitive thresholds for the survival of species in the genus Machilus. Therefore, in forest management and species conservation, creating a moderately shaded microenvironment that avoids full sunlight exposure is particularly crucial for maintaining the population regeneration of M. nanmu [64,67].
Notably, in addition to the key environmental factors discussed above, other elements also play significant roles in the growth and development of M. nanmu. Although soil and topographic factors contribute relatively little, incorporating them into the model yielded more accurate predictions than would otherwise be the case; without them, the model would predict a larger suitable area than the current one [68]. Studies have shown that in mountainous environments, plant growth and survival are largely influenced by topographic and geomorphic factors, and slope is also a dominant environmental variable limiting the distribution of Machilus species [69]. Topographic factors may exert indirect yet profound influences on the spatial distribution and growth performance of M. nanmu by regulating local microclimates, modifying soil properties, and altering light distribution patterns [63].

4.3. Dynamic Shifts in Suitable Habitats of M. nanmu

Currently, the highly suitable distribution area of M. nanmu is relatively small, accounting for only 0.22% of China’s total land area (approximately 21,109.94 km2), with a highly concentrated spatial distribution mainly focused in Sichuan Province. This distribution pattern closely aligns with the historically documented natural distribution of M. nanmu [24,27]. The modern distribution pattern of M. nanmu shows that it is centered around the Sichuan Basin, with scattered populations in northern Yunnan, northern Guizhou, and even extending to Hunan, Hubei, and Fujian, as illustrated in Figure 3. This distribution pattern reflects the main center of modern distribution and diversification in Sichuan, which fully matches the ecological preference of M. nanmu for warm and humid conditions [63]. From a climatic perspective, the region from Sichuan to Fujian and its adjacent areas exhibit typical monsoon climate characteristics, with hot and rainy summers and mild and dry winters, maintaining warm and humid conditions year-round—conditions highly favorable for the growth of M. nanmu. Notably, most species in the genus Machilus are dominant species in the East Asian tropical and subtropical evergreen broadleaved forests, further confirming that subtropical monsoon regions are generally suitable for the growth of Machilus species [70].
In the future, our simulation results indicated that under the SSP1–2.6 climate scenario, the area of highly suitable habitats for M. nanmu fluctuated considerably, exhibiting a unique asymmetric pattern of core stability at higher elevations and peripheral erosion at lower elevations. This pattern is deeply rooted in the species’ inherent ecological attributes, characterized by being centered on Sichuan and having a preference for warm and humid subtropical climates [24,70]. Under the moderate warming trajectory of SSP1–2.6, the cur-rent core areas in Sichuan and its surrounding mid-to-low elevation regions—where hydrothermal conditions are already favorable—remained within the species’ tolerance thresholds despite short-term disturbances, thus serving as refugia for population persistence. Meanwhile, climate warming raised temperatures in the previously cold-limited high-elevation marginal zones, converting them into newly suitable habitats that absorbed some populations migrating from degraded low-elevation areas [71,72]. Under the SSP2–4.5 scenario, the suitable habitats of M. nanmu showed minor fluctuations and a general expansion trend, but the growth of highly suitable areas in the 2090s remained below that observed under the low-emission scenario. The current distribution pattern, centered on Sichuan and encircled by warm and humid monsoon zones, gradually expanded outward. This expansion likely occurred because moderate but consistent warming under SSP2–4.5 alleviated low-temperature constraints in previously cool marginal areas, especially at higher elevations and in the southwest, while the temperature and moisture conditions of the Sichuan-centered core habitats remained largely within the species’ tolerance limits [72,73]. As a result, peripheral gains of suitable habitat offset or exceeded localized losses, producing a relatively stable and slightly expanded range.

4.4. Conservation and Management Recommendations

Anthropogenic factors have a pervasive impact on Machilus species. Within nature reserves, Machilus species are already sparsely distributed, with evidence of anthropogenic damage commonly observed on seedlings and saplings along survey transects, directly reflecting the ongoing disturbance caused by anthropogenic factors [66]. Particularly against the backdrop of market speculation and skyrocketing prices of “golden-thread nanmu” (Phoebe zhennan S.K.Lee & F.N.Wei), Machilus trees are often mistakenly targeted as being the same as “nanmu”, leading to increasingly frequent digging, logging, and damage to young trees. This disturbance, compounded by the collection of fuelwood driven by economic interests, has severely hindered the natural regeneration of Machilus [24]. Therefore, there is an urgent need to establish systematic conservation measures for Machilus species and to promote the formulation and improvement of relevant national laws and regulations. For the structural gaps observed in Machilus populations, anthropogenic intervention could be employed to facilitate their successful succession. Only through intensified research on the suitable distribution areas of Machilus can this valuable tree resource be more effectively protected and utilized. It is recommended to establish protection sites in areas with concentrated Machilus distribution, install fencing, remove obstacles that affect the growth of mother trees and natural seeding, and create habitats conducive to natural regeneration. Simultaneously, efforts should be intensified in public education and awareness campaigns regarding Machilus conservation, along with strengthened law enforcement to severely penalize illegal logging activities [24,27].

4.5. Research Limitations

Model accuracy depends heavily on the quality and spatial resolution of input data. Although high-resolution climatic, topographic, and soil datasets have become increasingly available, some regions still rely on coarse or outdated data, which may compromise predictive performance. Furthermore, this study did not explicitly incorporate ecological interactions, vegetation succession, land-use change, or direct human disturbances, such as deforestation, agricultural expansion, and urbanization. Consequently, there may be discrepancies between the predicted potential distributions and actual occurrence pat-terns [74]. Future studies that incorporate these factors, along with dynamic feedbacks among environmental variables, could further enhance model realism and predictive accuracy. Moreover, soil properties, topography, and ultraviolet radiation were assumed to remain constant owing to data limitations, even though these factors may undergo chang-es under future climate conditions [75,76]. Incorporating such dynamics represents an important direction for future research and would enhance the applicability of model outputs for wetland conservation and management.

5. Conclusions

In this study, we employed the MaxEnt model integrating climatic, soil, topographic, anthropogenic, and ultraviolet radiation variables to assess the resource distribution pattern, climate change vulnerability, and conservation priorities of M. nanmu. The highly suitable areas for this species are located in Sichuan, Chongqing, Yunnan, and Guizhou, with secondary endemic hotspots in parts of central and southwestern China, exhibiting a macro-geographic pattern of “core aggregation with marginal independent differentiation”. The optimized MaxEnt model (AUC = 0.946) revealed that Mean UV-B of the Highest Month (Uvb3, 24.5% contribution), Temperature Seasonality (bio4, 19.6%), and Population Distribution (human_pd, 19.5%) were the dominant factors limiting its distribution. Under the pessimistic SSP2–4.5 scenario, the highly suitable area of M. nanmu is projected to increase by approximately 3.9% by the 2090s; however, its centroid trajectory is more complex, initially shifting westward and northward, then significantly southwestward, and finally turning eastward; and under the optimistic SSP1–2.6 scenario, the highly suitable area is projected to increase by approximately 6.3% by the 2090s, with the centroid showing an oscillatory east–west migration pattern and a brief southwestward shift between the 2050s and 2070s. The highly suitable habitats in Sichuan, Chongqing, northern Yunnan, and northern Guizhou are projected to remain relatively stable and could serve as potential climate refugia. However, Machilus species have long been affected by anthropogenic factors. Targeted measures are urgently needed: new nature reserves or micro-reserves should be established in hotspot areas (western and southern Sichuan, northeastern Yunnan, Chongqing, and Guizhou), and projected migration corridors should be incorporated into the reserve network planning to enhance connectivity among populations and alleviate the threat of fragmentation to this genus. It should be noted that the current predictions rely on a single climate model (BCC–CSM2–MR); the robustness of predictions could be improved by employing a multimodel ensemble approach. Species distribution data may be subject to sampling bias and spatial autocorrelation. The MaxEnt model did not account for interspecific competition or dispersal limitations, and our single-species approach may have masked niche differentiation among congeneric species. Future research should integrate ensemble predictions from multiple climate models with more refined species-level distribution data. Despite these limitations, our findings contribute to conservation planning by identifying core refugia, conservation gaps, and migration corridors. We call for the immediate implementation of the above strategies to address the combined threats of climate change and habitat degradation, ensuring the long-term survival of Machilus species in the wild.

Supplementary Materials

The following supporting information can be downloaded at https://www.mdpi.com/article/10.3390/f17091071/s1, Table S1: Filtered environmental factors of M. nanmu; Table S2: All environment variables used to build the MaxEnt model.

Author Contributions

Y.-M.P. and Z.-W.L.: Writing—Original Draft, Writing—Review & Editing, Data Curation, Formal Analysis, Investigation, Methodology, Project Administration, Software, Validation, and Visualization. L.-L.W. and Z.-Y.Y.: Writing—Original Draft, Writing—Review & Editing, Visualization, Software, Methodology, Formal Analysis, Data Curation, and Conceptualization. H.W.: Writing—Review & Editing, Data Curation, Formal Analysis, Investigation, Project Administration, Resources, Supervision, and Validation. Y.C., J.-J.S., R.X. and F.-K.K.: Writing—Review & Editing, Formal Analysis, Data Curation, and Investigation. K.-F.G., Z.-T.Y., Q.-L.W. and Z.-P.F.: Writing—Review & Editing, Data Curation, Formal Analysis, Investigation, and Validation. All authors have read and agreed to the published version of the manuscript.

Funding

This study was supported by Yunnan Science and Technology Talent and Platform Program (202305AM340008).

Data Availability Statement

The original contributions presented in the study are included in the article/Supplementary Material. Further inquiries can be directed to the corresponding authors.

Acknowledgments

We are grateful to Jianming Zhao for kindly supplying the photographs of Machilus nanmu and its habitat used in this study. We thank all the individuals who have helped us in this study.

Conflicts of Interest

The authors declare no conflicts of interest.

Abbreviations

The following abbreviations are used in this manuscript:
SDMsSpecies Distribution Models
ENEndangered
AUCThe area under the receiver operating characteristic curve
CBIThe continuous Boyce index
RMRegularization multiplier
FCFeature combination
SSPShared Socioeconomic Pathway
GCMsGlobal Climate Models

References

  1. Keck, F.; Peller, T.; Alther, R.; Barouillet, C.; Blackman, R.; Capo, E.; Chonova, T.; Couton, M.; Fehlinger, L.; Kirschner, D.; et al. The Global Human Impact on Biodiversity. Nature 2025, 641, 395–400. [Google Scholar] [CrossRef] [Scilit] [PubMed]
  2. Díaz, S.; Settele, J.; Brondízio, E.S.; Ngo, H.T.; Agard, J.; Arneth, A.; Balvanera, P.; Brauman, K.A.; Butchart, S.H.; Chan, K.M.; et al. Pervasive Human-Driven Decline of Life on Earth Points to the Need for Transformative Change. Science 2019, 366, eaax3100. [Google Scholar] [CrossRef] [Scilit] [PubMed]
  3. IPBES. Summary for Policymakers of the Global Assessment Report on Biodiversity and Ecosystem Services of the Intergovernmental Science-Policy Platform on Biodiversity and Ecosystem Services; IPBES Secretariat: Bonn, Germany, 2019. [Google Scholar]
  4. Han, X.; Zhao, Y.; Chen, Y.; Xu, J.; Jiang, C.; Wang, X.; Zhuo, R.; Lu, M.-Z.; Zhang, J. Lignin Biosynthesis and Accumulation in Response to Abiotic Stresses in Woody Plants. For. Res. 2022, 2, 9. [Google Scholar] [CrossRef] [Scilit] [PubMed]
  5. Rodríguez-Pacheco, A.; Formoso-Freire, V.; Olalla Lorenzo-Carballa, M.; Baselga, A.; Gómez-Rodríguez, C. Thermophilization and Reshuffling of Montane Leaf Beetle Communities over a Two-Decade Period. J. Syst. Evol. 2024, 62, 321–331. [Google Scholar] [CrossRef] [Scilit]
  6. Barnosky, A.D.; Matzke, N.; Tomiya, S.; Wogan, G.O.; Swartz, B.; Quental, T.B.; Marshall, C.; McGuire, J.L.; Lindsey, E.L.; Maguire, K.C.; et al. Has the Earth’s Sixth Mass Extinction Already Arrived? Nature 2011, 471, 51–57. [Google Scholar] [CrossRef] [Scilit] [PubMed]
  7. Song, Y.-X.; Hu, T.; Peng, S.; Cong, Y.-Y.; Hu, G.-W. Palynological and Macroscopic Characters Evidence Infer the Evolutionary History and Insight into Pollination Adaptation in Impatiens (Balsaminaceae). J. Syst. Evol. 2024, 62, 403–420. [Google Scholar] [CrossRef] [Scilit]
  8. Willis, K.J. State of the World’s Plants; Royal Botanic Gardens: London, UK, 2017; ISBN 978-1-84246-647-6. [Google Scholar]
  9. Qin, H.; Yang, Y.; Dong, S.; He, Q.; Jia, Y.; Zhao, L. Threatened Species List of China’s Higher Plants. Biodivers. Sci. 2017, 25, 696–744. [Google Scholar] [CrossRef] [Scilit]
  10. Liao, M.; Zhang, J.; Li, M.; Zhou, Y.; Wang, Z.; Xu, B. Genomic Analysis of Xerophyte Salweenia Species Provides Insights into the Alpine Dry–Warm Valleys Divergence and Survival History. Plant J. 2025, 124, e70597. [Google Scholar] [CrossRef] [Scilit] [PubMed]
  11. Yan, Z.-Y.; Wu, H.-Y.; Tian, B.; Ye, J.-W. Comparison of Shifts of Potential Distributions in Gleditsia (Fabaceae) between Eastern Asia and Eastern North America. Ecol. Evol. 2025, 15, e72591. [Google Scholar] [CrossRef] [Scilit] [PubMed]
  12. Marcer, A.; Sáez, L.; Molowny-Horas, R.; Pons, X.; Pino, J. Using Species Distribution Modelling to Disentangle Realised versus Potential Distributions for Rare Species Conservation. Biol. Conserv. 2013, 166, 221–230. [Google Scholar] [CrossRef] [Scilit]
  13. Isaac, N.J.; Jarzyna, M.A.; Keil, P.; Dambly, L.I.; Boersch-Supan, P.H.; Browning, E.; Freeman, S.N.; Golding, N.; Guillera-Arroita, G.; Henrys, P.A.; et al. Data Integration for Large-Scale Models of Species Distributions. Trends Ecol. Evol. 2020, 35, 56–67. [Google Scholar] [CrossRef] [Scilit] [PubMed]
  14. Wiens, J.A.; Stralberg, D.; Jongsomjit, D.; Howell, C.A.; Snyder, M.A. Niches, Models, and Climate Change: Assessing the Assumptions and Uncertainties. Proc. Natl. Acad. Sci. USA 2009, 106, 19729–19736. [Google Scholar] [CrossRef] [Scilit] [PubMed]
  15. Phillips, S.J.; Dudík, M.; Schapire, R.E. A Maximum Entropy Approach to Species Distribution Modeling. In Proceedings of the Twenty-First International Conference on Machine Learning; Association for Computing Machinery: New York, NY, USA, 2004; p. 83. [Google Scholar]
  16. Jin, S.; Chi, Y.; Li, X.; Shu, P.; Zhu, M.; Yuan, Z.; Liu, Y.; Chen, W.; Han, Y. Predicting the Response of Three Common Subtropical Tree Species in China to Climate Change. Front. For. Glob. Change 2023, 6, 1299120. [Google Scholar] [CrossRef] [Scilit]
  17. Nguyen, D.; Leung, B. How Well Do Species Distribution Models Predict Occurrences in Exotic Ranges? Glob. Ecol. Biogeogr. 2022, 31, 1051–1065. [Google Scholar] [CrossRef] [Scilit]
  18. Qin, A.; Liu, B.; Guo, Q.; Bussmann, R.W.; Ma, F.; Jian, Z.; Xu, G.; Pei, S. Maxent Modeling for Predicting Impacts of Climate Change on the Potential Distribution of Thuja sutchuenensis Franch., an Extremely Endangered Conifer from Southwestern China. Glob. Ecol. Conserv. 2017, 10, 139–146. [Google Scholar] [CrossRef] [Scilit]
  19. Gao, K.; Wang, C.; Wu, H. Safeguarding a National Treasure: Modeling the Climate-Driven Habitat Shift of the National Key Protected Aquilaria sinensis in China. Ind. Crops Prod. 2025, 235, 121789. [Google Scholar] [CrossRef] [Scilit]
  20. Chen, Z.; Kang, W.; Li, G.; He, R.; Luo, Z. Distributional Response of the Rare and Critically Endangered Ilex nanchuanensis to Climate Change in East Asia. Environ. Res. Commun. 2024, 6, 105027. [Google Scholar] [CrossRef] [Scilit]
  21. Yao, W.; Wang, Z.; Fan, Y.; Liu, D.; Ding, Z.; Zhou, Y.; Hu, S.; Zhang, W.; Ou, J. Prediction of Potential Habitat Distributions and Climate Change Impacts on the Rare Species Woonyoungia septentrionalis (Magnoliaceae) in China Based on MaxEnt. Plants 2024, 14, 86. [Google Scholar] [CrossRef] [Scilit] [PubMed]
  22. Merow, C.; Smith, M.J.; Silander, J.A., Jr. A Practical Guide to MaxEnt for Modeling Species’ Distributions: What It Does, and Why Inputs and Settings Matter. Ecography 2013, 36, 1058–1069. [Google Scholar] [CrossRef] [Scilit]
  23. Flora of China Editorial Committee. Flora of China; Science Press: Beijing, China, 2018. [Google Scholar]
  24. He, F.; Long, T.; Liu, X.; Liu, S. Discussion on Resource Condition and Taxonomic Status of Machilus nanmu. Sichuan For. Sci. Technol. 2012, 33, 29–30. [Google Scholar]
  25. Zhao, J.; Ding, H.-X.; Song, Q.-Y.; Gao, K. Chemical Constituents of Plants from the Genus Machilus. Chem. Biodivers. 2011, 8, 1943–1957. [Google Scholar] [CrossRef] [Scilit] [PubMed]
  26. Thin, D.B.; Thinh, B.B. Chemical Composition and Antimicrobial Activity of Leaf Essential Oil of Machilus platycarpa. Chem. Nat. Compd. 2024, 60, 566–568. [Google Scholar] [CrossRef] [Scilit]
  27. Xu, Z.; Yang, M.; Hu, D.; Ding, Q.; Fei, Y. Resource Situation, Research Status and Development Utilization Prospects of Machilus Nees Main Tree Species. J. Yangtze Univ. 2016, 13, 13–17. [Google Scholar] [CrossRef]
  28. Cheng, F.; Deng, Z.; Guo, Z.; Chen, J.; Zou, K. Machilusmarin, a New Neuroprotective Isocoumarin Dimer from the Stems of Machilus ichangensis Rehd. et Wils. Nat. Prod. Res. 2013, 27, 1542–1547. [Google Scholar] [CrossRef] [Scilit] [PubMed]
  29. Ma, C.J.; Kim, Y.C.; Sung, S.H. Compounds with Neuroprotective Activity from the Medicinal Plant Machilus thunbergii. J. Enzym. Inhib. Med. Chem. 2009, 24, 1117–1121. [Google Scholar] [CrossRef] [Scilit] [PubMed]
  30. Liu, M.; Lin, S.; Gan, M.; Chen, M.; Li, L.; Wang, S.; Zi, J.; Fan, X.; Liu, Y.; Si, Y.; et al. Yaoshanenolides A and B: New Spirolactones from the Bark of Machilus Yaoshansis. Org. Lett. 2012, 14, 1004–1007. [Google Scholar] [CrossRef] [Scilit] [PubMed]
  31. Jiangsu New Medical College. Dictionary of Traditional Chinese Medicine; Shanghai Scientific and Technical Publishers: Shanghai, China, 1977. [Google Scholar]
  32. Gan, M.; Liu, M.; Liu, B.; Lin, S.; Zhang, Y.; Zi, J.; Song, W.; Ye, F.; Chen, X.; Shi, J. Cucurbitane Glucosides from the Root of Machilus yaoshansis. J. Nat. Prod. 2011, 74, 2431–2437. [Google Scholar] [CrossRef] [Scilit] [PubMed]
  33. Yu, Y.U.; Kang, S.Y.; Park, H.Y.; Sung, S.H.; Lee, E.J.; Kim, S.Y.; Kim, Y.C. Antioxidant Lignans from Machilus thunbergii Protect CCl4-Injured Primary Cultures of Rat Hepatocytes. J. Pharm. Pharmacol. 2000, 52, 1163–1169. [Google Scholar] [CrossRef] [Scilit] [PubMed]
  34. Shen, N.; Wang, T.; Gan, Q.; Liu, S.; Wang, L.; Jin, B. Plant Flavonoids: Classification, Distribution, Biosynthesis, and Antioxidant Activity. Food Chem. 2022, 383, 132531. [Google Scholar] [CrossRef] [Scilit] [PubMed]
  35. Kusano, M.; Tohge, T.; Fukushima, A.; Kobayashi, M.; Hayashi, N.; Otsuki, H.; Kondou, Y.; Goto, H.; Kawashima, M.; Matsuda, F.; et al. Metabolomics Reveals Comprehensive Reprogramming Involving Two Independent Metabolic Responses of Arabidopsis to UV-B Light. Plant J. 2011, 67, 354–369. [Google Scholar] [CrossRef] [Scilit] [PubMed]
  36. Cui, Y.; Wu, Y.; Chen, X.; Gu, Y.; Yan, K. Effect of Different Treatments on Cuttage Rooting of Machilus nanmu. J. Sichuan For. Sci. Technol. 2023, 44, 134–138. [Google Scholar] [CrossRef]
  37. Zhang, X.; Xia, C.; Zhang, H.; Li, W.; Zhang, Z.; Long, N.; Yao, R.; Li, J.; Deng, H. Integrated Metabolomic and Transcriptomic Profiling Elucidates the Tissue-Specific Biosynthesis and Regulation of Flavonoids in Machilus nanmu. Front. Plant Sci. 2025, 16, 1731446. [Google Scholar] [CrossRef] [Scilit] [PubMed]
  38. Boria, R.A.; Olson, L.E.; Goodman, S.M.; Anderson, R.P. Spatial Filtering to Reduce Sampling Bias Can Improve the Performance of Ecological Niche Models. Ecol. Modell. 2014, 275, 73–77. [Google Scholar] [CrossRef] [Scilit]
  39. Van Proosdij, A.S.J.; Sosef, M.S.M.; Wieringa, J.J.; Raes, N. Minimum Required Number of Specimen Records to Develop Accurate Species Distribution Models. Ecography 2016, 39, 542–552. [Google Scholar] [CrossRef] [Scilit]
  40. Fick, S.E.; Hijmans, R.J. WorldClim 2: New 1-Km Spatial Resolution Climate Surfaces for Global Land Areas. Int. J. Climatol. 2017, 37, 4302–4315. [Google Scholar] [CrossRef] [Scilit]
  41. FAO. Harmonized World Soil Database Version 2.0; FAO: International Institute for Applied Systems Analysis (IIASA): Rome, Italy; Laxenburg, Austria, 2023; ISBN 978-92-5-137499-3. [Google Scholar]
  42. Beckmann, M.; Václavík, T.; Manceur, A.M.; Šprtová, L.; von Wehrden, H.; Welk, E.; Cord, A.F. GlUV: A Global UV-B Radiation Data Set for Macroecological Studies. Methods Ecol. Evol. 2014, 5, 372–383. [Google Scholar] [CrossRef] [Scilit]
  43. Tuanmu, M.-N.; Jetz, W. A Global, Remote Sensing-Based Characterization of Terrestrial Habitat Heterogeneity for Biodiversity and Ecosystem Modelling. Glob. Ecol. Biogeogr. 2015, 24, 1329–1339. [Google Scholar] [CrossRef] [Scilit]
  44. Zhang, T.; Cheng, C.; Wu, X. Mapping the Spatial Heterogeneity of Global Land Use and Land Cover from 2020 to 2100 at a 1 km Resolution. Sci. Data 2023, 10, 748. [Google Scholar] [CrossRef] [Scilit] [PubMed]
  45. Wang, X.; Meng, X.; Long, Y. Projecting 1 Km-Grid Population Distributions from 2020 to 2100 Globally under Shared Socioeconomic Pathways. Sci. Data 2022, 9, 563. [Google Scholar] [CrossRef] [Scilit] [PubMed]
  46. Zhu, D.P.; Yang, L.; Li, Y.; Huang, P.; Yao, B.; Kong, Z.; Xiang, Y. Predicting the Potential Distribution of the Endangered Pyrethrum tatsienense in China Using an Optimized Maxent Model under Climate Change Scenarios. Ecol. Evol. 2024, 14, e70503. [Google Scholar] [CrossRef] [Scilit] [PubMed]
  47. Wu, H.-Y.; Liu, Y.-H.; He, Q.-X.; Ye, J.-W.; Tian, B. Differential Distribution Shifts in Two Subregions of East Asian Subtropical Evergreen Broadleaved Forests—A Case of Magnoliaceae. Front. Plant Sci. 2024, 14, 1326207. [Google Scholar] [CrossRef] [Scilit] [PubMed]
  48. Hijmans, R.J.; Cameron, S.E.; Parra, J.L.; Jones, P.G.; Jarvis, A. Very High Resolution Interpolated Climate Surfaces for Global Land Areas. Int. J. Climatol. 2005, 25, 1965–1978. [Google Scholar] [CrossRef] [Scilit]
  49. Gu, C.; Tu, Y.; Liu, L.; Wei, B.; Zhang, Y.; Yu, H.; Wang, X.; Yangjin, Z.; Zhang, B.; Cui, B. Predicting the Potential Global Distribution of Ageratina adenophora under Current and Future Climate Change Scenarios. Ecol. Evol. 2021, 11, 12092–12113. [Google Scholar] [CrossRef] [Scilit] [PubMed]
  50. Phillips, S.J.; Anderson, R.P.; Schapire, R.E. Maximum Entropy Modeling of Species Geographic Distributions. Ecol. Modell. 2006, 190, 231–259. [Google Scholar] [CrossRef] [Scilit]
  51. Phillips, S.J.; Dudík, M. Modeling of Species Distributions with Maxent: New Extensions and a Comprehensive Evaluation. Ecography 2008, 31, 161–175. [Google Scholar] [CrossRef] [Scilit]
  52. Muscarella, R.; Galante, P.J.; Soley-Guardia, M.; Boria, R.A.; Kass, J.M.; Uriarte, M.; Anderson, R.P. ENMeval: An R Package for Conducting Spatially Independent Evaluations and Estimating Optimal Model Complexity for Maxent Ecological Niche Models. Methods Ecol. Evol. 2014, 5, 1198–1205. [Google Scholar] [CrossRef] [Scilit]
  53. Fawcett, T. An Introduction to ROC Analysis. Pattern Recognit. Lett. 2006, 27, 861–874. [Google Scholar] [CrossRef] [Scilit]
  54. Bellamy, C.; Altringham, J. Predicting Species Distributions Using Record Centre Data: Multi-Scale Modelling of Habitat Suitability for Bat Roosts. PLoS ONE 2015, 10, e0128440. [Google Scholar] [CrossRef] [Scilit] [PubMed]
  55. Brown, J.L. SDMtoolbox: A Python-Based GIS Toolkit for Landscape Genetic, Biogeographic and Species Distribution Model Analyses. Methods Ecol. Evol. 2014, 5, 694–700. [Google Scholar] [CrossRef] [Scilit]
  56. Graham, C.H.; Elith, J.; Hijmans, R.J.; Guisan, A.; Townsend Peterson, A.; Loiselle, B.A. The Nceas Predicting Species Distributions Working Group. The Influence of Spatial Errors in Species Occurrence Data Used in Distribution Models. J. Appl. Ecol. 2008, 45, 239–247. [Google Scholar] [CrossRef] [Scilit]
  57. Kramer-Schadt, S.; Niedballa, J.; Pilgrim, J.D.; Schröder, B.; Lindenborn, J.; Reinfelder, V.; Stillfried, M.; Heckmann, I.; Scharf, A.K.; Augeri, D.M.; et al. The Importance of Correcting for Sampling Bias in MaxEnt Species Distribution Models. Divers. Distrib. 2013, 19, 1366–1379. [Google Scholar] [CrossRef] [Scilit]
  58. Zhang, T.-T.; Jiang, X.; Yang, H.-R.; Jia, Y. Impacts of Climate Change on the Geographic Distribution of Dioscorea zingiberensis, a Traditional Medicinal Plant in China. Plants 2026, 15, 1444. [Google Scholar] [CrossRef] [Scilit] [PubMed]
  59. Yan, H.; He, J.; Xu, X.; Yao, X.; Wang, G.; Tang, L.; Feng, L.; Zou, L.; Gu, X.; Qu, Y.; et al. Prediction of Potentially Suitable Distributions of Codonopsis pilosula in China Based on an Optimized MaxEnt Model. Front. Ecol. Evol. 2021, 9, 773396. [Google Scholar] [CrossRef] [Scilit]
  60. Morales, N.S.; Fernández, I.C.; Baca-González, V. MaxEnt’s Parameter Configuration and Small Samples: Are We Paying Attention to Recommendations? A Systematic Review. PeerJ 2017, 5, e3093. [Google Scholar] [CrossRef] [Scilit] [PubMed]
  61. Warren, D.L.; Seifert, S.N. Ecological Niche Modeling in Maxent: The Importance of Model Complexity and the Performance of Model Selection Criteria. Ecol. Appl. 2011, 21, 335–342. [Google Scholar] [CrossRef] [Scilit] [PubMed]
  62. Li, Y.; Li, M.; Li, C.; Liu, Z. Optimized Maxent Model Predictions of Climate Change Impacts on the Suitable Distribution of Cunninghamia lanceolata in China. Forests 2020, 11, 302. [Google Scholar] [CrossRef] [Scilit]
  63. Li, L.; Chen, Y.; Wu, C.; Yao, L.; Wang, Z.; Li, T.; Ren, Q.; Jiao, J. Distribution Prediction and Main Environmental Variables Analysis of Machilus thunbergii in Zhejiang Province. J. Zhejiang For. Sci. Technol. 2024, 44, 9–15. [Google Scholar] [CrossRef]
  64. Zhao, L.; Zhou, Q.; Cao, S.; Liao, W.; Wu, J. Effects of Warming on the Seedling Adaptation and Growth of Machilus gamblei in a Subtropical Forest. Glob. Ecol. Conserv. 2024, 53, e03035. [Google Scholar] [CrossRef] [Scilit]
  65. Jiang, M. Key Points of Machilus Planting Technology in Eastern Guangxi. South China Agric. 2025, 19, 236–238. [Google Scholar] [CrossRef]
  66. Ye, K.; Bao, B.; Zhou, M.; Wang, D.; Luo, K.; Liang, S. Community Characteristics of Phoebe and Machilus Plants in Xishui National Nature Reserve, Guizhou. For. Sci. Technol. Commun. 2025, 12, 49–54. [Google Scholar] [CrossRef]
  67. Liao, R.Y.; Wu, X.Q.; Jin, C.; Huang, L.; Qian, S.H. Effect of Canopy Condition on Machilus nanmu Seedling Configuration and Biomass Allocation. Chin. J. Appl. Ecol. 2021, 32, 2061–2069. [Google Scholar] [CrossRef] [Scilit] [PubMed]
  68. Zuquim, G.; Costa, F.R.; Tuomisto, H.; Moulatlet, G.M.; Figueiredo, F.O. The Importance of Soils in Predicting the Future of Plant Habitat Suitability in a Tropical Forest. Plant Soil 2020, 450, 151–170. [Google Scholar] [CrossRef] [Scilit]
  69. Sakai, T.; Sugita, H.; Yone, Y.; Hiura, T. Instability on Steep Slopes Mediates Tree Species Co-Existence in a Warm–Temperate Mixed Forest. Plant Ecol. 2014, 215, 121–131. [Google Scholar] [CrossRef] [Scilit]
  70. Jiang, K.; Wang, Z.; Chen, X. Chloroplast Sequences and Nuclear Microsatellites Reveal Extensive Hybridization among Sympatric Species of the Genus Machilus. Guihaia 2025, 45, 555–566. [Google Scholar] [CrossRef]
  71. Wang, J.; Oliveira, B.F.; Moore, F.C.; Kozar, D.J.; Fu, Y.; Dong, X. Climate-Induced Range Shifts Support Local Plant Diversity but Don’t Reduce Extinction Risk. Science 2026, 392, 648–654. [Google Scholar] [CrossRef] [Scilit] [PubMed]
  72. Hu, W.; Wen, N.; Xiao, Y.; Zhong, R.; Ru, Z. Geographic Distribution and Potential Distribution Estimation of Machilus breviflora. Guangdong Agric. Sci. 2017, 44, 82–85. [Google Scholar] [CrossRef]
  73. Zhao, Z.; Zhang, W.; Shang, L.; Zeng, X.; Hu, D. Overwintering Performance of Four Machilus Species in Jingzhou City. Hubei Agric. Sci. 2024, 63, 105–110. [Google Scholar] [CrossRef]
  74. Shi, X.; Wang, J.; Zhang, L.; Chen, S.; Zhao, A.; Ning, X.; Fan, G.; Wu, N.; Zhang, L.; Wang, Z. Prediction of the Potentially Suitable Areas of Litsea cubeba in China Based on Future Climate Change Using the Optimized MaxEnt Model. Ecol. Indic. 2023, 148, 110093. [Google Scholar] [CrossRef] [Scilit]
  75. Sünnemann, M.; Beugnon, R.; Breitkreuz, C.; Buscot, F.; Cesarz, S.; Jones, A.; Lehmann, A.; Lochner, A.; Orgiazzi, A.; Reitz, T.; et al. Climate Change and Cropland Management Compromise Soil Integrity and Multifunctionality. Commun. Earth Environ. 2023, 4, 394. [Google Scholar] [CrossRef] [Scilit]
  76. Hirmas, D.R.; Giménez, D.; Nemes, A.; Kerry, R.; Brunsell, N.A.; Wilson, C.J. Climate-Induced Changes in Continental-Scale Soil Macroporosity May Intensify Water Cycle. Nature 2018, 561, 100–103. [Google Scholar] [CrossRef] [Scilit] [PubMed]
Figure 1. Distribution of valid occurrence records for M. nanmu used in MaxEnt modeling. Photo credit: Jianming Zhao.
Forests 17 01071 g001
Figure 2. The evaluation of the MaxEnt model accuracy, based on the receiver operating characteristic (ROC) curve, was derived from the average result of the cross-validation procedure conducted on the training dataset.
Forests 17 01071 g002
Figure 3. The contribution and importance of environmental factors to the growth and development of M. nanmu.
Forests 17 01071 g003
Figure 4. Jackknife test of importance environmental variables.
Forests 17 01071 g004
Figure 5. Current habitat-suitability distribution of M. nanmu in China predicted using the MaxEnt model. Suitability classes indicate unsuitable (0–0.2), marginally suitable (0.2–0.4), moderately suitable (0.4–0.6), and highly suitable (0.6–1.0) areas under current climatic conditions.
Forests 17 01071 g005
Figure 6. Projected habitat-suitability distribution of M. nanmu under future climate scenarios. Maps show the predicted spatial distribution of non-suitable, low-suitability, moderate-suitability, and high-suitability areas during different future periods under SSP126 and SSP245. bcc = BCC–CSM2–MR. Suitability classes indicate unsuitable (0–0.2), marginally suitable (0.2–0.4), moderately suitable (0.4–0.6), and highly suitable (0.6–1.0) areas under current climatic conditions.
Forests 17 01071 g006
Figure 7. Prediction of the potential suitable distribution area of M. nanmu under future climate scenarios. GCM abbreviations are defined as follows: bcc = BCC-CSM2-MR. Emission scenarios are denoted as ssp126 and ssp245, corresponding to the Shared Socioeconomic Pathway–Representative Concentration Pathway combinations SSP1–2.6 and SSP2–4.5, respectively. Suitability levels are classified as highly suitable (0.6–1.0), moderately suitable (0.4–0.6), and marginally suitable (0.2–0.4), with areas expressed in km2 for each class.
Forests 17 01071 g007
Figure 8. Spatial changes in the predicted suitable habitat of Machilus nanmu under different future climate scenarios. bcc = BCC–CSM2–MR. The maps show areas of habitat expansion, stability, and contraction between the current period and future periods under SSP126 and SSP245, based on MaxEnt habitat-suitability projections.
Forests 17 01071 g008
Figure 9. Centroids of the predicted potentially suitable area of M. nanmu. based on different climatic scenarios in the future.
Forests 17 01071 g009
Table 1. Shifts in the geometric center of the suitable habitat for Phoebe nanmu (M. nanmu) and migration distances between consecutive time slices under two SSP scenarios (SSP1–2.6 and SSP2–4.5) from the current period to the 2090s.
PeriodLongitude (°)Latitude (°)Migration DirectionDistance (km)
Current102.37396430.175396Current→2030ssp126252.08
2030s SSP1–2.699.76722230.0232262030ssp126→2050ssp12654.65
2050s SSP1–2.6100.33293530.047952050ssp126→2070ssp12652.04
2070s SSP1–2.699.81494229.9172592070ssp126→2090ssp126123.91
2090s SSP1–2.6101.09075830.044833//
Current102.37396430.175396Current→2030ssp24574.55
2030s SSP2–4.5101.6012830.1724072030ssp245→2050ssp24512.99
2050s SSP2–4.5101.61605930.2891162050ssp245→2070ssp245102.14
2070s SSP2–4.5100.65859729.8956762070ssp245→2090ssp24566.37
2090s SSP2–4.5101.34598129.917259//
Disclaimer/Publisher’s Note: The statements, opinions and data contained in all publications are solely those of the individual author(s) and contributor(s) and not of MDPI and/or the editor(s). MDPI and/or the editor(s) disclaim responsibility for any injury to people or property resulting from any ideas, methods, instructions or products referred to in the content.