Article

Ecofunctional Factors Associated with Resin Yield of Bursera bipinnata in Agroforestry Systems of Tropical Deciduous Forest


by
Selene del Carmen Arrazate-Jiménez
1,
Julio César Buendía-Espinoza
2,*,
Alejandro Lara-Bueno
3,
Joel Pérez-Nieto
1 and
Artemio Cruz-León
4,*
1
Posgrado en Agricultura Multifuncional para el Desarrollo Sostenible, Departamento de Fitotecnia, Universidad Autónoma Chapingo, Carretera México-Texcoco Km 38.5, Texcoco 56230, Estado de México, Mexico
2
Posgrado en Agroforestería para el Desarrollo Sostenible, Departamento de Suelos, Universidad Autónoma Chapingo, Carretera México-Texcoco Km 38.5, Texcoco 56230, Estado de México, Mexico
3
Posgrado en Producción Animal, Departamento de Zootecnia, Universidad Autónoma Chapingo, Carretera México-Texcoco Km 38.5, Texcoco 56230, Estado de México, Mexico
4
Posgrado en Desarrollo Rural Regional, Universidad Autónoma Chapingo, Carretera México-Texcoco Km 38.5, Texcoco 56230, Estado de México, Mexico
*
Authors to whom correspondence should be addressed.
Forests 2026, 17(9), 1070; https://doi.org/10.3390/f17091070
Submission received: 21 July 2026 / Revised: 2 September 2026 / Accepted: 2 September 2026 / Published: 7 September 2026
(This article belongs to the Special Issue Integrated Forestry Land Use Systems: Challenges and Benefits)

Abstract

The production of resin from Bursera bipinnata, a species native to the tropical deciduous forest (TDF), known as copal, represents a crucial source of income for rural Mexican communities. This study evaluated associations between ecofunctional gradients and resin yield using principal component analysis (PCA), hierarchical cluster analysis, and a multiple linear model. Ecological, edaphic, dendrometric, and management variables were evaluated in 27 trees established in agroforestry systems (AFS) in the municipality of Tepalcingo, Morelos, Mexico. Horn’s parallel analysis supported the retention of three principal components, which explained 63.66% of the total variance. The multiple linear model was significant ( F ( 5,21 ) = 3.23 ,   p = 0.0256 ;   R 2 = 0.435 ;   a d j u s t e d   R 2 = 0.300 ) . PC1 was positively associated with log-transformed resin yield ( β = 0.400 ,   p = 0.0245 ) and was characterized by negative loadings for total tree height (TH), total fungi (TF), soil organic matter (OM), actinobacteria (AC), available phosphorus (P), and total nitrogen (TOTN), and a positive loading for elevation (ALT). In contrast, PC3 was negatively associated with log-transformed resin yield ( β = 0.408 ,   p = 0.0269 ) and was characterized by negative loadings for soil bulk density (BD) and magnesium (MG), and a positive loading for soil moisture content (MC). Trees from site S 2 also showed lower log-transformed resin yield than those from the reference site S 1   ( β = 1.786 ,   p = 0.0067 ) , whereas no significant difference was detected between S 3 and S 1 . Although the clusters differed in their observed mean resin yield, these differences were not statistically significant. Overall, the findings indicate exploratory associations between resin yield and multivariate gradients integrating ecological, edaphic, dendrometric, and management attributes within the sampled trees and study sites.

1. Introduction

Copal is a resin of great cultural and economic value that has been used for ritual and religious purposes for thousands of years. Today, it is considered a non-timber forest product (NTFP) of great importance to many small farmers in rural communities across Mexico, where its harvesting provides a source of income and livelihood [1]. The term “copal” refers both to the resin and to various species of the genus Bursera (family Burseraceae). Mexico is the center of diversity for this genus, with more than 90 species distributed mainly in the Balsas River basin in the southern part of the country [2]. Among them are Bursera bipinnata (Sessé & Moc.) Engl. and Bursera copallifera (Sessé & Moc. Ex DC.) Bullock are the two species of greatest interest due to the quality and quantity of resin they produce, making them the most prized by collectors and traders [3].
These species thrive in the TDF, an ecosystem characterized by marked seasonal fluctuations in water availability, which causes most tree species to lose their foliage for approximately six months of the year. The TDF is found primarily along the Mexican Pacific coast, from southern Sonora and southwestern Chihuahua to southern Chiapas [2]. In addition to its presence in areas of natural vegetation, copal is a key component of traditional agroforestry systems, where it coexists with annual crops and other woody species [4]. In these regions, copal resin is not only a source of seasonal income, but also a central element of cultural and religious identity [5,6].
However, in various regions of Mexico—primarily in Morelos, Puebla, and Guerrero—copal harvesting is carried out without a forest management plan, which could jeopardize the production levels needed to meet the economic demands of the families engaged in this activity [5]. The lack of strategies that incorporate sustainable harvesting techniques and rest periods to allow for the trees’ physiological recovery jeopardizes the survival of these tree species within the ecosystem and limits the economic development of the communities that depend on this resource [3,7].
Among the ecological variables potentially associated with resin production, altitude and slope are particularly relevant because they integrate topographic and environmental conditions and contribute to environmental heterogeneity among trees and sites. Within the genus Bursera, slope has been associated with variation in the concentration of specific terpenoids, including o-cymene and γ-terpinene, in Bursera elongata resin [8]. These findings support the consideration of altitude and slope as ecological descriptors when examining multivariate patterns potentially associated with resin production in B. bipinnata, without assuming equivalent physiological mechanisms among resin-producing taxa.
Despite its importance, there is little research analyzing the factors associated with copal resin yield. While previous studies have reported associations between tree morphology [9,10] and soil fertility [2,11,12] exudate production, it is informative to investigate the factors that determine resin yield in greater depth. In this regard, identifying the ecofunctional factors—defined here as the integrated set of variables including site conditions, soil quality, tree dendrometry, and harvesting history—that are associated with the productive performance of copal trees is key to designing sustainable management strategies [10,13].
However, it is essential to accurately identify the key factors, especially for the species of interest, given that research on their utilization is still limited. In this regard, the objective of this study is to identify the ecofunctional relationships among ecological, edaphic, dendrometric, and management variables and their associations with the resin yield of B. bipinnata trees using PCA, hierarchical cluster analysis, and multiple linear modeling, with the aim of generating a scientific basis to support sustainable management and conservation for the species and the rural communities that depend on this resource. Accordingly, the study addressed the following research question: How is resin yield in B. bipinnata associated with multivariate ecofunctional gradients integrating ecological, edaphic, dendrometric, and management attributes within the sampled trees and study sites? Based on this framework, we hypothesized that resin yield in B. bipinnata would show significant associations with specific multivariate ecofunctional gradients integrating ecological, edaphic, dendrometric, and management attributes within the sampled trees and study sites.

2. Materials and Methods

2.1. Study Area

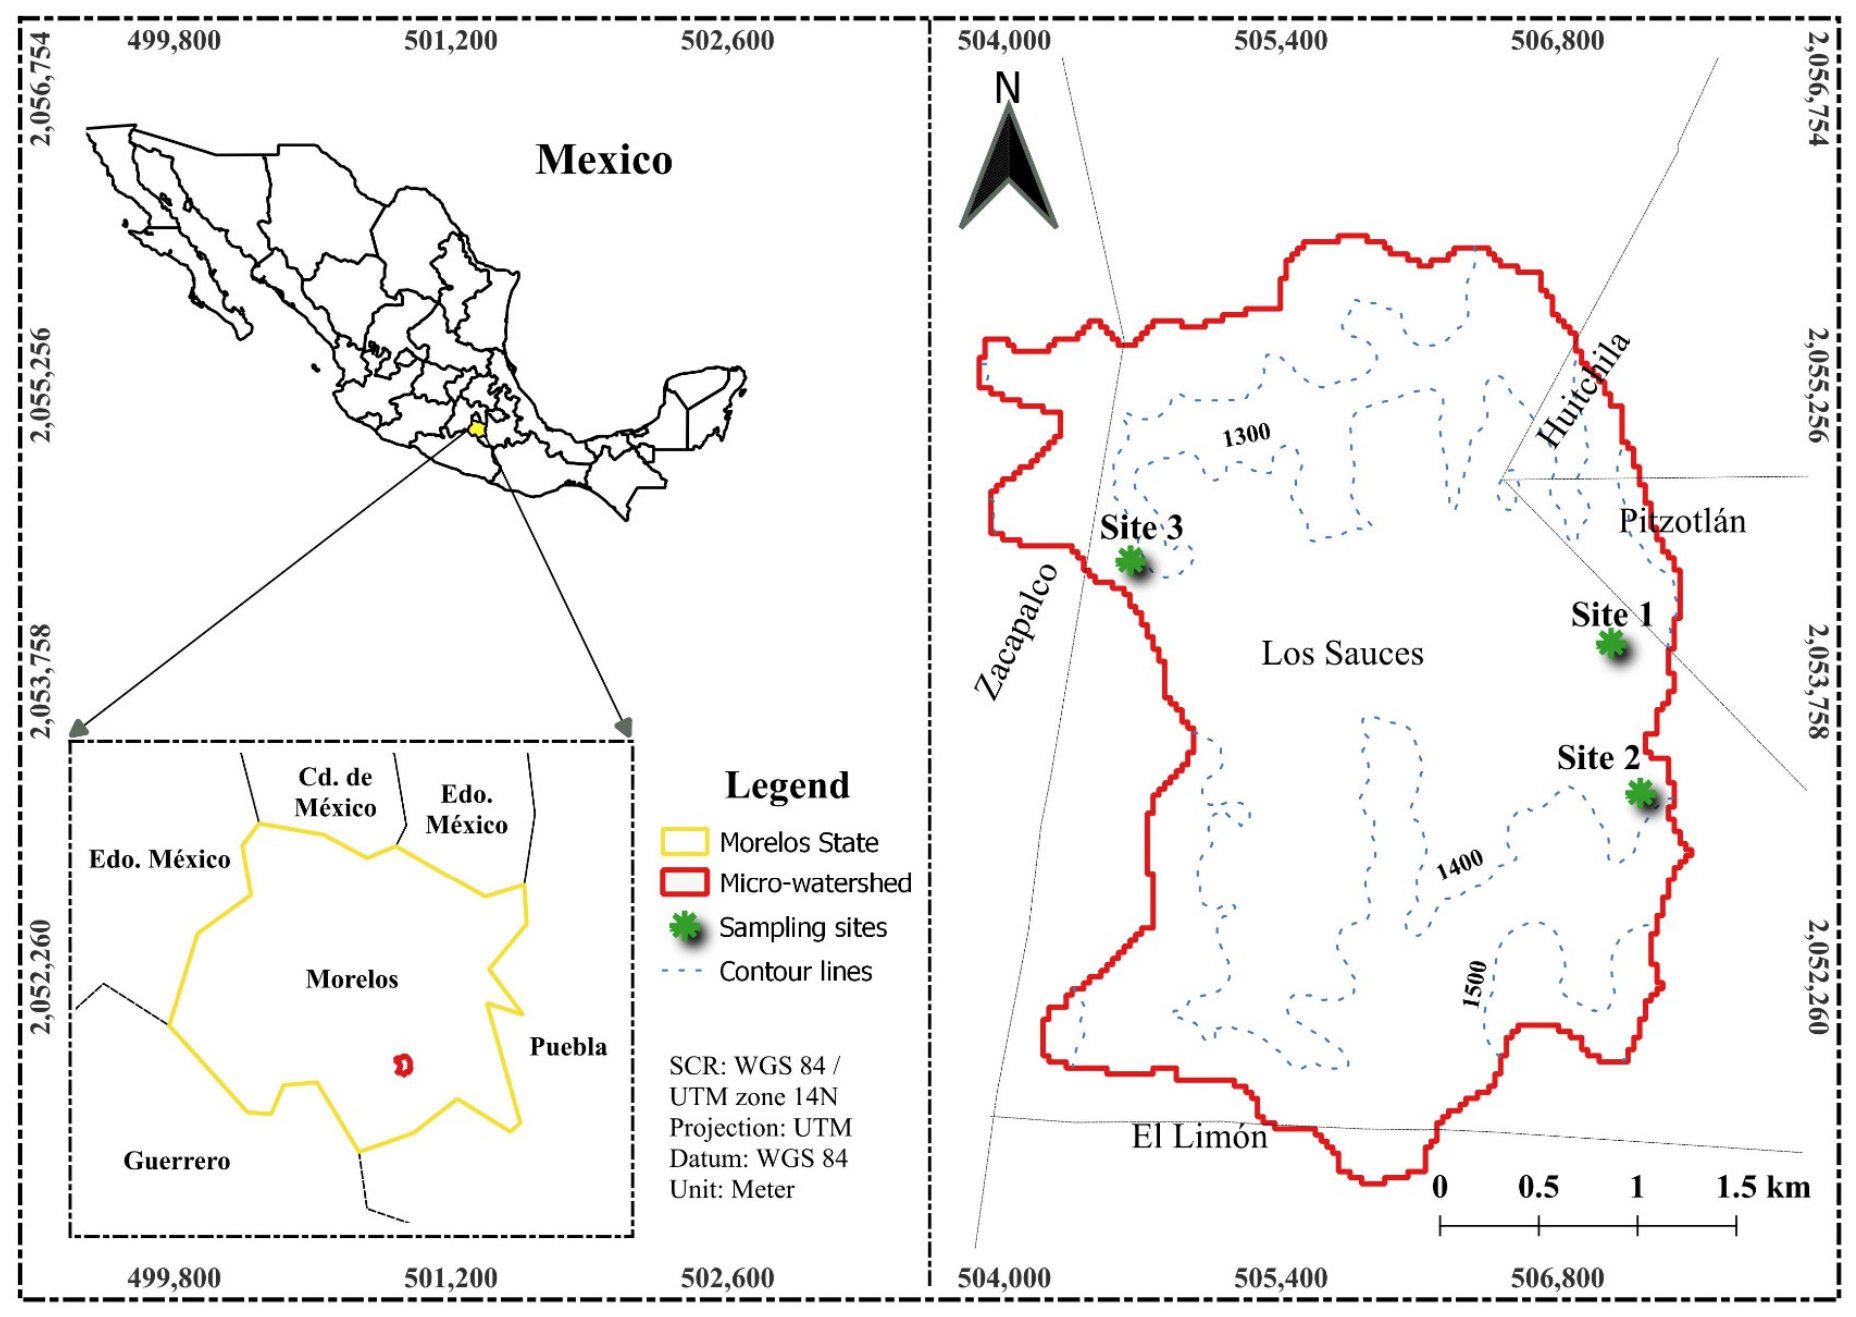
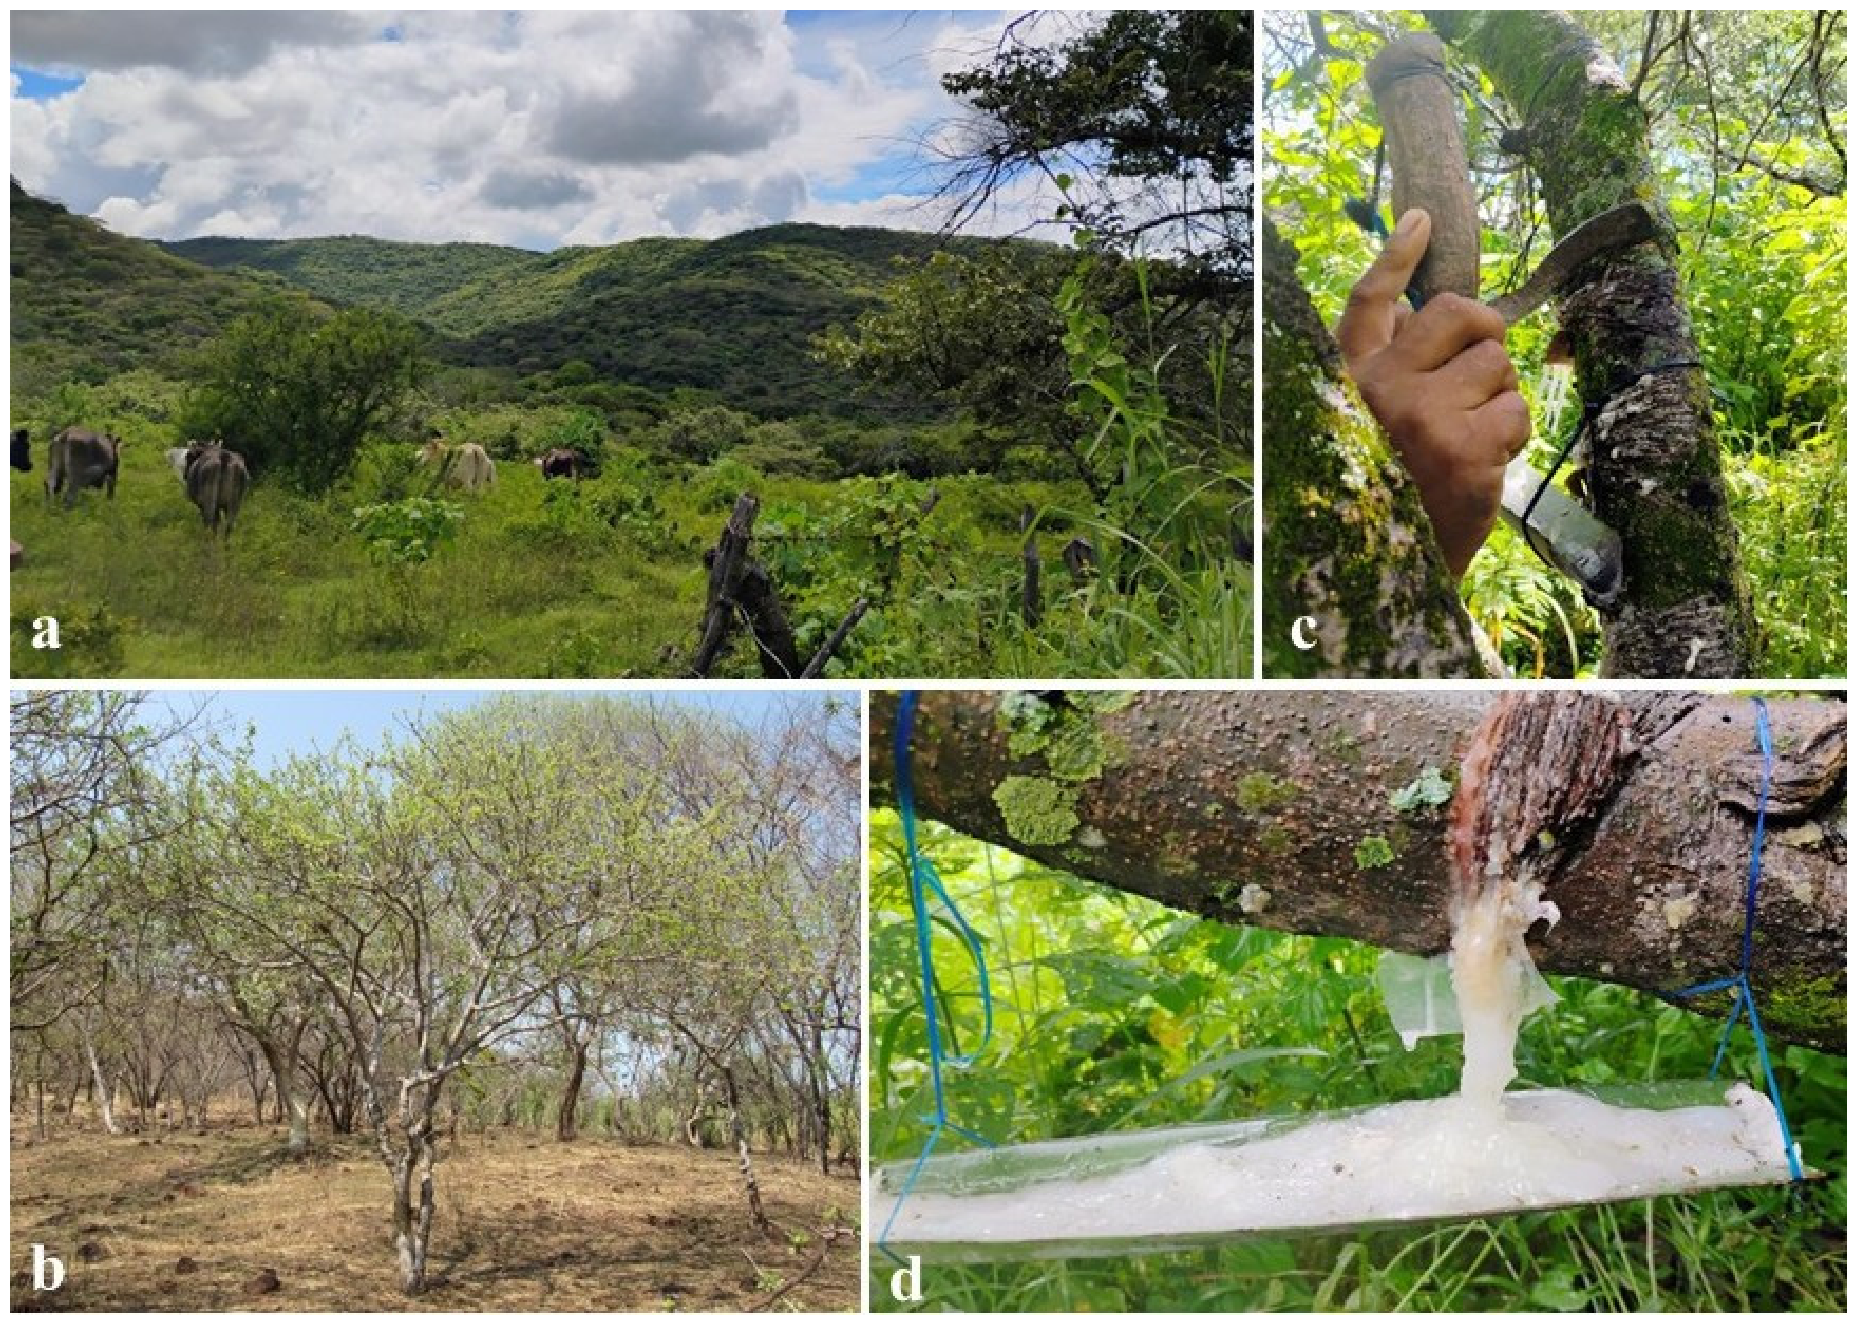
The study area is located in the Los Sauces micro-watershed, which is part of the Cuautla River sub-watershed and the Grande de Amacuzac River watershed in the state of Morelos, Mexico (Figure 1). This micro-watershed covers approximately 1142 ha, with an altitudinal range from 1219 to 1600 m a.s.l. It includes parts of the Los Sauces, Zacapalco, Huitchila, Pitzotlán, and El Limón ejidos, which belong to the municipality of Tepalcingo. The three sampling sites (Sites 1, 2, and 3) were located within the Los Sauces ejido and within the Los Sauces micro-watershed. Nine B. bipinnata trees were sampled at each site, for a total of 27 trees. The locations of the three sampling sites within the micro-watershed are shown in Figure 1. At the three sampling sites, the copal resin production system is classified as a silvopastoral system using scattered tree technology in pastures (Figure 2a) The predominant climate is (A)C(w1), classified as semi-warm subhumid with summer rainfall [14]. Annual precipitation ranges from 800 to 1000 mm, and the average annual temperature ranges from 22 to 26 °C. The predominant vegetation is TDF, characterized by its floral diversity and seasonal leaf loss during the dry season [2]. In addition to species of the genus Bursera, the TDF’s flora includes species such as Echinocactus platyacanthus, Acacia pennatula, Lonchocarpus caudatus, Bunchosia lanceolata, Ipomoea wolcottiana, and Mimosa benthami, among others [15]. In the Los Sauces ejido, copal harvesting is an ancestral practice that, in addition to meeting local needs, serves as a source of supplemental income for local families. It is estimated that this activity accounts for approximately 50 to 60 percent of producers’ annual income [5], highlighting its economic and social importance within the community.

2.2. Response Variable

Copal resin yield. This variable is a key indicator for assessing the productive and economic potential of copal harvesting in forest and agroforestry systems, especially in rural areas, where it represents a significant source of income for local communities [5,6]. Resin harvesting was conducted during a single harvesting season, from 1 August to 15 October, with tapping performed every third day. Yield was estimated by weighing the total resin collected from each tree at the end of the tapping and harvesting season (August–October) using the traditional method based on periodic incisions in the tree trunks and collection in small Agave spp. leaves [1]. This variable was coded as RENDRES and used as the main response variable to model the factors associated with copal resin productivity.

2.3. Explanatory Variables

The variables measured at the sampling site were ecological and edaphic, whereas the dendrometric and management variables were measured on the harvested trees (Table 1).

2.4. Dataset and Variable Measurement

2.4.1. Experimental Design and Tree Selection

At each of the three sampling sites, 15 candidate B. bipinnata trees were initially identified (Figure 2b), from which nine trees were selected (27 trees in total) following a direct sampling design based on three criteria: taxonomic classification, productive capacity evaluated through the local ecological knowledge and previous harvesting experience of copal collectors, who identified trees with a history of resin production; and phytosanitary condition, assessed through visual field inspection to select trees without evident signs of severe pest or disease damage [10,28]. The selected trees therefore represent actively harvested individuals meeting these predefined criteria rather than a probability sample of the B. bipinnata population. Consequently, the statistical inferences of this study are restricted to the sampled trees and study sites. Ecological, edaphic, dendrometric, and management variables, and resin-yield variables were recorded for each of the 27 sampled trees.

2.4.2. Ecological, Edaphic, Dendrometric, and Management Variables

The geographic coordinates of each tree were recorded using a Garmin GPS device (model GPSMAP 64x; Garmin International, Inc., Olathe, KS, USA). Ecological variables, such as elevation and slope, were determined using QGIS software (version 3.28.5) [29]. Soil variables were obtained from a composite soil sample taken from the drip line of each tree, with subsamples collected from four quadrants at a depth of 15 cm; these were homogenized to produce a 1 kg composite sample for fertility analysis. The following variables were measured: pH using a potentiometer at a soil-to-water ratio of 1:2; OM using the Walkley and Black method; N by diacid digestion and steam stripping; P using the Bray P-1 method; K by flame emission spectrophotometry after extraction with 1.0 N ammonium acetate (pH 7.0, 1:20 ratio); Ca and Mg by atomic absorption spectrophotometry after extraction with 1.0 N ammonium acetate (pH 7.0, 1:20 ratio); and CEC by steam distillation with 1.0 N ammonium acetate (pH 7.0) [30].
BD and soil moisture content were determined from samples collected on September 8 and 9, during the middle of the resin-harvesting season, using a double-cylinder auger (5 cm in diameter, 5 cm in height). Soil samples were stored in airtight containers, with the wet weight recorded, followed by drying in an oven at 105 °C for 48 h to determine the dry weight. BD was calculated using the following equation: B D = W d V , where Wd represents the dry soil weight and V is the known internal volume of the sampling cylinder (98.17 cm3). The soil moisture content was calculated using the following formula: θ g =   ( W m W c W d W c ) ( W d W c ) × 100 , where θ g is the gravimetric moisture content, Wd is the weight of the dry soil, Wm is the weight of the moist soil, and Wc is the weight of the container [31,32]. In addition, a second composite sample weighing 0.5 kg was collected for microbiological analysis of the soil; this sample was stored in a temperature-controlled cooler to preserve biological activity and was subsequently analyzed. The microbiological analysis of the soil included the quantification of CFU for total fungi, total bacteria, and actinobacteria. These soil samples were processed under aseptic conditions in a laminar flow hood, with 10 g of soil suspended in 90 mL of sterile distilled water for the first dilution, followed by serial dilutions (10−7). For each dilution, 0.1 mL was inoculated in triplicate onto selective media: nutrient agar (total bacteria), Czapeck agar with yeast extract (actinobacteria), and potato dextrose agar (total fungi). Incubation was carried out for 3 to 4 days for bacteria, 3 to 7 days for fungi, and 10 to 15 days for actinobacteria, after which the colonies were counted [33]. Colonies were quantified from plates containing 30–300 CFU, using countable dilutions of 10−6 for total bacteria, 10−4 for total fungi, and 10−5 for actinobacteria. The mean CFU value from the three replicate plates was calculated for each sample [33]. For the statistical analyses, the original mean CFU values were used without prior transformation.
The dendrometric and management variables evaluated were total tree height, stem diameter, number of primary branches, crown diameter, and years of harvesting [6,9]. The total height of the tree was measured using a Haga height meter, while the trunk diameter was recorded using a diameter tape (model 283D; Forestry Suppliers, Inc., Jackson, MS, USA) at a height of 1.30 m above ground. The number of primary branches was counted, and crown diameter was calculated as the average of two perpendicular measurements. The years of harvesting were determined based on information provided by local loggers.

2.4.3. Resin Yield

The response variable evaluated was resin yield, which was determined by weighing the resin obtained using the traditional extraction technique, which involves making incisions in the main stem or primary branches using a “quichala” or “quixala” (Figure 2c) and placing a maguey leaf (Agave spp.) to collect the exuded resin (Figure 2d). New incisions were made every three days, replacing the leaf each time it became full. This procedure was repeated throughout the harvesting season (1 August–15 October) [1,5,6]. At the end of the harvest season, the collected resin was weighed on a digital scale (model BASE-5EP; Truper, S.A. de C.V., Mexico City, Mexico). Although the interval between incisions and the harvesting period were common to the traditional procedure used, tree-level records of the total number and size of incisions, number of tapped branches, total number of collection events, and potential differences among collectors were not available. Therefore, resin yield was interpreted as the observed seasonal resin mass under the traditional harvesting conditions represented in this study, rather than as a fully standardized measure of intrinsic resin-production capacity.

2.5. Statistical Analysis

Descriptive statistics were calculated for all ecological, edaphic, dendrometric, and management variables considered in the study, including minimum and maximum values, mean, standard deviation, and coefficient of variation. Likewise, Pearson’s correlation matrix was calculated among the variables to identify linear associations between them and explore possible relationships prior to multivariate analysis [34]. To account for multiple comparisons, p-values were adjusted using the Benjamini–Hochberg false discovery rate (FDR) procedure. All statistical analyses were performed using R software version 4.2.3 [35].
To reduce the dimensionality of the dataset and summarize the main ecofunctional gradients associated with the evaluated variables, PCA was applied [34]. Prior to PCA, all variables were standardized using Z-score transformation, and the components were extracted from the Pearson correlation matrix by eigenvalue decomposition. Component scores for each tree were calculated from the standardized variables and the corresponding component coefficients and were subsequently used in the hierarchical cluster analysis and multiple linear model.
The suitability of the dataset for multivariate analysis was assessed using the Kaiser–Meyer–Olkin (KMO) measure of sample adequacy and Bartlett’s sphericity test [36,37]. Given the initial evidence of limited sampling adequacy, alternative subsets of variables were evaluated considering the overall KMO, individual measures of sampling adequacy (MSA), Bartlett’s test of sphericity, variable stability across candidate solutions, and ecofunctional representation. Because this data-driven variable-screening procedure may increase the apparent sampling adequacy of the retained variable set, the resulting PCA was treated as exploratory and interpreted cautiously. Given the limited sample size relative to the number of candidate variables, the case-to-variable ratio was low, which may have contributed to the marginal sampling adequacy and may limit the stability and generalizability of the PCA solution. Given the limited sample size (n = 27), component retention was additionally evaluated using Horn’s parallel analysis with 10,000 iterations. The stability of the retained PCA solution was further assessed by bootstrap resampling, evaluating the consistency of the main variable loadings across resampled datasets. These complementary procedures were used to assess the robustness of the multivariate structure under the available sample size. Principal components were extracted from the correlation matrix of the standardized variables. No rotation was applied, thereby preserving the orthogonality of the principal components. Component scores for each tree were calculated from the retained PCA solution and subsequently used in the hierarchical cluster analysis and multiple linear model. For interpretation, component loadings with absolute values ≥ |0.50| were considered [38]. The retained components were interpreted from the patterns of covariation among ecological, edaphic, dendrometric, and management variables.
To identify clusters of trees with similar ecofunctional profiles, an agglomerative hierarchical cluster analysis was performed based on the PC scores obtained from the PCA [39,40]. Euclidean distance was used as a measure of dissimilarity between observations, and Ward’s agglomerative clustering method (Ward.d2) was used as the merging criterion [39]. The number of clusters was evaluated using complementary criteria, including average silhouette width [41] and the Gap Statistic [42]. Because these criteria did not identify a consistent optimal partition, a three-cluster solution was additionally evaluated for exploratory purposes. The stability of this solution was subsequently assessed using bootstrap resampling (2000 replicates), with cluster reproducibility quantified through mean Jaccard similarity coefficients [43]. Resin yield differences among the resulting exploratory groups were evaluated using the nonparametric Kruskal–Wallis test.
To evaluate the association between the retained multivariate gradients and resin yield, a multiple linear model was fitted. Because resin yield showed a strongly right-skewed distribution and included a zero value, the response variable was transformed as l o g ( 1 + r e s i n   y i e l d ) , where y represents resin yield, prior to model fitting. The retained principal component scores (PC1, PC2, and PC3) were included as continuous predictors [34]. Sampling site was included as a categorical fixed effect, with S1 used as the reference level. The model was specified as:
l o g 1 + r e s i n   y i e d l = β 0 + β 1 P C 1 + β 2 P C 2 + β 3 P C 3 + β 4 S 2 + β 5 S 3 + ε
where β 0 represents the intercept; β 1 , β 2 and β 3 are the regression coefficients associated with P C 1 , P C 2 , and P C 3 , respectively; P C 1 P C 3 represent the retained multivariate gradients derived from the PCA; β 4 and β 5 represent the site effects for S 2 and S 3 relative to the reference site S1, respectively; and ε represents the residual error term. Model adequacy was evaluated through residual diagnostics, including assessment of residual normality, homoscedasticity, and influential observations. Model performance was summarized using R2, adjusted R2, the overall F-test, regression coefficients, standard errors, and 95% confidence intervals. Statistical significance was evaluated at α = 0.05 . The linear model and its diagnostic analyses were performed in R version 4.2.3 [35].

3. Results

3.1. Dataset and Variable Selection

A total of 27 individuals of B. bipinnata were assessed at three sites with silvopastoral systems, and the geographic coordinates of each site, two ecological variables, 13 edaphic variables, four dendrometric characteristics, one management variable, and the resin yield variable were recorded.
The altitude of the sites had an average value of 1342.56 ± 21.50 m a.s.l. and a low coefficient of variation (CV = 1.60%), indicating relatively homogeneous altitudinal conditions. In contrast, slope had a mean of 20.48 ± 6.06% with a CV of 29.59%, reflecting a variable topography that may influence species distribution and the microclimate (Table 2).
The mean values of the soil variables are presented in Table 3. The average soil pH was 6.70 ± 0.40, classified as neutral, although close to the threshold for moderately acidic soils [30]. The BD was 0.96 ± 0.15 g cm−3, characteristic of organic soils or those with volcanic influence. The organic matter (OM) content was 8.62 ± 2.65%. The nitrogen (N) content was 0.38 ± 0.09%. The phosphorus (P) content was 16.07 ± 17.59 mg kg−1, classified as medium to high. K was 1.10 ± 0.44 cmol(+) kg−1, Ca 26.37 ± 6.37 cmol(+) kg−1, and Mg 12.09 ± 3.58 cmol(+) kg−1; this trio showed medium to high concentrations, indicating good cation availability in the soil. The CEC was 43.57 ± 8.31 cmol(+) kg−1, classified as high. The moisture content was 38.95 ± 14.49%. Total bacteria were 25.05 × 10⁶ ± 16.12 × 10⁶ CFU g −1 soil, total fungi 0.23 × 10⁶ ± 0.14 × 10⁶ CFU g−1 soil, and actinobacteria 1.98 × 10⁶ ± 1.33 × 10⁶ CFU g−1 soil, with coefficients of variation exceeding 50%, indicating a heterogeneous distribution in the soil.
Regarding the dendrometric and management characteristics of the evaluated trees, the average height of the sampled trees was 5.02 ± 1.03 m, with a CV of 20.49%, indicating a homogeneous vertical structure. The average main diameter was 18.48 ± 5.52 cm, with moderate variability (CV = 29.85%), suggesting differences in individual tree development. The average number of primary branches was 2.19 ± 0.74 branches, with moderate variability (CV = 33.67%); this pattern could be associated with management practices or variations in local soil conditions that influence tree architecture. Meanwhile, the average crown diameter was 4.97 ± 1.08 m, with low variability (CV = 21.69%), reflecting a homogeneous crown architecture among the evaluated individuals. The years in which the trees were harvested showed a mean of 12.52 ± 7.42 years, with high variability (CV = 59.26%). This indicates marked heterogeneity in the trees’ management history (Table 4).
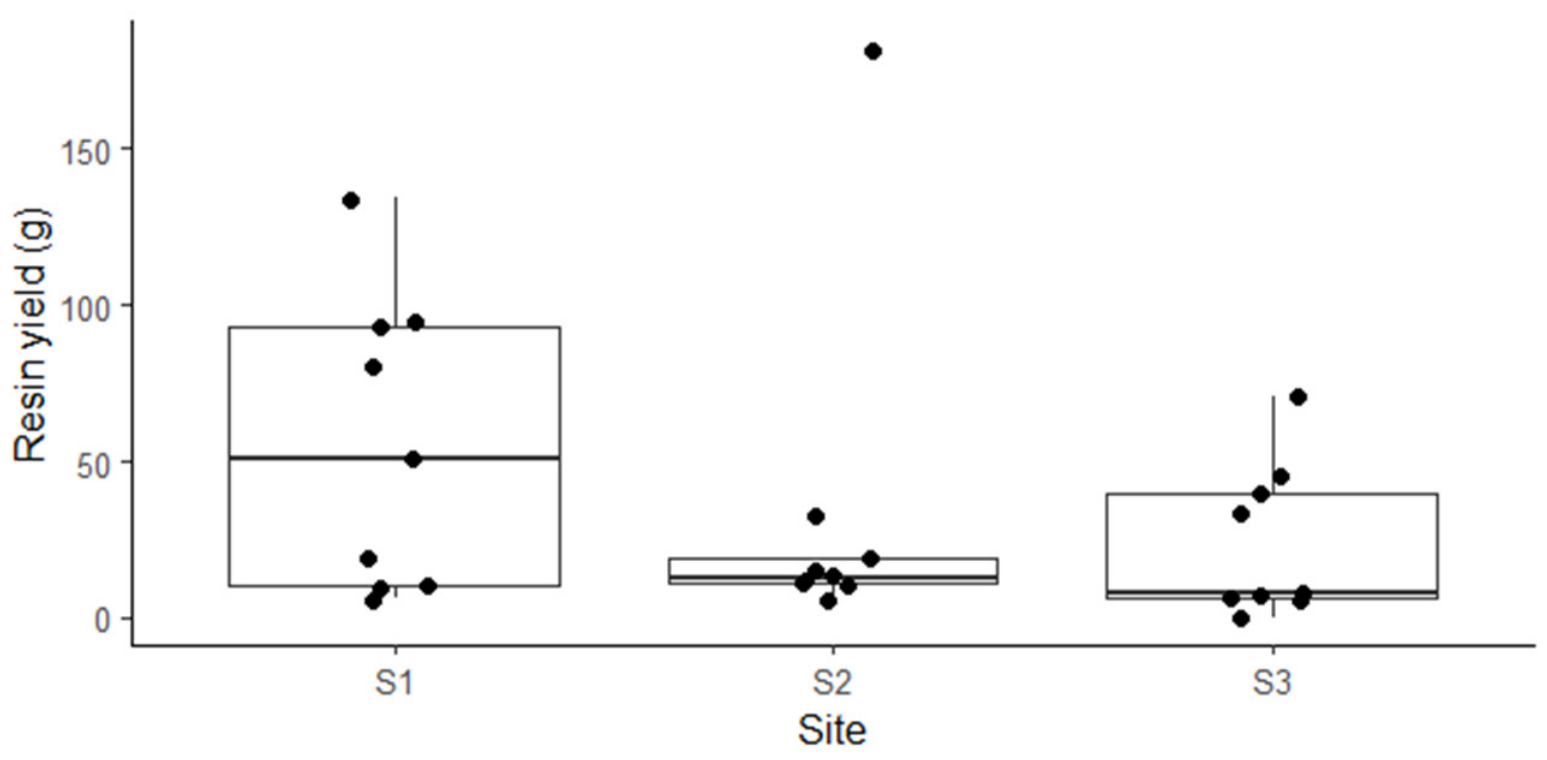
The average copal resin yield for B. bipinnata was 37.56 ± 44.76 g, with high variability (CV = 119.19%). The minimum yield was 0 g and the maximum was 181 g (Table 5). Individual observations showed substantial variability in resin yield among the sampled trees (Figure 3). The raw resin-yield distribution was markedly right-skewed and included one zero-yield observation (1 of 27 trees; 3.7%). Given the occurrence of only one zero observation, the distribution was not considered substantially zero-inflated.

3.2. Correlation Analysis

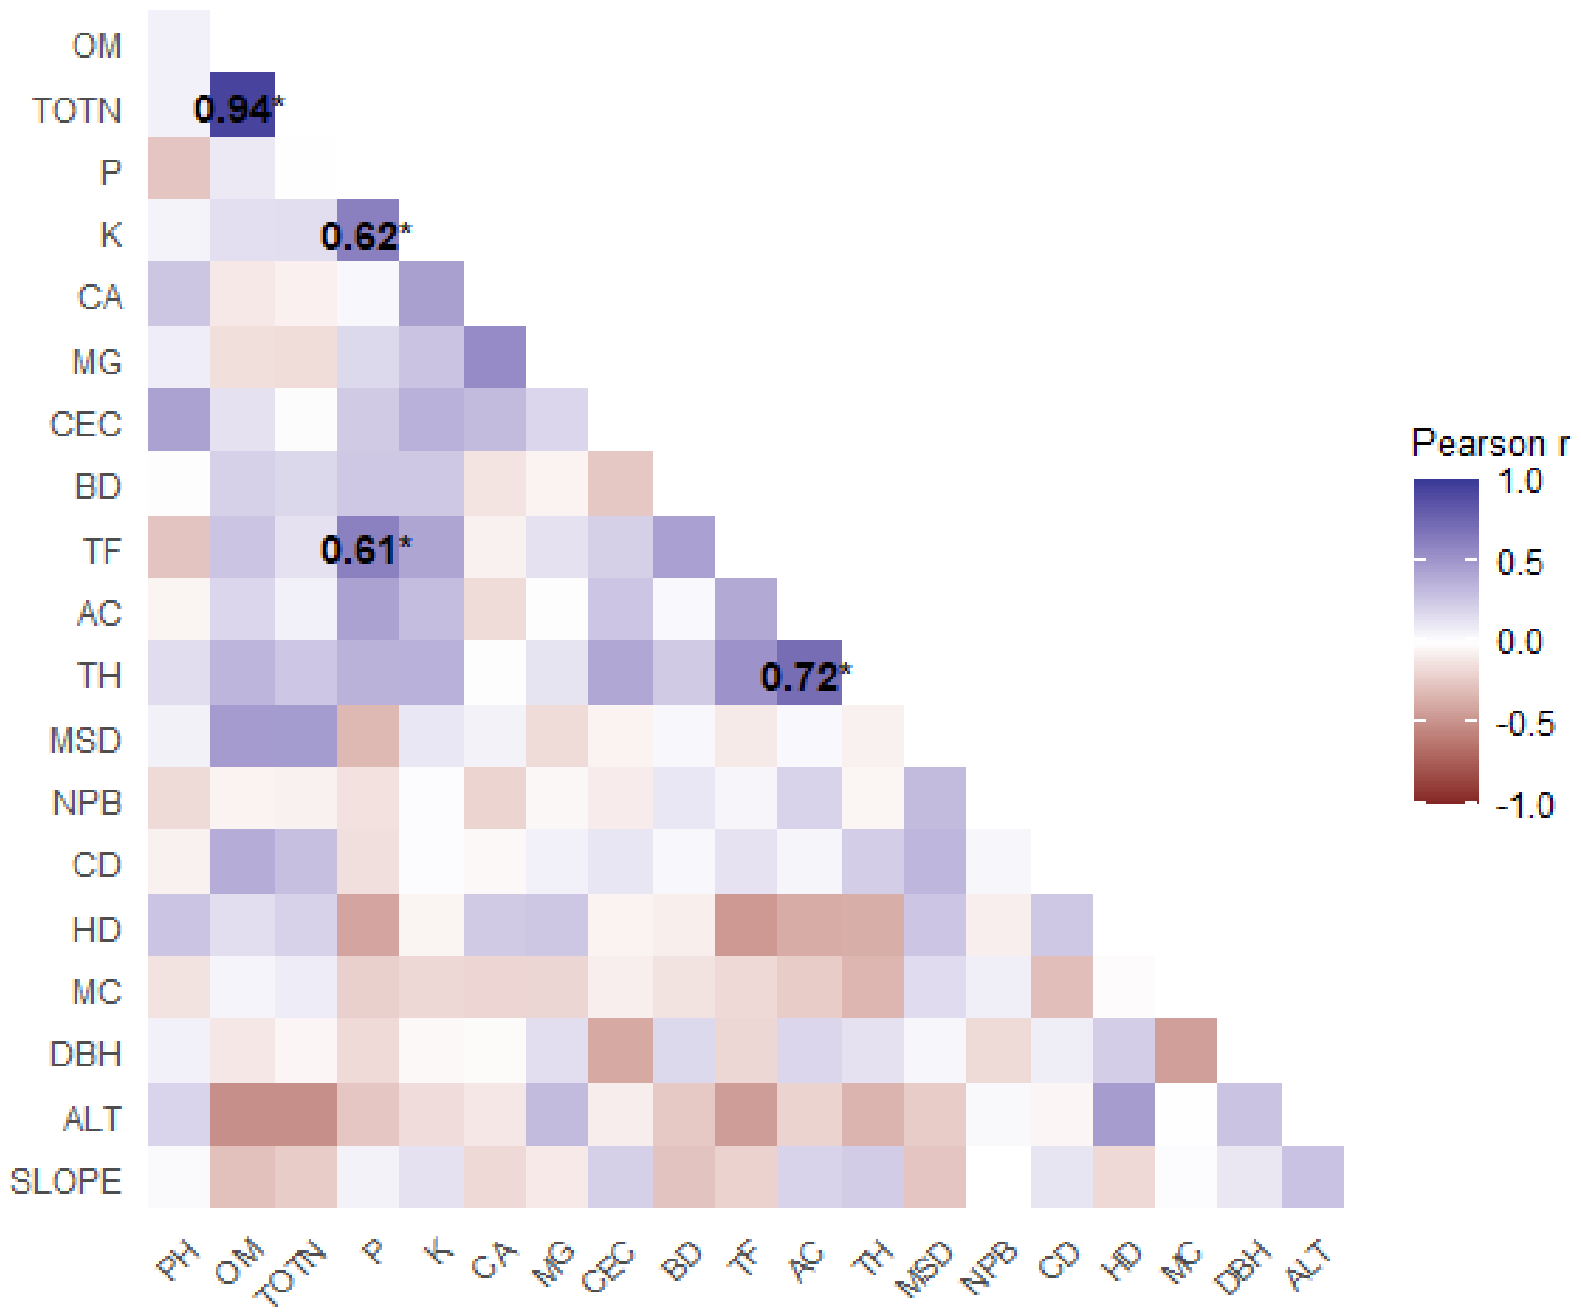
The Pearson correlation analysis revealed several associations among the evaluated variables; however, after controlling for multiple comparisons using the Benjamini–Hochberg false discovery rate (FDR) procedure [44], only four correlations remained statistically significant. The strongest association was observed between organic matter (OM) and total nitrogen (N) (r = 0.941, 95% CI: 0.873–0.973, adjusted p < 0.001). Actinobacteria abundance was positively correlated with total tree height (r = 0.719, 95% CI: 0.466–0.863, adjusted p = 0.0023). Soil phosphorus (P) was positively associated with potassium (K) (r = 0.622, 95% CI: 0.317–0.811, adjusted p = 0.0336) and fungal abundance (r = 0.609, 95% CI: 0.299–0.803, adjusted p = 0.0351). Although additional pairwise correlations were significant at the nominal level (p < 0.05), they did not remain significant after FDR correction and were therefore interpreted cautiously. The overall correlation structure and the associations that remained statistically significant after FDR correction are shown in Figure 4.

3.3. Sampling Adequacy Diagnostics for Principal Component Analysis

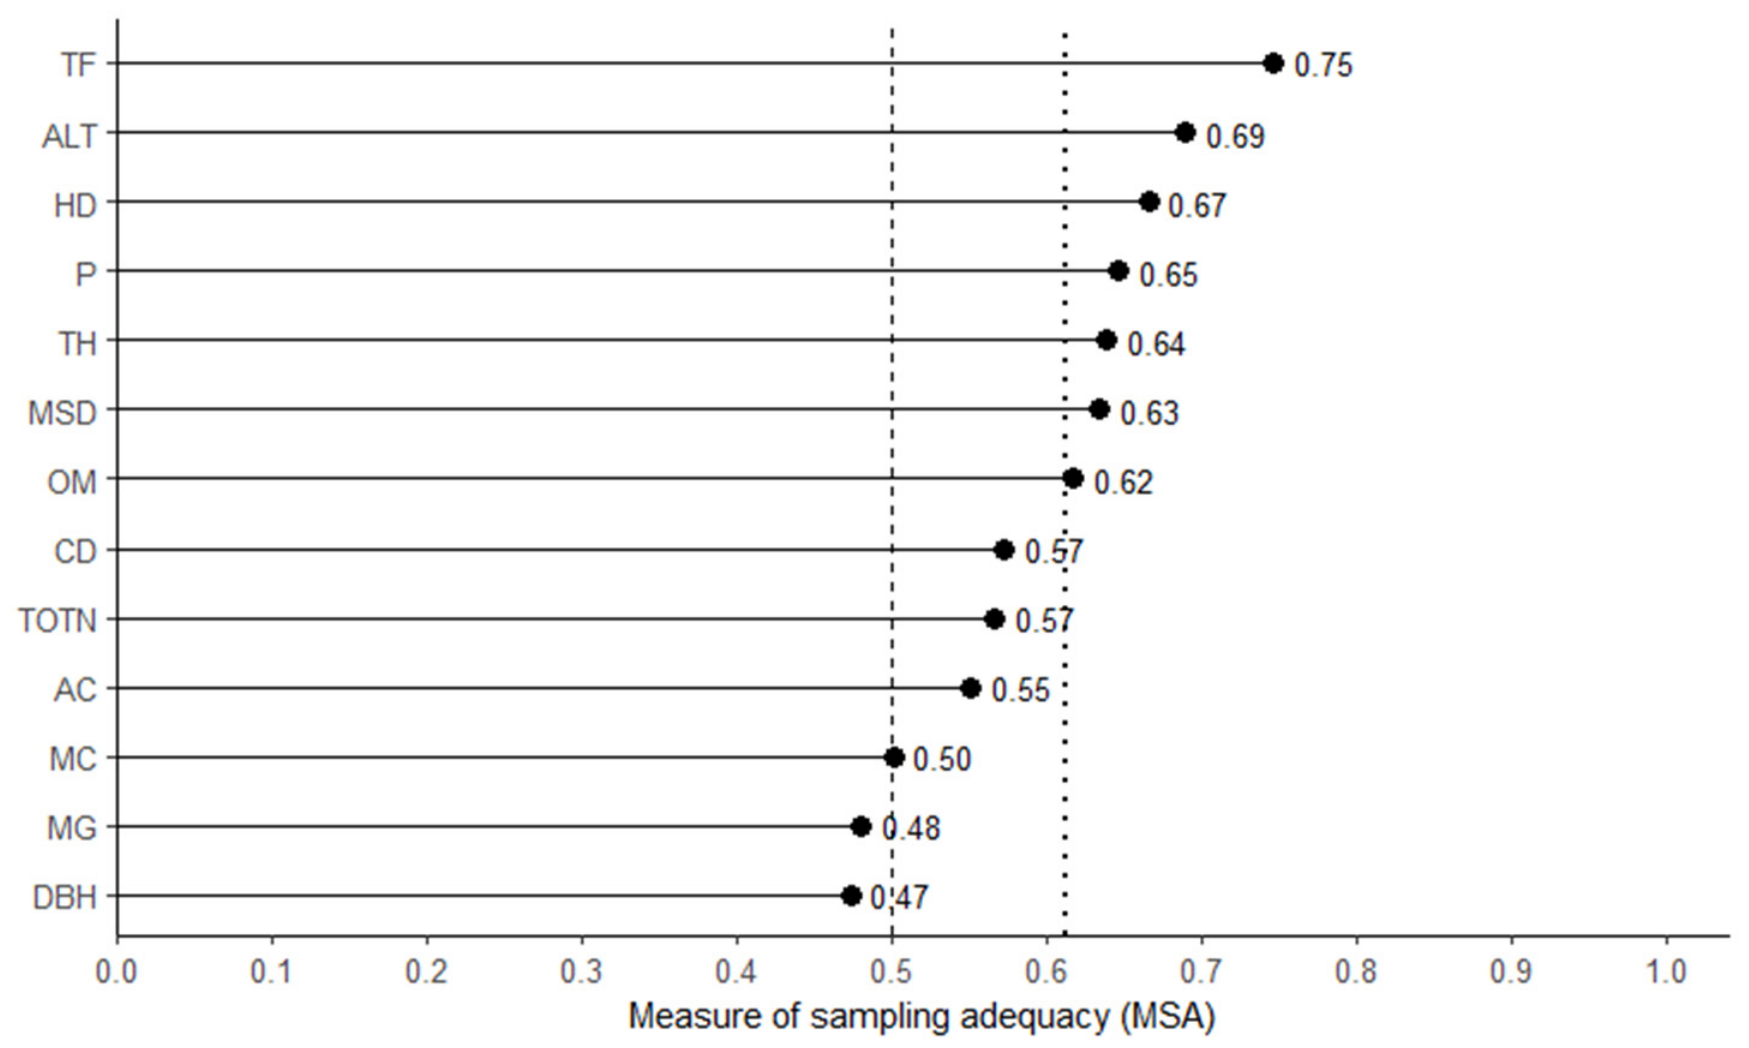
The initial Kaiser–Meyer–Olkin (KMO = 0.342) analysis indicated limited sampling adequacy for the complete set of variables. Therefore, alternative subsets of variables were evaluated considering the overall KMO, mean and minimum individual measures of sampling adequacy (MSA), Bartlett’s test of sphericity, variable stability across candidate solutions, and ecofunctional representation. The final solution retained 13 variables and yielded an overall KMO to 0.612, with a mean individual MSA of 0.598. Although two retained variables showed individual MSA values slightly below 0.50 ( D B H = 0.473 and M g = 0.480 ), they were maintained based on the combined statistical and ecofunctional criteria used to define the final multivariate solution. Bartlett’s test of sphericity was significant ( p < 0.0001 ), supporting sufficient correlation structure among the retained variables for subsequent exploratory PCA. Individual MSA values for the variables retained in the final solution are shown in Figure 5.

3.4. Principal Component Analysis (PCA)

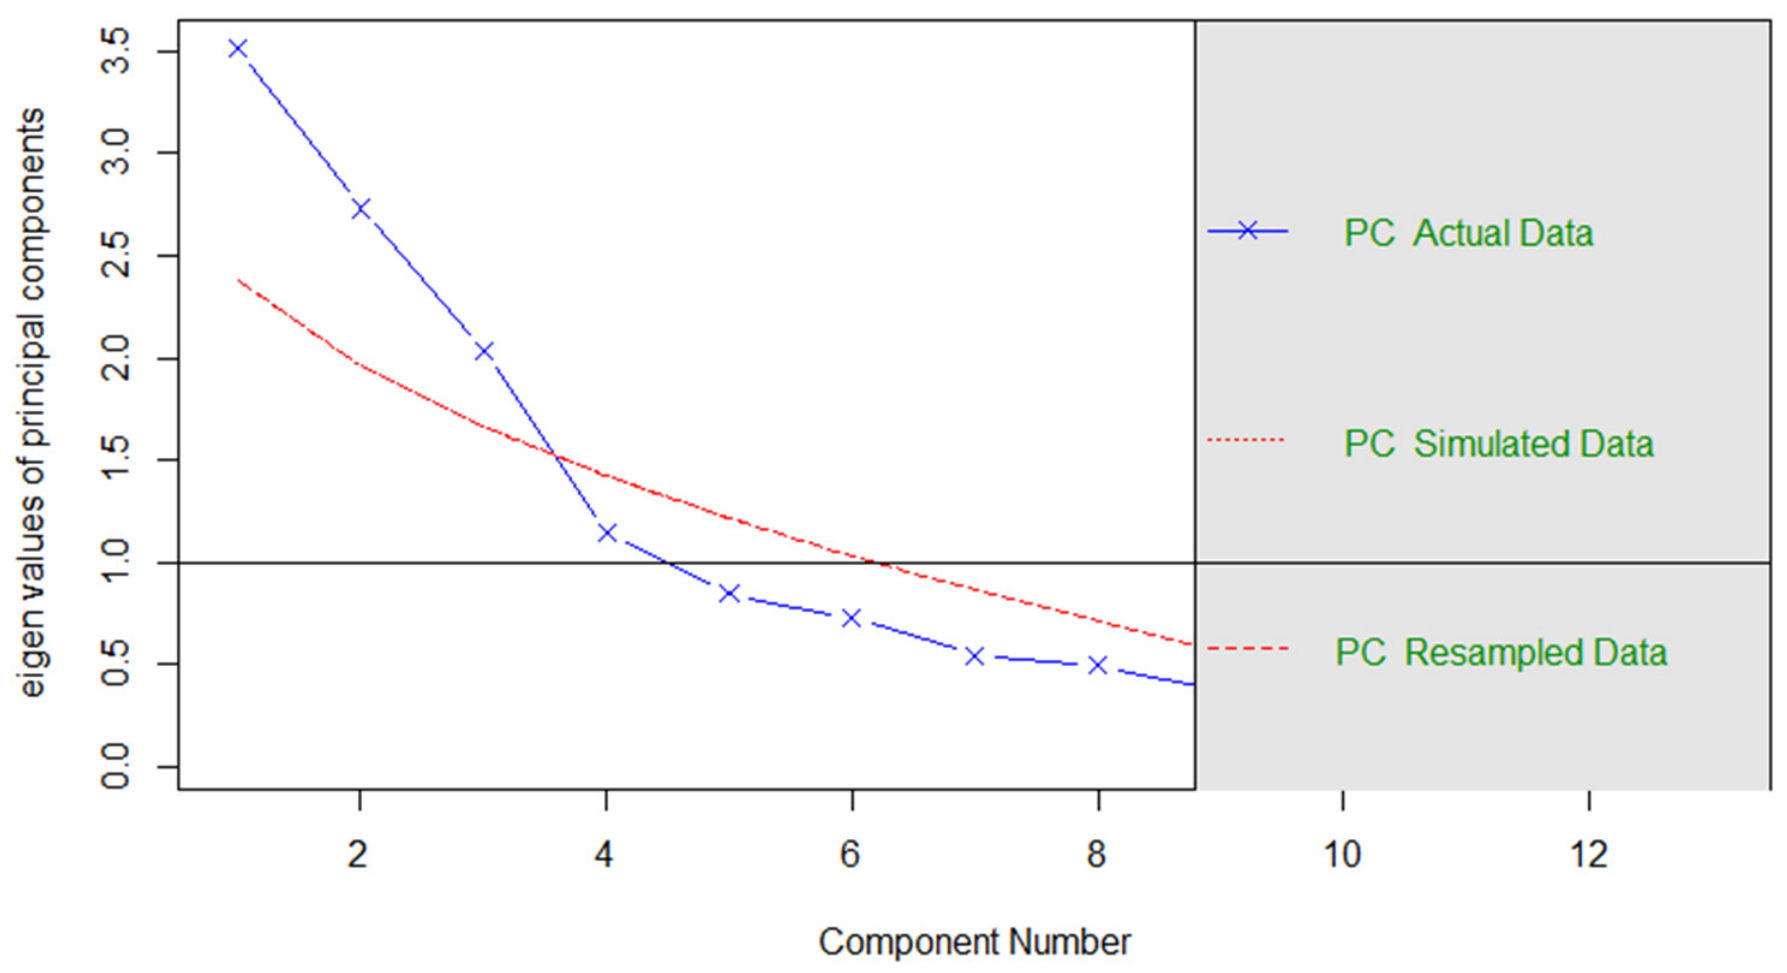
Figure 6 shows the distribution of eigenvalues and the variance explained by each principal component derived from the analysis. Horn’s parallel analysis [45] supported the retention of three principal components. Together, these components explained 63.66% of the total variance. PC1 had an eigenvalue of 3.510 and explained 27.00% of the variance, PC2 had an eigenvalue of 2.731 and explained 21.01%, and PC3 had an eigenvalue of 2.035 and explained 15.65%. This three-component solution was therefore retained for subsequent analyses and interpretation.
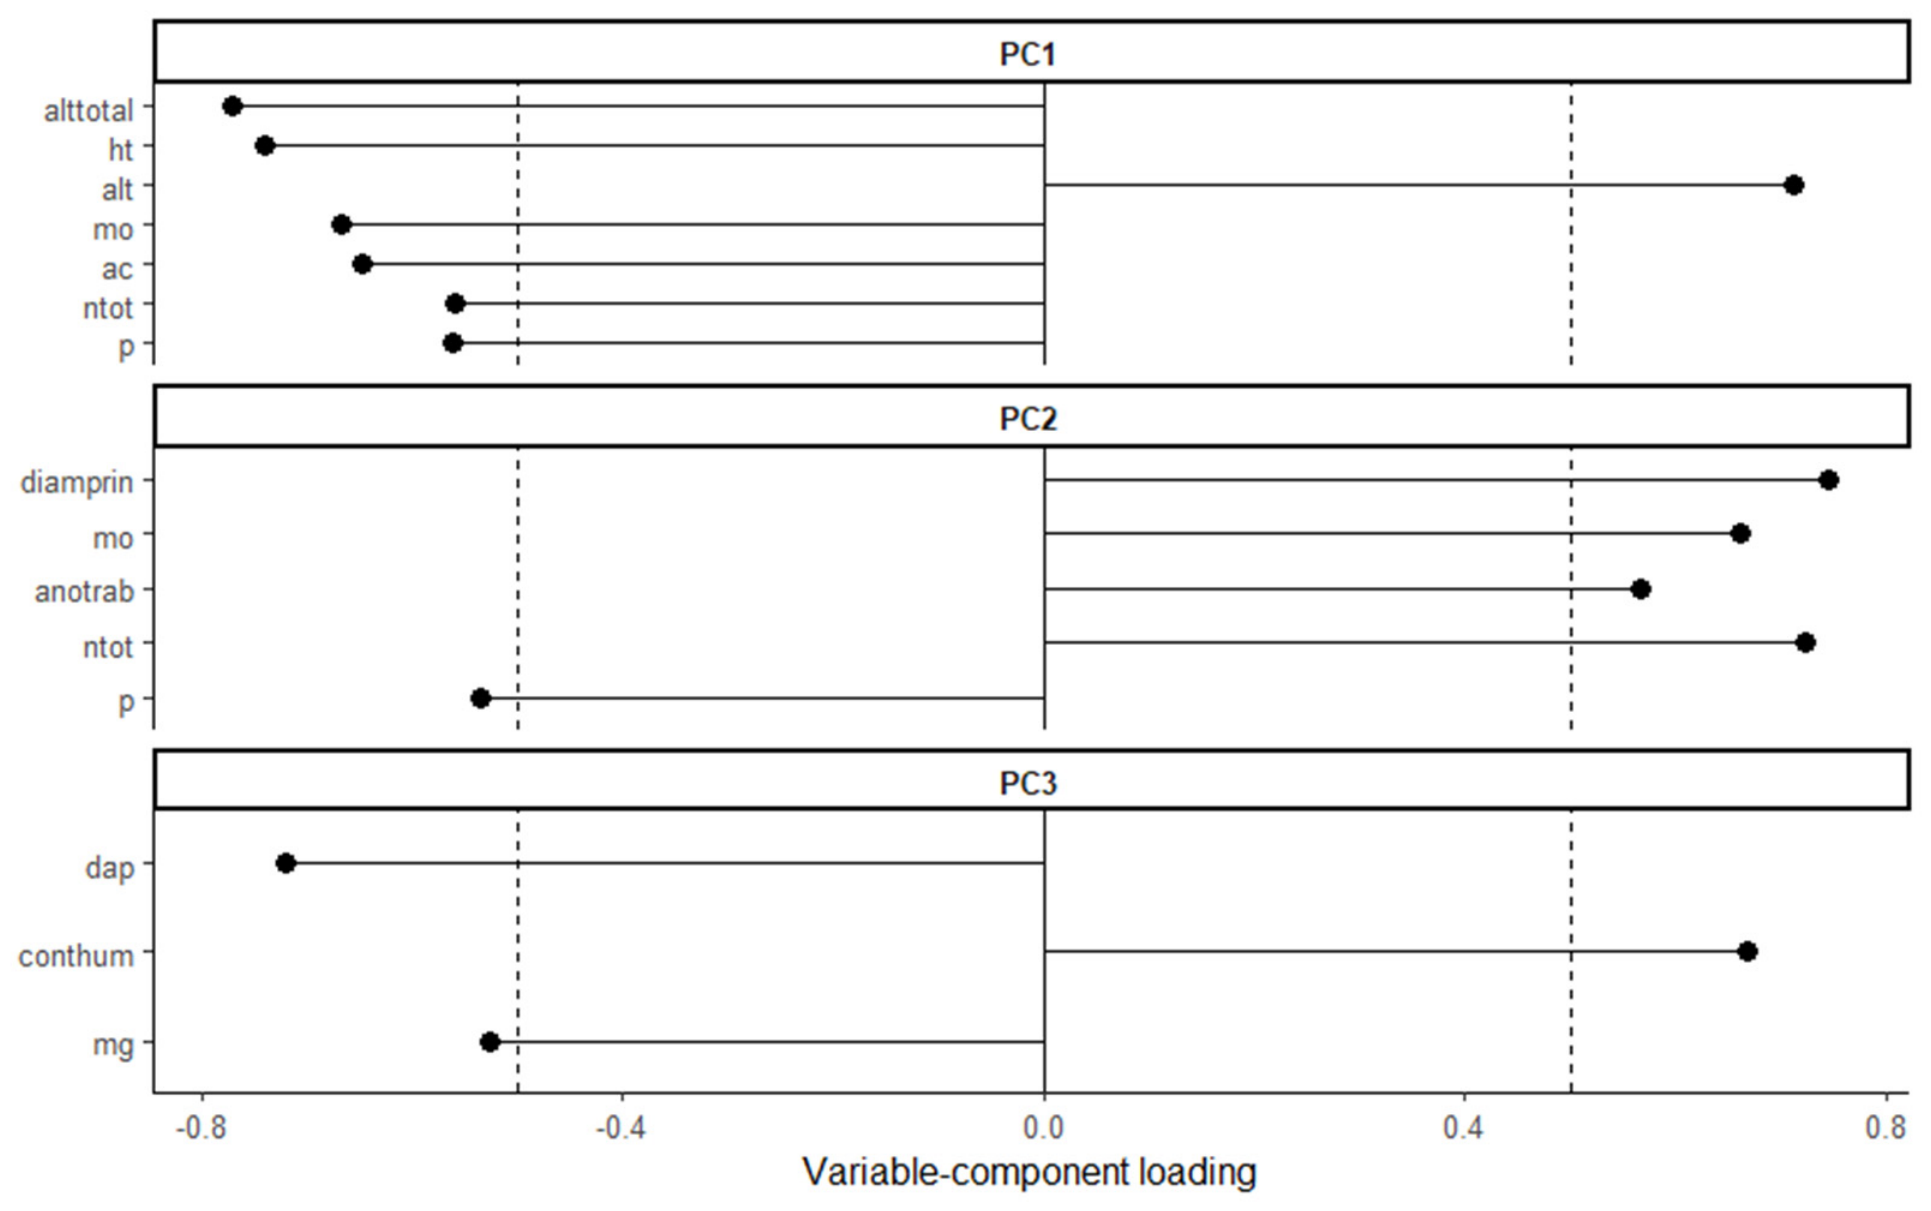
Figure 7 shows the resulting factor loadings after applying a direct oblique rotation to the PCA, with Kaiser normalization. To interpret the components, only those variables with factor loadings equal to or greater than |0.50| were selected. This threshold represents a substantial contribution to the explained variance [38,46].
The first principal component (PC1) explained 27.00% of the total variance and was characterized by high loadings for total tree height (−0.771), HT (−0.739), elevation (0.712), organic matter (−0.666), AC (−0.647), available P (−0.562), and total N (−0.560). This component represents a multivariate gradient integrating ecological, edaphic, and tree structural attributes. The opposite signs of elevation and the remaining variables indicate contrasting positions along this gradient and should be interpreted as patterns of covariation rather than causal relationships.
The second component (PC2) explained 21.01% of the total variance and was characterized by high positive loadings for main stem diameter (0.746), total N (0.723), organic matter (0.663), and tapping years (0.568), together with a negative loading for available P (−0.535). This component represents a multivariate gradient integrating tree size, soil organic fertility, and harvesting history, with available P varying in the opposite direction along the component.
The third component (PC3) explained 15.65% of the total variance and was characterized by a negative loading for bulk density (−0.720), a positive loading for soil moisture (0.668), and a negative loading for Mg (−0.527). This component represents a soil physical–water gradient in which soil moisture varies in the opposite direction to bulk density and Mg along the component.
Given the limited sample size, the stability of the retained PCA structure was additionally evaluated using 2000 bootstrap resamples. The analysis showed that several of the main variable–component loadings maintained consistent direction and magnitude across resamples, although stability varied among variables. Accordingly, the retained PCA solution was interpreted as an exploratory representation of the multivariate structure rather than as a confirmatory solution.
Collectively, the three retained principal components summarized 63.66% of the multivariate variation among the sampled trees. The scores of PC1–PC3 were subsequently used as input variables for hierarchical cluster analysis and the multiple linear model to evaluate their associations with resin yield.

3.5. Hierarchical Clustering and Multiple Linear Model

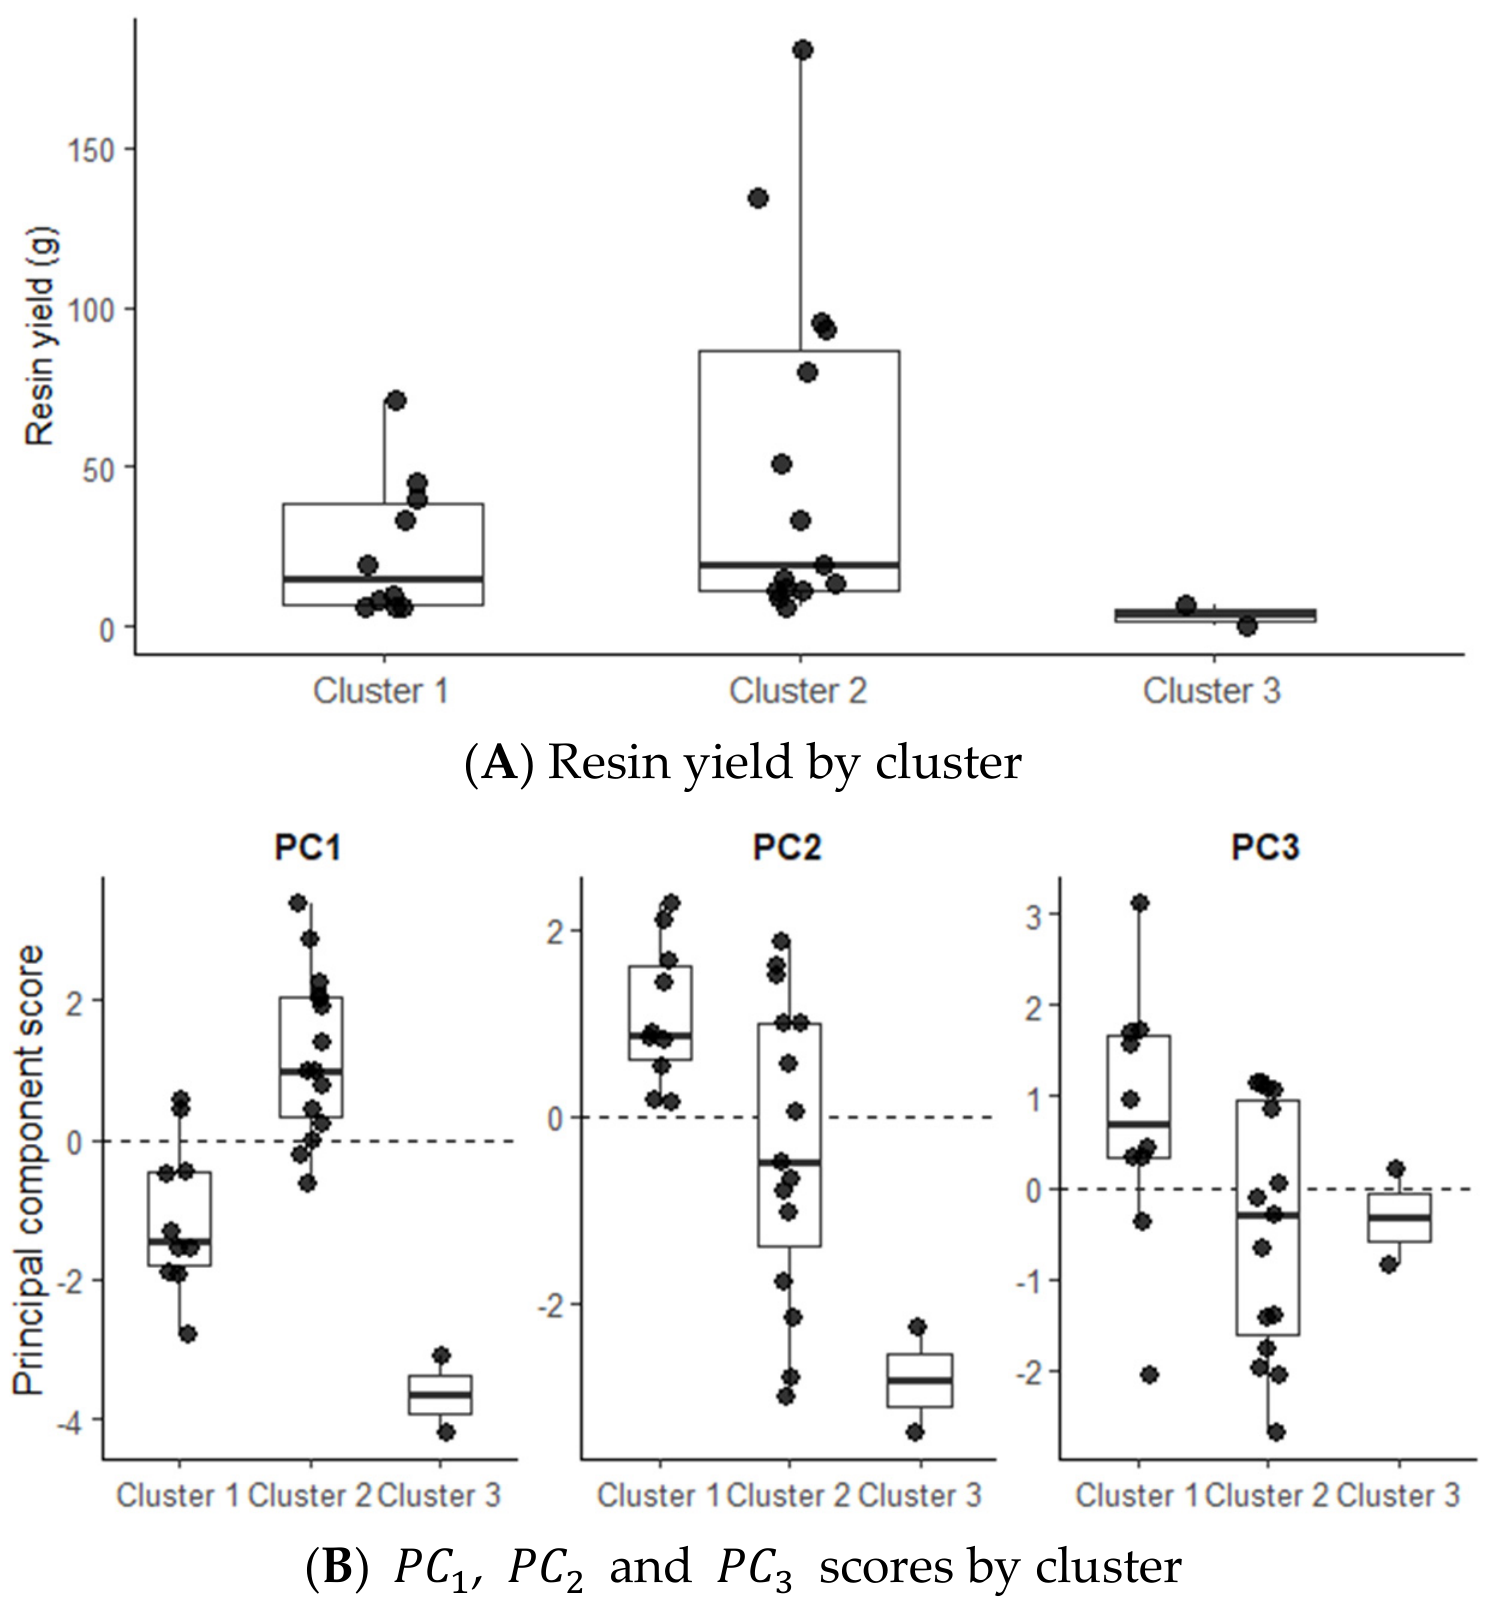
Hierarchical cluster analysis was used to explore potential groupings among the 27 individuals based on their multivariate profiles derived from the principal component scores. Evaluation of alternative cluster solutions did not provide consistent evidence for a uniquely supported number of clusters. The average silhouette width was highest for k = 6 (0.330), whereas the Gap Statistic favored k = 1, indicating weak overall evidence for a discrete clustering structure. A three-cluster solution was additionally evaluated for exploratory purposes, and its stability was assessed by bootstrap resampling. Mean Jaccard similarity coefficients were low for all three clusters (0.477, 0.413, and 0.470), indicating limited cluster stability. Therefore, the three-group partition should be interpreted as exploratory rather than as evidence of clearly differentiated ecofunctional groups. Under this partition, mean resin yields were 24.40 g (n = 10), 50.87 g (n = 15), and 3.50 g (n = 2) for Groups 1, 2, and 3, respectively. Nevertheless, resin yield did not differ significantly among groups according to the Kruskal–Wallis test (χ2 = 5.863, df = 2, p = 0.0533). The distributions of resin yield and principal component scores across the three exploratory groups are shown in Figure 8.
The multiple linear model including P C 1 , P C 2 , P C 3 , and sampling site was statistically significant ( F ( 5,21 ) = 3.23 ,   p = 0.0256 ) and explained 43.5% of the variation in log-transformed resin yield (R2 = 0.435; adjusted R2 = 0.300). P C 1 was positively associated with log-transformed resin yield ( β = 0.400 ,   S E = 0.165 ,   p = 0.0245 ) , whereas P C 3 showed a negative association ( β = 0.408 ,   S E = 0.171 ,   p = 0.0269 ) . P C 2 was not statistically significant at α = 0.05   ( β = 0.227 ,   S E = 0.122 ,   p = 0.0764 ) . After accounting for P C 1 P C 3 , trees from S 2 showed lower log-transformed resin yield than those from the reference site S 1   ( β = 1.786 ,   S E = 0.594 ,   p = 0.0067 ) , whereas no statistically significant difference was detected between S 3 and S 1   ( β = 0.309 ,   S E = 0.581 ,   p = 0.6007 ) .

4. Discussion

4.1. Correlation Analysis

The Pearson correlation matrix identified significant patterns of covariation among edaphic, dendrometric, and management factors indicating associations among these components within the sampled trees. A strong positive correlation was identified between OM and TOTN, indicating their close association within the sampled soils [18,19]. Furthermore, the moderate positive correlations of OM with CD and TH suggest that soil organic matter and tree structural attributes covaried within the sampled individuals. Similar associations between soil organic matter and plant development have been reported in tropical ecosystems [47,48,49].
On the other hand, the moderate correlations between P and K, TF, and AC indicates covariation between P and microbiological attributes within the sampled soils. This relationship is consistent with research reporting associations between P availability and soil microbial activity [50,51]. In this context, the correlation of K with CA and CEC indicates covariation among these soil chemical properties [22]. Furthermore, the relationship between TF and AC, together with their associations with CD and TH, indicates covariation between microbial and dendrometric attributes within the sampled trees. Although beneficial soil microbiota has been associated with physiological resilience and plant growth under stress conditions in previous studies [52], these mechanisms were not directly evaluated in the present study.
Regarding soil physical properties, BD showed a negative correlation with MC, indicating an inverse association between soil bulk density and moisture content within the sampled soils. Soil water availability has been associated with resin yield in previous studies [13,53]; however, the present correlation does not establish a direct effect on resin production. Regarding morphology, the positive relationship between NPB and MSD indicates some morphometric consistency within the species, although with limited implications for direct resin productivity. Previous studies have reported associations of trunk diameter and the number of primary branches with resin yield [10,54]; however, these relationships are considered here as comparative evidence and not as confirmation of equivalent anatomical or physiological mechanisms in B. bipinnata.
Finally, a negative correlation was observed between HD and key variables such as P, TF, and AC.
These finding indicate that longer exploitation histories were associated with lower values of these soil attributes within the sampled trees, but do not demonstrate a progressive decline caused by resin harvesting. Similar associations between soil quality and resin production have been reported in other resin-producing species [12]; however, such evidence is considered here only as comparative context.

4.2. Principal Component Analysis (PCA)

The three principal components retained by Horn’s parallel analysis explained 63.66% of the total multivariate variation among the sampled trees. These components summarized the main patterns of covariation among ecological, edaphic, dendrometric, and management attributes and were interpreted as exploratory multivariate gradients rather than as discrete ecological or physiological mechanisms. Together, they provided an integrated representation of the ecofunctional variation observed in the sampled B. bipinnata trees under the study conditions.
PC1 explained 27.00% of the total variance and was characterized by high loadings for TH, TF, ALT, OM, AC, P, and TOTN. This configuration describes a multivariate gradient integrating tree structure, topographic position, soil organic and nutrient attributes, and microbial variables. In PC1, TF, AC, OM, P, and TOTN all exhibited negative loadings, indicating that these edaphic and microbial attributes covaried in the same direction along the component. This direction directly contrasted with elevation (ALT), which showed a high positive loading. Total tree height (TH) also shared a negative loading, meaning it covaried in the same direction as the soil fertility and microbial variables along this component The opposite sign of ALT relative to TH and the edaphic and microbial variables indicate contrasting positions along this gradient and should be interpreted as a pattern of covariation rather than as evidence of direct ecological or physiological effects.
Fungi and actinobacteria are important components of soil microbial communities and have been associated with nutrient cycling and soil physical processes [50,51]. Previous studies have reported roles of fungi in P and N dynamics and plant–soil interactions [55,56,57], while actinobacteria have been associated with P availability and the formation of stable soil aggregates [50,57]. In PC1, TF and AC showed negative loadings together with OM, P, and TOTN, indicating that these edaphic and microbial attributes covaried in the same direction along the component and contrasted ALT, which showed a positive loading. These relationships should be interpreted as a multivariate pattern of covariation rather than as evidence of direct microbial effects on tree growth or resin production.
The loading of P on PC1 is relevant in the context of TDF agroforestry systems, where this nutrient typically exhibits low mobility [21]. In PC1, P covaried in the same direction as OM, TOTN, TF, and AC, collectively contributing to the edaphic and microbial dimension of this multivariate gradient. Concerns have been raised regarding the growing global scarcity of natural phosphorus sources and the need for more efficient and environmentally sustainable management of P in tropical soils [58]. In the present study, however, the contribution of P to PC1 is interpreted as part of the observed multivariate soil pattern rather than as evidence of a direct physiological effect on resin production.
In structural terms, total tree height is an important descriptor of tree structure. In PC1, TH loaded in the same direction as TF, OM, AC, P, and TOTN, indicating covariation between tree structural, edaphic, and microbial attributes along this multivariate gradient. Previous studies within the genus Bursera have reported associations between structural attributes and resin production [10]; however, the pattern observed here should not be interpreted as evidence that these edaphic or microbial attributes directly promote tree growth or resin production.
Overall, PC1 represents an ecofunctional gradient integrating tree structure, topographic position, and edaphic and microbial attributes. Rather than identifying an optimal ecofunctional status, this component highlights contrasting combinations of these attributes among the sampled trees, providing a basis for identifying conditions that may be relevant for the monitoring and sustainable management of B. bipinnata.
OM is recognized for its ability to improve soil structure, increase water-holding capacity, and serve as an energy reservoir for soil microbiota, thereby contributing to nutrient availability and plant growth [18,55]. Meanwhile, N is an essential nutrient for the synthesis of proteins and nucleic acids, which are central to plant tissue formation and the maintenance of photosynthetic metabolism [19]. In PC2, OM and TOTN showed positive loadings in the same direction as MSD and HD, indicating covariation among soil organic and nutrient attributes, tree structure, and harvesting history. Although N availability and radial growth have been linked to vegetative development and exudates in forest species [59], the pattern observed in PC2 represents a broad multivariate association and does not establish specific anatomical or physiological mechanisms linking stem diameter or nutrient availability to resin yield in B. bipinnata.
MSD is a reliable indicator of a tree’s cumulative growth and structural development. Several studies have reported associations between radial growth and soil conditions, particularly in perennial species found in seasonal tropical environments [13,60]. In PC2, MSD showed the highest positive loading and covaried in the same direction as TOTN, OM, and HD, indicating an association among tree structure, edaphic attributes, and harvesting history within the sampled trees. Within the genus Bursera, larger stem diameter has also been associated with resin production [54]; however, the present results do not establish an anatomical or physiological mechanism linking stem diameter to resin yield in B. bipinnata.
Overall, PC2 represents a multivariate gradient integrating tree structure, soil organic and nutrient attributes, and harvesting history. The covariation of MSD, TOTN, OM, and HD, together with the opposite contribution of P, highlights the combined variation of dendrometric, edaphic, and management attributes among the sampled trees. Rather than indicating that soil fertility determines resin yield or regulates physiological processes, this component identifies a set of potentially relevant conditions that may be considered in the monitoring and sustainable management of B. bipinnata.
The third principal component (PC3), which explained 15.65% of the total variance, was characterized by a negative loading for BD, a positive loading for MC, and a negative loading for MG. This configuration represents a soil physical–water gradient in which soil moisture varies in the opposite direction to BD and MG along the component. The contrasting loadings indicate covariation among these soil attributes rather than a direct effect of soil compaction or MG on water availability.
From an ecofunctional perspective, BD is considered an indicator of soil porosity, which is influenced by factors such as organic matter content, texture, and the degree of human disturbance [61]. High BD values are typically associated with reduced soil porosity and permeability, which limits water infiltration and storage, as well as the gas exchange necessary for root development [62,63]. In PC3, the opposite loadings of BD and MC are consistent with this physical–water contrast; however, the component represents covariation between these soil attributes and does not demonstrate direct effects on root functioning or rhizosphere conditions.
Soil moisture is an important component of water availability and may influence plant responses to seasonal water limitation. In B. bipinnata, previous research has reported lower resin production under dry conditions and has discussed potential relationships with hydraulic limitations [13]. In the present study, MC showed a positive loading on PC3 and contrasted with BD and MG. This pattern is consistent with a physical–water gradient, but the present analysis does not establish hydraulic or physiological mechanisms linking soil moisture to resin production.
Previous studies have reported associations of soil compaction and low water availability with root development and microbial activity [64,65], as well as relationships between water stress and chemical defense responses in woody species [66,67]. However, the present study did not directly measure physiological defense mechanisms. Therefore, the observed association between PC3 and resin yield should not be interpreted as evidence that soil stress induced resin exudation as an adaptive defense response.
Overall, PC3 represents a soil physical–water gradient characterized by contrasting contributions of MC, BD, and MG. This component highlights the relevance of considering soil physical and water-related attributes when evaluating the environmental conditions associated with B. bipinnata. These attributes may therefore be useful for soil monitoring within sustainable management strategies, particularly in seasonally dry environments where water availability is an important ecological constraint [68].

4.3. Hierarchical Clustering and Multiple Linear Regression

Hierarchical cluster analysis provided an exploratory representation of the multivariate heterogeneity among the sampled trees rather than evidence of discrete ecofunctional groups. The complementary criteria used to assess cluster structure did not identify a consistent optimal partition, and the low Jaccard similarity coefficients indicated limited stability of the three-cluster solution. Although differences in observed mean resin yield occurred among the exploratory groups, these differences were not statistically significant ( K r u s k a l W a l l i s ,   p = 0.0533 ) . Consequently, the three-cluster solution should be interpreted cautiously as a descriptive representation of multivariate variation among the sampled trees rather than as evidence of distinct resin-productivity groups.
The observed cluster configurations suggest that ecological, edaphic, dendrometric, and management attributes vary jointly among the sampled trees. However, these patterns do not establish that particular combinations of these attributes determine resin productivity. Moreover, because physiological defense responses were not directly measured, the observed associations cannot be interpreted as evidence that edaphic or water stress induces resin exudation as an adaptive defense response.
The multiple linear model provided additional evidence of associations between the retained multivariate gradients and resin yield. The model explained 43.5% of the variation in log-transformed resin yield ( R 2 = 0.435 ;   a d j u s t e d   R 2 = 0.300 ) , with P C 1 showing a positive association ( β = 0.400 ,   p = 0.0245 ) and P C 3 a negative association ( β = 0.408 ,   p = 0.0269 ) . P C 2 was not statistically significant ( p = 0.0764 ) . These results indicate that variation along P C 1 and P C 3 was associated with resin yield within the sampled trees, but should not be interpreted as evidence of direct ecological or physiological effects. Thus, in relation to the research question, resin yield was associated with specific multivariate ecofunctional gradients within the sampled trees.
Sampling site was also associated with resin yield after accounting for P C 1 P C 3 . Trees from S 2 showed lower log-transformed resin yield than those from the reference site S 1   ( β = 1.786 ,   p = 0.0067 ) , whereas S 3 did not differ significantly from S 1   ( p =   0.6007 ) . These site-level differences may reflect unmeasured environmental or management heterogeneity and should therefore be interpreted within the sampled sites rather than generalized beyond the study conditions.

4.4. Study Limitations

The initial purposive selection of candidate trees, based partly on productive capacity and phytosanitary condition, may have introduced selection bias. Because the trees were not selected through probability sampling, the statistical associations and inference results should be interpreted within the sampled trees and study sites and should not be generalized to the broader population of B. bipinnata.
In addition, harvesting effort was not fully quantified at the individual-tree level. Although the interval between incisions and the harvesting season followed the traditional procedure described above, unrecorded differences in the number and size of incisions, tapped branches, total collection frequency, or collector practices may have contributed to the observed variability in resin mass. Therefore, associations between resin yield and the evaluated ecofunctional variables should be interpreted with caution. Moreover, because physiological defense responses were not directly measured, the observed associations cannot be used to infer adaptive or defense mechanisms underlying resin exudation.
Finally, the relatively small sample size (n = 27) in relation to the number of variables considered represents a limitation of the multivariate analysis. Therefore, the PCA results should be interpreted as exploratory and within the context of the sampled trees and study sites.

5. Conclusions

Resin production in B. bipinnata was associated with multivariate gradients integrating ecological, edaphic, dendrometric, and management attributes within the sampled trees and study sites. PCA retained three principal components that explained 63.66% of the total multivariate variation. The multiple linear model showed a positive association between P C 1 and log-transformed resin yield and a negative association between P C 3 and the response variable, whereas P C 2 was not statistically significant. Sampling site was also associated with resin yield, with S 2 showing lower values than the reference site S1, while no significant difference was detected between S 3 and S 1 . Hierarchical cluster analysis was used to explore a three-group partition; however, complementary cluster-validation criteria indicated limited support and stability for this solution, and differences in resin yield among the exploratory groups were not statistically significant. Overall, these findings provide exploratory evidence that resin yield is associated with combinations of ecological, soil, tree structural, and management attributes, but they do not establish causal or physiological mechanisms. The identified multivariate patterns provide a basis for future studies and for the monitoring of site, soil, tree, and management attributes potentially associated with resin yield in the sustainable harvesting of B. bipinnata.

Author Contributions

Conceptualization, S.d.C.A.-J., A.L.-B. and J.C.B.-E.; methodology, S.d.C.A.-J., J.C.B.-E. and A.L.-B.; software, S.d.C.A.-J. and J.C.B.-E.; validation, S.d.C.A.-J., J.P.-N., A.C.-L. and J.C.B.-E.; formal analysis, J.C.B.-E.; investigation, S.d.C.A.-J., A.L.-B., J.P.-N. and A.C.-L.; resources, S.d.C.A.-J., J.C.B.-E.; data curation, J.C.B.-E. and S.d.C.A.-J.; writing—original draft preparation, S.d.C.A.-J. and J.C.B.-E.; writing—review and editing, S.d.C.A.-J., A.L.-B. and J.C.B.-E.; visualization, S.d.C.A.-J., J.P.-N., A.C.-L. and J.C.B.-E.; supervision, S.d.C.A.-J., A.L.-B. and J.C.B.-E.; project administration, J.C.B.-E.; funding acquisition, S.d.C.A.-J., A.L.-B. and J.C.B.-E. All authors have read and agreed to the published version of the manuscript.

Funding

This research was funded by Universidad Autónoma Chapingo and Secretaría de Ciencia, Humanidades, Tecnología e Innovación (Secihti).

Data Availability Statement

The de-identified data supporting the findings of this study and the code used for the statistical analyses are available from the corresponding author upon reasonable request.

Acknowledgments

The researchers would like to thank the copal producers of Ejido Los Sauces, Tepalcingo, Morelos, Mexico, for their participation in the study. During the preparation of this manuscript, the authors used AI tools for the purposes of document proofreading, text revision, and language editing. The authors have reviewed and edited the output and take full responsibility for the content of this publication.

Conflicts of Interest

The authors declare that they have no conflicts of interest.

References

  1. Montúfar, L.A. Copal de Bursera bipinnata. Una Resina Mesoamericana de Uso Ritual. Trace 2016, 70, 45–77. [Google Scholar] [CrossRef] [Scilit]
  2. Becerra, J.; Yetman, D. Elephant Trees, Copales, and Cuajiotes: A Natural History of Bursera; University of Arizona Press: Tucson, AZ, USA, 2024. [Google Scholar]
  3. Linares, E.; Bye, R. El Copal En Mexico. Biodiversitas 2008, 78, 8–11. [Google Scholar]
  4. Moreno-Calles, A.I.; Toledo, V.M.; Casas, A. Los Sistemas Agroforestales Tradicionales de Mexico: Una Aproximación Biocultural. Bot. Sci. 2013, 91, 375–398. [Google Scholar] [CrossRef] [Scilit]
  5. Cruz, L.A.; Salazar, M.L.; Campos, O.M. Antecedentes y Actualidad Del Aprovechamiento de Copal En La Sierra de Huautla, Morelos. Rev. Geogr. Agríc. 2006, 37, 97–115. [Google Scholar]
  6. Abad-Fitz, I.; Maldonado-Almanza, B.; Aguilar-Dorantes, K.M.; Sánchez-Méndez, L.; Gómez-Caudillo, L.; Casas, A.; Blancas, J.; García-Rodríguez, Y.M.; Beltrán-Rodríguez, L.; Sierra-Huelsz, J.A.; et al. Consequences of Traditional Management in the Production and Quality of Copal Resin (Bursera bipinnata (Moc. & Sessé Ex DC.) Engl.) in Mexico. Forests 2020, 11, 991. [Google Scholar] [CrossRef] [Scilit]
  7. Purata, V.S.E. Capítulo 6. Bases Para El Buen Manejo. In Uso y Manejo de los Copales Aromáticos: Resinas y Aceites; Purata, V.S.E., Ed.; Comisión Nacional para el Conocimiento y Uso de la Biodiversidad: Mexico City, Mexico, 2008; pp. 27–35. [Google Scholar]
  8. Tulková, J.; Pompeiano, A.; Massad, T.J.; Vahalík, P.; Paschová, Z.; Vaníčková, L.; Maděra, P. Geographical and Environmental Influences on Boswellia Elongata Balf.f. Volatiles: An in Situ Study on Socotra Island. Flora 2024, 321, 152638. [Google Scholar] [CrossRef] [Scilit]
  9. Reyes-Ramos, A.; León, J.C.d.; Martínez-Palacios, A.; Lobit, P.C.M.; Ambríz-Parra, J.E.; Sánchez-Vargas, N.M. Caracteres Ecológicos y Dendrométricos Que influyen En La producción de Resina en Pinus oocarpa de Michoacán, Mexico. Madera Bosques 2019, 25, 2511414. [Google Scholar] [CrossRef] [Scilit]
  10. Buendía-Espinoza, J.C.; Martínez-Ochoa, E.D.C.; García-Núñez, R.M.; Arrazate-Jiménez, S.D.C.; Sánchez-Vélez, A. Prediction of Resin Production in Copal Trees (Bursera spp.) Using a Random Forest Model. Sustainability 2022, 14, 8047. [Google Scholar] [CrossRef] [Scilit]
  11. Novick, K.A.; Katul, G.G.; McCarthy, H.R.; Oren, R. Increased Resin Flow in Mature Pine Trees Growing under Elevated CO2 and Moderate Soil Fertility. Tree Physiol. 2012, 32, 752–763. [Google Scholar] [CrossRef] [Scilit] [PubMed]
  12. Garcia-Forner, N.; Campelo, F.; Carvalho, A.; Vieira, J.; Rodríguez-Pereiras, A.; Ribeiro, M.; Salgueiro, A.; Silva, M.E.; Louzada, J.L. Growth-Defence Trade-Offs in Tapped Pines on Anatomical and Resin Production. For. Ecol. Manag. 2021, 496, 119406. [Google Scholar] [CrossRef] [Scilit]
  13. Martínez-Galván, F.; Buendía-Espinoza, J.C.; Martínez-Ochoa, E.D.C.; Arrazate-Jiménez, S.D.C.; García-Núñez, R.M. Sustainable Management of Bursera bipinnata: Relationship between Environmental and Physiological Parameters and Resin Extraction. Forests 2025, 16, 801. [Google Scholar] [CrossRef] [Scilit]
  14. García, E. Modificaciones al Sistema de Clasificación Climática de Köppen, 5th ed.; Universidad Nacional Autónoma de Mexico: Mexico City, Mexico, 2004. [Google Scholar]
  15. García-Núñez, R.M.; Buendía-Espinoza, J.C.; Arrazate-Jiménez, S.D.C.; Martínez-Ochoa, E.D.C. Effects of Copal Resin Extraction on the Diversity and Composition of Species in Tropical Deciduous Forests. Sci. Rep. 2023, 13, 4199. [Google Scholar] [CrossRef] [Scilit] [PubMed]
  16. Osorio, N.W. PH Del Suelo y Disponibilidad de Nutrientes. Manejo Integral Suelo Nutr. Veg. 2012, 1, 1–4. [Google Scholar]
  17. Montaño, M.N.; Sandoval-Pérez, A.L.; Nava-Mendoza, M.; Sánchez-Yañez, J.M.; García-Oliva, F. Variación Espacial y Estacional de Grupos Funcionales de Bacterias Cultivables Del Suelo de Un Bosque Tropical Seco En Mexico. Rev. Biol. Trop. 2013, 61, 439–453. [Google Scholar] [CrossRef] [Scilit]
  18. Trinidad-Santos, A.; Velasco-Velasco, J. Importancia De La Materia Orgánica En El Suelo. Agroproductividad 2016, 9, 52–58. [Google Scholar]
  19. Reich, P.B.; Hobbie, S.E.; Lee, T.; Ellsworthh, D.S.; West, J.B.; Tilman, D.; Knops, J.M.H.; Naeem, S.; Trost, J. Nitrogen Limitation Constrains Sustainability of Ecosystem Response to CO2. Nature 2006, 440, 922–925. [Google Scholar] [CrossRef] [Scilit] [PubMed]
  20. Bindraban, P.S.; Dimkpa, C.O.; Pandey, R. Exploring Phosphorus Fertilizers and Fertilization Strategies for Improved Human and Environmental Health. Biol. Fertil. Soils 2020, 56, 299–317. [Google Scholar] [CrossRef] [Scilit]
  21. Hinsinger, P. Bioavailability of Soil Inorganic P in the Rhizosphere as Affected by Root-Induced Chemical Changes: A Review. Plant Soil 2001, 237, 173–195. [Google Scholar] [CrossRef] [Scilit]
  22. Alcántar, G.G.; Trejo-Téllez, L.I.; Gómez-Merino, F.C. Nutrición de Cultivos, 2nd ed.; Biblioteca Básica de Agricultura: Mexico City, Mexico, 2016. [Google Scholar]
  23. Rashan, L.; Idrees, M.; Rishan, M.L.; Hakkim, F.L.; Al-Buloshi, M.; Abdo Hasson, S.S.A. Comparative Studies on Mineral Contents in Soil and Wild Trees Samples of Boswellia sacra Collected from Different Locations of Dhofar. Ara. J. Med. Aromat. Plants 2019, 5, 46–58. [Google Scholar] [CrossRef]
  24. Cruz-Macías, W.O.; Rodríguez-Larramendi, L.A.; Salas-Marina, M.Á.; Hernández-García, V.; Campos-Saldaña, R.A.; Chávez-Hernández, M.H.; Gordillo-Curiel, A. Efecto de La Materia Orgánica y La Capacidad de Intercambio Catiónico En La Acidez de Suelos Cultivados Con Maíz En Dos Regiones de Chiapas, Mexico. Terra Latinoam. 2020, 38, 475–480. [Google Scholar] [CrossRef] [Scilit]
  25. Agostini, M.d.l.Á.; Monterubbianesi, M.G.; Studdert, G.A.; Maurette, S. Un Método Simple y Práctico Para La Determinación de Densidad Aparente. Cienc. Suelo 2014, 32, 171–176. [Google Scholar]
  26. Valdez-Hernández, M.; Andrade, J.L.; Jackson, P.C.; Rebolledo-Vieyra, M. Phenology of Five Tree Species of a Tropical Dry Forest in Yucatan, Mexico: Effects of Environmental and Physiological Factors. Plant Soil 2010, 329, 155–171. [Google Scholar] [CrossRef] [Scilit]
  27. Burgess, A.J.; Retkute, R.; Preston, S.P.; Jensen, O.E.; Pound, M.P.; Pridmore, T.P.; Murchie, E.H. The 4-Dimensional Plant: Effects of Wind-Induced Canopy Movement on Light Fluctuations and Photosynthesis. Front. Plant Sci. 2016, 7, 1392. [Google Scholar] [CrossRef] [Scilit] [PubMed]
  28. Mcroberts, R.E.; Tomppo, E.O.; Czaplewski, R.I. Diseños de Muestreo de Las Evaluaciones Forestales Nacionales; FAO: Roma, Italy, 1992. [Google Scholar]
  29. QGIS Development Team. QGIS Geographic Information System; QGIS Association: Bern, Switzerland, 2022; Available online: https://qgis.org/ (accessed on 24 March 2025).
  30. Secretaría de Medio Ambiente y Recursos Naturales. NOM-021-RECNAT-2000, Especificaciones de Fertilidad, Salinidad y Clasificación de Suelos; SEMARNAT: Mexico City, Mexico, 2002. [Google Scholar]
  31. Blake, G.R.; Hartge, K.H. Bulk Density. In Methods of Soil Analysis, Part 1: Physical and Mineralogical Methods; Klute, A., Ed.; American Society of Agronomy: Madison, WI, USA; Soil Science Society of America: Madison, WI, USA, 1986; pp. 363–375. [Google Scholar]
  32. Lampurlanés, J.; Cantero-Martínez, C. Soil Bulk Density and Penetration Resistance under Different Tillage and Crop Management Systems and Their Relationship with Barley Root Growth. Agron. J. 2003, 95, 526–536. [Google Scholar] [CrossRef] [Scilit]
  33. González, M.A.; Almaraz, S.J.J.; Ferrera, C.R.; Rodríguez, G.M.d.P.; Taboada, G.O.R.; Trinidad, S.A. Rizobacterias y Hongos Micorrízicos Arbusculares Asociados Con Chile Poblano En La Sierra Nevada de Puebla, Mexico. Rev. Mex. De Cienc. Agric. 2018, 20, 4355–4365. [Google Scholar] [CrossRef] [Scilit]
  34. Jolliffe, I.T. Principal Component Analysis, 2nd ed.; Springer Series in Statistics: New York, NY, USA, 2002. [Google Scholar]
  35. R Core Team. R: A Language and Environment for Statistical Computing; R Foundation for Statistical Computing: Vienna, Austria, 2023; Available online: https://www.r-project.org/ (accessed on 15 July 2025).
  36. Kaiser, H.F. An Index of Factorial Simplicity. Psychometrika 1974, 39, 31–36. [Google Scholar] [CrossRef] [Scilit]
  37. Bartlett, M.S. Tests of Significance in Factor Analysis. Br. J. Stat. Psychol. 1950, 3, 77–85. [Google Scholar] [CrossRef] [Scilit]
  38. Hair, J.F.; Black, W.C.; Babin, B.J.; Anderson, R.E. Multivariate Data Analysis, 7th ed.; Pearson Education: Hoboken, NJ, USA, 2010. [Google Scholar]
  39. Everitt, B.S.; Landau, S.; Leese, M.; Stahl, D. Cluster Analysis, 5th ed.; Wiley: Chichester, UK, 2011. [Google Scholar]
  40. Kaufman, L.; Rousseeuw, P.J. Finding Groups in Data: An Introduction to Cluster Analysis; Wiley: Chichester, UK, 2009. [Google Scholar]
  41. Rousseeuw, P.J. Silhouettes: A Graphical Aid to the Interpretation and Validation of Cluster Analysis. J. Comput. Appl. Math. 1987, 20, 53–65. [Google Scholar] [CrossRef] [Scilit]
  42. Tibshirani, R.; Walther, G.; Hastie, T. Estimating the Number of Clusters in a Data Set via the Gap Statistic. J. R. Stat. Soc. B 2001, 63, 411–423. [Google Scholar] [CrossRef] [Scilit]
  43. Hennig, C. Cluster-Wise Assessment of Cluster Stability. Comput. Stat. Data Anal. 2007, 52, 258–271. [Google Scholar] [CrossRef] [Scilit]
  44. Benjamini, Y.; Hochberg, Y. Controlling the False Discovery Rate: A Practical and Powerful Approach to Multiple Testing. J. R. Stat. Soc. B 1995, 57, 289–300. [Google Scholar] [CrossRef] [Scilit]
  45. Horn, J.L. A Rationale and Test for the Number of Factors in Factor Analysis. Psychometrika 1965, 30, 179–185. [Google Scholar] [CrossRef] [Scilit] [PubMed]
  46. Field, A. Discovering Statistics Using IBM SPSS Statistics, 4th ed.; SAGE Publications: Thousand Oaks, CA, USA, 2013. [Google Scholar]
  47. Guízar, N.E.; Sánchez, V.A. Guía Para El Reconocimiento de Los Principales Árboles Del Alto Balsas; Universidad Autónoma Chapingo: Mexico City, Mexico, 1991. [Google Scholar]
  48. Leiva, J.A.; Rocha, O.J.; Mata, R.; Gutiérrez-Soto, M.V. Cronología de La Regeneración Del Bosque Tropical Seco En Santa Rosa, Guanacaste, Costa Rica. II. La Vegetación En Relación Con El Suelo. Rev. Biol. Trop. 2009, 57, 817–836. [Google Scholar] [CrossRef] [Scilit]
  49. Hernández-García, E.; Barrales-Alcalá, B.; Bonfil, C. Evaluación Del Desempeño Inicial de Estacas y Plántulas En Una Plantación de Copales (Bursera copallifera y B. bipinnata). Bot. Sci. 2024, 102, 1062–1079. [Google Scholar] [CrossRef] [Scilit]
  50. Mendes, R.; Garbeva, P.; Raaijmakers, J.M. The Rhizosphere Microbiome: Significance of Plant Beneficial, Plant Pathogenic, and Human Pathogenic Microorganisms. Microbiol. Rev. 2013, 37, 634–663. [Google Scholar] [CrossRef] [Scilit] [PubMed]
  51. Smith, S.E.; Read, D.J. Mycorrhizal Symbiosis, 3rd ed.; Academic Press: San Diego, CA, USA, 2008. [Google Scholar]
  52. Chauhan, P.; Sharma, N.; Tapwal, A.; Kumar, A.; Verma, G.S.; Meena, M.; Seth, C.S.; Swapnil, P. Soil Microbiome: Diversity, Benefits and Interactions with Plants. Sustainability 2023, 15, 14643. [Google Scholar] [CrossRef] [Scilit]
  53. Rodríguez-García, A.; Martín, J.A.; López, R.; Mutke, S.; Pinillos, F.; Gil, L. Influence of Climate Variables on Resin Yield and Secretory Structures in Tapped Pinus pinaster Ait. in Central Spain. Agric. For. Meteorol. 2015, 202, 83–93. [Google Scholar] [CrossRef] [Scilit]
  54. Tolera, M.; Sass-Klaassen, U.; Eshete, A.; Bongers, F.; Sterck, F. Frankincense Yield Is Related to Tree Size and Resin-Canal Characteristics. For. Ecol. Manag. 2015, 353, 41–48. [Google Scholar] [CrossRef] [Scilit]
  55. Lehmann, J.; Kleber, M. The Contentious Nature of Soil Organic Matter. Nature 2015, 528, 60–68. [Google Scholar] [CrossRef] [Scilit] [PubMed]
  56. Treseder, K.K. The Extent of Mycorrhizal Colonization of Roots and Its Influence on Plant Growth and Nutrient Content. Ecol. Lett. 2013, 371, 1–13. [Google Scholar] [CrossRef] [Scilit]
  57. Liu, Y.; Imtiaz, M.; Ditta, A.; Rizwan, M.S.; Ashraf, M.; Mehmood, S.; Aziz, O.; Mubeen, F.; Ali, M.; Elahi, N.N.; et al. Response of Growth, Antioxidant Enzymes and Root Exudates Production towards As Stress in Pteris vittata and in Astragalus sinicus Colonized by Arbuscular Mycorrhizal Fungi. Environ. Sci. Pollut. Res. 2020, 27, 2340–2352. [Google Scholar] [CrossRef] [Scilit] [PubMed]
  58. Lizcano-Toledo, R.; Reyes-Martín, M.P.; Celi, L.; Fernández-Ondoño, E. Phosphorus Dynamics in the Soil–Plant–Environment Relationship in Cropping Systems: A Review. Appl. Sci. 2021, 11, 11133. [Google Scholar] [CrossRef] [Scilit]
  59. Rodríguez-García, A.; López, R.; Martín, J.A.; Pinillos, F.; Gil, L. Resin Yield in Pinus pinaster Is Related to Tree Dendrometry, Stand Density and Tapping-Induced Systemic Changes in Xylem Anatomy. For. Ecol. Manag. 2014, 313, 47–54. [Google Scholar] [CrossRef] [Scilit]
  60. Poorter, L.; Bongers, L.; Bongers, F.J.J.M. Architecture of 54 Moist-Forest Tree Species: Traits, Trade-Offs, and Functional Groups. Ecology 2006, 87, 1289–1301. [Google Scholar] [CrossRef] [Scilit]
  61. Martínez, E.; Fuentes, J.P.; Acevedo, E. Carbono Orgánico y Propiedades Del Suelo. J. Soil. Sc. Plant Nutr. 2008, 8, 68–96. [Google Scholar] [CrossRef] [Scilit]
  62. Batey, T. Soil Compaction and Soil Management—A Review. Soil Use Manag. 2009, 25, 335–345. [Google Scholar] [CrossRef] [Scilit]
  63. Unger, P.; Kaspar, T. Soil Compaction and Root Growth: A Review. Agron. J. 1994, 86, 759–766. [Google Scholar] [CrossRef] [Scilit]
  64. Benegas, L.; Ilstedt, U.; Roupsard, O.; Jones, J.; Malmer, A. Effects of Trees on Infiltrability and Preferential Flow in Two Contrasting Agroecosystems in Central America. Agric. Ecosyst. Environ. 2014, 183, 185–196. [Google Scholar] [CrossRef] [Scilit]
  65. Nawaz, M.F.; Bourrié, G.; Trolard, F. Soil Compaction Impact and Modelling. A Review. Agron. Sustain. Dev. 2013, 33, 291–309. [Google Scholar] [CrossRef] [Scilit]
  66. Rissanen, K.; Hölttä, T.; Bäck, J.; Rigling, A.; Wermelinger, B.; Gessler, A. Drought Effects on Carbon Allocation to Resin Defences and on Resin Dynamics in Old-Grown Scots Pine. Environ. Exp. Bot. 2021, 185, 104410. [Google Scholar] [CrossRef] [Scilit]
  67. Klutsch, J.G.; Shamoun, S.F.; Erbilgin, N. Drought Stress Leads to Systemic Induced Susceptibility to a Nectrotrophic Fungus Associated with Mountain Pine Beetle in Pinus banksiana Seedlings. PLoS ONE 2017, 12, e0189203. [Google Scholar] [CrossRef] [Scilit] [PubMed]
  68. Allen, C.D.; Macalady, A.K.; Chenchouni, H.; Bachelet, D.; McDowell, N.; Vennetier, M.; Kitzberger, T.; Rigling, A.; Breshears, D.D.; Hogg, E.H.T.; et al. A Global Overview of Drought and Heat-Induced Tree Mortality Reveals Emerging Climate Change Risks for Forests. For. Ecol. Manag. 2010, 259, 660–684. [Google Scholar] [CrossRef] [Scilit]
Figure 1. Location of the study area and the three sampling sites within the Los Sauces micro-watershed, Tepalcingo, Morelos, Mexico.
Forests 17 01070 g001
Figure 2. Ecofunctional context and traditional resin-harvesting process of Bursera bipinnata. (a) General view of the silvopastoral system within the tropical dry forest; (b) B. bipinnata tree under active resin harvesting; (c) traditional incision technique on a tree branch using a “quichala” or “quixala” and a wooden mallet; and (d) copal resin exudation and collection using an Agave spp. leaf.
Forests 17 01070 g002
Figure 3. Distribution of individual resin yield observations of B. bipinnata across the three sampling sites. Points represent individual trees (n = 9 per site; n = 27 in total), and boxplots summarize the distribution of resin yield within each site. S1, S2, and S3 denote sampling Sites 1, 2, and 3, respectively, all located within the Los Sauces ejido.
Forests 17 01070 g003
Figure 4. Pearson correlation matrix among the ecological, edaphic, dendrometric, and management variables evaluated in B. bipinnata. Cell color represents the magnitude and direction of Pearson’s correlation coefficient (r). Asterisks indicate correlations that remained statistically significant after Benjamini–Hochberg false discovery rate (FDR) correction (adjusted p < 0.05). pH = soil pH; OM = organic matter; TOTN = total nitrogen; P = phosphorus; K = potassium; Ca = calcium; Mg = magnesium; CEC = cation exchange capacity; BD = bulk density; TF = total fungi; AC = actinobacteria; TH = total tree height; MSD = main stem diameter; NPB = number of primary branches; CD = crown diameter; HD = harvesting duration; MC = soil moisture content; DBH = diameter at breast height; ALT = elevation.
Forests 17 01070 g004
Figure 5. Individual measures of sampling adequacy (MSA) for the variables retained in the final principal component analysis (PCA). The dashed vertical line indicates the reference MSA value of 0.50, and the dotted vertical line indicates the overall Kaiser–Meyer–Olkin (KMO) value of 0.612. TF = total fungi; ALT = elevation; HD = harvest duration; P = available phosphorus; TH = total tree height; MSD = main stem diameter; OM = organic matter; CD = crown diameter; TOTN = total nitrogen; AC = actinobacteria; MC = moisture content; MG = magnesium; DBH = diameter at breast height.
Forests 17 01070 g005
Figure 6. Horn’s parallel analysis for principal component retention. Observed PCA eigenvalues were compared with eigenvalues obtained from randomly generated datasets using 10,000 iterations. Three principal components were retained based on the parallel analysis criterion [45].
Forests 17 01070 g006
Figure 7. Variable loadings on the three principal components retained by Horn’s parallel analysis. Only variables with absolute loadings | 0.50 | are shown to facilitate interpretation of the multivariate gradients. Dashed vertical lines indicate the ± 0.50 loading threshold. alttotal = total tree height; ht = total fungi; alt = elevation; mo = organic matter; ac = actinobacteria; ntot = total nitrogen; P = available phosphorus; diamprin = main stem diameter; anotrab = harvest duration; dap = diameter at breast height; conthum = moisture content; mg = magnesium.
Forests 17 01070 g007
Figure 8. Resin yield and principal component score distributions among the three exploratory clusters. (A) Observed resin yield by cluster. (B) Distribution of P C 1 , P C 2 and P C 3 scores by cluster. Points represent individual trees, and boxplots summarize the distributions within each exploratory group. The three-cluster solution showed limited bootstrap stability, and resin yield did not differ significantly among groups (Kruskal–Wallis, p = 0.0533).
Forests 17 01070 g008
Table 1. Description of explanatory variables for copal resin production.
CategoryVariableCodeUnitsDescription
EcologicalAltitudeALTm a.s.l.Topographic variable representing the elevation of each sampled tree above sea level.
EcologicalSlopeSLOPE%Topographic variable representing terrain inclination at each sampled tree.
EdaphicpHPHdimensionlessSoil chemical indicator related to nutrient availability and soil management requirements [16].
EdaphicOrganic matterOM%Key soil component associated with physical, chemical, and biological soil properties [17,18].
EdaphicTotal nitrogenTOTN%Essential soil nutrient associated with plant growth and productivity [19].
EdaphicAvailable phosphorusPmg kg−1Essential macronutrient whose availability is often limited by its low mobility in soil [20,21].
EdaphicPotassiumKcmol(+) kg−1Essential nutrient involved in plant physiological processes, including photosynthesis and carbohydrate translocation [22].
EdaphicCalciumCAcmol(+) kg−1Essential mineral element involved in cell-wall structure, root growth, and cellular integrity [22].
EdaphicMagnesiumMGcmol(+) kg−1Essential plant nutrient and central component of chlorophyll that also functions as an enzymatic cofactor [22,23].
EdaphicCation exchange capacityCECcmol(+) kg−1Soil capacity to retain and exchange essential cations, influenced primarily by clay and organic matter content [24].
EdaphicBulk densityBDg cm−3Soil physical indicator reflecting compaction, porosity, water movement, and aeration [25].
EdaphicMoisture contentMC%Soil water-content indicator relevant to nutrient availability and mobility [26].
EdaphicTotal fungi CFU1TFCFU g−1 soilAbundance of culturable fungi in the soil expressed as colony-forming units.
EdaphicTotal bacteria CFU1TBCFU g−1 soilAbundance of culturable bacteria in the soil expressed as colony-forming units.
EdaphicActinobacteria CFU1ACCFU g−1 soilAbundance of culturable actinobacteria in the soil expressed as colony-forming units.
DendrometricTotal heightTHmDendrometric indicator reflecting the overall vertical development of each sampled tree.
DendrometricMain stem diameterMSDcmDendrometric indicator of main stem size associated with tree structural development [6,10].
DendrometricNumber of primary branchesNPBcountDendrometric attribute reflecting the structural complexity of the tree canopy.
DendrometricCrown diameterCDmDendrometric indicator describing crown size and tree canopy development [10,27].
ManagementHarvest durationHDyearsRetrospective estimate of the number of years each tree had been harvested for resin, based on information provided by local copal collectors and subject to potential recall bias.
Table 2. Descriptive statistics of ecological variables.
VariablesUnitsMinimumMaximumMeanStandard DeviationCV (%)
Elevationm a.s.l.1311.001376.001342.5621.501.60
Slope(%)6.8633.9420.486.0629.59
Table 3. Descriptive statistics of the edaphic variables.
VariableUnitsMinimumMaximumMeanStandard DeviationCV (%)
pHdimensionless5.907.306.700.405.30
BD(g cm−3)0.761.230.960.1516.05
OM%3.5012.608.622.6530.73
N%0.200.500.380.0924.15
P(mg kg−1)3.6097.2016.0717.59109.43
Kcmol(+) kg−10.432.241.100.4439.85
Cacmol(+) kg−115.2840.326.376.3724.17
Mgcmol(+) kg−16.4521.9212.093.5829.60
CECcmol(+) kg−129.4060.6043.578.3119.08
Moisture content%15.5790.8038.9514.4937.20
Total bacteriaCFU g−1 soil5.78 × 10679.05 × 10625.05 × 10616.12 × 106 64.36
Total fungiCFU g−1 soil0.05 × 1060.54 × 1060.23 × 1060.14 × 10658.85
ActinobacteriaCFU g−1 soil0.29 × 1064.59 × 1061.98 × 1061.33 × 10667.06
Table 4. Descriptive statistics of the dendrometric and management variables.
VariablesUnitsMinimumMaximumMeanStandard DeviationCV (%)
Overall heightm3.206.505.021.0320.49
Main diametercm8.6331.8318.485.5229.85
Primary branchesquantity1.005.002.190.7433.67
Crown diameterm2.807.104.971.0821.69
Years of harvestingyears2.0027.0012.527.4259.26
Table 5. Descriptive statistics of copal resin yield.
VariableUnitsMinimumMaximumMeanStandard DeviationCV (%)
Resin yieldg0.00181.0037.5644.76119.19
Disclaimer/Publisher’s Note: The statements, opinions and data contained in all publications are solely those of the individual author(s) and contributor(s) and not of MDPI and/or the editor(s). MDPI and/or the editor(s) disclaim responsibility for any injury to people or property resulting from any ideas, methods, instructions or products referred to in the content.