1. Introduction
Water is the principal resource limiting the establishment, growth, and long-term survival of forest plantations in arid and semi-arid regions [
1,
2]. Within the soil-plant-atmosphere continuum, transpiration, accounting for over 99% of total plant water uptake, simultaneously reflects plant physiological status and atmospheric evaporative demand [
3,
4], and is jointly regulated by atmospheric conditions, soil moisture, and stomatal behavior [
5,
6]. Clarifying how these drivers interact to determine tree- and stand-level water use is therefore central to forest-hydrology theory and to the sustainable management of protective plantations [
7,
8,
9].
This question has grown increasingly urgent under global climate change [
10,
11]. Rising temperatures and declining precipitation are intensifying vapor pressure deficit (VPD) and widening the gap between atmospheric water demand and soil moisture supply, triggering drought-induced dieback in water-limited planted forests worldwide [
12,
13]. The maturation of thermal-dissipation sap-flow techniques, enabling continuous, high-frequency monitoring of stem water flux, has greatly advanced our capacity to quantify transpiration and diagnose the underlying stomatal-regulation strategies [
14,
15,
16]. Northern China exemplifies these challenges: over half of annual precipitation falls in summer, while warming-driven increases in potential evapotranspiration exacerbate year-round water deficits [
17,
18]. Under prolonged water stress, impaired root water uptake promotes xylem embolism and hydraulic failure, ultimately driving canopy dieback or whole-tree mortality [
19,
20]. Because stomata provide the principal interface through which trees sense and respond to this stress [
21,
22,
23], understanding sap-flow dynamics together with associated stomatal-regulation strategies is fundamental to evaluating species adaptability and informing science-based water management in dryland afforestation [
24,
25].
Mongolian pine (
Pinus sylvestris L. var.
mongolica Litv.) combines exceptional cold- and drought-tolerance with a well-developed root system capable of establishing on nutrient-poor sandy substrates, making it the flagship species of China’s “Three-North” Shelterbelt Program and the dominant afforestation species across northern China [
3,
4,
6,
26]. Despite this success, mid-aged and mature stands in early afforestation areas have begun to show growth decline and mortality, with soil-water deficit widely identified as the principal driver [
26,
27]. Although an increasing number of sap-flow studies have probed the water relations of this species [
10,
11,
12,
28], most examine a single stand age and do not explicitly link sap-flow dynamics to stomatal water-regulation strategy across the young-to-mature transition, leaving a critical gap in understanding how water use and drought vulnerability change precisely during the demographic period when decline most frequently occurs [
29,
30].
The southern margin of the Horqin Sandy Land-China’s largest sandy region provides an ideal setting to address this gap. Zhanggutai, site of China’s first artificially planted Mongolian pine sand-fixation forest (established 1955), now supports stands spanning several decades of age, offering a rare opportunity to examine directly how water relations of this ecologically pivotal species shift as shelterbelt forests mature [
1,
2,
3,
4,
31].
Rainfall pulses represent a particularly important yet under-examined dimension of age-dependent water relations [
32]. In sandy soils with low water-holding capacity, discrete precipitation events drive transient increases in surface soil moisture that can relieve water stress and stimulate sap flow, especially in individuals with surface-concentrated root systems [
33,
34,
35]. Because fine-root distribution, canopy architecture, and rooting depth all shift systematically with stand age, transpiration responses to rainfall pulses would be expected to differ markedly between young and mature stands, yet this contrast has rarely been quantified using paired, synchronous sap-flow records [
36].
Two complementary theoretical frameworks guide interpretation of these age-dependent patterns. The hydraulic limitation hypothesis predicts that as trees grow taller, lengthening hydraulic pathways increase frictional and gravitational resistance, forcing tighter stomatal closure and reducing stomatal conductance (
gs) and transpiration in larger, older individuals [
37]. The isohydric–anisohydric framework classifies species along a continuum defined by how tightly midday leaf water potential (
Ψmd) is regulated as predawn water potential (
Ψpd) declines: isohydric species maintain constant
Ψmd via aggressive stomatal closure, whereas anisohydric species allow
Ψmd to track
Ψpd, sustaining transpiration at greater hydraulic risk [
20]. Although these frameworks address complementary aspects of water regulation, they have rarely been tested jointly across an explicit age gradient in Mongolian pine. Whether mature trees behave as the hydraulic limitation hypothesis predicts, and whether young and mature stands occupy distinct positions on the isohydric-anisohydric continuum, therefore remain open and practically important questions.
Because direct porometric measurement of
gs is logistically impractical for tall trees across a full growing season, canopy-scale
gs is commonly inferred by inverting the Penman-Monteith equation using continuous sap-flow-derived transpiration coupled with meteorological observations [
24,
31,
32]. The reliability of this inversion depends on the degree of aerodynamic canopy-atmosphere coupling, evaluated with the dimensionless decoupling coefficient Ω: values near zero indicate that transpiration is governed primarily by stomatal regulation and VPD, whereas values near one indicate radiation-dominated, poorly coupled conditions [
31]. Applying this framework systematically across stand developmental stages alongside cross-correlation time-lag analysis provides an ecophysiological characterization of the degree of canopy-atmosphere coupling and water-regulation dynamics under the adopted big-leaf model assumptions.
To address these gaps, the present study conducted synchronous, high-frequency measurements of sap flow, meteorological variables, and leaf and soil water potential in adjacent 41-year-old mature and 13-year-old young Mongolian pine stands at Zhanggutai throughout the 2024 growing season. Three working hypotheses were formulated: (H1) the young stand, with its shallower, surface-concentrated root system and more open canopy, would show proportionally larger sap-flow responses to small-to-moderate rainfall pulses than the mature stand, whose deeper roots buffer against short-term surface-moisture fluctuations; (H2) VPD and photosynthetically active radiation would be the dominant drivers of transpiration in both stands, with sap flow tracking these drivers after a short, near-synchronous lag and with tight canopy–atmosphere coupling, indicating transpiration governed primarily by stomatal regulation; (H3) mature and young stands would occupy different positions along the isohydric-anisohydric continuum, and their gs, transpiration, and water-potential relationships would not conform to the size-dependent decline predicted by the hydraulic limitation hypothesis, indicating that iso/anisohydric behavior is shaped by the interaction between stand age and environment rather than being a fixed species trait. Three objectives were accordingly defined: (i) to characterize how individual-tree and canopy-scale transpiration, and their responses to discrete rainfall events, differ between stands across the growing season (testing H1); (ii) to identify dominant environmental drivers of sap flow, quantify time-lag relationships, and assess canopy-atmosphere coupling via gs and Ω in both stands (testing H2); and (iii) to characterize stomatal- and water-potential-based water-regulation strategies and evaluate conformity to the hydraulic limitation hypothesis (testing H3).
By jointly addressing these objectives, this study aims to clarify how transpiration and stomatal water-regulation strategies of Mongolian pine evolve across the young-to-mature transition, to evaluate the applicability of the hydraulic limitation hypothesis in this system, and to provide a physiological basis for water-oriented, age-differentiated silvicultural management and for the selection of water-use-efficient genotypes in future shelterbelt renewal.
2. Materials and Methods
2.1. Study Area and Plot Design
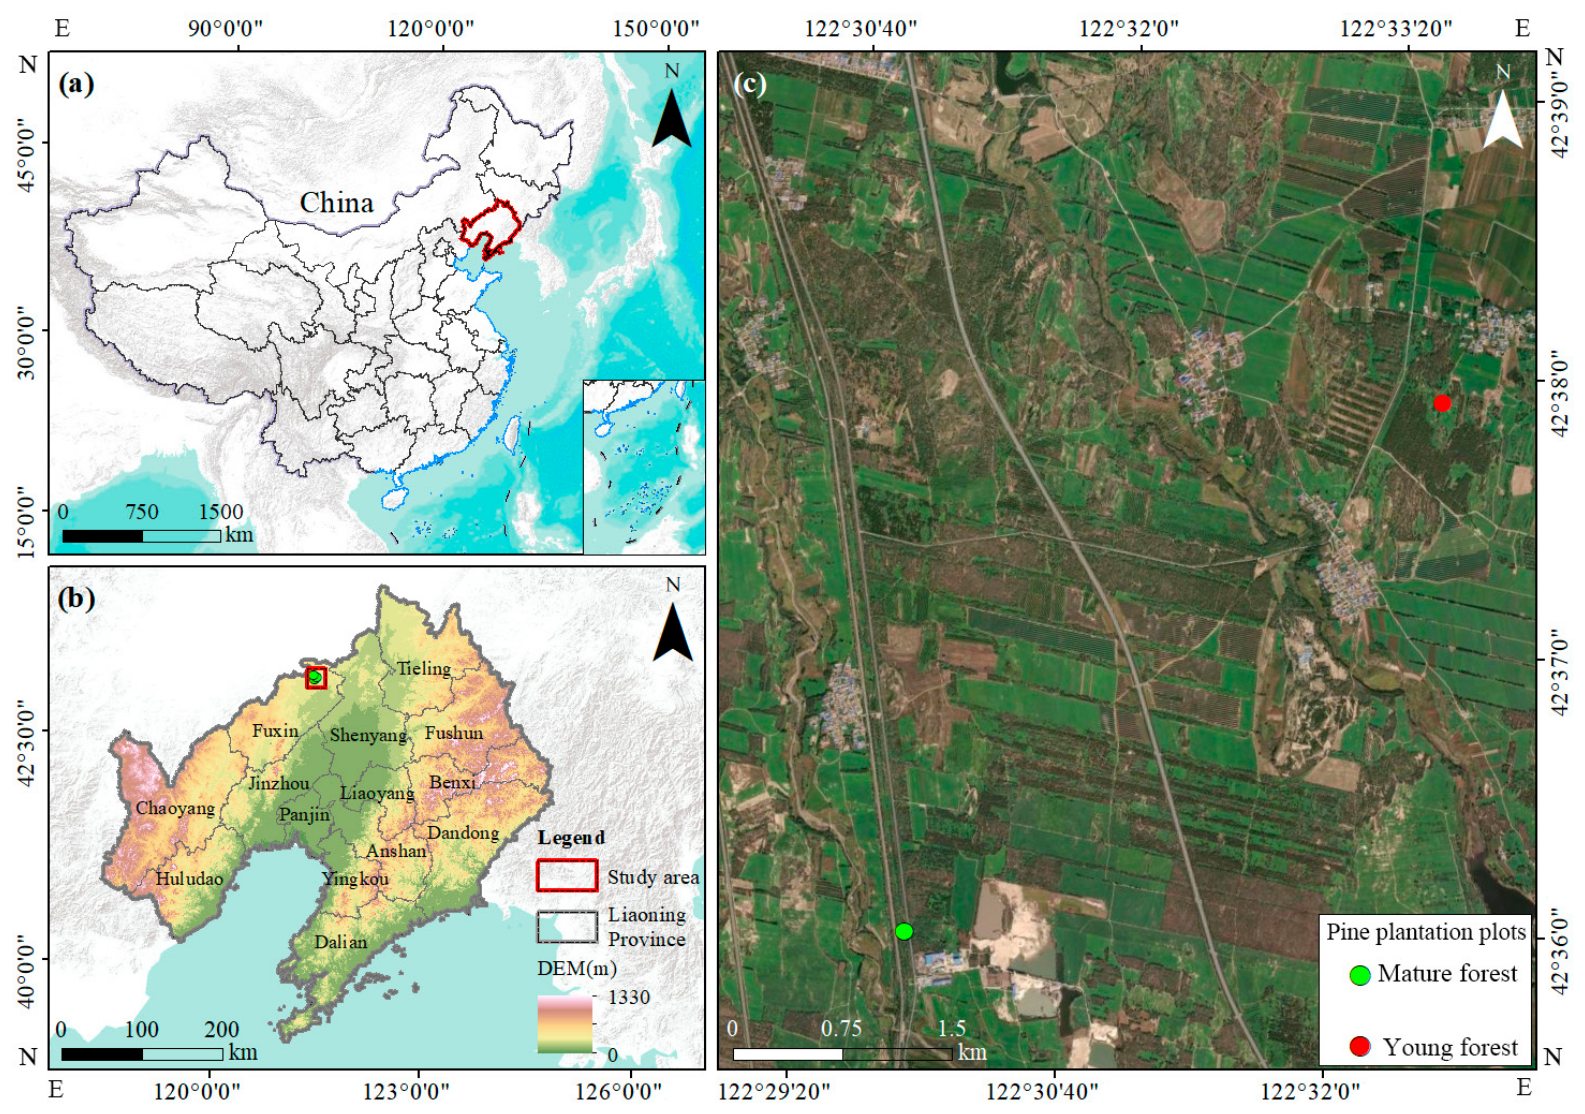
The study area is situated in Zhanggutai Town, Zhangwu County, Fuxin City, Liaoning Province (mature stand: 122.4917° E, 42.6000° N; young stand: 122.5472° E, 42.6333° N;
Figure 1a–c), on the southern margin of the Horqin Sandy Land-China’s largest sandy region and a critical front line against southward desertification advance. The region lies at a mean elevation of 185 m and experiences a semi-arid to semi-humid continental monsoon climate, characterized by a mean annual temperature of 9.9 °C (July maximum 32.6 °C; February minimum −23.7 °C), mean annual precipitation of 474.8 mm (concentrated from June to September), mean annual evaporation of 388.2 mm, mean annual wind speed of 1.2 m·s
−1, and mean annual relative humidity of 62%. Soils are aeolian sandy in texture, with low water-holding capacity and high permeability conditions that make episodic rainfall the primary source of plant-available moisture and render the ecosystem acutely sensitive to precipitation variability.
Zhanggutai holds particular historical and ecological significance. Prior to 1949, desertified land accounted for 96% of Zhangwu County’s total area (524.2 thousand hectares), and the county was renowned as Liaoning’s “wind gap” and “sand pocket.” In 1952, China’s first sand-control research station was established here, and in 1955 the country’s first artificially planted Mongolian pine sand-fixation forest was successfully established at Zhanggutai, pioneering the large-scale use of this species for desertification control [
1,
2,
38,
39]. The technique subsequently spread nationwide, with Mongolian pine becoming the cornerstone species of the “Three-North” Shelterbelt Program across more than 6.7 million hectares, and Zhanggutai’s afforestation model disseminated from Liaoning to the rest of China and internationally [
2]. Today, Zhanggutai supports stands spanning several decades of age, providing a rare opportunity to study age-dependent water-use dynamics within a single, ecologically pivotal species under identical climatic and edaphic conditions.
Guided by the dual goals of ecological protection and wind erosion/sand fixation, local afforestation has consistently prioritized cold- and drought-tolerant species, with Mongolian pine as the most representative pioneer [
1]. Two pure Mongolian pine stands a 41-year-old mature stand and a 13-year-old young stand were selected as study plots, enabling direct comparison of transpiration characteristics and water-regulation strategies across the young-to-mature transition under equivalent regional climate and soil conditions.
In 2024, two permanent 30 m × 30 m sample plots were established on flat aeolian sandy terrain free of surface runoff, approximately 5.2 km apart, sharing similar soil conditions, microclimate, and regional topography. The experimental design comprised a 41-year-old mature stand (planted 1983; density: 325 stems·ha
−1) and a 13-year-old young stand (planted 2011; density: 900 stems·ha
−1). In semiarid sandy plantations,
P. sylvestris var.
mongolica reaches structural and physiological maturity at approximately 35–40 years under prolonged edaphic water limitation [
1,
3,
6,
29]; consistent with Chinese forestry inventory standards (LY/T 2001; GB/T 26424) (
https://openstd.samr.gov.cn/bzgk/std/newGbInfo?hcno=18D1658E2885CD74F5976BEA0A3B2991) (accessed on 1 June 2011) and established regional shelterbelt literature [
1,
6,
28], the two stands represent canonical mature and young plantation developmental stages, respectively. It is acknowledged that the higher density of the young stand (900 stems·ha
−1) relative to the mature stand (325 stems·ha
−1) introduces structural differences including canopy closure and root competition that co-vary with stand age; comparisons between plots therefore reflect the combined effects of tree age, size, and stand density.
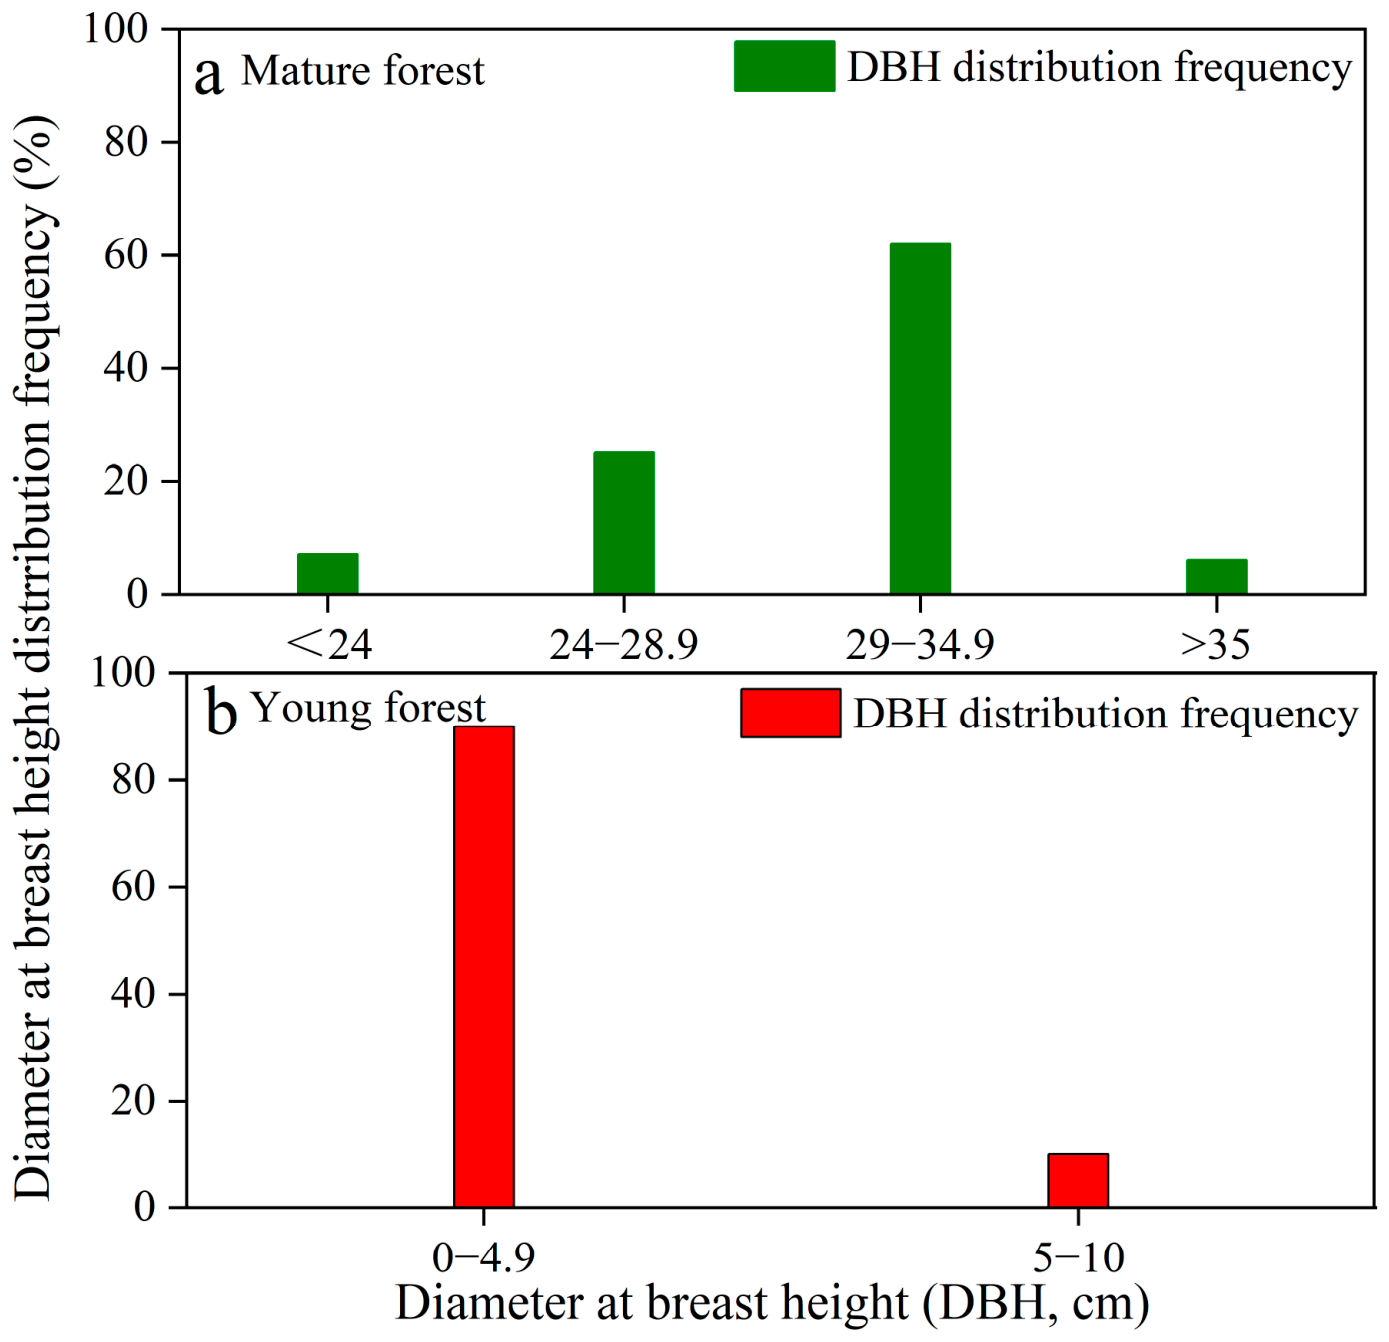
The DBH and tree-height frequency distributions of both stands are presented in
Figure 2.
2.2. Sample Tree Selection
To characterize individual-tree transpiration, nine sample trees were selected per stand from the dominant DBH classes identified in the stand inventory (
Figure 2). In the mature stand, three trees were drawn from the 24–28.9 cm DBH class and six from the 29–34.9 cm DBH class; in the young stand, six trees were drawn from the 0–4.9 cm class and three from the 5–10 cm class. All selected trees were visually healthy, free from pest infestation or disease, and had developed without intensive management since planting. For each tree, DBH was measured at 1.3 m with a diameter tape (±0.1 cm), total height with a laser hypsometer, and sapwood area estimated from stand-specific DBH-sapwood area allometric equations developed from 26 destructively sampled trees per stand (
Section 2.3). Mean tree height, DBH, and sapwood area were 17.59 m, 30.31 cm, and 421.60 cm
2 for the mature stand, and 2.63 m, 4.73 cm, and 15.06 cm
2 for the young stand, respectively (
Table S1). The nine instrumented trees in each plot provide within-stand replication to capture individual-level physiological variability, rather than independent stand-level replication.
2.3. Sap-Flow Measurements and Leaf Area Index Observation
Sap flow was measured continuously using thermal dissipation probe (TDP) systems (SF-G model, Ecomatik GmbH, Munich, Germany). Probe length was matched to the sapwood depth of each stand: 30 mm probes (diameter 1.2 mm, heating current 120 mA, power 0.2 W) were deployed in the 41-year-old mature stand (mean sapwood depth 58.4 ± 6.2 mm), and 10 mm mini-probes (diameter 1.2 mm, heating current 40 mA) in the 13-year-old young stand (mean sapwood depth 12.3 ± 2.1 mm), ensuring that sensors were fully encapsulated within active conducting sapwood and did not penetrate into heartwood. In the young stand, the 10 mm sensor sampled nearly the entire radial sapwood depth (mean DBH 4.73 cm), whereas in the mature stand (mean DBH 30.31 cm), measurements characterized the outer, hydraulically dominant xylem layer.
All probes were installed on the shaded, north-facing side of the stem at breast height (1.3 m) to minimize natural ambient temperature gradients (Δ
Tnat) arising from direct solar radiation, a known source of systematic bias in thermal dissipation measurements in the Northern Hemisphere [
10]. Prior to installation, outer bark was carefully shaved without damaging functional phloem. Pre-drilled guide holes received aluminum tubes coated with thermally conductive silicone grease to minimize contact resistance between probe and wood. The upper probe served as the continuously heated element, while the lower reference probe recorded ambient wood temperature. The entire probe assembly and the surrounding stem section were encased in multi-layered reflective aluminum foam jackets sealed with waterproof tape to eliminate direct solar heating artifacts and suppress ambient temperature fluctuations. Data were sampled every 60 s and stored as 10-min averages.
Sapwood area (SA) is a critical scaling variable because it integrates the cross-sectional area of the active water-conducting pathway and is closely correlated with leaf area and whole-tree hydraulic capacity [
10]. To avoid destructive sampling of instrumented trees, 26 additional trees per stand were harvested from areas immediately adjacent to, but outside the two permanent plots under identical soil and topographic conditions. A stem disc was collected at breast height (1.3 m) from each harvested tree. The boundary between sapwood and heartwood was identified visually on the freshly cut cross-section by contrasting the translucent, moist sapwood with the darker, drier heartwood; sapwood annulus width was then measured along two perpendicular diameters with a digital caliper (precision ±0.01 mm). Bark thickness (
db) and sapwood thickness (
ds) were recorded for each disc, and SA was computed geometrically as:
where
r = DBH/2 is the stem radius at breast height.
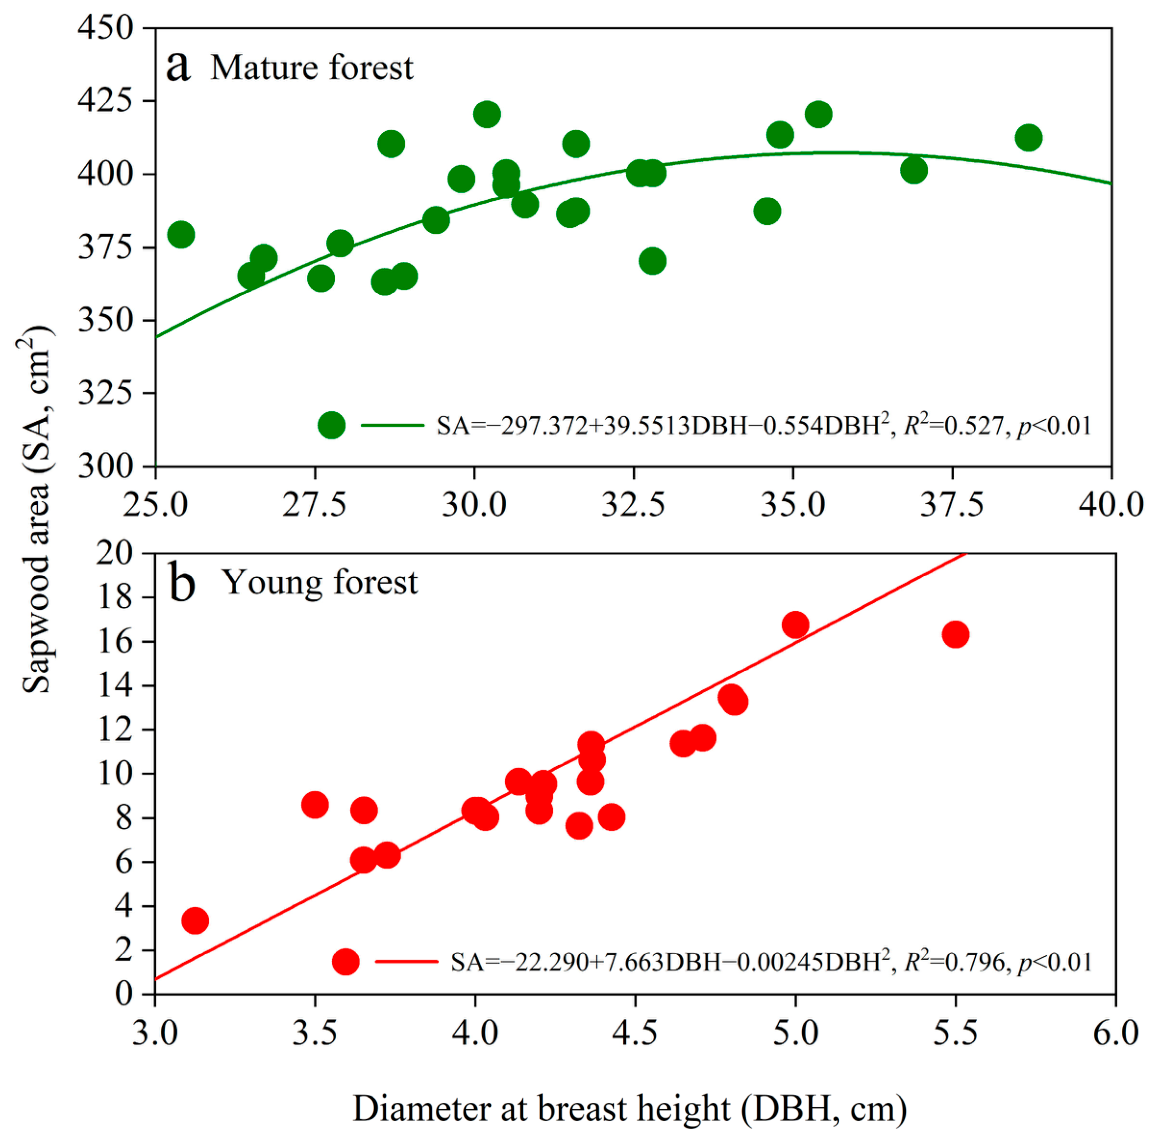
Stand-specific DBH-SA allometric equations were fitted to these paired measurements: For the mature stand, SA = −297.372 + 39.5513DBH−0.554DBH
2 (
R2 = 0.527,
p < 0.01;
Figure 3a). For the young stand, SA = −22.290 + 7.663DBH−0.00245DBH
2 (
R2 = 0.796,
p < 0.01;
Figure 3b). These equations were subsequently applied to each monitored sample tree using its measured DBH to estimate individual SA values (
Table S1).
Data were sampled every 60 s and 10-min averages were recorded. Sap-flow density (
Js, g·m
−2·s
−1) was calculated as follows [
10]:
where Δ
TM is the maximum temperature difference at zero flow, and Δ
T is the instantaneous measured temperature difference [
10]. Expressing the coefficient as 119 yields
Js directly in g·m
−2·s
−1 (equivalent to 0.0119 g·cm
−2·s
−1) [
10].
To eliminate sensor offset and long-term signal drift, a dynamic nocturnal baseline correction was applied: Δ
TM was recalibrated every seven days by extracting the maximum temperature difference recorded between 01:00 and 05:00 on nights with dense cloud cover or high relative humidity, during which VPD remained below 0.05 kPa for at least two consecutive hours—conditions under which transpiration demand is negligible and sap flow can be assumed to be at or near zero [
10,
11,
12].
Whole-tree daily water consumption (
Wtree, L·d
−1) was obtained by integrating 10-min
Js values over a continuous 24-h cycle (00:00–24:00) and multiplying by sapwood area:
where
Js,t is the 10-min average sap flux density (g·m
−2·s
−1), SA is the tree sapwood area (m
2), Δt = 600 s is the measurement time interval,
ρw = 1.0 kg·L
−1 is the density of water, and 1000 converts grams to kilograms.
Individual-tree transpiration rate (
EL, mm·d
−1) was calculated as:
where
Cd is the crown projection area of the sample tree (m
2) and ρ is the density of water (g·L
−1). Because 1 L·m
−2 ≡ 1 mm,
EL is expressed directly in mm·d
−1.
The stand-scale canopy transpiration rate (
EA, mm·d
−1) was calculated as follows:
where
Nstand is the total number of stems in the sample plot,
Wtree, i is the daily water consumption of tree i estimated from DBH-SA allometric regressions, and
Aplot = 900 m
2 (30 m × 30 m) is the plot ground area.
To contextualize stand-scale transpiration estimates and interpret between-stand differences in canopy water use, leaf area index (LAI, m
2·m
−2) was measured monthly from May to October throughout the 2024 growing season. All measurements were conducted under diffuse light conditions (at dawn or dusk, solar zenith angle > 75°) using an optical plant canopy analyzer (LAI-2200C, LI-COR Biosciences, Lincoln, NE, USA), with five spatially representative sampling points distributed evenly within each 30 m × 30 m plot following a systematic grid design. Monthly LAI values for both stands are reported in
Table S2.
The mature stand maintained consistently higher LAI than the young stand across all measurement months (
Table S2), reflecting the substantially greater needle biomass, larger crown dimensions, and more complex multilayered canopy architecture accumulated over four decades of stand development. This structural contrast provides an important mechanistic context for interpreting the observed differences in canopy transpiration (
EA) between stands: greater LAI increases the total evaporative surface area and enhances aerodynamic canopy-atmosphere coupling, both of which amplify the sensitivity of transpiration to atmospheric demand. The LAI data thus serve a dual function as a structural covariate in the interpretation of transpiration drivers and as independent evidence that the two stands occupy distinct ontogenetic stages, complementing the DBH and tree-height distributions presented in
Figure 2.
2.4. Meteorological Monitoring
Continuous meteorological data were recorded at 10-min intervals throughout the 2024 growing season using an automatic weather station (HOBO U30, Onset Computer Corporation, Bourne, MA, USA) installed in an open clearing approximately 70 m from the monitored plots, at a measurement height of 2.0 m above the ground surface. The station recorded air temperature (Ta, °C), relative humidity (RH, %), wind speed (Ws, m·s−1), photosynthetically active radiation (PAR, μmol·m−2·s−1), and precipitation (P, mm). All daily mean values were computed by averaging 10-min readings over the full 24-h cycle (00:00–24:00), synchronized with sap-flow logging intervals to enable time-resolved analysis of transpiration-environment coupling.
2.5. Soil Moisture Monitoring and Gravimetric Conversion
Soil volumetric water content (θv, cm3·cm−3) was monitored continuously at 10-min intervals using calibrated soil moisture sensors (HH2/ML2x, Dynamax Inc., Cambridge, UK). In each plot, three spatially distributed sensor sets were installed at depths of 0–20 cm, 20–40 cm, and 40–60 cm to characterize the vertical moisture profile across the root zone. Sensor logging was synchronized with sap-flow and meteorological records throughout the growing season.
To facilitate comparison with gravimetric field measurements and integration into water-balance calculations,
θv was converted to gravimetric soil water content (
θm, g·g
−3, %) as:
where
ρb is the soil bulk density of the aeolian sandy soil measured in situ using soil core sampling (1.45 g·cm
−3);
ρw is the density of water, which is taken as 1.0 g·cm
−3 at room temperature.
Vapor pressure deficit (VPD, kPa) was calculated as follows [
30]:
where
es is the saturation vapor pressure (kPa),
ea is the actual vapor pressure (kPa). Computing VPD directly from the collocated station ensured temporal consistency with sap-flow and soil moisture records.
Reference evapotranspiration (
ET0, mm·d
−1) was calculated using the standardized FAO-56 Penman-Monteith equation [
30].
where
Rn is net radiation at the crop surface (MJ·m
−2·d
−1), G is soil heat flux density (MJ·m
−2d
−1),
Ta is mean daily air temperature at 2 m height (°C),
u2 is wind speed at 2 m height (m·s
−1), Δ is the slope of the saturation vapor pressure curve (kPa·°C
−1), and
γ is the psychrometric constant (kPa·°C
−1). The reference surface corresponds to a hypothetical, well-watered short-grass canopy (
h = 0.12 m) with a fixed bulk surface resistance of
rs = 70 sm
−1 and a surface albedo of α = 0.23 [
30]. For this standardized surface, the zero-plane displacement height and roughness lengths are defined as
d = 2/3
h = 0.08 m,
z0 m = 0.123
h = 0.0148 m, and
z0 h = 0.1
z0 m = 0.00148 m; the aerodynamic resistance (
ra = 208/
u2) and the wind function coefficient (0.34
u2) are embedded directly in the empirical constants of Equation (9) under the assumption of neutral atmospheric stability [
30]. Because the weather station measurement height matched the FAO-56 reference height of 2.0 m, no logarithmic wind-profile adjustment was required.
It must be emphasized that ET0 characterizes the evaporative demand of a standardized hypothetical grass surface, not the actual potential evapotranspiration of the tall pine forest. In this study, ET0 was employed strictly as an independent, standardized meteorological benchmark to quantify macroclimatic evaporative forcing and to decouple atmospheric demand from canopy and soil moisture constraints across the growing season. Stand-specific aerodynamic resistances and canopy conductances were derived separately from sap-flow inversion of the Penman-Monteith equation.
2.6. Leaf and Soil Water Potential Measurements
To characterize the full diurnal trajectory of plant–soil hydraulic status and to capture seasonal variation in water-regulation strategy, leaf water potential (Ψleaf, MPa) and soil water potential (Ψsoil, MPa) were measured concurrently on two representative clear days: 16 July 2024 (mid-growing season) and 19 September 2024 (late growing season). Measurements were made hourly from predawn (04:30 h) through midday (12:00 h) to dusk (20:00 h), yielding 16 time steps per day and capturing the full dynamic range from near-zero transpiration demand at predawn to peak hydraulic stress at midday. On each measurement day, three fixed sample trees per plot were repeatedly sampled (n = 3 biological replicates per stand), all pre-selected from among the sap-flow monitored trees to enable direct integration of water-potential data with concurrent transpiration records. Predawn leaf water potential (Ψpd) and midday leaf water potential (Ψmd) were extracted from these diurnal profiles as the key hydraulic benchmarks for subsequent iso/anisohydric classification.
At each hourly time step, mature, fully expanded, and visually healthy needle clusters were harvested from the first whorl of sunlit branches in the upper outer canopy of the three target trees per stand. Sampling was restricted to the upper outer canopy to ensure uniform light exposure and to minimize within-canopy microenvironmental variation across trees and measurement dates. Immediately upon selection, target needle clusters were enclosed in humidified, darkened, sealable plastic bags (containing moistened paper towel) to arrest transpirational water loss during transport; clusters were then excised with a single clean razor-blade cut and transferred to an insulated cool box. All samples were measured within 10–15 min of excision to prevent equilibration artifacts. Ψleaf was determined using a Scholander-type pressure chamber (Model 1505D-EXP, PMS Instrument Company, Albany, OR, USA; measurement range: 0 to −10 MPa). Three technical replicates were processed per tree at each time step, and the mean of the three readings was taken as the representative Ψleaf value for that tree, yielding a stand-level mean (n = 3 trees) at each hourly interval.
Concurrent with leaf sampling, soil water potential was measured in situ across the primary root zones of the sampled trees using dielectric water potential sensors (TEROS 21, METER Group Inc., Pullman, WA, USA). In each plot, sensors were arranged in a five-point spatial sampling design at four depths of 20 cm, 40 cm, and 60 cm to resolve the vertical hydraulic gradient across the active root zone and to establish a direct linkage between soil moisture availability and root water uptake. Soil temperature was recorded simultaneously at each sensor depth to apply manufacturer-specified temperature compensation to raw water potential readings. All TEROS 21 sensors were fully factory-calibrated prior to deployment and maintained in a consistent operational state throughout the measurement campaign. The resulting soil water potential profiles, integrated with concurrent Ψ~leaf~ records and sap-flow data, enabled a mechanistic assessment of soil-plant hydraulic connectivity and provided the empirical basis for quantifying iso/anisohydric behavior across stand ages (
Section 2.8).
2.7. Time-Lag Analysis
To quantify the asynchronous response and hysteresis effects between plant water use and environmental drivers, a cross-correlation analysis (CCF) was performed to determine the time lag between sap flow (or sap flux density) and key meteorological factors, VPD and PAR. The sap flow data series was systematically shifted against the environmental data series at 10-min intervals within ±120 min window. The time displacement that yielded the maximum cross-correlation coefficient (
RCCF) was identified as the optimal time-lag characterization. A positive time lag indicates that environmental factors changed ahead of sap flow activation, whereas a negative time lag implies that sap flow initiated prior to atmospheric driving forces. To eliminate the influence of these time-lag/hysteresis effects on subsequent physiological modeling, the time series of environmental variables (VPD, PAR) were mathematically aligned by shifting them backward according to their respective optimal lag times before calculating
gs and performing regression analyses. This alignment effectively synchronized the water-use data with the meteorological drivers, preventing the under- or over-estimation of stomatal conductance during rapid transitional periods [
10,
11,
12].
2.8. Stomatal Conductance, Atmospheric Decoupling, and and Vapor Pressure Deficit Sensitivity
Quantifying stomatal conductance (
gs) via Penman–Monteith inversion requires prior estimation of canopy aerodynamic conductance (
ga, m·s
−1), which characterizes the efficiency of turbulent momentum and scalar transport between the canopy surface and the overlying atmosphere. Under the assumption of neutral atmospheric stability,
ga was derived from logarithmic wind-profile theory [
31,
32]:
where
ra is aerodynamic resistance (s·m
−1),
zm is the wind measurement height (m), d is zero-plane displacement height (m),
zom is roughness length for momentum (m),
zoh is roughness length for heat/water vapor transfer (m), k = 0.41 is von Kármán’s constant, and
uz is wind speed at height
zm (m·s
−1). Stand-specific canopy structural parameters were derived from mean canopy height (
h): 17.59 m for the mature stand and 2.63 m for the young stand, following established parameterization conventions [
31,
32]:
Because the weather station was mounted at 2 m above the ground surface well below the canopy top of the mature stand (mean height 17.59 m), wind speed recorded at 2 m was extrapolated to canopy height using a logarithmic wind-profile function prior to computing
ga for the mature stand [
30]. For the young stand (mean height 2.63 m), the measurement height was approximately comparable to canopy height, and no extrapolation was required. Aerodynamic conductance in m·s
−1 was subsequently converted to molar units (mmol·m
−2·s
−1) using ambient air density and molar volume at measured temperatures [
31].
Under the big-leaf framework, canopy stomatal conductance (mmol·m
−2·s
−1) represents the integrated, flux-weighted gas-exchange capacity of all foliage distributed throughout the crown [
31,
32]. Assuming that: (i) canopy aerodynamic conductance substantially exceeds
gs, so that boundary-layer resistance is negligible relative to stomatal resistance; (ii) root-to-canopy water transport operates under quasi-steady-state conditions, with total hydraulic resistance low enough to sustain near-instantaneous supply; and (iii) dynamic stem internal water storage release and capacitance buffering are negligible over daily timescales [
27,
31,
32],
gs was calculated by inverting the simplified Penman-Monteith equation [
13,
24,
31]:
where
EL is individual-tree transpiration (mm·d
−1),
Rv = 0.462 kPa·m
3·kg
−1·K
−1 is the specific gas constant for water vapor,
Ta is absolute air temperature (K), VPD is vapor pressure deficit (kPa), and
Vm is the molar volume of an ideal gas at ambient temperature (m
3·mol
−1). This formulation yields an effective bulk canopy conductance that integrates the collective responses of needle age classes, vertical light gradients, and branch architectures distributed throughout the entire crown volume [
13,
18].
In practice, tree hydraulic capacitance can induce non-steady-state sap flow, causing basal flux to lag behind crown transpirational demand in the morning (storage depletion phase) and to persist after sunset (storage recharge phase) [
40,
41,
42]. To minimize capacitance-induced hysteresis artifacts in the
gs inversion, VPD and PAR time series were time-lag aligned with sap-flow records prior to inversion, based on the optimal cross-correlation lag time (±10 min) determined independently for each stand (
Section 3.2). This correction ensures that instantaneous
EL and VPD observations are temporally matched, satisfying the quasi-steady-state assumption embedded in Equation (15) [
10,
11,
12].
It must be emphasized that
gs estimated via Equation (15) represents an inferred canopy-scale stomatal conductance derived indirectly from sap flux density rather than direct porometric or leaf-level gas-exchange measurements. Its validity rests on three biophysical prerequisites: negligible internal water storage, minimal hydraulic resistance relative to boundary-layer resistance, and tight canopy-atmosphere coupling. As demonstrated in
Section 3.2, within this operational framework, the calculated decoupling coefficients (Ω = 0.177 and 0.256 for the older and young stands, respectively) indicate that under the prescribed aerodynamic parameterization, canopy transpiration in both stands was primarily aligned with VPD-driven stomatal control rather than radiation-dominated regimes.
The Ω quantifies the relative sensitivity of canopy transpiration to marginal changes in
gs versus net radiation, thereby describing the degree to which canopy water loss is governed by stomatal regulation (Ω → 0) or by available energy (Ω → 1) [
31,
32,
43]. Ω was computed from the equilibrium transpiration rate (
Eeq), the theoretical rate for a perfectly coupled, extensively wet surface in energy balance, and the imposed transpiration rate (
Eimp), which reflects the VPD-driven component of water loss [
31]:
where Δ is the slope of the saturation vapor pressure–temperature curve (kPa·°C
−1), γ is the psychrometric constant (kPa·°C
−1),
Rn—
G is available energy (MJ·m
−2·d
−1), λ is the latent heat of vaporization (MJ·kg
−1), and
Kg(
Ta) is the temperature-dependent conductance coefficient (kPa·m
3·kg
−1). Here, Ω serves strictly as a stand-level theoretical metric to characterize the relative sensitivity of canopy water loss to stomatal regulation versus available energy within the Penman-Monteith modeling framework.
To evaluate the robust impact of aerodynamic parameterization on derived gs and Ω, a parameter sensitivity analysis was conducted. The zero-plane displacement fraction (α = d/h) and roughness length fraction (β = z0 m/h) were perturbed within their biologically realistic ranges (α = 0.60−0.75, β = 0.08−0.15, representing a ± 20% variation around baseline values). The resulting variation in seasonal mean ga and its cascading effect on Ω and gs were quantified to provide bounded uncertainty ranges for aerodynamic calculations.
To quantitatively compare the divergent impacts of VPD on
gs across different forest ages, a linear-logarithmic function was employed to fit the relationship between
gs and VPD. This model facilitates an effective comparison of stomatal sensitivity across various treatments and species. [
13,
17,
21,
28]:
where
a is the intercept, representing the reference stomatal conductance when VPD = 1 kPa, and
b represents the response slope of stomatal conductance variation with changes in vapor pressure deficit, which serves to evaluate the stomatal sensitivity of Mongolian pine plantations across different forest ages to elevated VPD [
13]. A steeper negative slope indicates greater stomatal responsiveness to rising atmospheric drought stress. This model facilitates direct comparison of stomatal regulation behavior between the mature and young stands, and contextualizes the inferred
gs responses within the broader iso/anisohydric regulatory framework developed in
Section 2.8.
2.9. Plant Water Transport Regulation: Isohydric/Anisohydric Behaviors
Plants require effective mechanisms to regulate water transport at a variety of scales. Here, we adopted a theoretical framework describing plant responses to drying soil based on the relationship between midday (12:00 h) and pre-dawn (05:00–06:00 h) soil water potential. The intercept of the relationship (Λ) characterizes the maximum transpiration rate per unit of hydraulic transport capacity, whereas the slope (σ) measures the relative sensitivity of plant water potential to declining water availability [
20].
The relationship between the pre-dawn soil and midday water potentials, according to the theoretical model mentioned above, assumes a linear relationship. Four different behaviors are depicted, all sharing the same intercept (Λ): strict isohydric (σ = 0), partial isohydric (0 < σ < 1), near-strict anisohydric (σ = 1), and extreme anisohydric (σ > 1). For isohydric behaviors,
Ψpd =
Ψmd; while for anisohydric relationships,
Ψmd represents the point at which plant hydraulic conductance is completely lost [
20]. Importantly, Isohydric species are characterized by tighter stomatal closure, whereas anisohydric species are characterized by avoidance of complete stomatal closure [
20,
21,
22].
2.10. Data Processing and Statistical Analysis
Raw sap-flow, meteorological, soil-moisture, and water-potential data were initially organized, quality-controlled, and pre-processed in Microsoft Excel 2016 (Microsoft Corporation, Redmond, WA, USA), including removal of anomalous records associated with sensor malfunctions, rainfall interference, or incomplete diurnal cycles.
To compare stand-level physiological and environmental variables (e.g., transpiration rates, stomatal conductance, soil water content) between the young and mature stands, independent two-sample
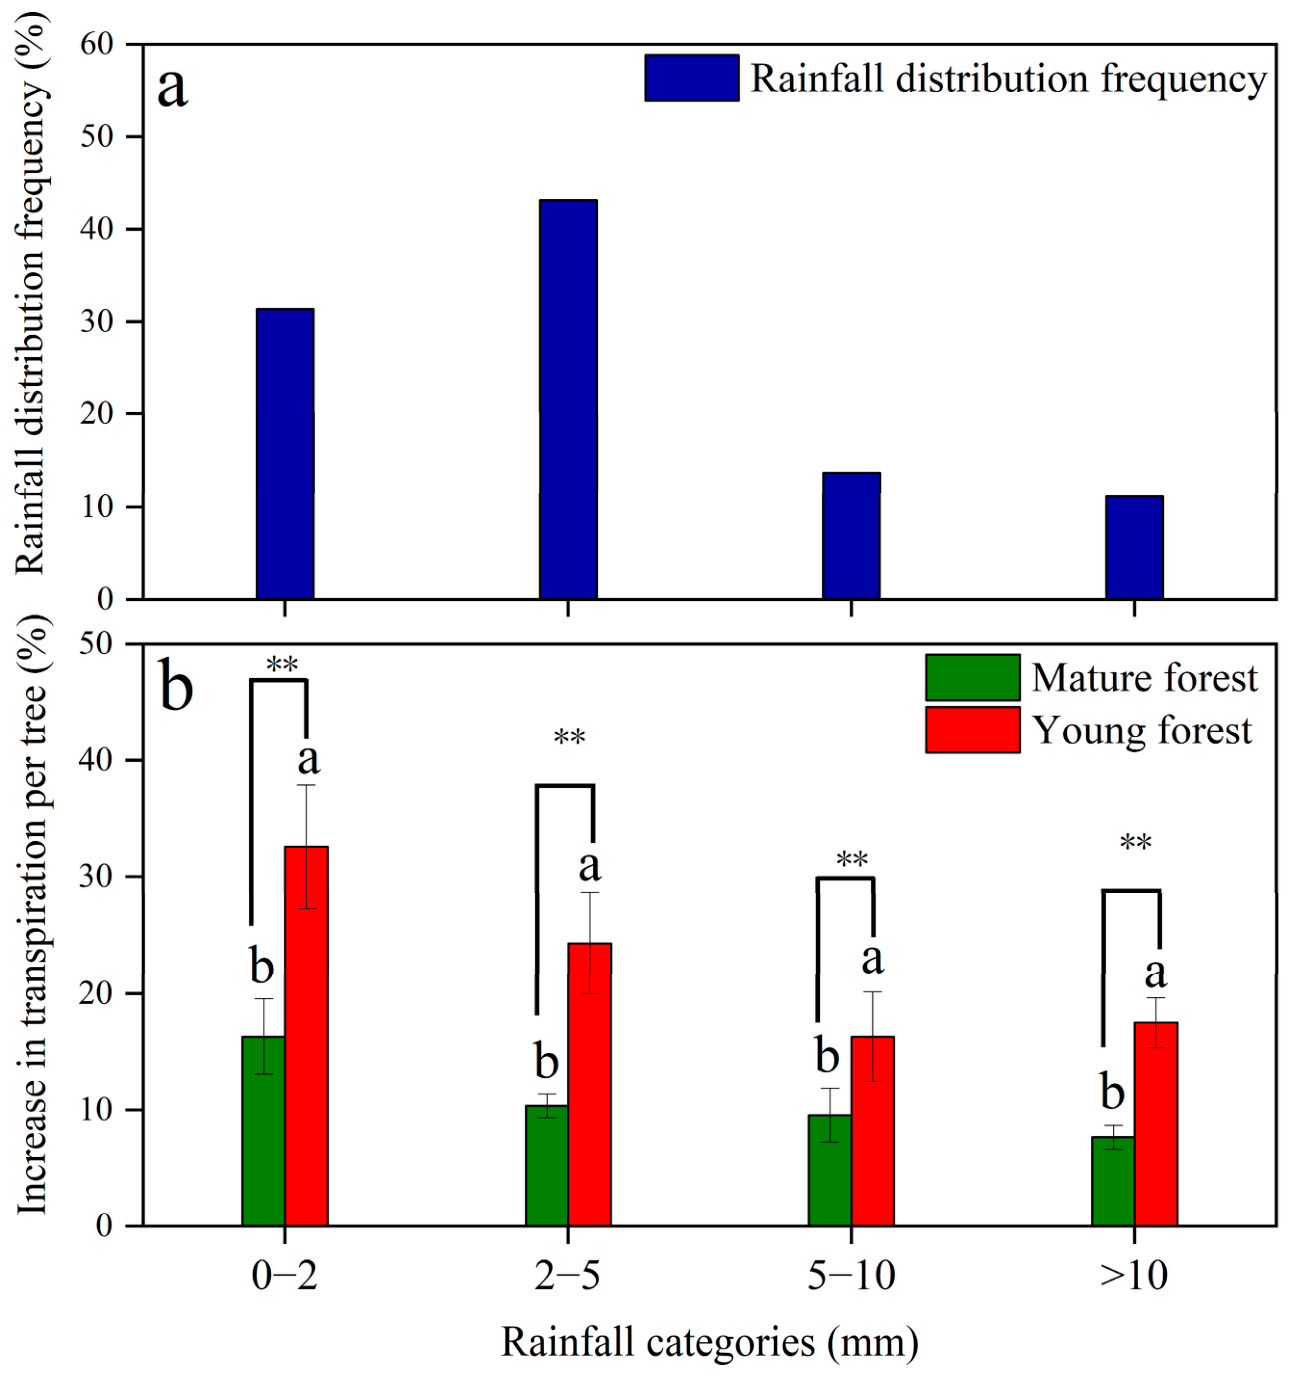
t-tests (Welch’s correction applied where Levene’s test indicated unequal variances) were conducted. The effects of stand type (young vs. mature), discrete rainfall category (0–2 mm, 2–5 mm, 5–10 mm, and >10 mm), and their interactive effects on relative sap-flow increase were evaluated using a two-way Analysis of Variance (ANOVA). Where significant main effects or interactions were detected (
p < 0.05), pairwise comparisons were performed using Tukey’s Honest Significant Difference (HSD) post-hoc test to control the family-wise error rate across multiple comparisons. For rainfall-category comparisons with unequal group variances or sample sizes, Welch’s
t-tests were applied independently for each category pair, with test statistics (
t, degrees of freedom), and exact
p-values explicitly reported in the text (
Section 3.1).
Relationships between canopy transpiration (
EA) and individual environmental drivers (
Ta, RH, VPD,
Ws, PAR,
ET0, and
θm) were characterized using ordinary least squares (OLS) regression, with both linear and nonlinear (quadratic) functional forms evaluated based on residual diagnostics and biological plausibility. Cross-correlation functions (CCF) between sap flux density (
Js) and atmospheric drivers (VPD, PAR) were computed within a symmetric ±120 min window at 10-min resolution to quantify time-lag behavior (
Section 2.6). The optimal lag time defined as the displacement yielding the maximum cross-correlation coefficient (
RCCF) was subsequently applied to temporally align environmental time series with sap-flow records prior to stomatal conductance (
gs) inversion, ensuring quasi-steady-state conditions were satisfied during regression analysis.
Stomatal sensitivity parameters (
gs vs. ln VPD; Equation (21)) and water-potential regulation coefficients (
Ψmd vs.
Ψpd; Equation (22)) were fitted using OLS regression, with the coefficient of determination (
R2), standard errors of regression parameters (SE), and exact
p-values reported for each model. For the isohydric–anisohydric classification, the slope parameter (σ) and its 95% confidence interval were extracted from the fitted linear model to enable rigorous comparison between stand ages (
Section 2.8). The statistical significance of between-stand differences in regression slopes was further assessed using analysis of covariance (ANCOVA), treating stand age as a categorical factor and ln VPD (or
Ψpd) as the continuous covariate.
All statistical analyses were conducted in SPSS Statistics 22.0 (IBM Corp., Armonk, NY, USA) and R (v4.3.1; R Core Team, Vienna, Austria), with regression diagnostics, cross-correlation functions, and graphical outputs produced using the stats, ggplot2, and nlme packages in R (version R 4.3.2). Prior to parametric testing, normality of residuals was assessed using the Shapiro–Wilk test, and homogeneity of variances was verified by Levene’s test; no substantive violations were detected for the primary response variables.
Sample sizes were
n = 9 instrumented trees per stand for sap-flow and transpiration analyses, and
n = 3 biological replicates (trees) per stand per time point for leaf and soil water-potential measurements. Because the nine monitored trees per stand constitute within-stand physiological replicates rather than independent stand-level spatial replicates, all inferential comparisons between stands should be interpreted in the context of this paired single-plot design (see
Section 4.4 for a full discussion of this limitation).
Statistical significance was evaluated at a primary threshold of α = 0.05. Results are designated as statistically significant when p < 0.05 and highly significant when p < 0.01. In all figures and tables, significance levels are indicated using standard notation (* p < 0.05; ** p < 0.01), while exact p-values, test statistics (F, t), and degrees of freedom are explicitly reported in the main text and figure captions where appropriate. Unless otherwise stated, all summary values are presented as Mean ± Standard Error (SE).
4. Discussion
This study addressed three objectives: (1) characterizing how transpiration and rainfall-pulse sensitivity differ between young and mature Pinus sylvestris var. mongolica stands; (2) identifying the environmental drivers, time-lag behavior, and canopy–atmosphere coupling governing transpiration; and (3) characterizing age-dependent stomatal and water-potential regulation strategies, including a test of the hydraulic limitation hypothesis. All three corresponding hypotheses (H1–H3) were supported by the data.
4.1. Transpiration Dynamics and Rainfall-Pulse Response (Objective 1/H1)
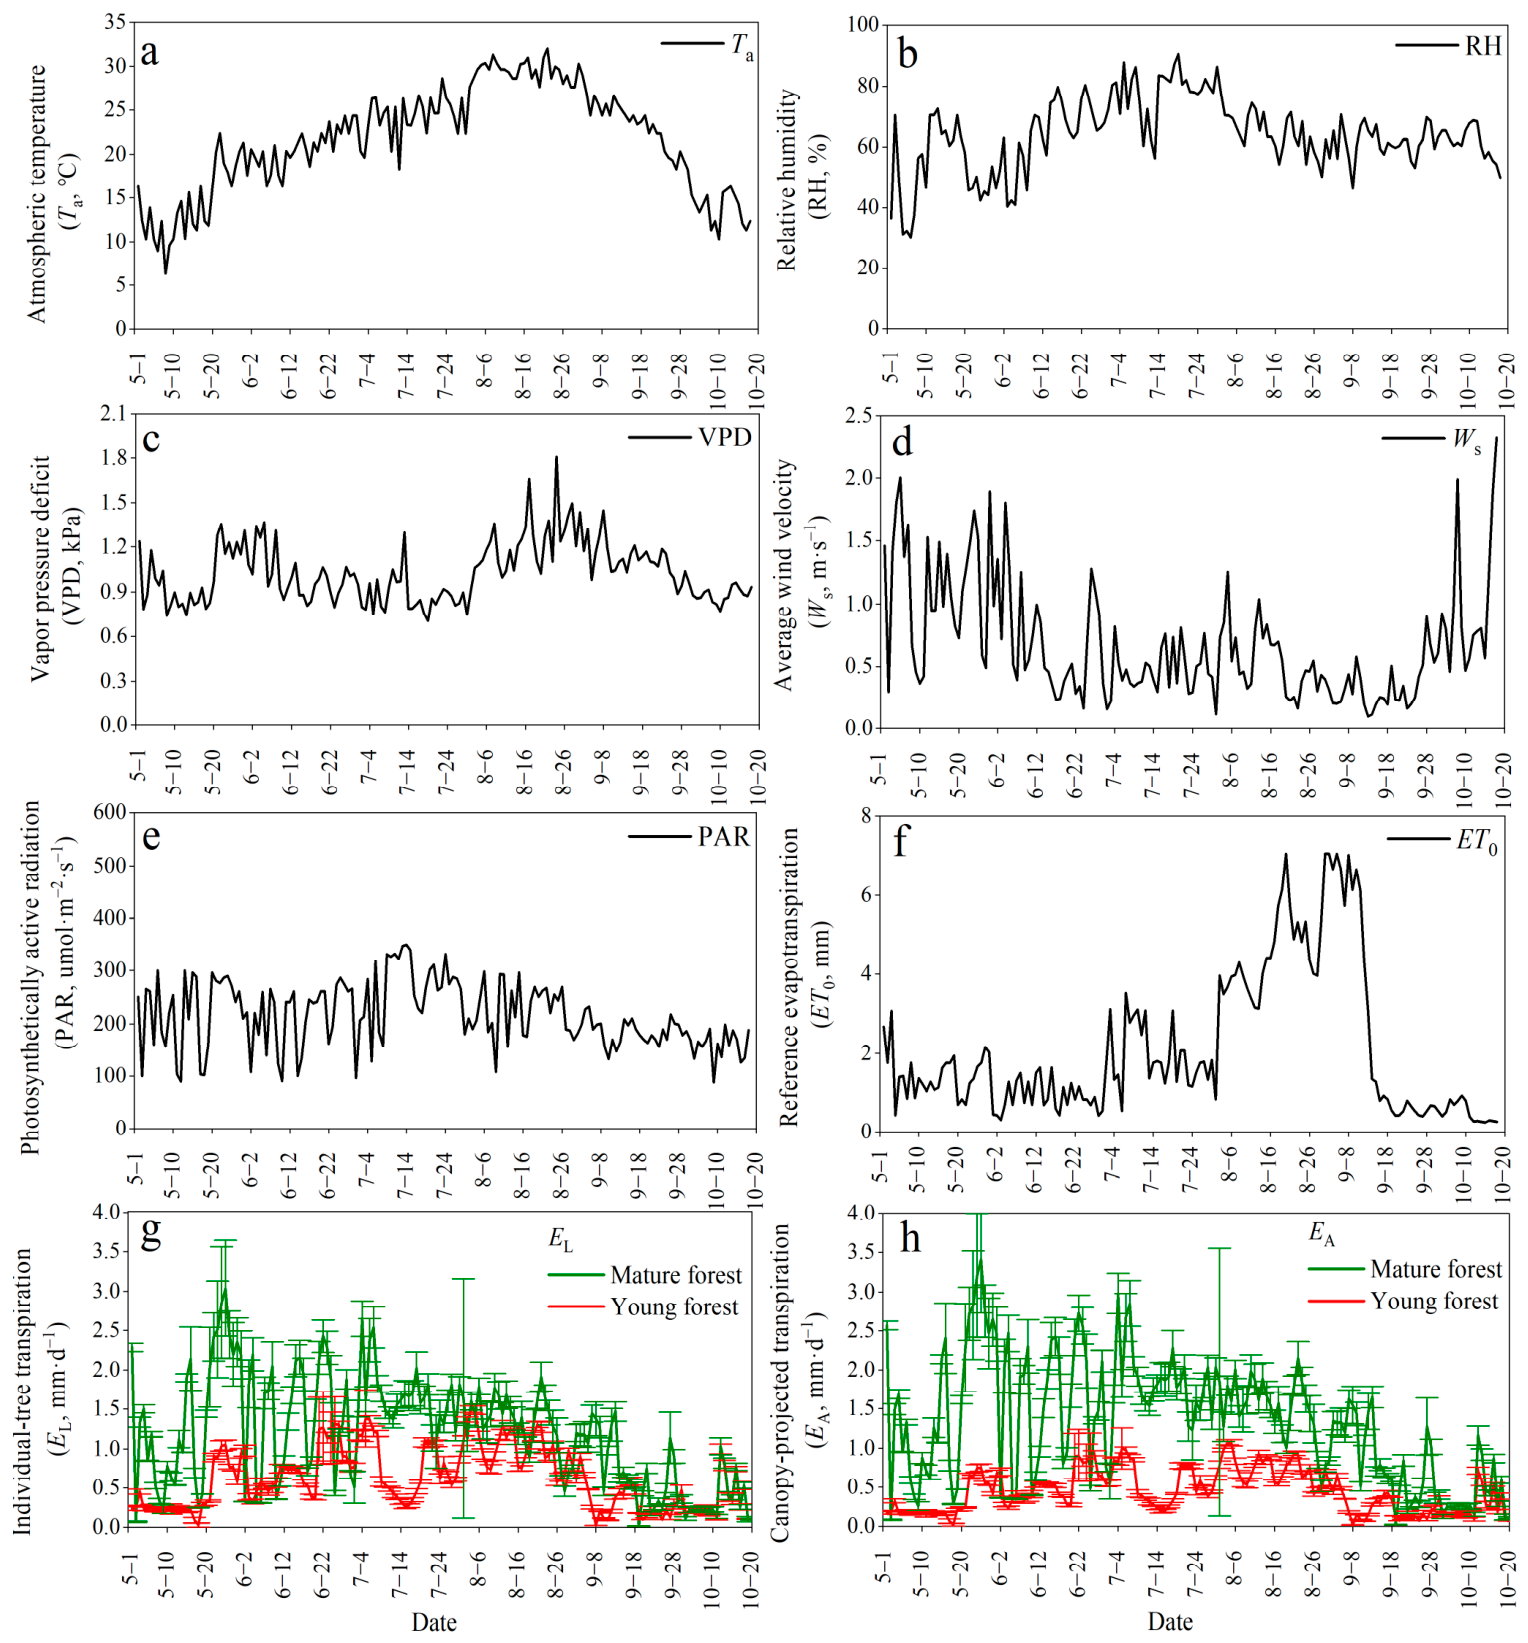
The meteorological conditions recorded during the study period—seasonal means of
Ta = 20.98 °C, VPD = 1.02 kPa,
ET0 = 1.98 m·d
−1, and cumulative precipitation of 437.01 mm are consistent with the warm, semi-arid regime characteristic of the southern Horqin Sandy Land [
40,
41,
46,
47]. Against this shared atmospheric background, the two stands diverged sharply in transpiration magnitude: mean individual-tree transpiration (
EL) was 2.36 mm·d
−1 in the mature stand versus 0.90 mm·d
−1 in the young stand, and canopy-projected transpiration (
EA) was 1.35 and 0.44 mm·d
−1, respectively. The young stand exhibited a clear unimodal seasonal pattern, whereas the mature stand sustained consistently elevated transpiration throughout the growing season, indicating that both individual hydraulic capacity and canopy-scale water-transport intensity increase progressively with stand age. These values fall within the range reported for coniferous and broadleaf plantations across dryland and temperate settings [
14,
40,
41,
48], but exceed those of Scots pine stands in northeastern Germany and central Siberia by a margin broadly proportional to the higher
Ta, VPD, PAR, and soil moisture at our site, consistent with the well-established positive relationship between atmospheric water demand and transpiration intensity [
2,
3,
12,
18].
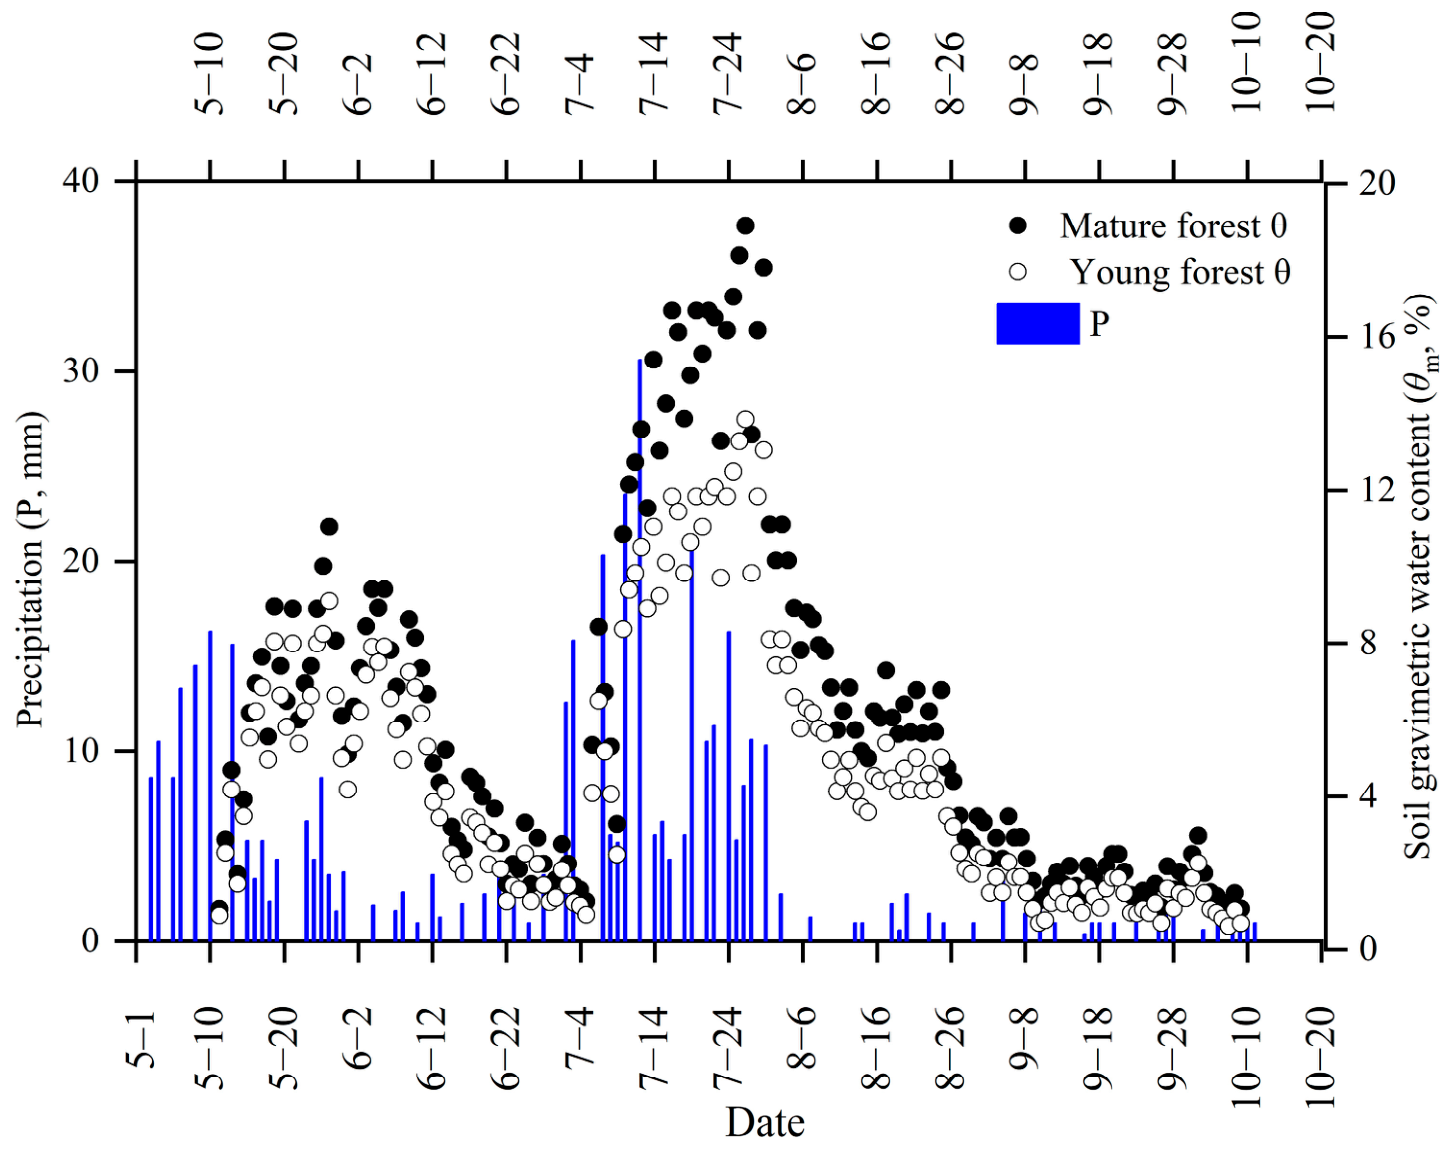
The rainfall-pulse response provided the clearest test of H1. Across all rainfall categories (0–2 mm, 2–5 mm, 5–10 mm, and >10 mm), the young stand showed substantially larger relative sap-flow increases (32.56%, 24.32%, 16.32%, and 17.52%) than the mature stand (16.32%, 10.36%, 9.56%, and 7.65%), a pattern confirmed by two-way ANOVA (
F1,94 = 48.36,
p < 0.01). This age-dependent divergence is mechanistically consistent with ontogenetic shifts in root architecture and canopy structure: young trees typically concentrate active fine roots in shallow soil horizons, enabling rapid exploitation of transient moisture pulses, whereas mature trees access deeper, more stable soil water reserves that buffer them against surface moisture fluctuations [
38,
39,
44]. Canopy structure likely amplifies this contrast under low-intensity events, as the denser mature canopy intercepts a greater fraction of incoming precipitation, reducing net throughfall relative to the more open young canopy. The lower mean soil gravimetric water content in the young stand (4.29% vs. 5.84% in the mature stand) further reflects the combined influence of shallower root-zone moisture depletion and greater belowground competition associated with higher stand density (900 vs. 325 stems·ha
−1). Collectively, these results confirm H1: rainfall-pulse sensitivity differed markedly between the two stands, which is mechanistically linked to structural and physiological differences (e.g., rooting depth, canopy openness, and tree density) between developmental stages, with direct implications for stage- and density-specific silvicultural management.
4.2. Environmental Drivers, Time-Lag Behavior, and Canopy–Atmosphere Coupling (Objective 2/H2)
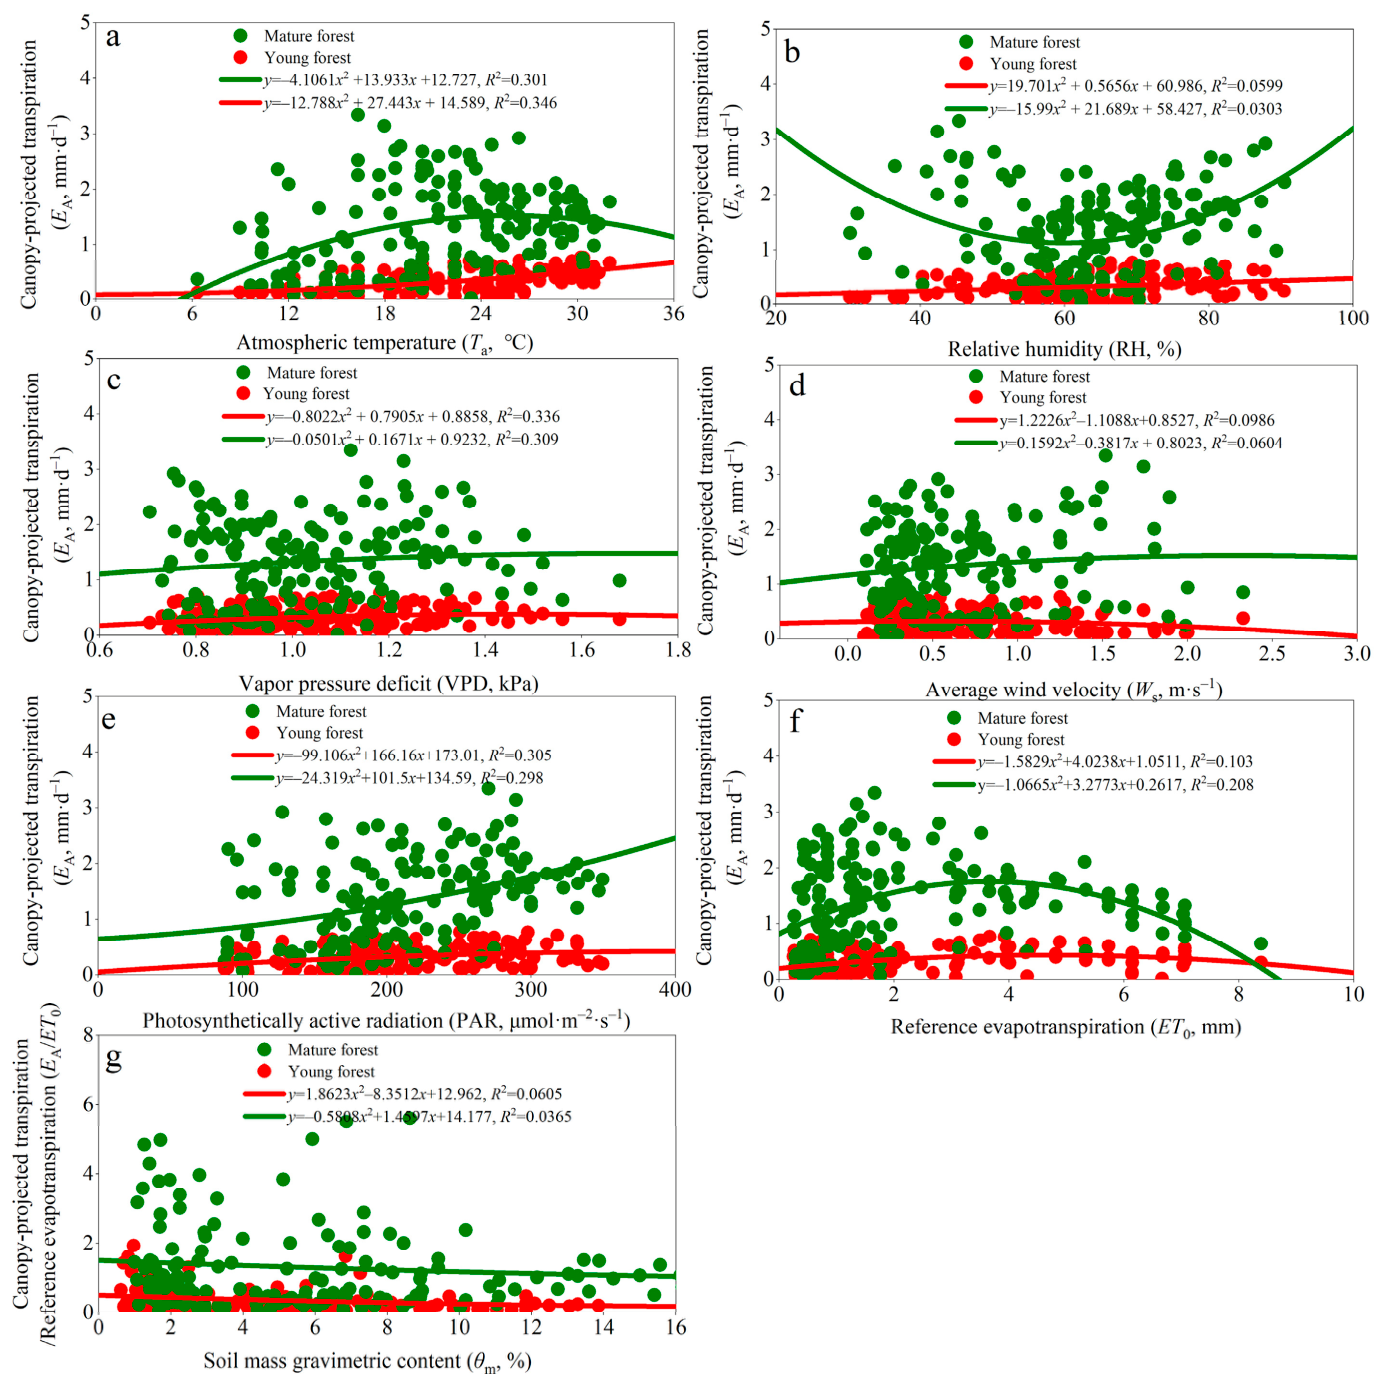
Regression analysis identified VPD and PAR as the dominant drivers of
EA in both stands, while RH, wind speed, and soil water content contributed comparatively little explanatory power. The
EA/
ET0 ratio remained independent of soil gravimetric water content (
R2 < 0.06), confirming that soil moisture did not impose a persistent hydraulic limitation on transpiration during the study period—a finding consistent with previous reports for pine plantations under non-water-limited conditions (citations). Both
Ta and VPD exhibited nonlinear, parabolic relationships with
EA, with transpiration plateauing or declining at high evaporative demand thresholds, reflecting progressive stomatal closure as a hydraulic safety mechanism and a two-phase VPD-transpiration response widely documented in
Pinus sylvestris and other conifers [
40,
41]. The structural openness of the needle canopy minimizes internal humidity gradients, reinforcing VPD over PAR as the primary transpiration driver, consistent with prior comparative studies of coniferous versus broadleaf water use [
21,
26].
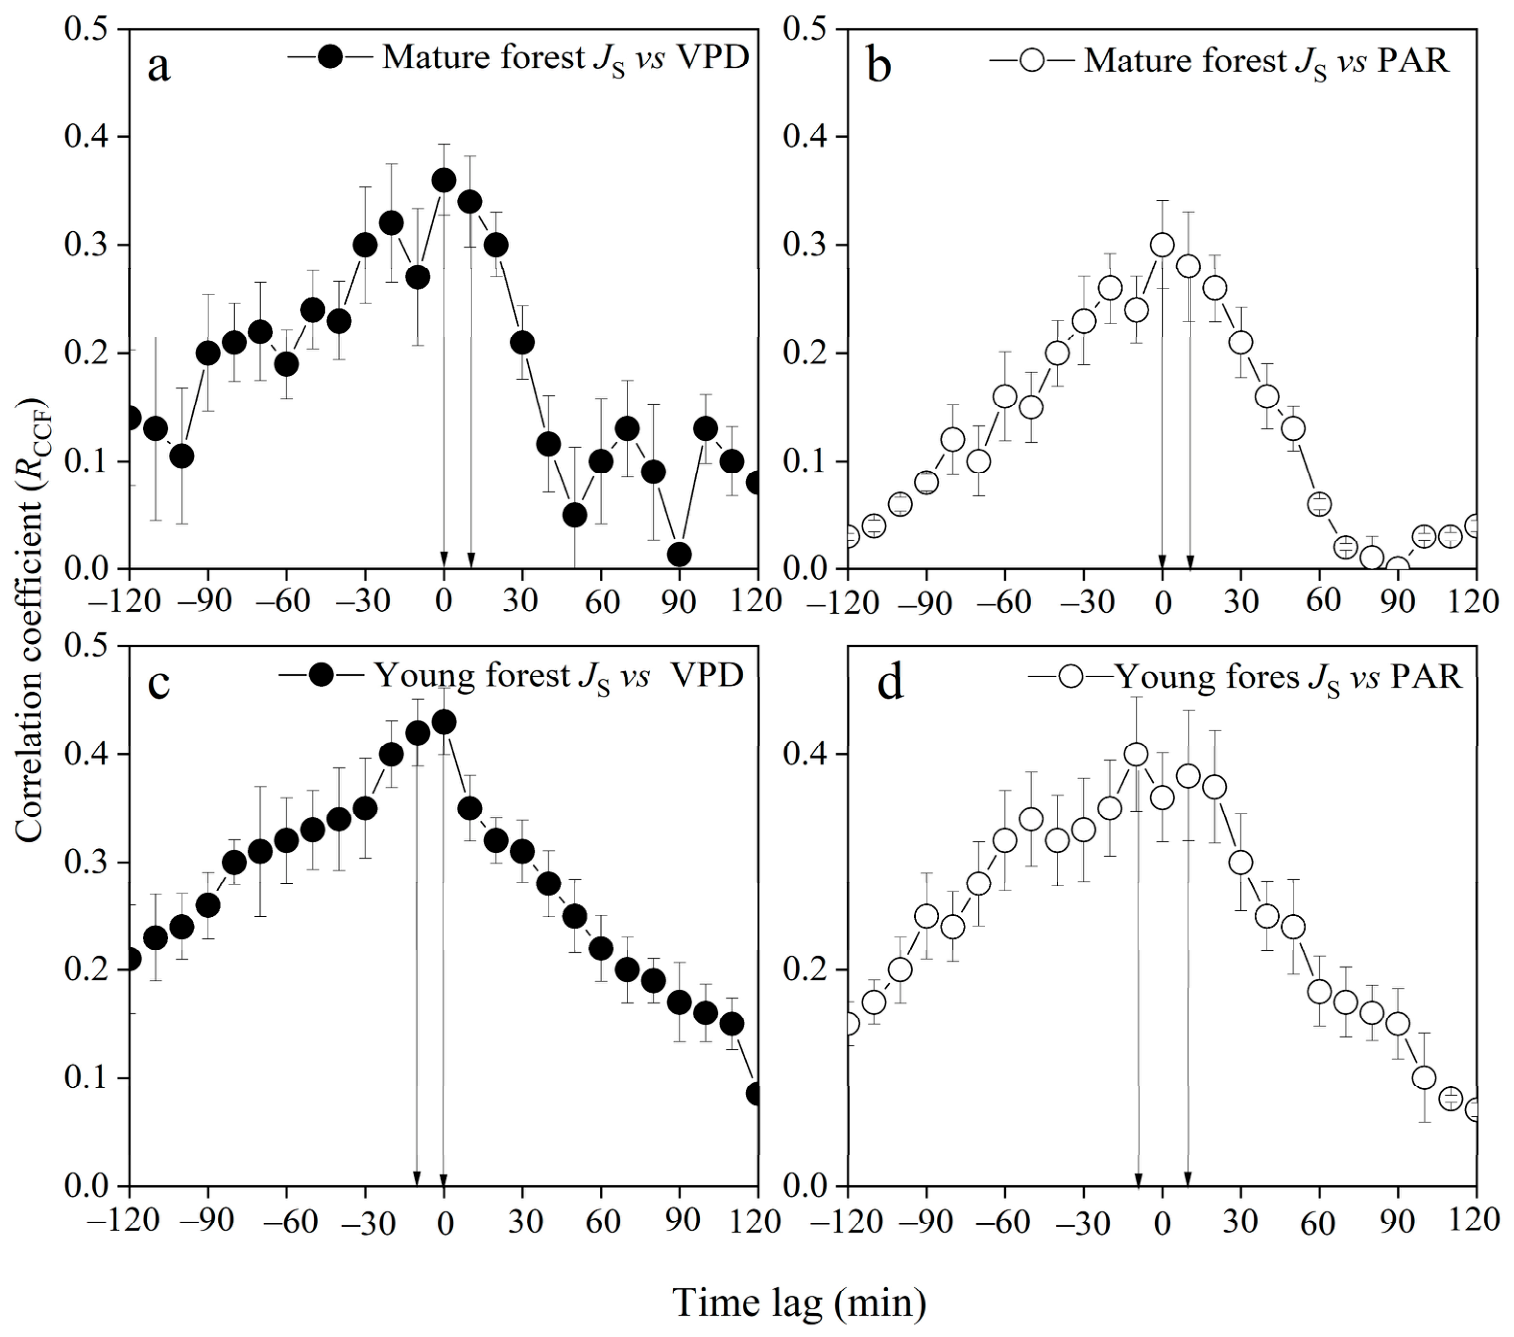
Cross-correlation analysis revealed that sap flow tracked both VPD and PAR with maximum correlation within ±10 min of zero lag (
Figure 8), indicating a negligible time-lag effect and rapid stomatal responsiveness to atmospheric forcing in both stands. This near-zero lag implies that internal stem water storage played only a minor buffering role over the study period, justifying the use of a narrow temporal correction window in the
gs inversion and supporting the time-lag component of H2.
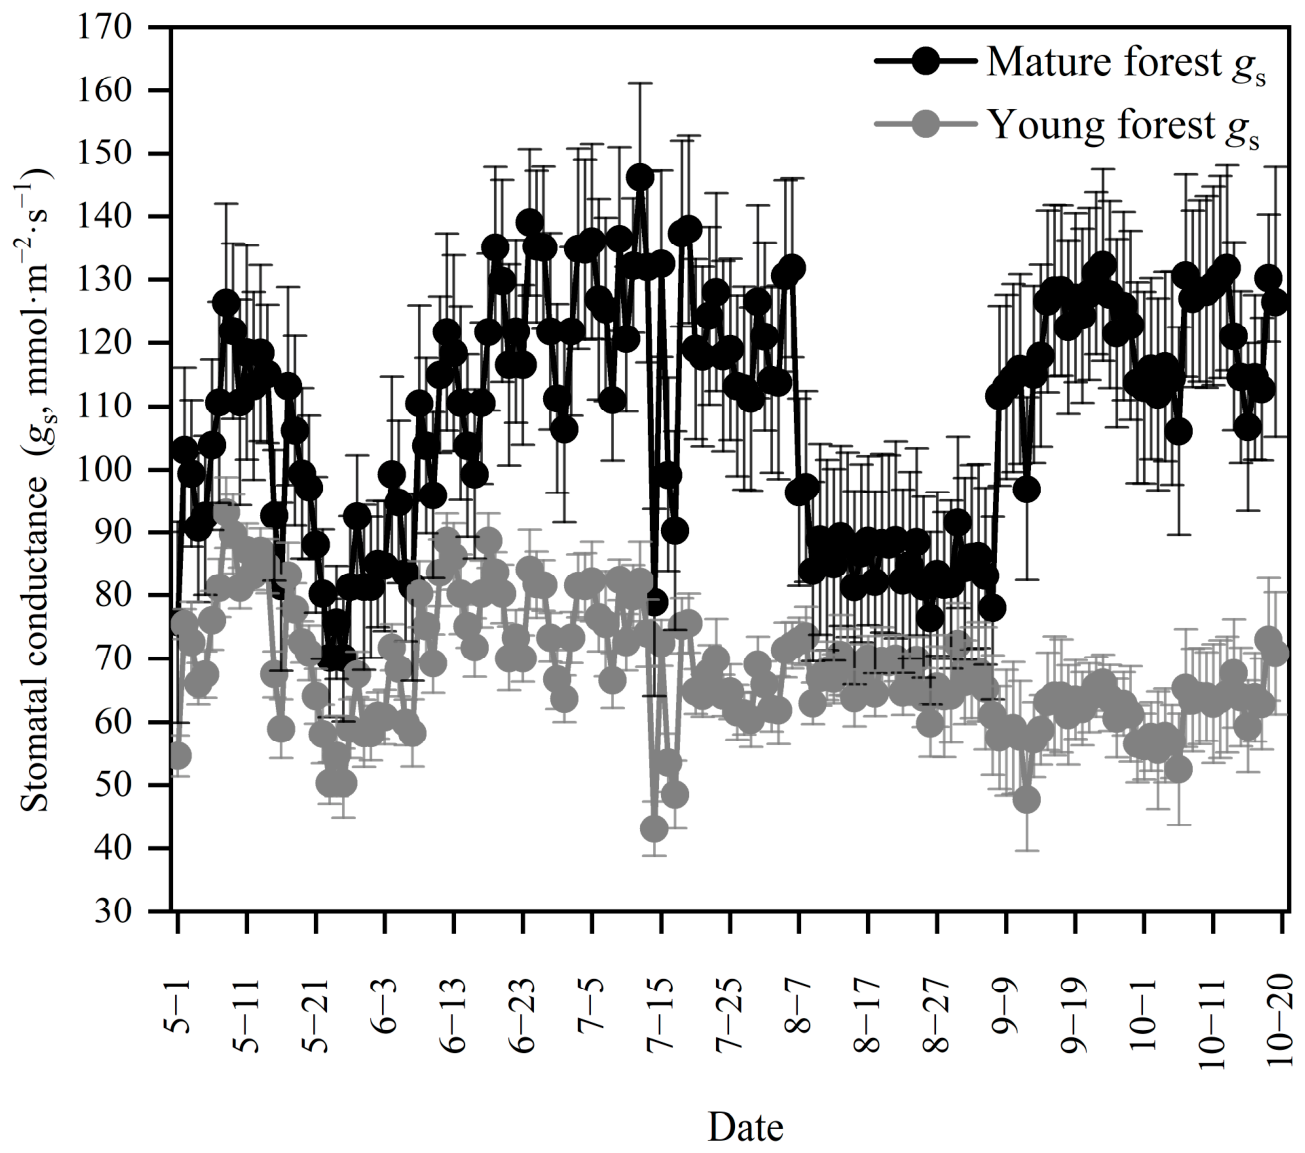
Penman-Monteith inversion yielded seasonal mean
gs of 109.04 mmol·m
−2·s
−1 (mature) and 67.83 mmol·m
−2·s
−1 (young). Rather than tracking a smooth seasonal trajectory,
gs exhibited age-specific dynamic patterns: the young stand operated within a narrow, conservative stomatal range, while the mature stand displayed pronounced episodic depressions, most notably a steep mid-July decline reflecting active demand-driven stomatal optimization under peak atmospheric evaporative stress. It should be emphasized that aerodynamic conductance (
ga) is derived from logarithmic wind profile formulations under the assumption of neutral atmospheric stratification. Consequently, the higher calculated
ga in the young stand compared to the mature stand (1297.40 mmol·m
−2·s
−1 vs. 892.63 mmol·m
−2·s
−1) is fundamentally linked to the empirical canopy-height parameterization (d and
z0 m) and the logarithmic wind extrapolation applied to the mature stand. This quantitative divergence should be interpreted within the context of the specific parameterization scheme rather than solely as an intrinsic physiological or microstructural contrast between stands. Our sensitivity analysis indicates that while a ± 20% perturbation in roughness and displacement parameters altered absolute
ga by 12.4%–18.6%, the decoupling coefficient (Ω) varied by less than ±0.03 (remaining consistently < 0.30 across both stands). Thus, although absolute
ga carries parameter-dependent uncertainty, the fundamental conclusion that both canopies operated in a tightly coupled, stomata-dominated regime (Ω ≤ 0.5) remains robust against aerodynamic parameter uncertainties. The resulting Ω was persistently low in both stands (mature: 0.177; young: 0.256), well within the tightly coupled range reported for other coniferous and broadleaf species including
Schima superba (0.22),
Eucalyptus grandis (0.25), and
Citrus limon (0.14) [
32,
36,
40]. These low Ω values indicate that, within the adopted Penman-Monteith framework, transpiration fluxes in both stands were predominantly governed by stomatal conductance and atmospheric VPD gradients rather than by net radiation. It should be clarified that because Ω is derived directly from the estimated
gs and
ga, it reflects the modeled degree of canopy-atmosphere coupling under the assumed aerodynamic formulations rather than an independent biophysical validation of the inversion methodology itself. A transient Ω surge toward 0.5 in the young stand during the mid-to-late August drought episode absent in the mature stand indicates brief structural decoupling under concurrent low wind speed, high
Ta, and maximum VPD, though both stands remained fundamentally within the tightly coupled regime across the growing season as a whole.
4.3. Stomatal Regulation, Hydraulic Strategy, and Water-Use Behavior (Objective 3/H3)
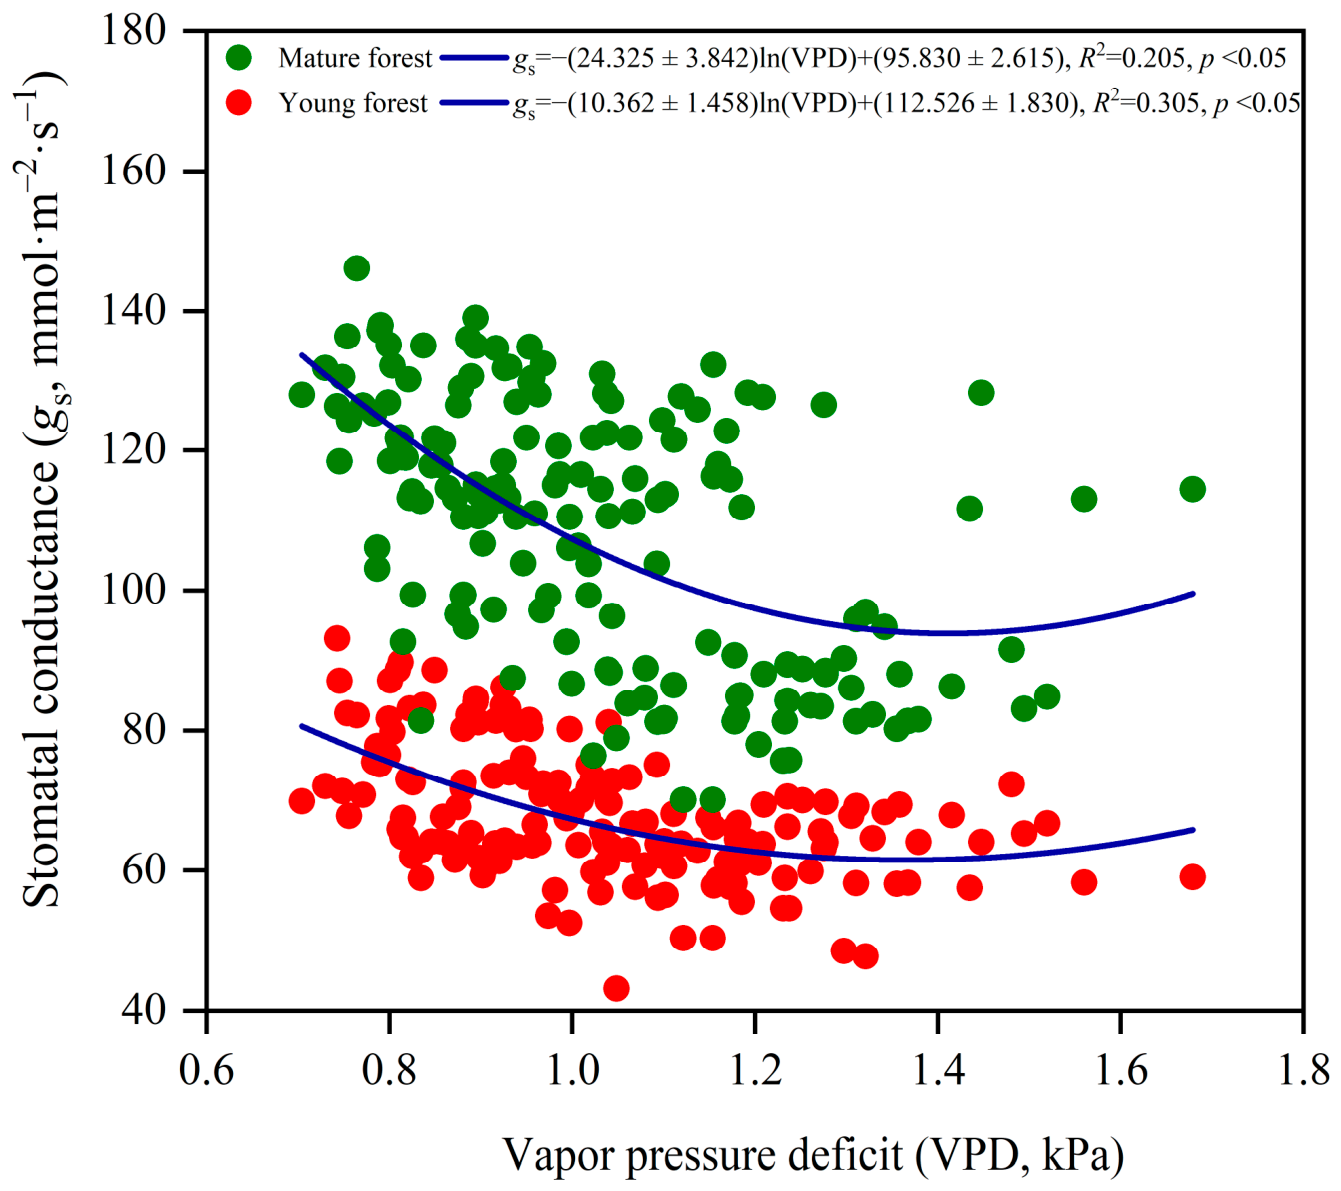
Stomatal conductance declined logarithmically with increasing VPD in both stands (
gs = −(24.325 ± 3.842)ln(VPD) + (95.830 ± 2.615) in the mature stand;
gs = −(10.362 ± 1.458)ln(VPD) + (112.526 ± 1.830) in the young stand;
Figure 12), consistent with the classical water-conservation stomatal response to atmospheric drought [
10,
16,
20,
49,
50]. The steeper slope in the mature stand indicates a stronger absolute stomatal sensitivity to VPD, while the young stand maintained lower absolute
gs across the observed VPD range—reflecting its smaller sapwood area, more limited hydraulic transport capacity, and greater degree of capacity-limited rather than regulation-limited water flux.
The hydraulic limitation hypothesis predicts that increasing path length and hydraulic resistance with tree height should force earlier stomatal closure, reducing
gs and unit-leaf-area transpiration in taller, older trees [
24,
26,
32]. The present data contradict this expectation: both maximum
gs and
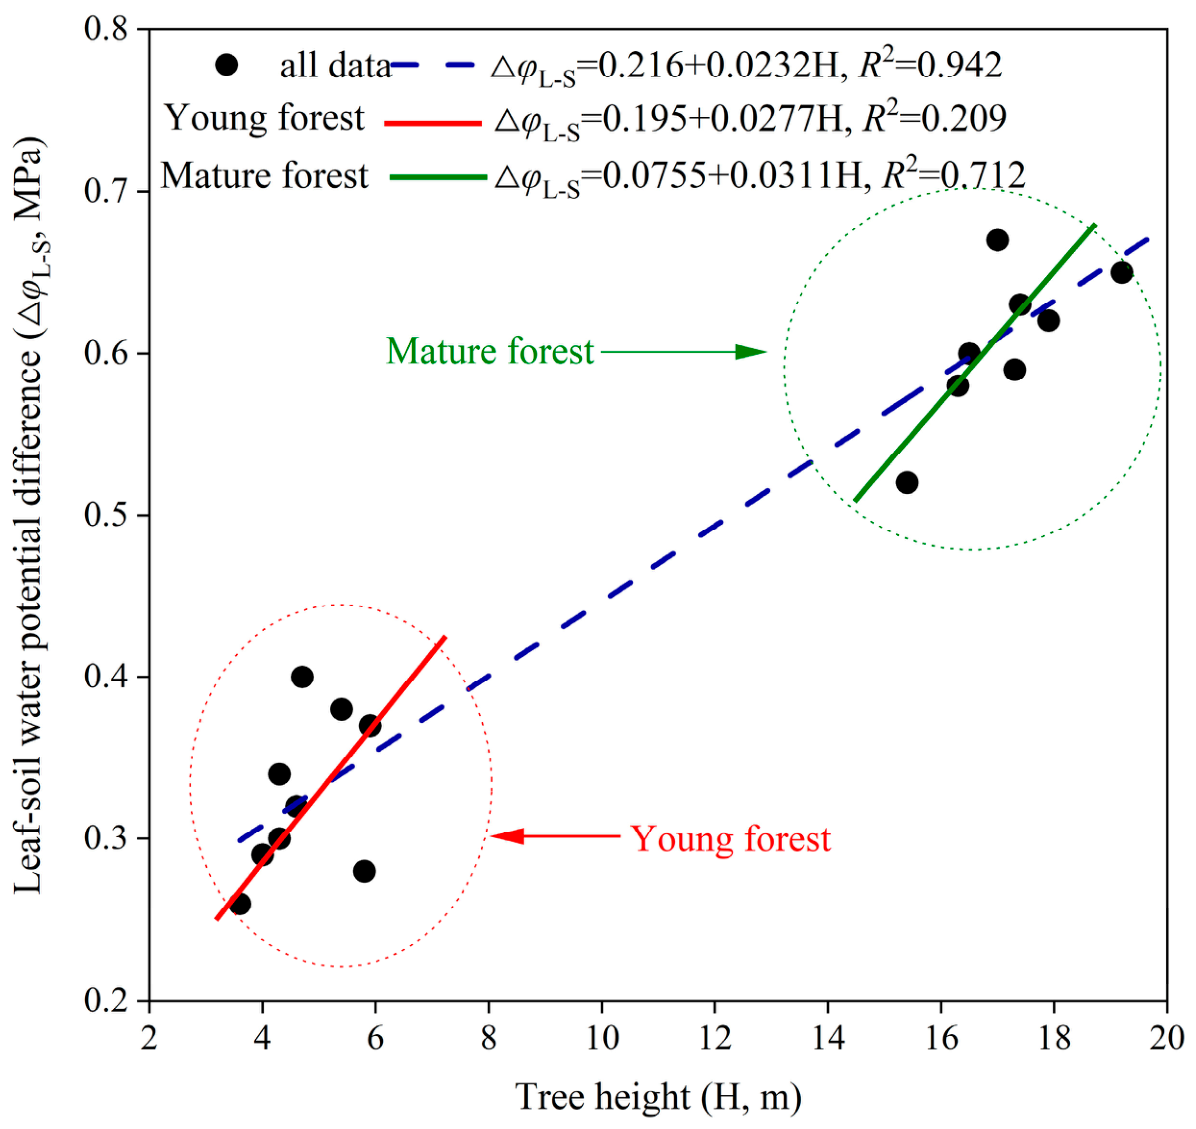
EL increased with DBH, and Δ
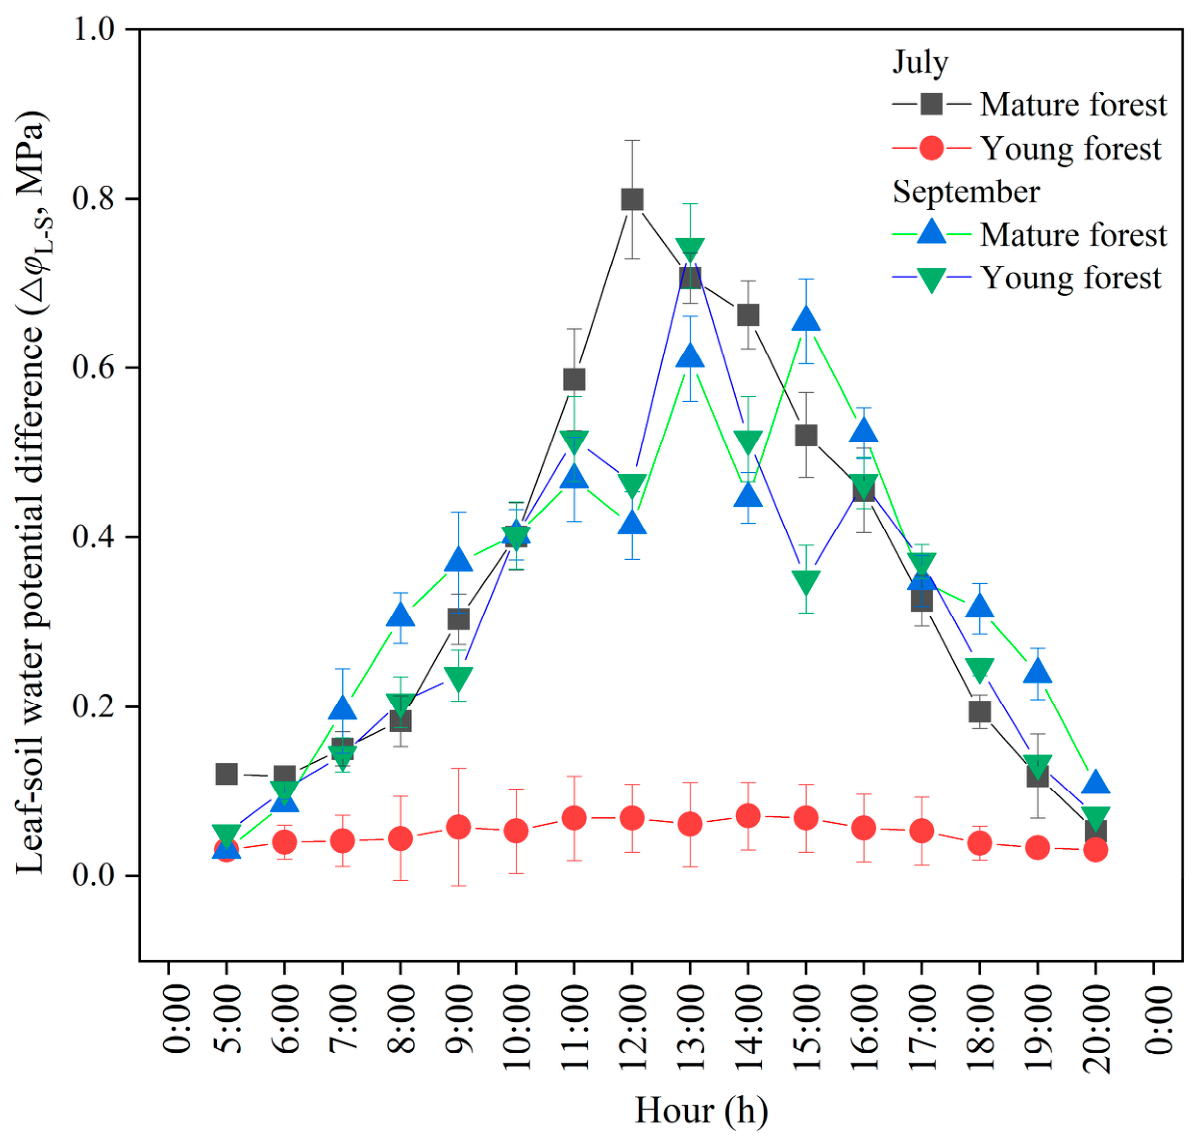
ΨL–S scaled positively with tree height (
Figure 13), while
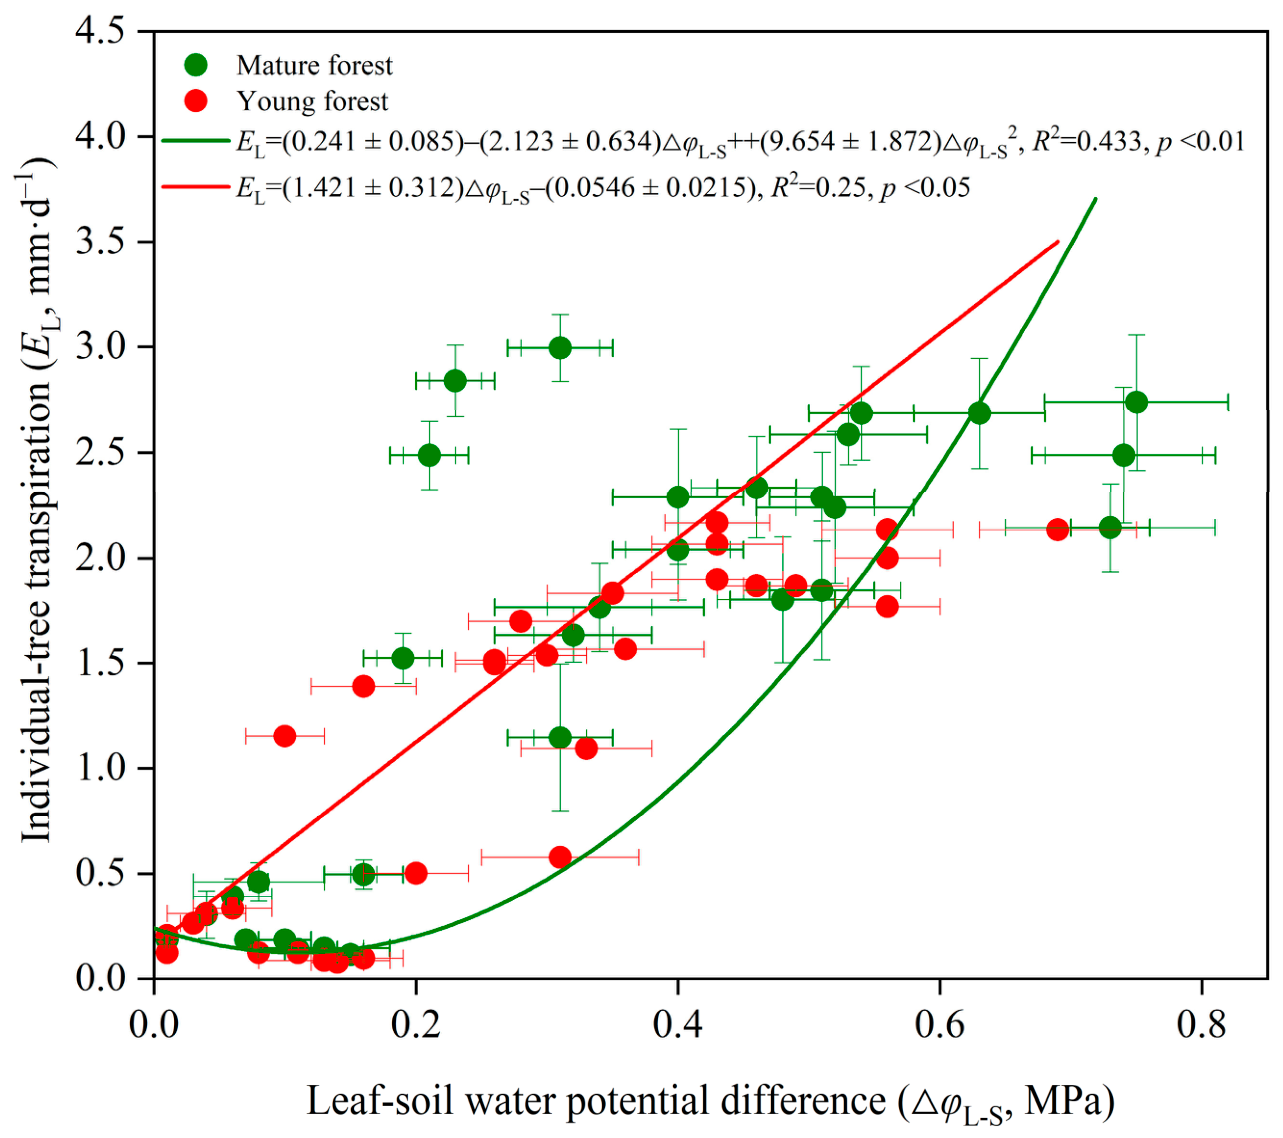
EL and Δ
ΨL–S exhibited significant nonlinear relationships in the mature stand (
EL = (0.241 ± 0.085)−(2.123 ± 0.634)Δ
φL–S + (9.654 ± 1.872)Δ
φL–S2,
R2 = 0.433) and a linear relationship in the young stand (
EL = (1.421 ± 0.312)Δ
φL–S−(0.0546 ± 0.0215),
R2 = 0.25). The nonlinear
EL−Δ
ΨL−S relationship in the mature stand reflects simultaneous modulation by stem capacitance, dynamic stomatal closure, and canopy structural heterogeneity, implying active hydraulic conductance regulation rather than passive gradient-driven transport. Together, these patterns indicate that mature trees in this system were not constrained by hydraulic limitation during the study period, instead sustaining higher transpiration and
gs through greater sapwood cross-sectional area, deeper root-system access to stable soil water, and more developed xylem anatomy, factors that collectively offset the resistance penalty of increased hydraulic path length in this dryland context [
17,
38,
39,
51].
In the context of the
Ψmd-
Ψpd framework [
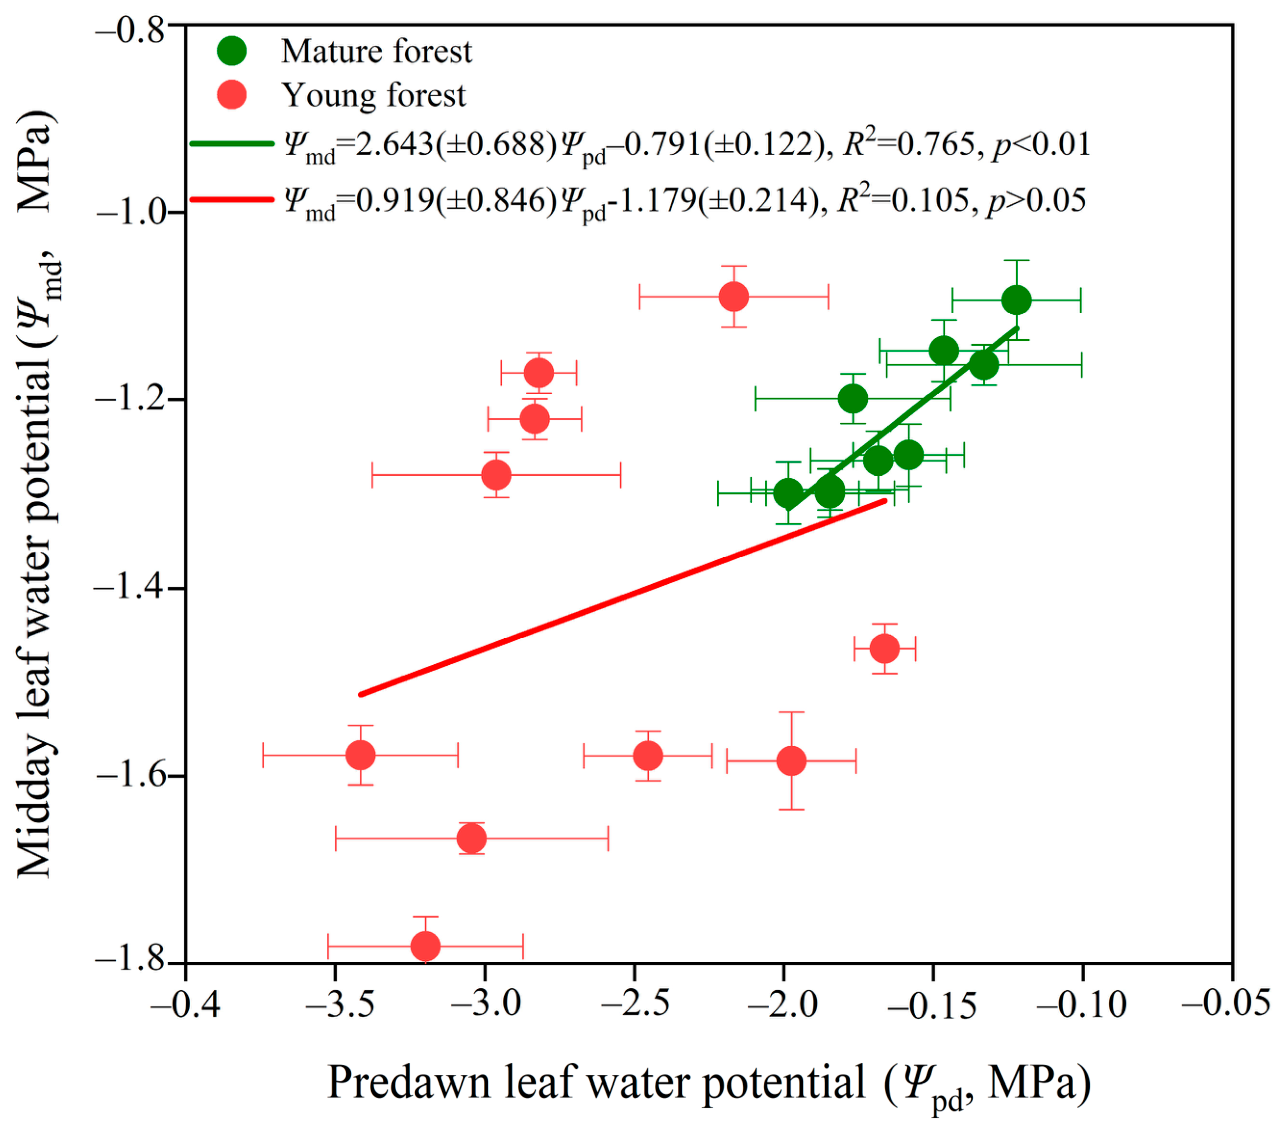
20], the two stands exhibited distinct water-potential regulation patterns (
Figure 14). The 41-year-old older stand demonstrated pronounced anisohydric behavior (σ = 2.643 ± 0.688,
R2 = 0.765,
p < 0.01), tolerating substantial diurnal water-potential drops to sustain elevated transpiration and carbon assimilation under rising atmospheric evaporative demand. In contrast, for the 13-year-old young stand, the
Ψmd−
Ψpd relationship was statistically non-significant with an extremely low coefficient of determination (σ = 0.919 ± 0.846,
R2 = 0.105,
p > 0.05), precluding a definitive classification along the isohydric–anisohydric continuum based on this dataset alone. This poor linear fit in the young stand likely reflects pronounced tree-to-tree hydraulic heterogeneity, rapid stomatal and water-status adjustments in response to transient shallow soil moisture pulses, and constrained baseline sap flux. Rather than conforming to a static, species-wide classification, these contrasting behaviors between developmental stages reinforce the paradigm that the iso/anisohydric spectrum is a dynamic continuum shaped by tree dimensions, root distribution, and plant-environment interactions [
20,
22,
49,
50,
52].
These divergent hydraulic states highlight contrasting, stage-specific drought vulnerabilities. Although the 41-year-old stand sustains higher transpirational fluxes via its anisohydric strategy, this aggressive water-use mode may elevate long-term xylem embolism and hydraulic failure risks under sustained regional aridification. Conversely, the young stand’s constrained water flux and dynamic hydraulic tracking do not confer unambiguous drought security: its pronounced reliance on shallow, transient soil moisture and high sensitivity to rainfall pulses render young trees highly susceptible to mid-season topsoil desiccation once precipitation ceases. These contrasting vulnerabilities have direct implications for stage- and structure-differentiated silvicultural management: young plantations require interventions aimed at buffering shallow soil-moisture availability and reducing inter-tree competition (e.g., density regulation or supplementary watering during severe dry spells), whereas management of older stands should prioritize preserving deeper soil water reserves and monitoring hydraulic threshold risks to prevent structural degradation [
53,
54].”
4.4. Limitations and Future Perspectives
Several methodological limitations should be considered when interpreting these findings. First, the experimental design compares a single mature stand (41 years, 325 stems·ha−1) with a single young stand (13 years, 900 stems·ha−1), providing within-stand physiological replication (n = 9 trees per stand) rather than true independent stand-level replication. Because stand age is inevitably confounded with stand density, tree size, and canopy closure in this single-pair design, the observed contrasts cannot be interpreted as an isolated, proven age effect per se. Instead, they represent the integrated differences between the two specific stands and developmental stages. Future research should employ replicated multi-site chronosequences across orthogonal density gradients to strictly isolate age-driven mechanisms from density- and site-specific effects.
Second, sap flow was measured using a single north-facing thermal dissipation probe per tree, which introduces methodological limitations regarding radial and azimuthal heterogeneity in sap flux density (Js). In the large-diameter older trees (mean DBH = 30.31 cm, mean sapwood depth = 58.4 mm), the 30 mm probe sampled primarily the outer, most hydraulically conductive xylem. Because sap flux typically declines non-linearly from the outer sapwood toward the inner heartwood boundary, and significant azimuthal variation in flux can occur around the stem circumference driven by uneven crown exposure, root distribution, and xylem sectoriality, relying on a single radial depth and a single north-facing sensor inevitably introduces uncertainty when scaling point measurements to whole-tree and stand-level transpiration (EL and EA). While standardizing sensor placement on the shaded northern aspect successfully minimized direct solar radiation artifacts and preserved the relative temporal dynamics, stomatal sensitivity comparisons, and time-lag patterns across stands, the absolute transpiration fluxes of the older stand may carry estimation biases (e.g., potential over- or under-estimation depending on inner sapwood activity). In contrast, in the small young trees (mean DBH = 4.73 cm), the 10 mm mini-probe traversed nearly the entire functional sapwood depth (12.3 ± 2.1 mm), minimizing radial integration bias. Future studies should deploy multi-depth radial sensor arrays alongside multi-azimuth circumferential profiling to rigorously resolve spatial flux heterogeneity and reduce scaling uncertainties in dryland forest water balances.
Third, canopy stomatal conductance (
gs) was derived via Penman-Monteith inversion under the operational assumption of quasi-steady-state water transport. It must be emphasized that the observed near-zero time lag (±10 min) derived from cross-correlation analysis primarily reflects the temporal coherence between bulk time-series signals; it does not in itself constitute physical proof that stem capacitance is absent or that strict steady-state conditions are universally maintained. In tall trees with substantial xylem volume (such as the 41-year-old stand), the withdrawal of internally stored water during early morning transpiration surge and the replenishment of stem capacitance after dusk inevitably generate transient, non-steady-state hydraulic decoupling between crown transpiration and basal sap flux. Although our time-lag alignment minimized macro-scale phase offset artifacts across the full diurnal cycle, porometric inversions during rapid transitional periods may still carry localized uncertainties. Future investigations should integrate high-resolution point dendrometers, multi-height sap flow sensors, and 3D hydrodynamic models to explicitly quantify diurnal capacitance dynamics and non-steady-state flux partitioning across developmental stages [
55,
56].
Fourth, leaf and soil water-potential measurements were restricted to two representative diurnal cycles (July and September), providing hydraulic snapshots rather than continuous seasonal trajectories. The low R2 (0.105) for the young stand’s Ψmd-Ψpd regression reflects both limited sampling and potentially greater tree-to-tree hydraulic heterogeneity, introducing uncertainty into the precise iso/anisohydric classification for this age class. Finally, monitoring was confined to a single growing season (2024), precluding assessment of interannual variability in age-specific hydraulic strategies under contrasting rainfall regimes or multi-year drought. Future studies should combine multi-season continuous monitoring, isotopic water-source tracing, direct root-architecture characterization, eddy-covariance cross-validation, and broader stand-age gradients to fully resolve how hydraulic regulation strategies shift across the ontogenetic continuum of Mongolian pine shelterbelts.
Additionally, it should be clarified that stand-level water vapor and energy fluxes were derived exclusively from scaled sap-flow measurements and meteorological observations, as direct eddy-covariance flux tower measurements were not conducted in this study. While the combination of thermal dissipation sap-flow probes with Penman-Monteith inversion provides a robust and widely accepted approach for resolving individual- and canopy-scale transpiration dynamics in uniform stands, scaling sap flow to ecosystem-level evapotranspiration inevitably carries uncertainties associated with spatial footprint matching and understory vegetation contributions. Future research should integrate continuous, long-term eddy-covariance measurements with concurrent sap-flow monitoring arrays to enable cross-scale validation, quantify the partitioning between tree transpiration and understory evapotranspiration, and more comprehensively evaluate ecosystem-scale water balances across different stand developmental stages.
5. Conclusions
This study quantified age-dependent water-use and hydraulic regulation strategies in Pinus sylvestris var. mongolica plantations across two ontogenetic stages in the semi-arid Horqin Sandy Land, yielding three principal findings.
First, the mature stand (41 years) sustained substantially higher and temporally stable individual-tree transpiration (EL = 2.36 vs. 0.90 mm·d−1) than the young stand (13 years), whereas the young stand exhibited disproportionately greater relative sap-flow responses to small-to-moderate rainfall pulses (up to 32.56% vs. 16.32%), driven by its shallower root architecture and more transmissive canopy structure (H1 confirmed).
Second, VPD, PAR, and Ta co-dominantly governed canopy transpiration (EA), each explaining 30%–35% of seasonal variance, while soil moisture exerted negligible constraint (EA/ET0: R2 < 0.06). Near-synchronous sap-flow tracking of atmospheric drivers (lag ≤ 10 min) and low calculated decoupling coefficients (Ω = 0.177 and 0.256 for the older and young stands, respectively) characterized tight canopy-atmosphere coupling within the modeled framework, reflecting a stomata-dominated transpirational regime in both stands (H2 supported).
Third, stomatal conductance declined logarithmically with VPD, with a twofold steeper sensitivity slope in the mature stand. Predawn–midday leaf water-potential analysis revealed pronounced anisohydric behavior in the 41-year-old stand (σ = 2.643, R2 = 0.765, p < 0.01), whereas the 13-year-old young stand exhibited an uncoupled, non-significant Ψmd−Ψpd relationship (R2 = 0.105, p > 0.05), precluding a definitive iso/anisohydric classification and underscoring distinct hydraulic stability and regulation patterns across the two developmental stages. Both gs and EL increased with tree size, departing from the size-dependent hydraulic limitation hypothesis (H3 confirmed).
Collectively, the comparative analysis between the two stands indicates that stand development and associated shifts in stand structure (e.g., rooting depth, canopy architecture, and sapwood area) substantially alter transpiration magnitude, rainfall-pulse sensitivity, and hydraulic regulation strategies. These findings carry direct management implications: young stands require density control to alleviate shallow-zone moisture competition, whereas mature stands necessitate timely thinning to preserve deep soil-water reserves and reduce catastrophic hydraulic failure risk under intensifying regional aridification. Future research priorities include multi-year monitoring across continuous climate gradients, integration of xylem anatomical traits and embolism vulnerability curves, and comparative provenance trials screening for germplasm combining high water-use efficiency with robust stomatal sensitivity.




 ,
,