1. Introduction
Bamboo is an ideal sustainable natural fiber-reinforced composite, offering advantages such as abundant resources, rapid growth, and low cost, while exhibiting excellent comprehensive mechanical properties [
1]. The strength-to-modulus ratio of bamboo exceeds that of low-carbon steel, and its good toughness makes it promising for engineering applications in construction, bridge building, and furniture manufacturing [
2]. The outstanding mechanical properties of bamboo originate from its unique multi-scale gradient structure: at the tissue level, bamboo consists of a composite of parenchyma cells serving as the matrix and fibers serving as the reinforcement phase [
3], where fibers provide strength and stiffness, while parenchyma cells enhance flexibility and toughness through plastic deformation. From the inner to the outer layer of the culm wall, the fiber content exhibits a pronounced gradient distribution, endowing bamboo with excellent mechanical characteristics through a composite effect of exterior rigidity and interior flexibility [
4,
5].
Current experimental research on the mechanical properties of bamboo has focused on different hierarchical levels. At the macroscopic level, researchers have investigated the macroscopic mechanical properties of bamboo through tensile, compressive, bending, and shear tests [
6,
7,
8]. At the tissue level, the strength and modulus of each constituent have been studied separately by isolating parenchyma tissue or fiber bundles [
8,
9]. With the development of advanced characterization techniques such as scanning electron microscopy (SEM) and X-ray computed tomography, the research scale has extended from the macroscopic to the meso- and micro-scales [
10,
11]. However, the mechanical behavior and failure mechanisms of bamboo at the microscale have not been adequately investigated. Conventional mechanical testing methods can only provide macroscopic mechanical properties, without the capability to synchronously observe microstructural evolution and damage processes during loading.
In situ testing techniques integrate microscopic imaging devices with mechanical testing apparatus, enabling simultaneous observation of deformation and damage evolution during material loading [
12,
13]. Integrating mechanical testing instruments within an SEM allows real-time observation of microscopic deformation, crack initiation, and propagation processes, thereby revealing the intrinsic relationship between macroscopic mechanical properties and microscopic damage mechanisms [
14,
15]. However, current in situ SEM testing instruments are predominantly developed for tensile testing [
13,
16,
17], and dedicated bending loading devices remain scarce. Although commercial in situ testing instruments can perform tensile testing, they are mostly designed for metallic materials, with load ranges far exceeding those required for natural fiber materials, leading to inaccurate measurements [
5]. When adapted for in situ tensile configurations, conventional three-point bending fixtures cause the failure zone at the contact point between the specimen and the indenter to shift continuously during loading [
17], making it difficult to maintain continuous tracking of the same region of interest.
Unlike conventional methods that can only provide mechanical property curves and fracture surface morphology, in situ testing techniques enable real-time observation of dynamic failure processes, such as fiber/matrix interfacial debonding and crack deflection, under continuous loading, directly establishing causal relationships between macroscopic mechanical responses and microscopic damage mechanisms. Several researchers have begun to employ SEM-based in situ testing techniques to investigate the multiscale mechanical behavior and toughening mechanisms of natural composites [
11,
17,
18]. Han et al. used a Deben Microtest 2000 in situ tensile stage in conjunction with a Quanta 2000 SEM to perform in situ characterization of bamboo, elucidating the intrinsic principles of the synergistic strength–toughness behavior from the perspective of functionally graded structures, and pointing out that the fiber volume fraction gradient across the culm wall is the structural basis for achieving the optimal strength–toughness balance [
3]. Similar studies have primarily employed commercial in situ testing platforms (such as the Deben Microtest and Kammrath & Weiss systems), which are mainly designed for metallic tensile testing and suffer from excessive load ranges and a lack of dedicated bending functionality, making them not fully suitable for natural fiber material research. Some researchers have opted for custom-built devices in conjunction with SEM. Tan [
8] developed a piezoelectrically driven micro-scale in situ tensile stage to determine the intrinsic mechanical properties of bamboo fibers, providing critical parameter inputs for multi-scale mechanical models. However, this design significantly limits the stroke and loading capacity, making it difficult to comprehensively characterize the interlaminar mechanical behavior of natural composite panels.
To investigate the mechanical behavior of native bamboo at the microscale, this paper presents the design and development of an in situ SEM bending testing instrument. The instrument features the following characteristics:
- (1)
by fixing the loading indenter and driving the two supports to move symmetrically, the region of interest on the specimen is guaranteed to remain stably positioned at the center of the SEM field of view.
- (2)
An STM32-based control system was developed, achieving precise closed-loop control of velocity, displacement, and load.
- (3)
Using this instrument, in situ SEM three-point bending experiments were performed on native bamboo, yielding images of micro-damage evolution underloading. Combined with digital image correlation (DIC) analysis of strain-field distributions, the contribution mechanisms of fibers and parenchyma tissue to the mechanical behavior of bamboo were elucidated.
2. Materials and Methods
2.1. Instrument Design Principles and Overall Scheme
To implement in situ SEM bending testing, the instrument design must satisfy the following constraints: (1) the internal space of the SEM chamber is limited, with various irregularly distributed signal detectors requiring a compact instrument structure with appropriate external dimensions; (2) the SEM interior must maintain a high vacuum state, requiring the lubrication of transmission components and electrical elements to be vacuum-compatible; (3) SEM imaging relies on electron beams, requiring the metallic components of the instrument to be non-magnetizable to avoid deflecting electron beam trajectories; (4) to ensure the normal operation of the specimen stage, the instrument must be designed with minimum weight; (5) during in situ experiments at high magnifications, micron-level precise control of the loading indenter is required.
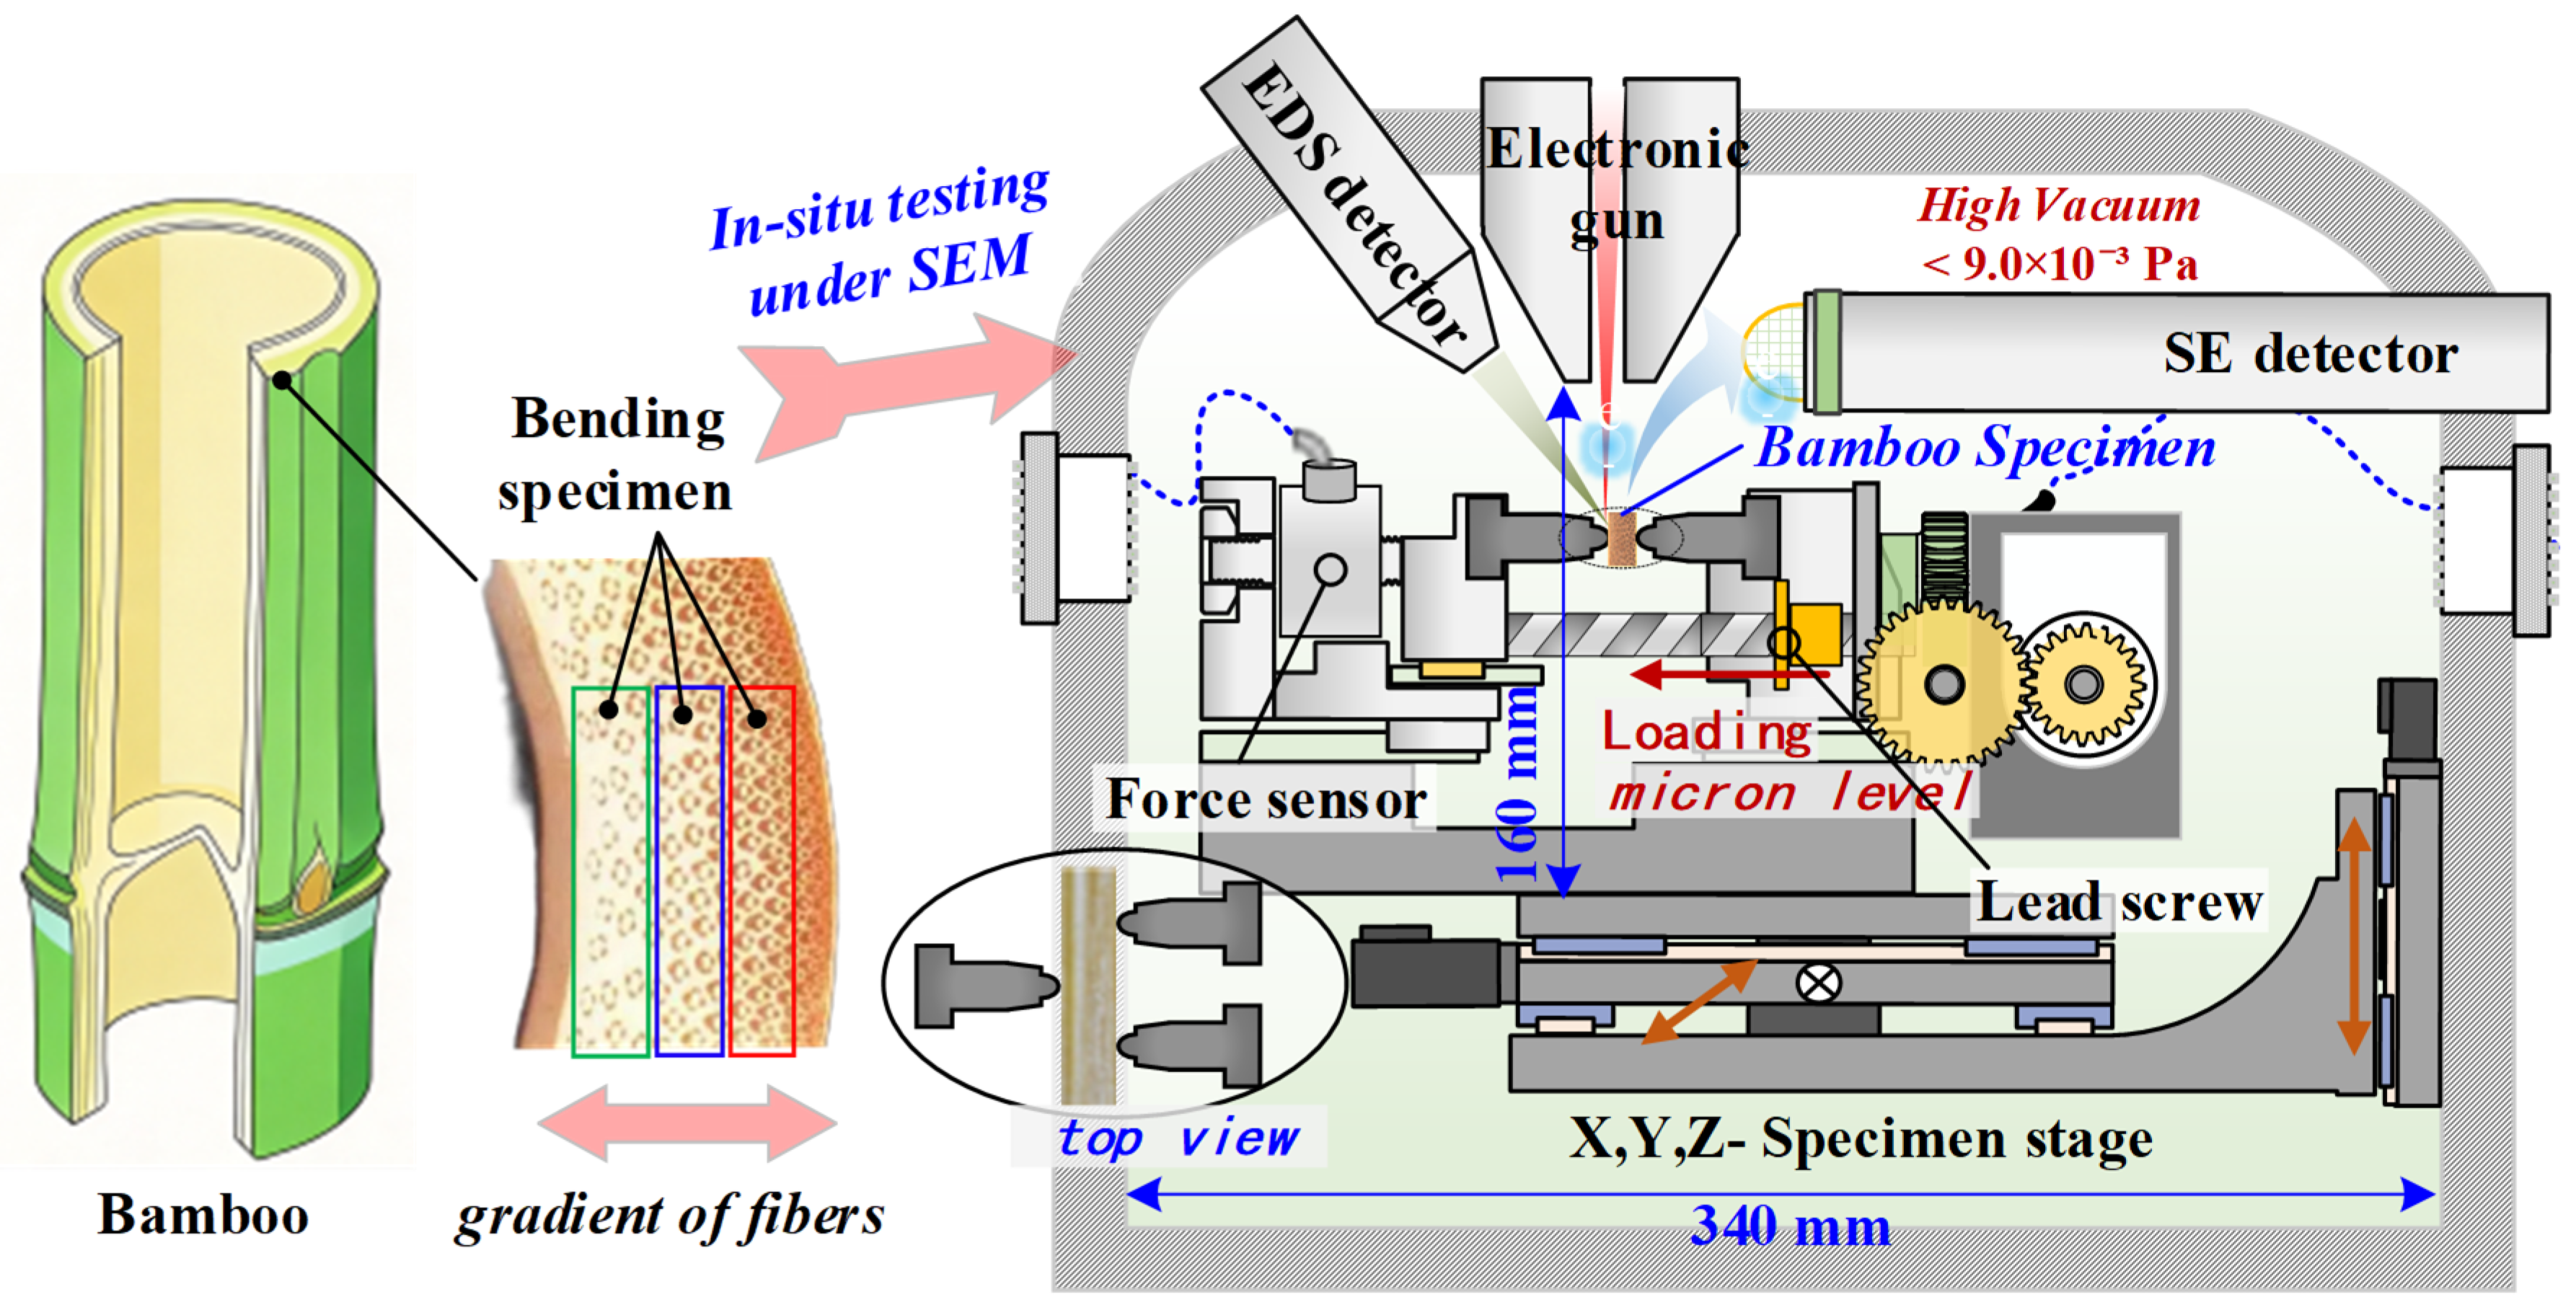
The instrument was designed to accommodate the chamber of a scanning electron microscope (Vega4, Tescan, Brno, Czech Republic), as shown in
Figure 1. The SEM chamber internal dimensions are 340 mm (width) × 315 mm (depth), with a five-axis specimen stage mounted on the chamber door, having a maximum load capacity of 5 kg and a working distance (W.D.) of 10–35 mm in secondary electron imaging mode. Considering the mechanical properties of bamboo (flexural strength of approximately 100–200 MPa, elastic modulus of approximately 5–15 GPa) and the specimen dimensions (60 mm × 4 mm × 2 mm), the main functional parameters of the instrument were determined as listed in
Table 1.
To address the problem of observation-region drift in conventional three-point bending tests, the instrument adopts a configuration in which the central indenter remains stationary while the two supports move symmetrically. During loading, the loading point on the specimen maintains tight contact with the central indenter. The two supports are connected to miniature bidirectional lead screws, enabling continuous adjustment of the span length (span length) within the range of 5–50 mm. This design enables continuous tracking of the entire process of crack initiation, propagation, and fiber failure within the loading region without repeatedly readjusting the SEM field of view. Compared with the commercial Deben MT2000—which has been used in existing in situ studies on bamboo (e.g., [
3,
19])—this represents a key advantage. In addition, our instrument offers a more appropriate load range, higher force and displacement resolutions, and a wider speed range, making it particularly suitable for thin natural fiber composite specimens.
2.2. Mechanical System
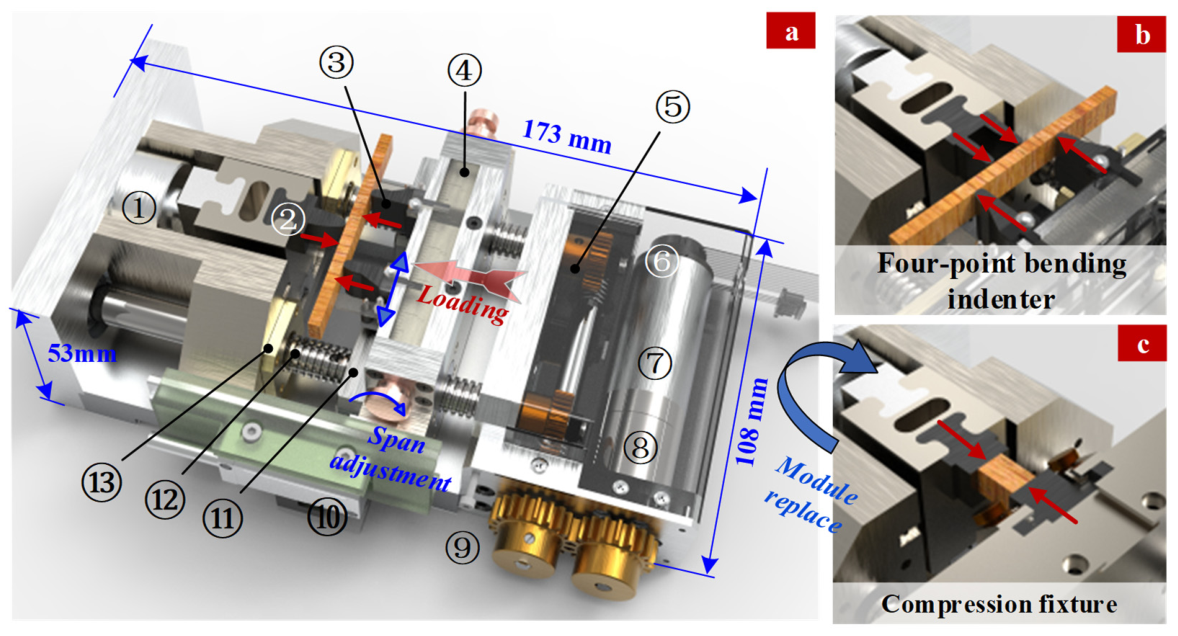
The mechanical structure of the instrument is shown in
Figure 2. The power output unit consists of a DC servo motor (DCX22L, Maxon, Sachseln, Switzerland) and its associated planetary gear reducer (GPX22, reduction ratio 44:1), and an encoder (ENX16, Maxon, Sachseln, Switzerland). The servo motor is positioned on one side of the instrument and transmits power through a pair of spur gears (gear ratio 1:1) to a worm gear pair (reduction ratio 30:1). A ball screw (nominal diameter: 10 mm, lead: 2 mm) is adopted as the final transmission element to ensure high positioning accuracy and low friction. The ball nut is connected to the support bracket and translates linearly under the driving of the ball screw. Displacement measurement employs a linear optical encoder (TONiC UHV T1630, Renishaw, Wotton-under-Edge, UK) with a resolution of 1 μm, installed at the end of the transmission chain to directly measure the displacement between the loading slide and the base, achieving fully closed-loop displacement control.
It ultimately converts rotational motion into linear motion via a ball screw to drive the loading module for mechanical loading. The total transmission ratio is 1320:1. All transmission components are lubricated with vacuum-compatible grease to satisfy the high-vacuum requirements of the SEM environment.
Through transmission calculation and verification, the theoretical driving torque of the ball screw is 0.080 N·m, and the maximum output torque of the system is 3.566 N·m, satisfying the loading requirements. The rated speed of the motor after reduction is 109 rpm, corresponding to a linear loading speed range of 0.1–100 μm/s.
Load measurement employs a strain gauge load cell (GWMC-500N, Interface, Scottsdale, AZ, USA) with a range of 500 N. The signal is conditioned by a precision strain gauge amplifier (SGA/A, Mantracourt Electronics, Exeter, UK., bandwidth 6 kHz, typical linearity < ±0.03%), which features an integrated low-pass filter (cutoff frequency set to 20 Hz) and converts the input into a ±5 V analog output. The conditioned signal is then acquired by a 24-bit A/D conversion module at a sampling frequency of 40 Hz.
Through the design of interchangeable loading modules, multiple mechanical loading functions, including three-point bending, four-point bending, and compression, can be switched within a single apparatus, as shown in
Figure 2b,c. The compression module is equipped with a mounting plate adapted to the sample height, allowing pre-assembly of the test specimens for convenient module replacement. Key structural components are fabricated from 304 stainless steel, while the loading indenters and supports in contact with the specimens are manufactured from non-magnetic die steel (HPM75, Hitachi Metals, Tokyo, Japan) to satisfy the electron imaging requirements.
2.3. Control System
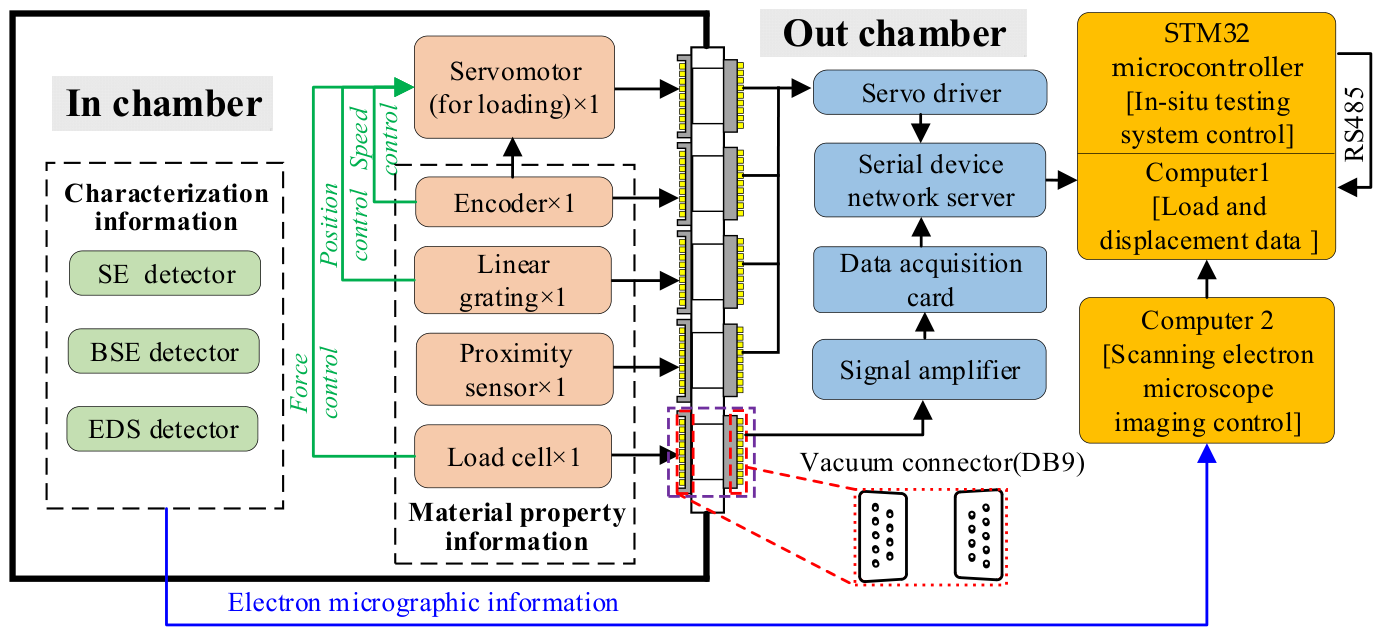
The instrument control system adopts a two-level architecture comprising a host computer and a slave controller, as shown in
Figure 3. The host computer runs on a Windows operating system, with UI software developed based on the Qt framework, providing functions including loading mode selection, parameter configuration, PID tuning, real-time data display and curve plotting, and data storage. The slave controller is based on an STM32 microcontroller running the FreeRTOS real-time operating system, responsible for motor motion control, sensor data acquisition, and communication with the host computer. The host computer and slave controller exchange data via the RS485 serial communication protocol.
The motion control unit employs a cascaded three-loop PID control strategy. The encoder provides feedback on the motor speed, forming the velocity control loop; the linear optical encoder directly measures the displacement of the loading slide, forming the position control loop; and the load sensor provides feedback on the load value, forming the force control loop. In velocity control mode, loading proceeds at a preset constant rate; in displacement control mode, loading automatically stops upon reaching the target displacement, suitable for in situ experiments requiring stepwise image capture; in load control mode, loading continues until the target load value is reached, followed by entry into a load-holding mode.
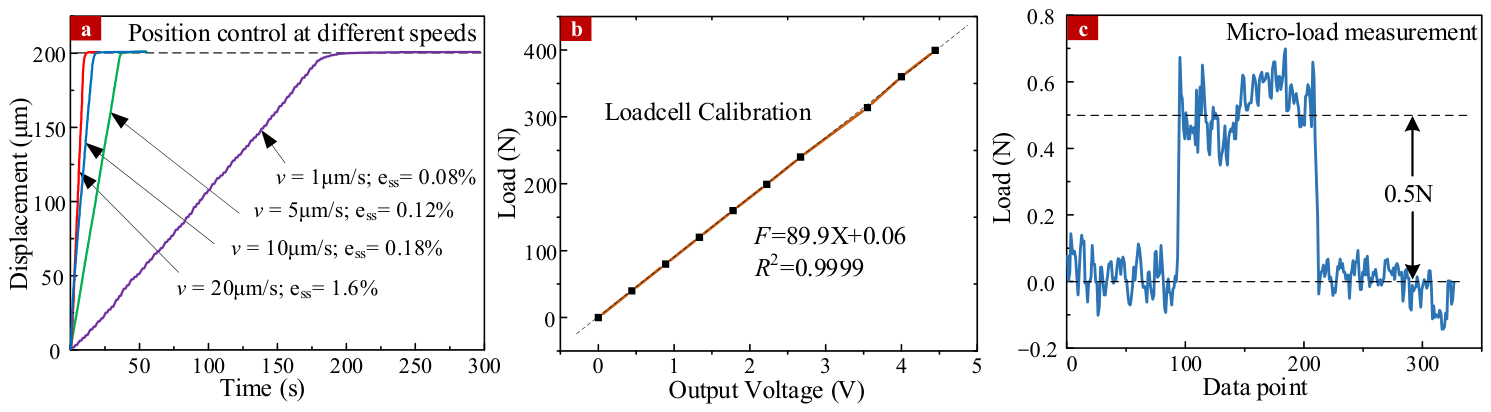
After PID parameter tuning, system control performance testing demonstrated that: within the tested loading speed range of 1–20 μm/s, the steady-state error of position control does not exceed 1.6%, as shown in
Figure 4a. Within the tested load range of 20–400 N, the steady-state error of force control does not exceed 1.2%. Following calibration of the load sensor with standard weights, the linear fit of voltage versus load achieved an R
2 of 0.9999, as shown in
Figure 4b. In addition to the closed-loop control accuracy, the practical force resolution of the system was verified using M1-class standard weights with a step increment of 0.5 N (
Figure 4c). These results indicate that the control system possesses good stability and precision, satisfying the requirements for in situ mechanical testing within an SEM.
Inspection confirmed that when the stage moves to its limit positions, a sufficient safety clearance remains between the instrument and the chamber wall, with no interference occurring. For vacuum compatibility verification, after installing the instrument and connecting the electrical wiring, the SEM vacuum chamber was evacuated to a vacuum level of 0.055 Pa, and the SEM was used to image bamboo clamped in the instrument, acquiring micromorphology images at various magnifications. In the high-magnification images, the specimen morphology was clear, with no image distortion or delamination observed, indicating that the weight and electromagnetic compatibility of the instrument satisfy the requirements for SEM integration.
2.4. Materials and Specimens
Specimens were harvested from three-year-old Moso bamboo (Phyllostachys edulis, Guangde, Anhui province, China), obtained from internodes approximately 2 m above ground level. To investigate the effect of different fiber volume fractions on the mechanical behavior of bamboo, bending specimens were cut from the outer, middle, and inner layers of the culm wall along the radial direction, with specimen dimensions of 60 mm (axial) × 4 mm (tangential) × 2 mm (radial), ensuring that the long axis was parallel to the fiber direction. The observation surfaces of the bending specimens were sequentially polished with 400- to 2000-grit sandpaper, vacuum-dried for 6 h, and then sputter-coated with gold using an ion sputtering coater to enhance electrical conductivity. A total of ten bending specimens were prepared from the three layers (five from the inner layer, three from the middle layer, and two from the outer layer). Three-point bending tests were then conducted for each specimen.
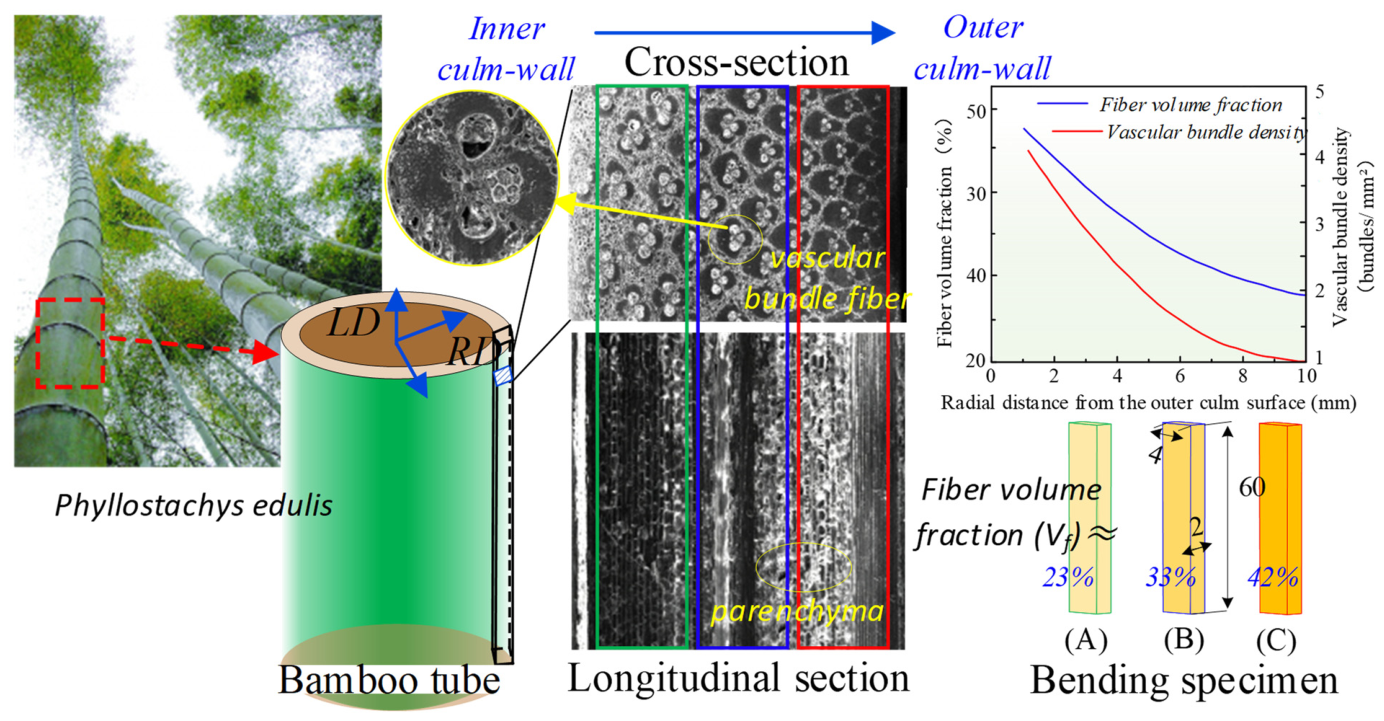
As shown in
Figure 5, bamboo exhibits the characteristics of a typical natural composite, consisting of a two-phase structure with parenchyma cells as the matrix and vascular bundle fibers as the reinforcement phase. According to SEM-acquired images, the flower-like tubular structures formed on the cross-section of bamboo are the vascular bundles, while the cubic-like structures formed on the longitudinal section are the densely packed parenchyma cells.
Along the radial direction of the culm wall, the fiber content exhibits a pronounced gradient distribution. From cross-sectional micrographs of the specimens, the fiber volume fraction was calculated to be approximately 42% in the outer layer, 33% in the middle layer, and 23% in the inner layer. The relationships between sampling position and vascular bundle fiber volume fraction and density are shown by the fitted curves in
Figure 5. This gradient distribution enables bamboo to achieve excellent mechanical properties through a composite effect of exterior rigidity and interior flexibility.
2.5. Experimental Methods
Each specimen was mounted on the three-point bending module with a loading rate of 4 μm/s and a bending span of 30 mm. The experiments were conducted in the SEM at an accelerating voltage of 5 kV and a working distance of 20–30 mm. Loading was initiated at an initial magnification of 500× while simultaneously recording the load–displacement curve; at key stages, the magnification was switched to 2000× to 5000× for high-magnification observation to capture crack initiation and propagation in real time. DIC analysis was performed using VIC-2D software (Correlated Solutions, Columbia, SC, USA.). The natural textures of parenchyma cells and fibers on the bamboo surface served as intrinsic speckle patterns, eliminating the need for artificial surface patterning. A subset size of 29 × 29 pixels with a step size of 7 pixels was adopted. Strain fields were computed from the recorded SEM image sequences to obtain the evolution of the full-field strain distribution during loading [
20].
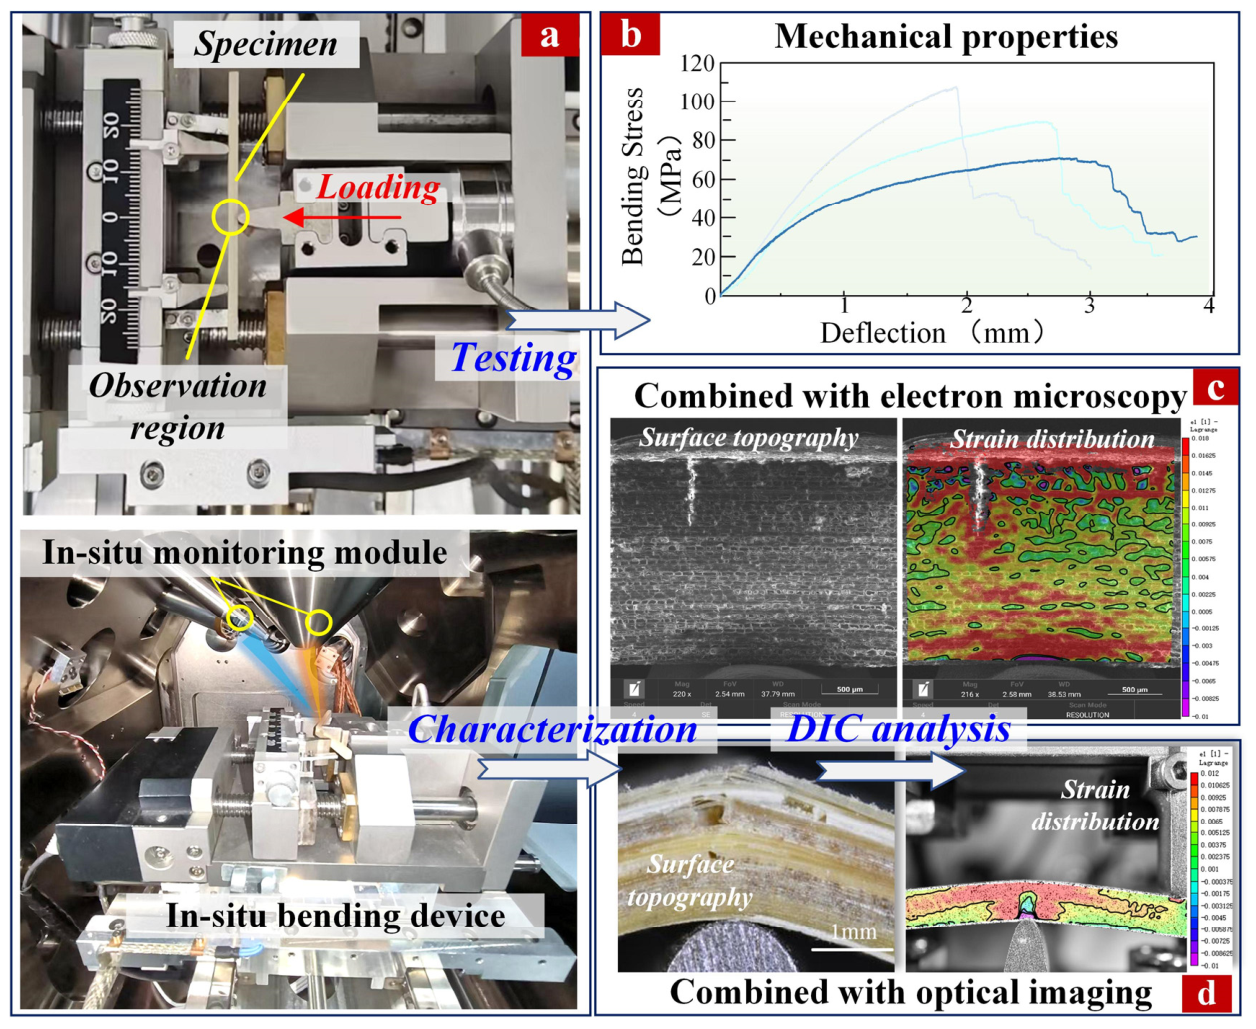
Figure 6a shows the overall installation of the instrument within the SEM chamber. The in situ testing technique proposed in this study enables the simultaneous acquisition of load–displacement curves, SEM failure-evolution image sequences, and strain field contour maps within a single experiment. The bending behavior of the specimens is characterized from three complementary dimensions: macroscopic mechanical response, microscopic morphological evolution, and micro-regional strain distribution, together providing a comprehensive description of the bending mechanical behavior of native bamboo. Additionally, the in situ bending instrument can be coupled with optical microscopes, high-speed cameras, and other imaging devices to enable multi-scale mechanical characterization of bamboo.
This study employed engineering strain for material deformation analysis, defined as follows [
21]:
where
D is the midspan deflection of the specimen,
d is the specimen thickness, and
L is the bending span.
Using the above equation and the measured load–displacement curve, the flexural stress–strain curve was obtained, and the flexural strength
σmax was calculated. The flexural modulus of elasticity was determined from the initial linear portion of the stress–strain curve by linear regression. The strain range for fitting was selected within the 1%–8% strain window to avoid the initial seating effect at lower strains, while the upper limit was adjusted to the proportional limit of each specimen. The slope of the linear fit with a coefficient of determination (R
2) greater than 0.99 was taken as the modulus, with these two parameters characterizing the stiffness and strength of bamboo, respectively. The fracture work
Wf was further calculated using Equation (2), defined as the area enclosed by the stress–strain curve, representing the toughness of bamboo [
22].
where
εf is the fracture strain, and
σ is the flexural stress.
3. Results
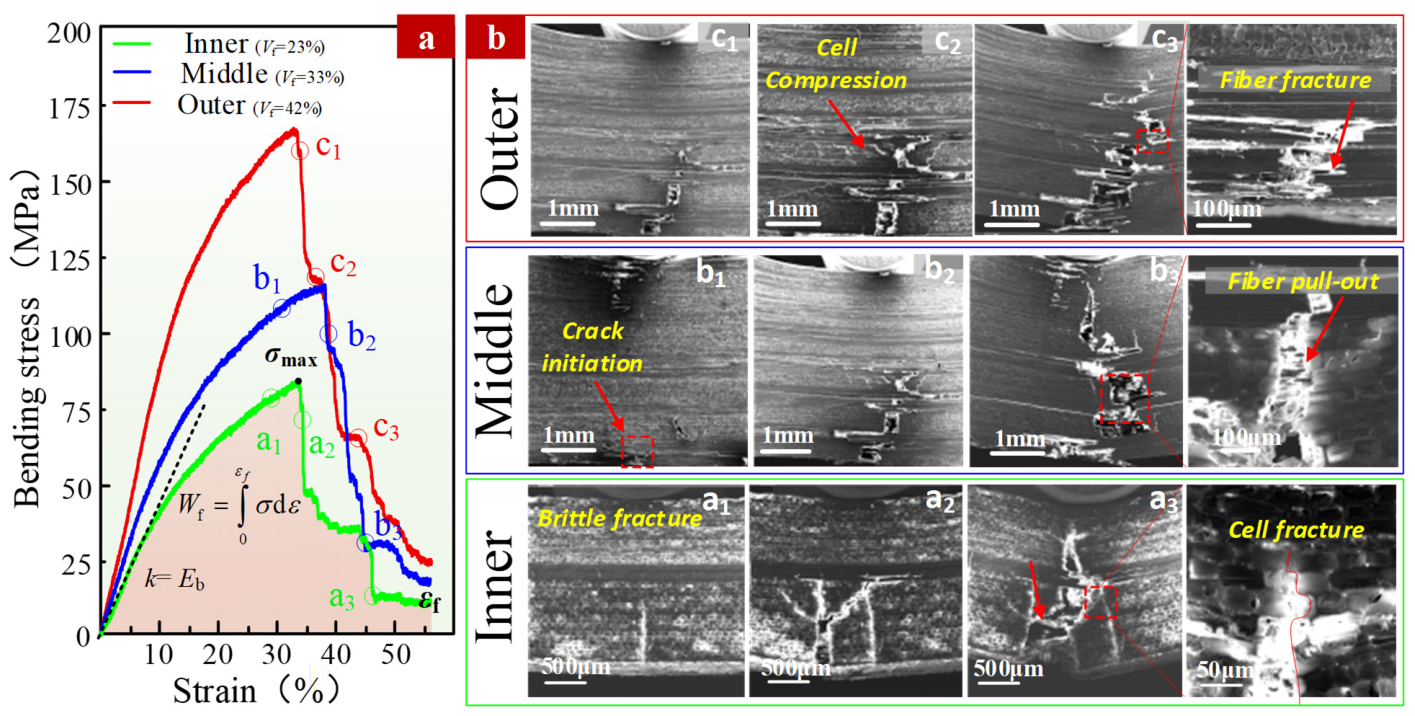
Figure 7 presents the in situ bending test results for bamboo with different fiber contents, including stress–strain curves and synchronously acquired SEM images of failure behavior.
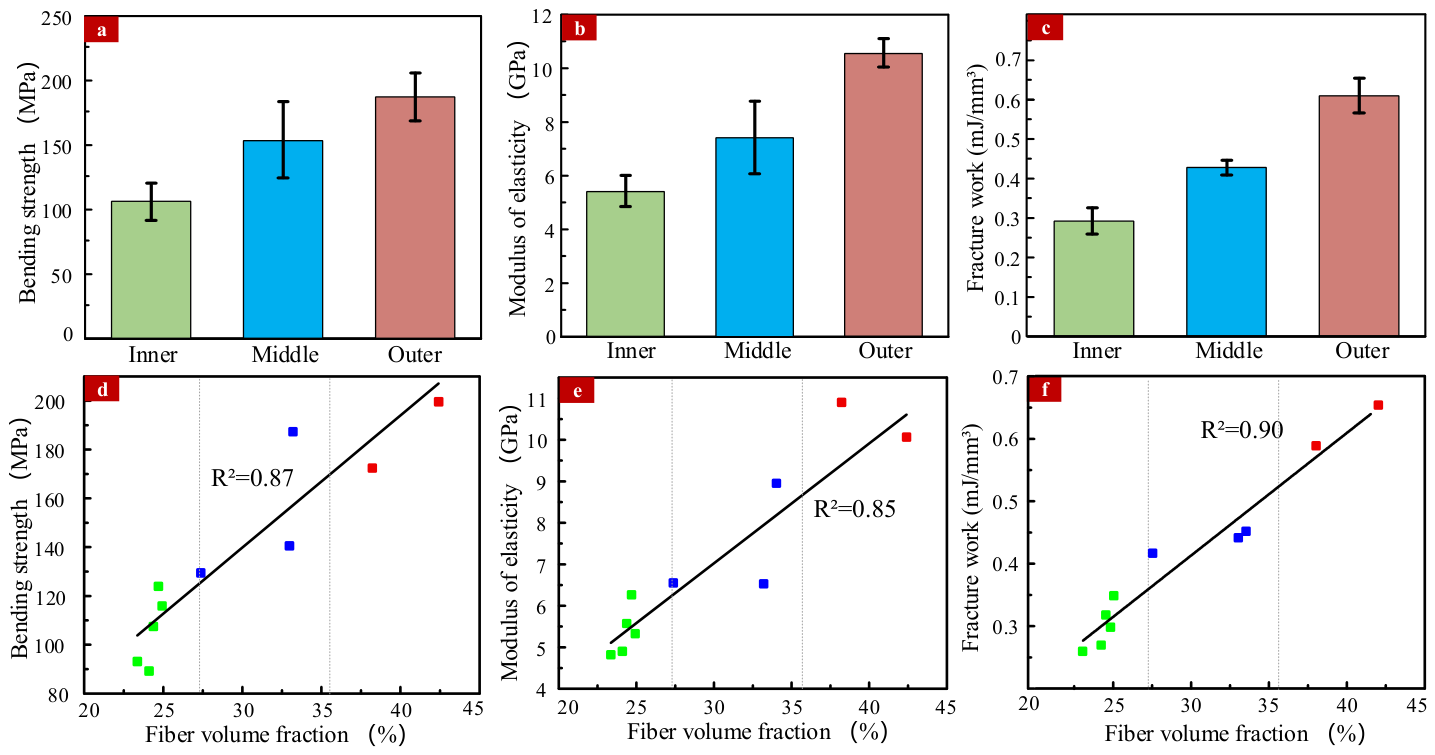
Figure 7a shows representative curves and images for one specimen from each layer (outer, middle, inner). Those three specimens shown were taken from the outer layer (~42% FC), middle layer (~33% FC), and inner layer (~23% FC) of the culm wall, exhibiting a pronounced gradient in fiber content. The variations in flexural modulus, flexural strength, and fracture work with fiber content, as determined from the bending curves, are shown in
Figure 8.
The outer layer specimen exhibited the steepest initial slope of the stress–strain curve, corresponding to an average flexural modulus of approximately 10.5 GPa and an average flexural strength of 170 MPa (
Figure 8a,b), followed by a sharp drop after the peak with large-scale serrated attenuation (
Figure 7a). SEM images (
Figure 7b, outer layer sequence) revealed that under bending loads, parenchyma cells between fibers underwent extensive collapse and densification, with the final failure occurring in a mixed mode of fiber delamination, pull-out, and fracture, resulting in a rough and irregular fracture surface. The area under the curve, i.e., the fracture work, was the highest, indicating that the high-fiber-content outer layer exhibits excellent energy absorption capacity while maintaining high strength.
The middle layer specimen exhibited an average flexural modulus of 7.3 GPa and a flexural strength of approximately 153 MPa (
Figure 8a,b), intermediate between those of the outer and inner layers. SEM images (
Figure 7b, middle layer sequence) showed that cracks first initiated longitudinally within the parenchyma tissue, then propagated transversely along the fiber bundles, accompanied by fiber pull-out and fracture, with a fracture morphology intermediate between the irregular fracture surface of the outer layer and the flat fracture surface of the inner layer. The fracture work was approximately 0.44 mJ/mm
3 (
Figure 8c).
The inner layer specimen exhibited the lowest flexural modulus (~5.3 GPa) and a flexural strength of approximately 106 MPa (
Figure 8a,b). The stress–strain curve dropped nearly vertically after the peak (
Figure 7a), and SEM images (
Figure 7b, inner layer sequence) revealed that cracks rapidly penetrated the parenchyma tissue after initiation, producing a flat fracture surface characteristic of typical brittle fracture. The fracture work was the lowest (~0.30 mJ/mm
3) (
Figure 8c).
The measurement results indicate that the fiber volume fraction, flexural modulus, and strength of native bamboo all exhibit significant positive linear correlations (
Figure 8a–c): as the fiber content increases from 23% to 42%, the modulus and strength increase by approximately 5.2 GPa and 64 MPa, respectively. The fracture work also showed a significant increasing trend with fiber content: 0.30 mJ/mm
3 for the inner layer (~23% FC), 0.44 mJ/mm
3 for the middle layer (~33% FC), and 0.62 mJ/mm
3 for the outer layer (~42% FC).
The data presented in
Figure 8 represent the measured values from individual specimens. The sample size was constrained by the difficulty of obtaining flat strips from each layer of the curved culm wall, as well as the high cost and limited access to in situ SEM testing. The linear fits and corresponding R
2 values are intended to illustrate general trends rather than to establish statistically rigorous predictive relationships.
4. Discussion
Bamboo can be regarded as a layered composite material comprising parenchyma cells and vascular bundles with varying volume fractions and stacking sequences [
23]. Accordingly, the failure modes observed in different regions can be categorized by their local layer configurations. The classification approach in this study follows the framework established in a previous micro-CT study on bamboo fracture [
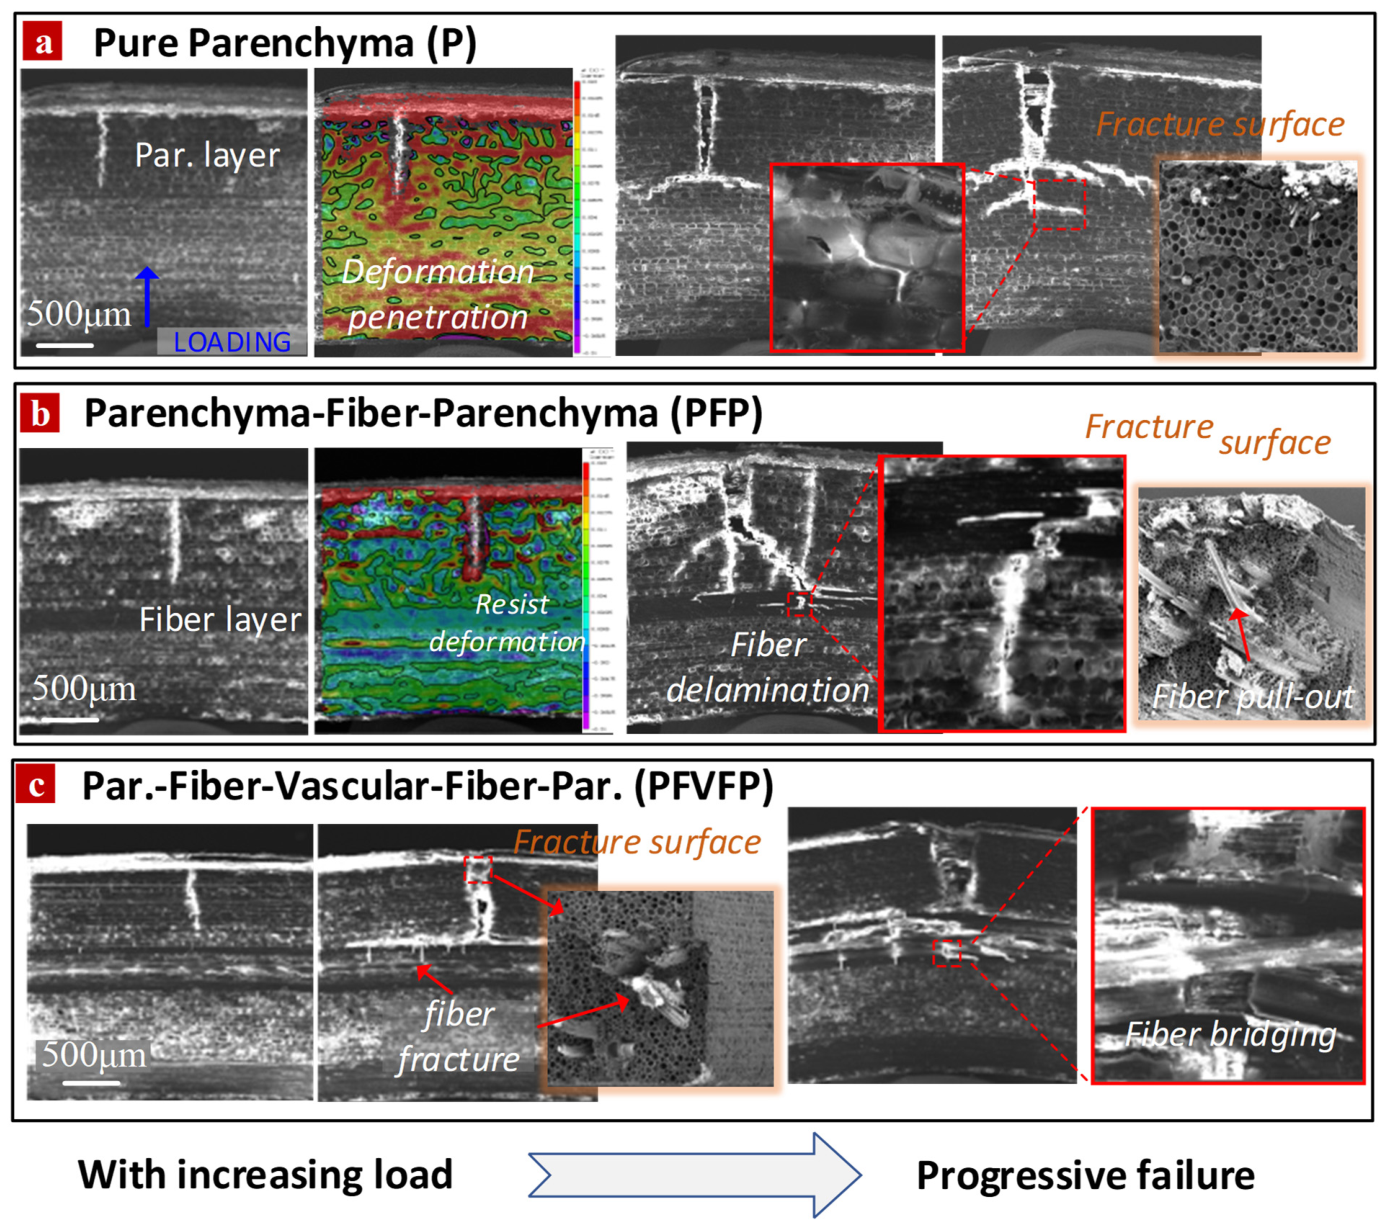
24], where similar tissue arrangements were categorized according to the sequential distribution of parenchyma, fibers, and vessels along the loading direction. It should be noted, however, that the classification is based on the features visible in the SEM cross-section, rather than on assumptions about the internal three-dimensional structure. The same specimen, if further polished to reveal a deeper plane, might exhibit a different arrangement of fibers and parenchyma. Nevertheless, a deterministic trend exists: as the sampling position moves from the inner to the outer layer of the culm wall, the vascular bundle density increases. This means that the probability of observing fiber-rich cross-sections (PFP or PFVFP patterns) is higher in the outer layer, whereas parenchyma-dominated cross-sections (P type) are more likely to appear in the inner layer. Based on this understanding, the failure was classified into three fundamental modes according to the arrangement characteristics of fibers and parenchyma tissue within the SEM observation regions, as illustrated in
Figure 9.
(1) Pure Parenchyma structure (P Type)
When the loaded structure consists predominantly of parenchyma tissue with only a small amount of transverse fiber structures, the failure type is designated as P type. The stress–strain curve exhibits linear growth followed by an abrupt drop in stress. The SEM sequence shows cracks rapidly propagating from the outer surface of the specimen along parenchyma cell walls to form penetrating crack networks, with a flat fracture surface, as shown in
Figure 9a. Due to the absence of transverse fiber layers to impede crack propagation, the DIC strain distribution reveals that strain penetrates directly through the parenchyma tissue layer from the loading point of the bending fixture. Because the fracture surface is straight and the crack encounters no effective obstruction, this fracture mode is the least favorable for energy dissipation.
(2) Parenchyma–Fiber–Parenchyma layered composite structure (PFP Type)
When distinct fiber layers are present in the loaded structure, a sandwich-like PFP structure is formed, as shown in
Figure 9b. The SEM sequence shows cracks initiating in the outer parenchyma tissue and, upon reaching the fiber layer, encountering a significant barrier effect. The strain distribution clearly reveals that the fiber layer resists the continued radially directed deformation, although strain develops and accumulates at the fiber interface. With further increases in load, the cracks extend into the fiber layer, eventually breaching the fiber barrier, with interfacial debonding occurring within the layer, and the fibers bend and ultimately pull out and fracture, producing an irregular stepped fracture surface. SEM images further reveal that parenchyma cells beneath the fibers undergo geometric collapse and densification. Notably, compared with the P-type, crack deflection occurs in this mode through the obstruction provided by fiber bundles. Therefore, the energy dissipation is improved to a certain degree.
(3) Parenchyma–Fiber–Vascular–Fiber–Parenchyma layered composite structure (PFVFP Type)
When complete vascular bundle structures are present in the loaded region, the complex PFVFP structure is formed, as the vascular bundles contain both fiber bundles and hollow vessels, as shown in
Figure 9c. Cracks form and propagate rapidly within the parenchyma tissue, then undergo deflection upon encountering fiber bundles and extend along the fiber cross-sections. With further deformation, the fiber bundles fracture and pull out, and fiber bridging occurs. This is a typical toughening mechanism in bamboo. Furthermore, cracks penetrate the vessels and continue to propagate in the fiber bundles below. Due to the constraint of multiple fiber bundles, the crack propagation path becomes highly tortuous, with significantly increased trends of fiber fracture, pull-out, and bridging. Therefore, among the three modes, this mode dissipates the most energy.
It is noteworthy that specimens with different fiber contents incorporate the above three types of regions in different proportions, and thus their fracture and failure behavior can be understood as a combination of the three failure modes. The outer layer is dominated by PFP and PFVFP types, the middle layer is a mixture of PFP and P types, and the inner layer is dominated by the P type. This difference in the proportions of failure modes determines the gradient distribution of strength and toughness across the three layers.
Based on the mechanical curves, SEM failure evolution images, and DIC strain-field data obtained from the in situ bending tests, the strengthening and toughening mechanisms of bamboo were analyzed from the perspective of composite mechanics. As a natural fiber-reinforced composite, bamboo exhibits a synergistic enhancement of both strength and toughness through its fiber–parenchyma composite structure, rather than following the strength–ductility trade-off universally observed in homogeneous materials. The macroscopic mechanical behavior of bamboo depends on the individual characteristics of fibers and parenchyma cells and their coupled interactions. The strong correlations between fiber volume fraction and modulus and strength, along with the pronounced gradient in mechanical properties from the inner to the outer layer, indicate the contribution of fibers as the high-modulus reinforcement phase.
The deformation and failure processes captured under the SEM reveal that the toughness enhancement of bamboo is achieved through three extrinsic toughening mechanisms. First, parenchyma cell collapse densification occurs: under bending loads, densely packed fiber layers exert strong transverse compression on the intervening parenchyma cells, triggering collapse and energy absorption. The in situ SEM images directly recorded this process, and the DIC strain fields quantified the strain-barrier effect at the fibers. Second, interfacial debonding and fiber pull-out: the modulus mismatch between the high-modulus fibers and the parenchyma cells leads to strain concentration at the interface, triggering debonding and subsequent fiber pull-out, which absorbs substantial energy. Third, fiber-induced crack deflection: upon encountering fibers, cracks undergo transverse deflection, increasing the propagation path and energy dissipation, which is particularly pronounced in regions dominated by parenchyma cells. These three mechanisms collectively explain the trend of increasing fracture work with fiber content: higher fiber content not only provides direct load-bearing capacity but also enhances the extrinsic toughening mechanisms, achieving a synergistic enhancement of both strength and toughness. This distinguishes bamboo from homogeneous materials governed by the strength-ductility trade-off [
25].
To assess the reliability of the measurements, the measured flexural properties were compared with previously reported data. Chen et al. [
21] reported flexural strengths ranging from approximately 107 to 159 MPa for Moso (
Phyllostachys edulis) bamboo with vascular bundle contents ranging from ~25% to ~50%. This range is consistent with our measured average flexural strengths, which ranged from 106 MPa (inner, ~23% fiber content) to 170 MPa (outer, ~42% fiber content). The gradient trend—strength increasing with fiber content from the inner to the outer layer—is also consistent with Han et al. [
3]. This consistency with established knowledge supports the validity of the in situ testing methodology and the reliability of the instrument. It should be noted, however, that direct quantitative comparisons should be interpreted with caution, as bamboo mechanical properties are sensitive to species, moisture content, and age.
Despite the capabilities demonstrated above, several limitations should be noted. Specimen dimensions are constrained by the SEM chamber (maximum length: 60 mm), and load capacity is limited by the transmission components, although the load cell can be replaced to reach 2000 N. The loading rate is restricted to quasi-static conditions, and slight image drift may occur above 1000× due to the lack of ball screw self-locking and sample creep. For SEM-based DIC, measurement accuracy depends on the quality of the natural surface texture of bamboo, which may introduce strain errors; nevertheless, it remains a valuable tool for localized microscale strain analysis.
5. Conclusions
(1) An in situ SEM three-point bending testing instrument was developed with a load range of 0–450 N, a force resolution of 0.5 N, and a displacement resolution of 1 μm. The instrument features a stationary central indenter and symmetrically moving supports, ensuring that the region of interest remains stable within the SEM field of view throughout the test.
(2) Using this instrument, in situ bending tests on bamboo revealed that fiber volume fraction governs the flexural properties in a positive correlation: as the fiber content increases from 23% to 42%, the flexural modulus, strength, and fracture work all increase substantially. Three extrinsic toughening mechanisms were identified: fiber-induced crack deflection, parenchyma cell collapse densification, and fiber–parenchyma interfacial debonding. A P/PFP/PFVFP microstructural failure classification framework was established, revealing that the gradient distribution of strength and toughness across the culm wall is closely associated with the varying proportions of these failure modes.
(3) This study provides a new approach for investigating the mechanical behavior of natural fiber composites. The method combines in situ SEM loading with the simultaneous acquisition of mechanical curves, failure-evolution images, and DIC strain fields. However, the current instrument has limitations. It operates only under high-vacuum conditions, which prevents direct testing of moist samples. Moreover, the sample size is limited. This is due to two factors: the difficulty of preparing flat strips from the curved bamboo culm, and the time-consuming nature of in situ tests. The testing protocol requires frequent interruptions at each loading step to acquire high-magnification SEM images, which significantly extends the duration of each individual test.
(4) Future work may extend the instrument to additional loading modes through interchangeable fixtures and apply the methodology to other natural fiber-reinforced composites (e.g., hemp, palm, wood-based materials) and engineered bamboo products (e.g., laminated bamboo lumber, bamboo scrimber). To address the moisture-content effect, future integration with ESEM or CLSM platforms—which permit observation under controlled humidity—would enable in situ testing of moist samples, thereby bridging the gap between laboratory characterization and real-service conditions.