1. Introduction
Wildfires are a major disturbance across global terrestrial ecosystems. They threaten forest resources while regulating biodiversity, ecosystem services and the global carbon cycle [
1,
2]. Although the total number of wildfires and burned areas has declined since 2000, the frequent occurrence of recent megafires indicates that wildfires pose unprecedented risks to human lives, socio-economic systems and ecological environments [
3,
4,
5]. In subtropical ecosystems, climatic anomalies and monsoon-driven seasonal droughts have become critical amplifiers of wildfire susceptibility [
6,
7]. These regions feature distinct seasonal precipitation regimes that alternate between vegetation fuel accumulation and fire-prone dry periods [
8,
9]. Nonetheless, drought–wildfire linkages exhibit strong spatiotemporal heterogeneity, and the mechanisms by which short-term lagged drought modulates high-intensity fire events remain insufficiently understood. Elucidating such lag-dependent drought–fire relationships is critical for supporting climate-adaptive wildfire management and ecological early warning systems [
10,
11,
12].
Global warming intensifies droughts through rising temperatures and precipitation deficits. These droughts elevate wildfire risks by drying fuels and disrupting vegetation dynamics. Meteorological observations and satellite remote sensing evidence confirm that prolonged moisture deficits reduce the water content of live and dead fuels, acting as a critical precondition for wildfire ignition and spread [
12,
13,
14]. While drought alone cannot trigger fire events, it substantially primes landscape flammability and increases the likelihood of high-intensity burning [
15,
16]. The mechanisms vary across ecosystems. In temperate forests, warmer springs accelerate snowmelt, while subsequent summer droughts desiccate fuels, amplifying fire risks [
17,
18]. In arid regions, reduced rainfall during fire seasons limits soil moisture and hinders vegetation recovery. Conversely, antecedent wet periods may increase fuel loads by promoting the growth of ephemeral plants [
19]. By suppressing soil moisture and creating temporal mismatches in water availability, drought indirectly modulates fuel dynamics. Early studies on wildfire regimes primarily focused on correlating fire activity with basic meteorological variables, particularly temperature and precipitation. With methodological advances, comprehensive drought indices including the Standardized Precipitation Evapotranspiration Index (SPEI), together with atmospheric indicators including vapor pressure deficit (VPD) and vapor pressure (VAP), have been widely adopted [
9,
20]. These multi-dimensional indices effectively characterize atmospheric aridity, soil water deficit and land surface water balance, providing improved mechanistic insights into drought-driven wildfire dynamics under climate change.
Wildfire regimes respond simultaneously to concurrent and lagged climatic effects, yet their underlying ecological mechanisms differ substantially [
21]. Concurrent dry weather directly accelerates fuel desiccation and flammability, triggering synchronized fire ignition and propagation across landscapes. In contrast, lagged climate conditions, such as antecedent droughts, indirectly modulate fire risk by altering fuel load and structure over time. These delayed effects arise from ecological memory, where persistent moisture deficits interact with gradual fuel accumulation to establish thresholds for future fire activity. However, current models often overlook these legacy effects, limiting mechanistic understanding and predictive accuracy [
11]. Concurrent drought mainly elevates fire risk through immediate VPD-induced aridity, while lagged drought plays a subtle but pivotal role in preconditioning landscapes for severe burning in subsequent months. Ignoring such cross-temporal interactions hinders the reliable simulation of climate–fire feedbacks [
10]. This includes cases where antecedent humid conditions paradoxically elevate fire risk through fuel accumulation before subsequent drying. Accordingly, quantitatively disentangling wildfire responses to both concurrent and antecedent drought is indispensable for revealing intrinsic climate–fire relationships and improving spatiotemporal predictive modeling.
Vegetation dynamics strongly mediate climate–fire relationships by altering surface coverage, productivity and fuel structural properties [
22,
23]. Fuel architecture critically influences fire intensity. Vertically continuous canopies and dense understory vegetation facilitate rapid crown fire propagation, compounding drought-driven risks [
24]. Topographic complexity and human infrastructure such as roads and residential settlements also introduce pronounced spatial heterogeneity in fire responses across regions [
25]. However, how bottom-up environmental controls regulate lagged fuel accumulation and real-time flammability remains poorly understood along ecological gradients. Clarifying this dual regulatory role is critical for identifying dominant factors and spatial patterns of fire occurrence. Therefore, quantifying drought–wildfire interactions across multiple temporal scales and environmental gradients is essential for revealing the mechanisms underlying the spatial heterogeneity of wildfire regimes and supporting refined ecological modeling and fire risk assessment.
Statistical models are widely applied to quantify drought–wildfire relationships and estimate the sensitivity of fire activity to climatic and environmental drivers [
17,
26]. Such approaches have been successfully used to interpret fire responses across diverse biomes, including coniferous forests, boreal woodlands and tropical savannas [
21,
27,
28]. However, conventional statistical methods often assume linearity and spatial homogeneity, which oversimplify real ecological processes [
29,
30]. Identical drought conditions can produce opposing fire responses across landscapes. They may suppress fires in humid montane forests by sustaining fuel moisture. Yet they can simultaneously increase fire risk in arid lowlands through rapid fuel drying [
31]. Time-lagged effects further complicate these dynamics. Prolonged drought progressively depletes moisture reserves in dense forests. This primes conditions for catastrophic fires in subsequent months. Additionally, traditional models ignore temporal autocorrelation and treat wildfire events as independent observations, leading to statistical bias in parameter estimation. Accordingly, advanced modeling frameworks are required to disentangle spatially heterogeneous climatic impacts and bottom-up controls, incorporate multi-scale temporal lag effects, and account for observational uncertainty in ecological fire analysis.
Subtropical China features a typical monsoon climate and complex terrain, making it an ideal natural laboratory for exploring interactions between drought dynamics and wildfire regimes. This region accounts for 84.7% of total wildfire events across China [
32,
33]. High-intensity wildfires here show distinctive spatiotemporal features and have become a major research focus [
3]. Large-scale climatic oscillations such as ENSO regulate seasonal drought stress, modify fuel availability, and further elevate the likelihood of extreme wildfire events [
33]. Climatic anomalies interact with vegetation biomass accumulation, shaping complicated feedbacks between drought and wildfire regimes in subtropical forest ecosystems. Therefore, quantifying the spatiotemporal variability of wildfire sensitivity to drought is essential for optimizing fire prevention planning and predicting future fire dynamics. Previous studies have confirmed that wildfire susceptibility to climatic drivers differs markedly across subtropical China. Southwestern fires are strongly linked to minimum relative humidity. Southeastern fires are primarily driven by humidity fluctuations [
34]. However, a systematic assessment of when and where wildfires are most vulnerable to drought remains elusive. This knowledge gap hinders the development of regional adaptive fire management. Although strict fire suppression policies have effectively reduced human-caused ignitions derived from agricultural activities and land-use transitions [
8,
9], the mechanisms governing drought-driven natural wildfire dynamics remain poorly elucidated.
In this study, we integrated long-term satellite remote sensing products and drought datasets to characterize the spatiotemporal patterns of high-intensity wildfires across subtropical China. We aimed to establish quantitative relationships between wildfire activity and drought conditions across multiple temporal scales. A zero-inflated negative binomial generalized linear mixed model (ZINB-GLMM) was adopted to disentangle the independent and interactive effects of drought indices and local environmental factors on wildfire occurrence. We then conducted spatially explicit assessments to evaluate model performance at the optimal lag timescale. Specifically, we addressed: (1) When and where were high-intensity wildfires most strongly correlated with concurrent and lagged drought? (2) Which drought variables and local background factors dominated wildfire dynamics across different temporal scales? (3) How did the predictive capability of the drought–wildfire model vary across the study area?
2. Materials and Methods
2.1. Study Area
The study area covers approximately 2.87 million km
2 across mainland South China (
Figure 1a) and features a typical subtropical monsoon climate. The mean annual temperature ranges from 15 °C to 22 °C, and the average annual precipitation is around 1300 mm, with roughly 75% of rainfall concentrated between June and November. Average forest coverage exceeds 55%. Growing stock totals over 7.2 billion cubic meters, ranking among the highest in the country [
35]. Road density exhibits marked spatial heterogeneity. The four subregions were delineated following the established eco-geographical regionalization framework for subtropical China [
32,
33]. Specifically, the northwest subregion (I) includes the Sichuan Basin and Hengduan Mountains, dominated by mixed coniferous and broadleaf forests; the northeast (II) covers Zhejiang, Jiangsu, and Hubei provinces, characterized by typical subtropical evergreen broadleaf forests; the southeast (III) encompasses Guangdong, Guangxi, Fujian, and Jiangxi, featuring tropical–subtropical transitional forests and karst landscapes; and the southwest (IV) comprises Yunnan and Guizhou provinces together with western Sichuan, featuring complex terrain and high forest cover. This subregional delineation ensures environmental homogeneity within each zone for subsequent analysis, and the grid-based zoning scheme adopted here provides a typical case for spatial hierarchical analysis in ecological informatics and spatiotemporal modeling.
2.2. Research Framework
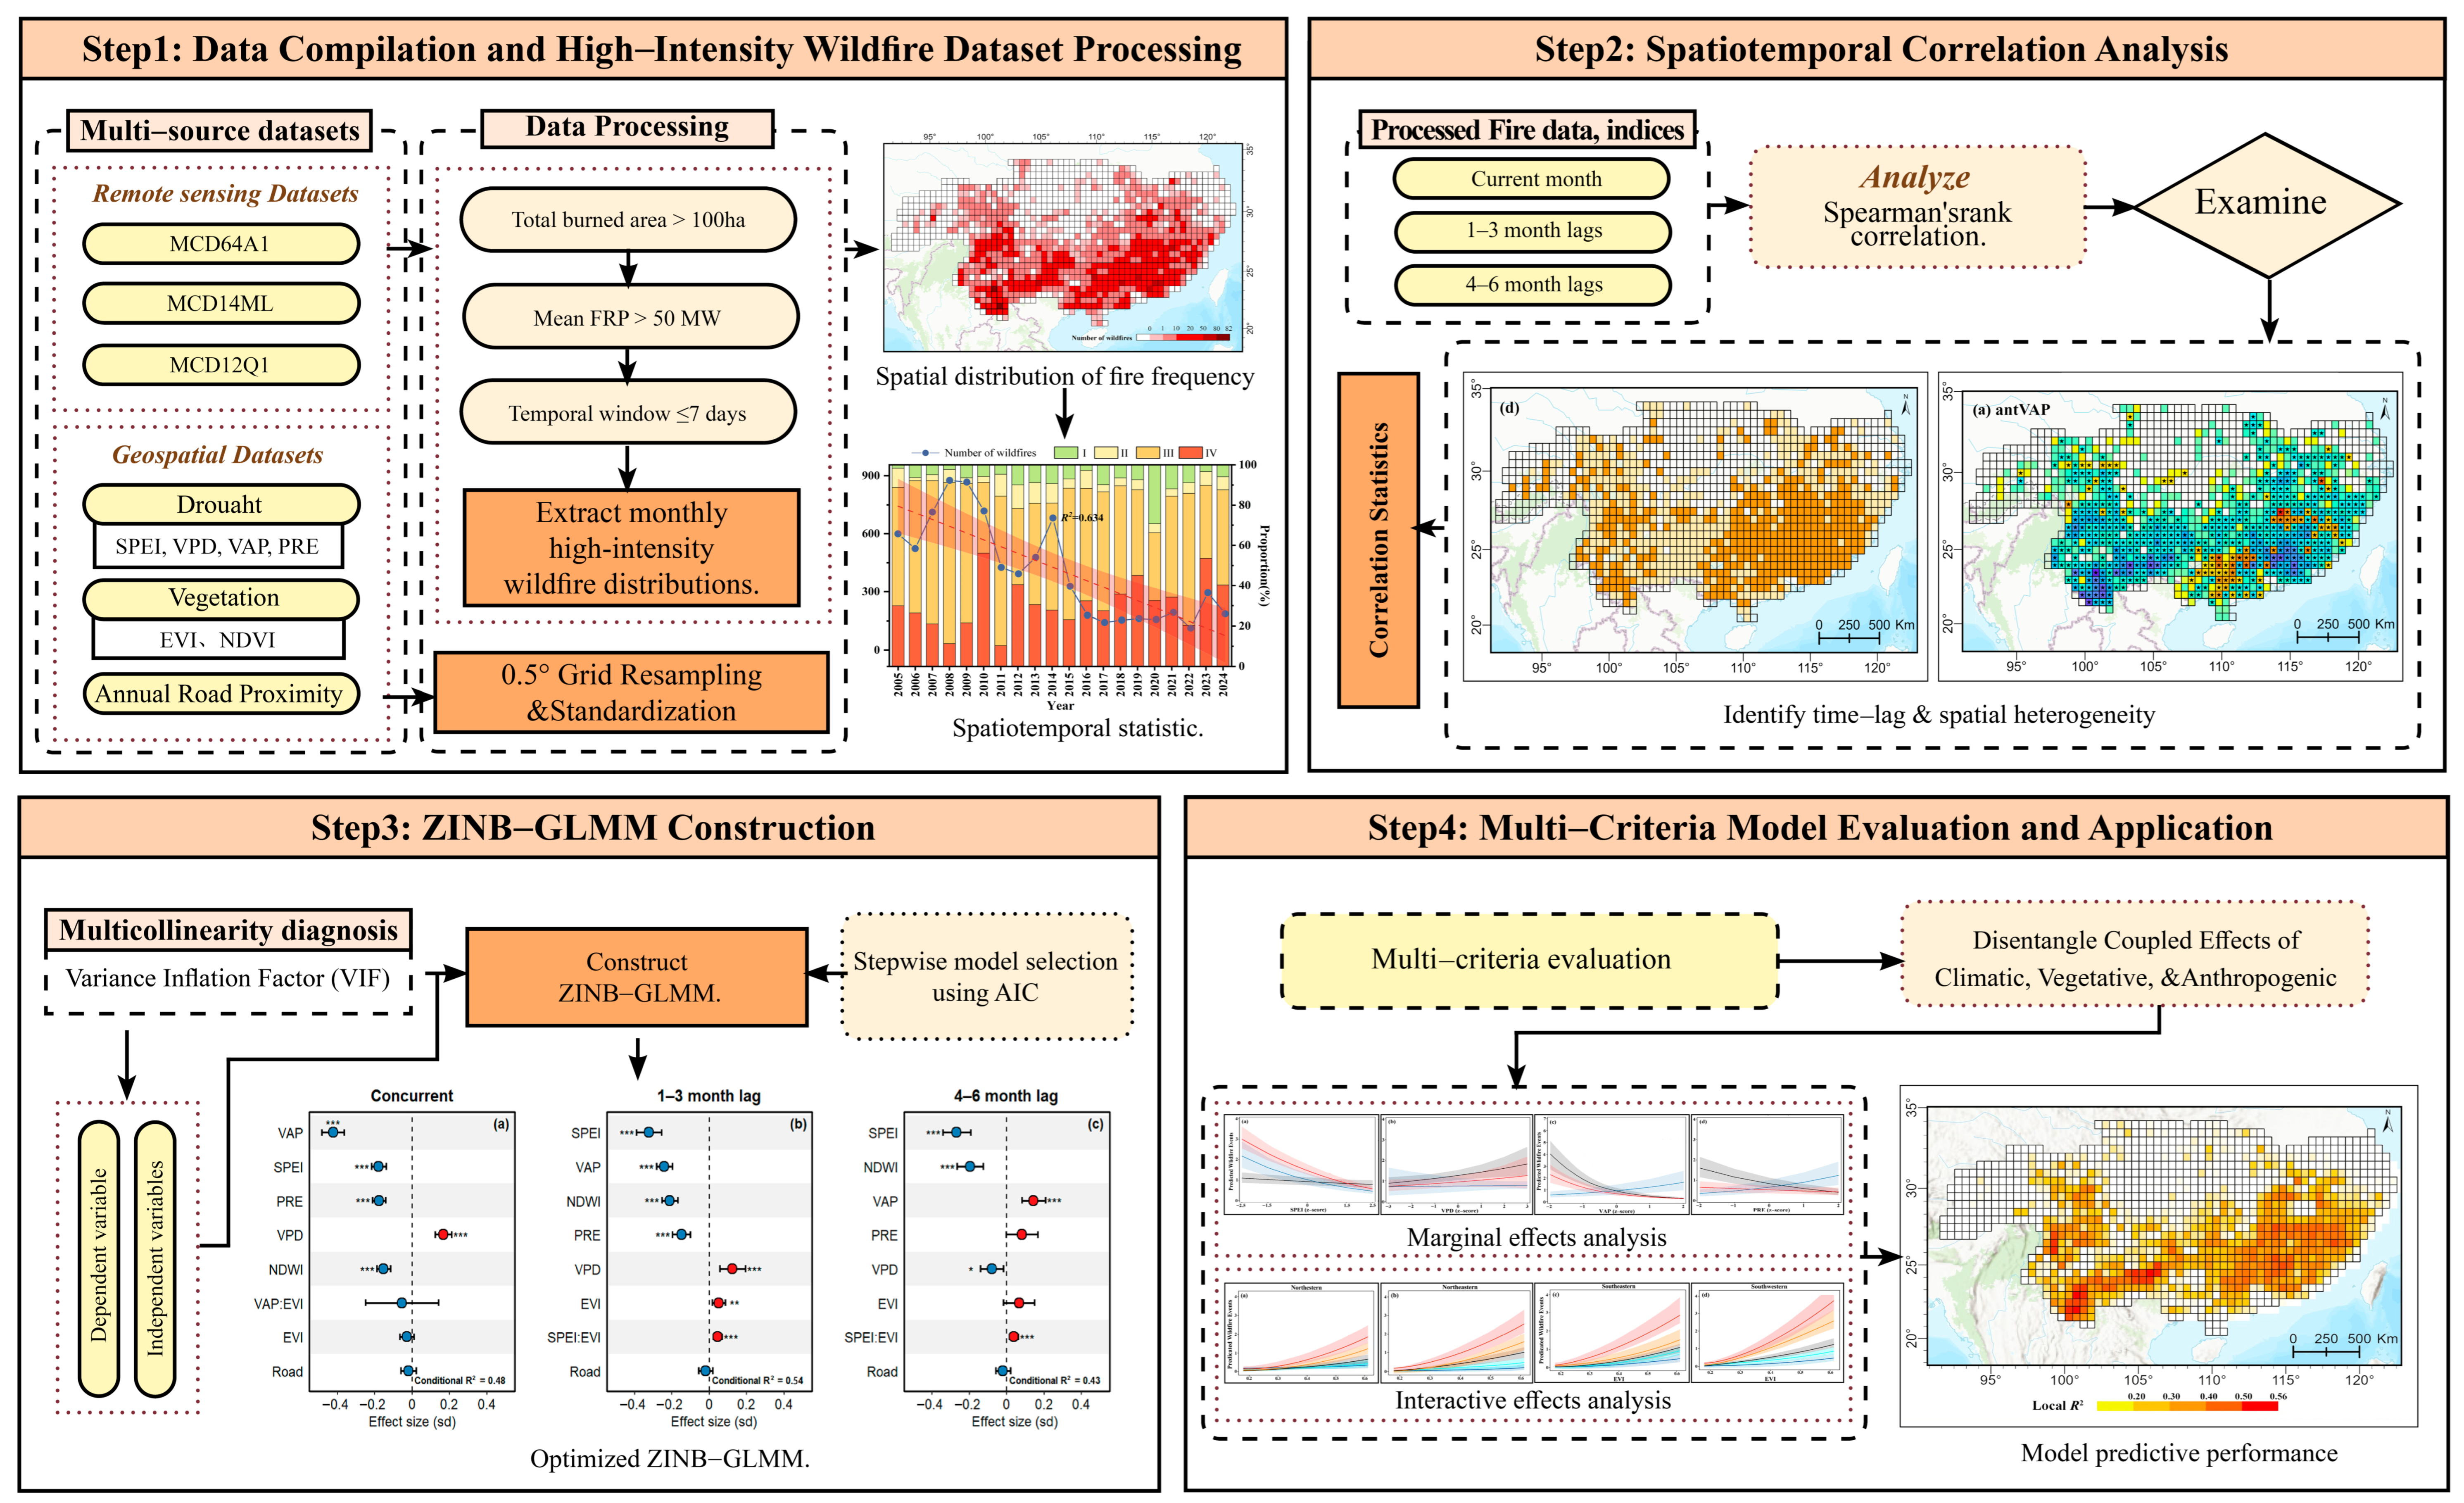
This study adopted a four-step analytical framework (
Figure 2). Step 1 compiled and preprocessed multi-source remote sensing and geospatial datasets. Fire-related products were processed via spatiotemporal clustering to extract monthly distributions of high-intensity wildfires. Monthly drought indices, vegetation indices and annual road proximity data were integrated, and all datasets were resampled to a 0.5° grid for subsequent analysis. Step 2 conducted spatiotemporal correlation analysis at concurrent, 3-month lag and 6-month lag timescales using Spearman’s rank correlation. Step 3 constructed ZINB-GLMM to quantify the relationships between high-intensity wildfire counts, drought and bottom-up controls. Step 4 carried out multi-criteria evaluation and mapped the spatial patterns of model predictive performance. This framework integrated remote sensing time-series mining, ecological informatics and spatiotemporal modeling to identify the key drivers governing high-intensity wildfire dynamics across subtropical China.
2.3. Data Compilation and Preprocessing
2.3.1. Wildfire Event Dataset
To identify high-intensity wildfire events, we adopted two standard MODIS remote sensing products, namely the MCD64A1 burned area product (Collection 6) and the MCD14ML active fire product (Collection 6.1). We first extracted forest burned patches from the MCD64A1 dataset. For the period 2005–2024, we retained burned pixels classified as forests, closed shrublands and woody savannas (IGBP codes 1–8 and 10) based on the annual MCD12Q1 land cover product. These pixels collectively represented forest burned areas across the study region.
We then integrated the MCD14ML active fire product to identify high-intensity wildfire events within the forest burned areas mentioned above. The MCD14ML dataset provides 1-km pixel-level thermal anomaly records, including geographic coordinates, acquisition time, confidence level and fire radiative power (FRP). These individual point observations cannot directly represent discrete wildfire events but serve as proxies for active burning. From MCD14ML, we selected candidate high-intensity thermal anomalies using an FRP threshold greater than 50 MW. This threshold is consistent with values used to identify rapidly spreading fires in subtropical ecosystems [
1]. We adopted a remote sensing fusion clustering algorithm combining the two MODIS fire products to develop an improved workflow for extracting discrete high-intensity fire information. We then applied spatiotemporal clustering to group fire points into independent wildfire events following standard protocols from previous studies [
36,
37]. Fire detections within a 2 km spatial distance and a 7-day temporal window were merged into an initial fire cluster [
38].
For each cluster, we extracted all MCD64A1 burned pixels that spatially overlapped with cluster points and whose burn dates fell within the cluster’s temporal window. The total burned area of each fire event was calculated by summing the corresponding burned pixels. High-intensity wildfire events were formally defined as:
where
is the mean FRP of all candidate points in cluster
j, and
is the total burned area derived from MCD64A1. We established a reproducible extraction framework that couples FRP magnitude and burned area, which can be readily transferred to subtropical and other monsoon regions. This dual-threshold definition ensures that the delineated events correspond to ecologically and climatologically meaningful high-intensity wildfires with strong radiative intensity and large burned extents [
1]. The selected thresholds were validated through a sensitivity analysis across alternative FRP and burned area values, with detailed results provided in
Table A1.
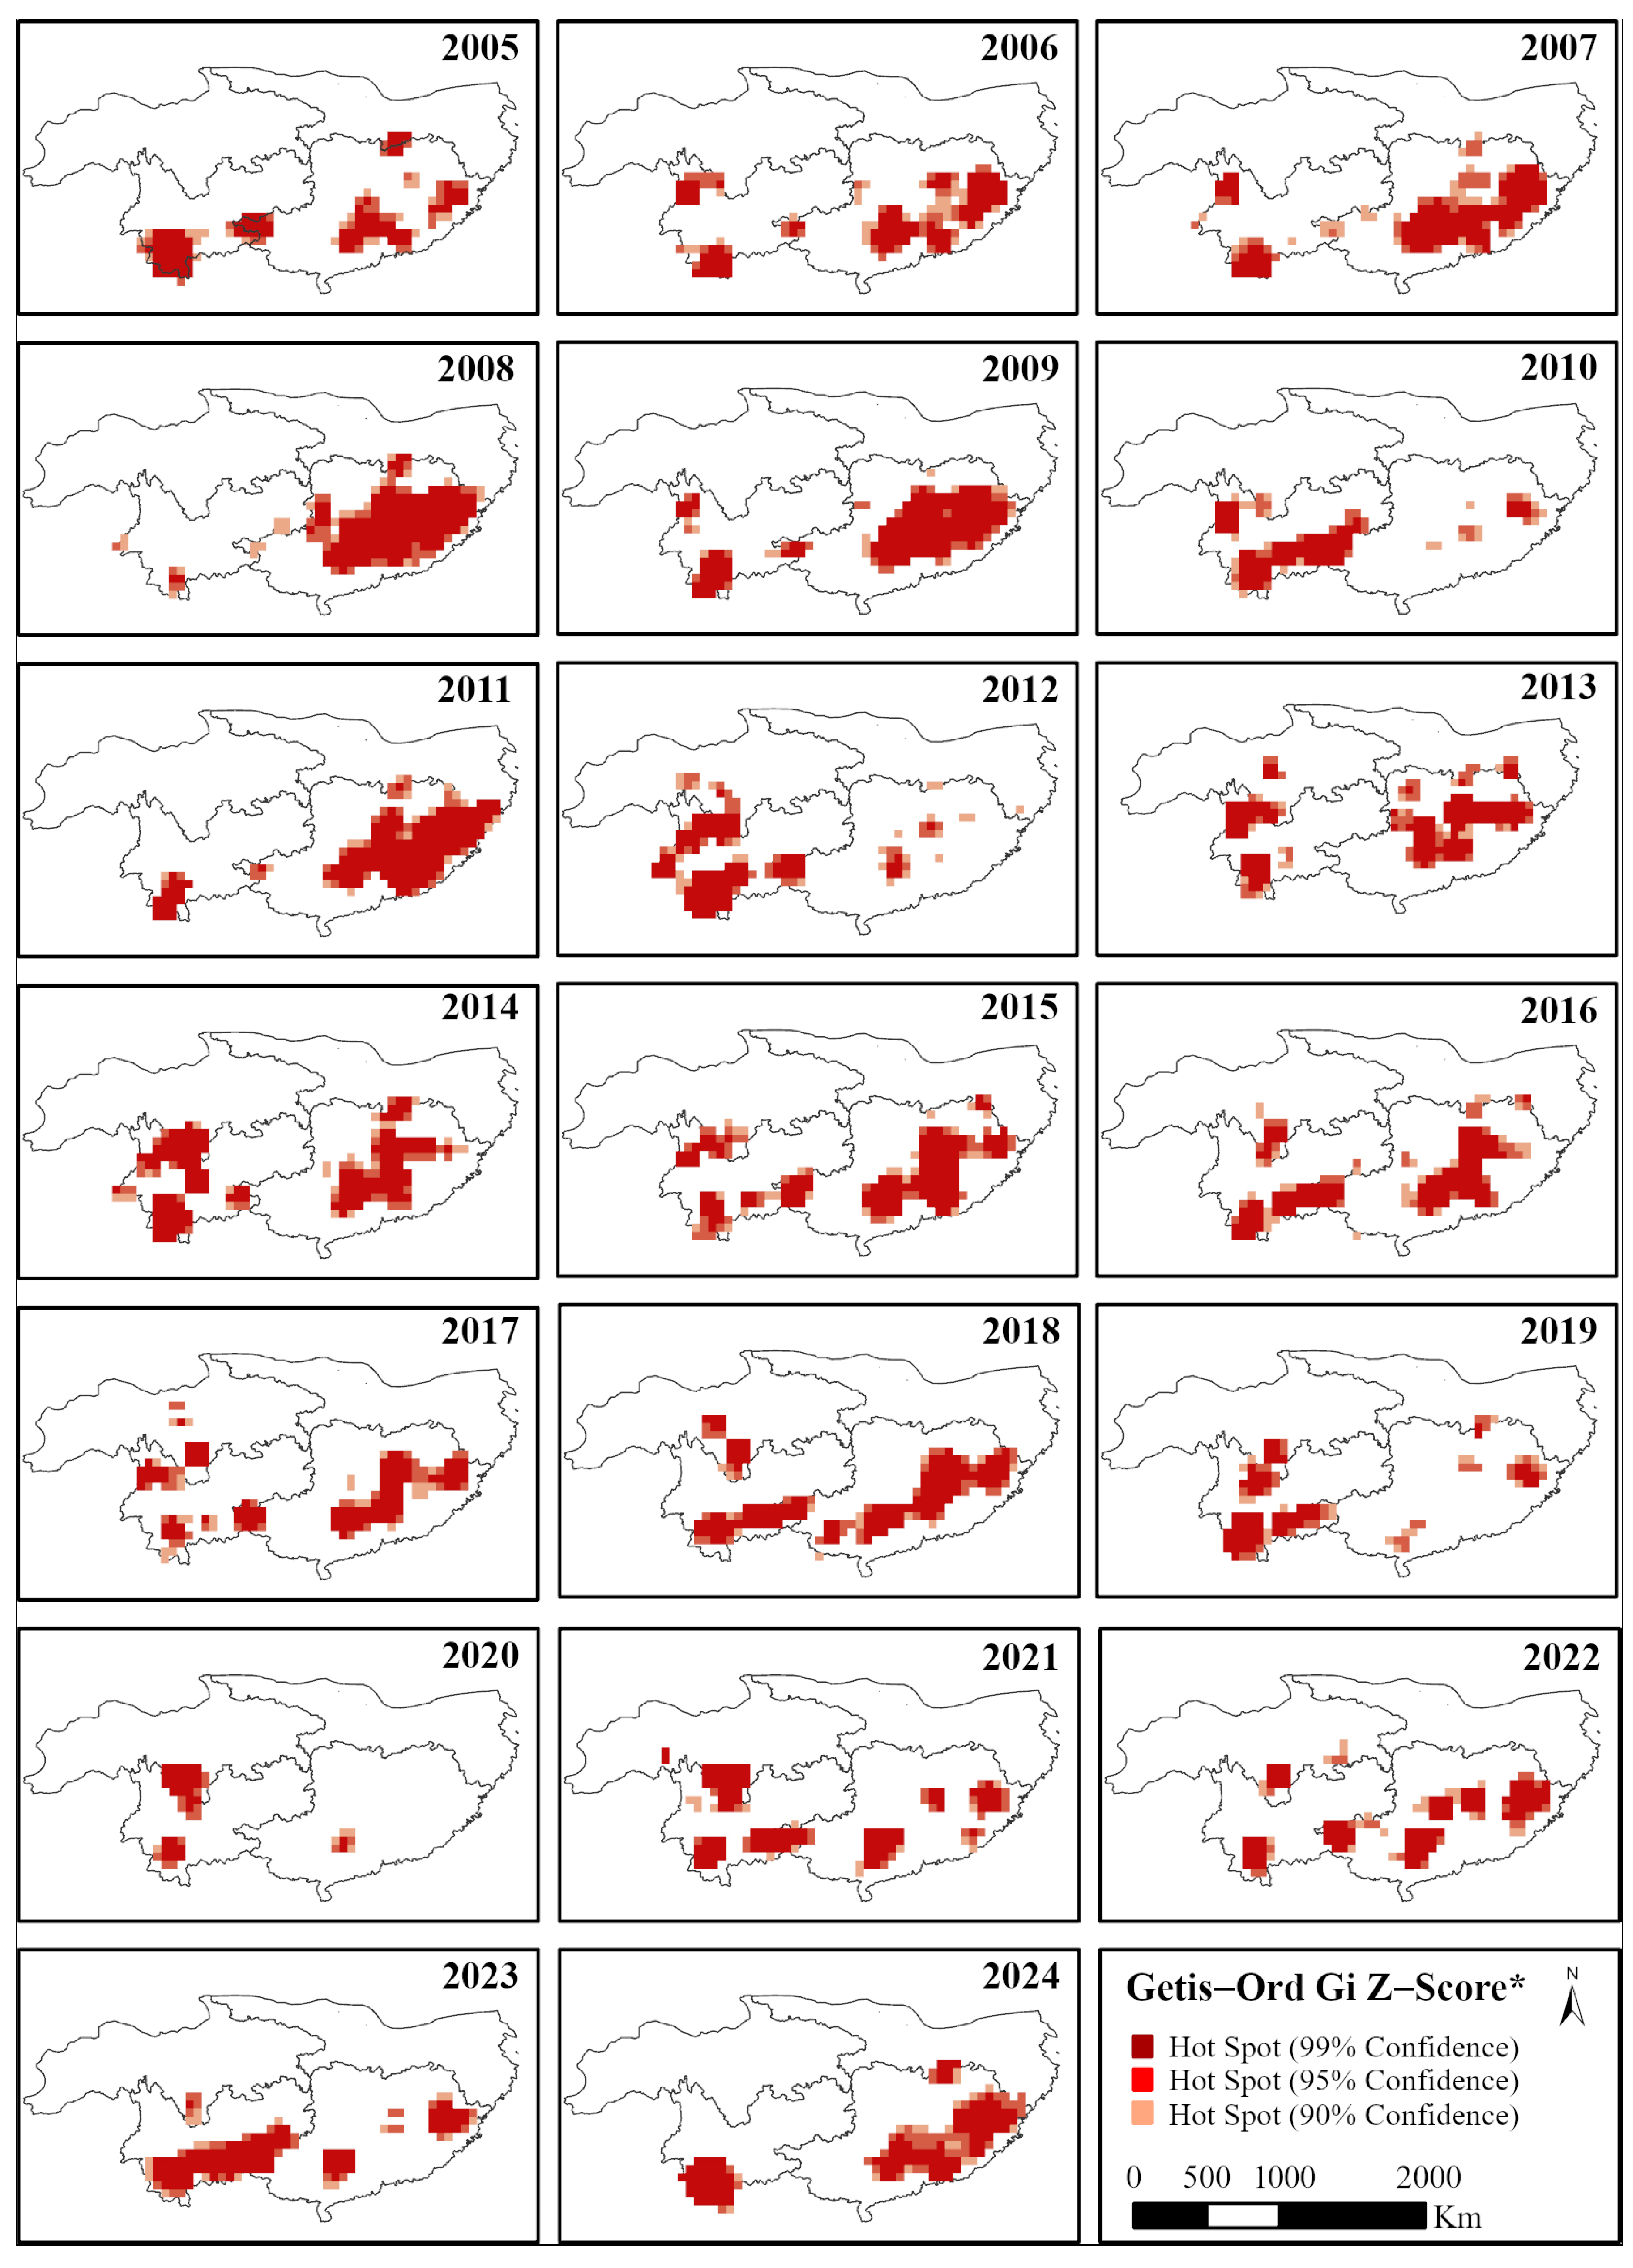
To analyze spatiotemporal patterns of high-intensity wildfire events, we divided mainland South China into 0.5° × 0.5° grid cells (totaling 1142 units). This provided a standardized spatial framework for regional analysis. All grid cells intersecting national terrestrial boundaries were fully retained, even those with limited coverage, to avoid spatial discontinuity. According to the location and occurrence date of each fire event, we aggregated wildfire records into individual grid cells and constructed monthly time series from 2005 to 2024. All grid cells were projected using the World Geodetic System 1984 (WGS84, EPSG: 4326). We used histograms to characterize monthly event frequency and capture seasonal variations. Linear regression was applied to annual fire counts to detect long-term trends. We also quantified the proportional contributions of wildfire events across the four predefined ecological subregions to reveal regional distribution patterns.
2.3.2. Drought Dataset
We adopted four widely used drought and aridity metrics to characterize surface moisture conditions, atmospheric dryness and regional water balance: the Standardized Precipitation Evapotranspiration Index (SPEI), vapor pressure deficit (VPD), precipitation (PRE) and vapor pressure (VAP). These metrics capture complementary information regarding terrestrial water balance, atmospheric aridity, precipitation supply and absolute vapor content, enabling a comprehensive evaluation of drought stress for wildfire research.
SPEI measures moisture surplus or deficit by normalizing the difference between precipitation and potential evapotranspiration [
39]. Positive SPEI values represent humid conditions, whereas negative values denote drought stress. VPD (kPa) reflects the gradient between saturated and actual atmospheric vapor pressure; higher VPD indicates stronger atmospheric aridity, which constrains vegetation transpiration, accelerates live fuel moisture loss, and substantially increases landscape flammability. Monthly SPEI and VPD datasets at 0.1° resolution (2005–2024) were retrieved from the CHM_Drought dataset (
https://doi.org/10.6084/m9.figshare.25656951.v2 (accessed on 14 November 2025)). All gridded drought variables were spatially resampled to a unified 0.5° resolution to match the fire analysis grid. Monthly precipitation (PRE, mm) and vapor pressure (VAP, hPa) at 0.5° resolution were derived from the Climatic Research Unit (CRU) TS v.4.08 dataset (
https://crudata.uea.ac.uk/cru/data/hrg/ (accessed on 14 November 2025)). PRE directly reflects rainfall supply that regulates surface moisture, and VAP charac). PRE directly reflects rainfall supply that regulates surface moisture, and VAP characterizes absolute atmospheric vapor content, further complementing the humidity information that VPD cannot fully capture.
We implemented a standardized workflow for multi-source climate data fusion and preprocessing, including unified resampling, coordinate registration and grid matching. All drought layers were resampled to 0.5° resolution and geometrically aligned with the wildfire grid using ArcGIS version 10.8 (ESRI, Redlands, CA, USA), ensuring consistent integration of multi-source data for subsequent spatiotemporal modeling. To eliminate dimensional disparities, VPD, PRE and VAP were standardized via z-score transformation; the SPEI was not processed as it is a dimensionless index.
2.3.3. Vegetation and Anthropogenic Dataset
The Enhanced Vegetation Index (EVI) was used to characterize vegetation structure and greenness. We obtained EVI from the MODIS MCD13Q1 product (250 m spatial resolution, 16-day composite), distributed by the NASA Land Processes Distributed Active Archive Center (LP DAAC), and aggregated the 16-day values into monthly means to align temporally with wildfire records. Vegetation moisture stress was represented by the Normalized Difference Water Index (NDWI). NDWI was derived from daily MODIS MCD43A4 Nadir BRDF-Adjusted Reflectance data at 500 m resolution, using the near-infrared and shortwave infrared bands. All daily NDWI values were then averaged to monthly means for unified analysis.
Road proximity served as a proxy for anthropogenic disturbance. Road network data were downloaded from the National Earth System Science Data Center (
http://www.geodata.cn (accessed on 1 December 2025)). Given the low update frequency of road datasets, we integrated data from three years: 2000, 2010 and 2020. Euclidean distance to the nearest road was computed at 1-km resolution via ArcGIS. We masked out water bodies and urban areas and clipped the analysis extent to ecoregion boundaries to reduce edge effects. For each 0.5° grid cell, we calculated the median EVI, NDWI and road proximity across all recorded wildfire events. Using median statistics mitigates the influence of outliers and produces reliable predictors for the following modeling procedures.
2.4. Drought–Wildfire Correlation Analysis
We constructed a spatiotemporal dataset of monthly high-intensity wildfire events across subtropical China from January 2005 to December 2024. Wildfire counts were aggregated within each 0.5° grid cell using zonal statistics. Concurrent monthly drought indices were similarly processed via spatial averaging, yielding standardized time series.
We adopted Spearman’s rank correlation (implemented via the R package Hmisc, version 4.3.1) to quantify associations between drought and wildfire activity. This nonparametric approach is well suited for ecological time series, especially for wildfire data featuring zero inflation, sparsity and non-normal distributions. As a rank-based method, it mitigates data skewness and accommodates sparse fire records while retaining sensitivity to monotonic trends, without requiring the linearity and normality assumptions of parametric correlation. We performed a two-tailed test with a significance level of p < 0.05 to test the null hypothesis of no correlation between drought and wildfires.
Drought can affect wildfires via time-lagged effects ranging from several months to years [
40]. To capture such lagged effects while balancing ecological relevance and statistical power, we focused on lags of 1–6 months. This window optimally captures critical fuel accumulation and desiccation processes in subtropical forests, where monsoon-driven droughts require about 3 months to elevate fire risk [
41], and aligns with regional phenology wherein 60%–80% of annual fuel production occurs within a 120-day growing season before moisture depletion [
42]. Lags longer than six months were excluded to avoid signal dilution and reduced statistical performance.
To evaluate the delayed effects of drought indices (SPEI, VPD, VAP, and PRE) on high-intensity wildfire activity, we performed a lagged Spearman rank correlation analysis. Let represent the monthly wildfire time series (July 2004–December 2023; 234 months) and denote a drought index series. For each drought index, lagged sequences were generated by shifting backward by months (), while preserving the 234-month window (e.g., : June 2004–November 2023). Spearman coefficients were computed between and to quantify monotonic relationships at 1- to 6-month lags. The final correlation coefficient and time lag were obtained from the maximum absolute correlation value among all and the corresponding time lag. Time-lagged drought index series were extracted at their optimal lags for subsequent modeling.
2.5. Model Development and Evaluation
Conventional regression methods failed to fit wildfire count data owing to zero inflation, overdispersion and spatiotemporally nested hierarchical structures. We therefore employed ZINB-GLMM to quantify how drought and environmental factors affect the spatiotemporal distribution of high-intensity wildfires. With flexible link functions for non-normal responses and random effects for hierarchical structures, this model ensures reliable ecological inference for heterogeneous nested datasets.
The three lag windows (concurrent, 1–3 month, and 4–6 month) were selected based on the exploratory correlation results (
Section 2.4), which showed the strongest drought effects within the first three months. These fixed windows were then used in the ZINB-GLMM to formally compare their explanatory power within a unified framework.
The full dataset included records from 1142 grid cells across 20 years at monthly intervals. To account for spatial and temporal autocorrelation, grid-level and month-level random intercepts were incorporated. These random terms separate intrinsic spatiotemporal background heterogeneity, remove confounding background disturbances, and improve the accuracy and stability of coefficient estimates for drought and environmental drivers. The initial Poisson model specification is expressed as:
where
represents the expected count of high-intensity wildfires in grid
i at time
t, with
as the baseline wildfire intensity,
and
as random intercepts for grid and time (where
and
),
as drought indices (
), and
as bottom-up controls (
).
represents stochastic noise. Fixed effects parameters
were assigned a multivariate normal prior distribution:
, where Σ represents the variance–covariance matrix.
Prior to model fitting, we assessed multicollinearity among all candidate predictors. These included the drought indices (SPEI, VPD, VAP, and PRE), vegetation indices (EVI and NDWI), and anthropogenic factors such as road proximity. We calculated the variance inflation factor (VIF) for each variable. All predictors had VIF values below 3, indicating acceptable multicollinearity for modeling. Although moderate correlation existed between VAP and PRE, both variables were retained because they reflected distinct physical processes of atmospheric and hydrological drought. We then constructed candidate models incorporating all combinations of drought indices and bottom-up predictors. Models were fitted via maximum likelihood estimation using the lme4 package in R. Model selection was performed based on Akaike’s Information Criterion (AIC). Residual analysis revealed substantial non-normality under Gaussian assumptions. We therefore adopted ZINB-GLMM, which addresses structural zeros via a logistic component and overdispersed counts via a negative binomial component with a dispersion parameter.
Model performance was evaluated using a multi-criteria framework. Leave-one-out cross-validation combined with expected log predictive density was used to assess overall predictive ability and prevent overfitting. The conditional quantified the total variance explained by fixed and random effects. For spatial evaluation, we calculated a local for each 0.5° grid cell, defined as the squared Spearman correlation between observed and predicted wildfire counts, to map spatial variations in model performance. Model convergence was verified by successful algorithm optimization and non-singular results of the random-effects structure. The optimal ZINB-GLMM was finally selected to interpret drought–wildfire relationships with solid statistical and ecological reliability.
4. Discussion
Based on satellite datasets from the NASA Earth Observing System, this study quantified the effects of drought on high-intensity wildfires in subtropical China. High-intensity wildfires have occurred frequently across most of the study area over the past two decades. We examined drought–wildfire relationships via ZINB-GLMM. The results reveal that drought is the dominant driver of such wildfires, and its impacts vary substantially across time lags and space. Dense vegetation further mediates drought effects, thereby increasing wildfire risk. Collectively, our results emphasize that quantifying short-term drought-induced fuel desiccation is critical to explaining wildfire dynamics in subtropical China, particularly in the densely vegetated southwest and southeast.
4.1. Methodological Contributions
This study develops a transferable analytical framework by integrating remote sensing time series, multi-scale lag identification, and generalized linear mixed models with a zero-inflated negative binomial distribution. This framework captures continuous long-term fire activity, quantifies multi-temporal drought effects, and accommodates spatiotemporal nested structures across subregions. The ZINB-GLMM framework offers three key advantages: it handles zero-inflation and overdispersion via its dual-component structure, captures spatiotemporal heterogeneity through random intercepts, and enables unified comparison of concurrent versus lagged drought effects within a single model. These features improve inference reliability and predictive performance. Unlike conventional ecological studies that rely on simple correlations or ordinary linear regression, our approach explicitly accounts for spatiotemporal heterogeneity, detects multi-scale lagged drought effects beyond concurrent conditions, and assesses local spatial variation in drought–fire relationships. These methodological advances support more reliable inference, enhanced mechanistic interpretability and improved predictive performance. This framework can be adapted and validated for other subtropical monsoon regions and provides a standardized template for regional fire early warning as well as large-scale and long-term wildfire risk assessment.
4.2. Drought–Wildfire Relationships in Subtropical China
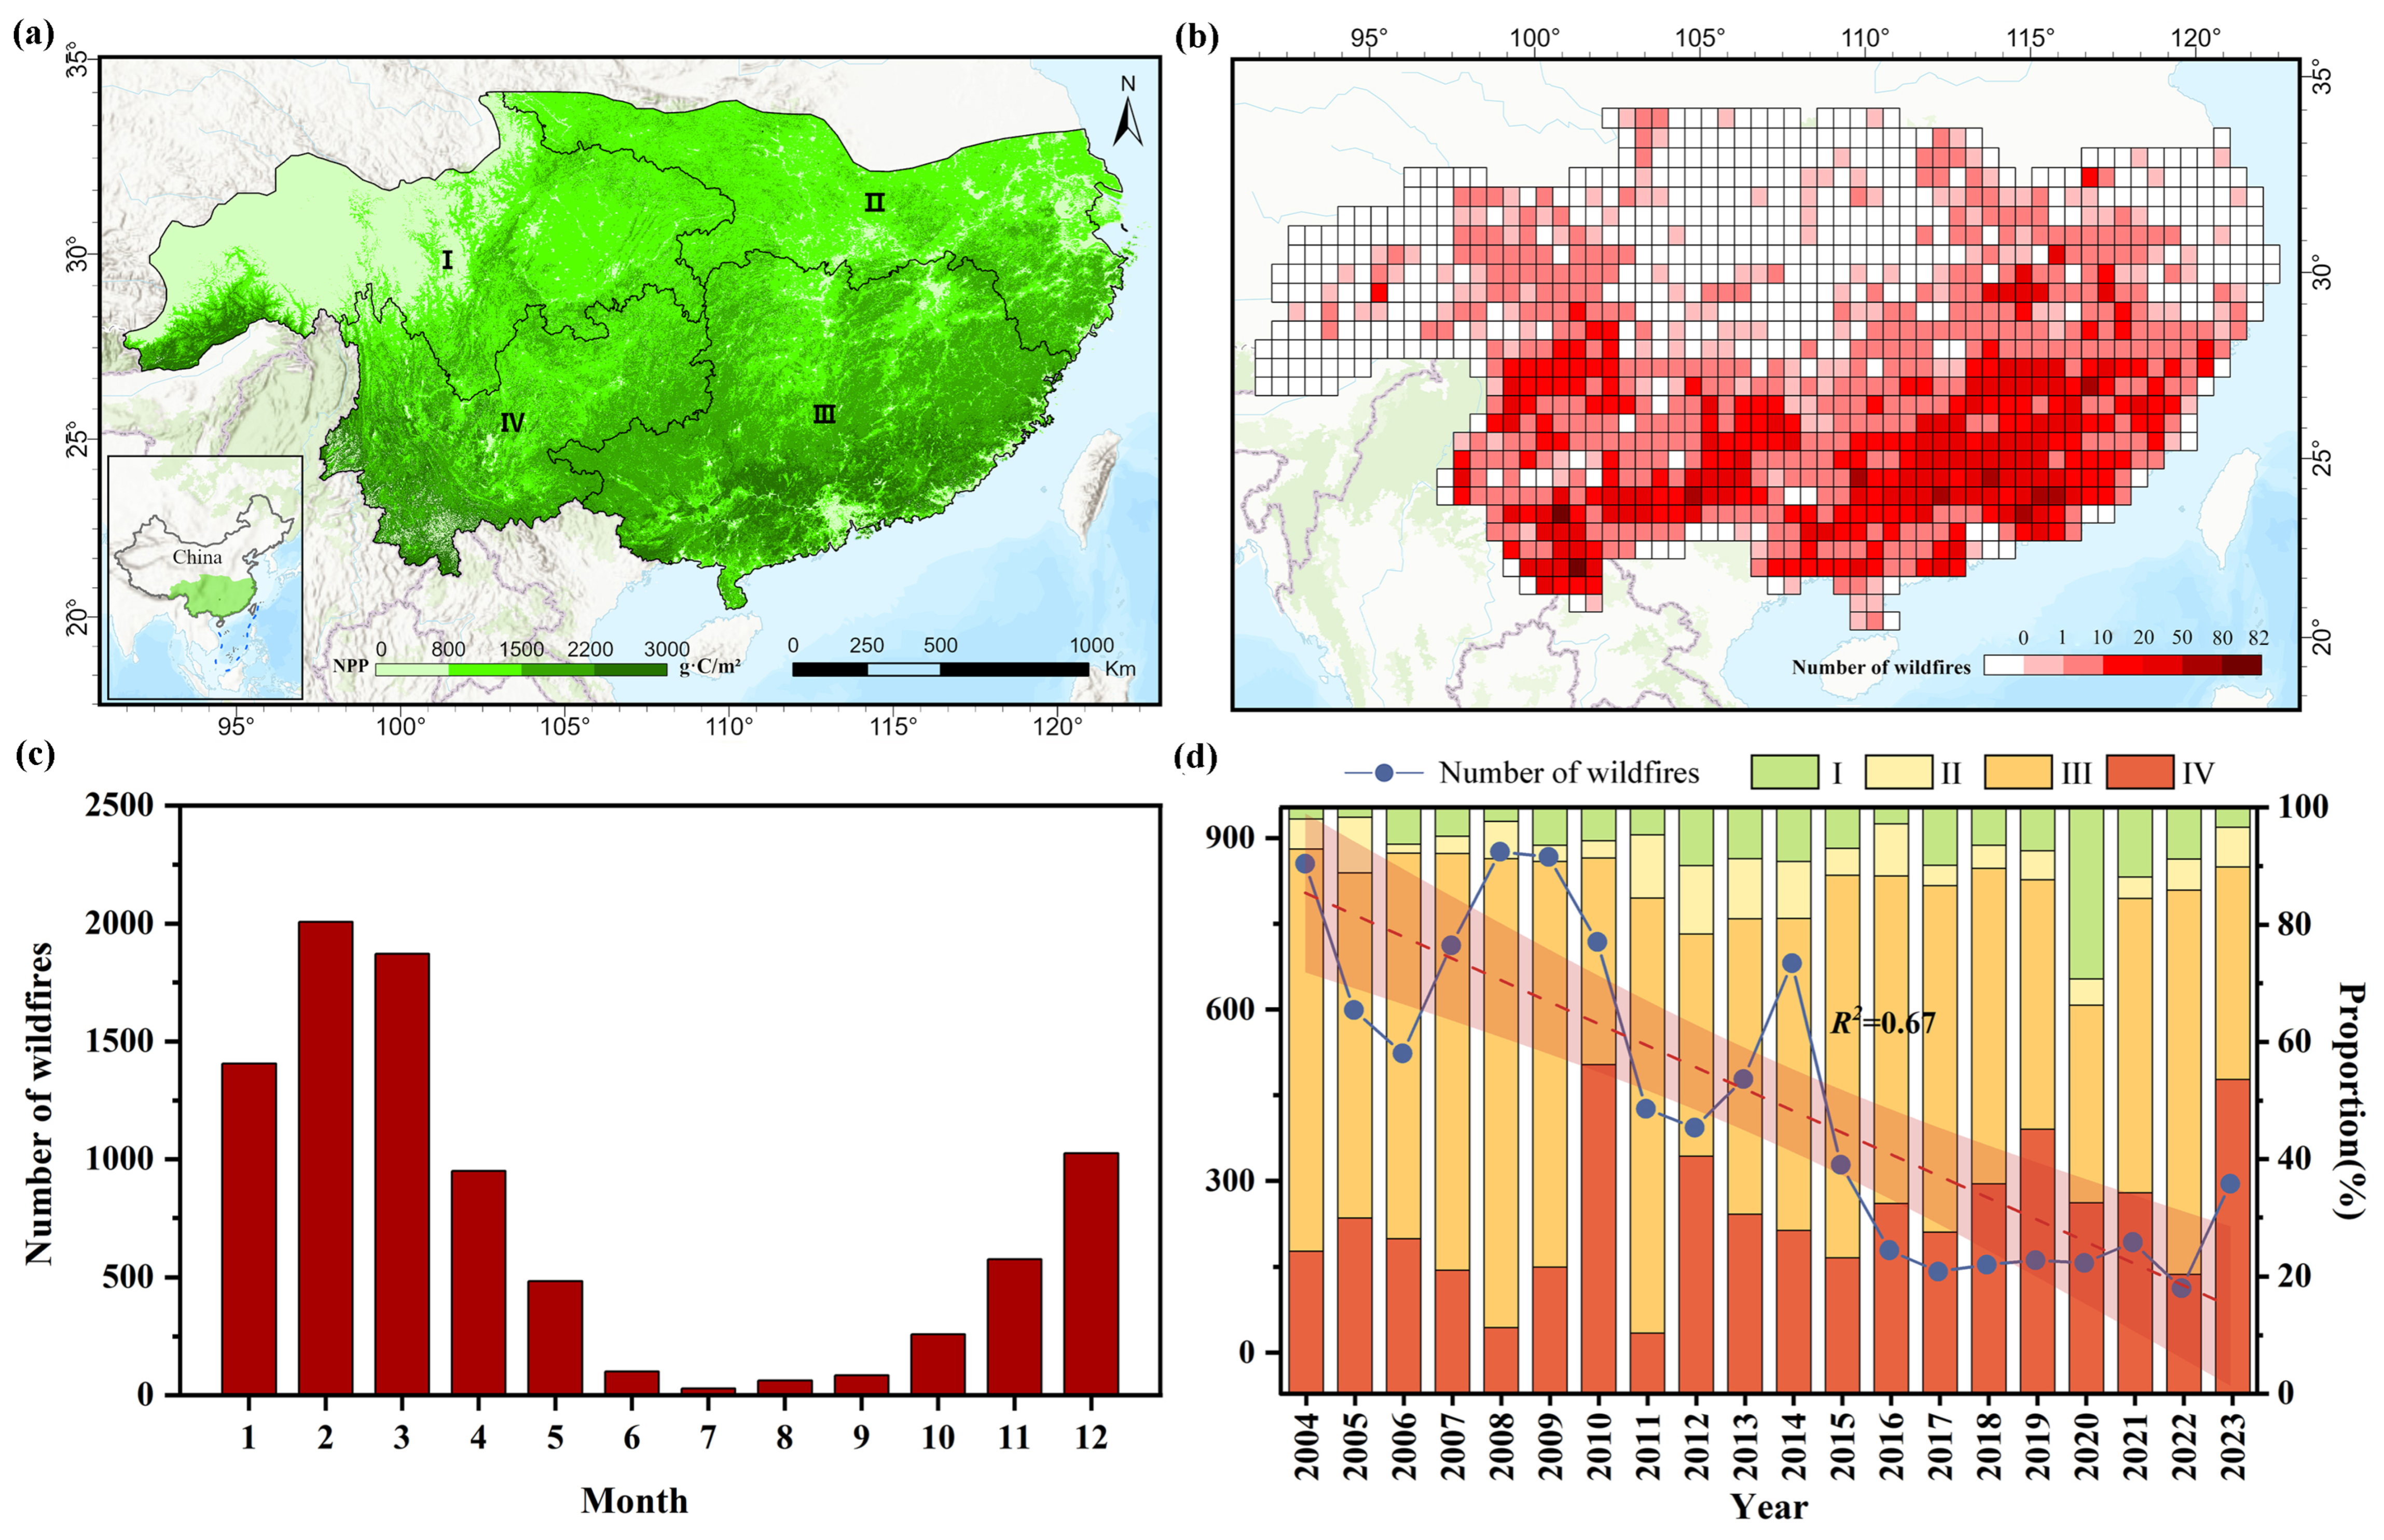
Our results reveal widespread high-intensity wildfires across subtropical China (
Figure 1b), consistent with previous studies [
32,
43]. The East Asian winter monsoon creates dry conditions in winter and spring, forming the primary wildfire season (
Figure 1c). ENSO events further exacerbate fuel flammability by altering atmospheric circulation. For example, the La Niña event in 2008 corresponded with a peak in high-intensity wildfire activity (
Figure 1d).
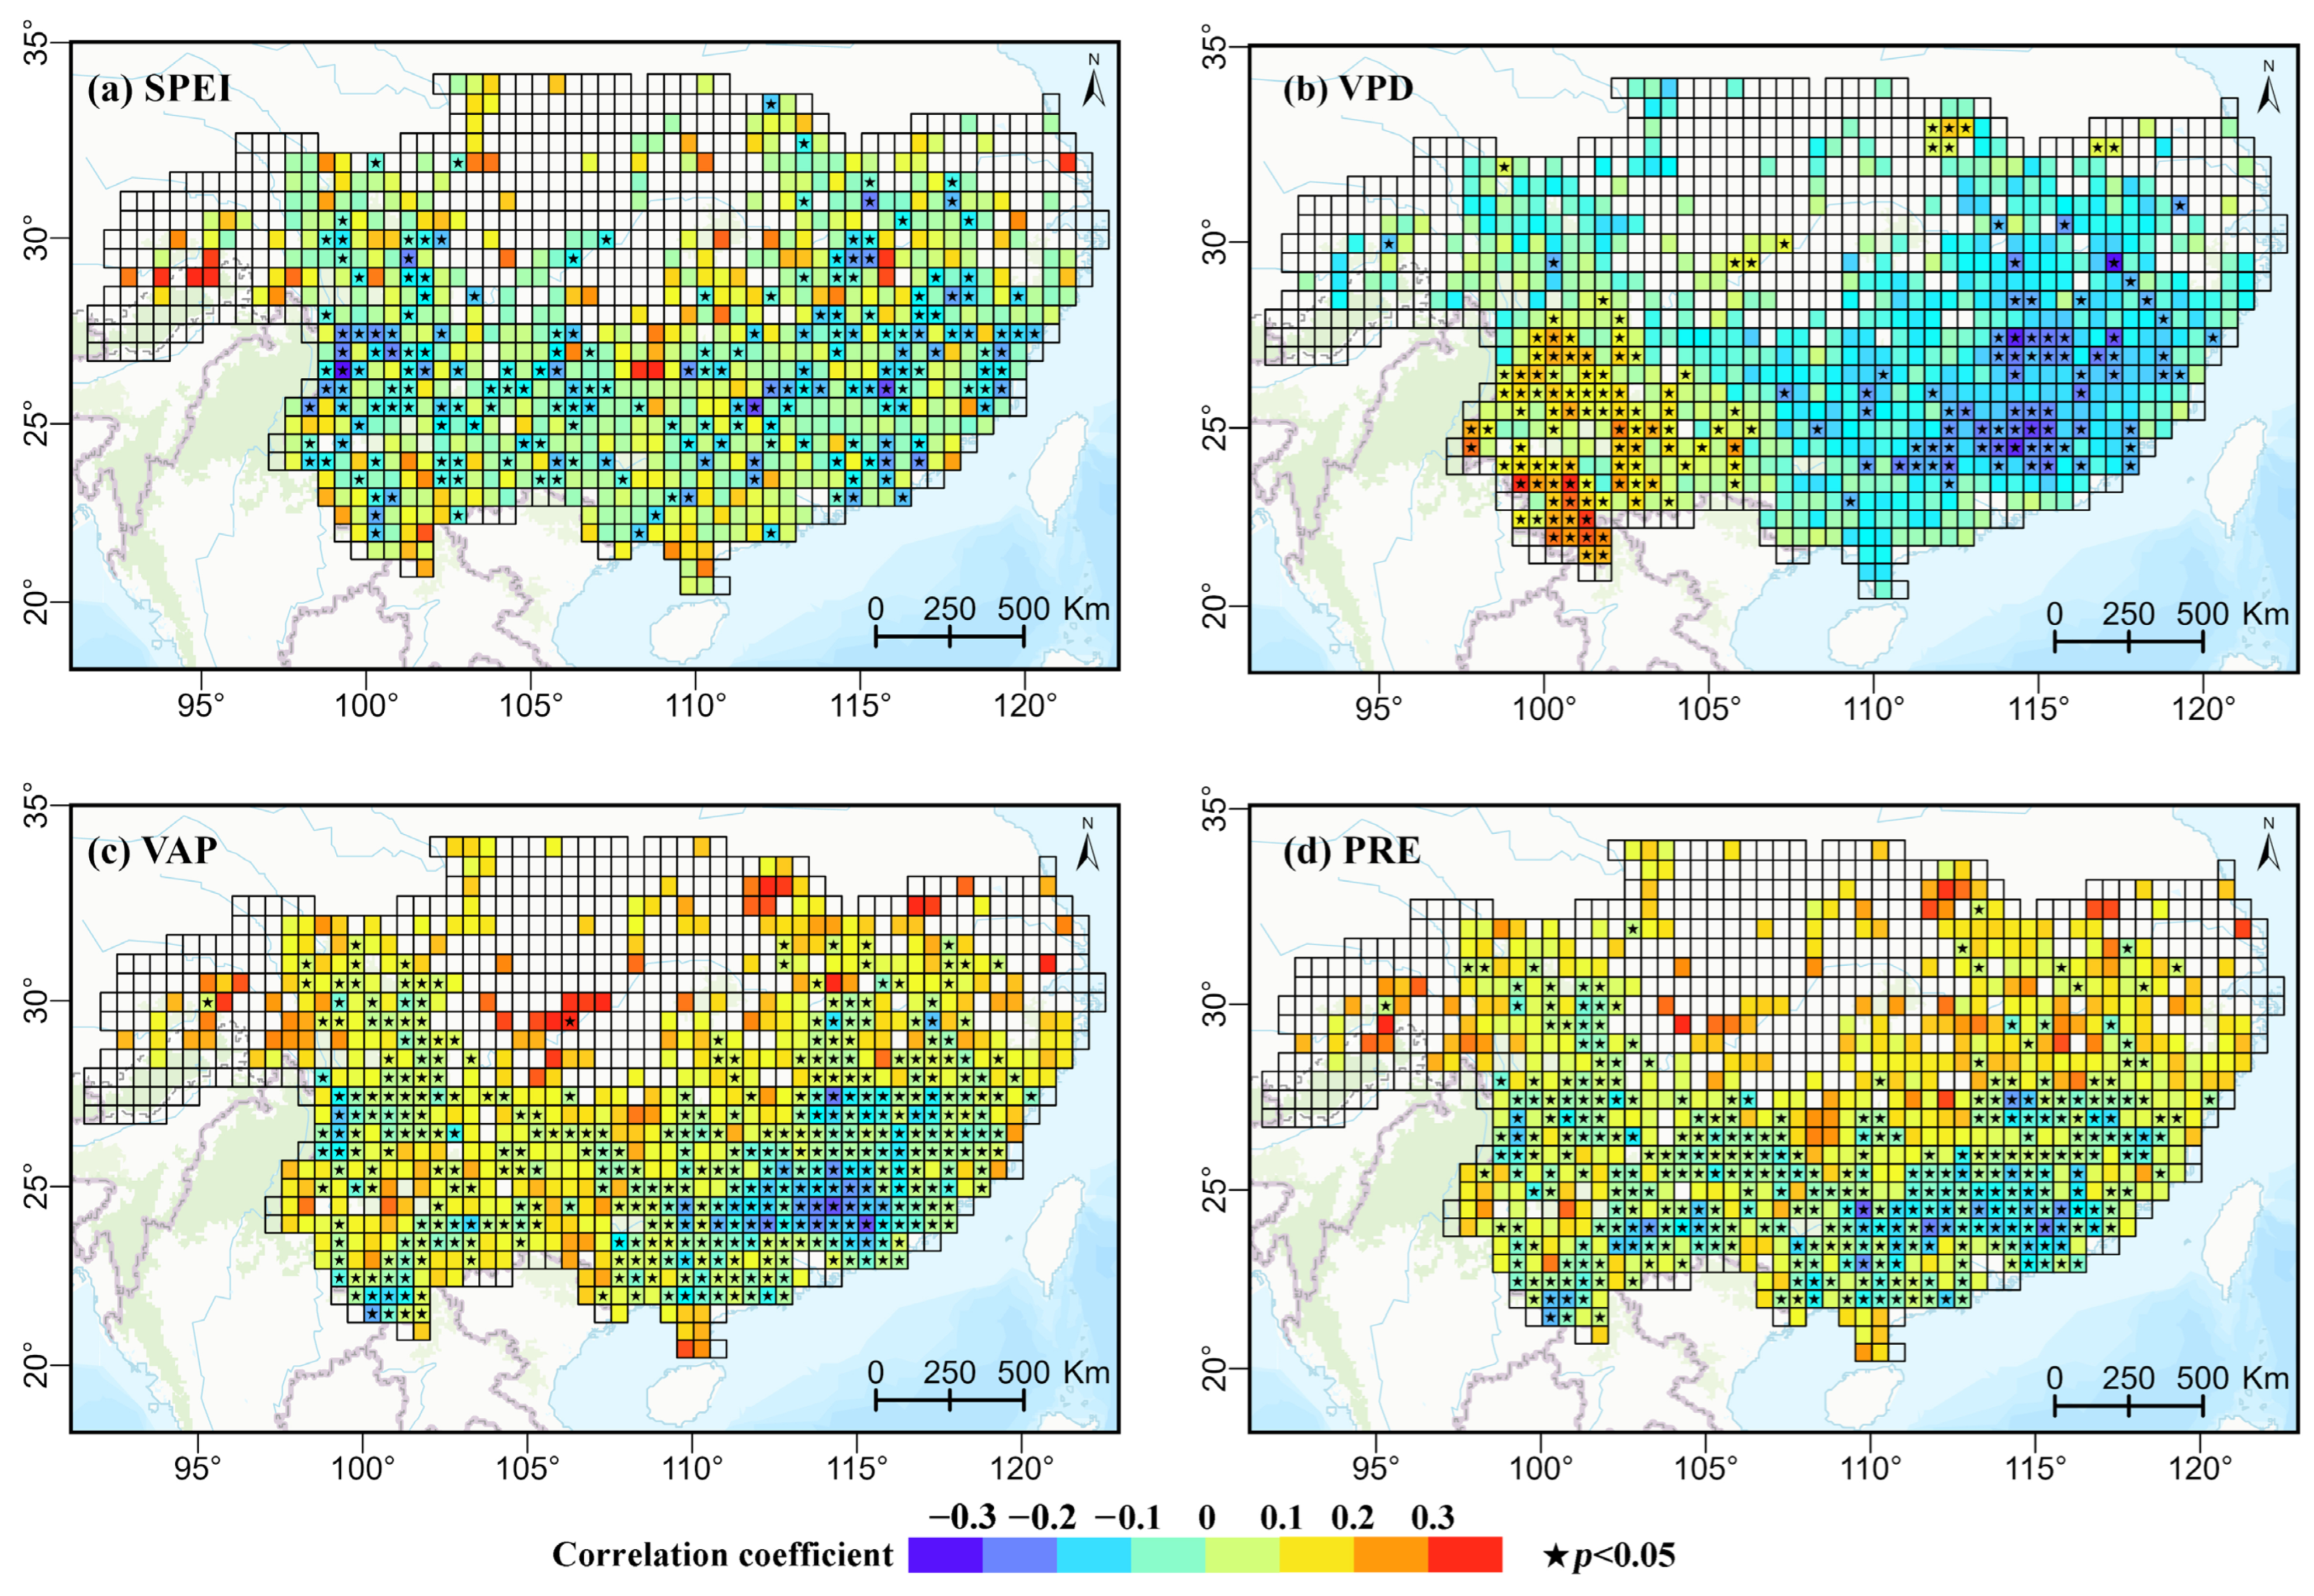
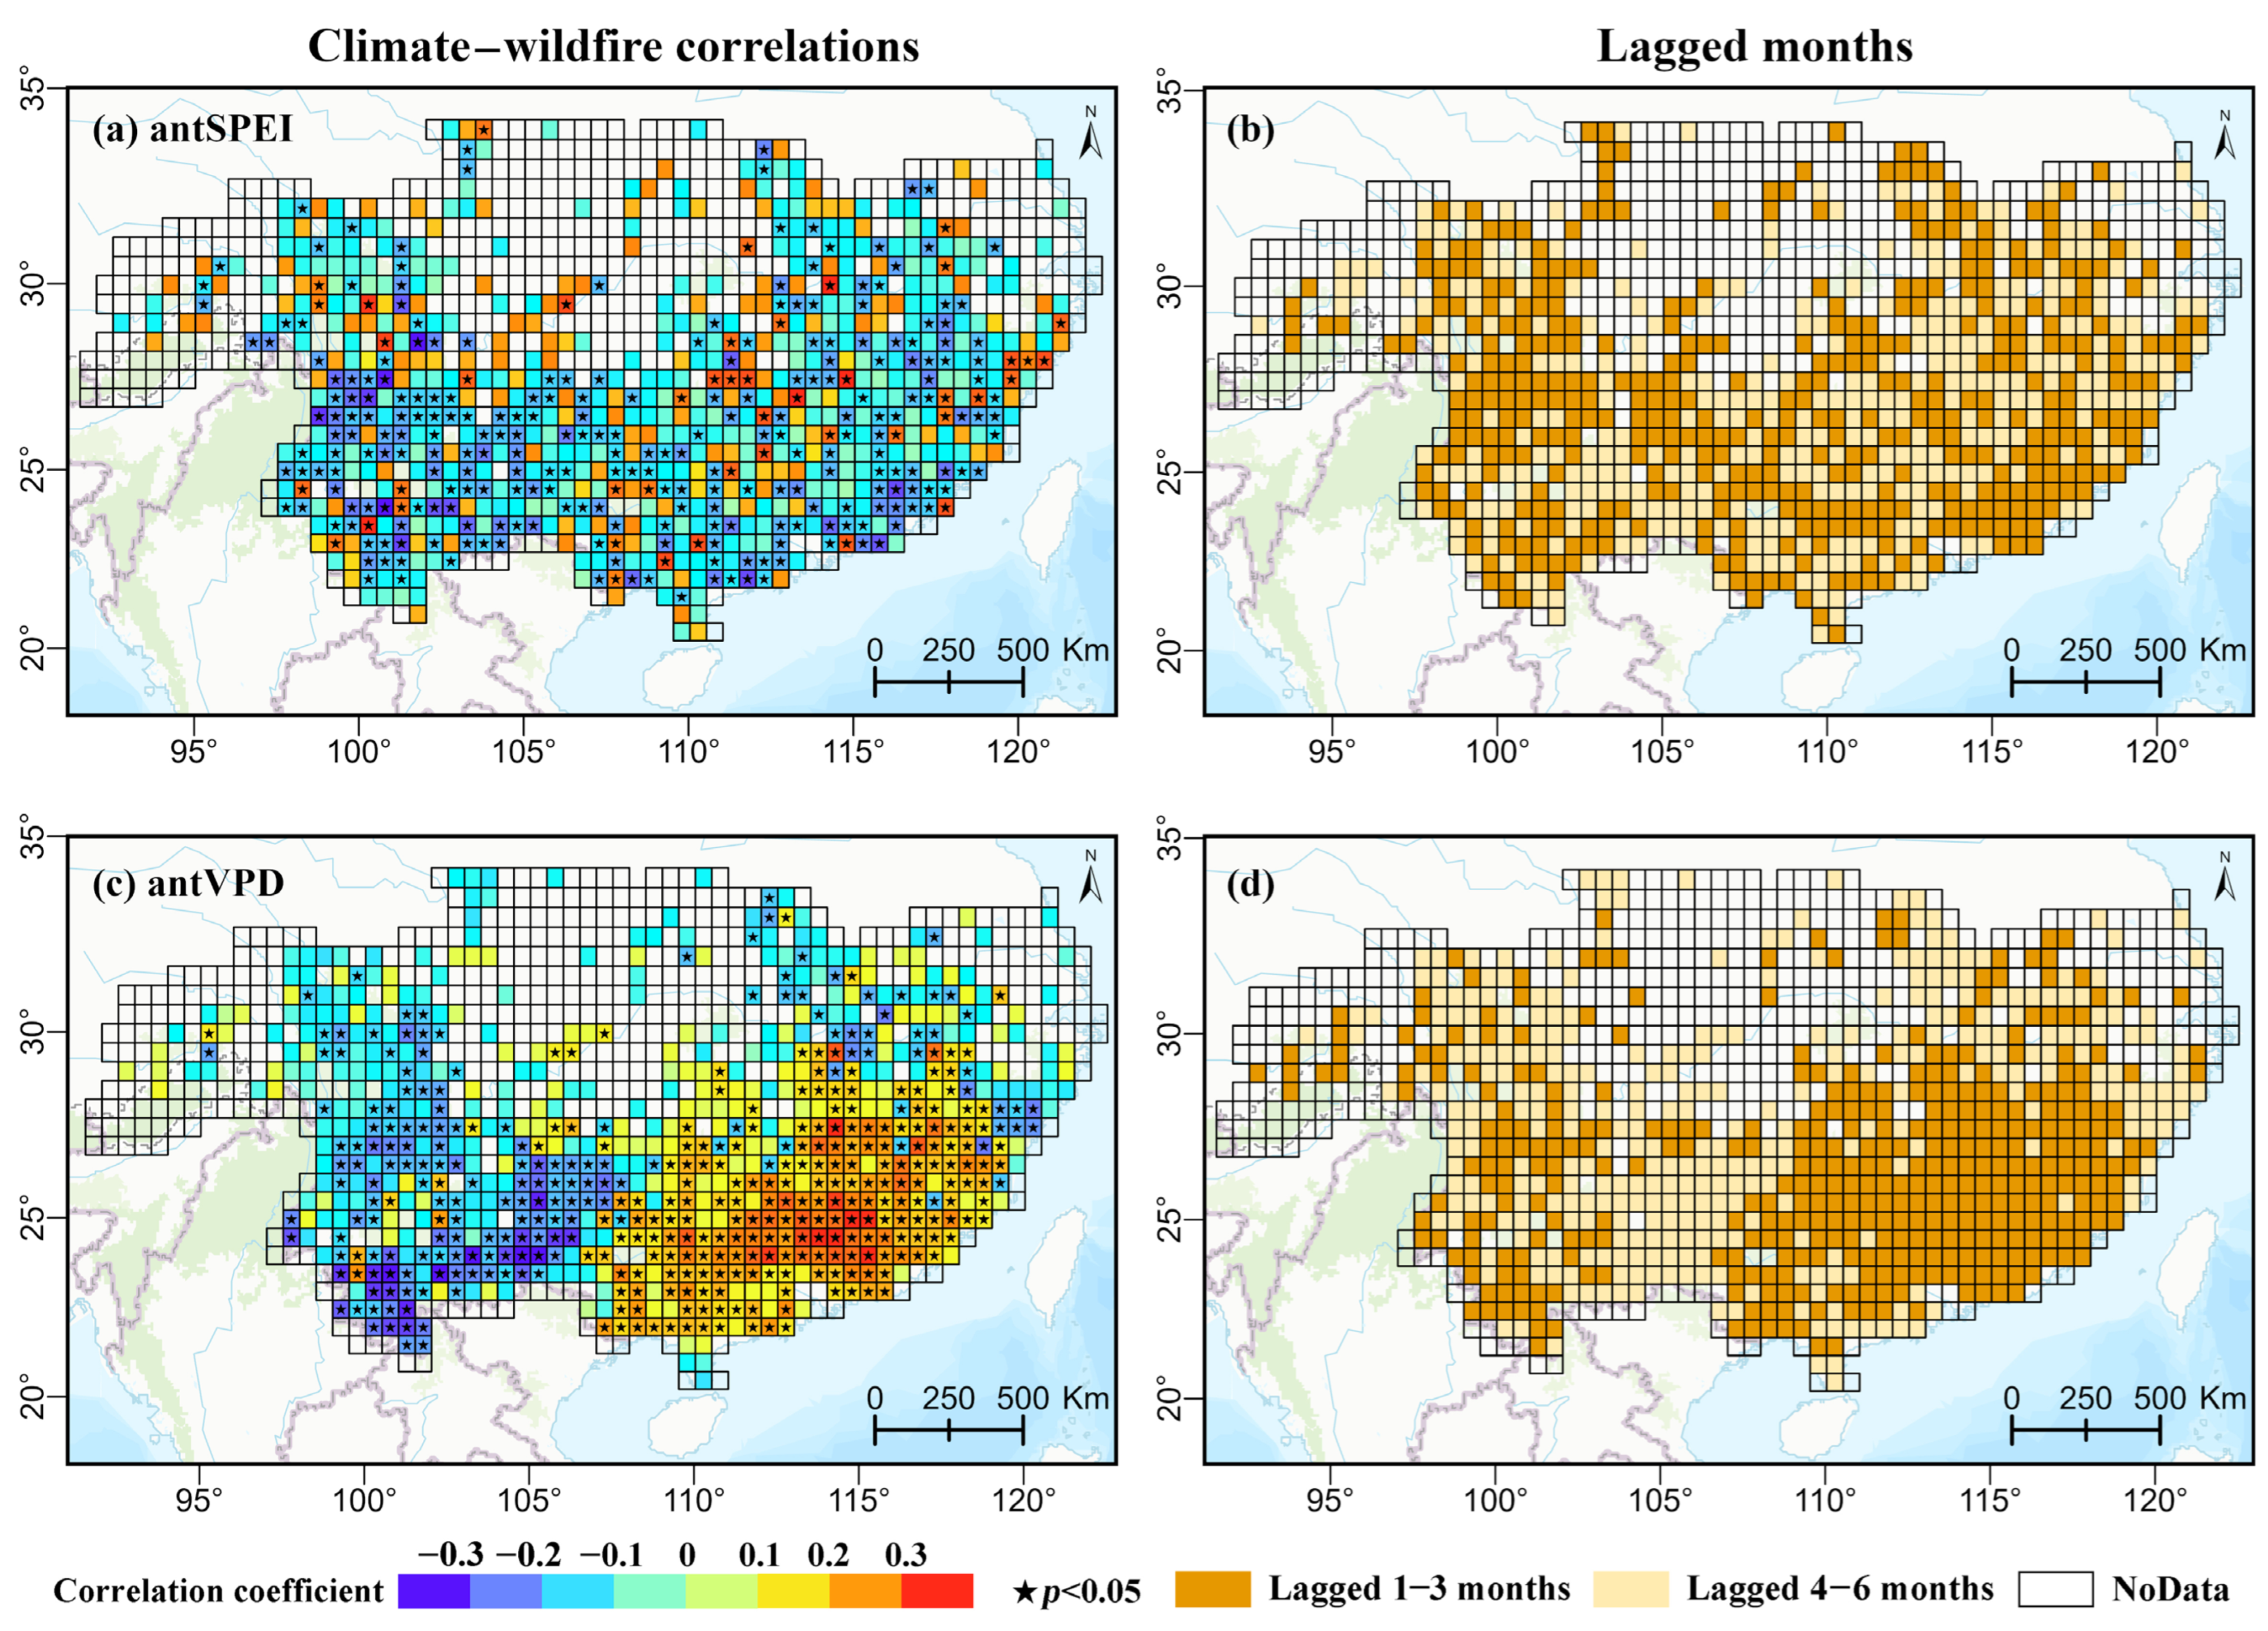
At the concurrent scale, SPEI exhibited scattered negative correlations with wildfire occurrence across most regions (
Figure 3a), reflecting the immediate impacts of drought on fuel desiccation [
28]. Weakened or even positive correlations in some regions suggest that anthropogenic interventions may decouple fire activity from climate drivers [
22]. Vapor pressure deficit exhibited a dipolar pattern, with positive correlations in the southwest and negative correlations in the southeast (
Figure 3b). This finding agrees with Yin [
9] and highlights regional heterogeneity in the effects of atmospheric aridity. This dipolar distribution is modulated by ENSO phases. In the drought-prone southwest, El Niño amplifies warm and dry conditions and accelerates fuel desiccation. In the humid southeast, high VPD often precedes rainfall, interrupting the fuel drying process before ignition can occur [
44]. VAP and PRE showed consistent negative correlations at the concurrent scale (
Figure 3c,d), as higher values of these variables raise fuel moisture and inhibit ignition.
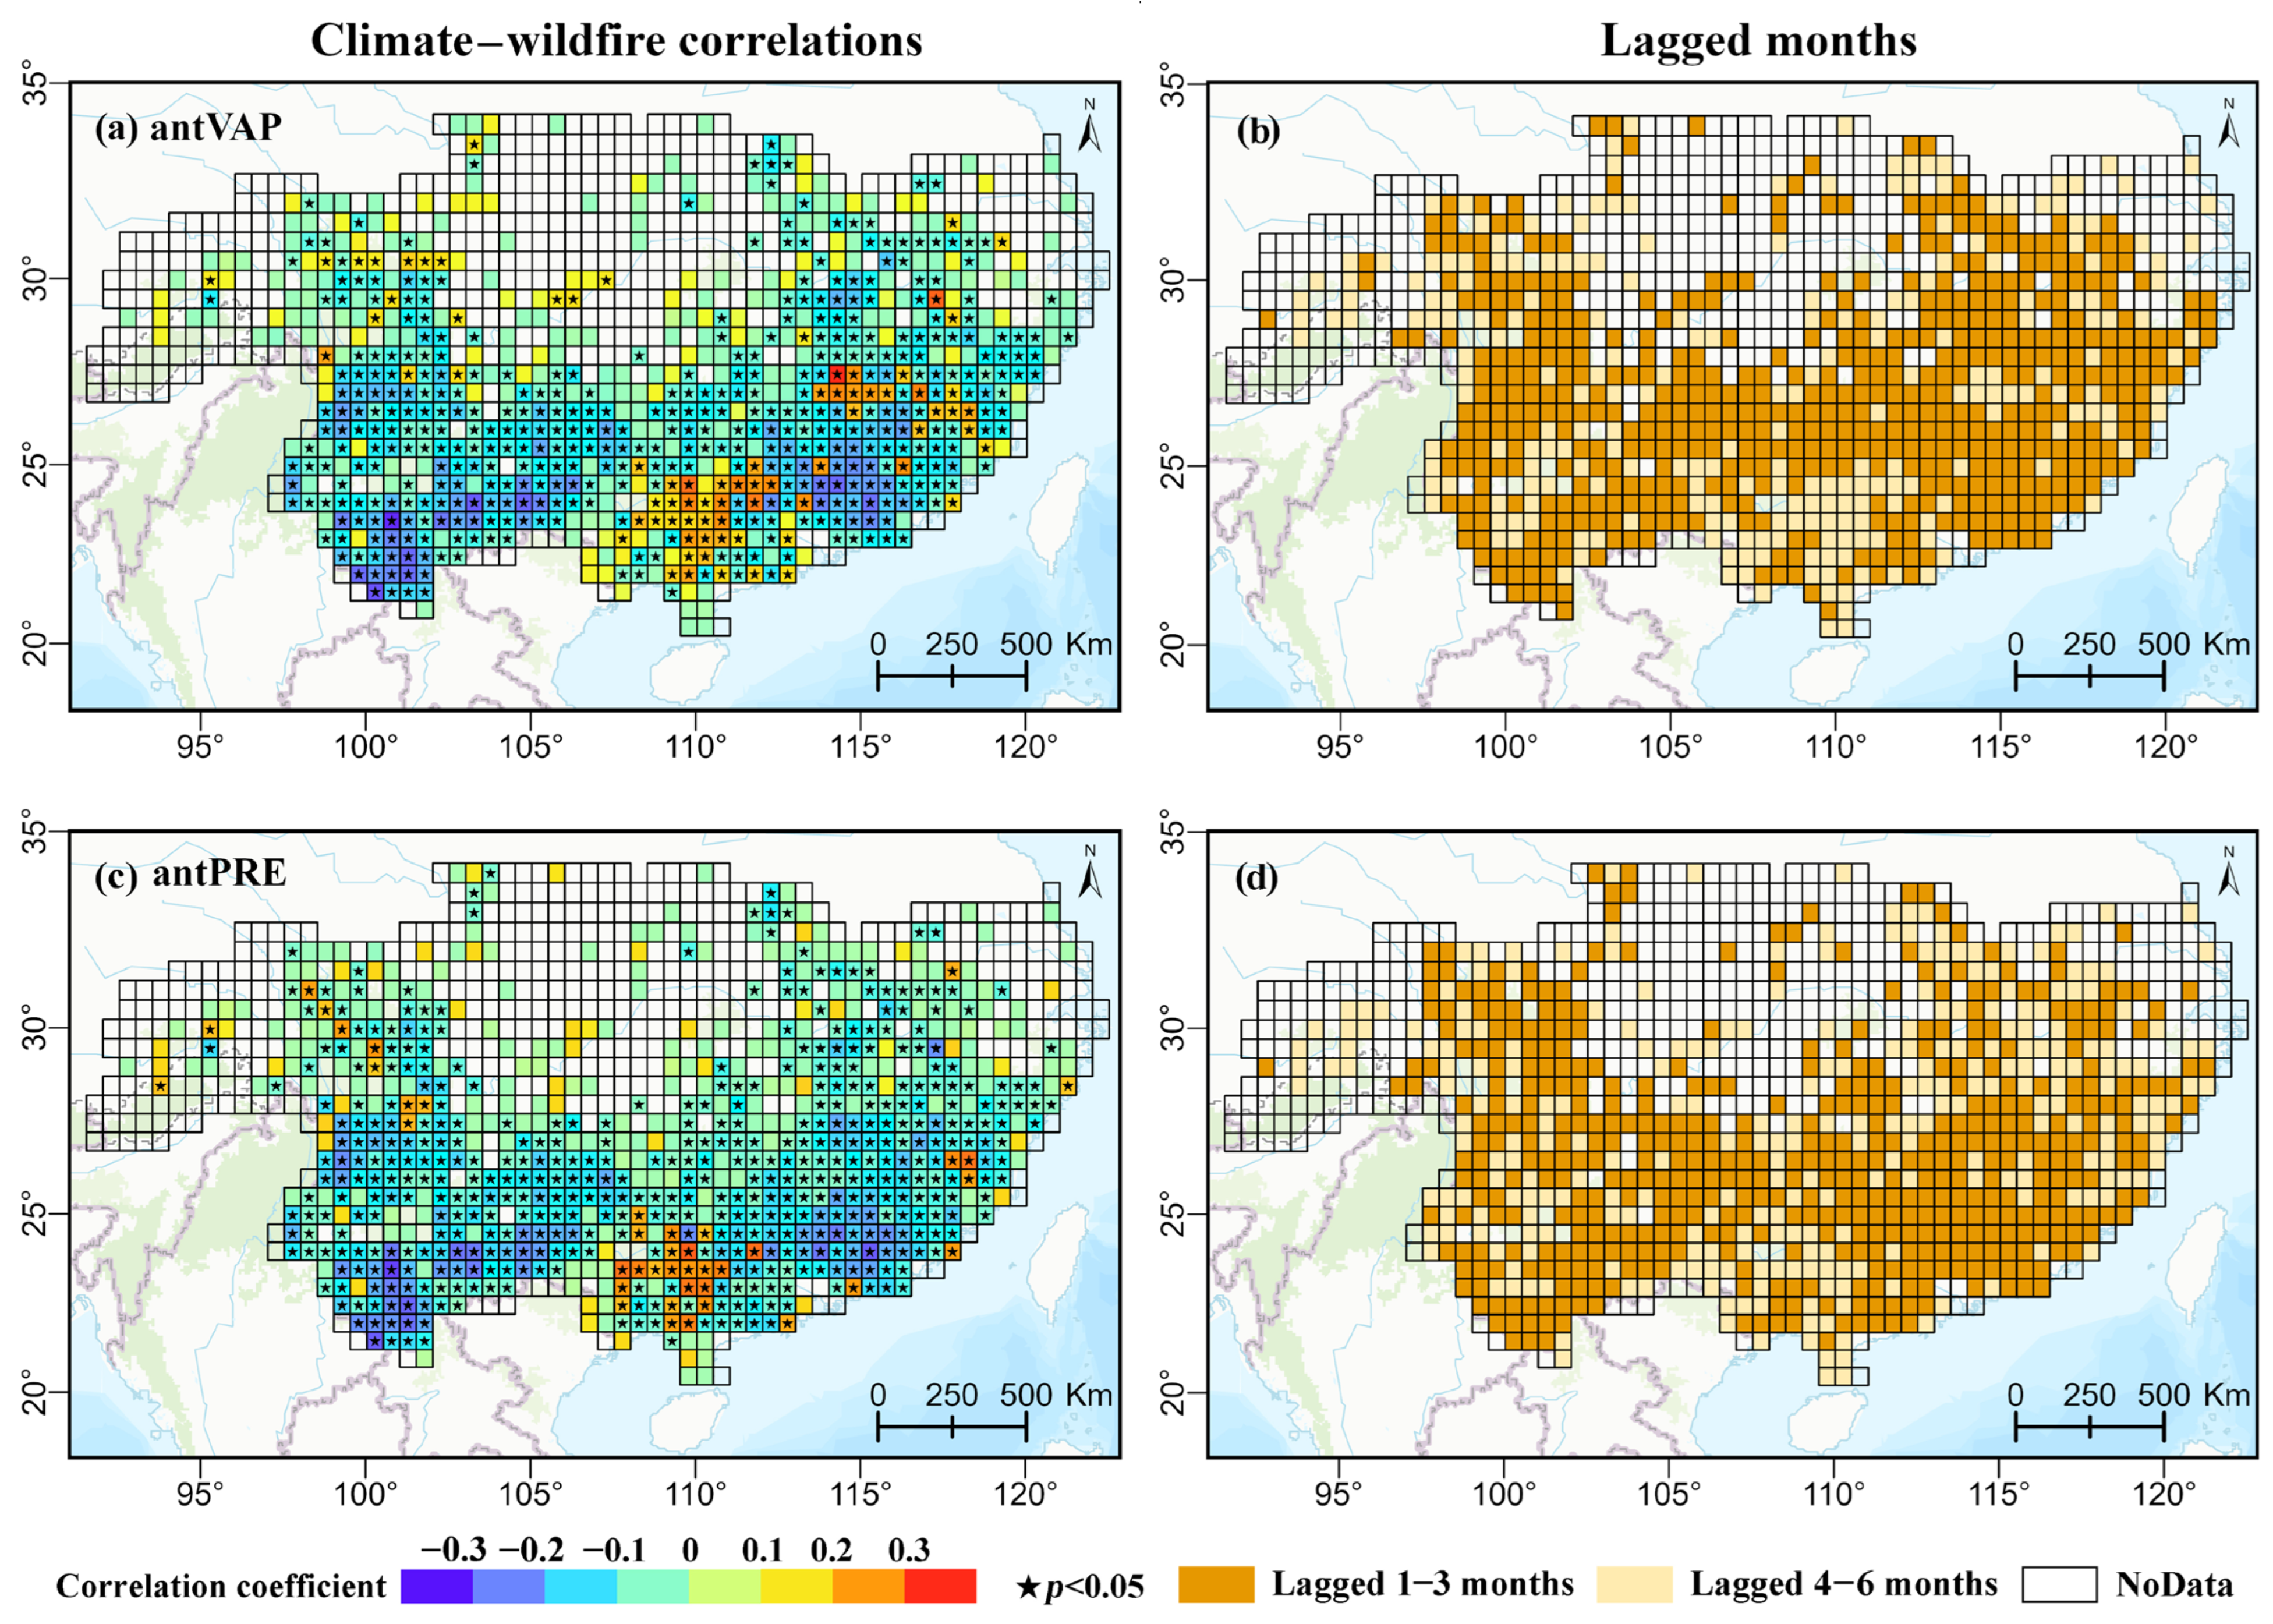
At the 1–3-month lag scale, drought significantly promoted wildfire occurrence, especially in the southwest (
Figure 4a). Multi-week dry spells precondition landscapes to burning, especially in karst ecosystems across Yunnan, Guangxi and Guizhou, where thin soil layers restrict water retention [
45]. Vegetation there is vulnerable to prolonged water stress, reducing live fuel moisture and increasing tree mortality; for conifers, drought may also enhance resin production and flammability [
46]. Antecedent VPD desiccates fine fuels in autumn, lowering ignition thresholds and elevating winter fire risk (
Figure 4b). The high flammability of these desiccated fuels supports this interpretation, as they greatly increase the ignitability and energy content of the litter layer [
44]. Meanwhile, lagged VAP and PRE boost vegetation growth and live fuel moisture in broadleaf forests, partially offsetting fuel accumulation (
Figure 4c,d).
At the 4–6-month lag scale, the fire-promoting effect of moisture deficits weakens (
Figure 4), as seasonal precipitation moderates intermediate-term drought [
47]. Persistently high VPD during the growing season can inhibit regrowth in fuel-limited areas, reducing future fuel availability. Summer VAP and PRE support fuel accumulation, which may later ignite during dry periods, increasing wildfire risk in the following season [
8]. Collectively, the timing of drought relative to vegetation phenology and fuel dynamics strongly regulates fire activity, with the most pronounced effects occurring at the 1–3-month lag.
4.3. Short-Lag Drought Drives Wildfires
Our analysis identifies the 1–3-month lagged drought as the primary driver of high-intensity wildfires in subtropical China. This finding refines the conventional focus on either concurrent weather conditions or longer-term fuel accumulation [
22,
48,
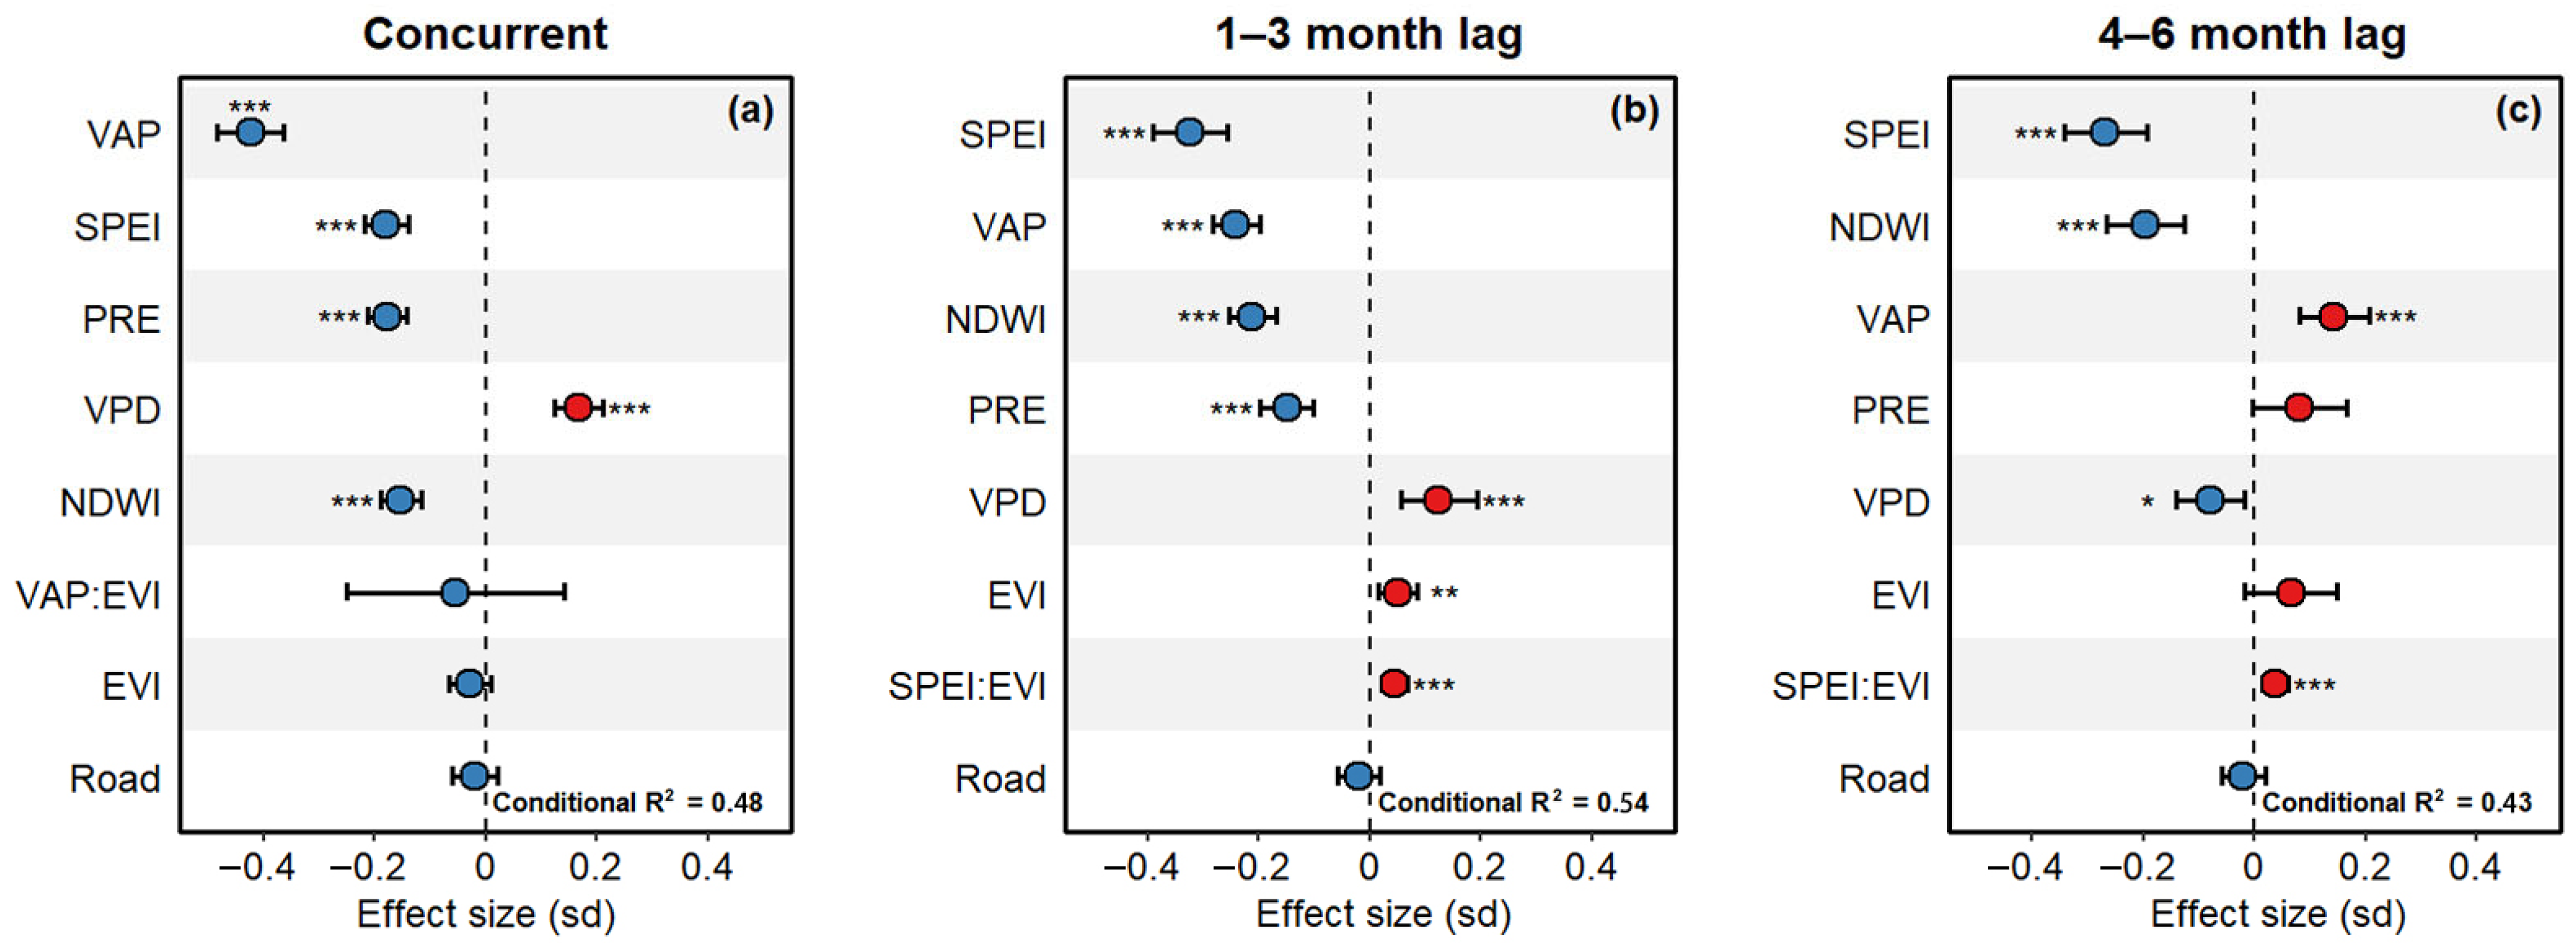
49]. While previous studies recognize drought as a general wildfire driver, our multi-temporal GLMMs quantitatively establish the peak explanatory power at the 1–3-month lag scale (conditional
R2 = 0.54), outperforming both concurrent (
R2 = 0.48) and longer-lag (4–6 months;
R2 = 0.43) models (
Figure 5). During this critical period, SPEI maintains dominant control, moderated by VAP and PRE, while acting synergistically with VPD. These interactions represent a combined drying process in which soil moisture deficit and atmospheric aridity jointly enhance fuel desiccation and elevate fire risk, even as moisture retention partially offsets this effect [
4]. Prior research confirms that an imbalance between these opposing factors over seasonal scales consistently leads to fuel drying and increased wildfire risk [
21], supporting the mechanistic validity of this shorter-term lag.
At the concurrent scale, VAP acts as the dominant suppressing factor through rapid fuel moisture elevation (
Table A2), consistent with known atmospheric suppression mechanisms [
50]. In contrast, SPEI emerges as the dominant driver at lagged scales, where its influence reflects cumulative moisture deficits and reduced soil water storage typically developing between September and November. Such prolonged drought conditions persistently enhance fuel availability and combustibility, preconditioning the landscape for elevated fire risk in subsequent seasons. The role of VPD further demonstrates scale-dependent reversals. At shorter lags, elevated VPD directly desiccates fine fuels, lowering ignition thresholds. Conversely, prolonged VPD over 4–6 months during the growing season can limit vegetation growth in moisture-sensitive areas, ultimately reducing fuel availability months later [
41]. Our models capture this transition, showing that the 1–3-month window integrates adequate time for fuel conditioning without triggering growth inhibition.
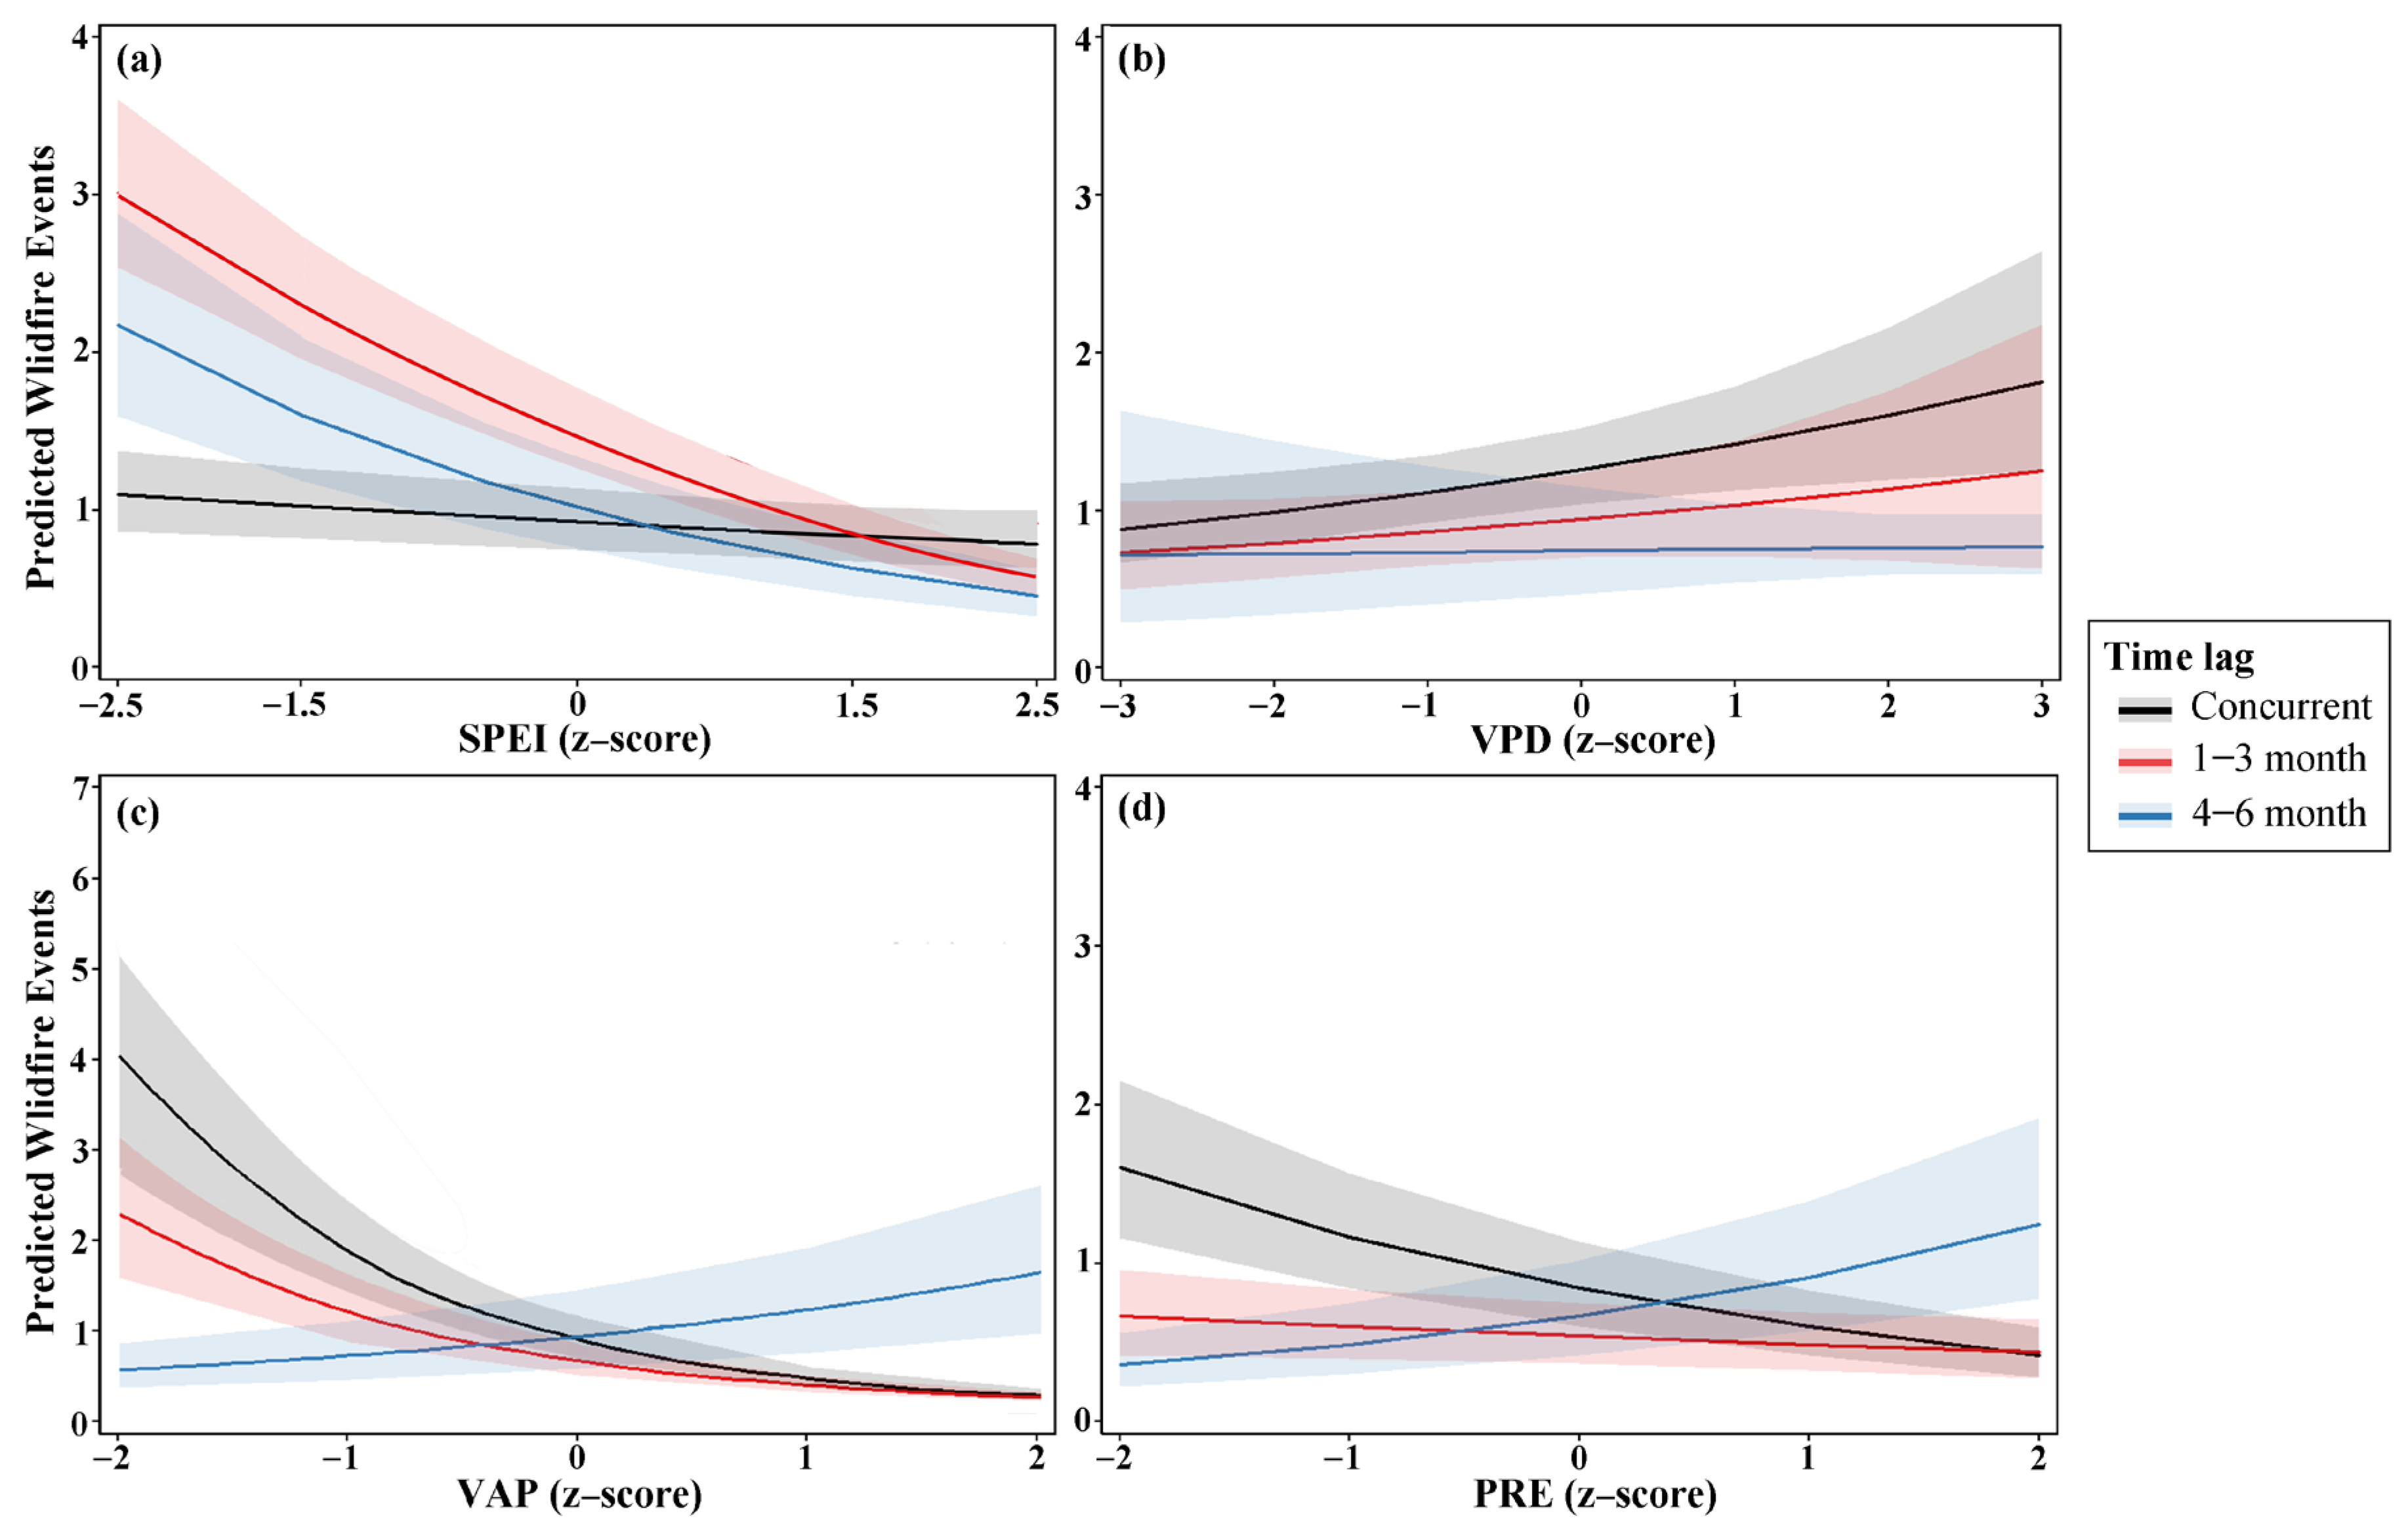
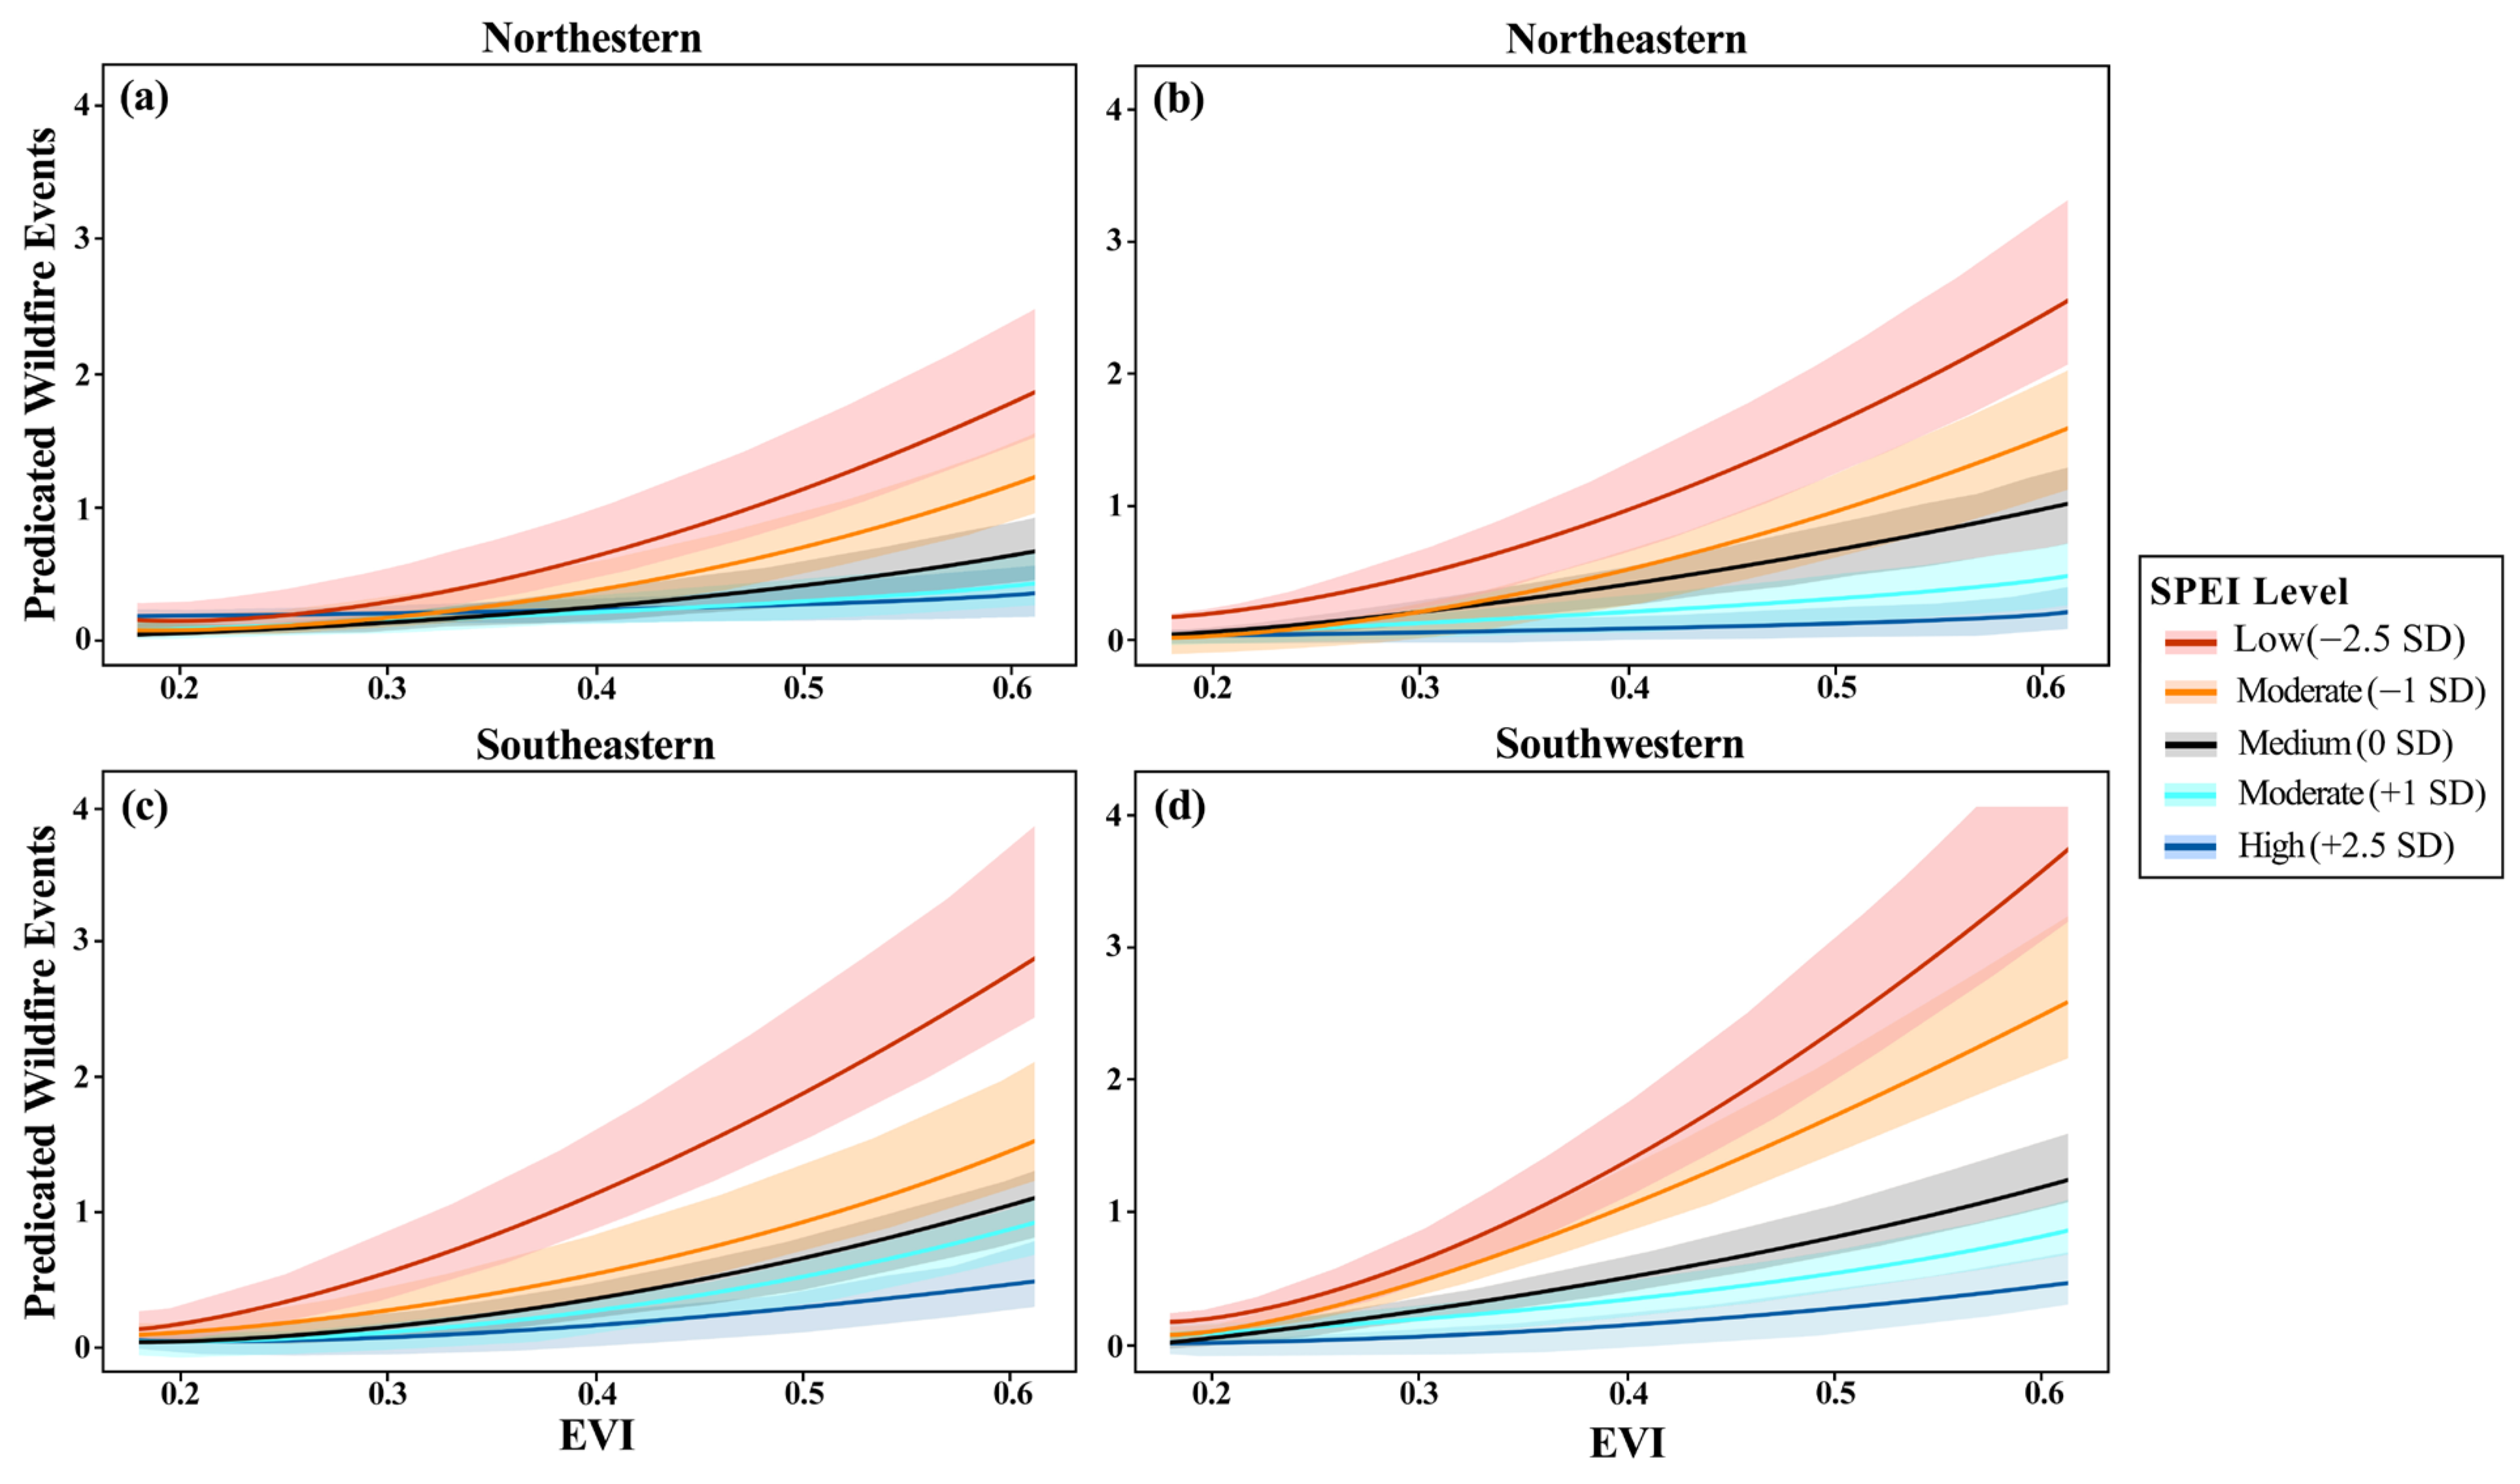
Moreover, the nonlinear marginal effects of drought indices reveal the synergistic role of shorter-term dryness in wildfire promotion. Our GLMM-based analysis reveals that at concurrent and 1–3-month lag scales, the four drought indices jointly contribute to a nonlinear rise in wildfire risk as moisture diminishes (
Figure 6), a pattern consistent with earlier findings [
9]. Dense vegetation further amplifies this drought–fire relationship (
Figure 7). The influence of drought strengthens with increasing vegetation cover, significantly elevating fire risk in fuel-rich regions. For instance, in the southwestern region with EVI = 0.6, predicted high-intensity wildfires increased from 2.5 under moderate drought to 3.7 under severe drought. These results align with global patterns linking productive ecosystems to stronger drought–fire relationships [
25,
39]. Regional differences were also evident in how vegetation influences fire risk. A slightly less pronounced but still strong amplification was observed in the southwestern region, likely due to the prevalence of vegetation adapted to drier conditions. Similarly, the northeastern and northwestern regions showed considerably more moderate effects, possibly resulting from limited fuel availability or differing vegetation composition. These spatial differentiations illustrate how local vegetation characteristics mediate landscape-level fire susceptibility [
21]. In contrast, anthropogenic activity exerted a relatively limited influence on fire risk compared to drought and fuel drivers. Collectively, these findings demonstrate that, in subtropical China, shorter-term antecedent drought increases wildfire risk through rapid fuel drying, with its effect amplified in areas with high fuel load (as indicated by EVI).
4.4. Wildfire Prediction and Management Implications
Traditional wildfire forecasting methods, such as those based on the Fire Weather Index, tend to overpredict high fire danger and frequently result in false alarms. Previous research indicates that substantial improvements in prediction accuracy require high-quality fire activity data [
51]. This study employs the MCD14ML v6.1 dataset, the latest MODIS active fire product, which offers long-term, high-frequency fire observations at global and regional scales. This represents an advantage over satellites such as Landsat and Sentinel [
13,
14]. A key feature of MCD14ML is the inclusion of Fire Radiative Power, a crucial metric for assessing wildfire intensity.
Studies show that integrating key drivers such as weather, fuel properties, and ignition sources enhances the reliability of global wildfire risk predictions [
10,
11]. Our methodology adheres to this principle while focusing on subtropical China, a region characterized by fuel-rich ecosystems where drought conditions strongly influence prediction quality. Moreover, because wildfires are sporadic events driven by favorable environmental conditions and stochastic ignitions, count-based modeling provides a natural framework for prediction [
51]. Accordingly, we applied zero-inflated negative binomial generalized linear mixed models, which are ideally suited for such analyses [
52]. These models explicitly represent the dual process of wildfire occurrence, accounting for both frequent absences under insufficient conditions and the expected number of events when drivers align. By distinguishing structural zeros from stochastic events, ZINB-GLMMs offer a more realistic basis for predicting wildfire event counts across diverse landscapes.
Predicting wildfires can support enhanced prevention and adaptive management strategies [
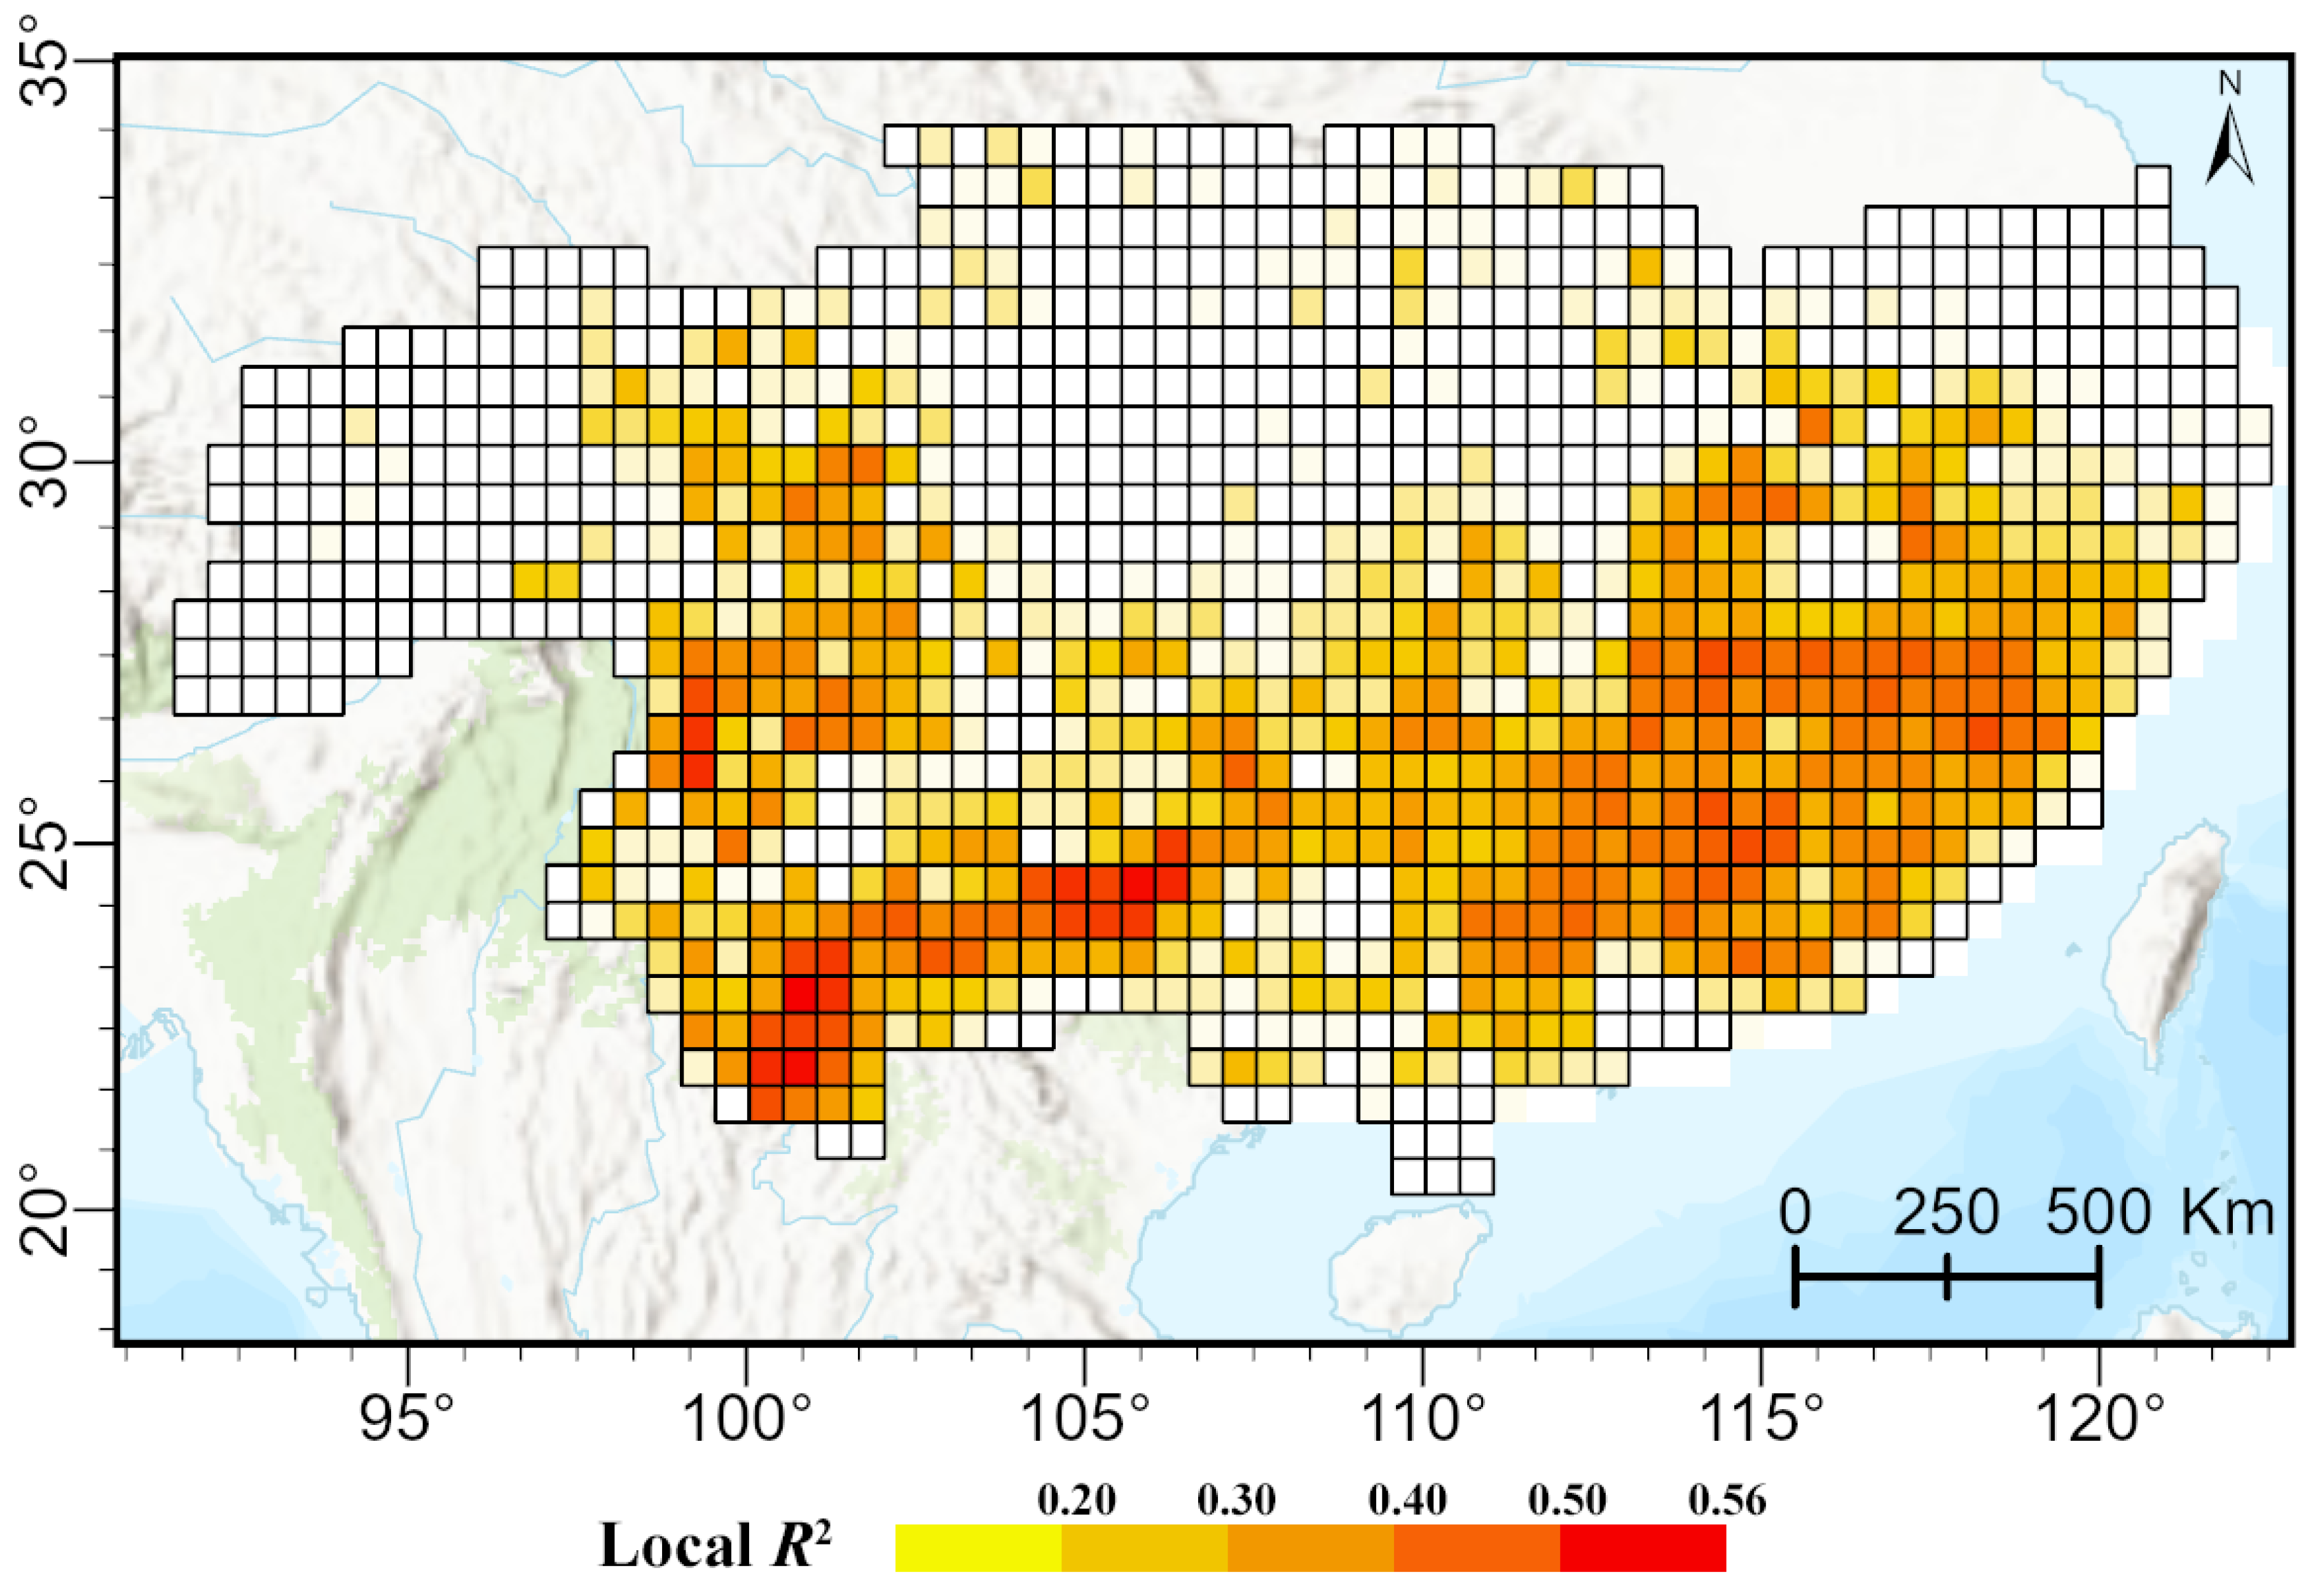
50]. The 1–3-month lag model exhibited strong spatial predictive performance, particularly in the southwestern and southeastern subregions (
Figure 8). These areas, including the Hengduan Mountains, the karst landscapes of Guizhou, and Yunnan Province, are characterized by dense vegetation and high susceptibility to drought during winter and spring. The model identified several known high-risk zones, consistent with previous studies [
32,
48]. In these regions, combined soil moisture deficit and atmospheric aridity significantly increase fuel combustibility, creating conditions conducive to intense wildfires.
In contrast, predictive performance was lower in parts of the northeastern and northwestern subregions. Several factors may explain this pattern. Human activities, such as agricultural burning and infrastructure development, can introduce ignitions that are not captured by drought-based predictors. Topographic complexity, including steep slopes and variable aspects, further modulates fire behavior and complicates climate fire relationships. Additionally, vegetation composition differs between the north and south. The northern subregions contain a higher proportion of deciduous broadleaf and mixed forests, which may exhibit different fuel moisture dynamics and drought responses compared to the evergreen broadleaf forests that dominate the south. Together, these local factors likely contribute to the weaker model performance observed in the northeast and northwest.
In China, fire suppression is the dominant wildfire management strategy. While effective at reducing anthropogenic ignitions, this approach also promotes fuel accumulation [
3]. In areas with continuous fuel loads, prolonged drought combined with ignition sources such as lightning substantially increases the probability of high-intensity wildfires [
17,
25]. Our findings highlight the importance of monitoring drought conditions during the critical 1–3 months preceding the fire season throughout subtropical China. Integrating these predictive insights into management frameworks would facilitate earlier intervention and more targeted resource allocation, supporting a shift from reactive fire suppression to proactive risk mitigation. Specifically, we recommend integrating sub-seasonal drought forecasts and vegetation monitoring into fire early warning systems, implementing spatially targeted prescribed burning in high-risk zones, and adjusting fire suppression tactics to account for lagged drought effects in fuel-rich regions. These measures would enhance regional resilience to climate-driven wildfire threats.
4.5. Limitations of This Work
Future work should combine higher-resolution remote sensing products, dynamic teleconnection modules, and deep learning frameworks to improve prediction accuracy, spatiotemporal refinement, and system scalability. The transferability of the proposed framework to other subtropical monsoon regions remains to be tested with local data, and we consider this a key direction for future work. Incorporating higher-resolution remote sensing data, dynamic ENSO-monsoon teleconnection modules, and deep learning approaches could further improve the accuracy, spatiotemporal resolution, and transferability of fire risk models in future studies.