Article

Selection of Stable and High-Yielding Poplar Clones Using BLUP–GGE Across Multiple Environments

1
Academy of Forestry, Hebei Agricultural University, Baoding 071000, China
2
Shandong Aacademy of Forestry, Jinan 250014, China
3
Jinan Energy Engineering Group Co., Ltd., Jinan Energy Engineering Group, Jinan 250101, China
4
Research Institute of Forestry, Chinese Academy of Forestry, Beijing 100091, China
*
Authors to whom correspondence should be addressed.
Forests 2026, 17(7), 850; https://doi.org/10.3390/f17070850
Submission received: 12 June 2026 / Revised: 16 July 2026 / Accepted: 16 July 2026 / Published: 17 July 2026

Abstract

Understanding genotype × environment interactions (G × E) is essential for selection of stable and productive clones in poplar breeding. However, the performance of hybrid poplar clones often varies unpredictably across sites, hindering efficient regional deployment. In this study, we evaluated the growth performance of 21 hybrid Populus section Aigeiros clones under five contrasting environmental conditions (YI, SHAN, SHEN, FEI, and JUAN). At the end of the growing season, we measured tree height (H), diameter at breast height (DBH), and individual tree volume (V). Both parametric and non-parametric stability statistics were used to assess individual V and fitted a mixed linear model in ASReml–R to generate best linear unbiased prediction (BLUP) values for subsequent genotype plus genotype-by-environment (GGE) biplot analysis. All measured traits exhibited substantial phenotypic variation, with coefficients of variation ranging from 17% to 43%. Genotype, environment, and G × E interaction effects were all highly significant (p < 0.01). The GGE biplot explained 89.88% of the total variation in individual V across test environments. Clones 1617 and 1618 exhibited high productivity, broad stability and strong adaptability across sites. Site discrimination and representativeness analyses revealed that SHAN, SHEN, FEI and JUAN were more informative, whereas YI showed weaker genotype differentiation. Clones 1617 and 1618 were particularly well adapted to FEI and JUAN, while clones 81, 1618, 13–22, 1607, I–107 and 1617 performed favourably in the other mega-environment. Our results indicate that integrating BLUP with GGE biplot analysis provides a robust framework for dissecting G × E and guiding clone selection in multi-environment poplar trials. The study provides valuable insights for refining poplar deployment strategies under diverse environmental conditions.

1. Introduction

Poplar represents a key tree genus in temperate regions, characterized by rapid growth, early maturity and high wood yield [1,2], and is among the most extensively cultivated and productive fast-growing timber species in global mid-latitude plains [3,4]. Poplar plantations effectively alleviate exploitation pressure on natural forests while providing essential ecological functions—including climate regulation—and sustainable industrial wood supplies [5,6]. Within the genus, P. section Aigeiros, particularly P. deltoides and its interspecific hybrids such as P. × euramericana, dominates global commercial poplar production [7,8]. These clones are prized for their vigorous growth, high productivity, and resistance to trunk-boring pests [9,10,11]. Notably, P. × euramericana ‘74/76’ (hereafter referred to as poplar I–107) is a superior cultivar widely planted across northern China and Huanghuai Plain. In poplar breeding, the ideotype concept, which defines an ideal plant morphological architecture, has been established to guide clonal selection. For P. section Aigeiros, the optimal ideotype features a single straight stem with strong apical dominance, moderate branch thickness and branch angles, and a high leaf area index; these traits are genetically correlated with improved timber and volume productivity [7,8].
In China, poplar forests underpin national timber and ecological security, with their development explicitly prioritized in key national strategic frameworks, including the National Reserve Forest Construction Plan (2018–2035) and the Main Forest Tree Breeding Science and Technology Innovation Plan (2016–2025). Poplars also serve as an essential component of shelterbelt ecosystems and the wood-processing industry [9,10]. Nowadays, substantial efforts have been dedicated to the breeding and introduction of superior Aigeiros clones, with inter- and intraspecific hybridization widely applied to broaden genetic diversity and develop fast-growth, straight-stemmed and environmentally adaptable genotypes [7]. Systematic seedling assessments and multi-site field trials have facilitated the development of elite varieties, including ‘Bofeng 1’, ‘Bofeng 2’, and ‘Huaxiong 4’ [12,13]. Such breeding and introduction programmes have substantially enriched poplar genetic resources reservoirs [14,15,16]. Despite these advances, further improvement in plantation productivity and commercial value is still needed, and the precise matching of elite clones to suitable planting environments remains a critical prerequisite for optimized poplar cultivation.
Multi-environment trials (METs) are routinely implemented to evaluate the adaptability and phenotypic stability of tree clones across heterogeneous sites [17,18,19]. Huehn and Thennarasu [20] categorized two primary analytical frameworks for investigating GEI. The first is the parametric approach (S1, S2, S3, S6 et al.), which relies on statistical distributional assumptions and quantifies genotypic performance across environments. The second is the non-parametric approach (N1, N2, N3, and N4), which characterizes phenotype–environment associations and integrates both biological and abiotic influencing factors. Collectively, these two approaches quantify genotypic environmental stability by assessing clonal sensitivity to varying environmental conditions [21]. Mixed linear models coupled with best linear unbiased prediction (BLUP) are well-suited for forestry trial analyses, as they effectively account for block effects, unbalanced experimental data and random genetic effects. Complementarily, genotype plus genotype-by-environment (GGE) biplot analysis serves as a powerful visualization tool to characterize genotypic performance, stability, as well as quantify the discrimination and representativeness of trial sites. The integrated application of BLUP and GGE biplots can therefore provide a robust theoretical basis for clonal selection and optimal test site screening in forestry METs [22]. Notably, existing studies on poplar clonal stability and adaptability have rarely integrated parametric and non-parametric statistics with a BLUP-adjusted GGE biplot framework, leaving a methodological gap in multi-environment poplar evaluation.
Therefore, this study assessed growth traits of 21 P. section Aigeiros clones across five contrasting field sites. We performed clonal stability analysis using combined parametric and non-parametric statistics, fitted mixed linear models in ASReml–R to generate BLUP values for individual V at six years of age, and constructed GGE biplots to comprehensively evaluate clonal growth performance, phenotypic stability, and test-site representativeness. The objectives of this study were to: (1) quantify genotypic and environmental variation in tree height (H), diameter at breast height (DBH) and individual tree volume across the 21 hybrid clones; (2) compare clonal productivity and stability via parametric and non-parametric stability metrics; (3) estimate BLUP values for individual tree volume using mixed linear modelling; and (4) screen superior stable clones and characterize informative test sites through GGE biplot analysis. The findings provide empirical evidence to support the early-stage selection of high-yielding, stable poplar clones and optimize clonal deployment strategies for regional plantation systems.

2. Materials and Methods

2.1. Experimental Design

In March 2018, clonal field trials were established at five state-owned forest farms in Shandong Province (Table 1) using two-year-old root one-year-old poles. At each site, a randomized complete block design (RCBD) was used with four blocks (replications). Afforestation spacing varied across sites to accommodate differences in local terrain and plot area. The 21 P. section Aigeiros clones were randomly arranged within each block, with four trees planted per clone per block. Two peripheral guard rows, consisting of identical clones and matching planting spacing, were established around each experimental plot to eliminate edge effects. All five sites were managed under uniform cultivation practices throughout the experimental period. Irrigation was implemented 3–4 times per year, and fertilization was conducted twice annually from May to July during the second growing season after planting. Routine weeding was conducted during the early plantation establishment stage, and standardized pruning was carried out during winter dormancy. For trees exceeding 10 m in height, all branches below one-third of the total height were removed to maintain a consistent crown-to-height ratio of approximately 2:3. No severe pest or disease outbreaks occurred during the trial, and the overall tree survival rate remained consistently above 90%.
The maternal and paternal parents of all tested clones are summarized in Table 2. The maternal parents, including P. deltoides clones D2, D3, D4, D5, D6, D7, D8, and D28, and others, and the paternal parents D20, D21, D22, D23, D24, etc., were all introduced from Tennessee, USA. These clones exhibit rapid growth, straight well-formed stems, tolerance to waterlogging, resistance to pests and diseases, and robust fecundity. By contrast, paternal P. nigra clones N1, N2, and N4 were sourced from Altay City, China, and display superior characteristics including fast growth, straight stem morphology, cold resistance and strong rooting ability. Among them, the I–107 used in the production and widely applied was set as the control clone.

2.2. Data Collection and Analysis

Microsoft Excel 2020 was used for raw experimental data sorting, organization and the visualization of growth trait box pots. Statistical analyses were conducted in R (v 4.0.1). The survival and survminer packages were utilized for parametric and non-parametric stability analyses, whereas the GGEBiplotGUI package was applied to generate GGE biplots. Biplot parameter settings were standardized as follows: unscaled data (Scaled = 0) with centred genotype and genotype-by-environment interaction effects (Centred = G + GE), and singular value partitioning was set to 1 or 2 corresponding to different biplot categories. Least significant difference (LSD) post hoc multiple comparison tests were performed to detect significant differences in phenotypic traits.
At the end of the sixth growing season, tree height (H) and diameter at breast height (DBH) were measured. In this study, ‘yield’ refers to the individual tree volume (V) calculated from DBH and height, serving as an indicator of timber productivity. Individual tree volume (V) was calculated using the following formulas:
V = 0.19328321 × DBH2 × H + 0.007734354 × DBH × H + 0.82141915 × DBH2
A mixed linear model with heterogeneous variances was fitted using ASReml–R, and best linear unbiased prediction (BLUP) values were extracted using the ‘predict()’ function:
Yijkl = μ + Si + Bj (Si) + Gk + Si × Gk + eijk
where Yijkl is the observed value of genotype k at the i-th site in the j block, μ the mean of all observed values, Si the effect of site, Bj (Si) the effect of block, Gj the effect of genotype, Si × Gj the interaction effect of genotype and site, and eijk the random error. Among them, the site was a fixed effect, while genotype, block and genotype × site interaction were treated as random effects. Heterogeneous residual variances across sites were modelled and justified through LRT (95% confidence interval, p < 0.05). The model was used to obtain BLUP values for clone performance.
The formula for calculating the repeatability of traits [23] was:
R = σ C 2 σ c 2   +   σ s c 2 i   +   σ e 2 n i
where R represents the repeatability, and σ C 2 is the variance components of clone, σ s c 2 is the variance components interaction effect of genotype and site, σ e 2 is the variance components of error, i is the number of site, and n is the number of individuals within the site.

3. Results

3.1. Variation in Growth Traits

Uniformly sized P. section Aigeiros seedlings were planted in five experimental forest sites in 2018 to establish clonal trial plantations. The growth conditions of 21 assessed clones during 2022 and 2023 are shown in Figure 1. The H, DBH and V of all clones exhibited consistent year-on-year increase across all trial sites. However, individual clones displayed divergent growth responses at different locations, with pronounced clonal growth variation across sites driven largely by heterogeneous environmental conditions. Specifically, the SHEN site, which features high annual precipitation (900 mm) and fertile loamy alluvial soil, supported the most robust clonal growth overall. In contrast, the YI site, characterized by sandy loam soil, showed the lowest growth performance. All measured growth traits exhibited interannual variation, with the magnitude of phenotypic differences varying substantially across sites.
The 21 clone varieties are shown in Table 3. At SHEN, clone 81 showed significantly (p < 0.05) higher H and V than the control I–107, exceeding it by 9.7% and 23.5%, respectively. At YI, the H values of clones 1601, 81 and 1607 were significantly different (p < 0.05) from the control I–107, exceeding the control I–107 by 22.9%, 17.6% and 16.2%. At SHAN, the H, DBH and V of 81 differed significantly (p < 0.05) from those of control I–107. At JUAN, clone 2215 showed a significant (p < 0.05) increase in H relative to the control I–107, exceeding it by 14.8%. At FEI, the H, DBH and V of clone 81 differed significantly (p < 0.05) from those of control I–107. On the whole, the growth of clones 81, 1615, 1607, 1601, 1618, 1617, 2215 and 13–22 consistently outperformed the site-average across all five sites.
Descriptive statistics for key growth traits of 5- and 6-year-old poplar clones are summarized in Table 4. For 5-year-old trees, H and DBH showed moderate phenotypic variation, with mean values of 14.2 m and 17.1 cm and coefficients of variation (CV) of 18.75% and 19.72%, respectively. By comparison, V exhibited substantially higher variability (CV = 51.79%), reflecting marked differences in biomass accumulation across the tested clones. At age six, the CVs of all traits declined, although V still retained a considerably higher CV (41.76%) than H and DBH. Overall, growth traits, especially V, showed substantial phenotypic variation, indicating considerable potential for clonal selection. Accordingly, V alone was selected as the core indicator for subsequent analytical procedures.

3.2. Parametric and Non-Parametric Statistics

Across all sites, clones 81, 1615, 13–22, 1618, 1607, 1617 and 2215 exhibited superior V performance, with the control clone I–107 ranking 8th. By contrast, clones 1624, 1606, 2025, 1608 and 1602 showed relatively low volumetric growth (Table 5). Stability evaluations based on parametric and non-parametric statistics yielded highly consistent outcomes. The ASV values of clones 1617, 1619, 13–26, 1618, 1607, 2215 and 1601 as having stable volume performance, whereas clones 81, 1610, I–107, 1270 and 1608 were showed poor stability. Notably, clone 2025 achieved the lowest CV, indicating the most phenotypically stable genotype. Parametric stability metrics (S1–S6) further verified 1617, 1618, 1619, 13–26, 1613, 2215, 81 and 1615 as highly stable clones. Thennarasu’s non-parametric stability statistics (N1–N4), which quantify stability based on adjusted mean volume rankings (lower values indicate greater stability), revealed minor discrepancies in the ranking of top-performing genotypes but consistently classified 1617, 1618, 1619, 13–26, 1624 and 1608 as stable across multiple evaluation indices. Collectively, clones 81, 1615, 1618, 1617 and 2215 integrated high volumetric productivity with excellent phenotypic stability, making them elite candidates for large-scale regional plantation deployment.

3.3. G × E Test and Repeatability

The mixed-model ANOVA results for the three growth traits are presented in Table 6. Significant variance components (p < 0.001) were detected for genotype, site, and genotype × site interaction across all traits, indicating substantial genetic differentiation among clones, strong environmental contrasts among sites, and notable G × E effects. For tree height, genotype variance was moderate (0.858), while site effects contributed the largest proportion of variation (variance = 6.498). DBH and individual tree volume showed high genotypic control, with repeatability estimates of 0.84 and 0.86, respectively, demonstrating strong potential for genetic improvement. Genotype × site interaction effects were also significant for all traits, emphasizing that clone performance varied considerably among environments. The relatively small G × E variance components indicate that interaction effects, while significant, contributed less to total variation than main effects. Model diagnostics supported the adequacy of the mixed-model specification for variance partitioning.

3.4. GGE–Biplot Evaluation Based on BLUP Values

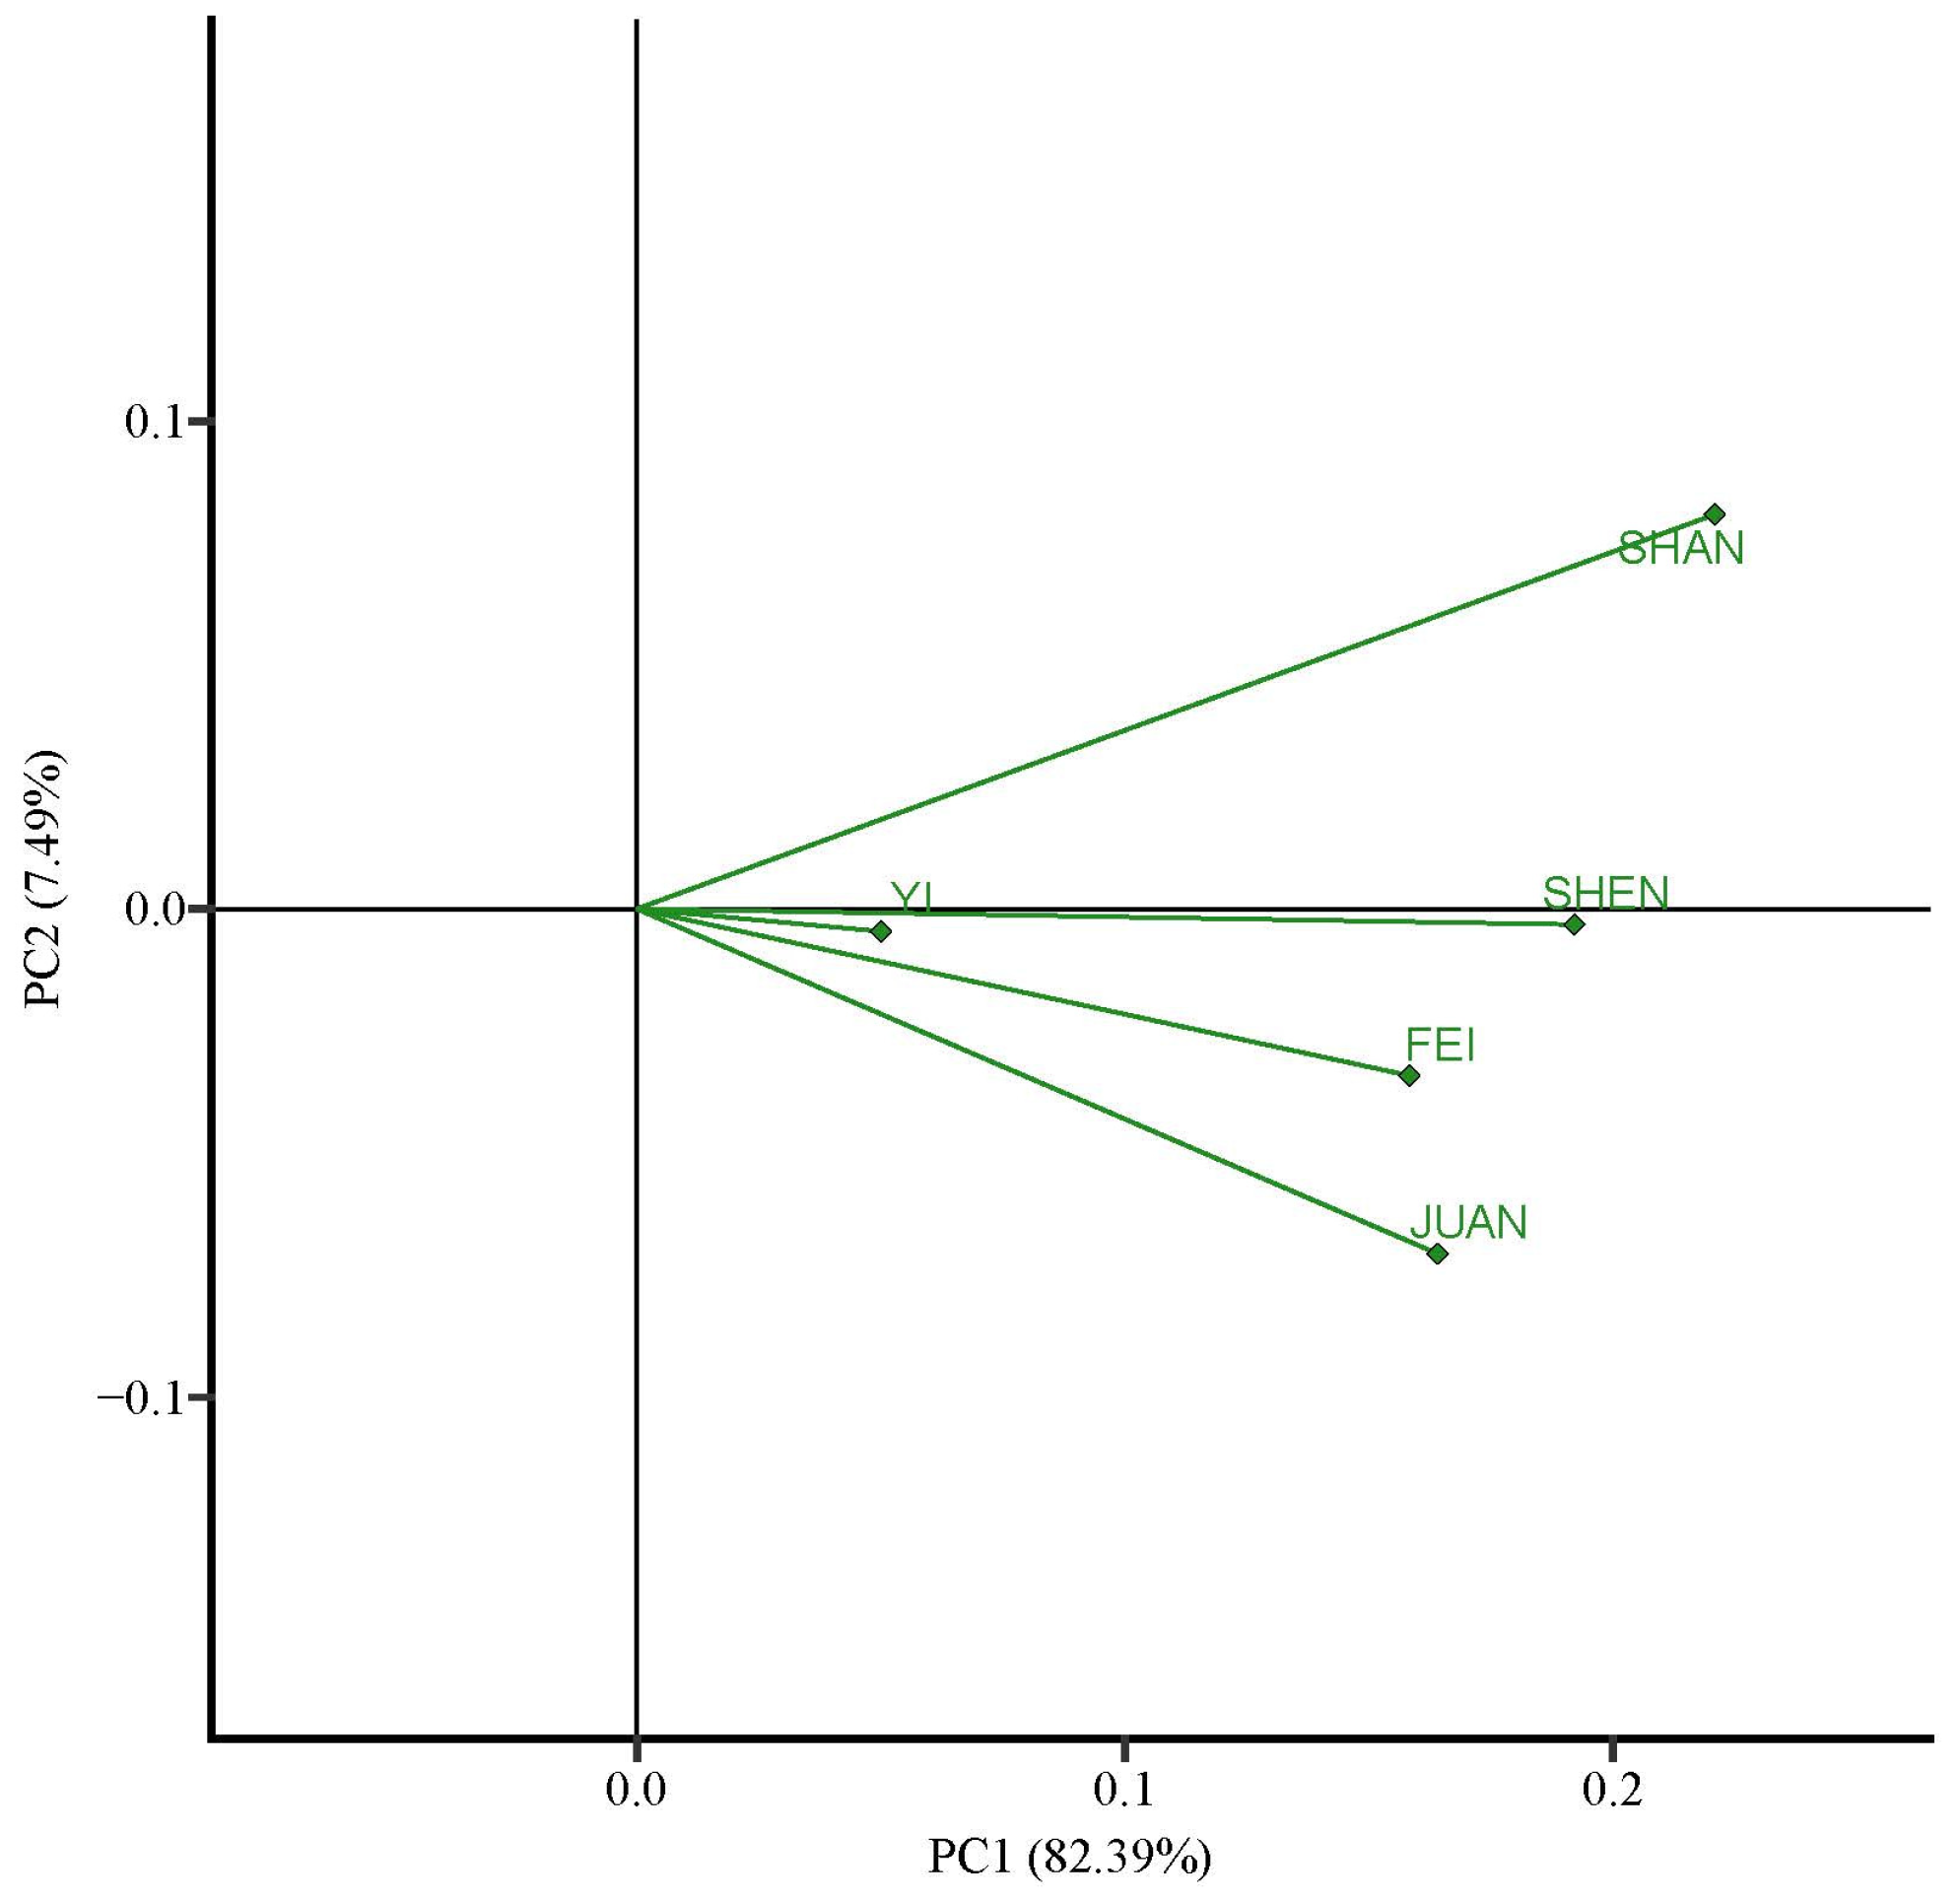
The GGE biplot effectively explained 89.88% of the total phenotypic variation in individual tree volume, with the first two principal components (PC1 and PC2) accounting for 82.39% and 7.49% of the total variation, respectively (Figure 2). All pairwise angles between environmental vectors were acute, indicating positive phenotypic correlations across the five trial sites. The YI, SHEN and FEI sites exhibited strong inter-site correlation. Among all test environments, SHAN, SHEN, FEI and JUAN displayed strong discriminatory ability and high representativeness. Notably, the SHAN and JUAN sites showed nearly independent vector relationships with minimal correlation. In contrast, the YI site showed weak discriminatory capacity and limited ability to resolve genotypic phenotypic differences. These spatial variation patterns confirm sufficient environmental heterogeneity across trial sites to induce biologically meaningful G × E interactions, particularly within the highly discriminatory environments.
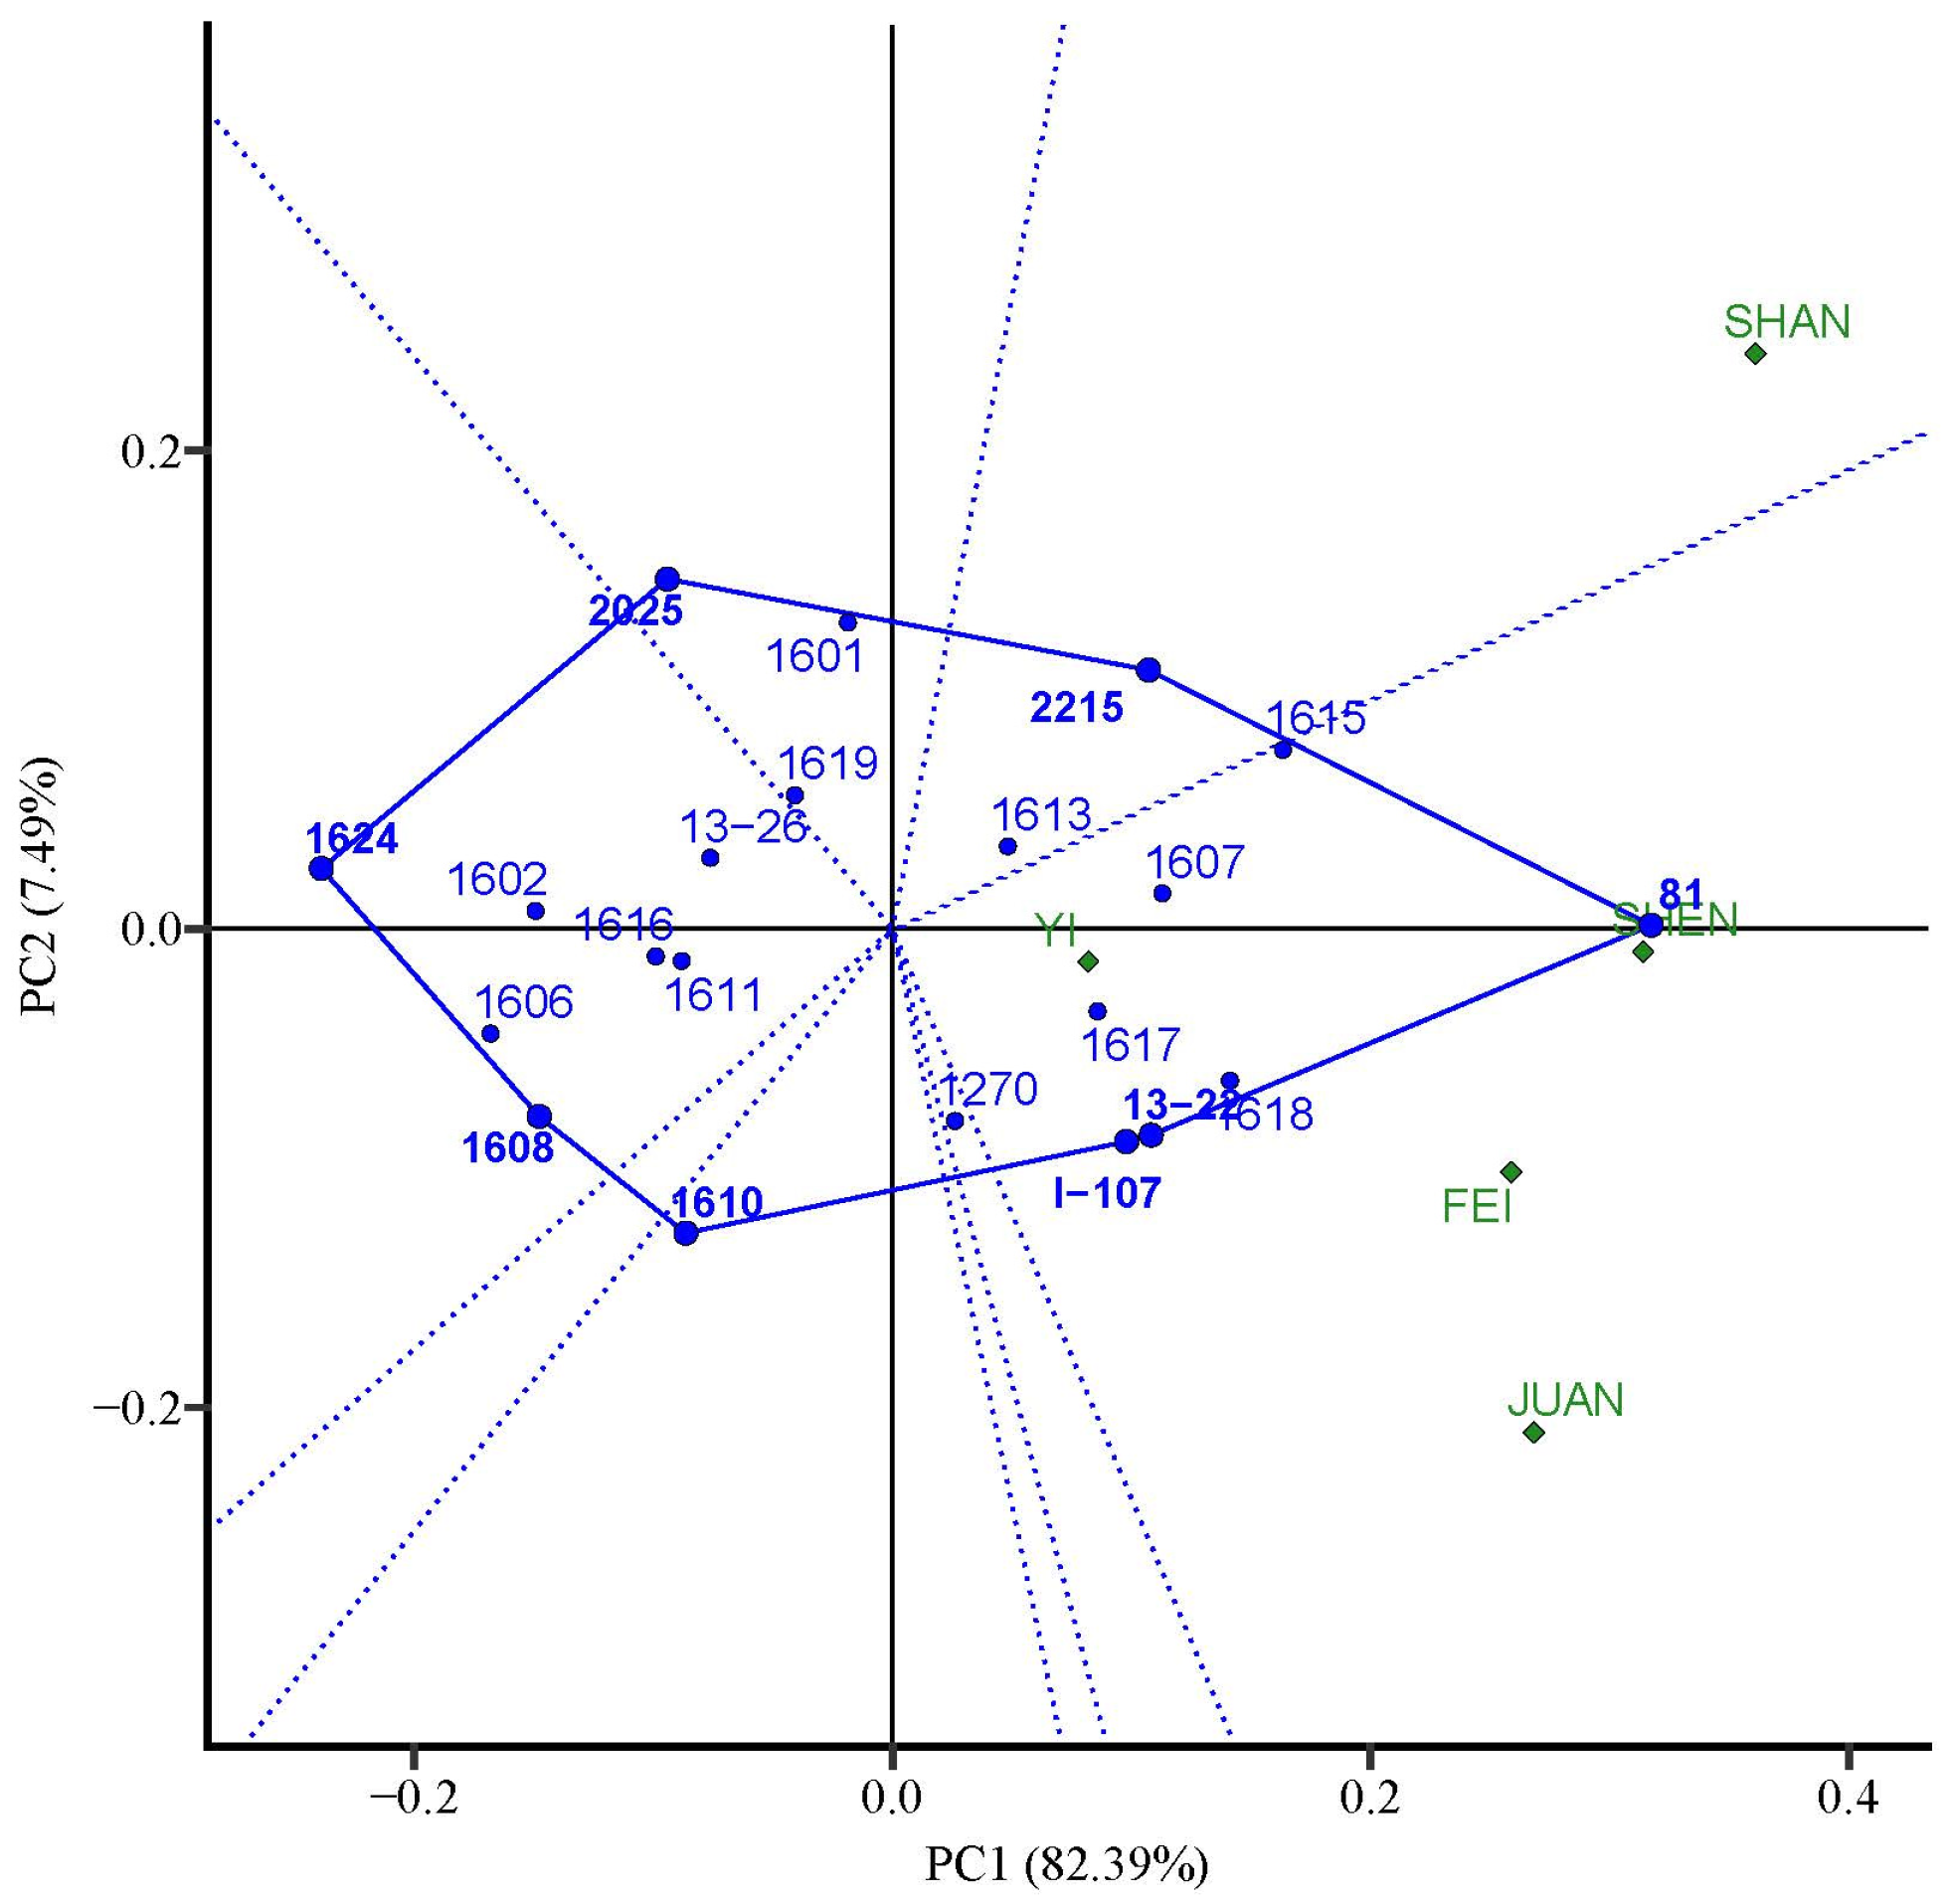
Figure 3 shows that the five test sites can be divided into two mega-environments (MEs). The SHAN formed the first ME, YI, FEI, JUAN and SHEN constituted the second ME. Within each ME, the best-performing clones were identified as follows: clone 2215 performed best in the first ME. Clone 81, 1618, 13–22 and I–107 showed higher performance in the second ME.
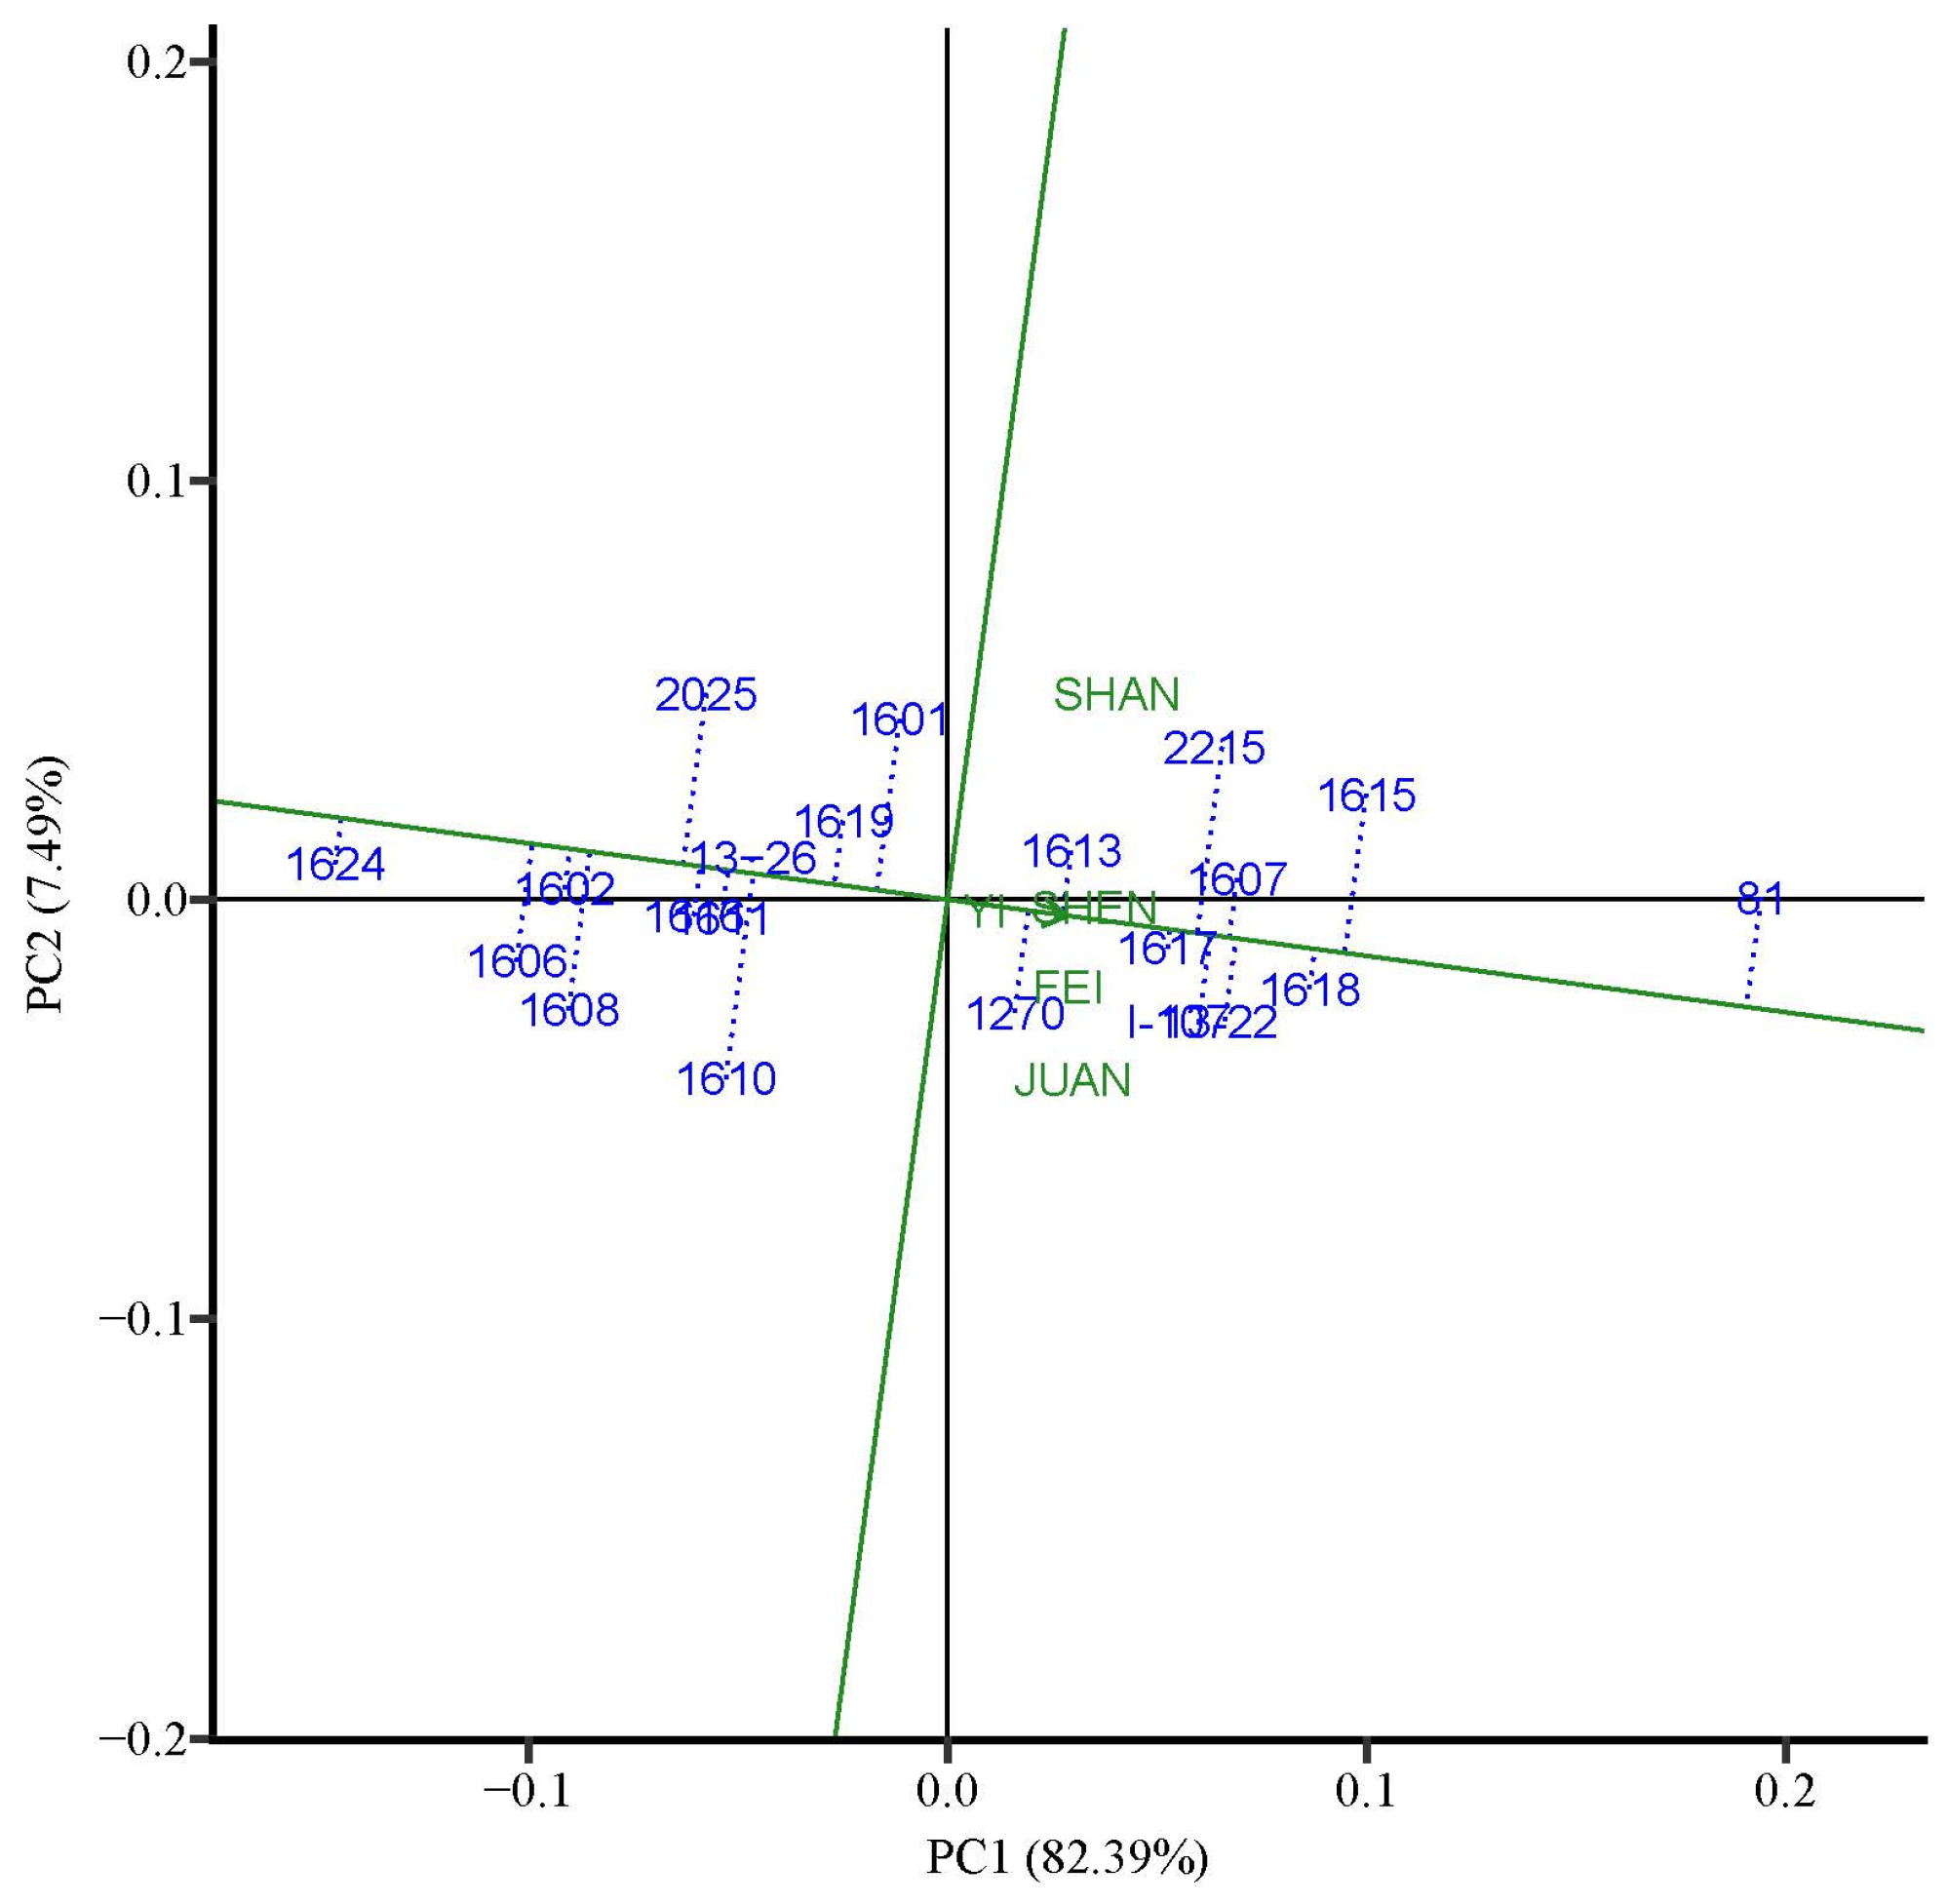
Figure 4 visualizes the mean volumetric performance and phenotypic adaptability of the 21 tested clones, revealing distinct genotypic differences. Clone 81 exhibited the highest individual tree volume and was positioned furthest right of the grand mean, followed by clones 1615, 1618, 13–22, 1607, I–107, 2215, 1617, 1613 and 1270. Clones 81, 1618, 13–22, 1607, I–107 and 1617 combined high productivity and satisfactory broad adaptability, making them suitable for cultivation across the YI, SHEN, and SHAN sites. Meanwhile, clones 1618 and 1617 showed superior growth performance and adaptability specifically for the FEI and JUAN. By comparison, clone 1624 had the lowest mean volumetric productivity and was located furthest left of the grand mean. In terms of yield and adaptability, phenotypic stability and cross-site adaptability, clones 1617 and 1618 stood out as the most elite genotypes, exhibiting comprehensive performance advantages across diverse trial conditions.

4. Discussion

By comparing multi-year growth traits of 21 poplar clones across five contrasting trial sites, this study demonstrated pronounced genotypic and spatiotemporal variation in growth performance. Specifically, clones 81, 1617, 1618, 2215 and 1615 consistently exhibited above-average H, DBH and V across all experimental environments. Abundant genetic variation within and among Populus species and clonal genotypes underpins the selection and improvement of superior cultivars [24,25]. Characterizing environment-dependent genetic variation is therefore critical for screening elite, adaptable genotypes for targeted forestry deployment. In this study, phenotypic CV for six-year-old growth traits ranged from 17% to 43%, with V presenting the highest variability (43%), consistent with prior poplar genetic evaluation studies [26]. The substantial phenotypic differentiation observed among the tested clones likely stems from the diverse genetic backgrounds of their parental germplasm, which generates broad genotypic diversity and pronounced phenotypic plasticity [27]. Such rich phenotypic variation provides robust selective potential for clonal improvement and screening. Collectively, these results indicate that V as a sensitive and representative indicator for evaluating clonal growth performance, stability and cross-site adaptability in multi-environment poplar trials.
Poplar plantation areas cover extensive and environmentally heterogeneous regions, presenting substantial challenges for the screening and deployment of high-yielding, phenotypically stable cultivars. Here, we integrated parametric and non-parametric statistical approaches to comprehensively evaluate clonal stability, identifying clones 81, 1615, 1618, 1617 and 2215 as superior genotypes with both robust volumetric productivity and stable cross-environment performance. Disentangling the independent and interactive effects of genetic regulation and environmental variables on clonal phenotypic variation is therefore critical to guide precision clonal deployment. Significant site-specific differences in growth traits confirmed pronounced environmental heterogeneity across trial locations. Variation in soil type, annual precipitation, mean annual temperature and planting density across the five experimental sites substantially modulated the growth performance of P. section Aigeiros clones. The highly significant G × E interaction observed in this study [28,29] demonstrates divergent genotypic plastic responses to environmental fluctuation, emphasizing the necessity of tailored, site-specific clonal selection strategies. Furthermore, repeatability values exceeding 0.84 for DBH and V indicate strong genetic regulation of these key growth traits, with considerable potential for stable genetic inheritance of superior phenotypic characteristics in future breeding programmes [19,30,31].
Given the large scale of plantation trials and unavoidable block effects [27], forestry experiments—predominantly multi-environment trials-benefit from analytical frameworks that can effectively remove non-genetic noise and improve selection accuracy [24,25,27]. In this study, a linear mixed model was constructed using ASReml–R with site as a fixed effect and clone × site as random effects. The GGE biplot indicates high reliability of the analysis [24,32]. The mean performance stability analysis identified clones 81, 1618, 13–22, 1607, I–107 and 1617 as high-yielding genotypes with favourable adaptability across the YI, SHEN and SHAN sites. Clone 81 achieved the greatest mean individual tree volume but exhibited limited cross-site adaptability. By contrast, clones 1617 and 1618 delivered an optimal balance of productivity, phenotypic stability and environmental adaptability, despite their slightly lower mean volume relative to clone 81. This finding reveals a notable productivity–stability trade-off in P. section Aigeiros germplasm, a key consideration for targeted clonal deployment. For homogeneous, intensively managed industrial plantations, high-yielding yet environmentally sensitive clones such as 81 can be prioritized to maximize short-term timber yields. Conversely, broadly adaptable, phenotypically stable genotypes including 1617 and 1618 are better suited for heterogeneous or climatically variable environments, enabling sustained long-term plantation productivity and yield resilience. Under heterogeneous or climatically uncertain environments, clones exhibiting broad adaptability and low variance (1617 and 1618) are preferable to safeguard long-term productivity. Environmental heterogeneity among trial sites underpinned the observed mega-environment (ME) grouping patterns. The SHAN, FEI, and YI sites received higher precipitation than JUAN and SHEN, while JUAN, SHEN, and FEI possessed soils with greater fertility and water-holding capacity relative to SHAN and YI. Additionally, the YI differed in planting density from the remaining four trial locations. These multidimensional environmental disparities structured the ME differentiation and drove divergent clonal growth responses across sites. The magnitude of G × E interactions detected in this study aligns well with previous multi-environment trial findings for hybrid poplars, confirming that the growth performance of P. section Aigeiros clones is strongly environment-dependent, even within a single provincial region such as Shandong. Importantly, this study advances current understanding by demonstrating unequal contributions of individual trial sites to overall G × E variation. For instance, the YI site exhibited weak genotypic discriminatory power, illustrating that although G × E effects were statistically significant at the global level, their magnitude varied substantially across individual environments. This nuanced spatial variability has been largely overlooked in prior poplar MET studies, which typically treat site effects as uniform and homogeneous [22,27]. Such findings highlight the critical importance of rigorous, representative trial site screening, as previously advocated, to avoid biassed clonal performance rankings and ensure robust breeding and deployment recommendations [28].
In terms of V, the SHAN, SHEN, FEI and JUAN sited presented strong genotypic discriminating capacity and high environmental representativeness, whereas the YI exhibited limited discriminatory performance. Genotypes optimized for each ME closely matched local environmental conditions: clone 2215 yielded the best in the SHAN site, whereas clones 81, 1618, 13–22 and I–107 showed superior growth at FEI, YI, JUAN and SHEN, respectively. These observations are consistent with a previous multi-site poplar study, which identified pronounced environmental heterogeneity across trial locations and confirmed high representativeness of experimental sites in northern China [24]. Collectively, these results verify that the northern China climatic and edaphic framework provides robust discriminatory power and representative trial conditions for screening high-yielding, phenotypically stable P. section Aigeiros clones.
The BLUP-based GGE biplot approach adopted in this study provides a robust theoretical framework for quantifying G × E interactions in hybrid Aigeiros clones. Nevertheless, present conclusions are limited to the early growth performance of poplars under short-rotation cultivation systems. Long-term, multi-year regional trials with continuous growth monitoring are therefore necessary to validate the generalizability and stability of our findings. While our results offer credible guidance for the early-stage screening of superior poplar clones, further validation through long-term observations and multi-region field assessments is essential prior to large-scale clonal deployment and industrial application.

5. Conclusions

This study revealed significant genotypic variation and pronounced genotype-by-environment interaction effects for key growth traits among 21 hybrid P. section Aigeiros clones across five heterogeneous field sites. Integrating volumetric productivity, phenotypic stability and cross-site adaptability, clones 1617 and 1618 were identified as elite genotypes with high yield potential, superior stability and broad environmental adaptability. Site-specific clonal deployment strategies were further established based on six-year-old growth performance: clone 2215 was optimal for the SHAN site, while clones 81, 1618, 13–22 and I–107 were best adapted to SHEN, YI, JUAN and FEI, respectively. Collectively, these findings furnish practical, site-tailored guidance for the rational deployment and efficient utilization of hybrid Aigeiros poplar clones and provide empirical insights to support future poplar breeding and cultivar selection in environmentally heterogeneous northern China plantation regions. However, all phenotypic evaluations here depend on early growth data of 6-year-old poplar plantations under consistent short-rotation regimes, lacking long-term growth patterns over full rotation cycles. Moreover, this study only addresses clonal growth performance and stability, with no exploration of molecular genetic mechanisms or physiological pathways shaping environmental adaptability. Future multi-year, wide-range regional trials across distinct ecotypes should combine wood property and stress resistance assessments with systematic genetic analyses. Such follow-up work will verify and expand current results, offering more solid, integrated theoretical guidance for poplar clone genetic improvement and industrial promotion.

Author Contributions

X.Z. contributed equally to this work. Writing—review and editing, Z.Z. and C.L.; data curation and investigation, R.Z., W.Z., M.S., Y.F. and Y.Q.; project administration, funding acquisition and project administration, S.L. (Shanwen Li) and S.L. (Shuangyun Li); conceptualization, validation, writing—review and editing, supervision, J.W. and M.Y. All authors have read and agreed to the published version of the manuscript.

Funding

This study was supported by the Key R&D Program of Shandong Province, China (Grant No. 2024LZGC025).

Data Availability Statement

The data presented in this study are available upon request from the corresponding author.

Acknowledgments

We are grateful for the scientific research platform and support provided by the Hebei Agricultural University and the Shandong Aacademy of Forestry.

Conflicts of Interest

The authors declare that they have no conflict of interest. Author Zhidong Zhuang is employed by Jinan Energy Engineering Group. The remaining authors declare that the research was conducted in the absence of any commercial or financial relationships that could be construed as a potential conflict of interest.

References

  1. Thakur, A.K.; Kumar, P.; Parmar, N.; Shandil, R.K.; Aggarwal, G.; Srivastava, D.K. Achievements and prospects of genetic engineering in poplar: A review. New For. 2021, 52, 889–920. [Google Scholar] [CrossRef] [Scilit]
  2. Guleria, I.; Kumari, A.; Lacaille, D.M.; Saini, A.K.; Kumar, V.; Saini, R.V.; Lal, U.R.; Naseem, A.G.; Sonam, K.; Amit, S.; et al. In–vitro antimicrobial, antioxidant, anti–inflammatory, and cytotoxic activities of Populus ciliata bark and leaves: A comparative study. S. Afr. J. Bot. 2022, 148, 238–250. [Google Scholar] [CrossRef] [Scilit]
  3. Fang, S.Z. Silviculture of poplar plantation in China: A review. Chin. J. Appl. Ecol. 2008, 19, 2308–2316. (In Chinese) [Google Scholar]
  4. Richardson, J.; Isebrands, J.G.; Ball, J.B.; Isebrands, J.G.; Richardson, J. Ecology and physiology of poplars and willows. In Poplars and Willows: Trees for Society and the Environment; CABI Digital Library: Wallingford, UK, 2014; pp. 8–91. [Google Scholar]
  5. Stanturf, J.A.; Oosten, C.; Netzer, D.A. Ecology and silviculture of poplar plantations. In Poplar Culture in North America; NRC Research Press: Ottawa, ON, Canada, 2001; pp. 153–206. [Google Scholar]
  6. Sharan, S.; Chakraborty, A.; Roy, A.; Singh, I.K.; Singh, A. Transgenic poplar for resistance against pest and pathogen attack in forests: An overview. Front. For. Glob. Change 2025, 7, 1490562. [Google Scholar]
  7. Su, X.H.; Ding, C.J.; Ma, C.G. Research progress and strategies of poplar breeding in China. For. Res. 2010, 23, 31–37. (In Chinese) [Google Scholar]
  8. Wang, Y.R.; Liu, C.W.; Zhao, R.J.; McCord, J.; Rials, T.; Wang, S.Q. Anatomical characteristics, microfibril angle and micromechanical properties of cottonwood (Populus deltoides) and its hybrids. Biomass Bioenergy 2016, 93, 72–77. [Google Scholar] [CrossRef] [Scilit]
  9. Guo, X.A.; Hu, X.; Sun, H.G.; Zhang, Y.C. The preliminary selection experiment of Populus deltoides cIonal biomass energy forest. J. Northeast For. Univ. 2025, 53, 10–14. [Google Scholar]
  10. Guo, J.T.; Peng, J.J.; Ma, X.; Liu, F.; Lan, Z.P.; Xia, Y.X. Responses of poplar plantations in northern China sandy land to conventional fertilization and drip fertigation. Sci. Silv. Sin. 2025, 61, 135–145. (In Chinese) [Google Scholar]
  11. Guo, L.; Wang, Y.; Li, L.; Wu, C.X.; Wu, Y.S. Analysis of transcriptome differences between two clones of Populus section Aigeiros after insect infestation. Ciênc. Florest. 2025, 35, e88195. [Google Scholar] [CrossRef] [Scilit]
  12. Huang, Q.J.; Su, X.H.; Wang, S.D.; Man, S.J.; Yang, Z.Y.; Shen, Y.B. Integrative evaluation of Populus × euramericana cl. ‘Bofeng 1’ and Populus × euramericana cl. ‘Bofeng 2’. Sci. Silv. Sin. 2014, 50, 75–81. (In Chinese) [Google Scholar]
  13. Zhang, X.Y.; Li, Z.T.; Zhong, W.G.; Qiao, Y.H.; Han, Y.J.; Zhuang, R.N.; Wang, X.D.; Li, S.Y.; Li, S.W. Breeding of the excellent new variety ‘Huaxiong 4’—A selected Populus × euramericana. Nat. Sci. Ed. 2025, 56, 849–856. (In Chinese) [Google Scholar]
  14. Chen, C.; Ding, C.J.; Huang, Q.J.; Zhang, J.; Liu, N.; Li, B.; Li, Z.H.; Su, X.H. Phenotypic and physiological trait diversity and population structure of Populus deltoides. J. Beijing For. Univ. 2021, 43, 1–12. (In Chinese) [Google Scholar] [CrossRef] [Scilit]
  15. Liu, W.; Man, S.J.; Liang, D.J.; Peng, R.S.; Yin, J.; Hou, G. Integrative evaluation for Populus × euramericana ‘177’. Nat. Sci. Ed. 2021, 52, 595–600. (In Chinese) [Google Scholar]
  16. Wang, R.Y.; Wang, X.L.; Li, J.H.; Wang, D.Y.; Niu, M.G. Establishment of in vitro regeneration system of Populus deltoides × Lulin ‘No. 9’. J. Northwest For. Univ. 2022, 37, 83–89. (In Chinese) [Google Scholar]
  17. Nelson, N.D.; Berguson, W.E.; Mcmahon, B.G.; Cai, M.J.; Buchman, D.J. Growth performance and stability of hybrid poplar clones in simultaneous tests on six sites. Biomass Bioenergy 2018, 118, 115–125. [Google Scholar] [CrossRef] [Scilit]
  18. Jiang, L.P.; Pei, X.N.; Hu, Y.B.; Zhao, X. Effects of environment and genotype on growth traits in poplar clones in Northeast China. Euphytica 2021, 217, 169–183. [Google Scholar] [CrossRef] [Scilit]
  19. Shi, Q.Y.; Gu, L.J.; Yang, M.S.; Wang, J.M.; Zhao, J. Application of GGE Biplot analysis to delineate suitable breeding regions and select superior clones in poplar. J. Northeast For. Univ. 2024, 52, 18–24. (In Chinese) [Google Scholar]
  20. Huehn, M. Nonparametric measures of phenotypic stability. Part 1: Theory. Euphytica 1990, 47, 189–194. [Google Scholar] [CrossRef] [Scilit]
  21. Kebede, G.; Workn, W.; Jifar, H.; Feyissa, F. Rain yield stability analysis using parametric and nonparametric statistics in oat (Avena sativa L.) genotypes in Ethiopia. Grassl. Res. 2023, 2, 182–196. [Google Scholar] [CrossRef] [Scilit]
  22. Yan, W.K. Optimal use of biplots in analysis of multi–location variety test data. Acta Agron. Sin. 2010, 36, 1805–1819. (In Chinese) [Google Scholar]
  23. Gao, B.W.; Ouyang, F.Q.; Gao, H.; Li, W.; Lei, H.; Tian, K.C.; Qi, S.; Wang, J.H. Growth difference and early evaluation and selection of young Picea abies clones in western Hubei. For. Res. 2021, 34, 88–94. (In Chinese) [Google Scholar]
  24. Li, J.H. Genotype by Environment Interaction for Growth Traits of Clones of Populus section Aigeiros based on BLUP and GGE biplot. Sci. Silv. Sin. 2021, 57, 64–73. (In Chinese) [Google Scholar]
  25. Liu, X.T.; Zhao, Q.S.; Yin, P.; Li, H.X.; Wu, L.G.; Li, Y.J.; Hu, Y.B.; Zhao, X.Y. Variation and stability analysis of growth traits of poplar clones in the seedling stage in northeast China. J. For. Res. 2023, 34, 1107–1116. [Google Scholar] [CrossRef] [Scilit]
  26. Pliura, A.; Zhang, S.Y.; Mackay, J.; Bousquet, J. Genotypic variation in wood density and growth traits of poplar hybrids at four clonal trials. For. Ecol. Manag. 2007, 238, 92–106. [Google Scholar] [CrossRef] [Scilit]
  27. Liu, N.; Ding, C.J.; Li, B.; Ding, M.; Su, X.H.; Huang, Q.J. Effects of genotype by environment interaction of 12 Populus × euramericana clones in their early growth. Sci. Silv. Sin. 2020, 56, 63–72. (In Chinese) [Google Scholar]
  28. Pliura, A.; Suchockas, V.; Sarsekova, D.; Gudynaite, I. Genotypic variation and heritability of growth and adaptive traits, and adaptation of young poplar hybrids at northern margins of natural distribution of Populus nigra in Europe. Biomass Bioenergy 2014, 70, 513–529. [Google Scholar] [CrossRef] [Scilit]
  29. Yanez, M.A.; Zamudio, F.; Espinoza, S.; Ivkovic, M.; Guerra, F.; Espinosa, C.; Baettig, R.M. Genetic variation and growth stability of hybrid poplars in high density short–rotation coppice stands in central Chile. Biomass Bioenergy 2019, 120, 84–90. [Google Scholar]
  30. Takahashi, Y.; Ishiguri, F.; Nezu, I.; Endo, R.; Kobayashi, S.; Tanabe, J.; Matsushita, M.; Ohshima, J.; Yokota, S. Radial variations of broad–sense heritability in wood properties and classification of load–deflection curves in static bending for six half–sib families of Chamaecyparis obtusa. J. Wood Sci. 2022, 68, 24. [Google Scholar] [CrossRef] [Scilit]
  31. Yu, S.; Feng, G.Y.; Su, X.L.; Xu, X.H.; Zhang, X.F.; Zuo, S.T.; Zhang, X.Q. Genetic diversity analysis and comprehensive evaluation of Lolium multiflorum based on phenotypic traits. Pratac. Sci. 2025, 42, 340–355. (In Chinese) [Google Scholar]
  32. Mullualem, D.; Tsega, A.; Mengie, T.; Fentieb, D.; Kassab, Z.; Fassila, A.; Wondaferewb, D.; Gelawc, T.A.; Astatkie, T. Genotype–by–environment interaction and stability analysis of grain yield of bread wheat (Triticum aestivum L.) genotypes using AMMI and GGE biplot analyses. Heliyon 2024, 10, e32918. [Google Scholar] [CrossRef] [Scilit] [PubMed]
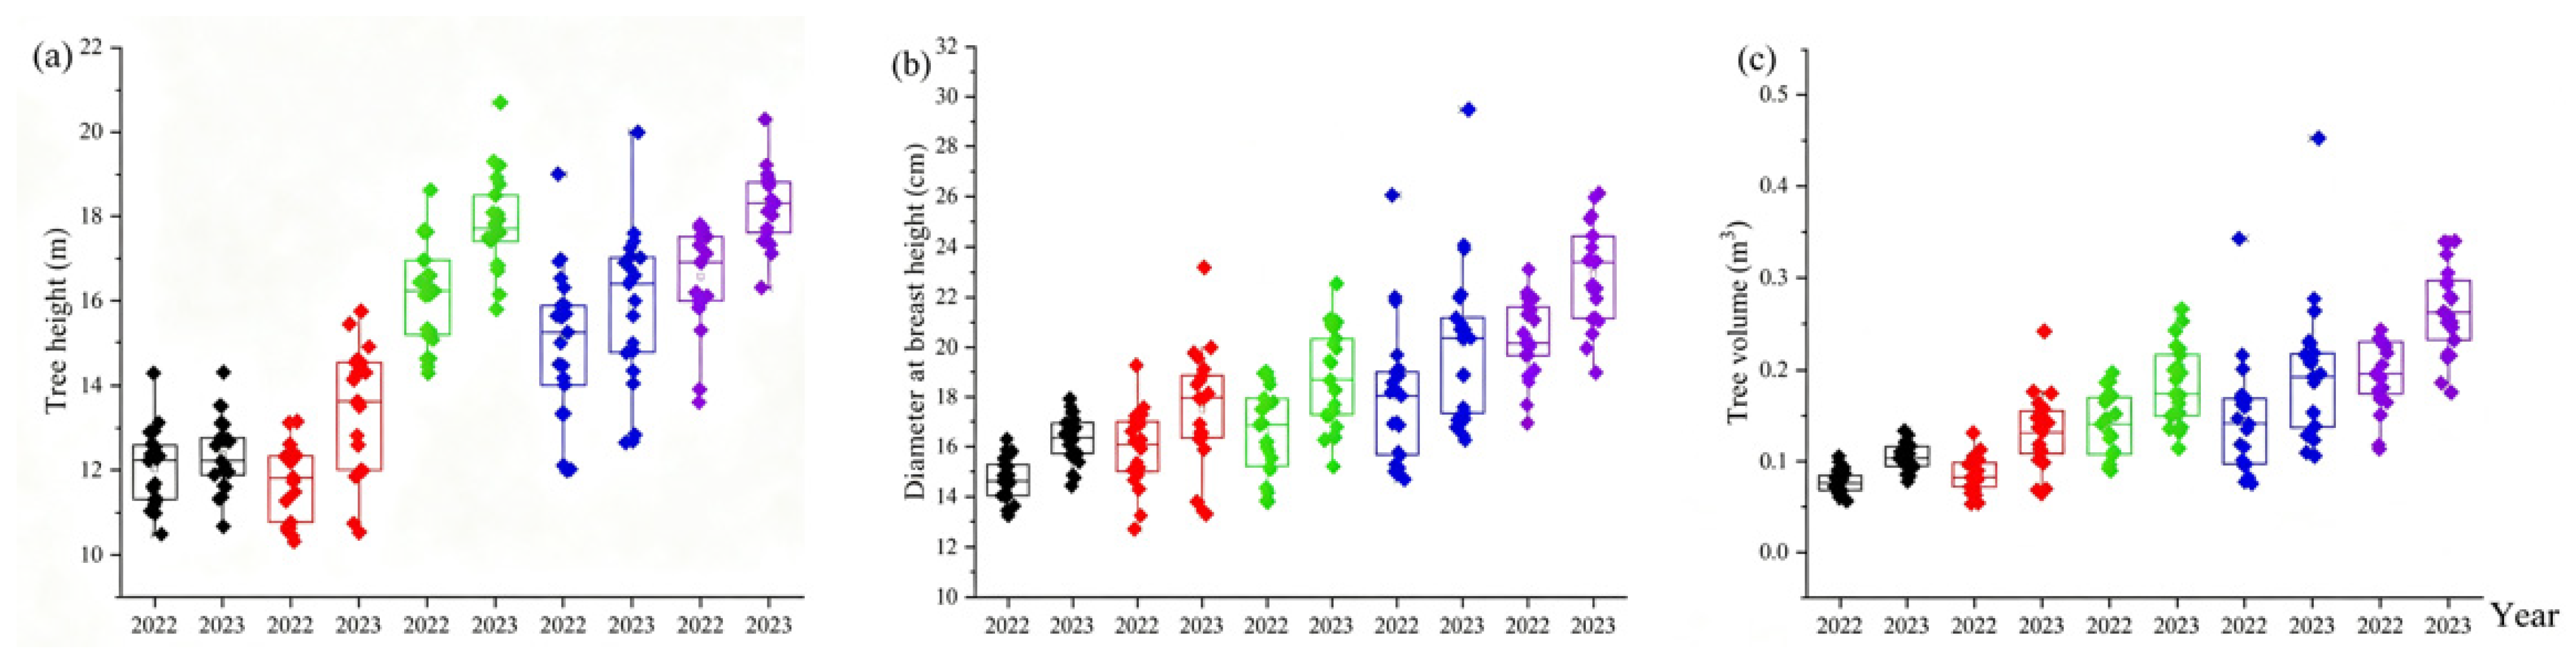
Figure 1. The growth status of 21 clones at different sites in different years. Black represent the YI Forest; red represent the FEI Forest; green represent the JUAN Forest; blue represent the SHAN Forest; purple represent the SHEN Forest. (a) Tree height of 21 clones at different sites in different years; (b) diameter at breast height of 21 clones at different sites in different years; (c) tree volume of 21 clones at different sites in different years.
Forests 17 00850 g001
Figure 2. Evaluation of the five test sites. In the GGE biplot, the cosine of the angle between site vectors represents the genetic correlation among test sites. Angles smaller than 90° indicate positive correlations, and the smaller the angle, the stronger the correlation; angles greater than 90° indicate negative correlations. The length of each site’s vector from the origin reflects its discriminating ability, whereas the angle between the site vector and the average environment axis indicates its representativeness.
Forests 17 00850 g002
Figure 3. Best-performing clones and grouping of test sites. The outermost genotypes are connected to form a polygon. Perpendicular lines drawn from the origin to each side of the polygon divide the test sites into environmental groups. The genotypes located at the vertices of the polygon represent the best-performing clones within their respective groups.
Forests 17 00850 g003
Figure 4. Growth performance and adaptability of the clones. The vertical dashed lines along the average environment axis represent the mean adaptability of each clone across all test sites; shorter dashed segments indicate higher adaptability. The solid line perpendicular to the average environment axis represents the overall trait mean. Clones located to the right of this line have above-average growing stock, with greater distance indicating higher values, whereas clones on the left have below-average growing stock, with greater distance reflecting lower performance.
Forests 17 00850 g004
Table 1. Environmental characteristics of the MET.
Environmental FactorsJUANSHENSHANFEIYI
Longitude (E)115°19′115°20′116°24′117°36′118°13′
Latitude (N)35°22′35°46′34°56′35°1′35°36′
Mean annual temperature (°C)1613141314
Minimum temperature (°C)−14−10−15.3−18.3−24.9
Maximum temperature (°C)3930374339
Mean annual precipitation (mm)589.2501.9737.1900784.8
Soil typeLoamy alluvial soilLoamy alluvial soilSandy loamLoamy alluvial soilSandy loam
Spacing4 m × 6 m4 m × 6 m4 m × 6 m4 m × 6 m4 m × 5 m
Afforestation year20182018201820182018
Area (m2)21,33328,00021,68024,35226,666
Table 2. Genetic background of test genotypes.
No.GenotypeFemale ParentsMale ParentsNo.GenotypeFemale ParentsMale Parents
11270P. deltoides ‘D8’P. deltoides ‘D20’121615P. deltoides ‘D5’P. nigra ‘N4’
213–22P. deltoides ‘D4’P. deltoides ‘D22’131616P. deltoides ‘D7’P. nigra ‘N1’
313–26P. deltoides ‘D4’P. deltoides ‘D22’141617P. deltoides ‘D7’P. nigra ‘N1’
41601P. deltoides ‘D5’P. nigra ‘N4’151618P. deltoides ‘D7’P. nigra ‘N1’
51602P. deltoides ‘D5’P. nigra ‘N4’161619P. deltoides ‘D7’P. nigra ‘N1’
61606P. deltoides ‘D5’P. nigra ‘N4’171624P. deltoides ‘D7’P. nigra ‘N1’
71607P. deltoides ‘D5’P. nigra ‘N4’182025P. deltoidesP. deltoides
81608P. deltoides ‘D5’P. nigra ‘N4’192215P. deltoides ‘D3’P. deltoides ‘D24’
91610P. deltoides ‘D5’P. nigra ‘N4’2081P. deltoides ‘D2’P. deltoides ‘D23’
101611P. deltoides ‘D5’P. nigra ‘N4’21I–107P. deltoidesP. nigra
111613P. deltoides ‘D5’P. nigra ‘N4’
Table 3. The growth traits of selected clone in different sites. Different lowercase letters in the figure represent significant differences among different clones.
NO.CloneSHENYIJUANFEISHAN
HDBHVHDBHVHDBHVHDBHVHDBHV
18120.3 a25.8 a0.3601 a13.6 abc18.2 a0.1398 a19.1 abc21.8 a0.2511 a15.8 a23.4 a0.2481 a20.0 a29.5 a0.4535 a
2221519.3 ab23.6 bcde0.2988 bcd13.0 abc16.2 b0.1064 bc20.7 a21.0 abc0.2562 a14.3 abc18.1 bcde0.1416 cdefg17.2 b20.6 de0.2062 cde
3160719.0 bc25.3 ab0.3294 abc11.2 ef15.9 b0.095 bc18.1 bcd20.2 abcde0.2075 abcd14.6 abc18.7 bcde0.1564 cde16.0 bcd20.9 cde0.2106 cde
4161718.9 bcd23.3 bcdef0.2817 cde13.5 abc17.3 ab0.1224 abc19 abcd20.8 abcd0.2285 abc14.2 abc18.9 bcd0.1509 cdefg16.9 bc21.2 cde0.2186 cde
5161818.8 bcde24.4 bc0.3049 bcd12.9 abc16.1 b0.1118 bc19.2 abc21 abc0.2398 ab14.8 abc19.7 b0.1699 bcd16.8 bc21.8 cde0.2236 cd
613–2218.8 bcde25.7 a0.3349 abc12.3 abc16.1 b0.1 bc19.4 ab21.6 ab0.2556 a15.2 ab19.8 b0.1742 bc15.4 cdef19.9 efg0.1773 defgh
7161318.7 bcde24.2 bcd0.299 bcd12 bcdef15.8 b0.0966 bc17.8 bcd18.4 bcdef0.1736 bcdef14.4 abc19 bc0.1550 cdef17.1 b21.8 cde0.2318 cd
8160118.6 bcde21.9 defgh0.2501 efg14.3 a17.3 ab0.1293 ab17.2 def16 hi0.132 ef13.6 bcd16.5 cdef0.1123 efgh17.2 b19.8 efg0.2010 cdef
9I–10718.5 bcde24.0 bcde0.2915 bcd11.6 bcd15.8 b0.0929 c18 bcde19.4 abcde0.1992 abcde14.1 abc18.5 bcde0.1472 cdefg17.2 b23.6 bcd0.2657 bc
10161518.4 bcde26.2 a0.3412 ab12.7 abc16.7 ab0.1169 bc17.6 bcd19.9 abcde0.1982 abcde14.5 abc19.5 b0.1636 cd16.5 bcd23.9 bc0.2645 bc
11161618.1 bcde20.8 gh0.2244 fgh12.1 abc17 ab0.1087 bc16.8 efg16.4 ghi0.1336 ef14.2 abc18.1 bcde0.1393 cdefg13.9 fg16.6 h0.123 hi
12202518.1 bcde22.5 cdefg0.2546 efg11.6 bcd14.8 c0.0836 c16.3 fg16.8 fghi0.1405 def11.7 gh10.0 h0.0600 j16.8 bc20.6 de0.2016 cdef
13161018.1 bcde23.0 bcdef0.2647 def12.5 abc16.9 ab0.1107 bc18 bcde19.2 abcde0.1896 abcde11.9 fgh16.3 def0.1096 fgh13.1 g16.5 h0.1108 i
14161918.0 cdef21.9 defgh0.2445 efg12.7 abc15.3 b0.0948 bc17.1 efg17.9 cdefg0.1633 cdef13.9 abc17.3 bcdef0.1263 defgh16.5 bcd20.2 ef0.1927 defg
15127017.7 defg24.3 bcd0.295 bcde11.3 def14.4 c0.0849 c18.5 bcd20.7 abcd0.2228 abc13 cdefg17.2 bcdef0.1171 efgh16 bcde17.3 fgh0.1385 fghi
16160817.6 efgh20.6 gh0.2132 gh11.9 bcd15.7 b0.0927 c17.6 bcd17.7 defghi0.1642 cdef11.8 fgh16.3 ef0.1012 hi12.7 g16.8 gh0.1121 hi
17161117.4 fghi21.1 fgh0.216 gh12.7 abc17.6 ab0.1205 abc17.4 cde17.2 efghi0.1494 def13.7 bcd17.9 bcdef0.1322 cdefg14.8 ef18.8 efgh0.1522 efghi
1813–2617.4 fghi23.6 bcdef0.2667 def11.5 cdef15.8 b0.0963 bc16.5 fg18.6 abcde0.1644 cdef10.5 h13.5 g0.0647 ij15 def18.9 efgh0.1548 efghi
19160217.3 ghi21.2 efgh0.2171 gh12.7 abc16.7 b0.1085 bc16.7 efg16.2 ghi0.1305 ef12 efgh15.9 f0.0985 hi14.7 ef17 gh0.1288 ghi
20160617.0 hi18.8 i0.1733 i12 bcdef16.4 b0.1036 bc17.3 cde17 efghi0.1479 def12.5 defg16.5 cdef0.1073 ghi14 fg17.2 gh0.1251 hi
21162416.2 i19.9 h0.1856 h10.7 f14.8 c0.0775 d15.7 g15.0 i0.1093 f10.5 h13.5 g0.0643 ij12.7 g16.5 h0.1071 i
Table 4. Descriptive statistics of growth traits. 1,2 The subscript of 5 and 6 after trait means 5- and 6-year-old. Number of observations: 1345.
TraitMean ± SESDCV (%)
H5 114.2 ± 0.072.6618.75
DBH517.1 ± 0.093.3719.72
V50.18 ± 0.010.0751.79
H6 215.6 ± 0.082.70 17.34
DBH619.3 ± 0.103.59 18.59
V60.18 ± 0.010.08 41.76
Table 5. Major parametric and non-parametric stability statistics for individual tree volume (V) of tested cultivars. ASV = AMMI stability value; CV = coefficient of variation; S1, S2, S3, S6, Nassar and Huehn’s non-parametric stability statistics; N1, N2, N3, N4, Thennarasu’s non-parametric stability statistics. The ranking of indicators is shown in parentheses.
GenotypeV (m3)ASVCVS1S2S3S6N1N2N3N4
12700.17 (10)0.25 (18)0.25 (19)0.9 (12)65.80 (18)11.31 (16)2.12 (17)6.4 (20)0.49 (14)0.59 (13)0.07 (11)
13–220.21 (3)0.23 (15)0.23 (18)1.8 (20)82.30 (21)11.47 (17)1.87 (13)6.8 (21)2.27 (20)1.16 (19)0.26 (20)
13–260.15 (14)0.07 (3)0.07 (20)0.4 (4)31.20 (5)4.67 (10)1.29 (10)3.4 (5)0.26 (3)0.37 (5)0.03 (4)
16010.16 (11)0.14 (7)0.14 (8)0.7 (9)41.20 (10)15.76 (20)2.27 (18)5.0 (13)0.36 (8)0.49 (10)0.06 (7)
16020.14 (17)0.19 (12)0.19 (5)1.2 (15)37.20 (8)11.67 (18)2.33 (19)4.4 (10)0.26 (4)0.34 (3)0.07 (9)
16060.13 (20)0.23 (14)0.23 (1)2.0 (21)69.80 (19)8.76 (13)1.93 (14)6.4 (19)0.40 (10)0.46 (8)0.12 (15)
16070.20 (5)0.11 (5)0.11 (15)1.7 (19)36.50 (7)4.19 (9)0.90 (7)3.6 (6)0.51 (15)0.73 (16)0.23 (19)
16080.14 (18)0.24 (17)0.24 (9)1.1 (14)41.50 (11)5.17 (11)1.83 (12)4.8 (12)0.27 (5)0.34 (4)0.06 (6)
16100.16 (12)0.32 (20)0.32 (17)0.0 (1)42.70 (12)10.74 (14)2.04 (15)4.4 (9)0.37 (9)0.46 (7)0.00 (1)
16110.15 (15)0.18 (11)0.18 (2)1.6 (18)59.00 (16)11.79 (19)2.04 (16)5.8 (17)0.41 (11)0.55 (12)0.13 (16)
16130.19 (9)0.17 (9)0.17 (11)0.7 (10)32.50 (6)3.44 (8)1.04 (8)4.2 (7)0.70 (18)0.65 (15)0.09 (13)
16150.22 (2)0.23 (16)0.23 (12)1.4 (16)61.00 (17)1.68 (5)0.55 (3)5.8 (16)1.45 (19)1.52 (20)0.30 (21)
16160.15 (16)0.23 (13)0.23 (3)1.0 (13)55.30 (15)11.00 (15)2.50 (20)5.4 (15)0.34 (7)0.48 (9)0.07 (10)
16170.20 (6)0.02 (1)0.02 (4)0.1 (2)11.80 (1)1.70 (6)0.58 (4)2.6 (2)0.43 (12)0.50 (11)0.02 (2)
16180.21 (4)0.07 (4)0.07 (6)0.6 (7)15.70 (3)0.30 (2)0.25 (2)2.4 (1)0.48 (13)0.77 (17)0.13 (17)
16190.16 (13)0.07 (2)0.07 (7)0.4 (5)12.80 (2)1.53 (4)0.88 (6)2.8 (3)0.20 (2)0.24 (2)0.03 (3)
16240.11 (21)0.16 (8)0.16 (16)1.4 (17)26.20 (4)0.86 (3)1.71 (11)3.2 (4)0.15 (1)0.22 (1)0.07 (8)
20250.14 (19)0.18 (10)0.18 (21)0.4 (6)49.70 (14)16.67 (21)3.33 (21)5.2 (14)0.31 (6)0.39 (6)0.03 (5)
22150.20 (7)0.12 (6)0.12 (10)0.6 (8)46.20 (13)3.33 (7)0.80 (5)4.8 (11)0.60 (17)0.87 (18)0.09 (14)
810.29 (1)0.78 (21)0.78 (14)0.2 (3)76.80 (20)0.16 (1)0.16 (1)6.2 (18)6.20 (21)5.60 (21)0.14 (18)
I–1070.20 (8)0.28 (19)0.28 (13)0.8 (11)39.70 (9)8.70 (12)1.27 (9)4.2 (8)0.53 (16)0.64 (14)0.09 (12)
Table 6. Liner mixed-effects model results and heritability estimates. Number of observations: 1345; genotype × site, 81; genotype, 21; site, 5.
TraitSourcedfVarianceStandard DeviationSignificanceR
H (m)Genotype200.8580.9260.0000.69
Site46.4982.5490.000
Genotype × site800.5720.7560.000
Residual12321.6131.270
DBH (cm)Genotype202.7861.6690.0000.84
Site46.3012.5100.000
Genotype × site801.4031.1850.000
Residual12325.5872.364
V (m3)Genotype200.0010.0370.0000.86
Site40.0040.0620.000
Genotype × site800.0010.0260.000
Residual12320.0020.046
Disclaimer/Publisher’s Note: The statements, opinions and data contained in all publications are solely those of the individual author(s) and contributor(s) and not of MDPI and/or the editor(s). MDPI and/or the editor(s) disclaim responsibility for any injury to people or property resulting from any ideas, methods, instructions or products referred to in the content.