Article

Positive Correlation Between Tree Species Richness and Soil Quality in Subtropical Natural Pinus massoniana Lamb. Forests

College of Forestry, Jiangxi Agricultural University, Nanchang 330045, China
*
Author to whom correspondence should be addressed.
Forests 2026, 17(7), 805; https://doi.org/10.3390/f17070805
Submission received: 29 May 2026 / Revised: 7 July 2026 / Accepted: 7 July 2026 / Published: 9 July 2026
(This article belongs to the Section Forest Soil)

Abstract

This study investigates the relationship between tree species diversity and soil quality in natural Pinus massoniana Lamb. forests, providing a scientific basis for the sustainable management of natural stands and the establishment of plantations. Located in Ganzhou City, Jiangxi Province, China, a subtropical region, the study focuses on natural P. massoniana forests. The Patrick richness index and Shannon–Wiener diversity index were each classified into three levels—low, medium, and high—to analyze how soil physicochemical indicators vary across these diversity levels. A minimum data set of key soil indicators was established to evaluate soil quality. Linear and nonlinear scoring functions were used to compare the relationships between the total data set and minimum data set-derived soil quality indices, and the most suitable scoring function for this study was selected. An obstacle factor diagnosis model was applied to identify the factors limiting soil quality improvement under different diversity levels. The results showed that (1) in the 20–40 cm soil layer, soil water content, maximum water-holding capacity, and total porosity significantly increased with rising Patrick richness and Shannon–Wiener diversity levels. (2) With increasing Patrick richness and Shannon–Wiener diversity levels, organic matter and total nitrogen in the 0–20 cm soil layer, as well as total potassium, available nitrogen, and pH in both the 0–20 cm and 20–40 cm soil layers, showed significant upward trends. In contrast, total phosphorus in both layers significantly decreased. Furthermore, available phosphorus in both layers significantly declined as Patrick richness increased. (3) The minimum data set based on the nonlinear scoring function can effectively substitute for the total data set (r = 0.791, R2 = 0.63), showing better applicability for assessing soil quality changes in natural P. massoniana forests. Additionally, the soil quality index in the 0–40 cm soil layer significantly increased with rising Patrick richness levels. (4) At different Patrick richness levels, bulk density had the greatest impact on soil quality in the 0–40 cm soil layer, while organic matter had the least. A comprehensive analysis shows that there is a positive correlation between tree species diversity and soil quality in natural P. massoniana forests. In P. massoniana plantation practices, a near-natural management approach should be adopted to create relatively species-rich and complex coniferous and broad-leaved mixed stands, which is conducive to improving soil quality.

1. Introduction

Soil quality is an integrated reflection of soil characteristics and the most sensitive indicator for revealing dynamic changes in soil conditions, playing a crucial role in vegetation restoration and the maintenance and enhancement of soil fertility [1,2]. Thus, research on soil quality assessment supports effective nutrient management and the sustainable management of forests. Soil physicochemical properties are key indicators for evaluating soil quality and can reflect soil fertility to some extent. However, due to the differing emphases of individual indicators, a single indicator cannot comprehensively or systematically characterize soil quality. Using too many indicators, on the other hand, is time-consuming and labor-intensive [3,4]. Therefore, selecting appropriate and representative indicators is a crucial step in soil quality assessment. The minimum data set (MDS) is the smallest combination of representative soil indicators that can accurately reflect soil quality [5]. Numerous studies have shown that MDS indicators can effectively replace the total data set (TDS) in soil quality evaluation [6,7]. Soil quality is comprehensively affected by biotic and abiotic factors such as vegetation type [8], stand age [9], and land use type [10]. Meanwhile, the soil’s own physicochemical properties and nutrient supply capacity will in turn act on the growth and distribution of vegetation [11,12]. It can be seen that the relationship between vegetation and soil is not unidirectional but a close interaction. In this interaction process, tree species diversity plays a key role. As one of the biotic factors, it is the most direct manifestation of biodiversity and forms the foundation for maintaining ecosystem structure, function, and stability [13]. Tree species diversity is not a simple “superposition of quantity”, but through a series of ecological mechanisms, such as niche differentiation, resource allocation and functional trait integration, antagonistic, complementary and selection effects, as well as leverage effect and functional redundancy, it synergistically shapes the multi-functionality and resilience of forests in productivity, carbon sequestration capacity, water conservation, soil fertility maintenance, and other aspects at multiple scales of individual, population, and community [14]. The study by Liang et al. [15] also shows that there is a significant cross-scale positive correlation between tree species diversity and ecosystem stability, and the improvement of tree species diversity will promote the enhancement of the overall functional stability of the ecosystem by strengthening interspecific asynchrony. The above studies provide a brand-new theoretical framework for understanding the regulatory effect of tree species diversity on soil ecological processes. Existing studies have also confirmed that, under similar site conditions in the same region, tree species diversity can directly or indirectly alter soil physical structure and chemical properties through root exudates, litter decomposition, and microbial interactions, thereby influencing soil nutrient status and serving as a key factor affecting soil quality [16,17]. However, the relationship between tree species diversity and soil quality may vary depending on forest type and diversity level. For instance, Shen et al. [2] found that vegetation richness in broad-leaf and shrub forests was negatively correlated with soil quality, whereas the opposite was observed in coniferous, mixed conifer–broad-leaf, and bamboo forests. This indicates that due to the differences in the biological and ecological traits of the constituent tree species, there may be certain differences in the direction and intensity of the effect of tree species diversity on soil quality. Therefore, relevant research conclusions from other forest types cannot be directly applied to typical forest stands in specific regions. At present, most existing studies at home and abroad focus on the transformation and management of tree species diversity in plantations, while the understanding of the relationship between tree species diversity and soil quality in natural forests is relatively limited. In fact, there are essential differences between natural forests and plantations in their development processes and community formation mechanisms—natural forests, after a long period of natural succession, usually have superior tree species composition and stand structure. Therefore, analyzing the soil quality status corresponding to different tree species diversity levels in natural forests can provide a scientific basis for the sustainable management of natural forests and the establishment of plantations.
Pinus massoniana Lamb. is a widely distributed coniferous tree species in subtropical regions of China, renowned for its strong adaptability, drought tolerance, and ability to thrive in infertile soils. It plays a vital role in safeguarding forest resources in southern China and in delivering key ecosystem services such as carbon sequestration, soil conservation, and water retention [18]. Ganzhou City, Jiangxi Province, China, is a major distribution area for P. massoniana, where natural P. massoniana forests cover 398,900 ha, accounting for 14.88% of the city’s total forested land, making it a significant component of Jiangxi’s forest resources. As a pioneer species in forest succession in southern China, P. massoniana typically follows a successional sequence from pure stands to mixed conifer-broad-leaf forests and eventually to broad-leaf forests. Numerous studies have shown that introducing broad-leaved species into pure P. massoniana stands enhances stand stability [19]. However, the impact of increasing tree species diversity on soil properties in P. massoniana forests remains unclear. Therefore, this study focuses on natural P. massoniana forests in Ganzhou, comparing soil physicochemical properties in the 0–20 cm and 20–40 cm soil layers, as well as soil quality in the 0–40 cm layer, across different tree species diversity levels based on plot surveys and sample measurements. The main objectives are (1) to analyze how soil physicochemical properties change with tree species diversity; (2) to examine the relationship between tree species diversity and soil quality; and (3) to identify the key factors limiting soil quality improvement. The findings aim to provide a scientific basis for enhancing soil quality in natural P. massoniana forests and guiding the management of plantations in subtropical regions.

2. Materials and Methods

2.1. Study Area

Ganzhou City (24°29′–27°09′ N, 113°54′–116°38′ E) is located in southern Jiangxi Province, situated in the upper reaches of the Gan River, with a total area of 3.9 × 10⁴ km2. The terrain is dominated by mountains and hills, and the soil parent materials are mainly weathering products of granitoids, pelitic rocks, and acidic crystalline rocks that are prone to soil erosion. The soil is mainly red soil based on the Chinese soil classification, which is classified as ferralsols in the World Reference Base for Soil Resources [20]. The region belongs to the subtropical monsoon climate zone, characterized by a mean annual temperature of 20.2 °C, mean annual precipitation of 1497.3 mm, and mean annual sunshine duration of 1622.3 h. The forest coverage rate is 76.2%, and the primary forest types include Cunninghamia lanceolata (Lamb.) Hook. forests, P. massoniana forests, evergreen broad-leaved forests, and mixed conifer–broad-leaved forests [21]. Since P. massoniana is a pioneer native tree species with extremely strong adaptability in the study area, the sparse forest land formed by disturbances such as diseases, insect pests, forest fires, and unsustainable human logging provides favorable conditions for the natural regeneration of P. massoniana. In the absence of artificial afforestation or replanting, these sites gradually develop into natural secondary forests dominated by P. massoniana. Up to now, the area of natural P. massoniana forests in Ganzhou has reached 3.99 × 10⁵ ha, accounting for 14.88% of the city’s forested land.

2.2. Plot Setup and Sample Collection

Prior to plot establishment, the main distribution areas of natural P. massoniana forests, along with their species composition, stand age, and growth conditions, were thoroughly assessed using regional forest resource monitoring data. Based on this assessment and considering regional tree species richness and topographic features, and ensuring that the selected plots can fully represent the overall characteristics of natural P. massoniana forests in the study area, representative sections in the low-disturbance distribution areas that meet the conditions were selected to set up plots. Finally, a total of 36 representative plots with an area of 0.09 ha (30 m × 30 m) were established in the representative main distribution areas during July–August 2024. The stand age of all plots ranges from 21 to 40 years, and the site conditions are basically the same, all belonging to hilly terrain. Within each plot, all arbor trees with a diameter at breast height (DBH) ≥ 5.0 cm were individually measured. Key surveyed attributes included species identity, tree coordinates, and DBH.
In the plot, one sampling point was selected at the upper, middle, and lower positions along the slope. First, soil samples from the 0–20 cm and 20–40 cm layers were collected using a cutting ring to measure seven soil physical properties: maximum water-holding capacity, capillary water-holding capacity, field water-holding capacity, bulk density, capillary porosity, non-capillary porosity, and total porosity. Simultaneously, approximately 10 g of soil was collected in an aluminum box adjacent to the cutting ring for soil water content determination. Second, soil samples were collected from the same locations, and the samples from the three points were mixed evenly for measuring eight soil chemical properties: organic matter, total nitrogen, total phosphorus, total potassium, available nitrogen, available phosphorus, available potassium, and pH.
The determination of soil physicochemical properties was carried out in accordance with the method used by Zhan et al. [5]. The soil water content was measured by oven-drying the sample, and the other 7 soil physical properties were determined by the cutting ring method. The total nitrogen and organic matter were detected using the Kjeldahl method and potassium dichromate oxidation method, respectively. The total phosphorus was detected by the molybdenum–antimony colorimetric method, and the total potassium was determined by wet digestion with sodium hydroxide. The available nitrogen was measured using a microdiffusion technique after alkaline hydrolysis, and the available phosphorus was detected by the Olsen method [22]. The available potassium was determined by flame atomic absorption spectrophotometry. The pH was measured using a soil-to-water ratio of 1:2.5.

2.3. Soil Quality Assessment

2.3.1. Total Data Set and Minimum Data Set Construction

All 16 measured soil physicochemical indicators were included in the TDS for selection of the MDS. First, principal component analysis was performed, and indicators with absolute factor loadings ≥ 0.6 in principal components with eigenvalues ≥ 1 were grouped together. If an indicator met this threshold in two components, it was assigned to the group with which it had lower correlation based on correlation coefficients. Next, the Norm value for each indicator was calculated, and indicators within 10% of the highest Norm value in each group were selected. Finally, when multiple indicators remained in a group, pairwise Pearson correlation analysis was conducted. If correlations were low (r < 0.5), all indicators were included in the MDS; if high (r ≥ 0.5), only the indicator with the highest Norm value was retained [23]. The formula for calculating the Norm value is:
N j k   = j   = 1 k u jk 2 × λ k
where Njk represents the comprehensive loading of the j-th indicator on the k principal components, k is the number of principal components with eigenvalues ≥ 1, ujk is the loading of the j-th indicator on the k-th principal component, and λk is the eigenvalue of the k-th principal component.

2.3.2. Selection of Scoring Functions

After the indicators for the TDS and the MDS were determined, each soil physicochemical parameter was transformed into a dimensionless value ranging from 0 to 1 using both linear and nonlinear scoring functions. Although both linear and nonlinear scoring functions belong to the parameter standardization system, there are essential differences in scoring logic and index adaptability: the linear method assumes that the index and soil quality respond proportionally, while the nonlinear method takes the threshold effect into consideration. At present, there is no unified consensus on the precise ecological response thresholds of various soil physicochemical indicators, and the response rules of indicators in different research regions also show obvious heterogeneity. Therefore, it is necessary to calculate the soil quality index (SQI) using both linear and nonlinear scoring methods simultaneously. On the one hand, it can ensure the comparability of the results of this study with existing studies of the same type in the same region; on the other hand, it can distinguish the actual performance differences between the two methods in local scenarios. In the scoring process, based on the positive or negative effects of the soil physicochemical indicators on soil quality, all indicators were classified into two types: “the larger, the better” and “the smaller, the better.” For indicators positively correlated with soil quality, the “the larger, the better” scoring function (Equation (2)) was applied; conversely, for indicators negatively correlated with soil quality, the “the smaller, the better” scoring function (Equation (3)) was employed [24,25]. The respective calculation formulas are as follows:
S L   =   ( x x m i n ) / ( x m a x x m i n )
S L = ( x m a x x ) / ( x m a x x m i n )
S N L = 1 / ( 1 + ( x / x m e a n ) b )
where SL denotes the linear score value; SNL denotes the nonlinear score value; x, xmin, xmax, and xmean represent the measured value, minimum value, maximum value, and mean value of each indicator, respectively; and b is the slope of the nonlinear scoring function, set to −2.5 for “the larger, the better” indicators and 2.5 for “the smaller, the better” indicators.

2.3.3. Calculation of Soil Quality Index

Based on the scores and weights of each indicator, four types of SQI were calculated: (1) TDS with linear scoring (TDS-L), (2) TDS with nonlinear scoring (TDS-NL), (3) MDS with linear scoring (MDS-L), and (4) MDS with nonlinear scoring (MDS-NL). The effectiveness of the MDS in simplifying the TDS under both linear and nonlinear scoring methods was evaluated through correlation analysis and linear regression models, thereby identifying the most suitable scoring function for assessing soil quality changes in natural P. massoniana forests. The calculation formula is as follows [26]:
  S Q I   =   j = 1 n S j   ×   W j
where Sj denotes the score of the j-th indicator, Wj represents the weight of the j-th indicator, calculated as the ratio of the common factor variance of the j-th indicator to the total variance in principal component analysis, and n is the number of soil physicochemical indicators.

2.4. Obstacle Factor Diagnosis Model

The obstacle factor diagnosis model was used to analyze the key limiting factors affecting soil quality. The calculation formulas are as follows [27]:
M i j   =   ( P i j × W j ) / i = 1 m ( P i j × W j )
M j =   j = 1 n M i j / n
where Mij represents the obstacle degree of the j-th indicator in the i-th plot; Mj denotes the average obstacle degree of the j-th indicator across all plots; Pij = 1 − Sij indicates the deviation of the j-th indicator in the i-th plot from the ideal value of 1, where a larger value implies a greater negative impact on soil quality and Sij is the score of the j-th indicator in the i-th plot; Wj is the weight of the j-th indicator; m is the number of soil physicochemical indicators; and n is the number of plots.

2.5. Selection of Tree Species Diversity Indices

Two indices—Patrick richness (R) and Shannon–Wiener diversity (H)—were selected to characterize tree species diversity of the arbor layer. Patrick richness is defined as the total number of tree species within a stand, quantifying species richness. Shannon–Wiener diversity integrates both species number and the evenness of individual distribution, reflecting species complexity. The calculation formulas are as follows:
R = S
  H   =   i = 1 S ( P i × l n P i )
where S represents the number of tree species within a plot, and Pi denotes the proportion of individuals of tree species i to the total number of individuals across all species in the plot.

2.6. Data Processing and Statistical Analysis

Before data analysis, the Shapiro–Wilk test and the Levene test were used to test the normality and homogeneity of variance of soil physicochemical data in the 0–20 cm and 20–40 cm soil layers, respectively. Data that did not conform to normal distribution or homogeneity of variance were subjected to logarithmic transformation. After the data met the assumptions of normal distribution and homogeneity of variance, one-way analysis of variance was used to compare the differences in soil physicochemical properties and SQI under different tree species diversity levels, and the Duncan method was adopted for post hoc multiple comparisons.

3. Results

3.1. Characteristics of Tree Species Diversity

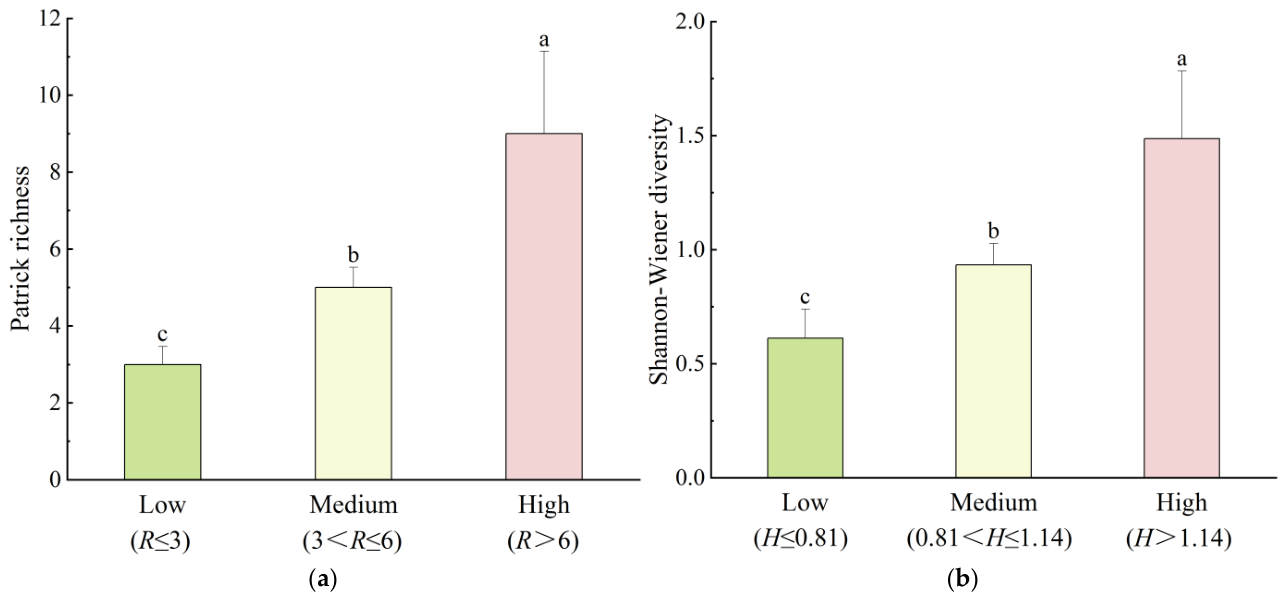
The ranges of Patrick richness (Equation (8)) and Shannon–Wiener diversity (Equation (9)) were 2–12 and 0.45–1.95 (Table 1), respectively. Considering both the variation in diversity and the number of plots, these indices were classified into three levels: low, medium, and high (Table 2). Tree species with a volume proportion ≥ 2% in each stand level were defined as dominant species. The results showed that the dominant tree species across all levels of the two diversity indices (from low to high) were P. massoniana, Schima superba Gardner & Champ., and Cunninghamia lanceolata (Table 2). Analysis of variance results confirmed significant differences among the three levels for both Patrick richness and Shannon–Wiener diversity (p < 0.05) (Figure 1).

3.2. Variations of Soil Physical Properties with Tree Species Diversity

As can be seen from Table 3, in the 20–40 cm layer, the soil water content, maximum water-holding capacity, and total porosity of the high richness level were significantly increased by 23.85%, 19.09%, and 17.19%, respectively, compared with those of the low richness level. In the 20–40 cm layer, the soil water content, maximum water-holding capacity, and total porosity of the high diversity level were significantly increased by 26.05%, 17.37%, and 16.03%, respectively, compared with those of the low diversity level. These results indicate that the soil water content, maximum water-holding capacity, and total porosity in the 20–40 cm layer all show a significant upward trend with the increase in tree species richness and complexity.

3.3. Variations of Soil Chemical Properties with Tree Species Diversity

3.3.1. Soil Organic Matter

As can be seen from Table 4, in the 0–20 cm layer, the organic matter of the low richness level was significantly decreased by 40.11% compared with that of the high richness level. In the 0–20 cm layer, the organic matter content of the medium and low diversity levels was significantly decreased by 29.12% and 38.75%, respectively, compared with that of the high diversity level. These results indicate that the organic matter content in the 0–20 cm layer shows a significant upward trend with the increase in tree species richness and complexity.
Table 4. Soil chemical properties across levels of tree species diversity indices.
Tree Species Diversity IndicesSoil Layer (cm)LevelOrganic Matter (g·kg−1)Soil Total NutrientsSoil Available NutrientspH
Total Nitrogen (g·kg−1)Total Phosphorus (g·kg−1)Total Potassium (g·kg−1)Available Nitrogen (mg·kg−1)Available Phosphorus (mg·kg−1)Available Potassium (mg·kg−1)
Patrick richness0–20Low14.77 ± 4.28 b0.68 ± 0.19 b0.37 ± 0.13 a18.07 ± 6.59 b58.05 ± 41.79 b1.94 ± 0.69 a40.99 ± 14.40 a4.75 ± 0.17 b
Medium21.01 ± 8.44 ab0.90 ± 0.32 ab0.28 ± 0.10 b21.01 ± 9.28 b94.06 ± 53.90 ab1.53 ± 1.02 ab50.28 ± 23.50 a4.87 ± 0.28 b
High24.66 ± 11.02 a1.02 ± 0.38 a0.25 ± 0.07 b29.88 ± 8.80 a123.71 ± 37.77 a0.99 ± 0.80 b48.40 ± 10.24 a5.09 ± 0.27 a
20–40Low13.07 ± 5.54 a0.61 ± 0.24 a0.36 ± 0.12 a17.75 ± 6.01 b43.50 ± 30.49 b1.76 ± 1.31 a35.35 ± 17.08 a4.53 ± 0.23 b
Medium14.54 ± 6.87 a0.68 ± 0.27 a0.24 ± 0.09 b19.70 ± 9.03 b78.23 ± 47.43 a1.78 ± 1.74 a46.06 ± 22.62 a4.75 ± 0.30 b
High12.59 ± 4.55 a0.60 ± 0.16 a0.24 ± 0.08 b29.79 ± 9.02 a104.95 ± 32.45 a0.53 ± 0.18 b40.47 ± 6.73 a5.04 ± 0.30 a
Shannon–Wiener diversity0–20Low16.09 ± 8.44 b0.71 ± 0.32 b0.35 ± 0.13 a18.94 ± 8.04 b64.02 ± 49.61 b1.72 ± 0.60 a45.39 ± 24.34 a4.78 ± 0.27 b
Medium18.62 ± 6.37 b0.81 ± 0.23 b0.28 ± 0.10 ab20.01 ± 8.54 b89.31 ± 52.75 ab1.55 ± 1.05 a45.94 ± 15.95 a4.85 ± 0.21 b
High26.27 ± 9.73 a1.09 ± 0.32 a0.25 ± 0.07 b30.26 ± 8.27 a125.48 ± 33.34 a1.15 ± 1.01 a49.11 ± 9.52 a5.09 ± 0.27 a
20–40Low12.36 ± 6.51 a0.56 ± 0.25 a0.34 ± 0.14 a18.26 ± 7.31 b49.99 ± 36.74 b1.70 ± 1.02 a39.10 ± 23.67 a4.56 ± 0.30 b
Medium14.07 ± 5.67 a0.69 ± 0.23 a0.26 ± 0.09 ab19.06 ± 8.39 b74.93 ± 47.33 ab1.69 ± 1.95 a42.97 ± 17.86 a4.74 ± 0.26 b
High13.89 ± 5.11 a0.66 ± 0.19 a0.23 ± 0.08 b30.08 ± 8.59 a104.65 ± 33.21 a0.69 ± 0.67 a40.69 ± 6.59 a5.04 ± 0.29 a

3.3.2. Soil Total Nutrients

As can be seen from Table 4, in the 0–20 cm layer, the total nitrogen content of the low richness level was significantly decreased by 33.33% compared with that of the high richness level; the total potassium content of the medium and low richness levels was significantly decreased by 29.69% and 39.52%, respectively, compared with that of the high richness level; the total phosphorus content of the medium and high richness levels was significantly decreased by 24.32% and 32.43%, respectively, compared with that of the low richness level. In the 20–40 cm layer, the total potassium content of the medium and low richness levels was significantly decreased by 33.87% and 40.42%, respectively, compared with that of the high richness level; the total phosphorus content of the medium and high richness levels was significantly decreased by 33.33% compared with that of the low richness level. In the 0–20 cm layer, the total nitrogen content of the medium and low diversity levels was significantly decreased by 25.69% and 34.86%, respectively, compared with that of the high diversity level; the total potassium content of the medium and low diversity levels was significantly decreased by 33.87% and 37.41%, respectively, compared with that of the high diversity level; and the total phosphorus content of the high diversity level was significantly decreased by 28.57% compared with that of the low diversity level. In the 20–40 cm layer, the total potassium content of the medium and low diversity levels was significantly decreased by 36.64% and 39.30%, respectively, compared with that of the high diversity level; the total phosphorus content of the high diversity level was significantly decreased by 32.35% compared with that of the low diversity level. These results indicate that with the increase in tree species richness and complexity, the total nitrogen content in the 0–20 cm layer, and the total potassium content in both 0–20 cm and 20–40 cm layers show a significant upward trend, while the total phosphorus content in both 0–20 cm and 20–40 cm layers exhibits a significant downward trend.

3.3.3. Soil Available Nutrients

As can be seen from Table 4, in the 0–20 cm layer, the available nitrogen content of the high richness level was significantly increased by 113.11% compared with that of the low richness level; the available phosphorus content of the low richness level was significantly increased by 95.96% compared with that of the high richness level. In the 20–40 cm layer, the available nitrogen content of the medium and high richness levels was significantly increased by 79.84% and 141.26%, respectively, compared with that of the low richness level; the available phosphorus content of the medium and low richness levels was significantly increased by 235.85% and 232.08%, respectively, compared with that of the high richness level. In the 0–20 cm layer, the available nitrogen content of the high diversity level was significantly increased by 96.00% compared with that of the low diversity level. In the 20–40 cm layer, the available nitrogen content of the high diversity level was significantly increased by 109.34% compared with that of the low diversity level. These results indicate that the available nitrogen content in both 0–20 cm and 20–40 cm layers shows a significant upward trend with the increase in tree species richness and complexity, while the available phosphorus content in both 0–20 cm and 20–40 cm layers shows a significant downward trend with the increase in species richness.

3.3.4. Soil pH

As can be seen from Table 4, in the 0–20 cm layer, the pH of the medium and low richness levels was significantly decreased by 4.32% and 6.68%, respectively, compared with that of the high richness level. In the 20–40 cm layer, the pH of the medium and low richness levels was significantly decreased by 5.75% and 10.12%, respectively, compared with that of the high richness level. In the 0–20 cm layer, the pH of the medium and low diversity levels was significantly decreased by 4.72% and 6.09%, respectively, compared with that of the high diversity level. In the 20–40 cm layer, the pH of the medium and low diversity levels was significantly decreased by 5.95% and 9.52%, respectively, compared with that of the high diversity level. These results indicate that the pH in both 0–20 cm and 20–40 cm layers shows a significant upward trend with the increase in tree species richness and complexity.

3.4. Variations of Soil Quality Index with Tree Species Diversity

3.4.1. Indicator Selection

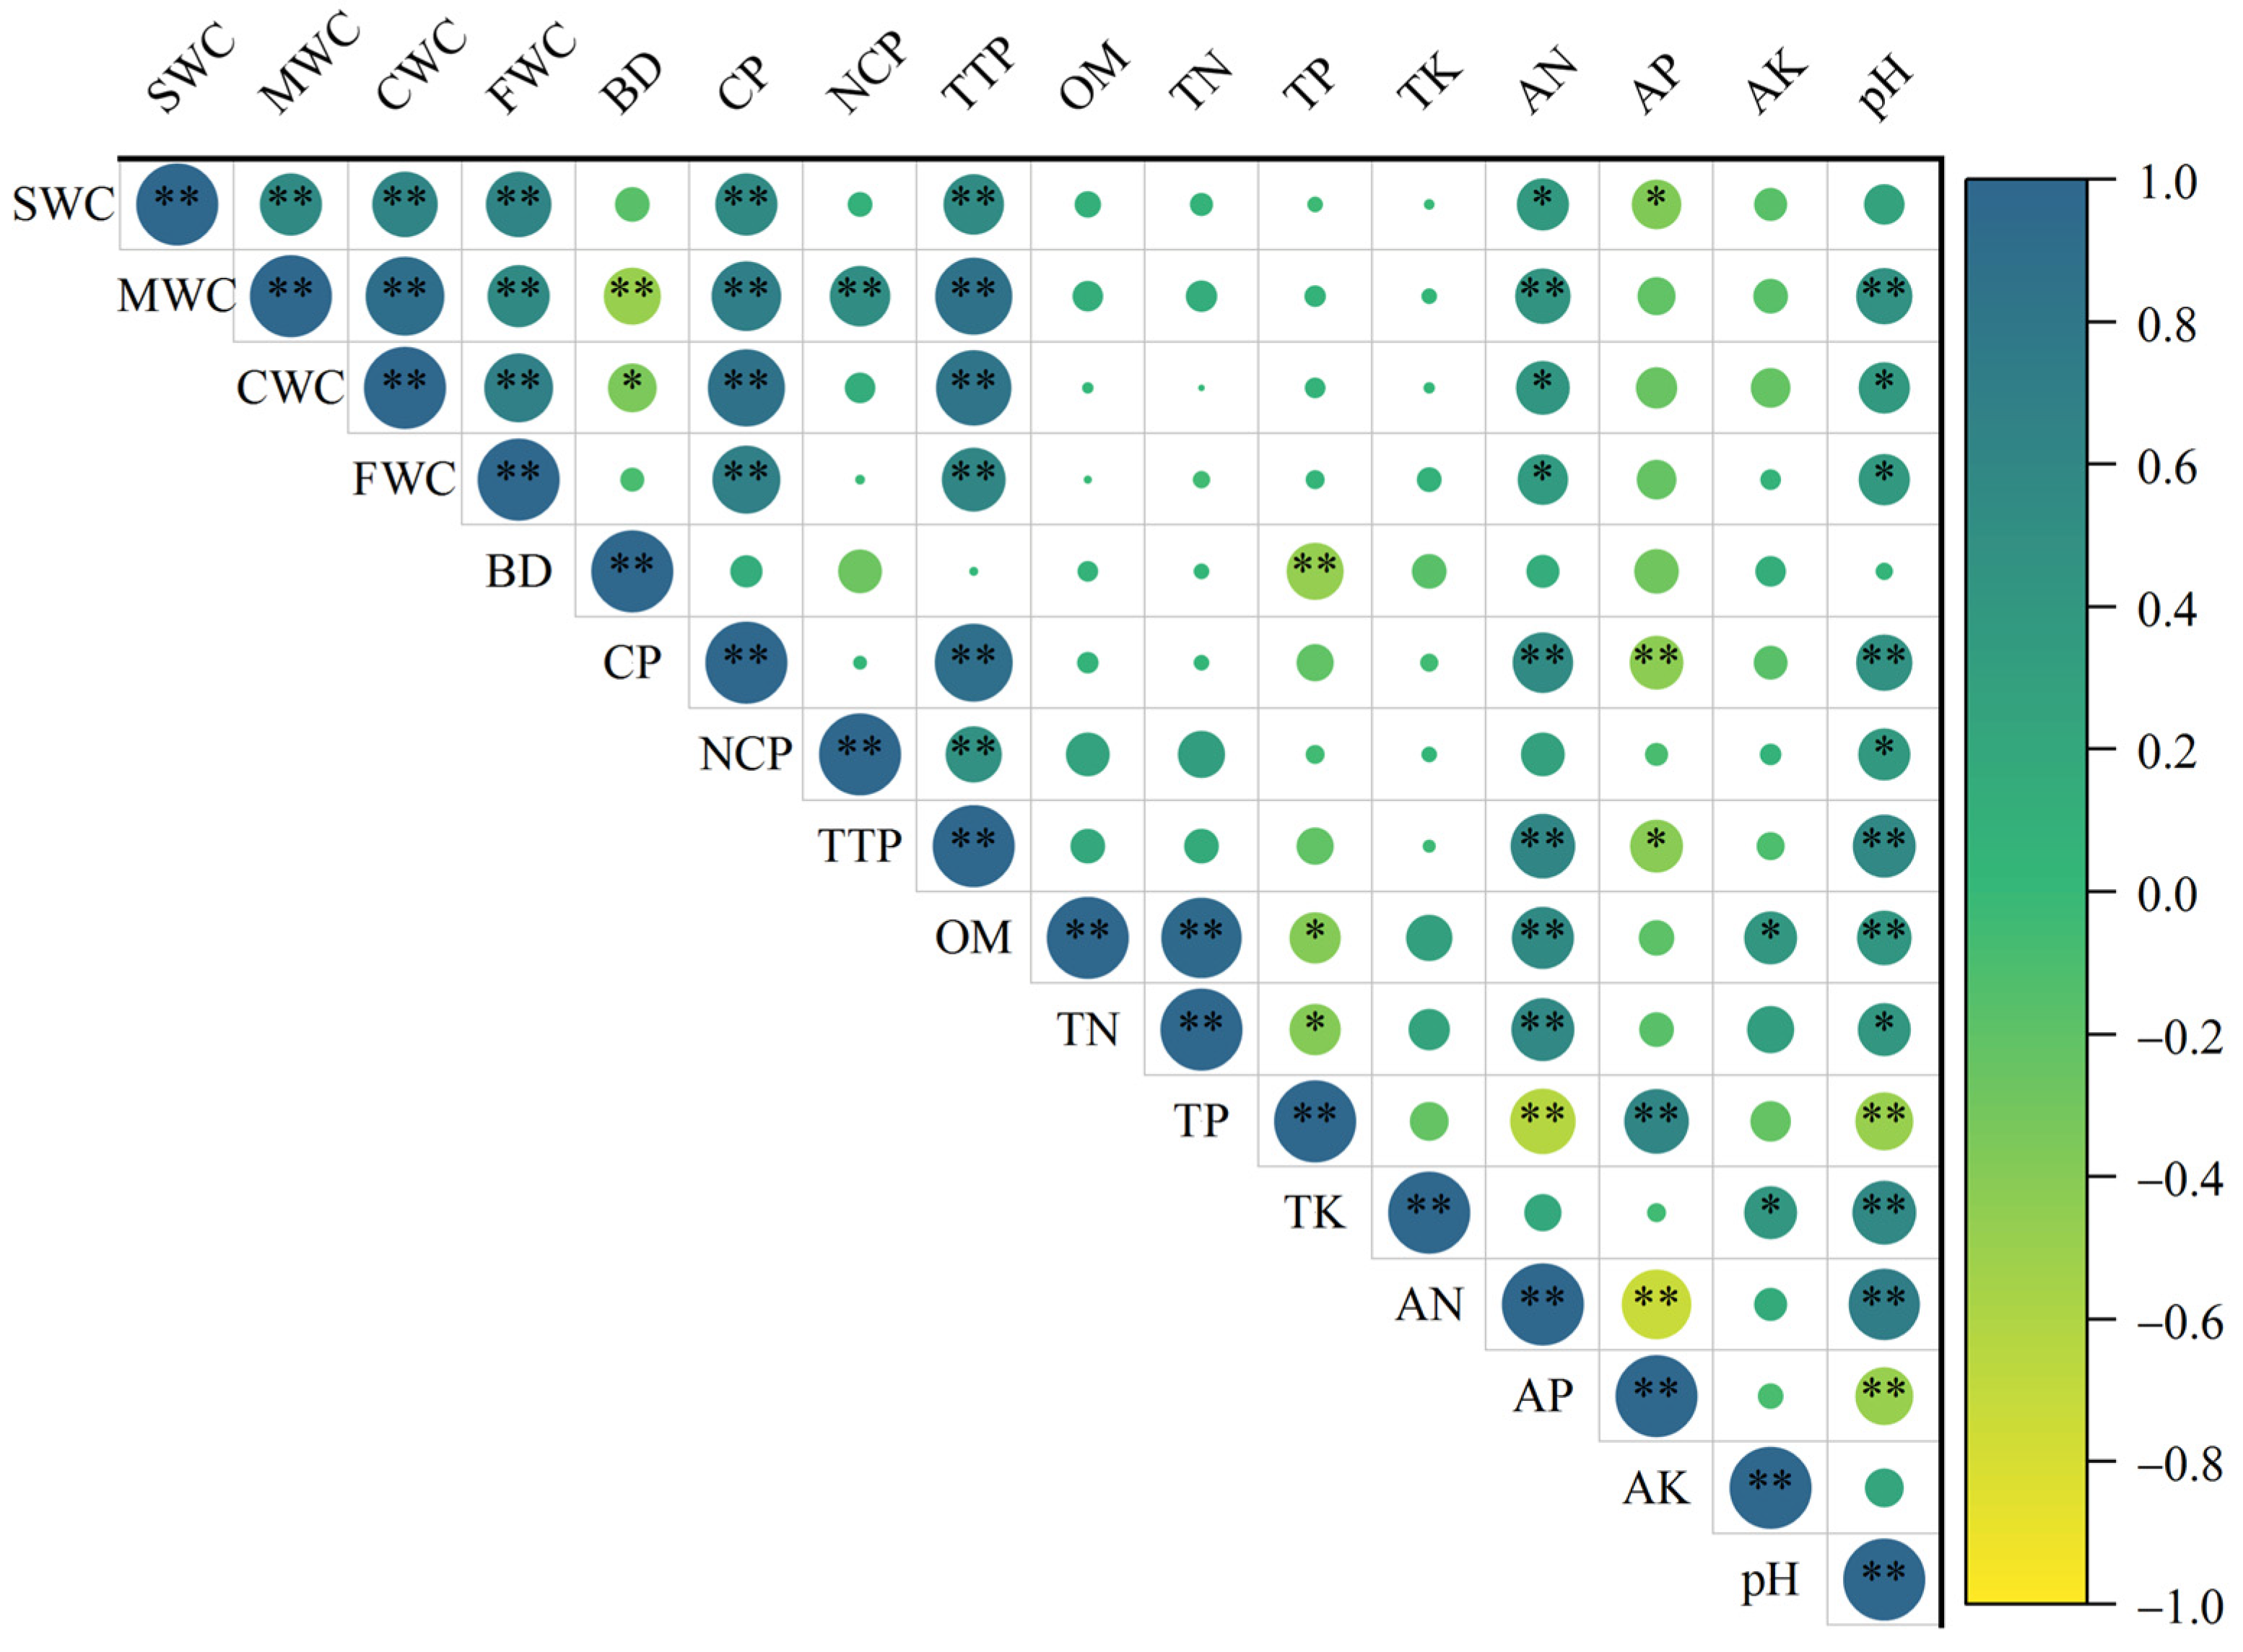
Four principal components with eigenvalues ≥1 were extracted, accounting for a cumulative variance contribution rate of 78.221% (Table 5). The indicator selection process was as follows: Group 1 contained nine indicators. Based on the Norm value (Equation (1)) selection criterion, five indicators—total porosity, capillary porosity, available nitrogen, maximum water-holding capacity, and capillary water-holding capacity—were initially selected. However, since the correlation coefficients between total porosity and the other four indicators were all ≥0.5 (Figure 2), only total porosity, which had the highest Norm value, was retained. Group 2 contained four indicators, with organic matter, total nitrogen, and total phosphorus initially selected. Given that the correlation between total nitrogen and organic matter was 0.95 (high), but between total phosphorus and organic matter was −0.39 (low), only organic matter and total phosphorus were retained. Group 3 included only bulk density and non-capillary porosity, with a low correlation (r < 0.5) between them (Figure 2), so both were included. Group 4 contained only total potassium, which was, therefore, selected. Consequently, a total of six indicators were selected for the MDS: total porosity, organic matter, total phosphorus, bulk density, non-capillary porosity, and total potassium.

3.4.2. Weight Determination

In the TDS, soil physical and chemical indicators accounted for 51.70% and 48.30% of the weight, respectively. In the MDS, soil physical indicators—including total porosity, bulk density, and non-capillary porosity—accounted for 51.40% of the total weight, while soil chemical indicators—including organic matter, total phosphorus, and total potassium—accounted for 48.60% (Table 6). These results indicate that soil physical properties have a slightly greater influence on overall soil quality in natural P. massoniana forests, and the similar weight distribution of physical and chemical indicators between the TDS and MDS suggests that the constructed MDS effectively represents the information of the TDS.

3.4.3. Soil Quality Index Calculation

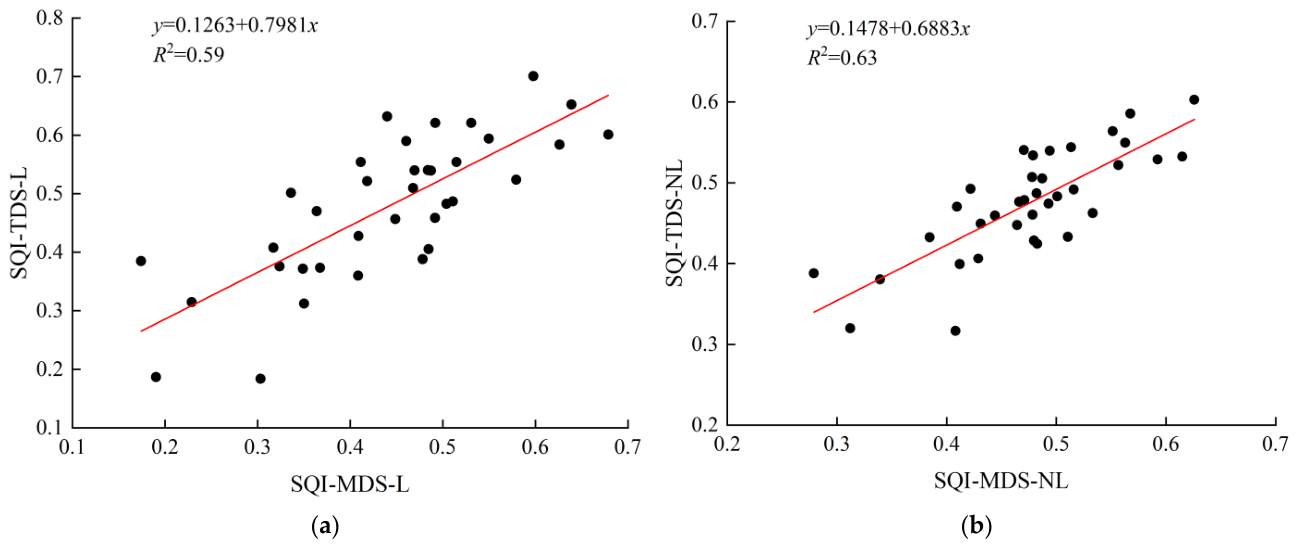
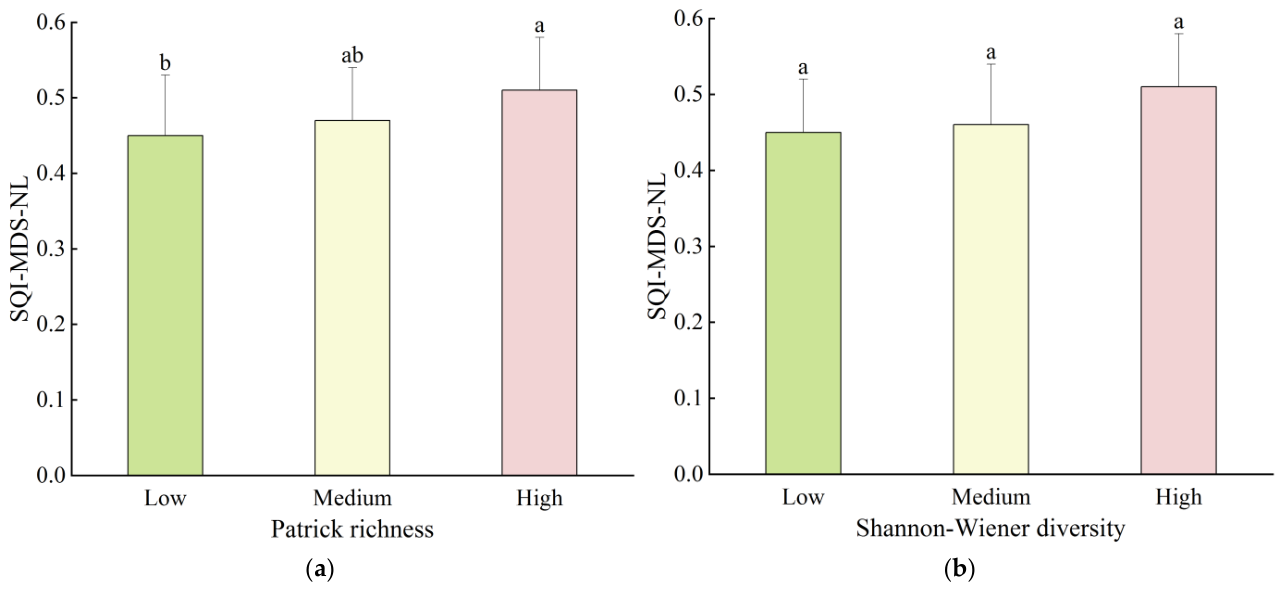
The calculations of the linear scoring function, nonlinear scoring function, and SQI are shown in Equations (2)–(5). The results showed that the correlation coefficient between the SQI derived from the TDS and MDS calculated using the nonlinear scoring function (r = 0.791) was higher than that using the linear function (r = 0.771) (Table 7), and the R2 value of the nonlinear function (0.63) also exceeded that of the linear function (0.59) (Figure 3). This further indicates that the constructed MDS can effectively substitute for the TDS, and the soil quality assessment method based on the nonlinear MDS is more suitable for evaluating soil quality changes in natural P. massoniana forests. Under the optimal scoring function, the SQI of the 36 plots ranged from 0.28 to 0.63, with an average value of 0.48. Among them, 83.33% of the plots had an SQI between 0.4 and 0.6, indicating that the soil quality of natural P. massoniana forests is generally at a moderate level. From the perspective of different levels, the SQI of the 0–40 cm layer with high richness level was significantly increased by 13.33% compared with that of the low richness level (Figure 4). This demonstrates that the SQI in the 0–40 cm layer only shows a significant upward trend with the increase in tree species richness.

3.5. Soil Quality Obstacle Factor Under Varying Richness Levels

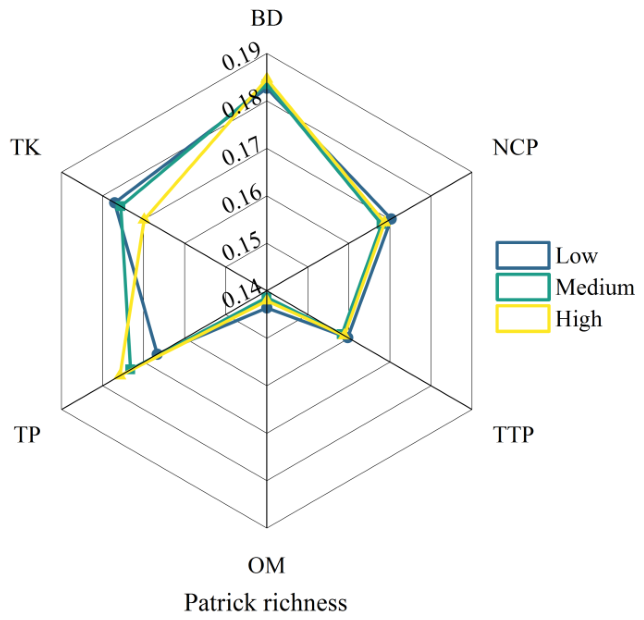
The obstacle degree of soil physicochemical indicators was calculated via Equations (6) and (7). The results showed that in the Patrick richness index, the ranking of soil quality limiting factors in the 0–40 cm layer varies across different levels. At the low richness level, the limiting factors ranked from greatest to least impact are bulk density, total potassium, non-capillary porosity, total phosphorus, total porosity, and organic matter. At the medium richness level, they are bulk density, total potassium, total phosphorus, non-capillary porosity, total porosity, and organic matter. At the high richness level, they are bulk density, total phosphorus, total potassium, non-capillary porosity, total porosity, and organic matter (Figure 5). This indicates that across different Patrick richness levels, bulk density has the greatest influence on soil quality in the 0–40 cm layer of natural P. massoniana forests, while organic matter has the least.

4. Discussion

4.1. The Relationship Between Tree Species Diversity and Soil Physical Properties

Bulk density, as a comprehensive indicator of soil texture, density, and porosity, directly or indirectly influences soil water retention and storage capacity. In this study, tree species diversity showed no significant correlation with bulk density, consistent with findings from multiple prior studies, such as Zheng et al. [28]. This may be attributed to the study area’s location in a subtropical monsoon climate zone with abundant precipitation and predominantly red soil, which possesses strong water-holding capacity, thereby diminishing the impact of bulk density on tree growth. Ning et al. [29] also suggested that the high rainfall and sufficient soil moisture meet the physiological demands of plants, resulting in no significant correlation between tree species diversity and bulk density. However, other studies have reported a significant negative correlation between bulk density and tree species richness [30]. On one hand, lower bulk density enhances soil permeability, increasing water supply to plant roots and root respiration rates, which promotes root growth and microbial activity, thereby increasing tree species richness [30]. On the other hand, anthropogenic disturbances, animal activity, and soil erosion may lead to the loss of fine soil particles, so higher bulk density inhibits vegetation growth, ultimately reducing tree species richness and complexity [31].
Soil moisture is closely related to soil porosity. In general, soil porosity provides storage space and flow pathways for soil moisture—the higher the porosity, the stronger the water-holding capacity [32]. In this study, soil water content, maximum water-holding capacity, and total porosity in the 20–40 cm layer showed significant increases with rising tree species richness and complexity, whereas no significant changes were observed in the 0–20 cm layer. This may be attributed to the fact that although surface soil porosity is promoted by non-root factors, such as litter decomposition and microbial activity, these gains are counterbalanced by physical disturbances, including frequent rainfall erosion and animal activity [33], thereby dampening the observable effect of species diversity. In contrast, the enhancement of porosity in deeper soil layers is likely driven primarily by deep-rooted tree species, whose root systems penetrate and loosen the soil, facilitating the formation of stable pores at depth [34].

4.2. The Relationship Between Tree Species Diversity and Soil Chemical Properties

Organic matter primarily originates from plant residues, root exudates, and microbial activity, serving as a critical factor in the formation of soil structure and fertility. As an essential nutrient element for plant growth, soil nitrogen has its occurrence forms and transformation processes closely related to organic matter. Among them, total nitrogen is the sum of all forms of nitrogen in soil, which mainly exists in the form of organic nitrogen that cannot be directly absorbed and utilized by plants, and its contribution to plant nutrition depends on the microbe-dominated mineralization process. Available nitrogen specifically refers to the inorganic nitrogen in soil that can be directly absorbed by plant roots, and there are essential differences between the two. This study found that both organic matter and total nitrogen in the 0–20 cm layer increased significantly with rising tree species richness and complexity, whereas no significant changes were observed in the 20–40 cm layer. This pattern may be attributed to the higher accumulation of litter and root biomass in the surface layer under high-diversity stands, leading to greater production and retention of organic matter and total nitrogen in the topsoil compared to deeper layers [35]. With increasing soil depth, this effect diminishes, compounded by reduced microbial activity, which slows down the rates of organic matter decomposition and nitrogen cycling, thereby limiting the vertical transport of organic constituents from surface to subsurface soils [36]. Furthermore, this study revealed a significant increase in available nitrogen with increasing tree species richness and complexity, likely driven by enhanced litter input and organic matter accumulation. Existing research indicates that the relationship between tree species diversity and available nitrogen varies across vegetation types within the same region. For instance, Lin et al. [37], conducting a study in Guilin, Guangxi, China, found a significant negative correlation between available nitrogen and tree diversity in evergreen–deciduous broad-leaf mixed forests, but there was no significant association in either deciduous broad-leaf or evergreen broad-leaf forests. This discrepancy may arise because elevated available nitrogen in mixed forests favors nitrogen-demanding species, which outcompete and suppress nitrogen-sensitive species, ultimately reducing overall species richness. These findings suggest that changes in available nitrogen are closely linked to species-specific physiological traits and the compositional identity of the tree community.
Phosphorus is an essential nutrient for plant growth and development, primarily derived from the mineralization of litter and the weathering of soil mineral particles. This study found that both total phosphorus and available phosphorus exhibited significant decreasing trends with increasing tree species richness, a pattern consistent with findings from multiple prior studies, such as Huston [38]. On one hand, this may be attributed to the subtropical climatic conditions and parent material characteristics of the study area, which favor the prevalence of red soil—a soil type whose acidic nature intensifies phosphorus limitation [39]. On the other hand, as tree species richness increases from low to high levels, enhanced plant growth and development may accelerate the uptake of phosphorus, outpacing the rate of phosphorus release through litter mineralization [40].
Soil potassium content directly influences regional soil fertility levels and is crucial for plant growth and physiological activities. This study found that increasing tree species richness and complexity had a significant positive effect on total potassium, but there was no significant effect on available potassium. However, other studies have reported positive [30] or negative [41] correlations between available potassium and species richness, which differ from the findings of this study. This discrepancy may be attributed to the close relationship between changes in available potassium and litter decomposition rates, which vary significantly among different tree species [42].
Within the optimal pH range, microbial activity is enhanced, promoting organic matter decomposition and nutrient mineralization, thereby increasing nutrient availability for plants and facilitating tree species diversity. Conversely, increased tree species diversity can, to some extent, elevate soil pH [43]. This study found that soil pH significantly increases with rising tree species richness and complexity, a result consistent with findings from Thoms et al. [44]. However, some studies report contrasting results. Xiao et al. [45] found a negative correlation between pH and species diversity, likely because dominant species, such as P. massoniana and Heptapleurum heptaphyllum (L.) Y. F. Deng, prefer acidic soils, making higher pH levels less favorable for plant growth. These findings suggest that the relationship between pH and tree species diversity may depend not only on species-specific pH tolerance [46] but also on factors such as successional stage and community composition.

4.3. The Relationship Between Tree Species Diversity and Soil Quality

Generally, mixed forests have a more beneficial effect on soil than monoculture forests [19], likely because mixed forests enhance the quantity and quality of root exudates and litter inputs, thereby regulating nutrient transfer between litter and decomposer communities and improving nutrient cycling efficiency to enhance soil quality [47]. Our findings also indicate that there is a significant positive correlation between tree species richness and soil quality, consistent with results from numerous studies, such as Mao et al. [48] and Vourlitis et al. [49]. However, this study also found that with the increase in tree species richness, although the SQI has been significantly improved, the contents of total phosphorus and available phosphorus show a significant downward trend (Table 4). This result does not fully support the traditional view that “the improvement of tree species diversity will inevitably drive the simultaneous improvement of soil quality”. The study by Zemunik et al. [50] also found that there is a negative correlation between tree species richness and soil fertility. This may be because, compared to monocultures, stands with high species richness in mixed forests may have higher nutrient demands during rapid growth phases, leading to greater nutrient uptake from the soil than return, thus causing a decline in soil quality [51]. The experimental area of this study is located in a typical subtropical phosphorus-limited region. When constructing multi-species forest communities by increasing tree species richness in such regions, the nutrient pattern imbalance phenomenon of “synergistic accumulation of soil carbon, nitrogen and potassium nutrients while continuous consumption of phosphorus” is more likely to occur. This process may trigger a chain ecological effect, that is, the soil ecosystem will gradually evolve to a more severe phosphorus-limited state and ultimately weaken the long-term sustainability of forest soil nutrient cycling. It is evident that the relationship between tree species diversity and soil quality is a dynamic process, which may be related to factors such as regional soil background characteristics, tree species functional trait combinations, and stand development stages.
Selecting appropriate and representative indicators is one of the key steps in soil quality assessment. In this study, six indicators were selected from an initial set of 16 soil physicochemical properties to form the MDS: bulk density, non-capillary porosity, and total porosity—representing soil texture and compactness—and organic matter, total phosphorus, and total potassium—reflecting soil nutrient levels of carbon, phosphorus, and potassium. However, the key indicators identified often vary due to differences in study objects or site conditions. For example, based on similar soil physicochemical properties, Zhan et al. [5] studied aerially seeded P. massoniana forests in Xingguo County, Ganzhou City, Jiangxi Province, and selected field capacity, bulk density, non-capillary porosity, organic matter, total nitrogen, and pH as the key indicators—a difference likely related to the context that these forests were restored in areas with poor water and nutrient retention and severe soil erosion. Furthermore, many researchers have incorporated soil biological indicators in addition to physicochemical ones [52]. Although this study did not include biological indicators, substantial evidence shows strong correlations between soil biological and physicochemical properties [53,54]. Therefore, relying solely on physicochemical indicators can still reflect overall soil quality to a certain extent. Future studies may further integrate soil biological indicators to provide a more comprehensive assessment of soil quality in natural P. massoniana forests.
Additionally, this study found that the nonlinear scoring function provides a better fit and is more suitable for assessing soil quality in natural P. massoniana forests compared to the linear function. Consistent with our findings, Gao et al. [55] also concluded that the nonlinear scoring method has higher sensitivity and is more appropriate for evaluating mountainous soil quality. This may be because the nonlinear approach better captures the complex relationships between soil physicochemical indicators and ecological functions. However, some studies suggest that the linear scoring method more effectively reflects soil quality changes [56,57], which may be related to factors such as study region, soil type, and vegetation characteristics.

4.4. Soil Quality Obstacle Factors

Existing studies indicate that for different stand types within the same region, the limiting factors for soil quality vary. For example, Ou et al. [58], studying major forest communities in Dongguan City, Guangdong Province, China, found that total porosity and non-capillary porosity are the primary limiting factors for improving soil quality in P. massoniana forests, while broad-leaved mixed forests are mainly constrained by electrical conductivity and organic matter, and Litchi chinensis Sonn. and Acacia confusa Merr. forests are primarily affected by available phosphorus. In contrast, this study reveals that the overall soil quality of natural P. massoniana forests is at a moderate level, and under different richness levels, bulk density is the most critical limiting factor for enhancing soil quality in natural P. massoniana forests across different tree species richness levels. This phenomenon may stem from the strong association between bulk density and soil type. The study area is dominated by red soil, which has a fine and clay-rich texture—offering good water retention but poor aeration due to dense pore structure [59]. Such soils are prone to physical compaction and intense leaching, thereby hindering root-induced improvements to soil structure. In addition, the relatively low content of soil available nutrients (Table 4) may also be an important factor restricting the improvement of soil quality. Soil available nutrients are the nutrient forms that can be directly absorbed and utilized by vegetation roots, and their content level directly determines the immediate fertilizer supply capacity of the soil. In the process of natural stand succession, with the increase in tree species richness, the demand for soil available nutrients will also be higher. When the absorption demand of vegetation roots for soil available nutrients exceeds the nutrient return rate of the litter decomposition process, the soil may become relatively barren in a short period, thus restricting the improvement of soil quality.
In summary, when managing P. massoniana plantations, first, near-natural forest management should be adopted to create coniferous and broad-leaved mixed stands with higher species richness and complexity. The root activities of different tree species can influence soil pore structure and enhance water retention and infiltration capacity, thereby improving soil physical properties. Second, forest litter should be retained on site. The accumulation and decomposition of mixed coniferous and broad-leaved litter, on one hand, reduce surface runoff and increase soil water-holding capacity and porosity [60]; on the other hand, they can promote the formation of organic matter and other compounds, thus improving soil chemical properties and enhancing overall soil quality.

5. Conclusions

The results show that with increasing tree species richness and complexity, organic matter and total nitrogen in the 0–20 cm layer, soil water content, maximum water-holding capacity, and total porosity in the 20–40 cm layer, as well as total potassium, available nitrogen, and pH in both the 0–20 cm and 20–40 cm layers, all exhibit a significant increasing trend; in contrast, total phosphorus in both layers shows a significant decreasing trend. Additionally, available phosphorus in both the 0–20 cm and 20–40 cm layers significantly decreases with increasing tree species richness, while the SQI in the 0–40 cm layer significantly increases with rising tree species richness. In P. massoniana plantation management, a near-natural management approach should be adopted to create relatively species-rich and complex coniferous and broad-leaved mixed stands, which is conducive to improving soil quality.

Author Contributions

Conceptualization, J.L. and P.P.; methodology, J.L., X.O., and P.P.; formal analysis, X.O., P.P., F.W., and F.C.; investigation, X.O., P.P., F.W., and F.C.; resources, X.O.; writing—original draft preparation, J.L. and H.L.; writing—review and editing, X.O. and P.P.; supervision, X.O. and P.P.; funding acquisition, X.O. and P.P. All authors have read and agreed to the published version of the manuscript.

Funding

This research was funded by the Science and Technology Innovation Program from Forestry Administration of Jiangxi Province, China (Innovation Project [2025] No. 22), the National Natural Science Foundation of China (grant Nos. 32360389 and 32260392), and the Jiangxi Provincial Natural Science Foundation (grant No. 20232BAB215048).

Data Availability Statement

The data that support the findings of this study are available from the corresponding author upon reasonable request.

Conflicts of Interest

The authors declare no conflict of interest.

References

  1. Feng, C.; Ma, Y.H.; Jin, X.; Wang, Z.; Ma, Y.; Fu, S.L.; Chen, H.Y.H. Soil Enzyme Activities Increase Following Restoration of Degraded Subtropical Forests. Geoderma 2019, 351, 180–187. [Google Scholar] [CrossRef]
  2. Shen, Y.F.; Li, J.; Chen, F.F.; Cheng, R.M.; Xiao, W.F.; Wu, L.C.; Zeng, L.X. Correlations Between Forest Soil Quality and Aboveground Vegetation Characteristics in Hunan Province, China. Front. Plant Sci. 2022, 13, 1009109. [Google Scholar] [CrossRef] [PubMed]
  3. Raiesi, F.; Kabiri, V. Identification of Soil Quality Indicators for Assessing the Effect of Different Tillage Practices through a Soil Quality Index in a Semi-Arid Environment. Ecol. Indic. 2016, 71, 198–207. [Google Scholar] [CrossRef]
  4. Guo, S.J.; Han, X.H.; Li, H.; Wang, T.; Tong, X.G.; Ren, G.X.; Feng, Y.Z.; Yang, G.H. Evaluation of Soil Quality Along Two Revegetation Chronosequences on the Loess Hilly Region of China. Sci. Total Environ. 2018, 633, 808–815. [Google Scholar] [CrossRef] [PubMed]
  5. Zhan, C.Y.; Pan, P.; Ouyang, X.Z.; Ning, J.K.; Xu, L.; Ju, L.J. Influence of Aerially Seeded Pinus massoniana Plantations on Soil Quality in Severely Eroded and Degraded Land of Subtropical China. Can. J. For. Res. 2022, 52, 1234–1244. [Google Scholar] [CrossRef]
  6. Teng, L.D.; Jiang, G.H.; Ding, Z.L.; Wang, Y.; Liang, T.B.; Zhang, J.Z.; Dai, H.X.; Cao, F.B. Evaluation of Tobacco-Planting Soil Quality Using Multiple Distinct Scoring Methods and Soil Quality Indices. J. Clean. Prod. 2024, 441, 140883. [Google Scholar] [CrossRef]
  7. Chang, T.T.; Feng, G.; Paul, V.; Adeli, A.; Brooks, J.P.; Jenkins, J.N. Soil Health Assessment for Different Tillage and Cropping Systems to Determine Sustainable Management Practices in a Humid Region. Soil Tillage Res. 2023, 233, 105796. [Google Scholar] [CrossRef]
  8. Zhang, Y.H.; Wang, L.; Jiang, J.; Zhang, J.C.; Zhang, Z.M.; Zhang, M.X. Application of Soil Quality Index to Determine the Effects of Different Vegetation Types on Soil Quality in the Yellow River Delta Wetland. Ecol. Indic. 2022, 141, 109116. [Google Scholar] [CrossRef]
  9. Cao, X.Y.; Mo, Y.J.; Yan, W.D.; Zhang, Z.L.; Peng, Y.Y. Evaluation of Soil Quality in Five Ages of Chinese Fir Plantations in Subtropical China Based on a Structural Equation Model. Forests 2023, 14, 1217. [Google Scholar] [CrossRef]
  10. De, P.; Deb, S.; Deb, D.; Chakraborty, S.; Santra, P.; Dutta, P.; Hoque, A.; Choudhury, A. Soil Quality Under Different Land Uses in Eastern India: Evaluation by Using Soil Indicators and Quality Index. PLoS ONE 2022, 17, e0275062. [Google Scholar] [CrossRef] [PubMed]
  11. Liu, B.; Zhao, Y.; Malekian, A.; Wang, X.; Zhao, W.Z.; Manesh, M.B.; Wang, B.; Yang, C.K.; Sun, W.H.; Li, W.; et al. Interactions and Feedback Mechanisms in Oasis Wetland Hydrology–Soil–Vegetation Systems, Northwestern China. Catena 2025, 258, 109220. [Google Scholar] [CrossRef]
  12. Zhang, Y.X.; Liu, T.R.; Guo, J.P.; Tan, Z.J.; Dong, W.; Wang, H.H. Changes in the Understory Diversity of Secondary Pinus tabulaeformis Forests are the Result of Stand Density and Soil Properties. Glob. Ecol. Conserv. 2021, 28, e01628. [Google Scholar] [CrossRef]
  13. Bai, J.L.; Ren, C.Y.; Shi, X.Y.; Xiang, H.X.; Zhang, W.M.; Jiang, H.L.; Ren, Y.X.; Xi, Y.B.; Wang, Z.M.; Mao, D.H. Tree Species Diversity Impacts on Ecosystem Services of Temperate Forests. Ecol. Indic. 2024, 167, 112639. [Google Scholar] [CrossRef]
  14. Liu, S.R.; Chen, Y.Q.; Nie, X.Q.; Ming, A.G.; Wang, H. Effects of Tree Species Diversity on Multifunctionality and Resilience of Forest Ecosystems. Sci. Silvae Sin. 2026, 62, 1–18. (In Chinese) [Google Scholar]
  15. Liang, M.W.; Yang, Q.; Chase, J.M.; Isbell, F.; Loreau, M.; Schmid, B.; Seabloom, E.W.; Tilman, D.; Wang, S.P. Unifying Spatial Scaling Laws of Biodiversity and Ecosystem Stability. Science 2025, 387, eadl2373. [Google Scholar] [CrossRef] [PubMed]
  16. Martin Guay, M.O.; Belluau, M.; Côté, B.; Handa, I.T.; Jewell, M.D.; Khlifa, R.; Munson, A.D.; Rivest, M.; Whalen, J.K.; Rivest, D. Tree Identity and Diversity Directly Affect Soil Moisture and Temperature but Not Soil Carbon Ten Years After Planting. Ecol. Evol. 2022, 12, e8509. [Google Scholar] [CrossRef] [PubMed]
  17. Zhang, S.M.; Landuyt, D.; Dhiedt, E.; De Frenne, P.; Verheyen, K. Tree Species Diversity Affects Litter Decomposition Via Modification of the Microenvironment. Ecosystems 2024, 27, 508–522. [Google Scholar] [CrossRef]
  18. Pan, P.; Sun, Y.J.; Ouyang, X.Z.; Zang, H.; Rao, J.F.; Ning, J.K. Factors Affecting Spatial Variation in Vegetation Carbon Density in Pinus massoniana Lamb. Forest in Subtropical China. Forests 2019, 10, 880. [Google Scholar] [CrossRef]
  19. Wen, L.; Lei, P.F.; Xiang, W.H.; Yan, W.D.; Liu, S.G. Soil Microbial Biomass Carbon and Nitrogen in Pure and Mixed Stands of Pinus massoniana and Cinnamomum camphora Differing in Stand Age. For. Ecol. Manag. 2014, 328, 150–158. [Google Scholar] [CrossRef]
  20. IUSS Working Group WRB. World Reference Base for Soil Resources, International Soil Classification System for Naming Soils and Creating Legends for Soil Maps, 4th ed.; International Union of Soil Sciences (IUSS): Vienna, Austria, 2022. [Google Scholar]
  21. Guo, Y.; Ouyang, X.Z.; Pan, P.; Liu, J.; Liu, C. Construction of Stand Density Management Diagrams and Silvicultural Simulation for Different Stand Types of Chinese Fir in the Mid-Subtropics. Forests 2025, 16, 1543. [Google Scholar] [CrossRef]
  22. Olsen, S.R.; Cole, C.V.; Watanabe, F.S.; Dean, L.A. Estimation of Available Phosphorus in Soils by Extraction with Sodium Bicarbonate; USDA Circular: Washington, DC, USA, 1954; p. 939. [Google Scholar]
  23. Liu, K.Y.; Yang, J.; Jiang, S.N.; Gu, H.Y. Evaluation of Differences in Soil Quality of Populus simonii × P. nigra (P. xiaohei) of Different Stand Ages in Typical Black Soil Areas Based on a Minimum Data Set. Acta Ecol. Sin. 2024, 44, 3623–3635. (In Chinese) [Google Scholar] [CrossRef]
  24. Li, P.; Qi, S.; Zhang, L.; Hu, J.; Tang, Y.; Lu, J.S.; Wang, X.Y.; Lai, J.L.; Liao, R.E.; Zhang, D.; et al. Comprehensive Evaluation of Soil Quality of Different Vegetation Restoration Types in Mountainous Areas of Beijing. J. Soil Water Conserv. 2024, 38, 337–346+356. (In Chinese) [Google Scholar] [CrossRef]
  25. Li, S.; Luo, D.; Wang, J.; Wei, Y.; Yuan, Z. Assessing Soil Quality in Association with Frozen Ground in the Source Areas of the Yangtze and Yellow Rivers, Qinghai-Tibet Plateau. Geoderma 2025, 456, 117264. [Google Scholar] [CrossRef]
  26. Zhou, Y.; Ma, H.B.; Xie, Y.Z.; Jia, X.Y.; Su, T.T.; Li, J.P.; Shen, Y. Assessment of Soil Quality Indexes for Different Land Use Types in Typical Steppe in the Loess Hilly Area, China. Ecol. Indic. 2020, 118, 106743. [Google Scholar] [CrossRef]
  27. Sun, D.Y.; Ji, Z.H.; Wang, Y.K.; Zhang, W.R. Assessment and Forecasting of Water Ecological Security and Obstacle Factor Diagnosis in the Hexi Corridor of Northwest China. Sci. Rep. 2024, 14, 23507. [Google Scholar] [CrossRef] [PubMed]
  28. Zheng, X.F.; Wei, X.; Zhang, S.X. Tree Species Diversity and Identity Effects on Soil Properties in the Huoditang Area of the Qinling Mountains, China. Ecosphere 2017, 8, e01732. [Google Scholar] [CrossRef]
  29. Ning, P.; Hou, X.W.; Hu, Y.Y.; Wen, M.X.; Liu, C.; Hou, L. Relationship Between Species Diversity of Juniperus tibetica Community and Soil Factors in Qinghai Province. Acta Bot. Boreali-Occident. Sin. 2021, 41, 1924–1931. (In Chinese) [Google Scholar] [CrossRef]
  30. Li, X.H.; Lei, S.G.; Liu, F.; Wang, W.Z. Analysis of Plant and Soil Restoration Process and Degree of Refuse Dumps in Open-Pit Coal Mining Areas. Int. J. Environ. Res. Public Health 2020, 17, 1975. [Google Scholar] [CrossRef] [PubMed]
  31. Xu, H.P.; Zhang, J.; Pang, X.P.; Wang, Q.; Zhang, W.N.; Wang, J.; Guo, Z.G. Responses of Plant Productivity and Soil Nutrient Concentrations to Different Alpine Grassland Degradation Levels. Environ. Monit. Assess. 2019, 191, 678. [Google Scholar] [CrossRef] [PubMed]
  32. Yuan, D.M.; Yang, M.; Yan, L.B.; Liu, F.; Zhang, H.M.; Cao, X.G.; Yu, L.F. Spatial Distribution of Surface Soil Water-Holding Capacity in Karst Forests and its Influencing Factors. Bull. Soil Water Conserv. 2024, 44, 57–69. (In Chinese) [Google Scholar] [CrossRef]
  33. Gong, S.H.; Zha, T.G.; Zhang, X.X.; Zhang, H.S.; Gao, L.W.; Yu, Y. Responses of Litter-Soil Nutrients to Rainfall Redistribution in Typical Stand on Loess Area of Western Shanxi Province. Acta Ecol. Sin. 2024, 44, 7748–7759. (In Chinese) [Google Scholar] [CrossRef]
  34. Laganière, J.; Paré, D.; Bergeron, Y.; Chen, H.Y.H. The Effect of Boreal Forest Composition on Soil Respiration is Mediated through Variations in Soil Temperature and C Quality. Soil Biol. Biochem. 2012, 53, 18–27. [Google Scholar] [CrossRef]
  35. Huang, X.M.; Liu, S.R.; Wang, H.; Hu, Z.D.; Li, Z.G.; You, Y.M. Changes of Soil Microbial Biomass Carbon and Community Composition through Mixing Nitrogen-Fixing Species with Eucalyptus urophylla in Subtropical China. Soil Biol. Biochem. 2014, 73, 42–48. [Google Scholar] [CrossRef]
  36. Wu, W.Z.; Ren, Q.R.; Zhang, S.Q.; Wang, K.J.; Liu, J.X.; Wei, Y.Q.; Chai, B.F. Structure and Stability of Soil Organic Carbon Pools Along Depth in Forests and Grasslands in the Luya Mountains. Environ. Sci. 2025, 46, 6567–6575. (In Chinese) [Google Scholar] [CrossRef] [PubMed]
  37. Lin, H.L.; Yuan, K.W.; Liang, Z.H.; Li, Y.L.; Liang, S.C. Relationship Between Plant Diversity and Environmental Factors of Typical Mid-Subtropical Karst Forests in China. Guihaia 2024, 44, 428–438. (In Chinese) [Google Scholar] [CrossRef]
  38. Huston, M. Soil Nutrients and Tree Species Richness in Costa Rican Forests. J. Biogeogr. 1980, 7, 147–157. [Google Scholar] [CrossRef]
  39. Jia, T.; Song, W.Y.; Guan, X.X.; Wei, Z.W.; Chen, H.; Yi, M.; Xiong, Q.H.; Zhang, L. Responses of Needle Functional Traits of Pinus Elliottii to Phosphorus Addition. J. Nanjing For. Univ. (Nat. Sci. Ed.) 2021, 45, 65–71. (In Chinese) [Google Scholar] [CrossRef]
  40. Campo, J.; Jaramillo, V.J.; Maass, J.M. Pulses of Soil Phosphorus Availability in a Mexican Tropical Dry Forest: Effects of Seasonality and Level of Wetting. Oecologia 1998, 115, 167–172. [Google Scholar] [CrossRef] [PubMed]
  41. Zhou, R.H.; Su, T.C.; Yu, J.; Xiang, L.; Chen, C.L.; Zhang, H.W.; Li, J.; Hao, J.F. Species Diversity and Soil Physicochemical Properties of Different Communities in Bifengxia Evergreen Broad-Leaved Forest. Chin. J. Ecol. 2022, 41, 1–8. (In Chinese) [Google Scholar] [CrossRef]
  42. Yang, Z.J.; Zheng, H.S.; Weng, Q.J. Effects of Mixed Eucalyptus and Nitrogen-Fixing Tree Species on Soil Fertility and Biomass. Guangdong For. Sci. Technol. 1995, 11, 10–16. (In Chinese) [Google Scholar]
  43. Pang, D.B.; Wu, M.Y.; Zhao, Y.R.; Yang, J.; Dong, L.G.; Wu, X.D.; Chen, L.; Li, X.B.; Ni, X.R.; Li, J.Y.; et al. Soil Microbial Community Characteristics and the Influencing Factors at Different Elevations on the Eastern Slope of Helan Mountain, Northwest China. Chin. J. Appl. Ecol. 2023, 34, 1957–1967. (In Chinese) [Google Scholar] [CrossRef] [PubMed]
  44. Thoms, C.; Gattinger, A.; Jacob, M.; Thomas, F.M.; Gleixner, G. Direct and Indirect Effects of Tree Diversity Drive Soil Microbial Diversity in Temperate Deciduous Forest. Soil Biol. Biochem. 2010, 42, 1558–1565. [Google Scholar] [CrossRef]
  45. Xiao, J.H.; Lai, M.Y.; Li, M.; Wang, C.X.; Zhong, Z.F.; Wen, Q.Y.; Qian, Z.J.; Luo, Z.; Wang, Y.X.; Deng, Q.Y.; et al. Characteristics of Pinus massoniana Forest Community and Species Diversity of Island in Sandu Gulf, Ningde, Fujian Province. Acta Ecol. Sin. 2023, 43, 9827–9843. (In Chinese) [Google Scholar] [CrossRef]
  46. Pärtel, M.; Helm, A.; Ingerpuu, N.; Reier, Ü.; Tuvi, E. Conservation of Northern European Plant Diversity: The Correspondence with Soil PH. Biol. Conserv. 2004, 120, 525–531. [Google Scholar] [CrossRef]
  47. Li, K.; Lu, Y.; Wang, Q.W.; Ni, R.Q.; Han, R.C.; Li, C.R.; Zhang, C.H.; Shen, W.X.; Yao, Q.; Gao, Y.Y.; et al. Leaf Litter Mixtures Alter Decomposition Rate, Nutrient Retention, and Bacterial Community Composition in a Temperate Forest. For. Res. 2023, 3, 22. [Google Scholar] [CrossRef] [PubMed]
  48. Mao, Z.K.; Corrales, A.; Zhu, K.; Yuan, Z.Q.; Lin, F.; Ye, J.; Hao, Z.Q.; Wang, X.G. Tree Mycorrhizal Associations Mediate Soil Fertility Effects on Forest Community Structure in a Temperate Forest. New Phytol. 2019, 223, 475–486. [Google Scholar] [CrossRef] [PubMed]
  49. Vourlitis, G.L.; de Almeida Lobo, F.; Lawrence, S.; Codolo De Lucena, I.; Pinto, O.B.; Dalmagro, H.J.; Carmen, E.; Rodriguez, O.; de Souza Nogueira, J. Variations in Stand Structure and Diversity Along a Soil Fertility Gradient in a Brazilian Savanna (Cerrado) in Southern Mato Grosso. Soil Sci. Soc. Am. J. 2013, 77, 1370–1379. [Google Scholar] [CrossRef]
  50. Zemunik, G.; Turner, B.L.; Lambers, H.; Laliberté, E. Increasing Plant Species Diversity and Extreme Species Turnover Accompany Declining Soil Fertility Along a Long-Term Chronosequence in a Biodiversity Hotspot. J. Ecol. 2016, 104, 792–805. [Google Scholar] [CrossRef]
  51. Richards, A.E.; Forrester, D.I.; Bauhus, J.; Scherer-Lorenzen, M. The Influence of Mixed Tree Plantations on the Nutrition of Individual Species: A Review. Tree Physiol. 2010, 30, 1192–1208. [Google Scholar] [CrossRef] [PubMed]
  52. Xiao, X.; Guo, X.Y.; Ouyang, X.Z.; Wu, Z.R. Characteristics of Understory Vegetation and Evaluation of Soil Quality of Aerially Seeded Pinus massoniana Plantation under Different Stand Densities. J. Northeast For. Univ. 2015, 43, 62–66. (In Chinese) [Google Scholar] [CrossRef]
  53. Chandra, L.R.; Gupta, S.; Pande, V.; Singh, N. Impact of Forest Vegetation on Soil Characteristics: A Correlation Between Soil Biological and Physico-Chemical Properties. 3 Biotech 2016, 6, 188. [Google Scholar] [CrossRef] [PubMed]
  54. Židó, J.; Šumichrast, L.; Kucbel, S.; Gömöryová, E. The Effect of Stand Structure on Soil Physico-Chemical and Biological Properties in a Primary Beech Forest. Forests 2022, 13, 1344. [Google Scholar] [CrossRef]
  55. Gao, J.; Zhang, J.W.; Gong, Y.W.; Yang, K.M.; Quan, W.C.; Li, L.; Wu, Y.X.; Wang, R.; Cheng, H.G. A Robust Soil Quality Index for Mountain Ecosystems Driven by XGBoost and Network Analysis. Geoderma 2025, 463, 117558. [Google Scholar] [CrossRef]
  56. Askari, M.S.; Holden, N.M. Quantitative Soil Quality Indexing of Temperate Arable Management Systems. Soil Till. Res. 2015, 150, 57–67. [Google Scholar] [CrossRef]
  57. Tan, T.S.; Hu, W.W.; Fu, T.C.; Li, M.; Campbell, G.; Smith, P.; Yi, Z.L.; Xue, S.; Xu, Y. Long-Term Miscanthus Cultivation Enhances Soil Quality in Degraded Acidic Red Soils: A Multi-Indicator Assessment. Ind. Crop. Prod. 2026, 242, 123001. [Google Scholar] [CrossRef]
  58. Ou, Z.Y.; Su, Z.Y.; Zhu, J.Y. Basic Soil Properties and Comprehensive Evaluation in Forest Communities in Dongguan, South China. J. Cent. South Univ. For. Technol. 2013, 33, 96–102. (In Chinese) [Google Scholar] [CrossRef]
  59. Zhao, Q.G.; Huang, G.Q.; Ma, Y.Q. The Problems in Red Soil Ecosystem in Southern of China and its Countermeasures. Acta Ecol. Sin. 2013, 33, 7615–7622. (In Chinese) [Google Scholar] [CrossRef]
  60. Facelli, J.M.; Pickett, S.T.A. Plant Litter: Its Dynamics and Effects on Plant Community Structure. Bot. Rev. 1991, 57, 1–32. [Google Scholar] [CrossRef]
Figure 1. Differences in tree species diversity indices across levels were analyzed. Panel (a) is the Patrick richness index, and panel (b) is the Shannon–Wiener diversity index. Different letters indicate significant differences among levels within the same index (p < 0.05). The significance test for inter-group differences was conducted using one-way analysis of variance (ANOVA), and Duncan’s test was used for post hoc multiple comparisons.
Forests 17 00805 g001
Figure 2. Correlation analysis among soil physicochemical indicators. Abbreviations: SWC = soil water content, MWC = maximum water-holding capacity, CWC = capillary water-holding capacity, FWC = field water-holding capacity, BD = bulk density, CP = capillary porosity, NCP = non-capillary porosity, TTP = total porosity, OM = organic matter, TN = total nitrogen, TP = total phosphorus, TK = total potassium, AN = available nitrogen, AP = available phosphorus, AK = available potassium. * p < 0.05, ** p < 0.01.
Forests 17 00805 g002
Figure 3. Comparing the relationship between SQI derived from the TDS and MDS using linear and nonlinear scoring methods. Panel (a) is the linear scoring method, and panel (b) is the nonlinear scoring method.
Forests 17 00805 g003
Figure 4. SQI across levels of tree species diversity indices. Panel (a) shows the SQI result by Patrick richness index, and panel (b) shows the SQI result by Shannon–Wiener diversity index. Different letters indicate significant differences among levels of the same index within the same soil layer (p < 0.05). The significance test for inter-group differences was conducted using one-way analysis of variance (ANOVA), and Duncan’s test was used for post hoc multiple comparisons.
Forests 17 00805 g004
Figure 5. Obstacle degree of soil physicochemical indicators. Abbreviations: BD = bulk density, NCP = non-capillary porosity, TTP = total porosity, OM = organic matter, TP = total phosphorus, TK = total potassium.
Forests 17 00805 g005
Table 1. Descriptive statistics were calculated for the tree species diversity indices in natural P. massoniana forests.
Tree Species Diversity IndicesMinimumMaximumMeanStandard Deviation
Patrick richness21263.03
Shannon–Wiener diversity0.451.951.010.41
Table 2. Dominant tree species composition across levels of two diversity indices.
Tree Species Diversity IndicesLevelNumber of PlotsSpecies Composition
Patrick richnessLow (R ≤ 3)117PM 2SS 1CL
Medium (3 < R ≤ 6)137PM 2SS 1CL
High (R > 6)126PM 2SS 1CL 1CF + IT
Shannon–Wiener diversityLow (H ≤ 0.81)128PM 2SS + CL
Medium (0.81 < H ≤ 1.14)127PM 2SS 1CL + LF
High (H > 1.14)126PM 2SS 1CL 1CF + IT
Note: PM = Pinus massoniana Lamb., SS = Schima superba Gardner & Champ., CL = Cunninghamia lanceolata (Lamb.) Hook., CF = Castanopsis fargesii Franch., IT = Ilex triflora Blume, LF = Liquidambar formosana Hance. The species composition coefficient represents the proportion of the volume of a given tree species relative to the total stand volume, expressed on a tenth scale. If the volume of a species accounts for less than 5% but more than 2% of the total stand volume, it is denoted by a “+” symbol. Stand volume refers to the total wood volume of all trees in a forest stand, with the unit being m3·ha−1.
Table 3. Soil physical properties across levels of tree species diversity indices.
Tree Species Diversity IndicesSoil Layer (cm)LevelSoil Water Content (%)Maximum Water-Holding Capacity (%)Capillary Water-Holding Capacity (%)Field Water-Holding Capacity (%)Bulk Density (g·cm−3)Capillary Porosity (%)Non-Capillary Porosity (%)Total Porosity (%)
Patrick richness0–20Low18.02 ± 2.93 a33.20 ± 9.03 a27.43 ± 8.98 a19.55 ± 6.06 a1.31 ± 0.17 a35.06 ± 9.36 a7.35 ± 2.23 a42.41 ± 8.23 a
Medium18.14 ± 5.92 a36.47 ± 6.49 a28.65 ± 4.67 a19.47 ± 6.55 a1.31 ± 0.13 a37.49 ± 7.00 a9.91 ± 3.86 a47.40 ± 7.66 a
High22.39 ± 6.42 a37.71 ± 5.09 a31.42 ± 4.44 a23.56 ± 5.83 a1.29 ± 0.09 a40.52 ± 5.84 a7.98 ± 3.86 a48.50 ± 5.24 a
20–40Low16.81 ± 4.38 b28.03 ± 4.89 b23.73 ± 4.88 a16.52 ± 5.60 a1.42 ± 0.10 a33.67 ± 7.86 a5.99 ± 2.25 a39.67 ± 7.26 b
Medium19.49 ± 4.26 ab31.32 ± 6.16 ab26.79 ± 4.47 a18.33 ± 6.33 a1.43 ± 0.11 a38.12 ± 4.87 a6.45 ± 3.59 a44.57 ± 7.46 ab
High20.82 ± 3.06 a33.38 ± 4.75 a27.23 ± 5.02 a19.15 ± 4.88 a1.39 ± 0.06 a37.93 ± 7.34 a8.56 ± 4.41 a46.49 ± 7.11 a
Shannon–Wiener diversity0–20Low17.40 ± 4.01 a34.80 ± 8.69 a28.35 ± 8.29 a19.55 ± 6.17 a1.29 ± 0.14 a35.90 ± 8.69 a8.10 ± 3.38 a44.00 ± 7.92 a
Medium20.02 ± 7.07 a36.44 ± 6.53 a29.20 ± 5.78 a21.08 ± 7.27 a1.32 ± 0.15 a38.39 ± 8.41 a9.24 ± 3.67 a47.63 ± 8.24 a
High21.14 ± 5.16 a36.41 ± 6.09 a30.05 ± 4.68 a21.94 ± 5.65 a1.30 ± 0.10 a38.97 ± 5.54 a8.12 ± 3.71 a47.10 ± 5.99 a
20–40Low16.93 ± 4.20 b28.56 ± 4.33 b23.95 ± 3.73 a15.54 ± 4.79 a1.42 ± 0.10 a33.90 ± 5.49 a6.46 ± 2.31 a40.36 ± 5.96 b
Medium19.08 ± 4.46 ab30.92 ± 6.99 ab26.15 ± 6.29 a19.09 ± 6.85 a1.43 ± 0.11 a37.17 ± 8.44 a6.77 ± 3.73 a43.94 ± 9.15 ab
High21.34 ± 2.67 a33.52 ± 4.44 a27.90 ± 3.77 a19.52 ± 4.42 a1.40 ± 0.06 a39.02 ± 5.74 a7.81 ± 4.67 a46.83 ± 6.55 a
Note: Values are presented as mean ± standard deviation. Different letters indicate significant differences among levels of the same index for the same factor within the same soil layer (p < 0.05). The significance test for inter-group differences was conducted using one-way analysis of variance (ANOVA), and Duncan’s test was used for post hoc multiple comparisons. Same as Table 4.
Table 5. Factor loadings from principal component analysis and corresponding Norm values of soil physicochemical indicators.
Soil Physicochemical IndicatorsGroupPrincipal ComponentCommon Factor VarianceNorm Value
1234
Total porosity10.904−0.245−0.051−0.1680.9082.2563
Capillary porosity10.828−0.322−0.3270.0440.8982.1510
Available nitrogen10.8240.405−0.145−0.1110.8772.1529
Maximum water-holding capacity10.815−0.4270.333−0.1210.9722.1881
Capillary water-holding capacity10.796−0.5290.0580.0860.9242.1709
pH10.7630.3710.0940.2140.7741.9977
Field water-holding capacity10.661−0.366−0.1010.4190.7571.8123
Soil water content10.651−0.338−0.0710.0730.5491.7070
Available phosphorus1−0.583−0.2890.4940.0630.6721.6672
Organic matter20.4120.6900.328−0.1550.7771.6864
Total nitrogen20.3960.6730.345−0.2570.7951.6630
Total phosphorus2−0.377−0.6650.4220.0820.7691.6379
Available potassium20.0450.5960.1670.4350.5751.2239
Bulk density3−0.0540.417−0.767−0.0970.7741.3283
Non-capillary porosity30.3890.0950.547−0.4740.6851.3417
Total potassium40.2120.4280.3530.6760.8101.3063
Eigenvalue5.9333.3511.9591.273
Percent (%)37.08120.94212.2447.955
Cumulative percent (%)37.08158.02270.26778.221
Table 6. Weight calculation of soil physicochemical indicators.
Soil Physicochemical IndicatorsTotal Data SetMinimum Data Set
Common Factor VarianceWeightCommon Factor VarianceWeight
Total porosity0.9080.0720.7330.159
Capillary porosity0.8980.072
Available nitrogen0.8770.070
Maximum water-holding capacity0.9720.078
Capillary water-holding capacity0.9240.074
pH0.7740.062
Field water-holding capacity0.7570.060
Soil water content0.5490.044
Available phosphorus0.6720.054
Organic matter0.7770.0620.6470.140
Total nitrogen0.7950.063
Total phosphorus0.7690.0610.7950.172
Available potassium0.5750.046
Bulk density0.7740.0620.8610.186
Non-capillary porosity0.6850.0550.7800.169
Total potassium0.8100.0650.8050.174
Table 7. The correlation between different SQIs under the two scoring methods.
ItemSQI-TDS-LSQI-MDS-LSQI-TDL-NLSQI-MDS-NL
SQI-TDS-L1.000
SQI-MDS-L0.771 **1.000
SQI-TDL-NL0.961 **0.780 **1.000
SQI-MDS-NL0.705 **0.943 **0.791 **1.000
Note: ** p < 0.01.
Disclaimer/Publisher’s Note: The statements, opinions and data contained in all publications are solely those of the individual author(s) and contributor(s) and not of MDPI and/or the editor(s). MDPI and/or the editor(s) disclaim responsibility for any injury to people or property resulting from any ideas, methods, instructions or products referred to in the content.