1. Introduction
Sitka spruce (
Picea sitchensis (Bong.) Carr.) occupies a unique position in Atlantic European forestry. It accounts for approximately 52% of the total forest area in Ireland, and in Britain, it is the single most planted conifer species, supporting timber industries in both regions worth hundreds of millions of euros annually [
1,
2]. The species was selected for Atlantic European planting in the early twentieth century because of its exceptional productivity under the cool, oceanic conditions that prevail across much of Ireland and Britain. At its best, Sitka spruce in Ireland can sustain mean annual volume increments exceeding 20 m
3 ha
−1 yr
−1, making it among the most productive temperate conifers in the world outside its native range [
3]. This productivity depends critically on a good match between provenance origin and planting environment. The interaction of these two elements is put under additional stress through the changing climate.
The challenge facing Sitka spruce management is fundamentally a temporal one. Trees planted today will not reach commercial maturity until the 2060s or 2080s, and the climatic conditions they will experience over their lifetimes are expected to diverge substantially from the current conditions. Modelled projections for Ireland and Britain under medium and high emission scenarios indicate warmer summers, more variable precipitation, and increased risk of late spring frost and summer drought stress; all conditions that could affect the suitability of provenances selected under historical climate guidelines [
4]. Because forestry requires long-term planning and investment, provenance selection is effectively a long-term bet on future conditions. Getting that bet right requires a better mechanistic understanding of how genetic variation in Sitka spruce is structured along climatic gradients in the native range, and how that structure is connected to performance in European planting environments.
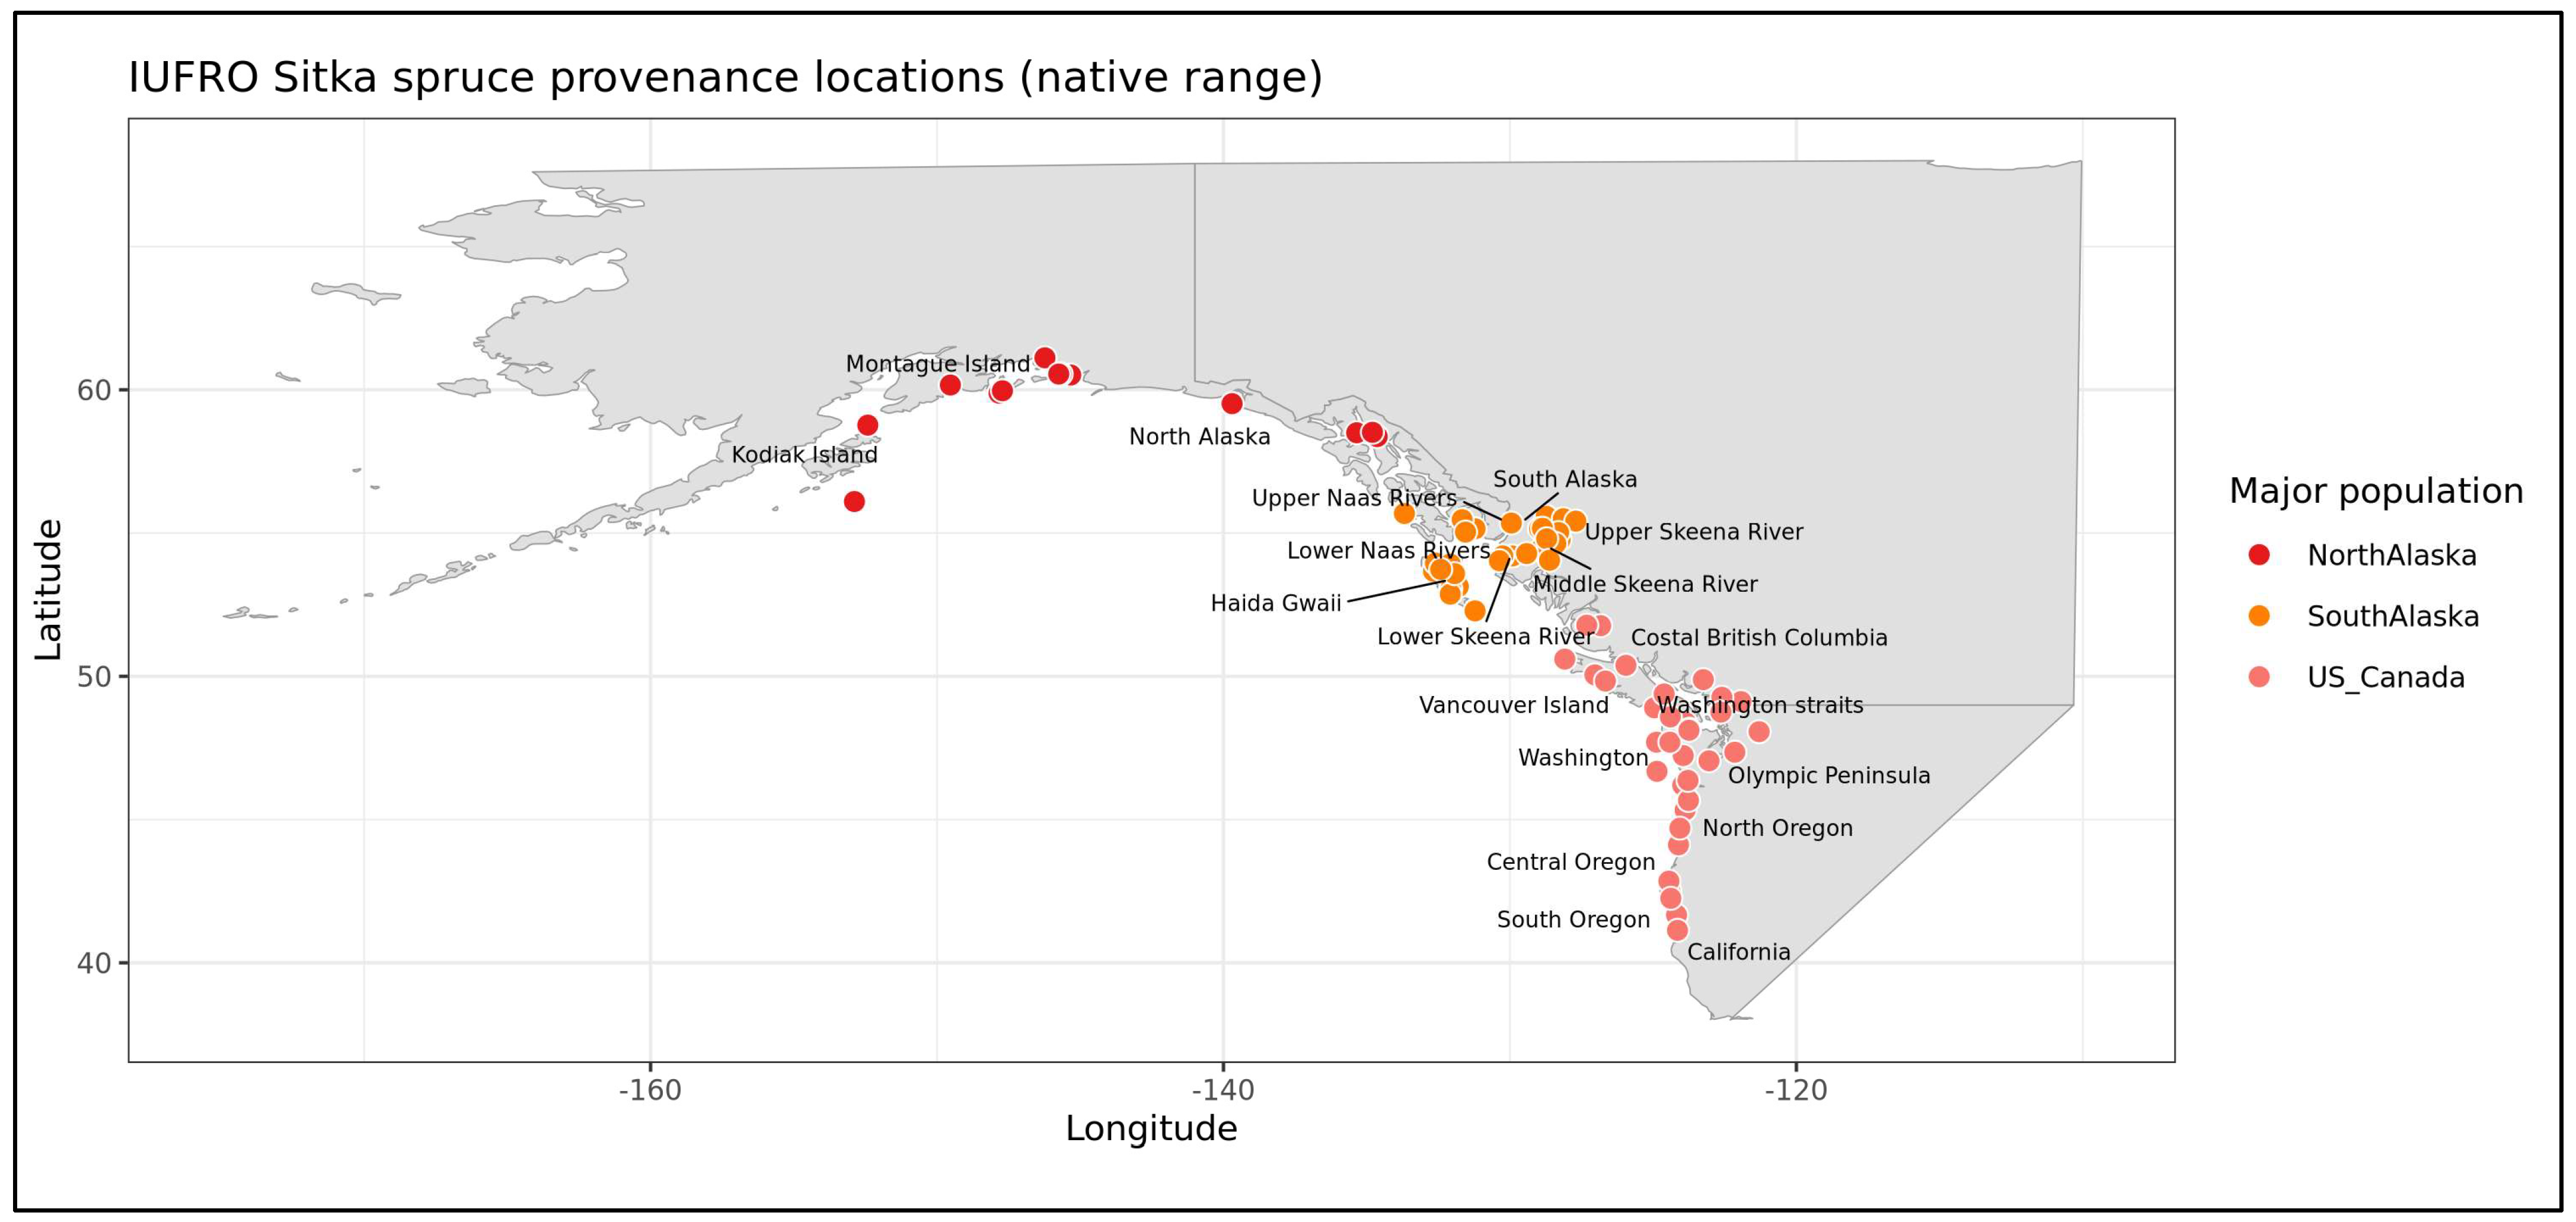
The native range of Sitka spruce extends for approximately 3000 km along the Pacific coast of North America, from Kodiak Island, Alaska (approximately 57° N) south to California (approximately 39° N) [
5,
6]. The distribution range is narrow, rarely exceeding 100 km inland, and is strongly oceanic throughout, reflecting its sensitivity to continentality and its dependence on the temperature-buffering influence of the Pacific. Despite this shared maritime character, the range spans an extraordinary latitudinal gradient in temperature, precipitation, and seasonality. In coastal Alaska, mean annual precipitation can exceed 3000 mm yr
−1, mean January temperatures remain above freezing across much of the range, and temperature seasonality is low. Moving south through British Columbia, Washington, Oregon, and into California, the climate becomes progressively warmer and drier, the growing season lengthens, and temperature seasonality increases as the summer dry season becomes more pronounced [
7]. Island populations, including those on Haida Gwaii, Kodiak Island, and Montague Island, experience particularly extreme maritime conditions and show distinctive patterns of genetic differentiation consistent with isolation and drift as well as possible environmental selection [
6].
This range-wide gradient in climate has long been recognised as a key driver of genetically based differences between Sitka spruce provenances. Common garden studies conducted in Europe from the 1950s onwards documented substantial variation in growth rate, phenology, frost hardiness, and wood properties among provenances, with northern and island seed sources generally growing more slowly but exhibiting greater frost tolerance than southern or mainland sources [
8,
9]. These results supported a model in which Sitka spruce populations have differentiated along the native range climate gradient, with northern populations carrying alleles favouring survival under cold and short-season conditions and southern populations carrying alleles associated with faster growth and longer phenological activity. The mechanistic and genomic basis of this differentiation, however, has remained largely unexplored.
The International Union of Forestry Research Organisations (IUFRO) established a coordinated Sitka spruce provenance experiment using seed collected across the native range in 1968 and 1970 [
10]. Material from 80 native-range provenances was established at common garden sites across Europe beginning in 1975, making this one of the longest-running and geographically broad conifer provenance experiments in existence. The Irish planting, at the John F. Kennedy Arboretum, Wexford (52.3° N, 6.9° W), represents a particularly valuable common garden because it has been maintained for over 50 years, allowing the full expression of provenance differences across most of the rotation. The Wexford site has a mean annual temperature of approximately 10 °C, annual precipitation of ca. 1050 mm, and a strong oceanic climate [
11]; broadly comparable in character to the maritime regions of the native range, but warmer and drier than coastal Alaska and wetter than coastal California (
Figure 1).
Genotyping-by-sequencing (GBS) data from the Irish IUFRO planting were reported in 2022 [
10], and documented genome-wide genetic diversity and population structure across the collection. That study recovered the broad geographic signal expected from the native range and identified strong genetic distinctiveness of island populations, particularly Haida Gwaii. It also established NCBI BioProject PRJNA852515 as a public resource. The present study utilises data from that work, asking whether the genomic structure of the collection is shaped by climatic gradients and whether these genomic-climatic signals are predictive of performance in a European common garden experiment.
The integration of genome-wide marker data with environmental gradients offers a powerful approach to identifying the climatic drivers of genomic differentiation and to predicting the consequences of climate change for local adaptation [
12,
13]. Gradient forest (GF) is a nonlinear, machine-learning approach that models the relationship between allele frequency and environmental gradients across a set of loci, generating predictor importance scores that quantify which environmental variables are most associated with genomic turnover and a transformed environmental space in which similar genomic compositions cluster together [
14,
15]. Genomic offset (calculated as the Euclidean distance in GF-transformed environmental space between current and projected environments) has emerged as a useful summary statistic for quantifying the degree to which a population’s allele frequencies are mismatched to its environment, and has been applied across a range of tree species as an index of climate vulnerability [
16,
17].
One important limitation of using genomic offset is that it does not directly predict fitness; it is a relative measure of genomic-climatic distance that must be validated against empirical performance data to be ecologically interpretable. The IUFRO common garden at Wexford provides exactly this validation opportunity [
18]. Because all 79 provenances were grown under identical site conditions for over 50 years, provenance-level differences in height, diameter, and stem quality reflect inherited genetic differences rather than site effects. Therefore, correlating genomic offset with these performance best linear unbiased estimators (BLUEs) provides a direct empirical test of whether the genomic-climatic framework captures biologically relevant variation in Sitka spruce.
This study uses the IUFRO Sitka spruce genomic resource, together with provenance-origin climate data and mature-tree performance BLUEs from the Wexford common garden, to test the following hypotheses:
Climatic gradients from the native range explain a significant component of genome-wide allele frequency variation, after accounting for population structure and geographic separation.
Temperature seasonality and annual precipitation are the most biologically meaningful climatic predictors of genomic turnover, reflecting the maritime specialisation of P. sitchensis.
Genomic differentiation is primarily polygenic, meaning that multi-locus summaries are more informative than individual candidate loci for describing climatic adaptation signals.
GF-derived genomic offset is negatively associated with provenance-level growth and quality performance at Wexford, providing empirical support for the biological relevance of the genomic climatic framework in this species.
These results are discussed in the context of climate adaptation and how they help inform planting decisions in regions under future Atlantic European conditions.
3. Results
3.1. The IUFRO Collection Spans the Full Climatic Breadth of the Sitka Spruce Range
The 80 provenances in the IUFRO collection represent the full climatic and geographic range of Sitka spruce, from the maritime islands of the Gulf of Alaska in the north to the transitional Mediterranean-maritime boundary in northern California in the south. Annual precipitation at provenance origin ranges from around 700 mm yr
−1 in the driest southern California localities to over 4000 mm yr
−1 in the wettest Alaskan coastal sites. Temperature seasonality spans from below 400 in the most oceanic Alaskan island locations to above 800 in more continental interior British Columbia [
7]. These gradients translate into fundamentally different ecological contexts for Sitka spruce growth: northern island provenances experience short growing seasons, perennial cloud cover, and very little summer drought risk, whereas southern mainland provenances encounter longer growing seasons, warmer and drier summers, and greater interannual climate variability. The Wexford IUFRO common garden, with its cool maritime climate, sits climatically between the most maritime Alaskan conditions and the warmer, more seasonal southern portion of the range.
After strict genotype filtering, the analysis retained 1106 of the 1177 sampled individuals and 31,049 SNPs, aggregated to 79 provenance-level observations. A sensitivity analysis using a relaxed SNP missingness threshold (≤30%) retained 36,523 SNPs and produced nearly identical predictor importance rankings (Pearson r > 0.99 between branches; supplement), confirming that the results are robust to the choice of missingness threshold. The strict filters were, however, used in all subsequent analyses for consistency.
3.2. Genomic Turnover Across the Native Range Reflects Its Long Coastal Gradient
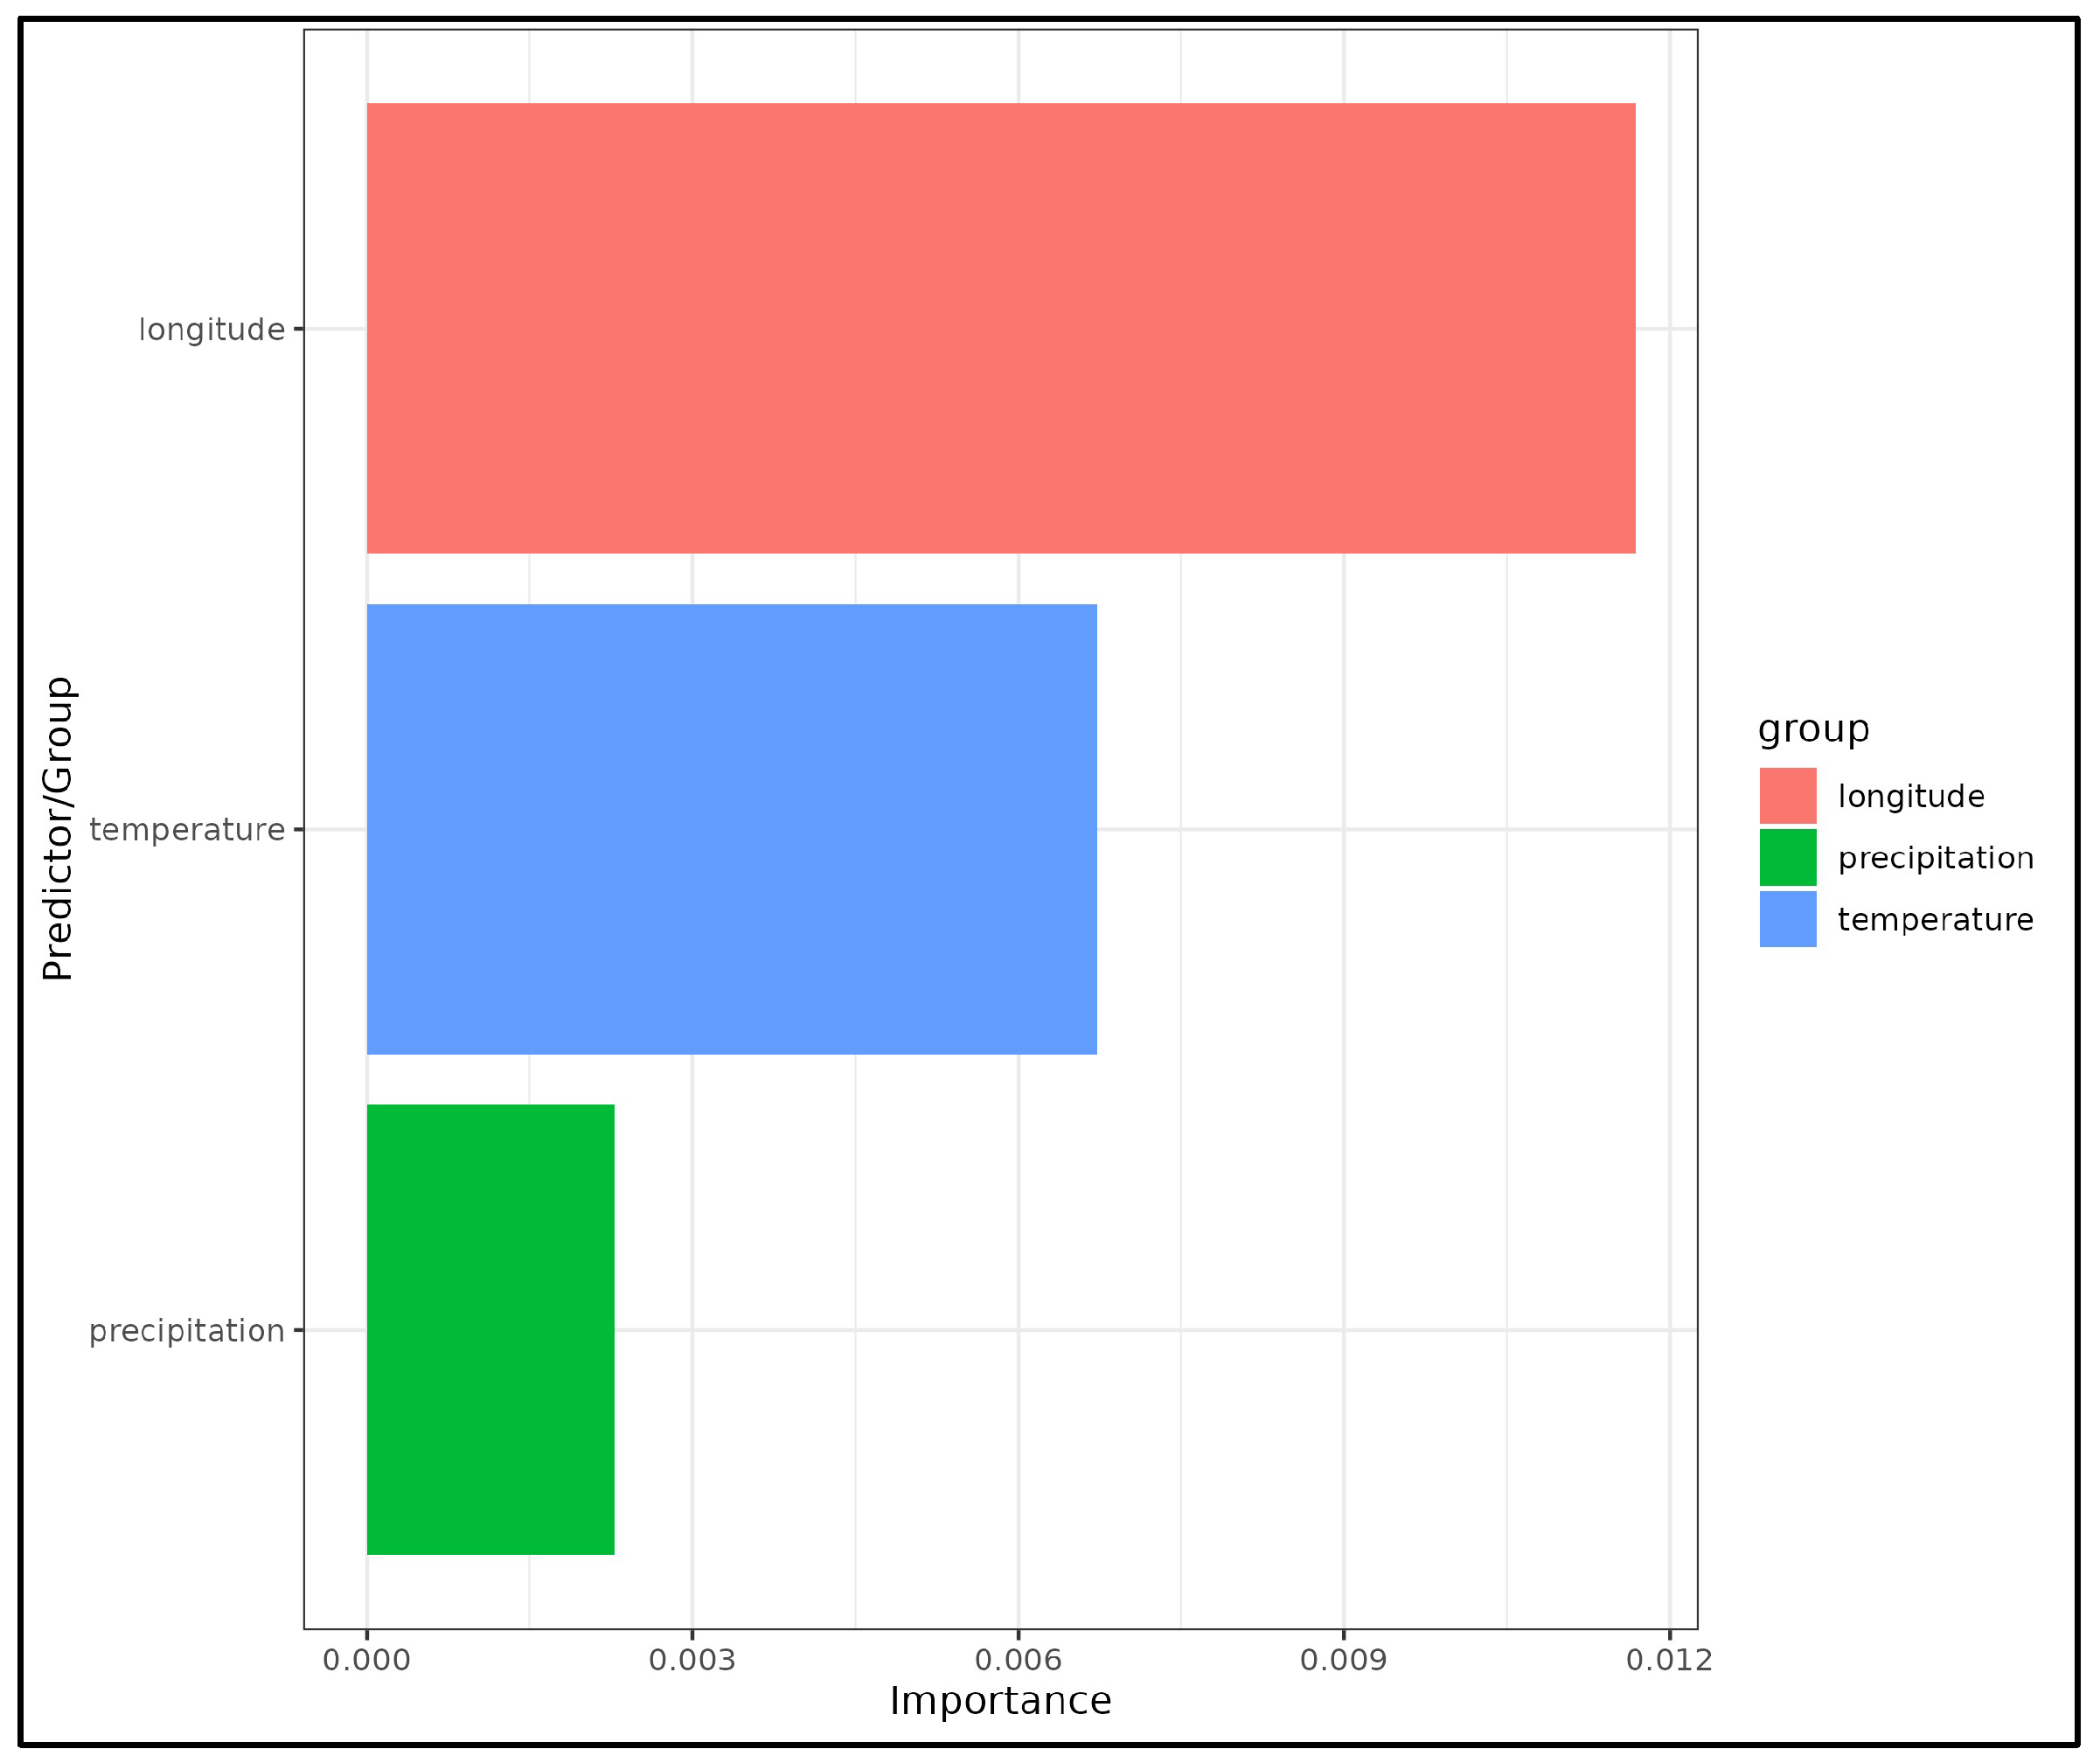
Gradient forest analysis across the 79 retained provenances identified Longitude as the strongest predictor of genomic turnover (mean R
2 importance = 0.01168), with Temperature Seasonality second (0.00672) and Annual Precipitation third (0.00228) (
Figure 2). The dominance of longitude reflects the fundamental structure of the Sitka spruce range: a long, narrow coastal strip in which geography, post-glacial history, and climate are tightly correlated along the north–south axis. The GF-transformed ordination separated Alaskan and island provenances strongly from Oregon and California populations, with British Columbian provenances distributed across an intermediate zone.
Although Longitude captured the largest share of genomic turnover, this result does not straightforwardly contradict Hypothesis 2. Longitude in this system functions as a composite proxy for the full suite of geographic, demographic, and historical processes that differentiate Alaskan from Californian provenances, including post-glacial recolonisation history, island isolation by marine barriers, and the northwest-to-southeast orientation of the native range coastline, rather than a purely geographic signal. Critically, Longitude also best resolves the island–mainland contrast: the major archipelago populations (Haida Gwaii, Kodiak, and Montague Island) lie substantially further west than adjacent mainland provenances at similar latitudes, and because these island populations are among the most genomically distinct in the IUFRO collection, a predictor that separates them from mainland sources accumulates disproportionately high GF importance. In this context, Longitude’s dominance reflects dataset geometry and demographic history as much as it does the primacy of geographic isolation over climate as a driver of adaptation. Temperature, Seasonality and Annual Precipitation each contributed independently after controlling for geography. This is biologically coherent: Sitka spruce is a maritime specialist, and the within-range gradient from hypermaritime Alaska to more seasonally variable Oregon and California represents genuine differentiation in the climatic conditions experienced across the species lifespan. Variance partitioning confirmed that population structure and longitude together explained the largest share of genome-wide variance (adjusted R
2 ≈ 3.08% for structure alone after conditioning on environment and longitude), with climate variables explaining a smaller but testable independent fraction (adjusted R
2 ≈ 0.20% for environment after conditioning on geography and structure). While these fractions are modest in absolute terms, they are consistent with expectations for a landscape genomic study of a large genome outcrossing conifer: adaptive differentiation at any single locus is subtle, and the total adaptive signal is distributed across tens of thousands of sites [
31,
32].
3.3. Climate Gradients Explain a Significant Multivariate Component of Allele Frequencies
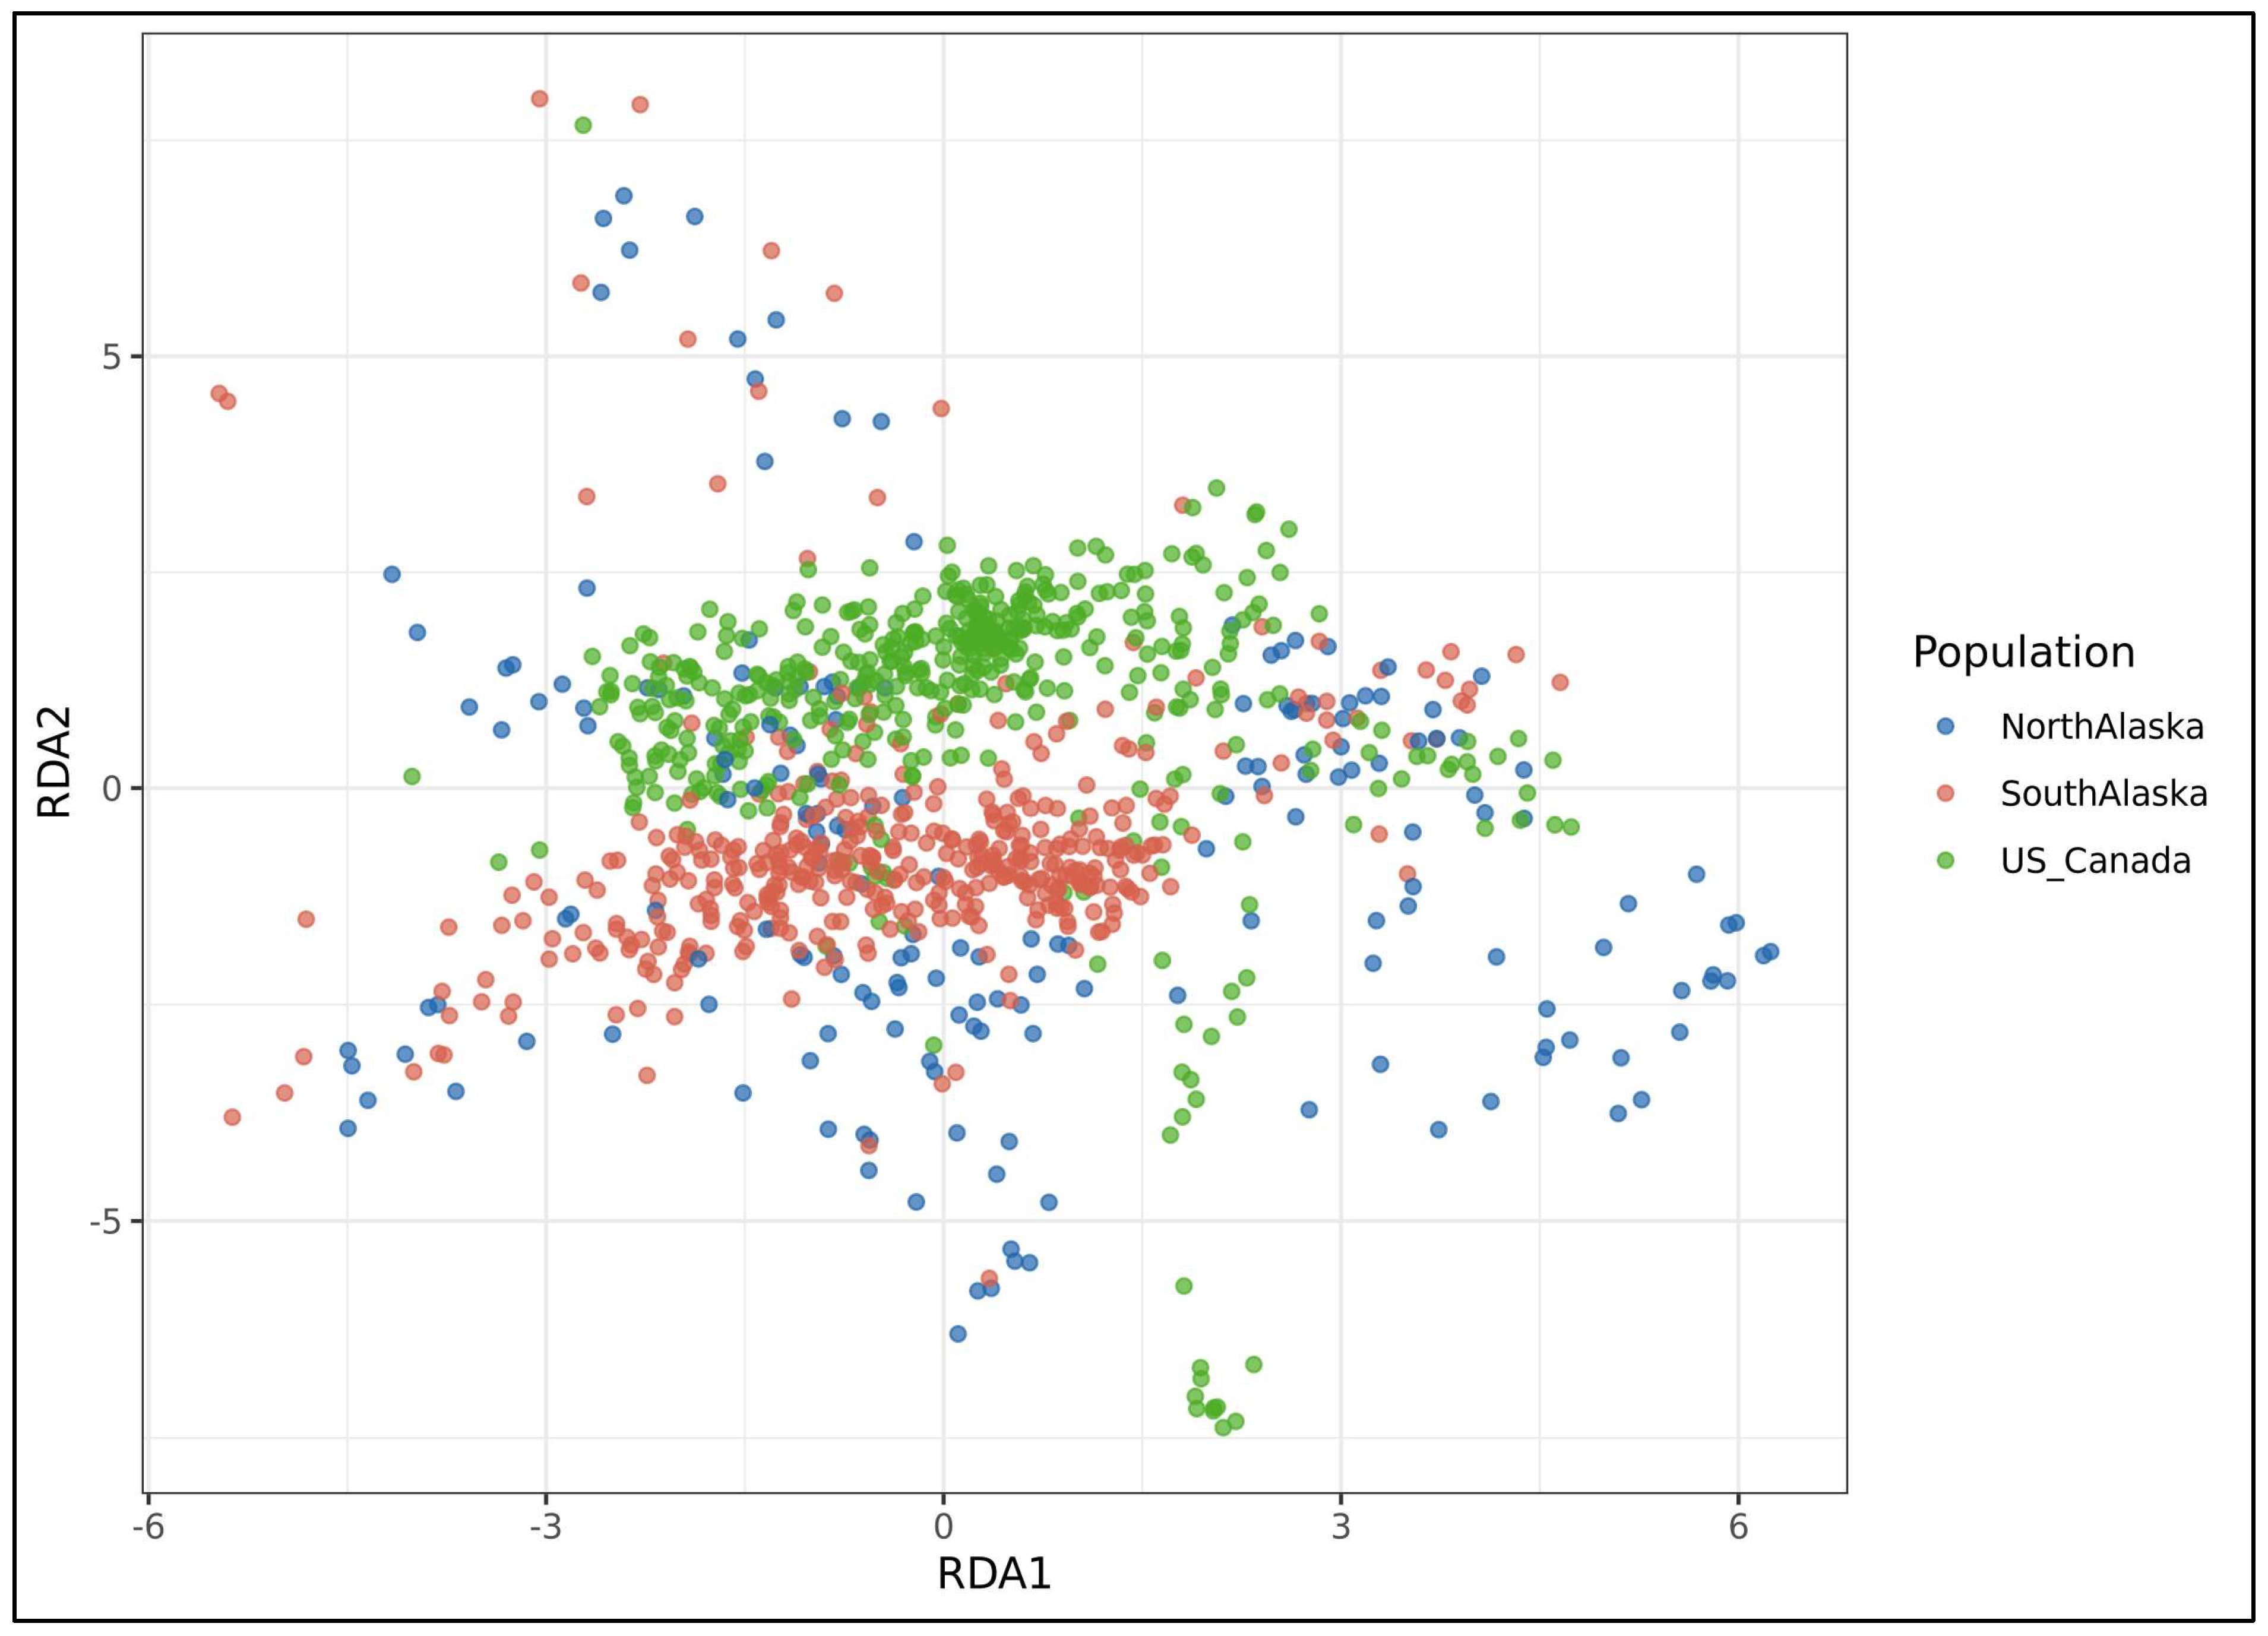
Redundancy analysis conditioned on ancestry principal components (PC1–PC3) identified a significant multivariate association between allele frequencies and the selected environmental predictors (F = 8.679,
p = 0.001, 999 permutations). The RDA biplot showed provenance ordination broadly consistent with the GF turnover pattern: Alaskan and island provenances separated from Oregon and California populations along axes reflecting temperature seasonality and precipitation. Both RDA axes were individually significant (
p = 0.001), indicating that the climate-genome relationship is expressed along more than one dimension of allele-frequency variation (
Figure 3).
LFMM identified 140 SNP-predictor associations at q ≤ 0.10 across the three environmental predictors, while RDA identified 469 SNPs with extreme loading z-scores (|z| ≥ 3.0). Together, these methods recovered 608 unique environment-associated candidate SNPs. However, only one SNP (Ps-1r180608s00050901:55515_A) was detected by both LFMM and RDA. This low cross-method overlap is a biologically expected result. Local climate adaptation in outcrossing conifers with very large genomes (the Sitka spruce genome is approximately 20 Gb) is believed to be primarily polygenic, with many loci of individually small effect distributed across the genome [
33]. GBS datasets, which sample a small fraction of the genome at low and uneven coverage, are poorly powered to recover the same adaptive loci across different analytical frameworks [
19,
34]. The single consensus SNP and the broader candidate set should therefore be treated as hypothesis-generating resources for future targeted genotyping or functional study, not as a validated list of adaptive variants.
3.4. High-Latitude and Island Provenances Show the Greatest Genomic-Climatic Displacement
GF-derived genomic offset, calculated as the Euclidean distance in transformed environmental space between each provenance’s current environment and a within-dataset shifted environment, showed a clear geographic pattern across the 79 provenances (mean offset = 0.00889; range 0.00659 to 0.01288) (
Figure S2). The highest offset values were concentrated in the northernmost and most island-associated regions of the native range (
Table 2). Kodiak Island had the highest mean offset (0.01175), followed by Montague Island (0.01161) and North Alaska (0.01062). These are among the most climatically extreme locations in the native range: Kodiak Island receives over 1500 mm of rainfall annually, has mean January temperatures only slightly below freezing, and experiences temperature seasonality that is among the lowest in the entire range. The allele frequencies of trees from these locations reflect selection history under these conditions, placing them furthest from the centre of the genomic-climatic space defined by the full collection.
The lowest offset values were found in Oregon and California provenances. Central Oregon (mean offset = 0.00669), North Oregon (0.00683), and California (0.00715) provenances are climatically closer to the centroid of the fitted genomic-climatic space, likely because the more temperate, seasonally variable conditions of the southern range are less extreme along the axes that drive turnover. These provenances cluster more closely in GF-transformed space, reflecting the lower rate of allele frequency change along the temperature and precipitation gradients in the southern portion of the range.
The pattern of genomic offset across regions echoes the classical provenance trial literature: island and northern mainland sources have long been observed to grow more slowly in European common gardens than southern mainland sources, while showing superior frost tolerance. The genomic offset analysis provides a genome-wide, multivariate basis for understanding provincial offset, as these provenances carry allele frequency distributions that reflect their adaptation to a very different climatic context than Atlantic Europe, or indeed the southern part of the native range.
3.5. Genomic-Climatic Mismatch Predicts Provenance Performance in Common Garden Experiment
The most direct test of the biological relevance of genomic offset came from its correlation with provenance-level performance BLUEs measured at the Wexford common garden after over 50 years of growth (
Table 3). Genomic offset was negatively correlated with all three measured traits. The strongest association was with height BLUE (Spearman ρ = −0.659, q ≈ 0), meaning that provenances with the greatest genomic-climatic displacement tended to produce the shortest trees. DBH BLUE showed a comparable association (ρ = −0.449, q = 7.73 × 10
−5), and stem quality BLUE, though weakly associated, was also significantly negatively correlated with offset (ρ = −0.348, q = 0.002). Translated into ecologically concrete terms: the provenances that are most genomically “out of place”, such as those from Kodiak Island, Montague Island, and North Alaska, are also, on average, the slowest growing and lowest quality at the Wexford common garden. Conversely, Oregon and California provenances, which show the lowest genomic offset, tend toward better performance on the growth metrics. This pattern is consistent with the expectation that genomic composition, shaped by natural selection along native-range climate gradients, predicts the degree of climatic misfit at a planting site, and that this misfit is associated with measurable growth penalties.
3.6. Polygenic Multilocus Scores Outperform Individual Candidate SNPs in Trait Prediction
Multi-locus polygenic scores, calculated by aggregating candidate SNP dosages across the full union candidate set, were strongly associated with both environmental gradients and performance traits. The union score was most strongly predicted by longitude (R2 = 0.777, q = 6.41 × 10⁻²⁶), confirming that the aggregate genomic composition of provenances is tightly coupled to their position along the range-wide geographic-climatic gradient. Polygenic scores were also significantly associated with DBH BLUE (R2 = 0.540, q = 2.83 × 10⁻¹³) and height BLUE (R2 = 0.518, q = 2.85 × 10⁻¹³), associations substantially stronger than those of any individual candidate SNP.
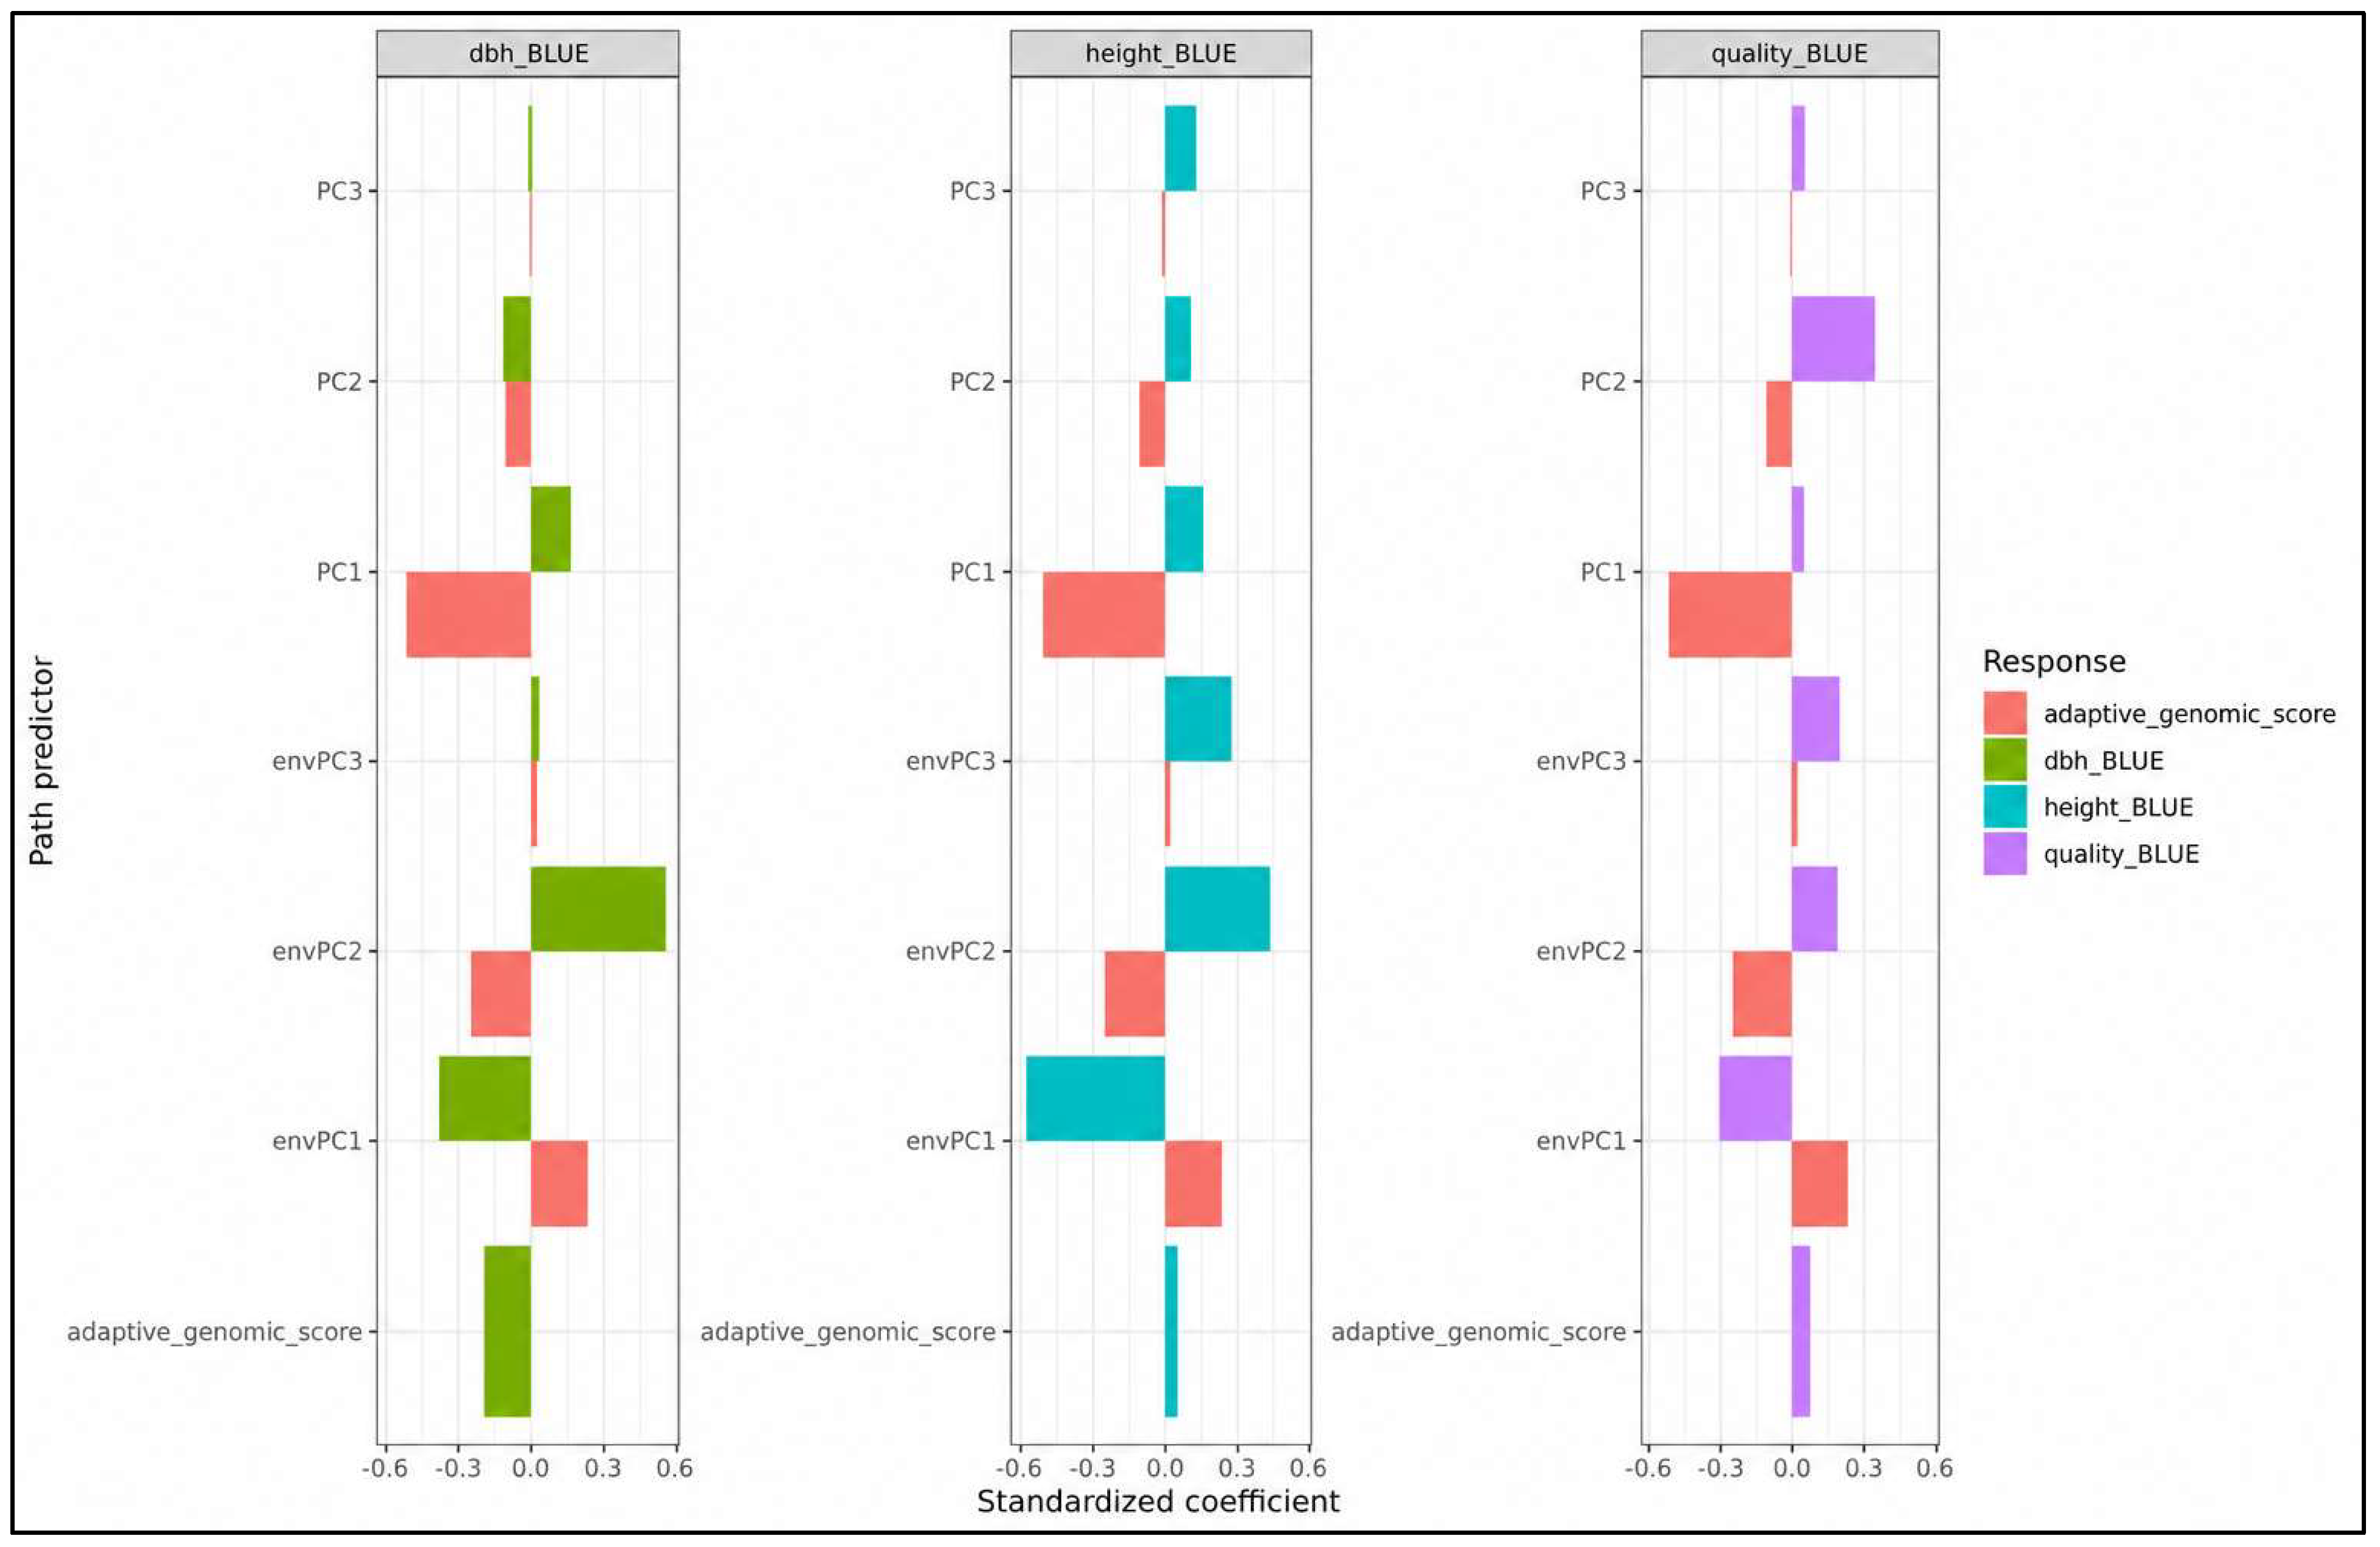
The contrast between the cross-method candidate overlaps (one shared SNP) and the strong multi-locus associations reinforces a polygenic interpretation. Each individual SNP captures only a tiny fraction of the allele-frequency variation that is structured along climate gradients, and the analytical power to recover the same loci across methods is correspondingly low. But when hundreds of such loci are aggregated into a score, the noise cancels, and the signals emerge clearly. Polygenic score analyses using random SNP sets of matched size showed that candidate-based scores consistently outperformed random sets, although the difference was modest, as is typical when a large fraction of the genome is weakly but consistently differentiated along range-wide gradients. Exploratory piecewise structural equation models, fitted to test whether environment, genomic composition, and provenance performance form a coherent indirect-effect path, explained 89.8%, 71.6%, and 40.9% of the variance in height, DBH, and quality BLUEs, respectively. However, the direct path coefficient from adaptive genomic score to trait was not consistently large once environmental and structure covariates were included, indicating that much of the trait-genome association is mediated through shared geographic and climatic gradients rather than through a clean causal genomic pathway. This result is expected given the observational design and the polygenic nature of the traits.
3.7. CMIP6 Genomic Offset Projections for the European Planting Region and the North American Source Range
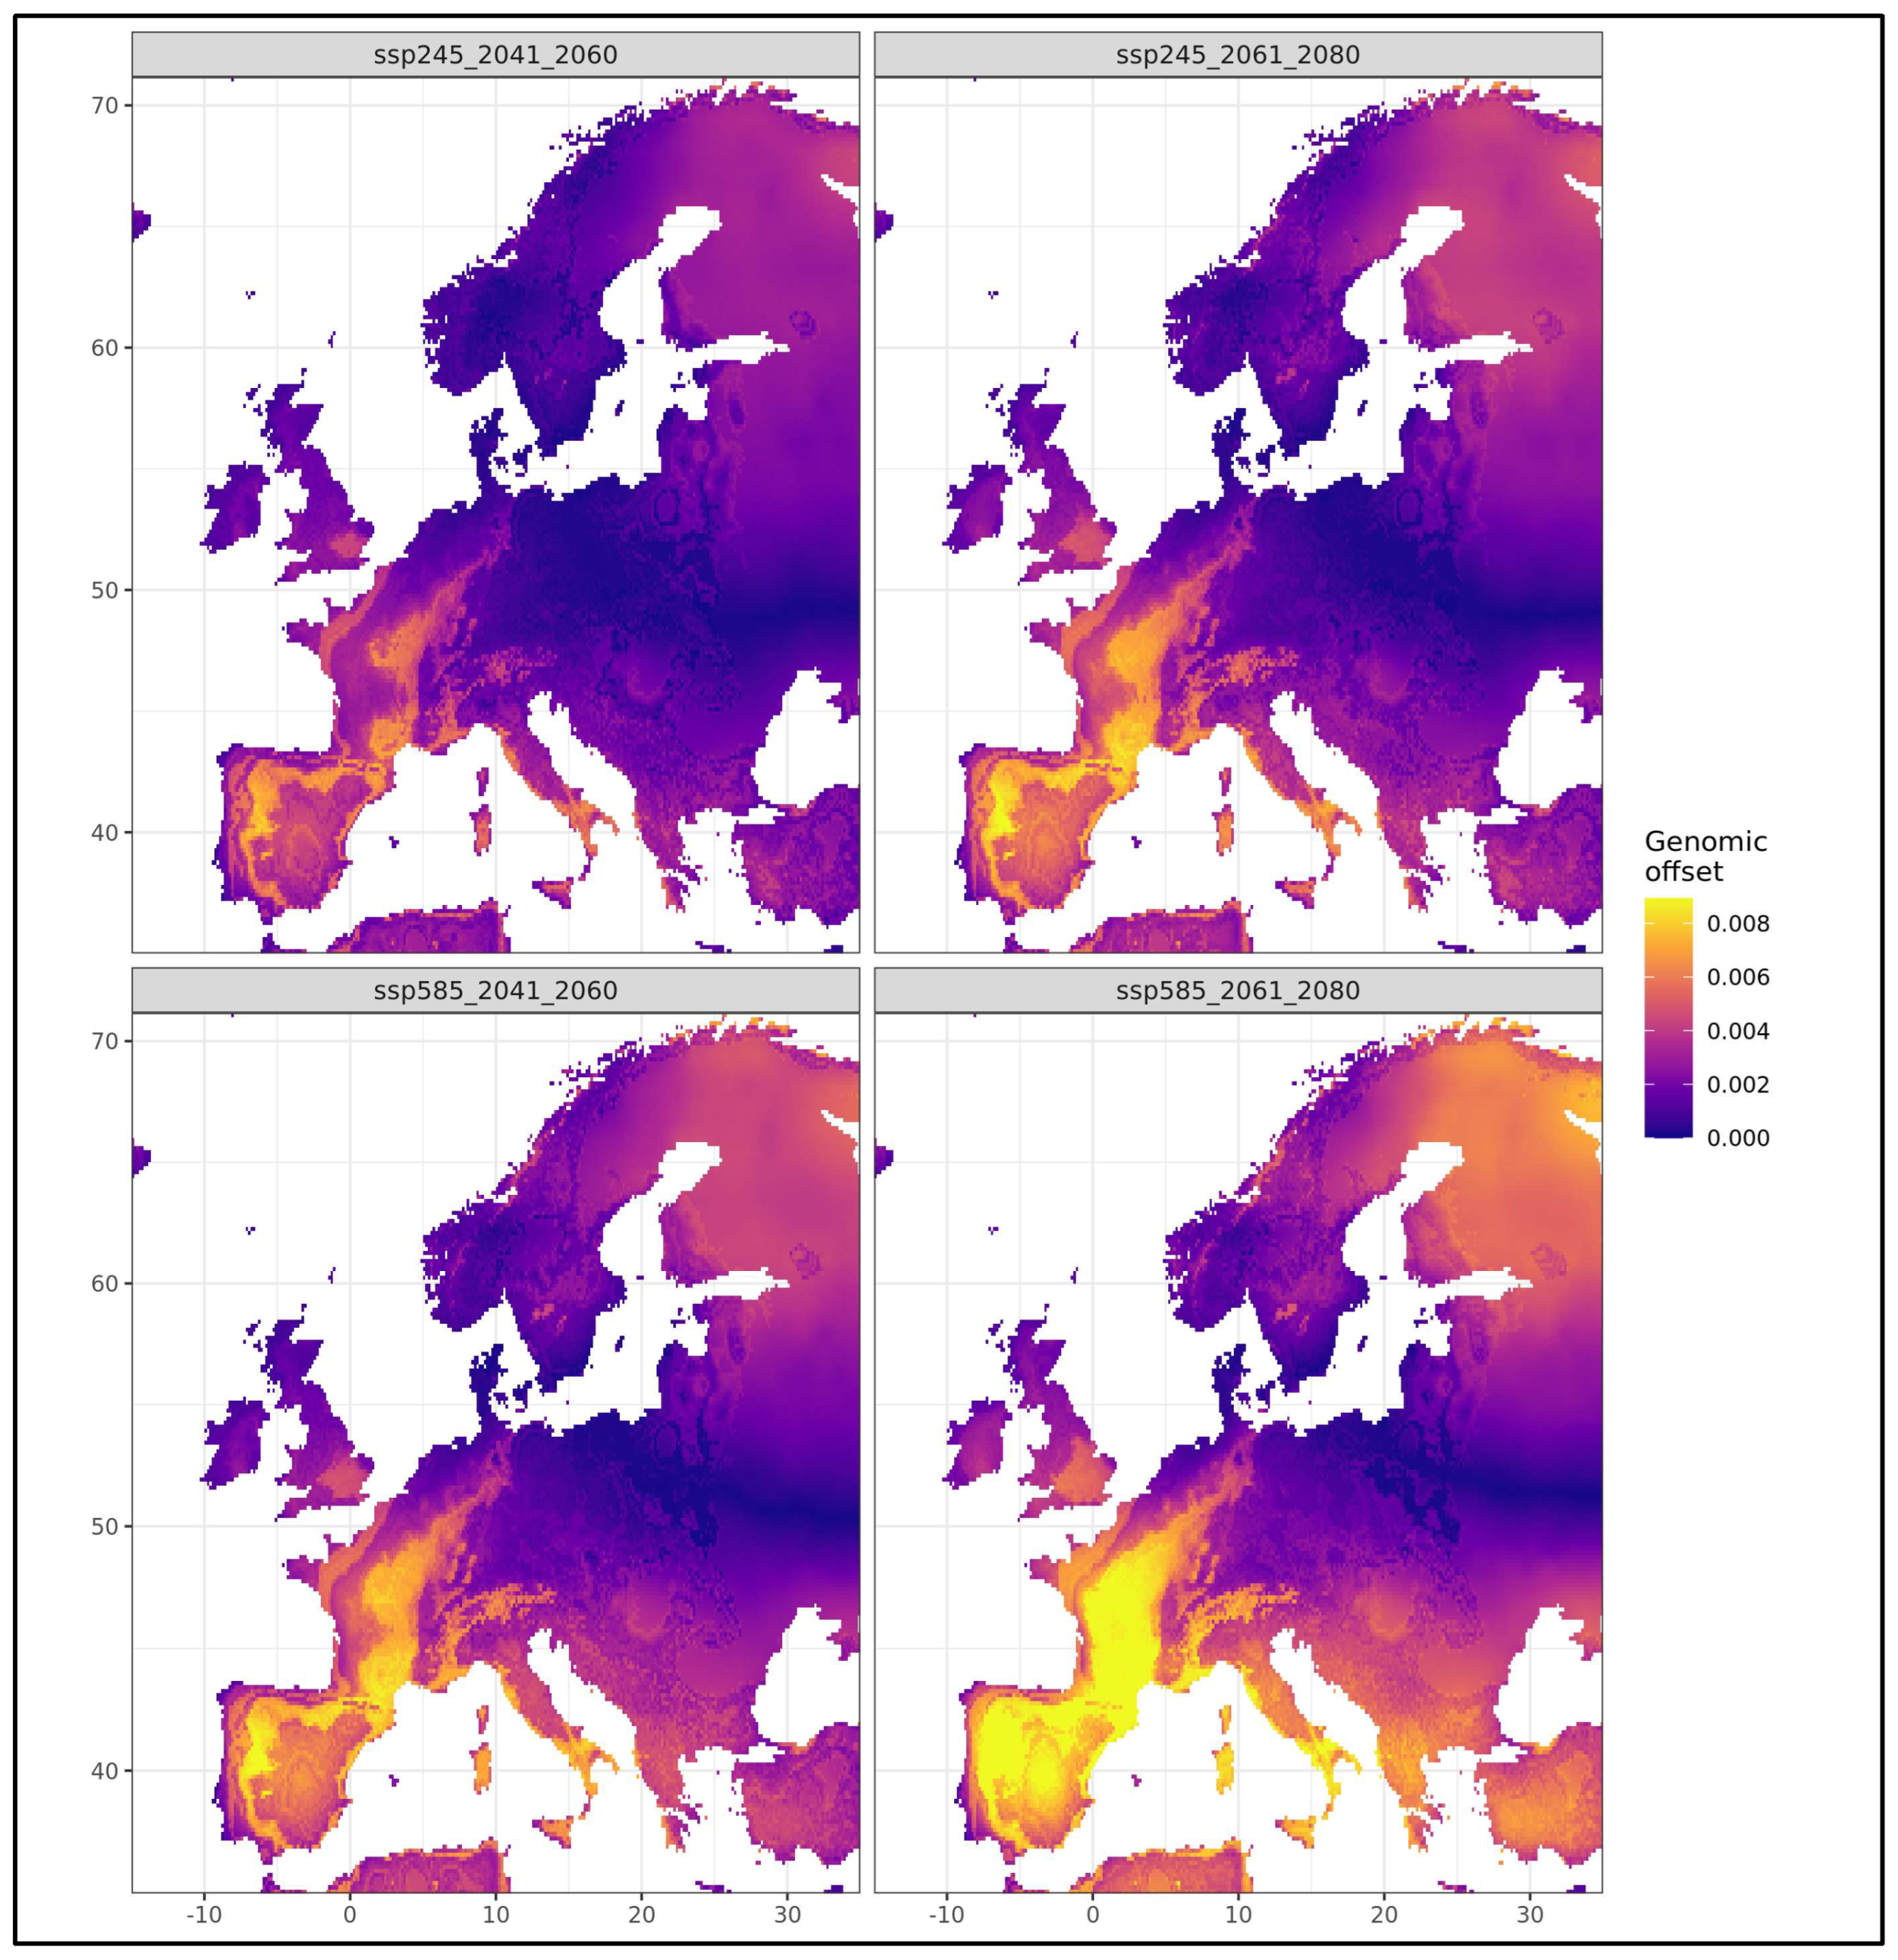
Projecting the fitted GF model onto the European planting region under the CMIP6 ensemble climate produced genomic offset estimates that were consistent across scenarios and ecologically interpretable relative to the within-dataset baseline. Under the moderate scenario SSP2-4.5 at mid-century (2041–2060), the mean European offset was 0.00211 (max 0.00817), rising to 0.00274 (max 0.00915) by 2061–2080 (
Figure 4;
Table 4). Under the high-emission scenario SSP5-8.5, the mean offset reached 0.00308 at 2041–2060 and 0.00409 (max 0.01236) by 2061–2080. All four scenarios produced a consistent geographic pattern, with higher offsets in continental and southern European grid cells and lower offsets in Atlantic coastal regions and central/eastern European grid cells, reflecting the strong oceanicity gradient in projected temperature seasonality change.
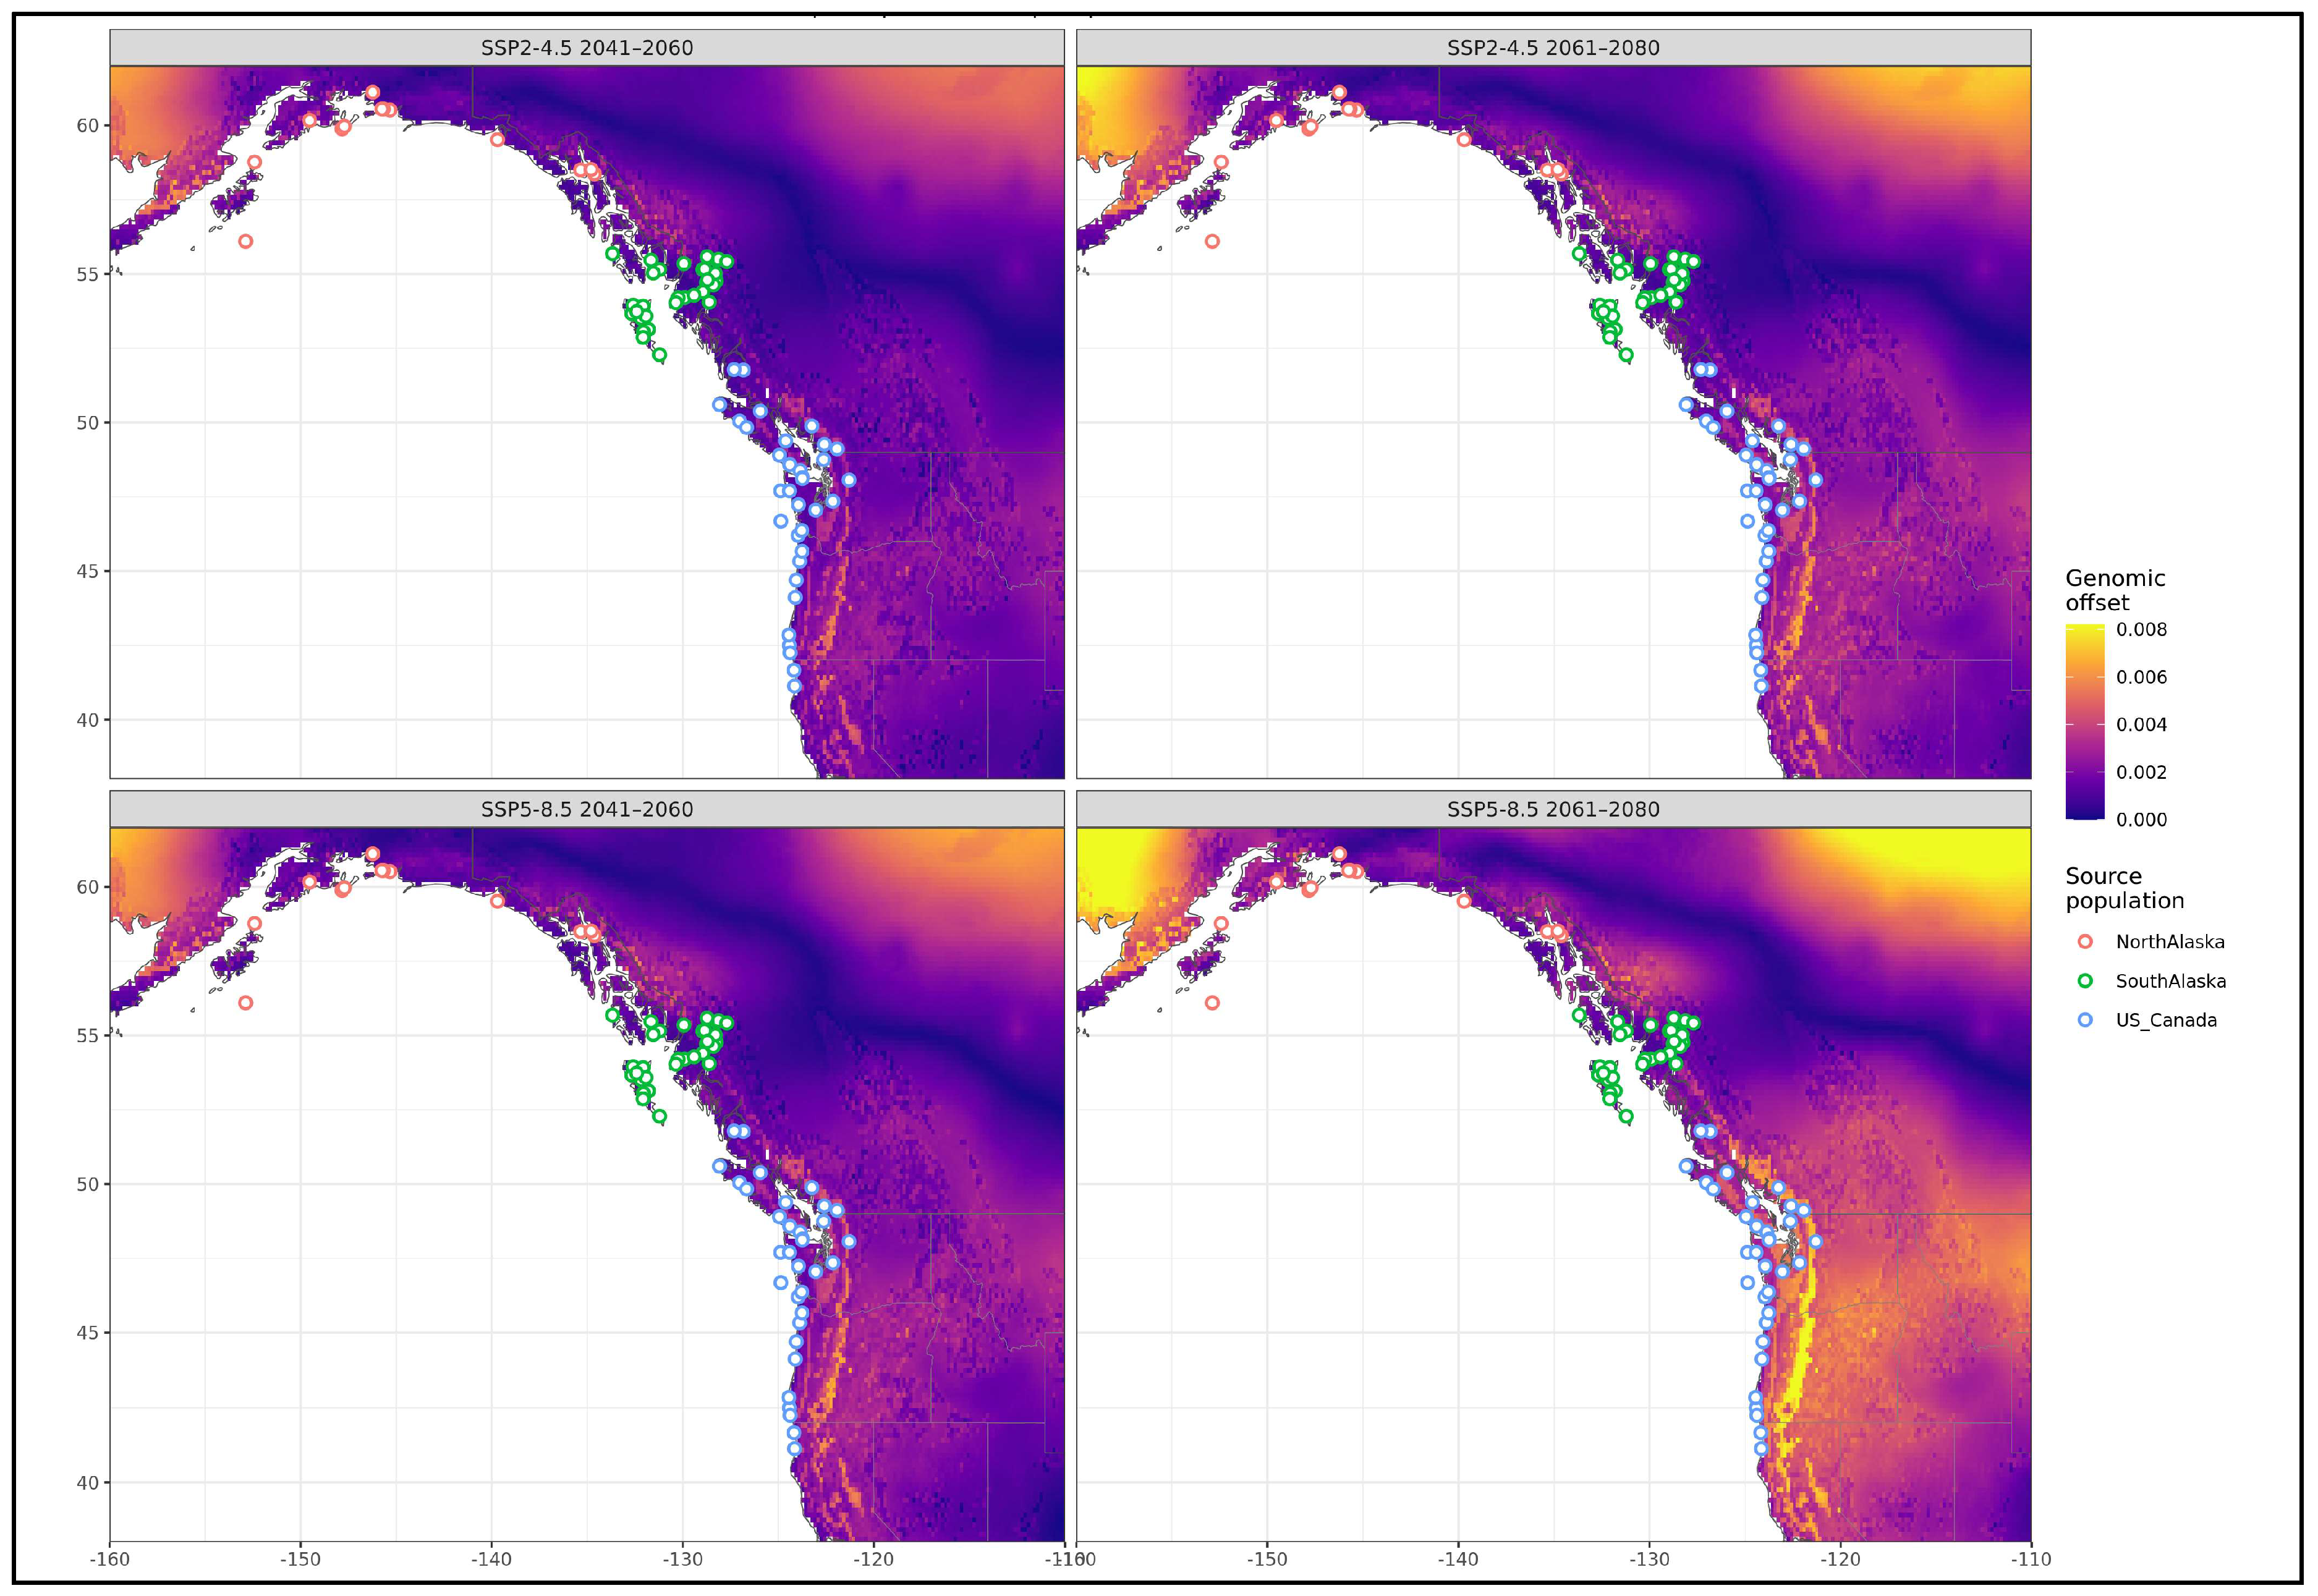
The North American source range showed a broadly similar but uniformly lower offset across all scenarios (
Figure 5). Under SSP2-4.5 2041–2060, the mean NA offset was 0.0019 (max 0.0068); under SSP5-8.5 2061–2080, it reached 0.0035 (max 0.0110). In every scenario, the European planting region had a higher mean offset than the North American source range, indicating that the European grid experiences greater projected climate-driven genomic mismatch than the populations from which the GF model was trained.
Expressed relative to the within-dataset baseline (mean 0.00889, range 0.00659–0.01288), the European CMIP6 offsets represent 24% of the baseline mean under SSP2-4.5 mid-century and 46% under SSP5-8.5 late-century. Critically, the maximum European offset under SSP5-8.5 2061–2080 (0.0124) approaches the upper tail of the source population offset distribution (maximum 0.01288), meaning that the most climate-exposed European planting cells under the worst-case scenario are projected to lie at the outer edge of the genomic-climatic variation characterised by the Sitka spruce source collection.
Climate delta maps showed that the primary driver of increased offset across Europe was rising temperature seasonality (mean increase under SSP5-8.5 2061–2080 of approximately 50–100 °C × 100 units across much of the continent), rather than precipitation change, which was more spatially heterogeneous, and in some Atlantic regions showed modest increases rather than decreases. This pattern is consistent with the GF model, placing the highest importance on Temperature Seasonality as a climate predictor of genomic turnover in the native range. Under moderate GCM scenarios, European sites remain within the climate space represented by southern source populations, suggesting that provenances from Oregon, Washington, and southern British Columbia are climatically matched to near-future European conditions.
4. Discussion
4.1. A Polygenic Genomic-Climatic Signal Along the Sitka Spruce Range Gradient
The central finding of this study is that genomic variation across the IUFRO Sitka spruce provenance collection is structured along the climatic and geographic gradients of the native range, and that the degree of a provenance’s genomic-climatic displacement predicts its growth performance in a European common garden (Wexford). This is not a simple correlation between geographic distance and performance; it reflects a multivariate genomic signal, embedded in tens of thousands of loci, that is coherently aligned with the temperature, precipitation, and geographic gradients that shape the native range. The dominance of longitude in the GF analysis should be interpreted carefully and correctly. It does not mean that longitude drives genomic differentiation. Rather, longitude in this dataset is a proxy for the full complex of ecological, demographic, and historical processes that differentiate Alaskan populations from Californian ones. These include post-glacial recolonisation history (Sitka spruce recolonised northward from glacial refugia south of the ice sheets, generating a gradient of ancestry from south to north), isolation of island populations by marine barriers, the longitudinal gradient in climate, and potentially historical differences in disturbance regime and competitive environment [
5,
6,
9,
10]. A gradient forest cannot distinguish between these mechanisms. What it establishes is that allele frequencies change nonlinearly and systematically along this gradient and that the pattern is not solely an artefact of demographic history; Temperature, Seasonality and Annual Precipitation contribute independently to turnover after accounting for longitude. The emergence of longitude rather than latitude can be explained by two features of the Sitka spruce range. First, the native range follows a coastline that runs northwest to southeast: from the Gulf of Alaska through Haida Gwaii and coastal British Columbia to Oregon and northern California. Because the coast curves progressively eastward as it runs south, latitude and longitude are highly collinear along the range transect, and both variables were placed in the same geographic predictor group during collinearity screening. Only one representative was retained for GF fitting. Second, and critically, longitude better captures the distinctiveness of the archipelago populations than latitude does. The major island groups (Haida Gwaii, Kodiak Island and Montague Island) lie substantially further west than the adjacent mainland coast at similar latitudes. Latitude would position Haida Gwaii provenances close to nearby BC mainland provenances at comparable degrees north, whereas longitude separates them clearly. Because island populations are among the most genomically distinct groups in the IUFRO collection, a predictor that resolves island–mainland contrasts will accumulate higher GF importance than one that does not.
Temperature Seasonality is, mechanistically, the most compelling climatic predictor in this analysis. Sitka spruce is a textbook maritime specialist: it cannot tolerate the temperature extremes of continental climates, and its growth and survival are tightly linked to the narrow, year-round thermal window of oceanic conditions. The gradient from maritime Alaska (low seasonality, buffered temperatures) to more seasonally variable Oregon and California is directly relevant to physiological traits, including cold hardiness, bud phenology, and drought avoidance. Genetic variation in bud set timing, which determines both frost risk and growing season length, has been shown to be strongly differentiated among Sitka spruce provenances and to respond to temperature gradients in the native range [
35]. The allele-frequency gradients captured here along the Temperature Seasonality axis are likely to include many loci involved in these phenological responses, even if individual loci cannot be resolved with confidence at current SNP marker density.
4.2. Alaskan and Island Provenances Underperform in Irish Common Garden Experiment
The negative correlation between genomic offset and provenance-level performance at the Wexford common garden is consistent with a straightforward ecological interpretation. The highest-offset provenances (Kodiak Island, Montague Island, and North Alaska) originate from environments that are climatically more extreme and more different from Wexford than any other part of the native range. Kodiak Island, for example, has an annual precipitation over three times that of Wexford, a mean summer temperature several degrees lower, and a growing season substantially shorter. Trees from Kodiak carry allele frequencies reflecting generations of selection for survival and reproduction under these conditions: early bud set to avoid autumn frost, conserved phenology tuned to a short growing season, and high carbon allocation to frost protection. At Wexford, with its warmer, longer growing season and more moderate summer climate, these traits are mismatched to the local environment. Early bud set means a shorter effective growing season. Conservative phenology means less exploitation of the relatively mild Irish autumn. The result is lower annual height and diameter increment, expressed consistently over the 50+ year period of the trial. This pattern aligns precisely with what has long been known empirically from Sitka spruce provenance trials across Atlantic Europe: the “Queen Charlotte Sound” and southern Alaskan provenances recommended for Irish and British planting are precisely those from the intermediate-offset zone in our analysis.
The quality BLUE correlation, while weaker (ρ = −0.348), adds a further dimension. Quality in conifers is related to wood density, branch characteristics, and stem form, traits that are under some genetic control [
36] and that also differ systematically among Sitka spruce provenances. Island provenances have long been noted for heavier branching and more variable stem form under European plantation conditions [
3], which may partly explain the quality offset signal.
4.3. Polygenic Adaptation and the Limits of Single-Locus Approaches
The near-complete lack of overlap between LFMM and RDA candidate SNPs (one shared locus from 608 unique candidates) (
Supplementary Table S1) is one of the clearest biological messages of this study. In a large genome, outcrossing conifer with an approximately 20 Gb genome, climatic adaptation is not expected to involve a small number of large-effect loci. Comparative studies of climate adaptation in
Picea,
Pinus,
Pseudotsuga, and related genera have consistently found that adaptive differentiation is polygenic, with many hundreds or thousands of loci each contributing a tiny fraction of the total variance in adaptive traits [
33,
37]. The GBS approach samples approximately 0.1% of the Sitka spruce genome at low and uneven coverage. Given this sparse sampling, the power to detect the same small-effect adaptive locus by two methods independently, at the q ≤ 0.10 threshold used here, is very low. Low overlap is therefore not evidence of a failed analysis; it is evidence of the expected biology.
The practical implication is that single-locus approaches are unlikely to generate reliable provenance recommendations for Sitka spruce in the near term. The polygenic score results support this conclusion from the positive direction: when many candidate loci are aggregated, the signal becomes robust (R
2 up to 0.78 for score versus longitude; R
2 up to 0.54 for score versus DBH BLUE) and biologically coherent (
Figure 6). Future studies with denser marker panels, for example, using the emerging Sitka spruce reference genome and targeted sequence capture, may be able to resolve individual adaptive loci more reliably. Until then, multi-locus genomic summaries and GF-derived offset provide the most appropriate tools for characterising and comparing provenance-level genomic-climatic profiles.
4.4. Significance of Results for Sitka Spruce Management in a Changing Climate
The results of this study are relevant to two interrelated management questions: (1) which provenances are best suited to current Atlantic European planting conditions? and (2) how might that suitability shift as the climate changes? The CMIP6 offset projections now allow both questions to be addressed with external future climate data rather than a synthetic within-dataset shift.
For current conditions, the genomic offset analysis confirms that the provenance groups currently recommended for Irish and British planting occupy an intermediate genomic offset zone in the IUFRO collection, neither the extreme Alaskan island provenances nor the driest California sources. This is consistent with their documented performance in European trials and with provenance guidance [
1,
2]. The CMIP6 projections directly address the prospective management question. Under SSP2-4.5 at mid-century (2041–2060), the mean European planting-site offset (0.00211) is approximately 24% of the mean within-source-range offset, well within the variation already represented among source populations. This is reassuring for near-term planting decisions based on current provenance recommendations: moderate warming over the next 35 years does not project European sites outside the climate envelope characterised by the GF model. Under SSP5-8.5 by 2061–2080, however, mean offset rises to 0.00409, and the most climate-exposed European cells approach the upper tail of the source population distribution (max European offset 0.01236 versus source range max 0.01288). Under this scenario, some European planting environments may be moving into a climate space that is poorly represented by any currently characterised Sitka spruce source population.
Importantly, the North American source range itself shows a lower projected offset than the European planting region under all scenarios (NA SSP5-8.5 2061–2080 mean 0.0035 versus European 0.0041) (
Figure 5). This asymmetry reflects the greater projected increase in temperature seasonality across continental Europe relative to the already-maritime North American coastal range. In practical terms, it means that the European planting environment is expected to diverge more from current Sitka spruce genomic-climatic norms than the source populations themselves, amplifying the urgency of provenance diversification for higher-emission trajectories.
The climate space analysis (
Figure 4) shows that the near-future European environment (SSP2-4.5 2041–2060) broadly overlaps with the current climate of Oregon, Washington, and southern British Columbia source populations, precisely the provenances that already show the lowest within-dataset offset and the strongest performance in the Wexford common garden. This convergence supports a clear and actionable provenance hypothesis: provenances from the Oregon–southern BC corridor, which originate from environments with higher temperature seasonality and lower annual precipitation than currently recommended northern sources, may already carry allele frequencies relevant to projected future Atlantic European conditions. Targeted assisted gene flow trials incorporating these provenances would provide a direct empirical test of this hypothesis [
38].
4.5. Limitations and Future Directions
Several important limitations constrain the inferences that can be drawn from this study. First, the BLUE–offset correlations are based on a single common garden site. Wexford is an extremely valuable resource, but replication across multiple European planting environments would strengthen the generality of the findings and permit identification of genotype–environment interactions that a single site cannot reveal [
39].
Second, the GF model was trained on provenances spanning only the North American coastal range, and the CMIP6 offset projections for the European planting region involve geographic extrapolation. Longitude, the strongest GF predictor, is far outside its training range for European grid cells. However, because within-site genomic offset compares current and future climate at the same cell, longitude is identical in both environments and contributes exactly zero to the Euclidean distance. The European projections are therefore driven entirely by changes in Temperature Seasonality and Annual Precipitation and are not contaminated by longitude extrapolation. The offset magnitudes should nonetheless be read relative to the source range baseline (mean 0.00889) rather than as standalone predictions of adaptation deficit.
Finally, the common garden material is now over 50 years old. Regeneration of the experiment from seed, incorporating advances in both genomics and climate projection, would provide an invaluable resource for the next generation of provenance research in Sitka spruce.
5. Conclusions
This study provides the first landscape genomic analysis of the IUFRO Sitka spruce provenance collection, integrating genome-wide allele frequency data with native-range climate gradients and provenance-level common garden performance. The results show that Sitka spruce provenances are genomically differentiated along with the temperature seasonality and precipitation gradients of the native range, that this differentiation is primarily polygenic, and that GF-derived genomic offset is negatively associated with growth and quality performance at the Wexford common garden. Island and high-latitude provenances show the greatest genomic-climatic displacement and the poorest performance, while Oregon and California provenances show the lowest displacement. These patterns are consistent with known trial results and with the ecology of a maritime species whose range spans a 3000 km climatic gradient.
The practical contribution of this work is not to replace the established provenance trial evidence base (decades of careful field experiments remain the gold standard for provenance recommendation) but to provide a genomic and mechanistic context for interpreting provenance performance differences and for generating hypotheses about how provenance suitability may shift as Atlantic European climates change. By combining strict genotype filtering, structure-aware landscape genomics, and long-term common garden data, this study establishes a framework for integrating molecular resources with applied forestry decisions in Picea sitchensis and, more broadly, in other conifers for which similar provenance and genomic resources exist.




 ,
,