1. Introduction
Urban forests are increasingly recognized as important components of urban green infrastructure because they contribute to ecological regulation, human well-being, and climate-related ecosystem services. They provide multiple benefits, including thermal regulation, air-quality improvement, hydrological moderation, landscape value, and carbon storage [
1,
2,
3]. For urban forestry departments, the accurate quantification of tree structure is not only a scientific issue but also a practical requirement for inventory updating, maintenance planning, risk assessment, budget allocation, and management decision-making [
4]. Among structural variables, stem volume is a basic mensurational attribute, because it provides a direct description of the woody stem component and can serve as an input for subsequent biomass- and carbon-related assessments [
5,
6]. However, stem volume should be distinguished from total tree biomass and carbon stock. Biomass and carbon estimation require additional information, including branches, leaves, roots, wood density, biomass expansion factors, and carbon concentration. Therefore, the direct objective of the present study is stem-volume estimation, while biomass- and carbon-related applications are treated only as potential downstream uses.
Classical stem-volume equations have generally been developed for trees growing in natural forests or managed stands, where stand competition, stem straightness, and height–diameter relationships are relatively regular. Urban trees often develop under markedly different conditions. Many urban trees grow in open or semi-open spaces, experience repeated pruning and crown shaping, and are affected by soil compaction, restricted rooting space, pavement, mechanical injury, irrigation, heterogeneous maintenance regimes, and urban heat-island effects [
7,
8,
9]. These factors can modify stem taper, crown architecture, vertical growth, and diameter growth. As a result, two urban trees with a similar DBH may differ substantially in height, stem form, pruning history, and stem volume. This structural heterogeneity limits the direct transferability of forest-derived equations to urban trees and highlights the need for species-specific equations developed under urban growing conditions [
10,
11,
12,
13,
14].
In traditional forest mensuration, robust stem-volume equations are usually based on a sufficiently large set of destructively sampled trees, for which the reference volume can be calculated from sectional measurements. Diameter variables remain the core predictors in volume and biomass modelling, and model performance often improves when tree height is included appropriately [
15]. Previous biomass and volume-model studies in Beijing have also emphasized the importance of local species- or genus-specific equations for tree assessment [
16,
17]. Recent studies further indicate that urban tree allometric relationships can vary with species traits, land-use background, and local growing conditions, limiting the applicability of generalized equations [
18,
19,
20]. However, extensive destructive sampling is difficult to implement in urban environments, because urban trees have landscape, ecological, social, and safety-related value, and tree felling is constrained by management permission, cost, public acceptance, and site conditions. Consequently, urban tree volume studies need to balance the statistical advantage of destructive reference data with the operational feasibility of non-destructive measurement.
Recent advances in non-destructive observation and proximal sensing have created new opportunities for urban tree measurement. Urban tree assessment has gradually moved from conventional visual interpretation and manual measurement toward image-based and point-cloud-based three-dimensional reconstruction [
21,
22,
23,
24]. Handheld photogrammetry has shown potential for estimating tree dimensions under field conditions [
25,
26]. Other approaches, including terrestrial laser scanning, unmanned aerial vehicle photogrammetry, and LiDAR-based workflows, can provide more detailed three-dimensional structural information and have been increasingly used for urban tree measurement and biomass-related assessment [
27,
28,
29,
30,
31,
32]. Nevertheless, photogrammetric tree-height measurement is not equivalent to destructive measurement. Its accuracy may be affected by crown occlusion, irregular treetops, leaning stems, complex crown architecture, pruning effects, operator experience, image acquisition geometry, and restricted sight lines in urban streets or parks. These uncertainties should be explicitly considered when photogrammetry-derived height is used in stem-volume modelling.
Despite recent progress, important gaps remain in the development and validation of stem-volume equations for urban broad-leaved trees. Spatially explicit forest-structure studies have emphasized the importance of field-measured structural information for management-oriented ecological assessment [
33,
34,
35,
36,
37]. More broadly, uncertainty in urban tree assessment arises not only from model structure but also from observation error, both of which can affect downstream biomass, carbon, and ecosystem-service estimates [
38,
39,
40]. However, relatively few studies have combined large-sample standing-tree inventories, non-destructive tree-height acquisition, species-specific stem-volume modelling, independent destructive reference validation, and explicit uncertainty propagation for dominant urban broad-leaved tree species.
Therefore, this study focused on four dominant urban broad-leaved tree species in Beijing: Quercus mongolica, Sophora japonica, Ginkgo biloba, and Populus davidiana. The specific objectives were to: (1) develop species-specific bivariate stem-volume equations using field-measured DBH and photogrammetry-derived tree height; (2) compare the bivariate equations with DBH-based linked models and ground-diameter-based chained models under different data-availability scenarios; (3) evaluate the performance of the model-assisted workflow using validation statistics, 10-fold cross-validation, Monte Carlo uncertainty propagation, and an independent destructive reference dataset of 55 felled trees; and (4) clarify the interpretation boundary of the proposed equations for urban forest inventory. In this study, DBH and ground diameter were field-measured variables, the tree height for standing trees was a photogrammetry-derived non-destructive measurement, model outputs were predicted stem volume, and section-measured stem volume from felled trees was only used as independent destructive reference validation. Biomass and carbon stock were not directly measured or modelled.
2. Materials and Methods
2.1. Study Area and Habitat Characteristics
The study was conducted across the Beijing municipal area (115.42–117.72° E, 39.39–41.03° N), covering all 16 districts. Beijing contains diverse urban green spaces embedded within highly heterogeneous built environments. Differences in green-space type, site conditions, and management regime contribute to marked variation in urban forest structure across the city, making Beijing well suited for the development of city-specific stem-volume models. In addition, the interaction between the regional climatic background and intensive urban development creates a distinctive urban growing environment that can modify tree growth trajectories, biomass accumulation, and allometric relationships. For these reasons, Beijing provides an appropriate setting for evaluating whether species-specific models and non-destructive measurement methods can improve stem-volume estimation for urban broad-leaved trees.
2.2. Sampling Design and Data Collection
To capture the structural variability of urban trees, a stratified random sampling framework was implemented using Beijing’s secondary forest inventory as the baseline data source. Stratification was designed to reduce the influence of differences in site conditions, diameter-class structure, and management history on subsequent parameter estimation and uncertainty analysis. Within this framework, 535 representative urban forestry and green-space plots were established across the city.
After field investigation and data cleaning, a total of 2679 high-quality individual-tree records were retained for analysis. The dataset comprised four dominant urban broad-leaved tree species:
Quercus mongolica (
n = 329),
Sophora japonica (
n = 810),
Ginkgo biloba (
n = 810), and
Populus davidiana (
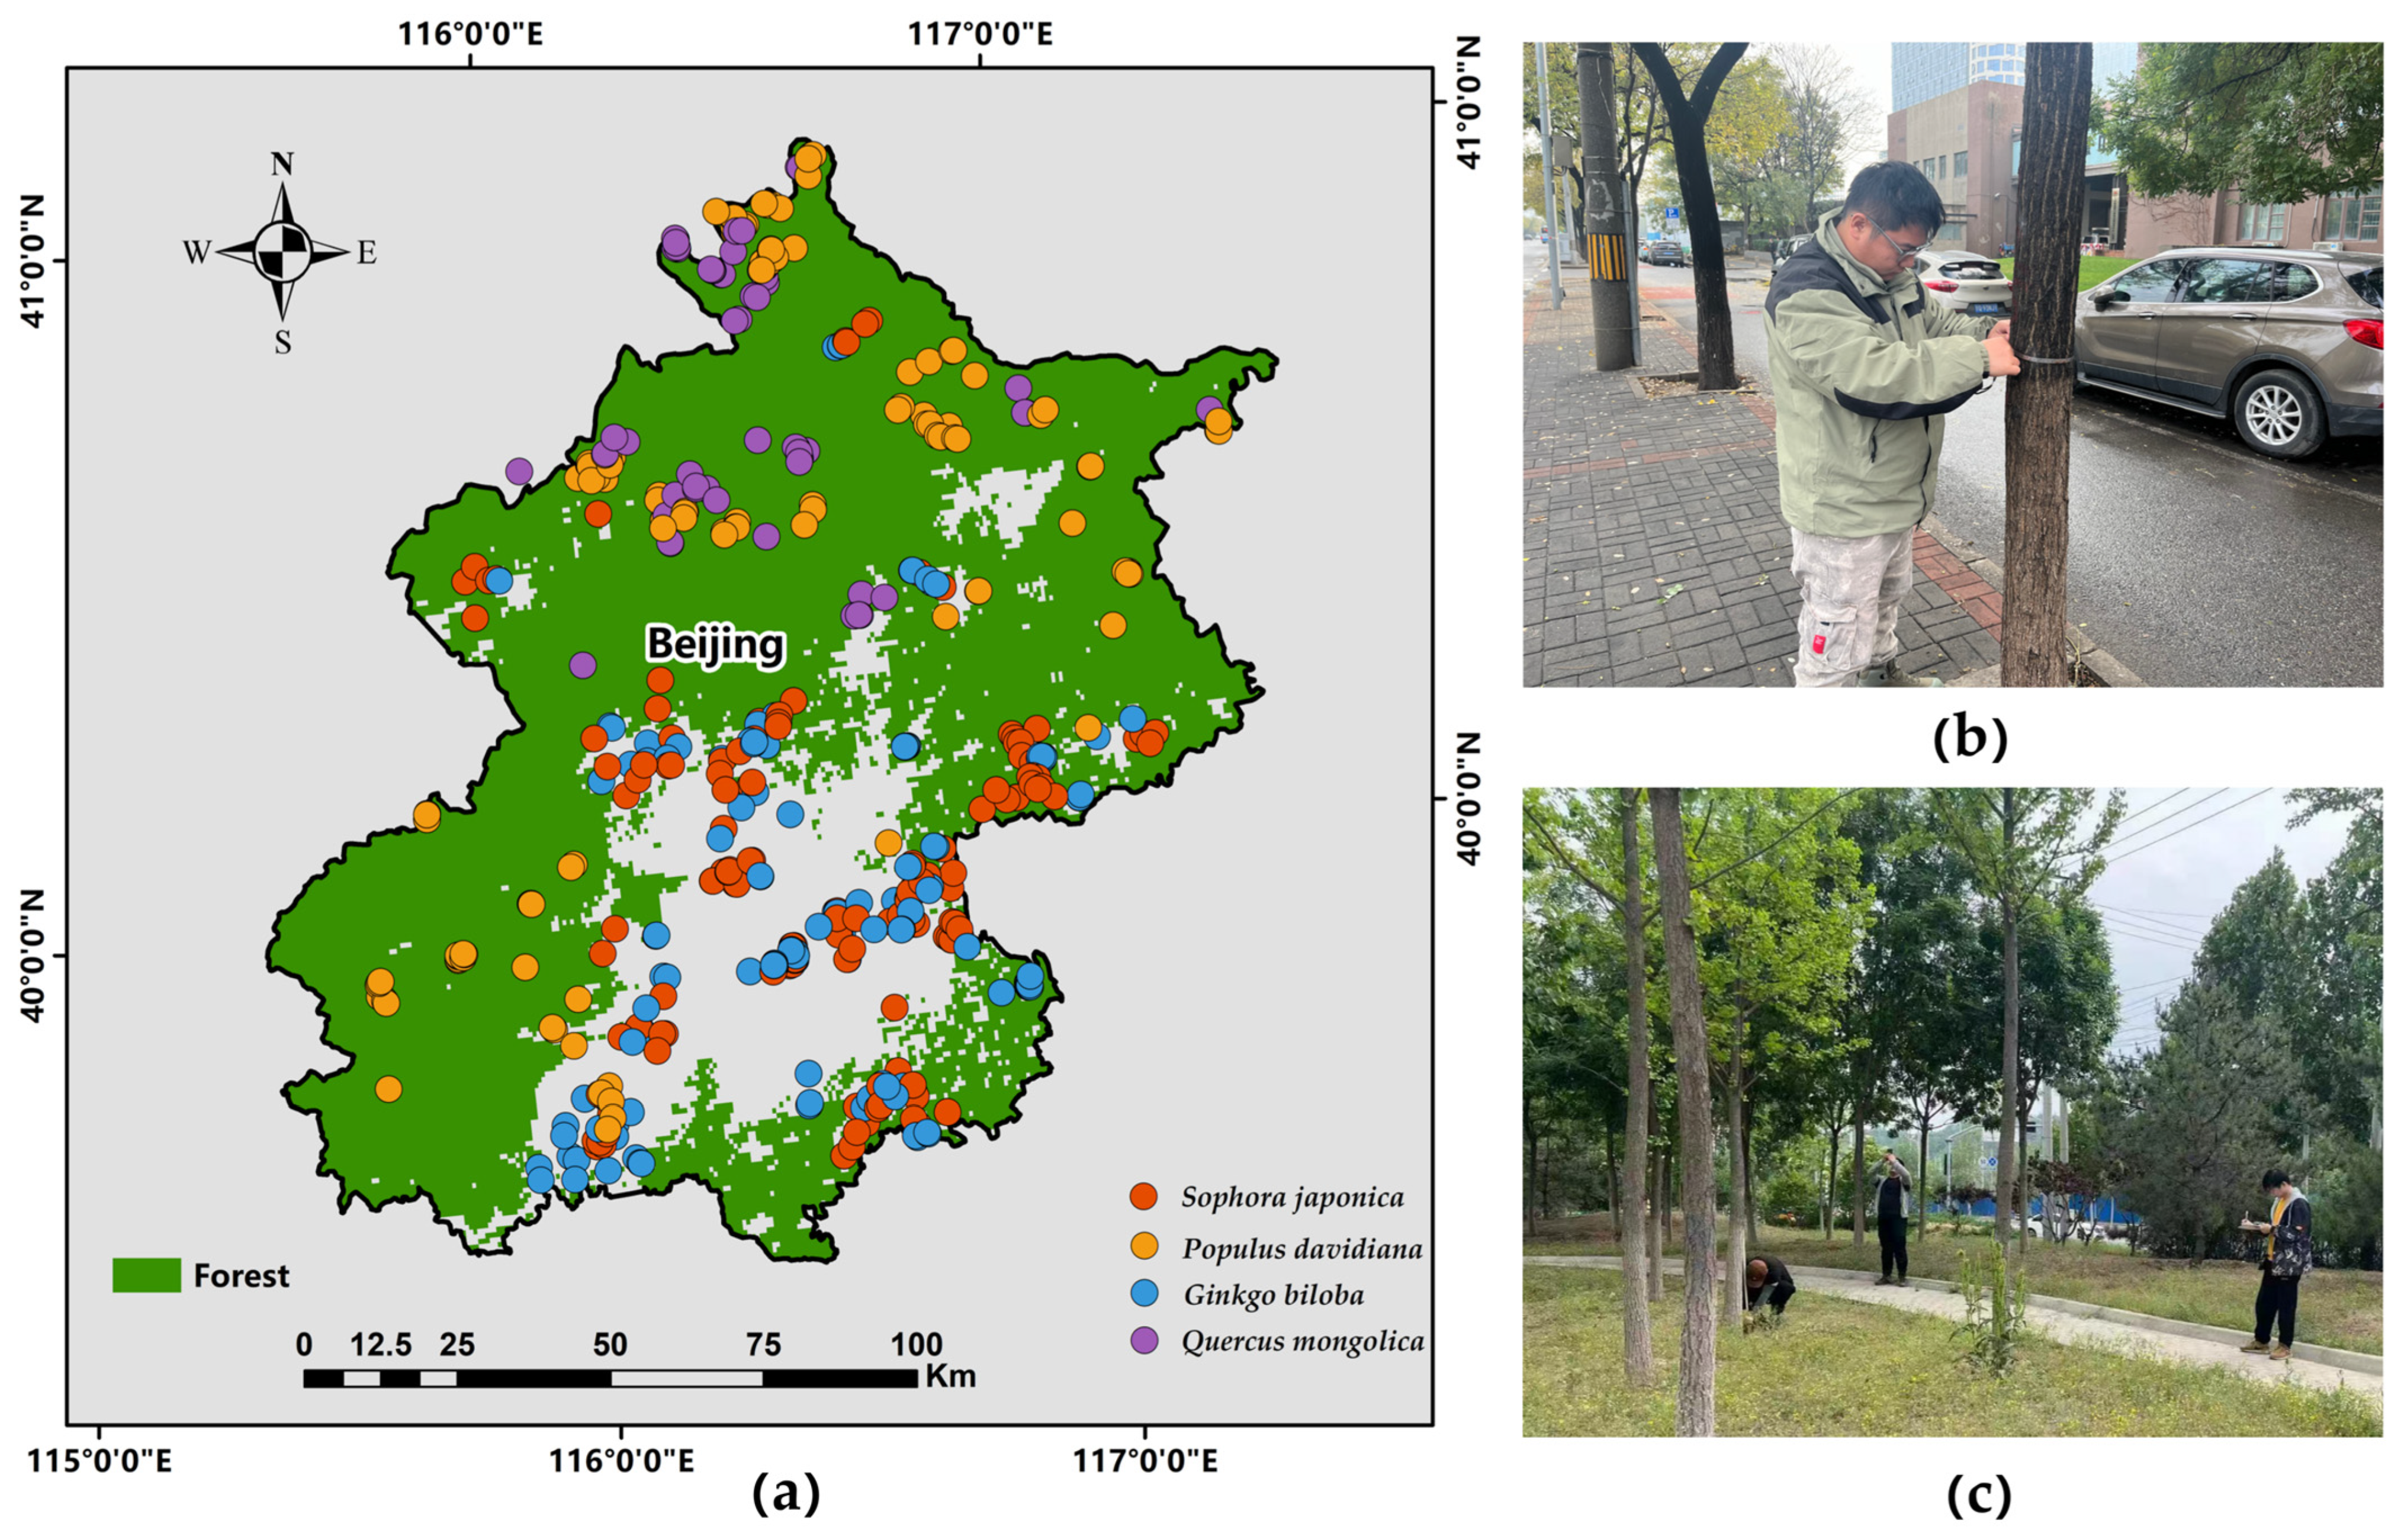
n = 730). For each species, the dataset was randomly divided into a modelling set (80%) and an independent validation set (20%) to assess model generalization and reduce the risk of overfitting. The spatial distribution of the sample plots is shown in
Figure 1, the diameter-class distribution of the sampled trees is summarized in
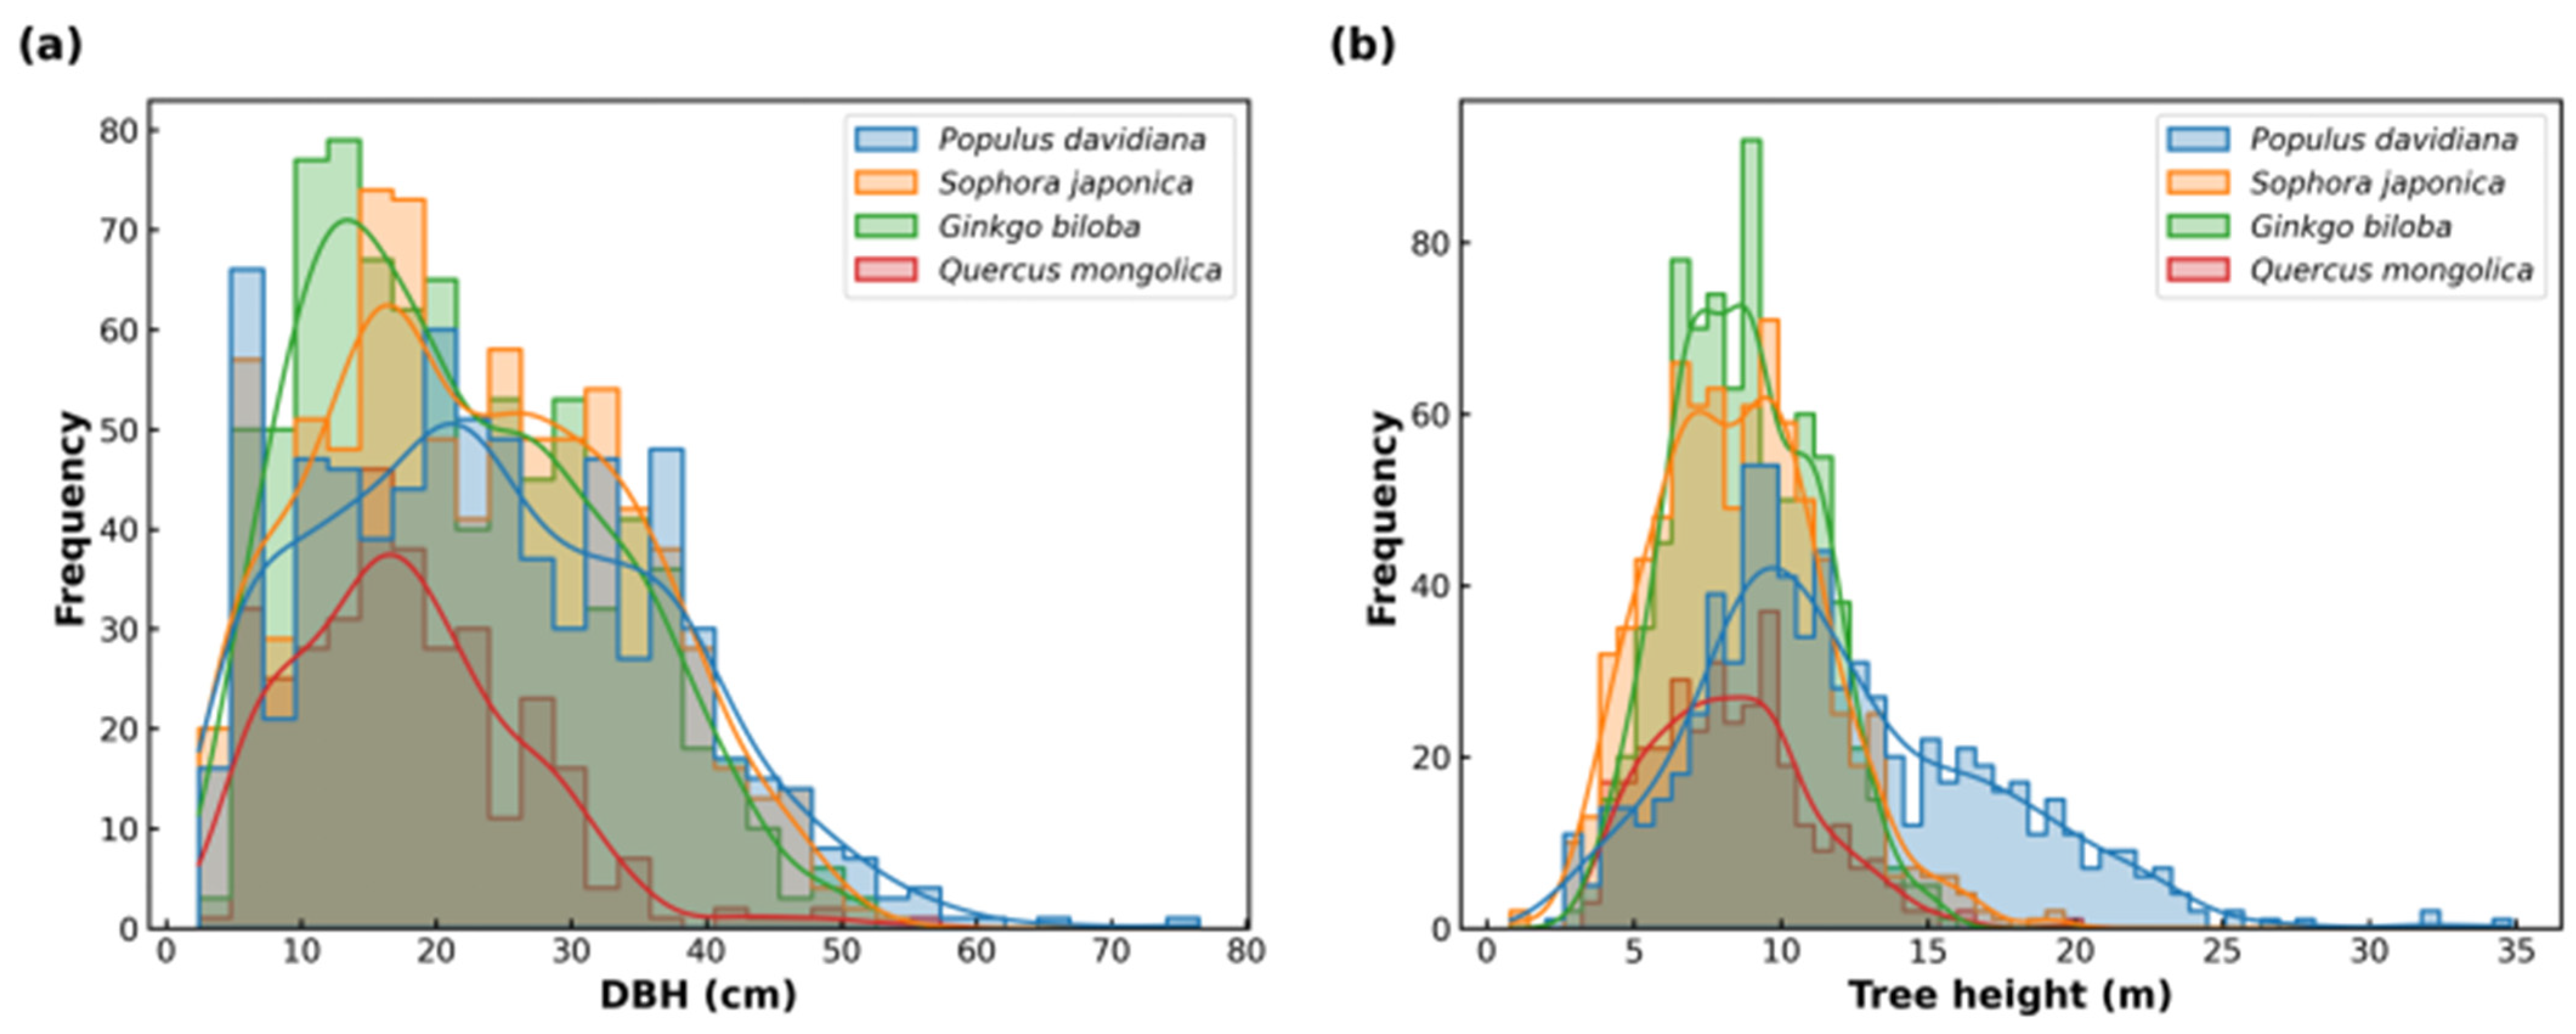
Table 1, and the DBH and tree-height distributions of the four studied species are shown in
Figure 2.
2.3. Dataset Description and Morphological Variables
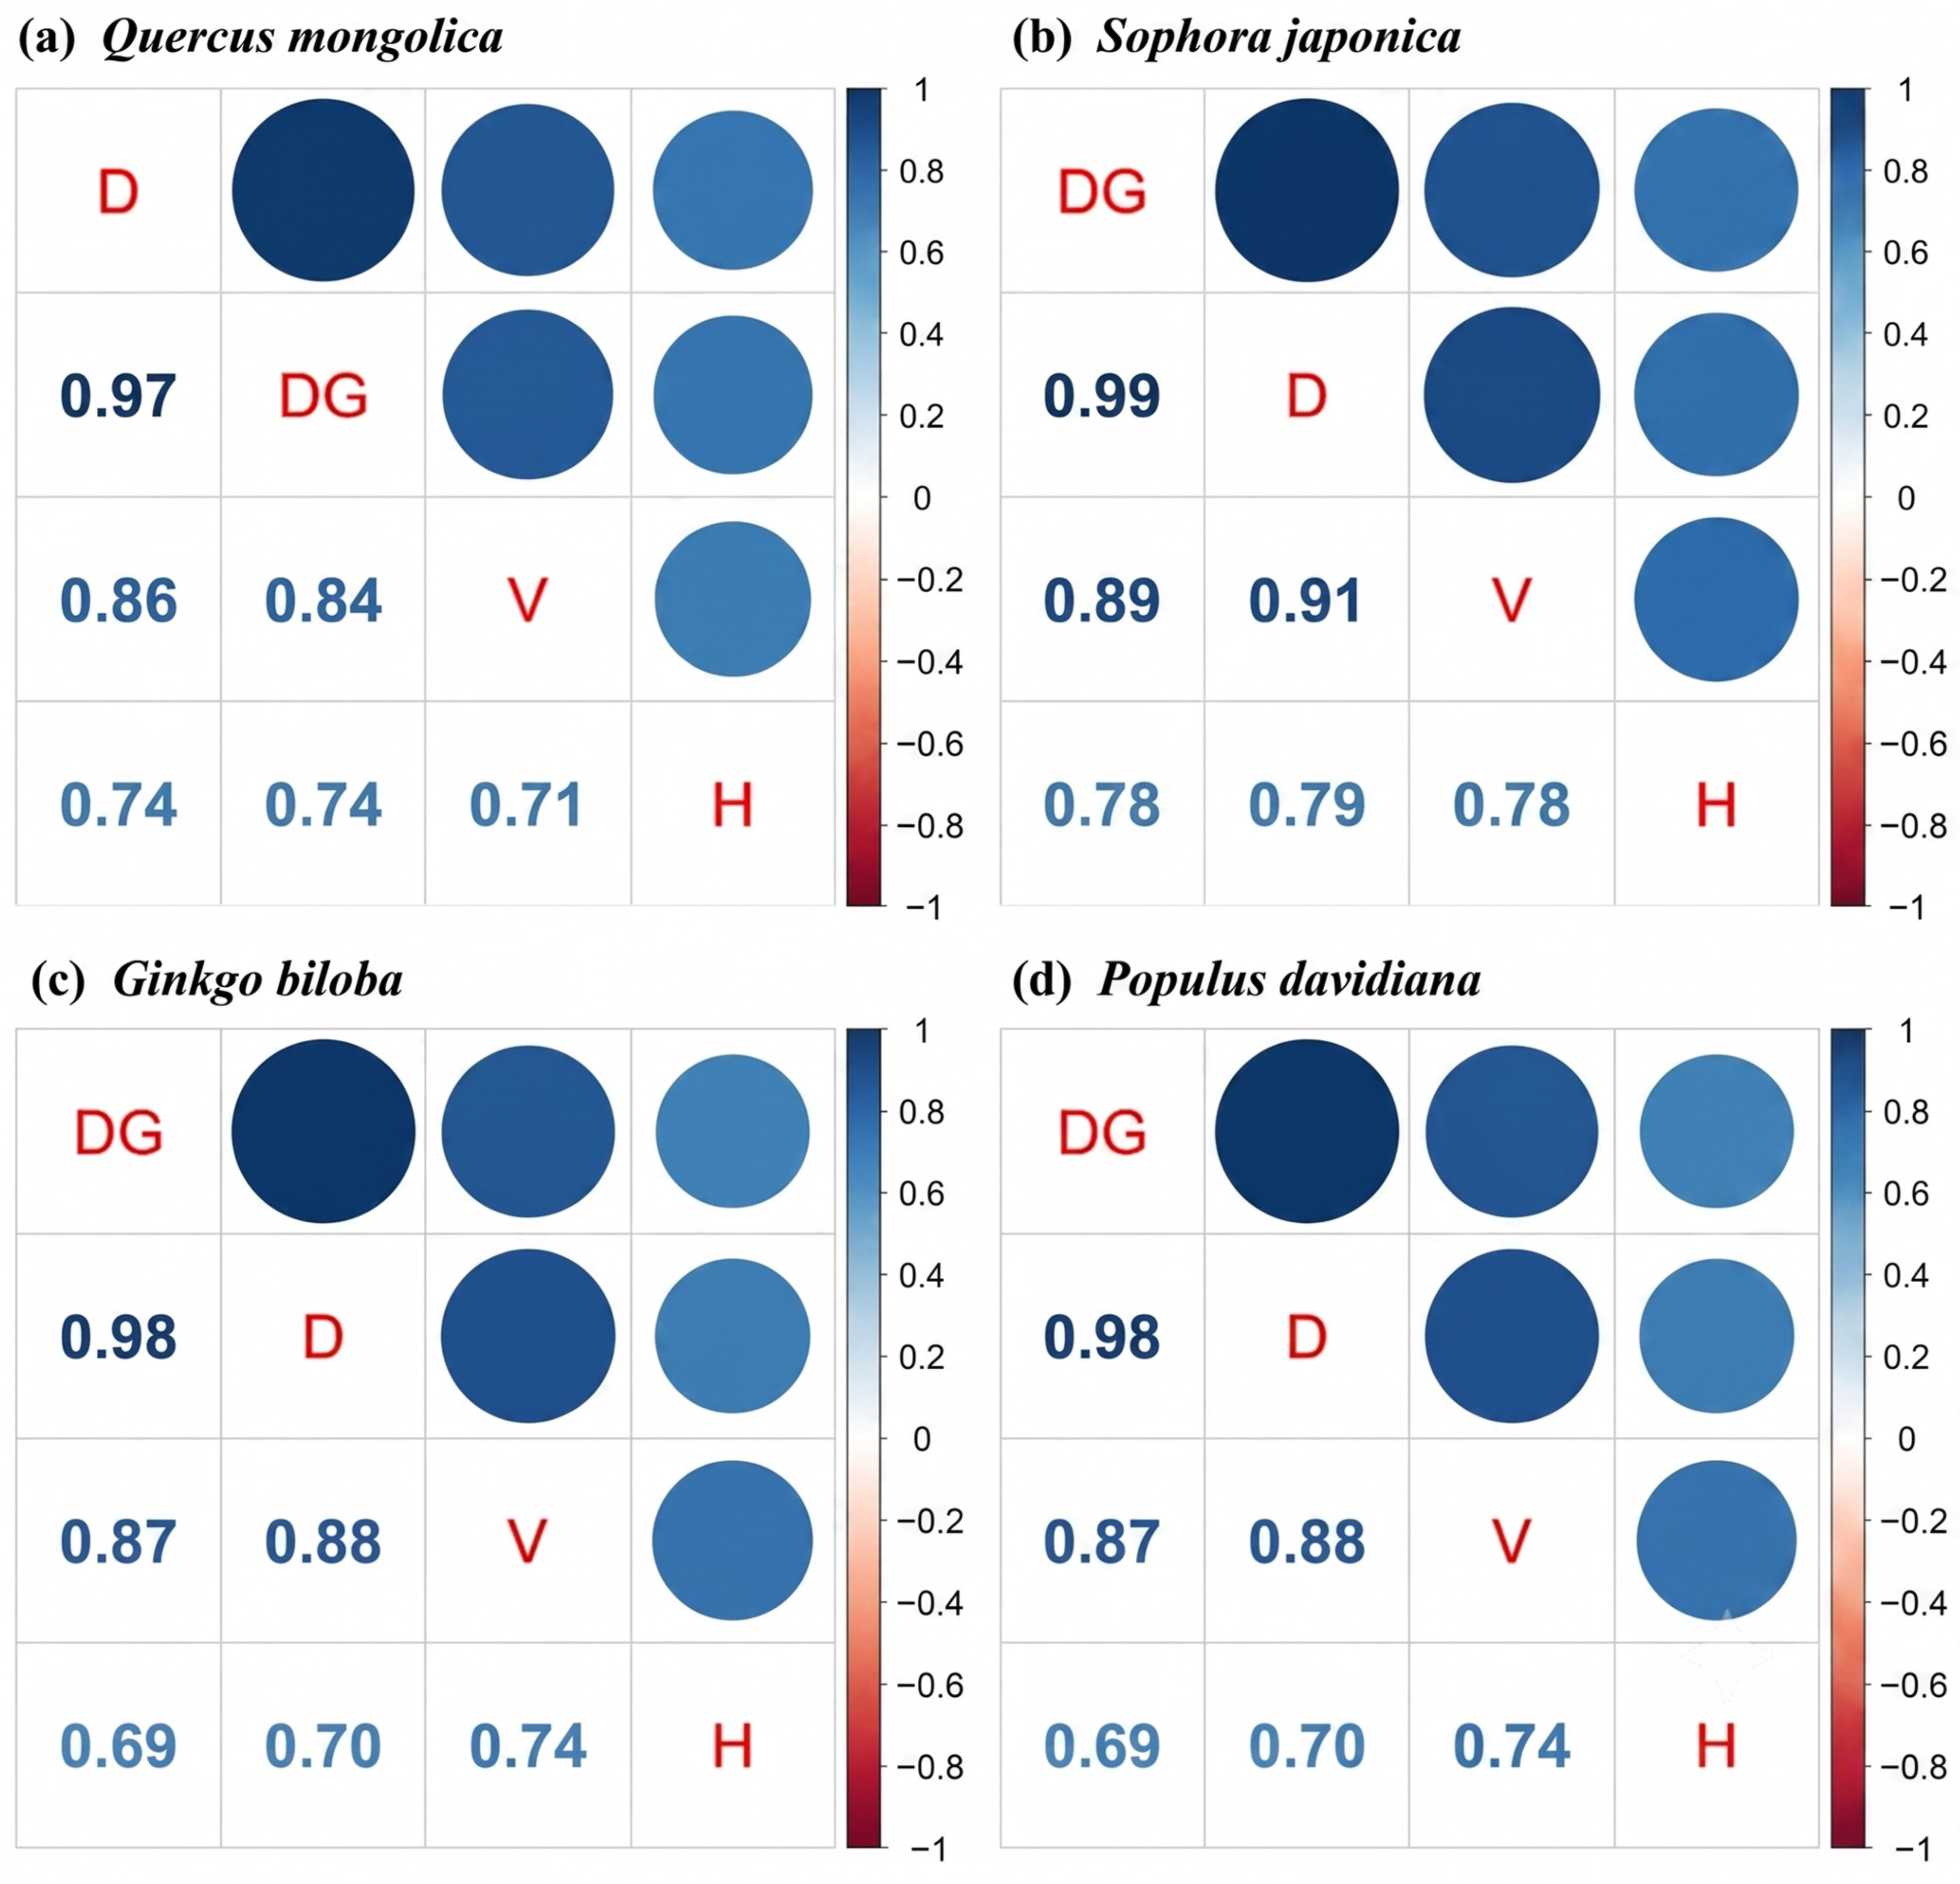
Table 2 summarizes the descriptive statistics of the modelling and validation datasets for the four urban broad-leaved species. All species covered wide ranges in DBH, ground diameter, tree height, and stem volume, indicating substantial structural heterogeneity in the sampled urban tree populations. In both the modelling and validation datasets, DBH and ground diameter showed moderate to relatively high dispersion, whereas tree height was less variable. By contrast, stem volume consistently showed the greatest dispersion across species.
For Quercus mongolica, the coefficients of variation in the modelling dataset were 0.45 for ground diameter, 0.51 for DBH, 0.32 for tree height, and 1.3007 for stem volume. For Sophora japonica, the corresponding values were 0.44, 0.49, 0.32, and 0.9578. For Ginkgo biloba, they were 0.50, 0.53, 0.30, and 1.0323. For Populus davidiana, the values were 0.52, 0.53, 0.40, and 1.1740. Similar patterns were retained in the validation datasets.
Overall, the results show that radial variables were more variable than tree height, while stem volume showed the highest dispersion among all variables. This indicates that, even when variation in tree height remained relatively constrained, the resulting variation in stem volume could still be substantial. The descriptive statistics therefore indicate that the sampled urban trees exhibited pronounced structural heterogeneity across species and size classes.
To examine spatial variation in tree-size characteristics, all trees were grouped into three urban zones according to their administrative districts: central urban area, suburban area, and outer suburban ecological area. DBH and tree height were summarized by species and urban zone. Differences in DBH and height among zones were tested separately for each species using Kruskal–Wallis tests. The detailed grouped statistics and boxplots are provided in the
Supplementary Material.
2.4. Measurement Protocols and Technical Workflow
A tiered measurement strategy was adopted to balance accuracy with operational efficiency under urban field conditions.
Diameter at breast height (D) and ground diameter (DG) were measured using calibrated diameter tapes. These variables served as the primary structural predictors in the subsequent modelling framework. Tree height (H) was obtained non-destructively using a handheld tree-measurement superstation through a photogrammetric workflow based on multi-view image acquisition and structure-from-motion (SfM) reconstruction. This approach was used because conventional height measurement in urban environments is often constrained by occlusion, complex crown architecture, and difficulty in identifying the uppermost visible treetop.
To provide an external reference for evaluating the non-destructive estimates, an independent destructive validation was also conducted. A total of 55 standard trees were felled, and section-measured reference stem volume was calculated by sectional measurement and frustum summation. This destructive benchmark was used to assess the accuracy of photogrammetry-supported volume prediction independently of the standing-tree modelling dataset.
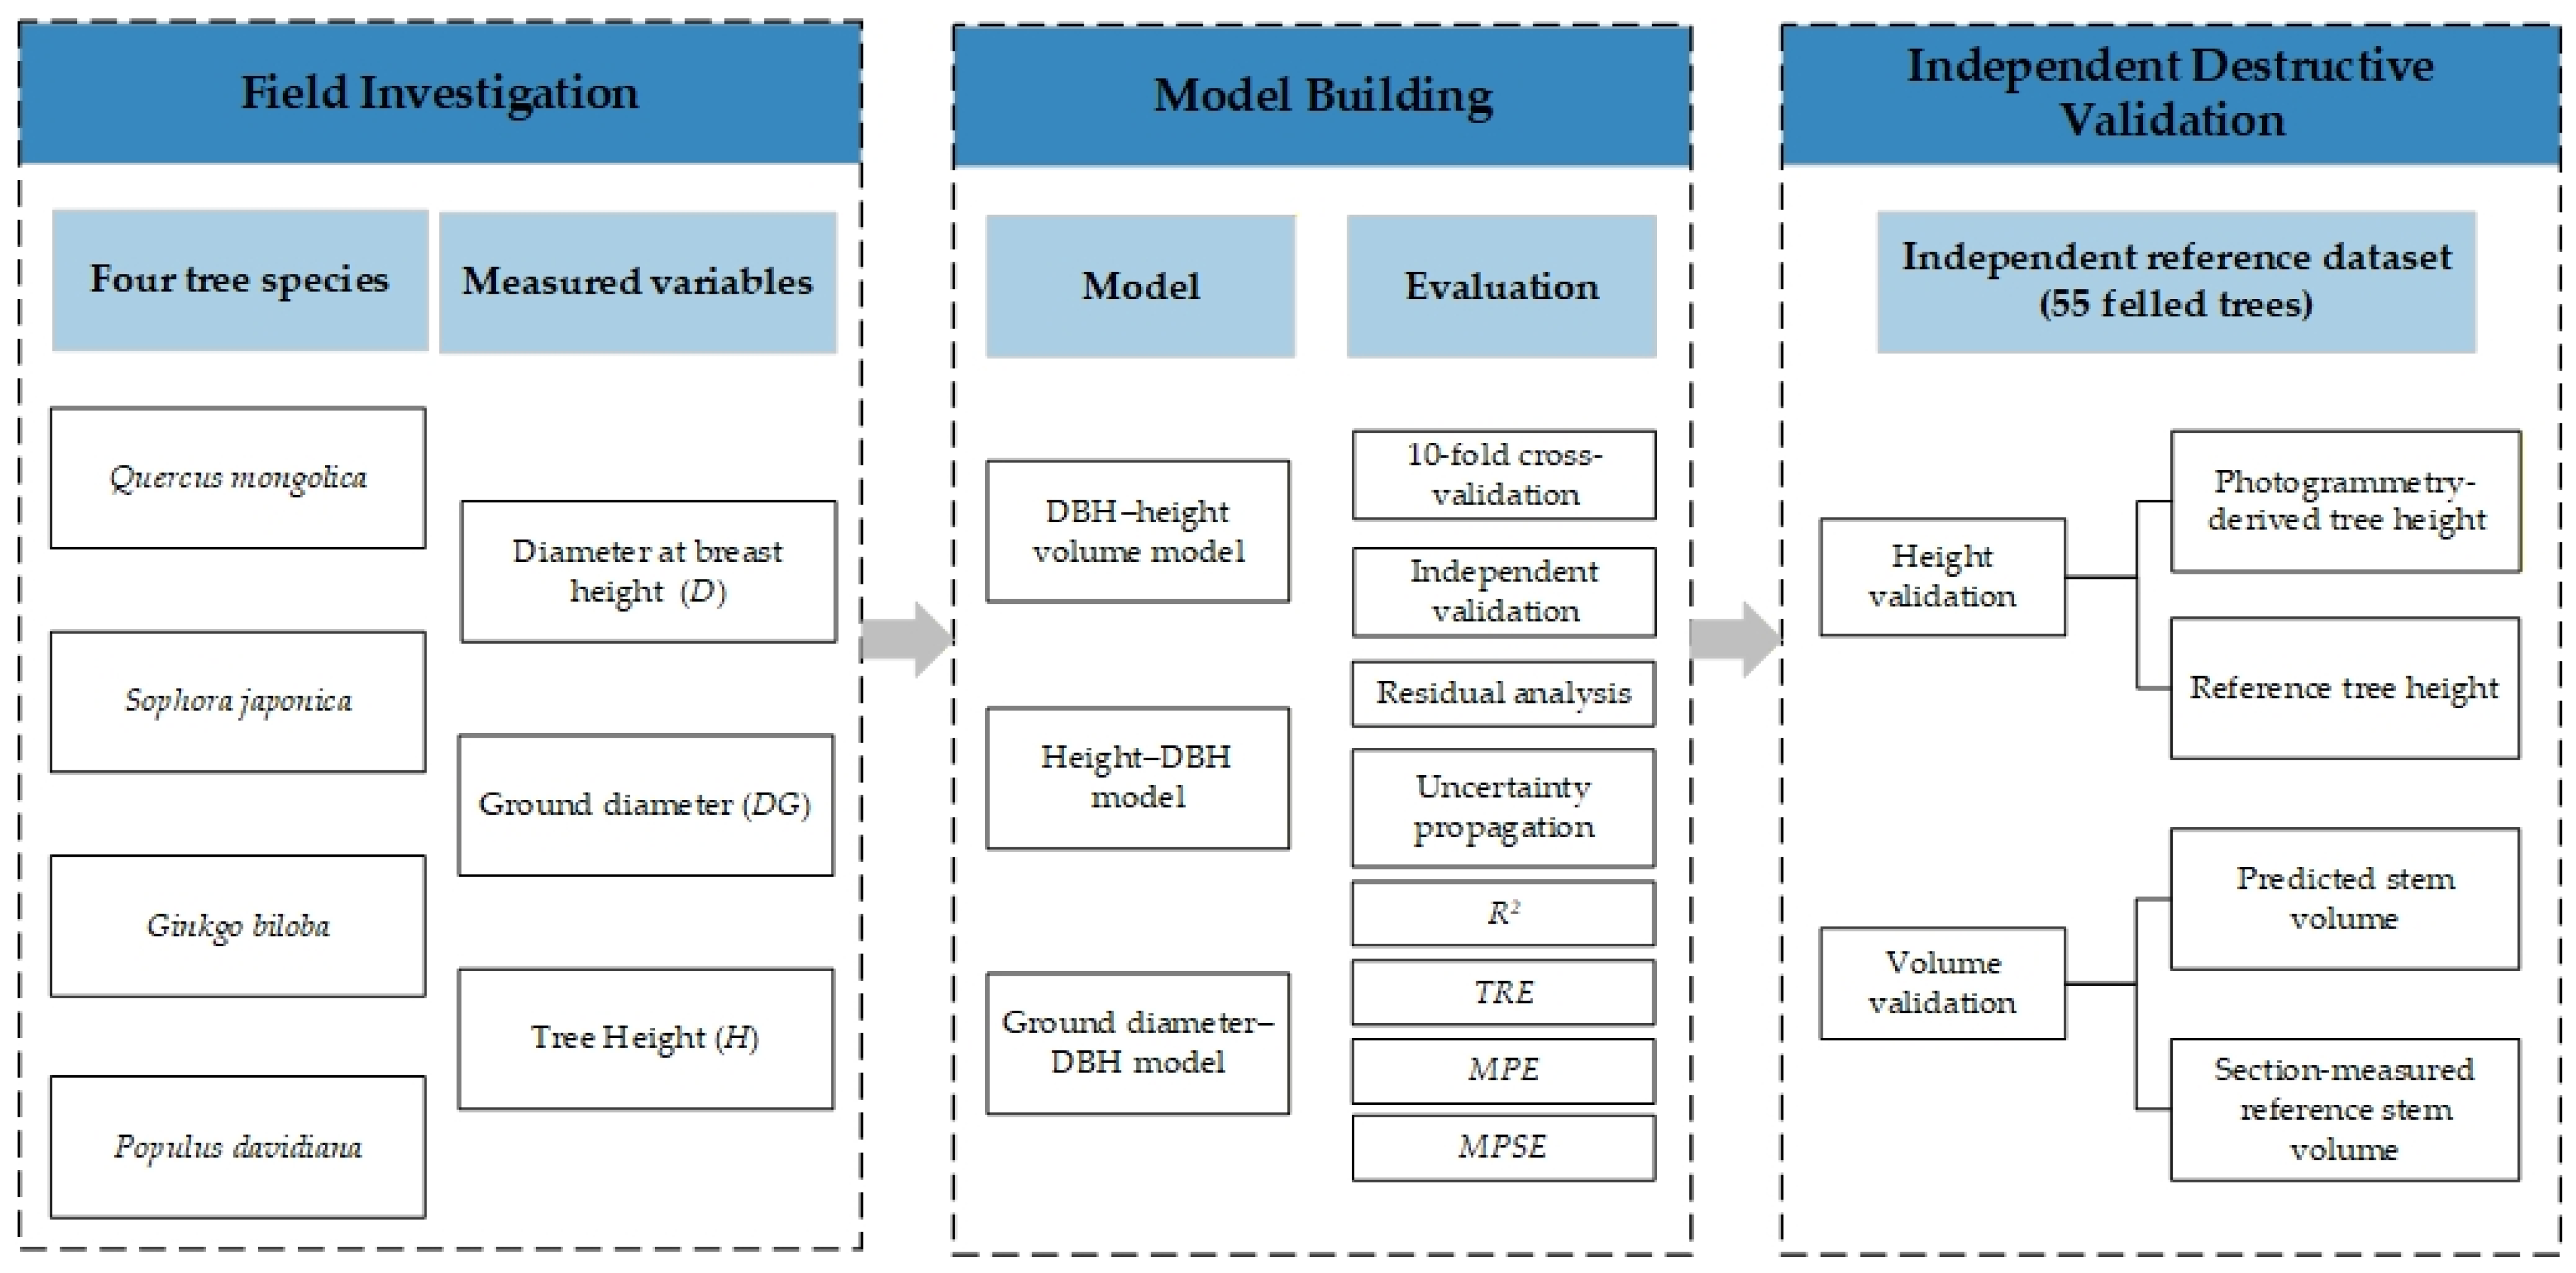
The overall technical workflow, therefore, consisted of three linked steps: field measurement of diameter variables, non-destructive acquisition of tree height using handheld photogrammetry, and external destructive validation of the resulting stem-volume estimates.
To further clarify the data hierarchy used in this study, we distinguished field-measured variables, photogrammetry-derived measurements, model-derived outputs, and destructively measured reference data. Diameter at breast height (DBH, D) and ground diameter (DG) were field-measured diameter variables obtained using calibrated diameter tapes. Tree height (H) for standing trees was obtained using a handheld tree-measurement superstation through a photogrammetric workflow and should therefore be interpreted as a photogrammetry-derived non-destructive height measurement rather than as a destructive measurement.
Stem volume generated by the fitted equations was interpreted as predicted or model-estimated stem volume. Model-estimated stem volume was not regarded as “real”, “actual”, or “true” stem volume. In this study, the term “section-measured reference stem volume” was reserved for the independent destructive validation dataset. This dataset consisted of 55 felled trees, for which stem volume was calculated using sectional measurements and frustum summation. These felled trees were not used to fit the main species-specific equations; instead, they provided an independent destructive reference for evaluating the non-destructive and model-assisted prediction workflow.
It should also be noted that the destructive validation dataset was limited in sample size and size range relative to the full standing-tree dataset. Therefore, the validation results should be interpreted as evidence of feasibility and preliminary predictive reliability under the available reference dataset rather than as definitive validation across all tree sizes, ages, pruning histories, site conditions, and urban management regimes.
2.5. Destructive Sampling and Independent Validation
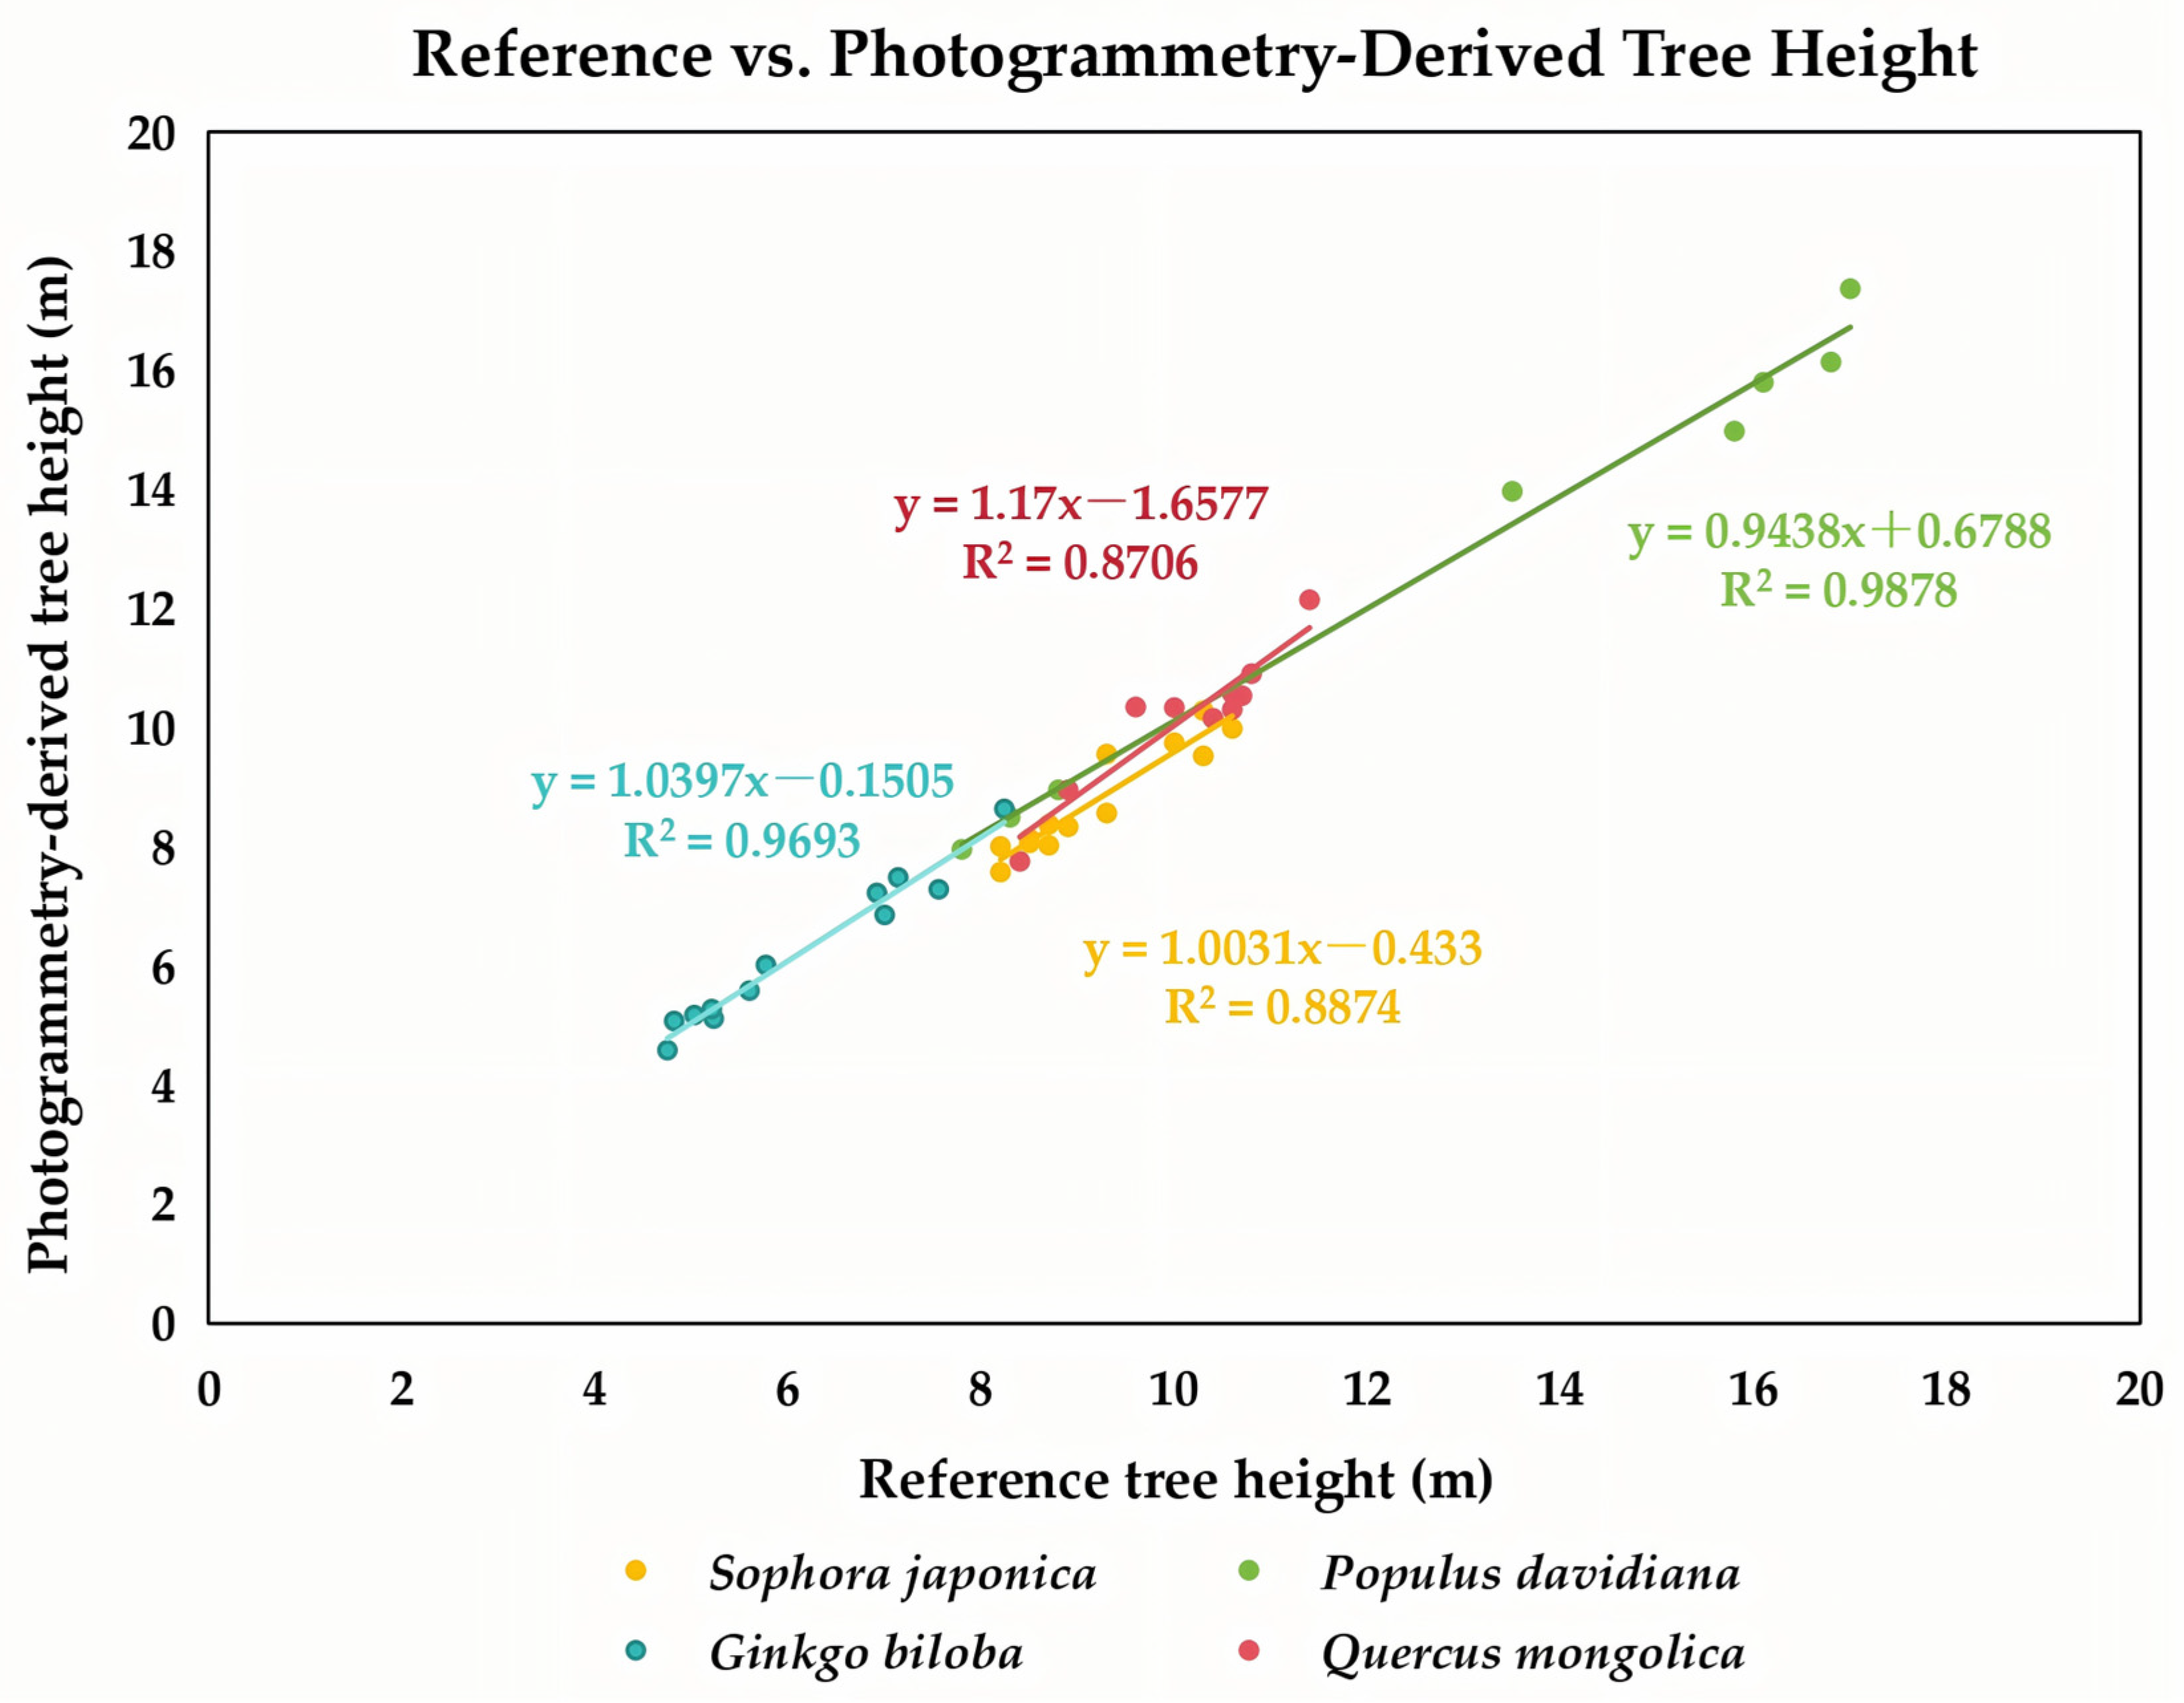
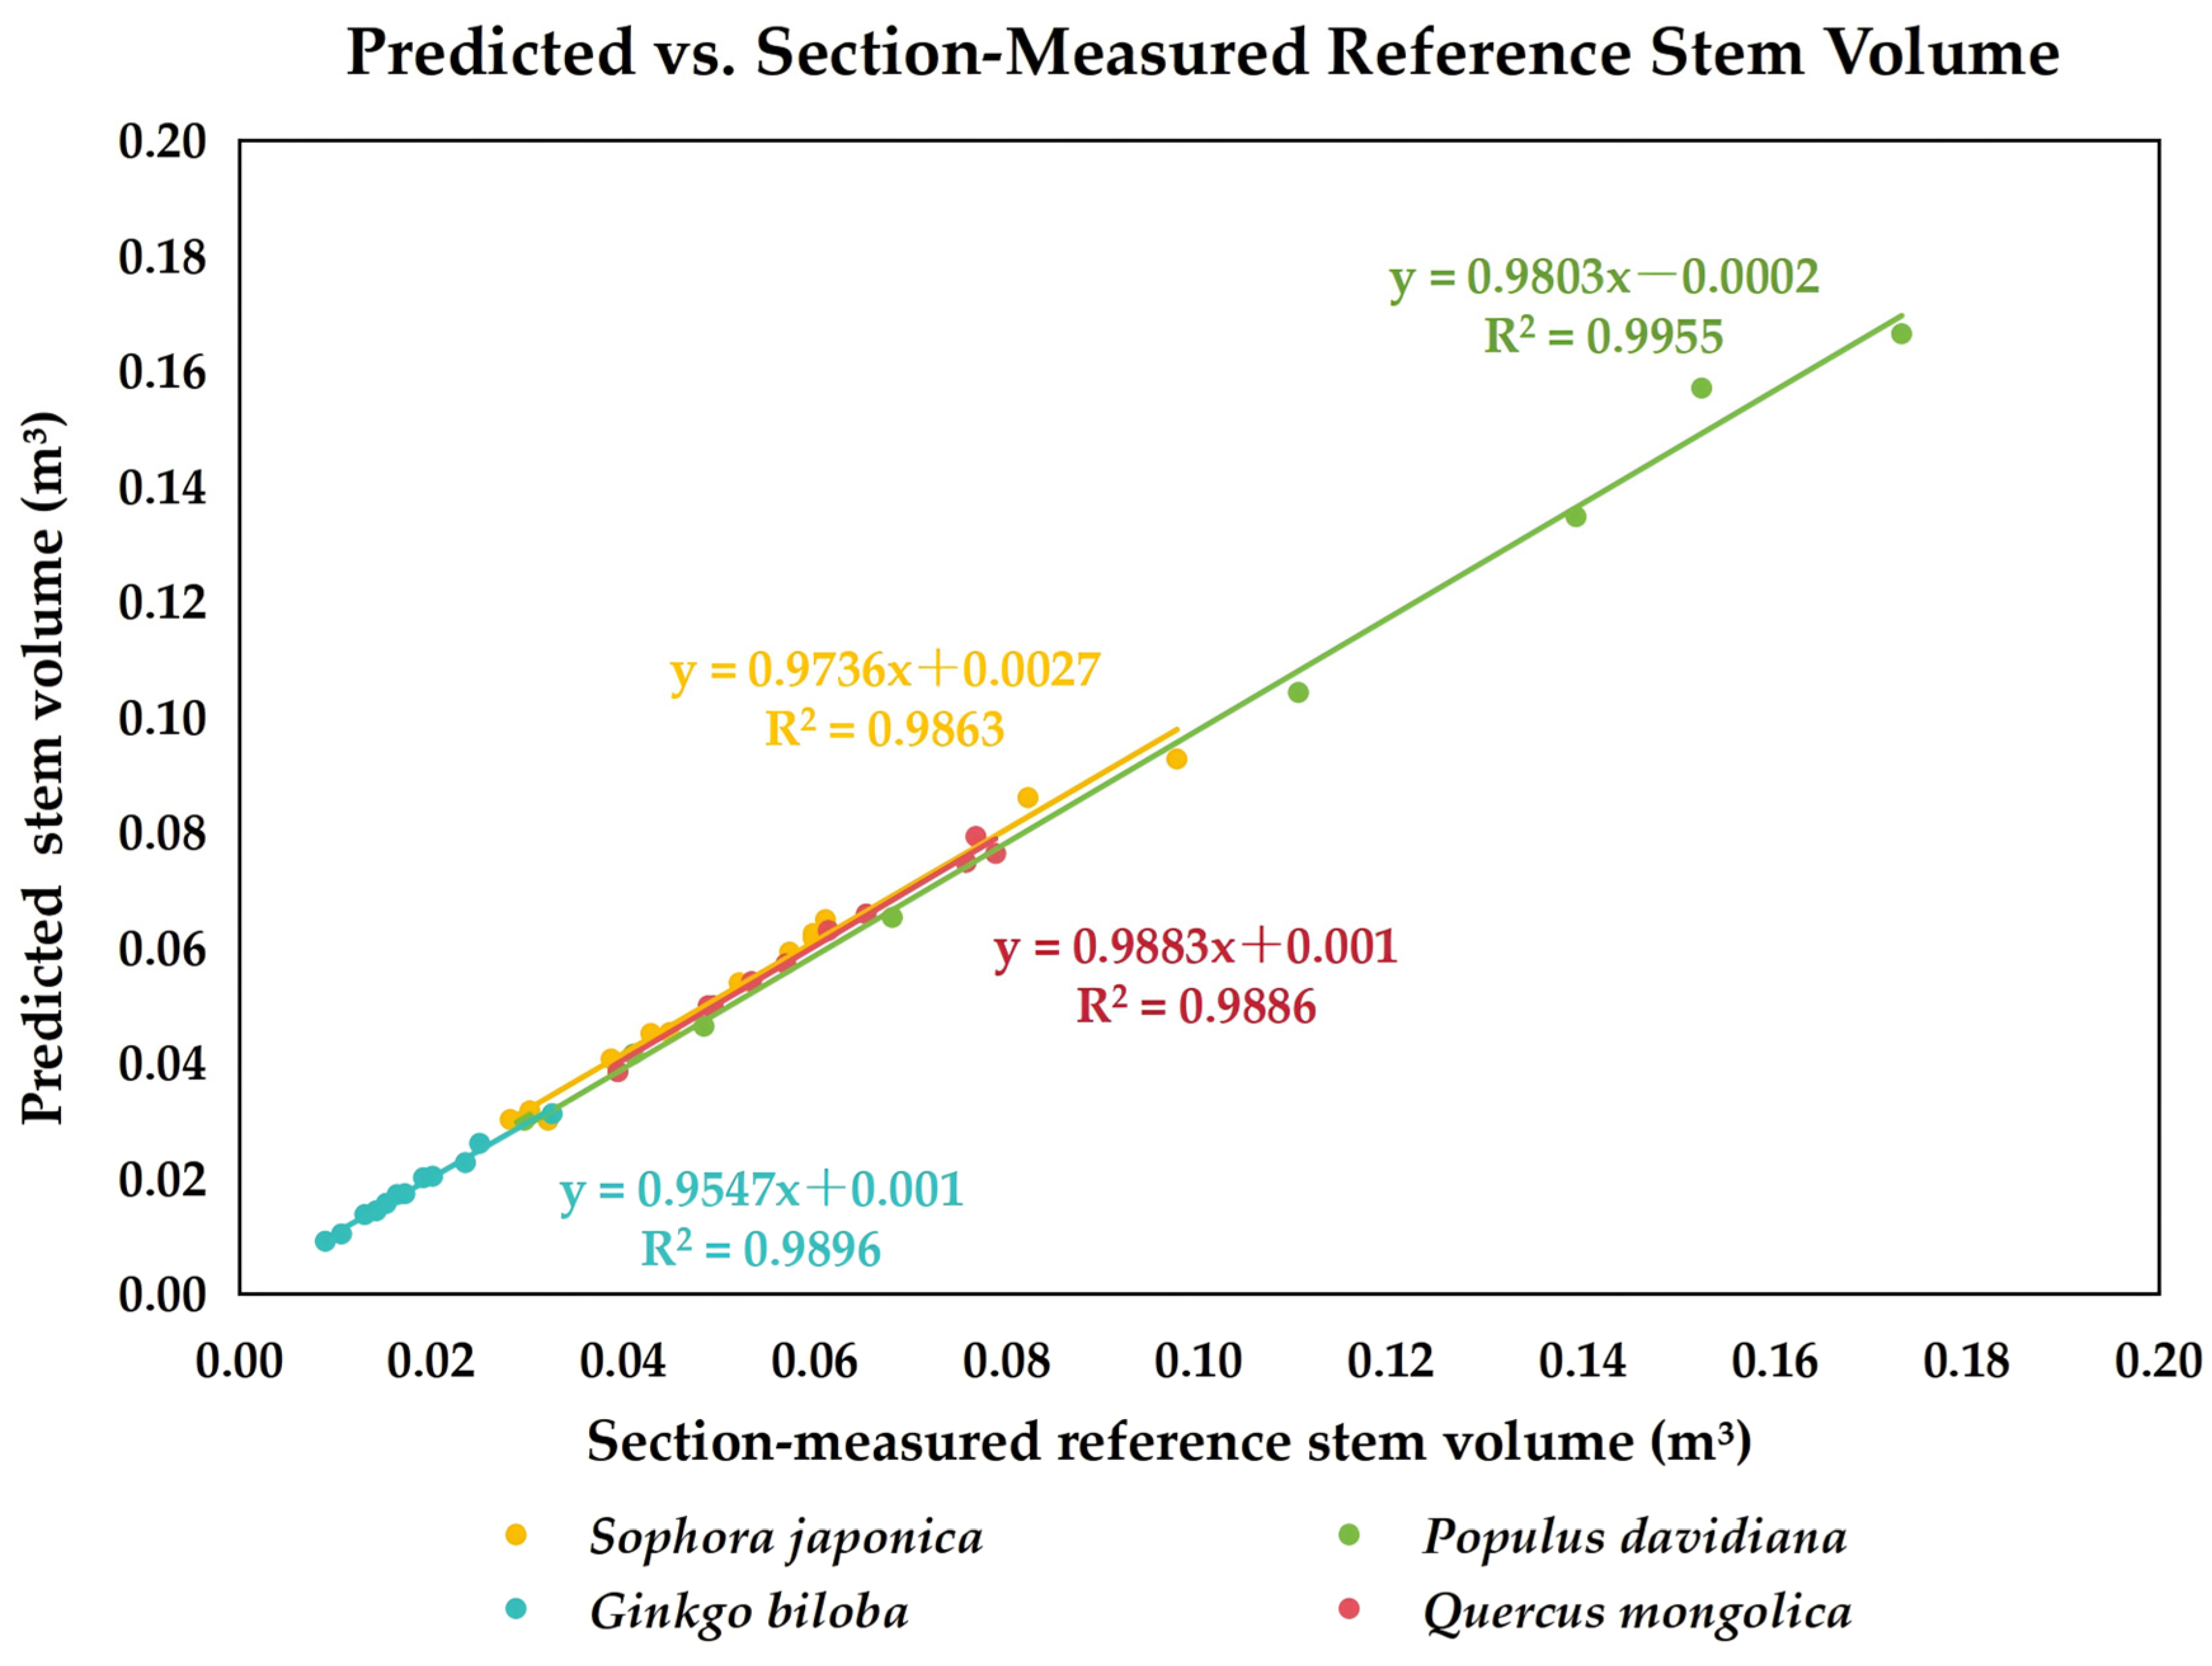
The independent destructive validation dataset comprised 55 felled trees, including 25 Sophora japonica, 8 Populus davidiana, 12 Ginkgo biloba, and 10 Quercus mongolica. In this sample, measured DBH ranged from 5.9 to 17.2 cm, reference tree height ranged from 4.75 to 17.00 m, and section-measured reference stem volume ranged from 0.008961 to 0.173172 m3. The corresponding photogrammetry-derived tree heights ranged from 4.59 to 17.37 m, and predicted stem volume ranged from 0.009142 to 0.166465 m3.
The 55 felled trees were not used to fit the main species-specific volume equations. Instead, they served as an independent destructive validation dataset to evaluate the performance of the non-destructive prediction workflow. Section-measured reference stem volume of felled trees was calculated using sectional measurements and frustum summation rather than assuming that the whole stem was a perfect cylinder.
2.6. Tiered Stem-Volume Modelling Framework
To accommodate different urban management scenarios, we developed a three-level predictive system in which models with different data requirements could be applied according to field conditions and data availability.
The primary model was a bivariate stem-volume model using both DBH and tree height:
In this equation, V is the predicted stem volume (m3), D is the measured DBH (cm), H is the tree height (m) obtained from photogrammetry, and c0, c1, and c2 are species-specific parameters.
For situations in which tree height could not be reliably acquired, a univariate DBH-based approach was developed by linking a height–DBH relationship to the bivariate model. Tree height was estimated using a Richards function:
where
b0,
b1, and
b2 are species-specific parameters describing the asymptotic height, growth rate, and curve shape, respectively. The predicted height was then substituted into the bivariate model to derive stem volume from DBH alone.
A third option was developed for practical scenarios in which DBH measurement was not feasible, such as renovated or recently disturbed sites where only basal measurements were available. In this case, DBH was first predicted from ground diameter:
where
a0 and
a1 are regression parameters. The estimated DBH was then used within the height-prediction and volume-prediction chain to obtain stem volume.
This tiered framework was designed to retain the higher accuracy of the bivariate model when full measurements were available, while also providing lower-data alternatives for more constrained urban survey conditions.
2.7. Parameter Estimation and Heteroscedasticity Correction
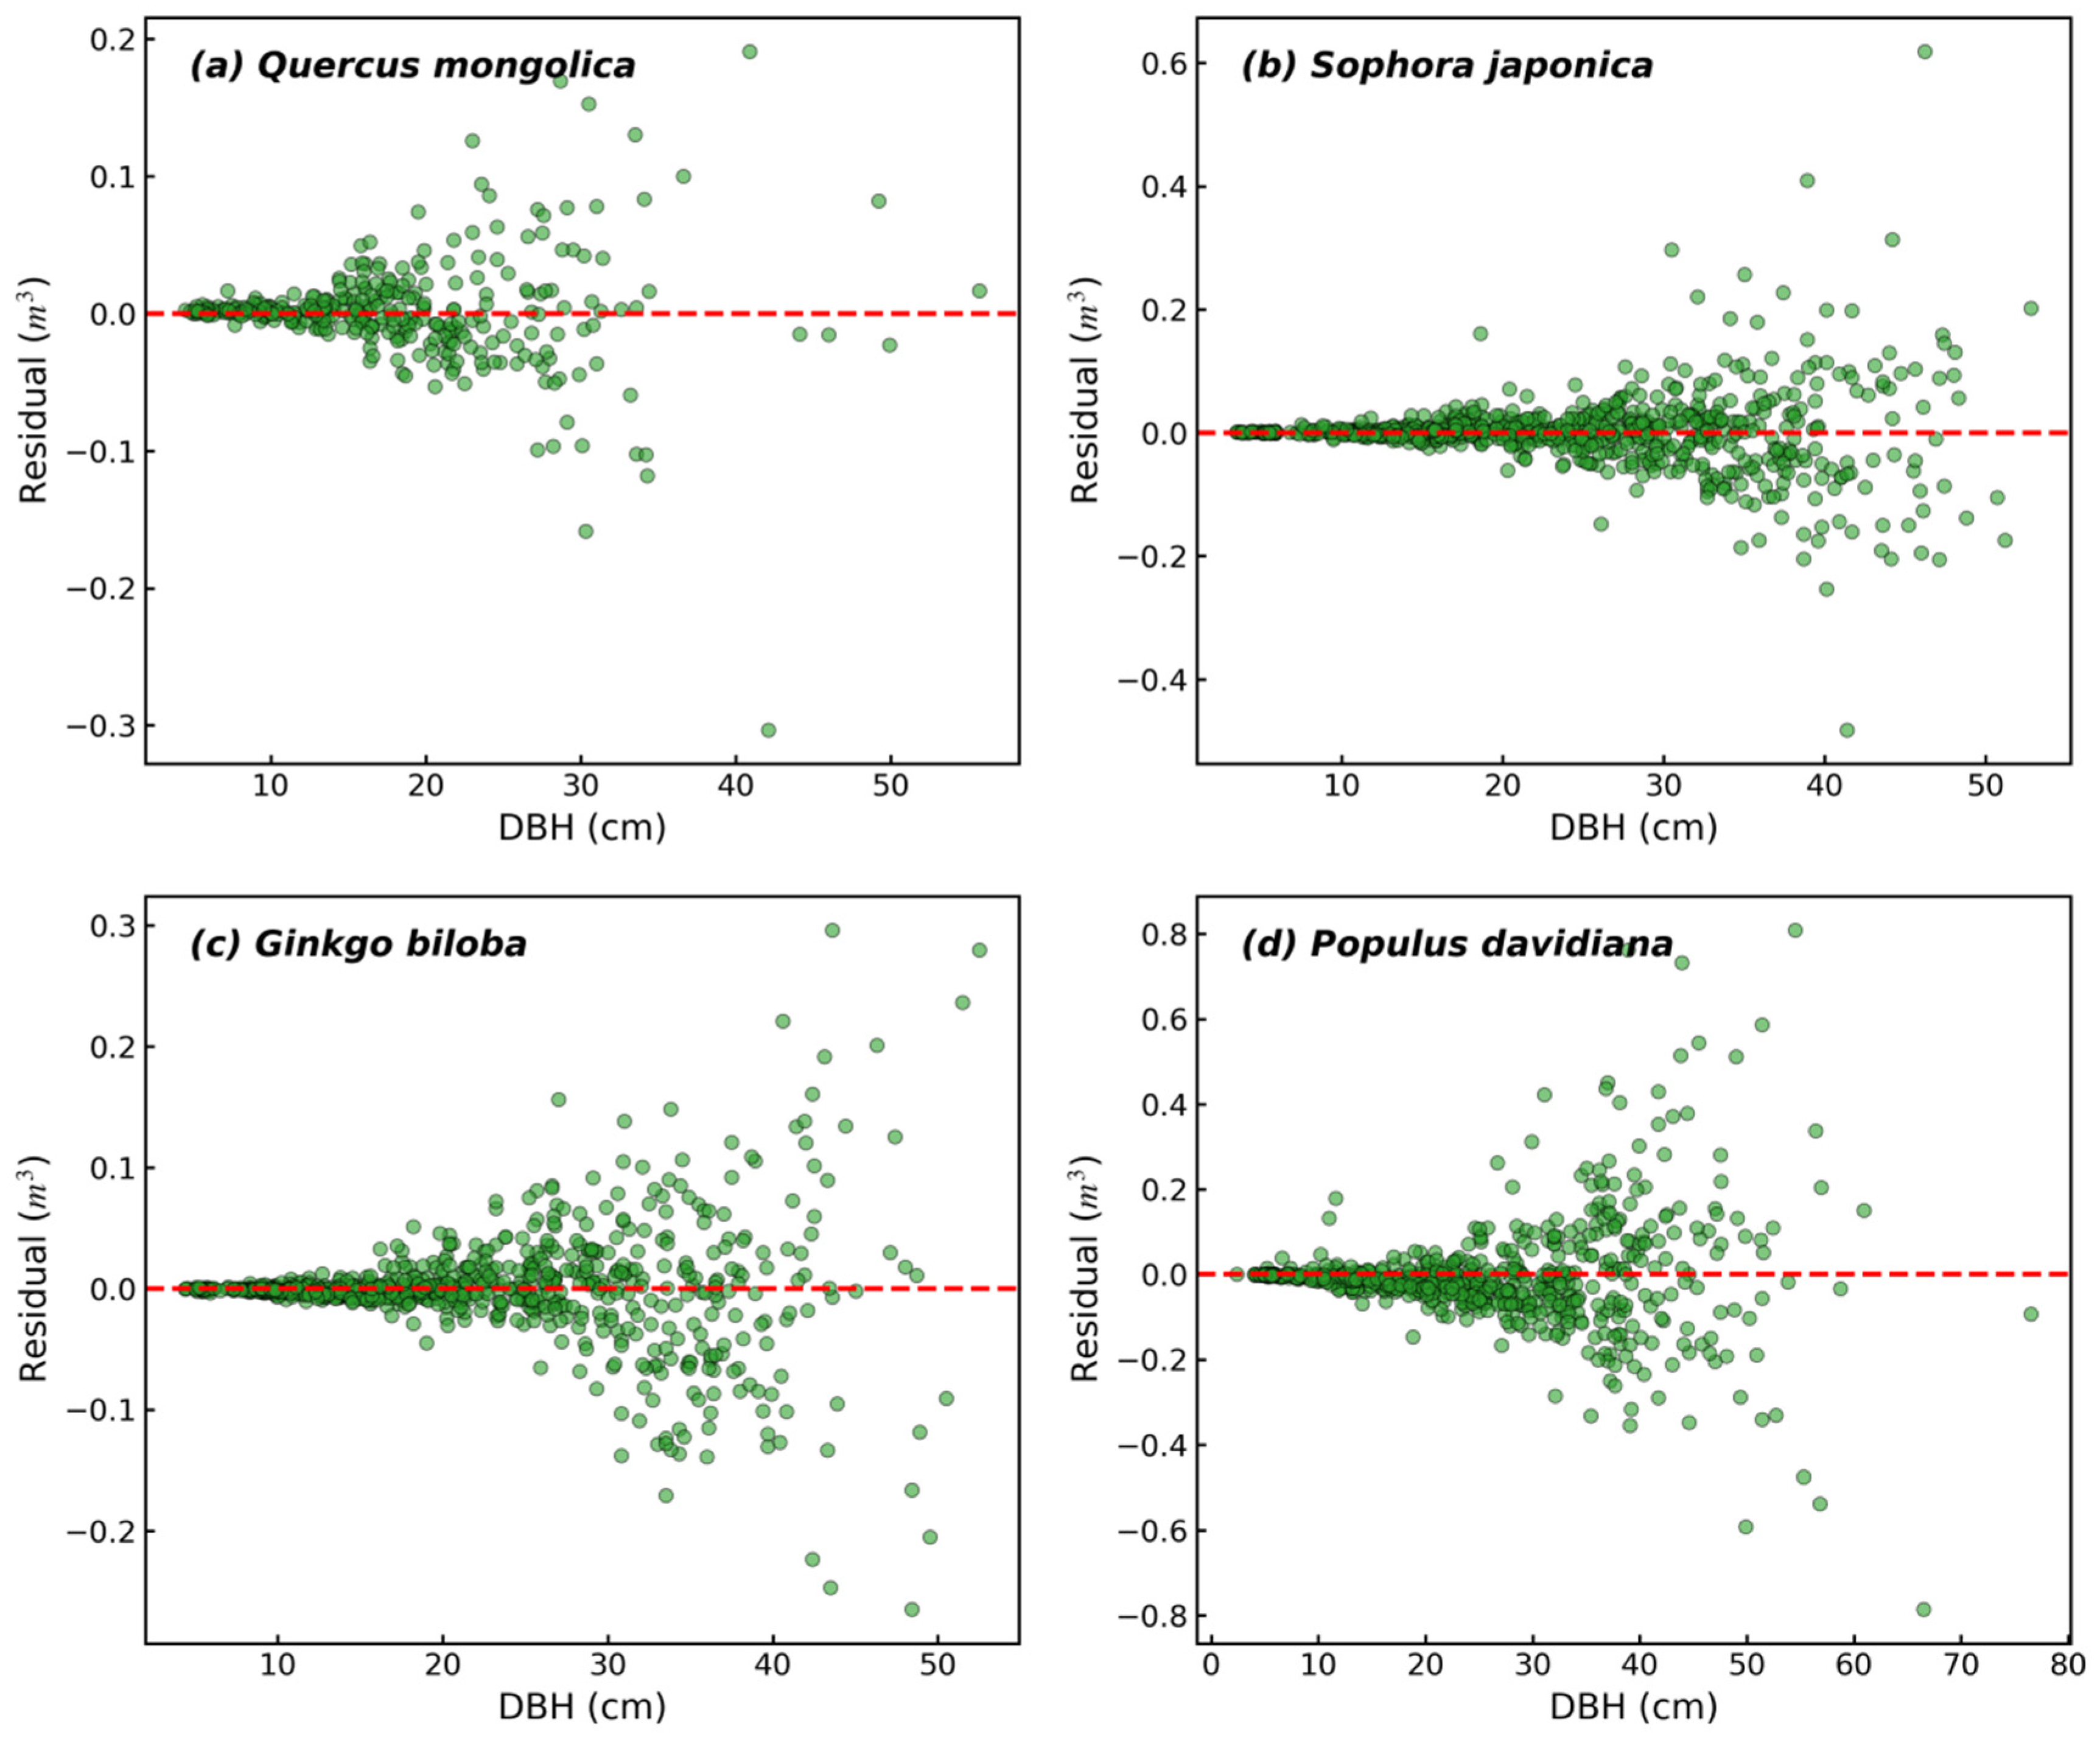
All model parameters were estimated using weighted nonlinear least squares (WNLS) in Python 3.9 with scipy.optimize. Because variance in stem-volume data typically increases with tree size, heteroscedasticity was expected across the full range of the DBH, tree height, and ground diameter. To reduce the disproportionate influence of large trees and improve model robustness, candidate weight functions were tested for each model form.
The candidate functions included inverse power forms based on D, D2H, predicted values, and DG, together with an empirical comparator. The final weighting structure was selected by combining three criteria: (1) reduction in funnel-shaped residual patterns, (2) improvement in Akaike’s Information Criterion (AIC), and (3) performance on the independent validation set. This procedure was used to balance statistical fit with predictive stability under realistic field conditions.
2.8. Performance Evaluation and Error Propagation
Model performance was evaluated using 10-fold cross-validation and independent validation. Cross-validation was applied to the bivariate and univariate DBH-based models for each species to assess stability and generalization. The main evaluation metrics were the coefficient of determination (
R2), root mean square error (RMSE), Mean Absolute Bias (MAB), and Total Relative Error (TRE). Average systematic error (ASE), mean percent error (MPE), and mean percent standard error (MPSE) were also examined to support comparison among model types. RMSE was used as the primary prediction-error metric and was calculated as:
where
is the reference or target stem volume used for evaluation,
is the predicted stem volume, and
is the number of trees.
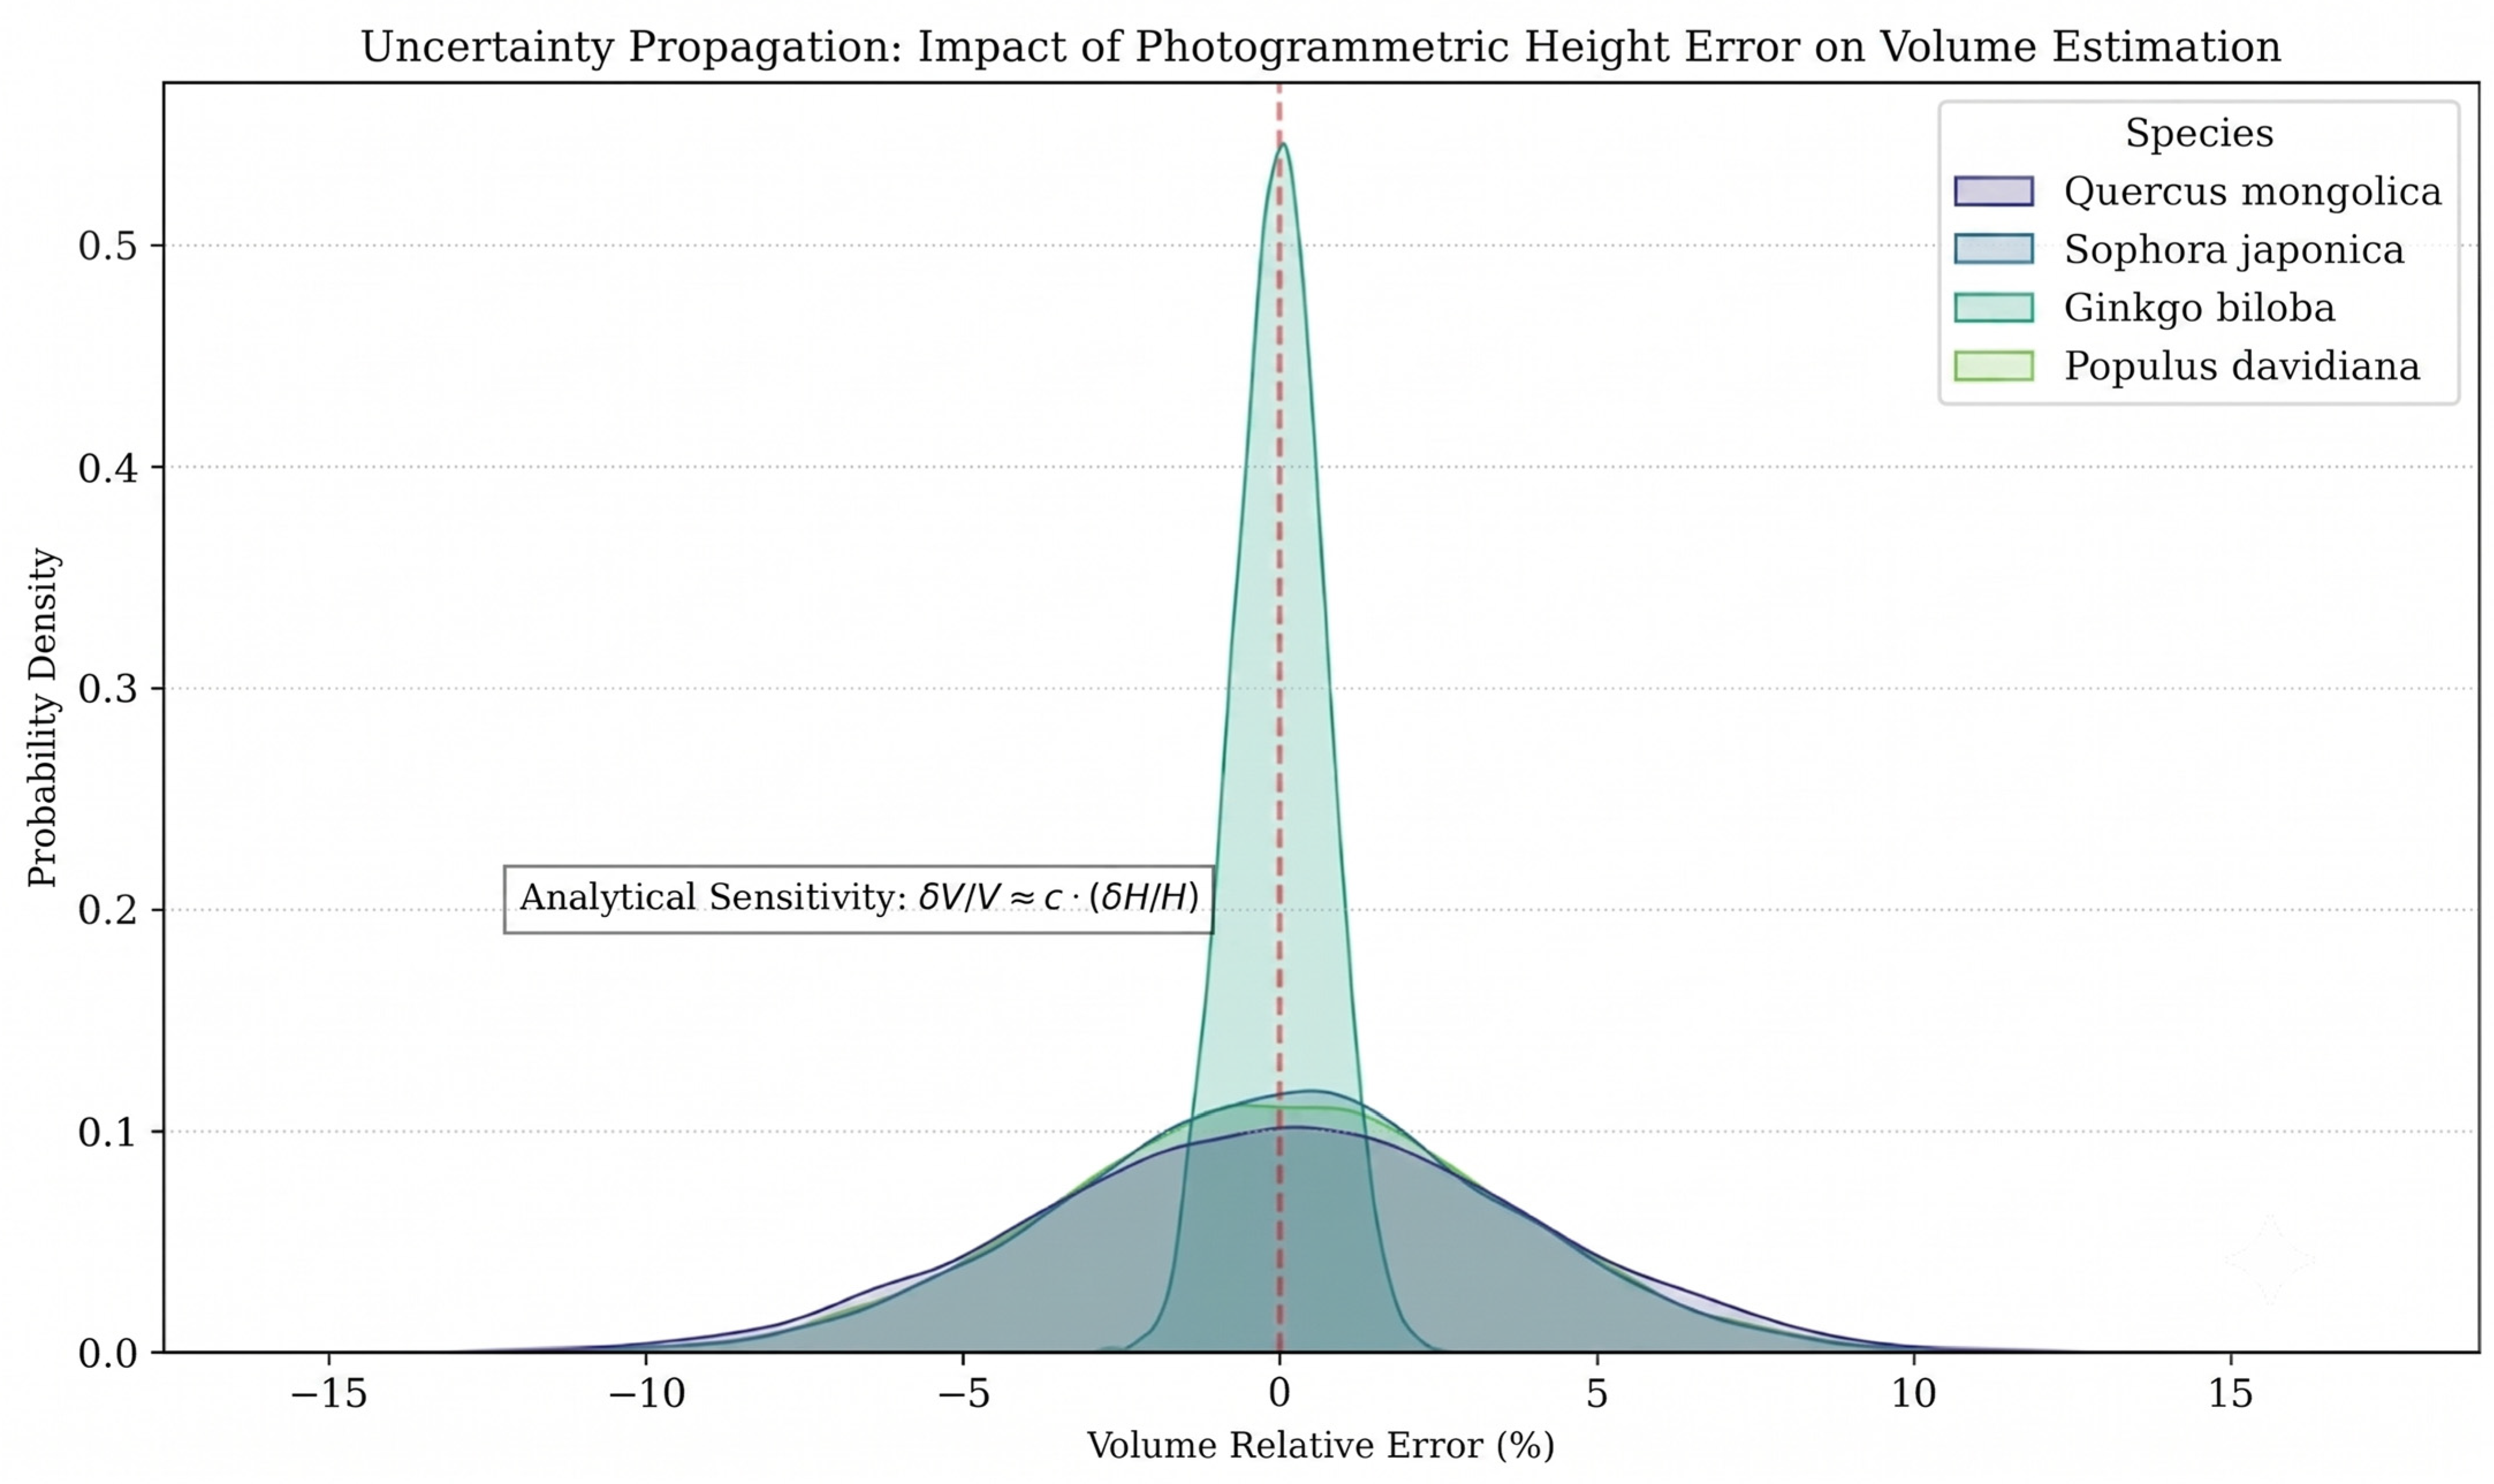
To quantify how photogrammetric tree-height error propagated into stem-volume estimation, a Monte Carlo simulation was conducted based on the bivariate model. For each species, the RMSE of tree-height measurement was used as the scale parameter of observational error, and N = 10,000 random perturbations were generated for each tree:
The perturbed height values were then substituted into the bivariate stem-volume model to obtain the simulated stem volume (
Vsim). Relative volume fluctuation was calculated as:
where
is the original volume prediction based on the original photogrammetry-derived height, and
is the simulated stem volume after height perturbation. The mean relative fluctuation across all trees of a species was used to represent the average uncertainty transmitted from tree-height error to stem-volume estimation. This procedure allowed for species-specific sensitivity to photogrammetric error to be evaluated within a management-oriented uncertainty framework. The overall analytical workflow is shown in
Figure 3.
4. Discussion
4.1. Contribution and Limitation of Photogrammetric Height Measurement to Model-Assisted Stem-Volume Estimation
This study developed a species-specific and model-assisted framework for estimating the stem volume of dominant urban broad-leaved trees in Beijing. The framework combined field-measured diameter variables, photogrammetry-derived tree height, tiered stem-volume modelling, cross-validation, Monte Carlo uncertainty propagation, and independent destructive reference validation. This design reflects a practical constraint in urban forestry: extensive destructive sampling, which is commonly used to develop classical volume equations in forest stands, is rarely feasible for urban trees because of landscape value, public-space management, safety concerns, cost, and administrative restrictions. Therefore, the present study should be interpreted as an operational stem-volume estimation approach rather than as a complete substitute for large destructive datasets.
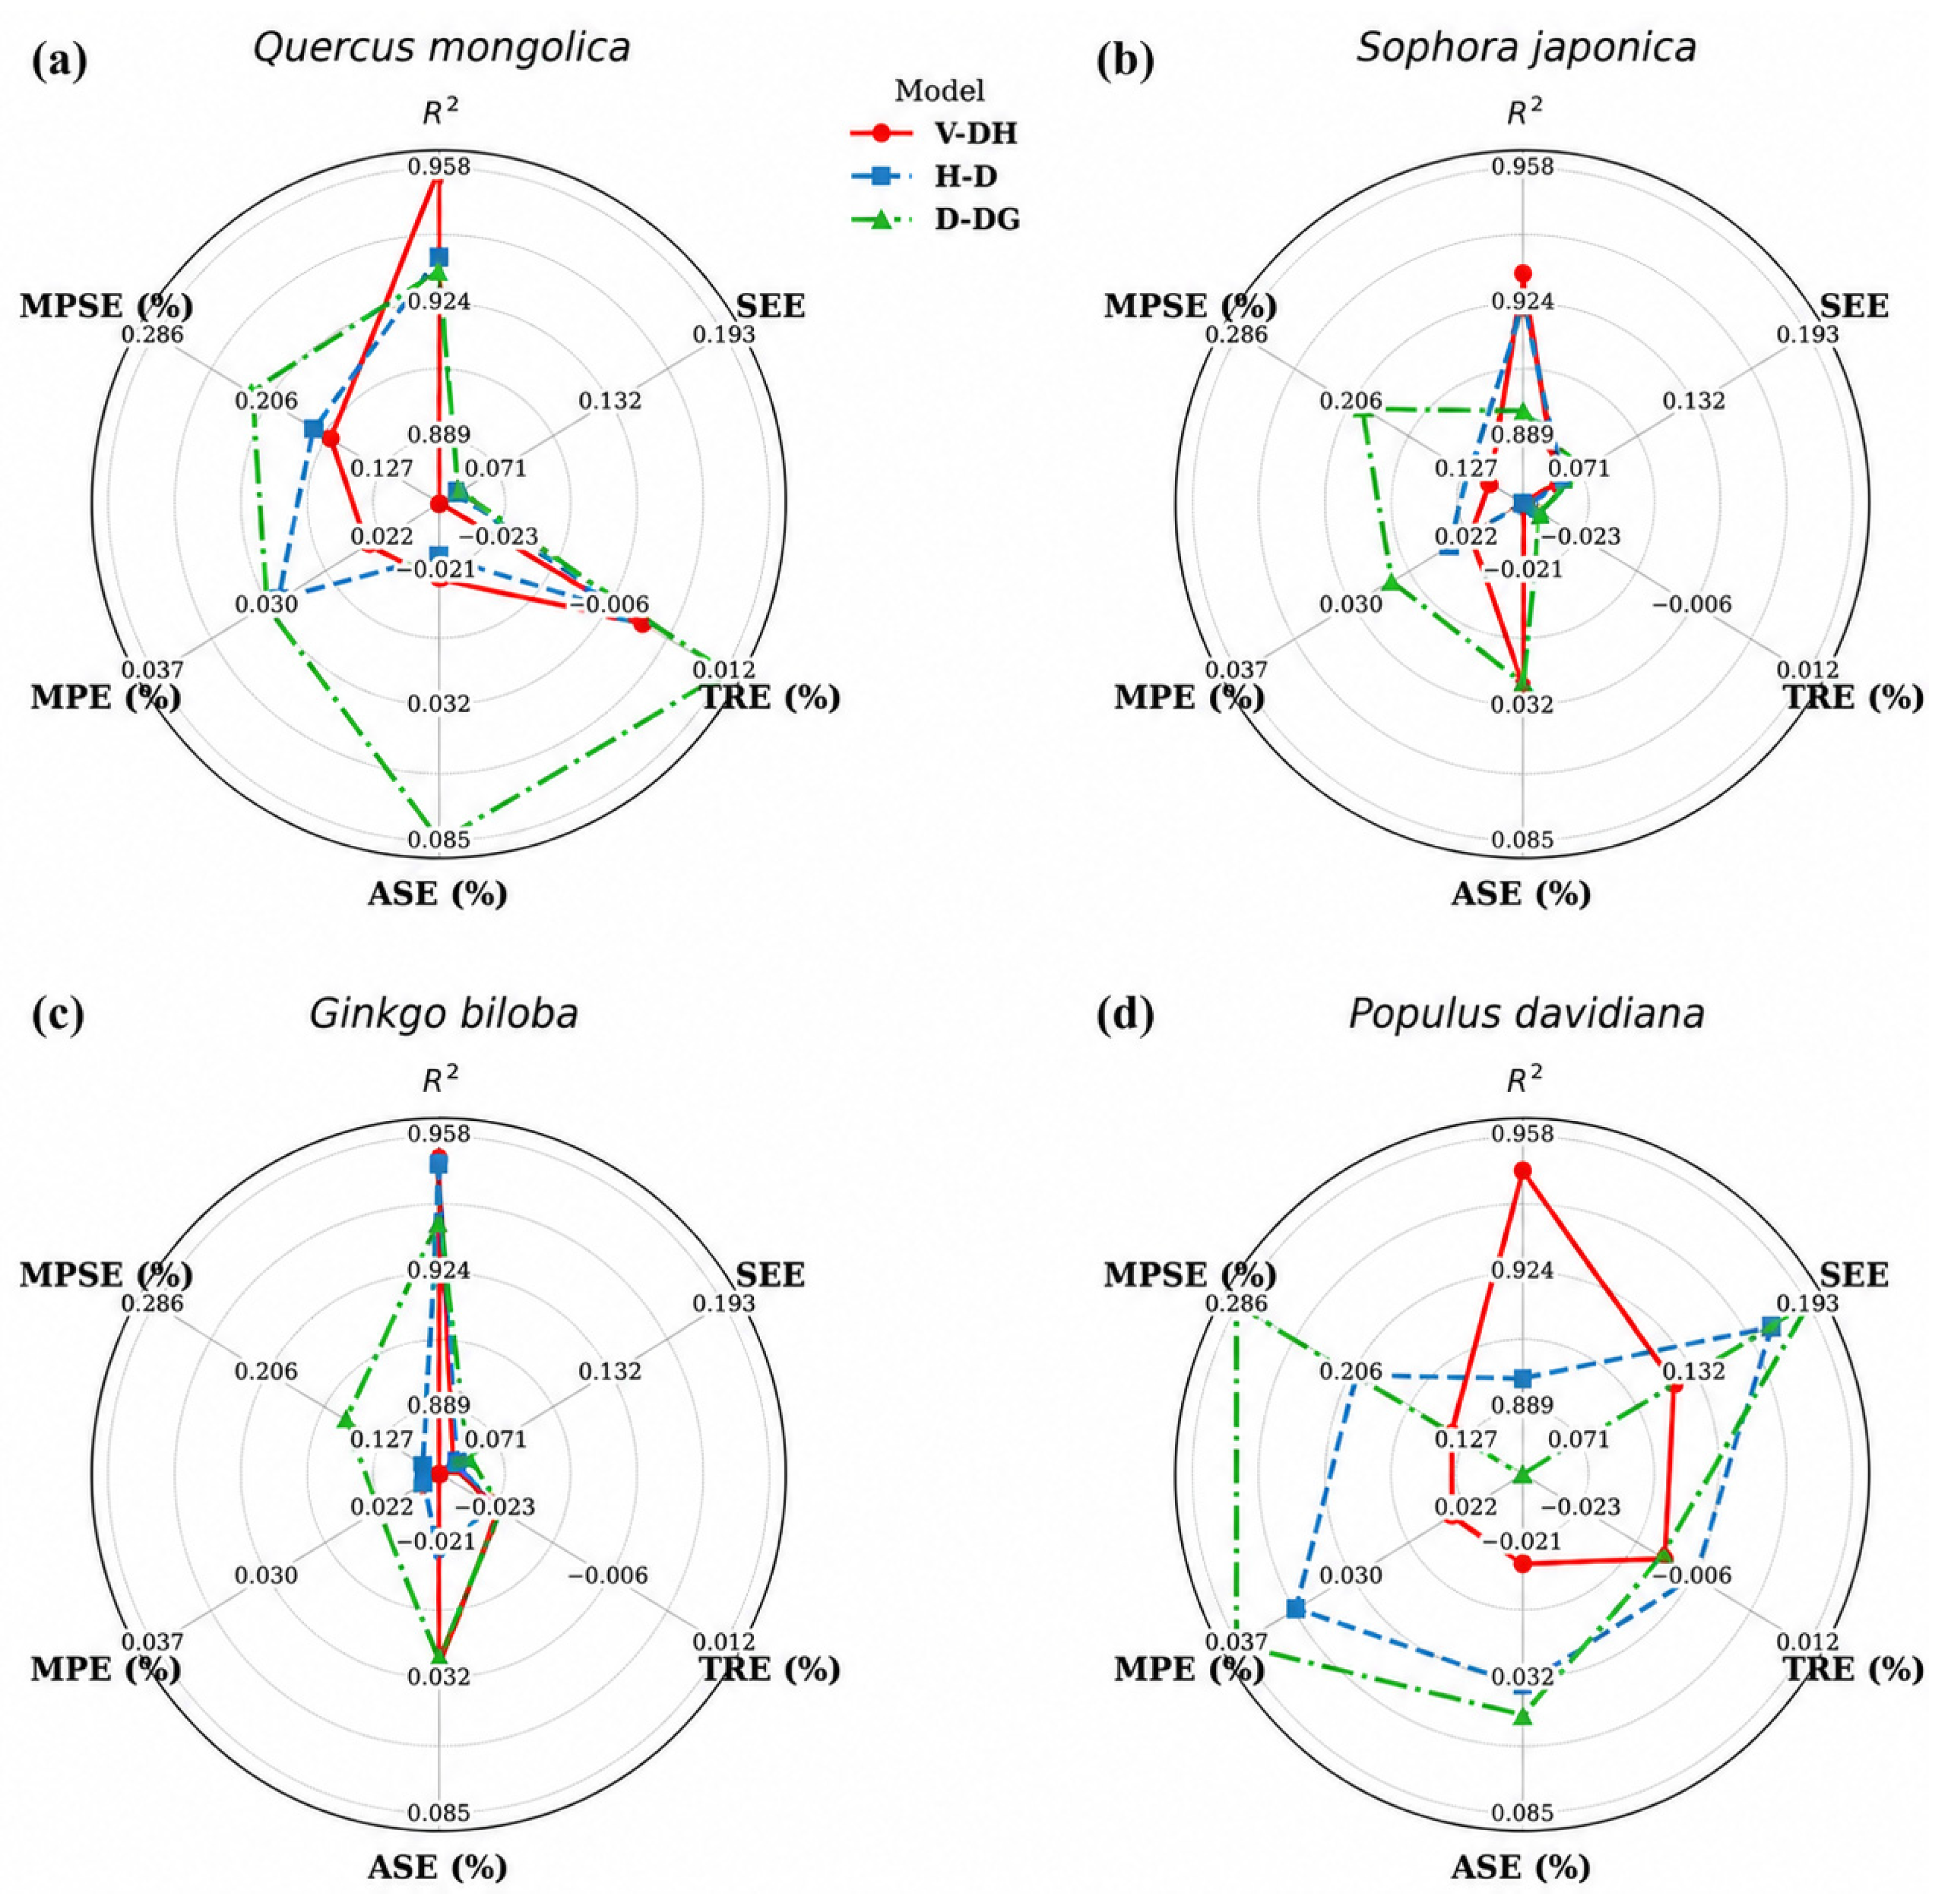
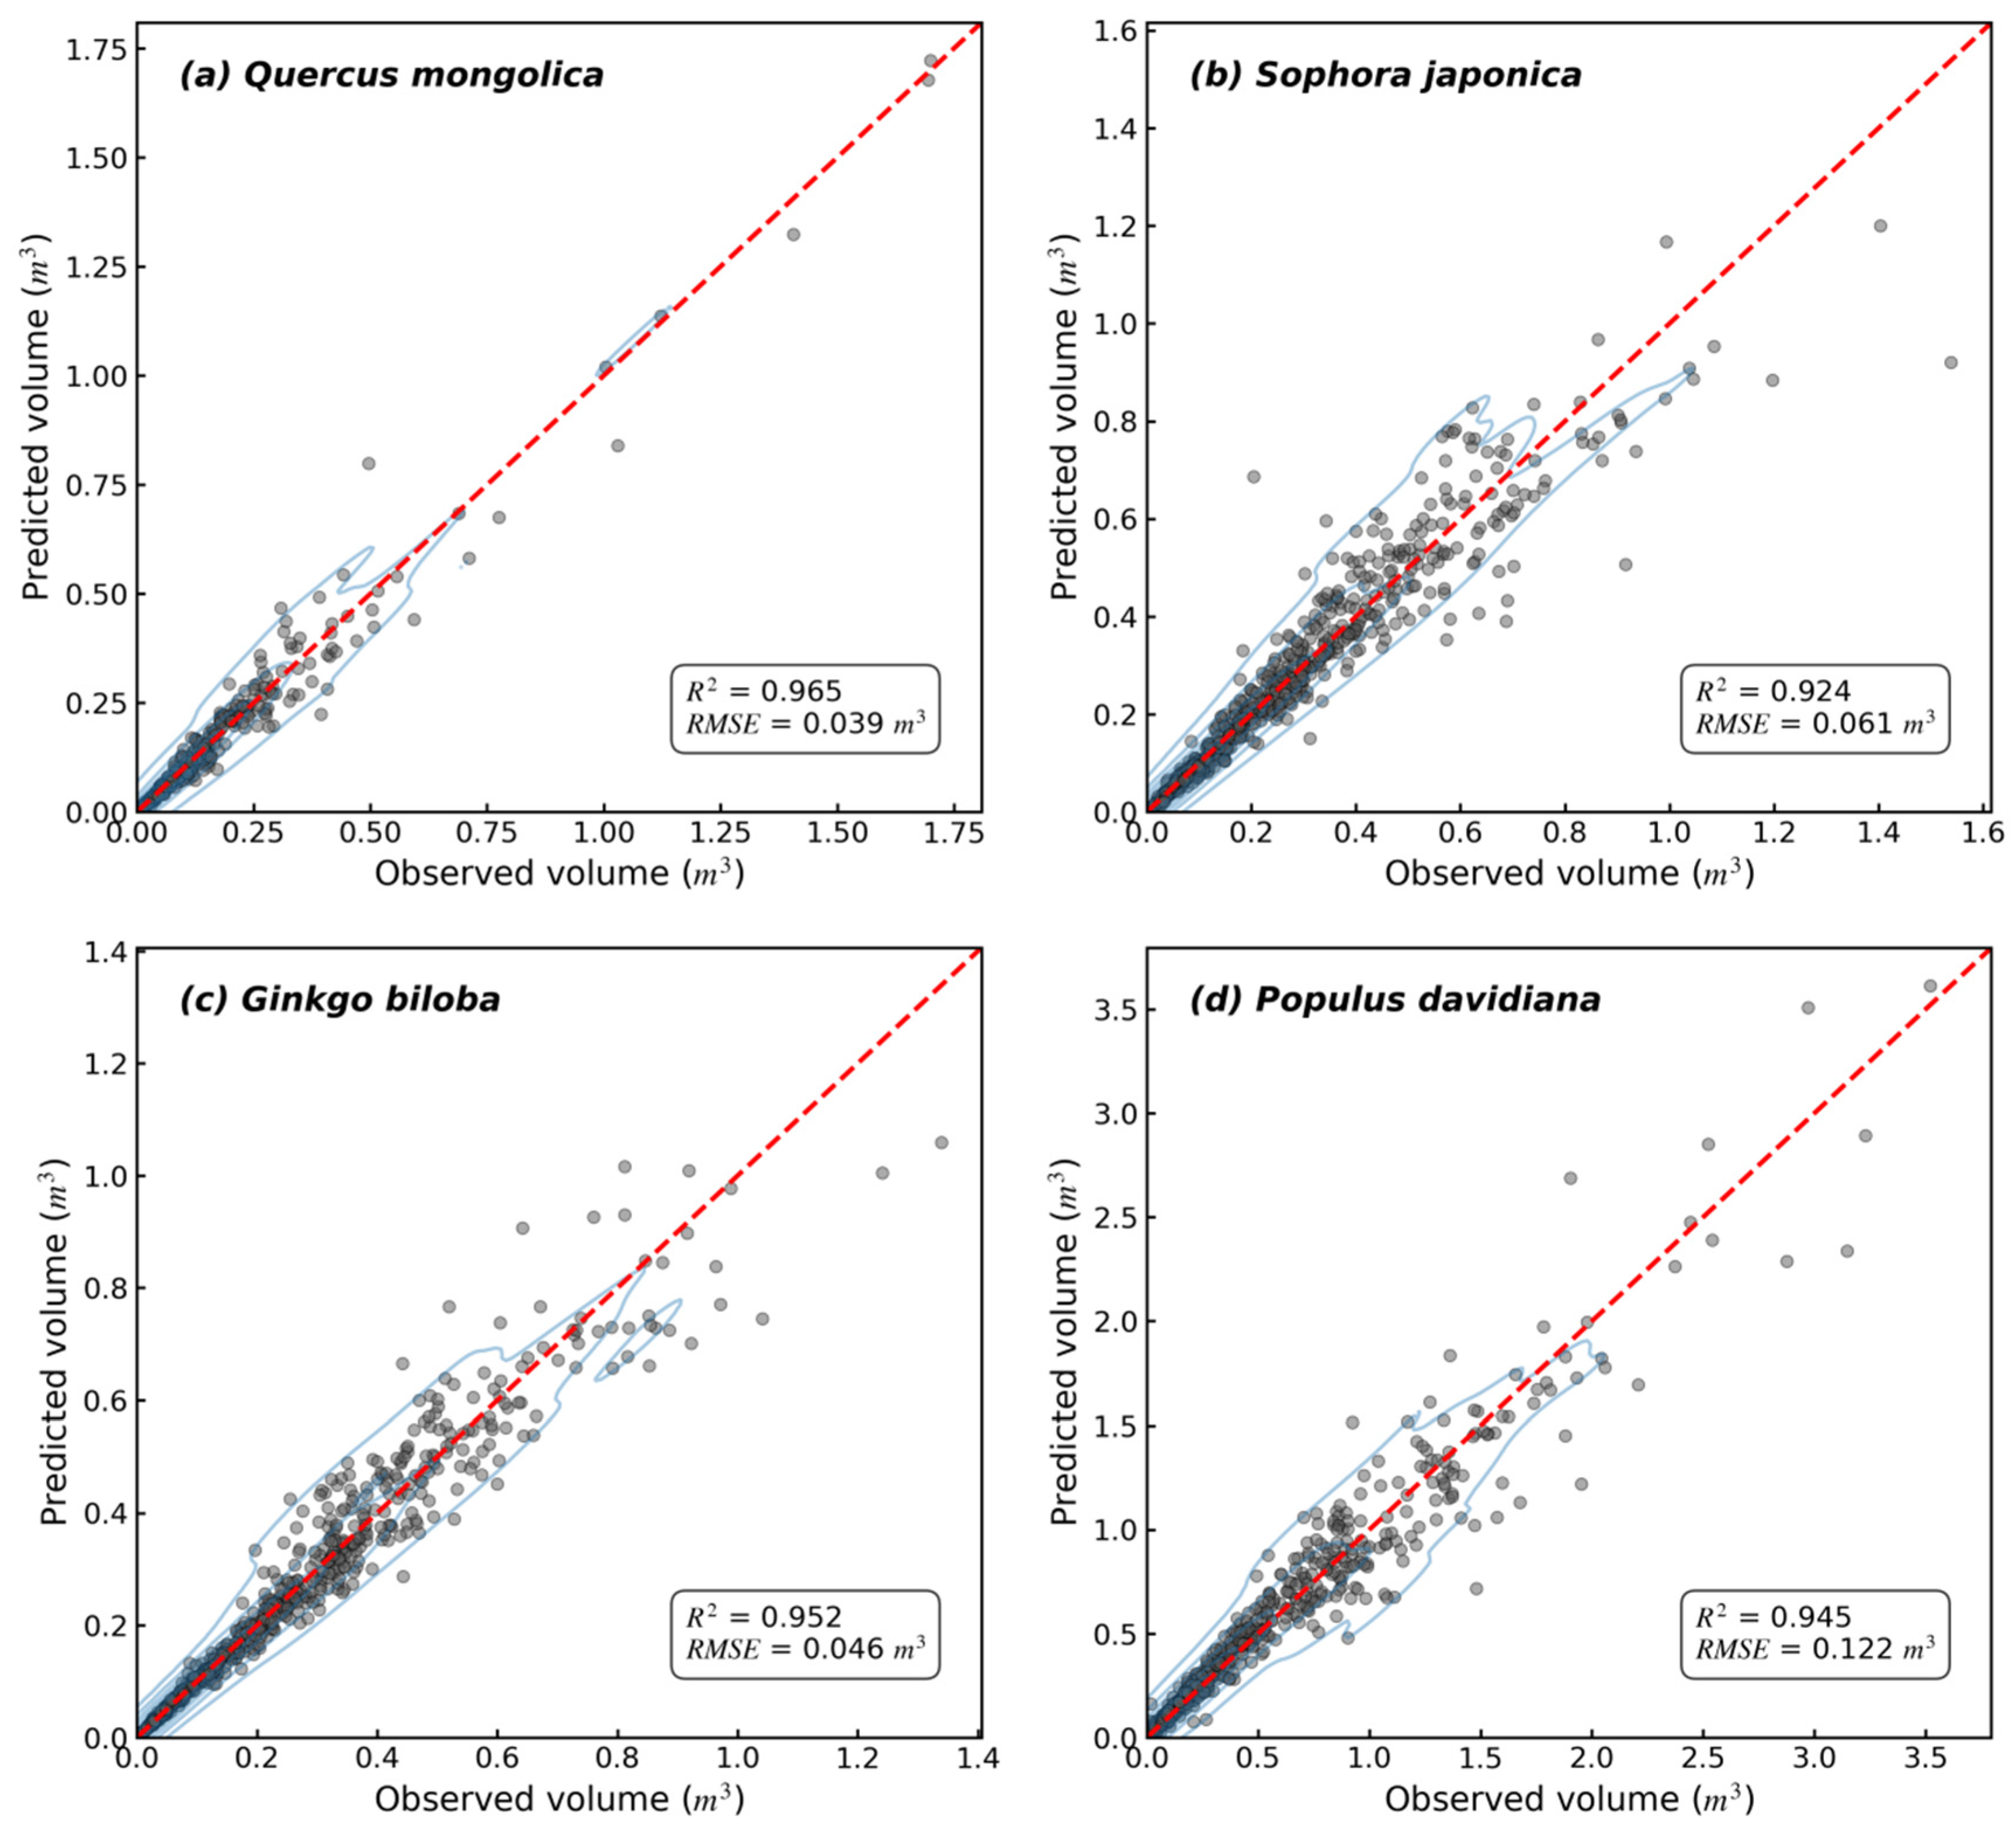
The results showed that bivariate models incorporating both DBH and tree height generally provided the strongest predictive performance among the tested model forms. This finding supports the expectation that height contains useful vertical structural information for open-grown urban trees, especially when the diameter alone cannot fully represent variations in stem form. The improvement was particularly evident for Quercus mongolica and Populus davidiana. In the 10-fold cross-validation, the bivariate model for Quercus mongolica increased the cross-validated R2 from 0.918 to 0.963 and reduced the RMSE from 0.060 to 0.040 m3 compared with the DBH-based linked model. For Populus davidiana, the corresponding R2 increased from 0.865 to 0.941, while the RMSE decreased from 0.191 to 0.127 m3. These results indicate that tree height helped capture a stem-volume variation that was not fully explained by DBH alone.
However, the contribution of the photogrammetric height measurement should be interpreted within a clear data hierarchy. In this study, the DBH and ground diameter were field-measured variables, tree height was obtained as a photogrammetry-derived non-destructive measurement, predicted stem volume was a model-derived output, and section-measured stem volume from felled trees was used as the destructive reference for validation. Therefore, model-estimated stem volume should not be interpreted as directly measured or ‘true’ volume. The main value of handheld photogrammetry lies in providing an efficient and repeatable height measurement for standing urban trees, but it does not eliminate the need for reference data and uncertainty evaluation.
The usefulness of photogrammetric height also varied among species. For Ginkgo biloba, the difference between the bivariate and DBH-based linked models was relatively small, suggesting that its DBH–height–volume relationship was more stable in the sampled urban conditions. By contrast, Quercus mongolica and Populus davidiana benefited more from height inclusion, indicating stronger sensitivity to vertical structural information. These interspecific differences suggest that the value of photogrammetric height measurement depends not only on measurement precision but also on species-specific architecture and urban growth form.
At the same time, photogrammetry-derived height is not equivalent to destructive height measurement. Its accuracy may be affected by crown occlusion, irregular or flat-topped crowns, leaning stems, pruning effects, complex crown architecture, image acquisition geometry, restricted sight lines, and operator experience. These sources of uncertainty are particularly relevant in urban streets, parks, and residential green spaces, where trees are often shaped by long-term management. Therefore, handheld photogrammetry should be regarded as a practical non-destructive measurement tool for urban inventories rather than as a perfect substitute for destructive or high-precision three-dimensional reference measurement. Comparisons with TLS, UAV photogrammetry, mobile LiDAR, or detailed manual stem measurements would further clarify its relative advantages and limitations in future studies.
4.2. Spatial Heterogeneity in Tree-Size Structure and Implications for City-Scale Application
Beijing contains a highly heterogeneous urban forest environment, with differences in green-space type, planting history, management intensity, site conditions, and disturbance regimes across central urban, suburban, and outer suburban ecological areas. The supplementary spatial analysis showed that the DBH and tree height varied among urban zones in a species-specific manner, indicating that the sampled urban trees were not spatially homogeneous. Such variation is expected because trees in different urban zones may experience different levels of growing-space limitations, soil compaction, pruning intensity, irrigation, maintenance frequency, and human disturbance.
This spatial heterogeneity has important implications for the application of species-specific stem-volume equations. The models developed in this study estimate stem volume at the individual-tree level, and their performance can be evaluated using RMSE, bias, residual patterns, cross-validation, and destructive reference validation. However, individual-tree prediction error should be distinguished from city-scale total volume uncertainty. When the equations are applied to a large and heterogeneous urban tree population, uncertainty may be influenced not only by model error but also by species composition, DBH distribution, height distribution, the proportion of large trees, and the spatial clustering of different management conditions.
This distinction is especially important for large trees and structurally irregular urban trees. Residual dispersion and volume uncertainty often increase with tree size, and large-diameter trees can contribute disproportionately to total stem volume at the city scale. If large trees are unevenly distributed among urban zones, city-scale estimates may be sensitive to both model structure and sampling representation. Therefore, future applications should combine species-specific equations with spatially explicit tree-size distributions and management-zone information. Such integration would help reduce uncertainty when individual-tree models are used for broader inventory, planning, or biomass-related assessments.
4.3. Reconfigured Urban Tree Allometry, Tiered Model Hierarchy, and Smoothing Effects
The parameter differences among the four studied species support the need for species-specific equations for urban stem-volume estimation. Urban trees often grow under conditions that differ from natural forests or managed stands, including lower competition, repeated pruning, crown shaping, soil compaction, fragmented rooting space, pavement effects, irrigation, mechanical injury, and urban heat-island influences [
7,
8,
9,
10,
11]. These factors may alter height growth, diameter growth, taper, crown architecture, and the relationship between DBH, height, and stem volume. As a result, two urban trees with a similar DBH may differ substantially in height, stem form, crown structure, and management history. This reconfigured allometry helps explain why equations developed for forest-grown trees may not be directly transferable to urban settings.
The tiered modelling framework was designed to accommodate different levels of data availability in urban inventories. When DBH and photogrammetry-derived height are both available, the bivariate model should be preferred, because it uses a measured diameter and non-destructively acquired vertical structure. When height cannot be obtained reliably, the DBH-based linked model provides a practical alternative by predicting height from the DBH and then estimating volume. When the DBH is unavailable or difficult to measure, the ground-diameter-based chained model offers an additional option. This hierarchy reflects real field conditions in urban forestry, where measurement constraints can vary across streets, parks, residential areas, and renovated green spaces.
Nevertheless, linked models must be interpreted cautiously. When height is predicted from DBH using an H-DBH function, part of the natural individual-tree variation in height may be smoothed. This smoothing effect can reduce the apparent dispersion of modelled values, because individuals with unusual height–diameter relationships are pulled toward the fitted average curve. The effect may be stronger in the ground-diameter-based chained model, where DBH and height are both estimated through intermediate relationships before volume is predicted. Therefore, DBH-based and ground-diameter-based linked models should be regarded as practical inventory alternatives under constrained data conditions, not as substitutes for direct height measurement or destructive reference data.
This issue is particularly relevant for urban trees, because urban growth forms are often highly heterogeneous. Pruning, open-grown crown expansion, stem leaning, forks, basal swelling, and local site disturbance may produce tree forms that deviate from average height–diameter relationships. For this reason, the bivariate model using field-measured DBH and photogrammetry-derived height should be prioritized when field conditions allow. The linked alternatives remain useful, but their predictions should be interpreted with greater caution, especially for heavily pruned, large-diameter, or structurally irregular urban trees.
Ground diameter can provide useful information when DBH measurement is unavailable, but it should not be considered equivalent to DBH in predictive reliability. The ground-diameter-based models generally showed lower performance than the DBH-based and bivariate models. This is reasonable, because ground diameter is more likely to be affected by buttress swelling, root collar irregularity, wounds, pavement, soil exposure, mechanical injury, and maintenance activities. Therefore, the ground diameter may serve as a practical fallback variable in constrained survey situations, but its use should be accompanied by a clear acknowledgement of reduced precision.
4.4. Species-Specific Uncertainty Propagation and Destructive Reference Validation
The Monte Carlo analysis showed that the propagation of photogrammetric height error into stem-volume estimates differed clearly among species. Under the observed level of height-measurement uncertainty, the average relative fluctuation in estimated stem volume was 3.86% for Quercus mongolica, 3.44% for Sophora japonica, 0.73% for Ginkgo biloba, and 3.50% for Populus davidiana. These results indicate that uncertainty transmission is not uniform across species, even when the same measurement and modelling framework is used.
The relatively low propagated uncertainty in Ginkgo biloba may be associated with its lower height-measurement RMSE and more stable height-related response in the bivariate model. Its relatively regular stem form and distinguishable upper crown structure may also facilitate more stable height extraction under photogrammetric measurement. In contrast, Quercus mongolica and Populus davidiana showed stronger sensitivity to height perturbation. For Quercus mongolica, this may be related to more variable crown architecture and the effects of pruning or open-grown branching, which can make treetop identification more difficult. For Populus davidiana, the larger tree-height range and greater structural variability may have amplified the contribution of height uncertainty to final volume prediction.
These findings suggest that measurement quality control should be species-specific. A model with an acceptable average performance may still respond differently to measurement error depending on species architecture, crown form, and height sensitivity in the volume equation. For species with a stronger sensitivity to height error, repeated height measurements, stricter image acquisition protocols, or comparison with alternative three-dimensional measurement methods may be necessary. Therefore, uncertainty propagation should be treated as an integral part of model application rather than as a secondary diagnostic step.
The independent destructive validation dataset provided an important reference for evaluating the proposed workflow. The 55 felled trees were not used to fit the main species-specific equations and therefore offered an external check on the relationship between predicted stem volume and section-measured reference stem volume. The validation results showed acceptable agreement under the available reference dataset, supporting the feasibility of the non-destructive and model-assisted approach within the tested sample range.
However, the destructive validation dataset was limited in sample size and size range relative to the full standing-tree dataset. Therefore, the validation results should not be interpreted as definitive proof of model reliability across all DBH classes, tree ages, pruning histories, site conditions, and management regimes. Prediction uncertainty may be higher for large-diameter trees, old trees, strongly curved stems, forked stems, hollow stems, or heavily pruned individuals. Future studies should expand destructive reference datasets where feasible, especially for large and structurally complex urban trees. Where destructive sampling is not possible, TLS, mobile LiDAR, UAV photogrammetry, or detailed manual stem measurements could provide additional reference information.
4.5. Methodological Limitations and Boundary of Biomass/Carbon-Related Applications
Several methodological limitations should be considered when interpreting the results. First, although the study included a relatively large standing-tree dataset, the destructive validation dataset was limited to 55 felled trees. This provided an independent reference for evaluating model-assisted predictions, but it did not cover the full structural range of the standing-tree dataset. Second, tree height for standing trees was obtained through handheld photogrammetry rather than destructive measurements and may therefore contain observation errors related to crown and field conditions. Third, the DBH-based and ground-diameter-based linked models may smooth part of the natural dispersion in individual-tree structure when height or DBH is predicted through intermediate relationships.
In addition, the present models did not include several biological and management-related variables that may affect stem-volume prediction. This study did not include stem quality, taper irregularity, stem curvature, forks, cavities, pruning history, crown form, tree age, competition history, or detailed site conditions. These variables may be especially important for urban trees, because long-term pruning, open-grown branching, mechanical injury, restricted rooting space, and heterogeneous maintenance can modify the stem form and volume allocation. The absence of these variables does not invalidate the current modelling framework, but it limits the biological interpretation and general applicability of the equations.
The direct output of this study is stem volume, not total tree biomass or carbon stock. This distinction is important, because biomass estimation requires additional information on branches, leaves, roots, wood density, biomass expansion factors, and belowground allocation, while carbon-stock estimation further requires carbon-concentration parameters and uncertainty propagation across the volume–biomass–carbon conversion chain. Therefore, the developed equations should be regarded as a stem-volume basis that may support future biomass- and carbon-related assessments when appropriate conversion parameters are available. They should not be interpreted as direct biomass or carbon-stock models.
Future work should strengthen the proposed framework in several directions. Larger destructive reference datasets should be collected where feasible, particularly for large-diameter, old, heavily pruned, forked, hollow, or structurally irregular urban trees. Additional variables such as stem quality, taper measurements, crown metrics, pruning records, tree age, competition history, and site conditions should be incorporated to improve the biological explanatory capacity of urban tree volume models. Finally, direct comparison with TLS, UAV photogrammetry, mobile LiDAR, and other three-dimensional sensing methods would help determine how handheld photogrammetry can be most effectively integrated into operational urban forest inventories.
5. Conclusions
This study developed a species-specific and model-assisted framework for estimating the stem volume of four dominant urban broad-leaved tree species in Beijing: Quercus mongolica, Sophora japonica, Ginkgo biloba, and Populus davidiana. The framework integrated field-measured DBH and ground diameter, photogrammetry-derived non-destructive tree height, tiered stem-volume modelling, 10-fold cross-validation, Monte Carlo uncertainty propagation, and independent destructive reference validation using 55 felled trees. The direct outcome of this study is stem-volume estimation rather than the direct estimation of biomass or carbon stock.
Among the tested model forms, the bivariate models using DBH and photogrammetry-derived height generally showed the strongest predictive performance. This indicates that tree height provides useful additional structural information for representing stem-volume variation in open-grown urban trees. The DBH-based linked models and ground-diameter-based chained models can serve as practical alternatives when complete field measurements are unavailable, but they should be interpreted cautiously, because predicted height or predicted DBH may smooth part of the natural individual-tree variation.
The independent destructive reference dataset provided useful evidence for evaluating the feasibility of the proposed workflow. However, the validation dataset was limited in sample size and size range relative to the full standing-tree dataset. Therefore, the validation results should be understood as support for the preliminary applicability of the model-assisted approach within the available reference conditions rather than as definitive validation across all DBH classes, tree ages, pruning histories, site conditions, and urban management regimes.
The developed equations may provide a practical basis for urban tree inventory, stem-volume assessment, and management planning in Beijing. They may also support future biomass- and carbon-related assessments when combined with appropriate wood-density, biomass-conversion, and carbon-concentration parameters. Future research should expand destructive reference datasets, especially for large-diameter and structurally irregular urban trees, and should incorporate stem quality, taper irregularity, stem curvature, forks, cavities, pruning history, crown form, tree age, competition history, and detailed site conditions. Direct comparisons with TLS, UAV photogrammetry, mobile LiDAR, and other three-dimensional sensing methods would further strengthen the methodological basis for non-destructive urban tree volume estimation.