Article

Integrative Structural, Physiological, and Transcriptomic Analyses Reveal Key Determinants of Anthracnose Resistance in Rubber Tree (Hevea brasiliensis)


1
State Key Laboratory of Tropical Crop Breeding, Sanya Institute of Breeding and Multiplication, School of Tropical Agriculture and Forestry, Hainan University, Sanya 572025, China
2
Zhanjiang Experimental Station, Chinese Academy of Tropical Agricultural Sciences, Zhanjiang 524091, China
*
Authors to whom correspondence should be addressed.
Forests 2026, 17(5), 629; https://doi.org/10.3390/f17050629
Submission received: 29 March 2026 / Revised: 1 May 2026 / Accepted: 18 May 2026 / Published: 21 May 2026

Abstract

Anthracnose, caused by Colletotrichum spp., is a major foliar disease limiting rubber tree (Hevea brasiliensis) productivity. To uncover resistance mechanisms, we compared resistant and susceptible germplasm using an integrated framework combining leaf structural analysis, physiological defense profiling, and transcriptome sequencing. Resistant germplasm exhibited lower stomatal density and more compact mesophyll, likely restricting pathogen entry and within-leaf spread. Following inoculation, resistant accessions showed stronger antioxidant responses, with higher activities of superoxide dismutase (SOD) and peroxidase (POD), and elevated phenylpropanoid-related enzymes, including polyphenol oxidase (PPO) and phenylalanine ammonia-lyase (PAL), peaking at 24–48 h post inoculation. These responses were accompanied by enhanced reactive oxygen species (ROS) accumulation (H2O2) but reduced lipid peroxidation (malondialdehyde), indicating efficient oxidative stress regulation. Microscopic observation revealed delayed infection progression and postponed differentiation of infection structures in resistant germplasm. Transcriptomic analysis further demonstrated that differentially expressed genes were mainly enriched in pathways related to signal transduction and secondary metabolism, particularly phenylpropanoid metabolism and related secondary metabolic pathways. Together, these results suggest that anthracnose resistance is mediated by coordinated structural barriers, redox homeostasis, and transcriptional regulation of defense networks. This study provides a mechanistic framework for resistance-oriented breeding and the utilization of resistant germplasm in rubber tree.

1. Introduction

Natural rubber is an essential industrial raw material, and rubber tree (Hevea brasiliensis) is the primary commercial source, contributing more than 90% of global natural rubber production [1,2]. Anthracnose is among the most destructive foliar diseases constraining rubber plantations worldwide [3]. It can infect leaves, shoots, fruits, and green bark tissues, causing defoliation, dieback, and yield losses, and may trigger severe production reductions under epidemic conditions [4,5]. Anthracnose is mainly caused by species in the genus Colletotrichum, particularly members of the C. gloeosporioides species complex, which exhibit diverse infection strategies and pathogenicity [6].
Deploying resistant germplasm is widely considered the most effective and environmentally sustainable strategy for anthracnose management [7]. However, research on rubber tree has largely emphasized resistance screening and identification, whereas systematic side-by-side comparisons between resistant and susceptible germplasm remain limited. Consequently, the biological basis underlying resistance divergence is still insufficiently resolved, which constrains resistance breeding and mechanism-based management. Plant resistance to foliar pathogens relies on coordinated responses across structural, physiological, and molecular levels [8]. Structural traits, including stomatal features and internal leaf anatomy, can influence pathogen entry and colonization. Because stomata serve as natural entry points for many foliar pathogens, stomatal density can affect infection efficiency [9]. Moreover, leaf tissue organization and compactness may modulate intercellular space availability and thereby alter pathogen proliferation [10]. In addition, internal leaf structure, including tissue organization and compactness, can affect pathogen colonization by modulating intercellular space [11]. Nevertheless, the extent to which these structural traits contribute to anthracnose resistance in rubber tree remains unclear.
At the physiological level, defense responses are closely linked to reactive oxygen species (ROS) metabolism and secondary metabolite biosynthesis. ROS such as hydrogen peroxide (H2O2) can act as defense signals, whereas excessive ROS accumulation may cause oxidative damage [12]. Antioxidant enzymes including superoxide dismutase (SOD) and peroxidase (POD) contribute to ROS homeostasis, while enzymes related to phenylpropanoid metabolism, such as phenylalanine ammonia-lyase (PAL) and polyphenol oxidase (PPO), promote the biosynthesis of lignin and flavonoids [13,14]. Resistant plants often exhibit stronger antioxidant capacity and more active secondary metabolism than susceptible ones [15]. At the molecular level, transcriptome analysis has provided important insights into plant–pathogen interactions. Comparative studies between resistant and susceptible genotypes have revealed that plant defense involves multiple signaling pathways, including MAPK cascades, plant hormone signaling, and secondary metabolism pathways [16,17]. Although transcriptomic studies have been conducted in several crops, integrative analyses combining structural, physiological, and molecular perspectives remain limited in rubber tree.
Therefore, we performed a comprehensive comparative analysis of resistant versus susceptible rubber tree germplasm in response to anthracnose infection. By integrating structural characterization, physiological profiling, and transcriptomic analyses, this study aims to identify key resistance-associated differences and provide a mechanistic basis for resistance breeding in rubber tree.

2. Materials and Methods

2.1. Plant Materials and Pathogen

Rubber tree (Hevea brasiliensis) germplasm accessions used in this study were obtained from the germplasm nursery of the Zhanjiang Experimental Station, Chinese Academy of Tropical Agricultural Sciences (Zhanjiang, Guangdong, China). Six rubber tree germplasm accessions (ZhanShi 477-6, RO42, Reyan 879, ZhanShi 327-20, ZhanShi 5006, and Reyan 73397) were selected based on previous evaluations and used for comparative analysis in this study. The pathogen used for inoculation was Colletotrichum siamense strain M-2, isolated and maintained in our laboratory.

2.2. Pathogen Culture, Inoculation, and Resistance Evaluation

The C. siamense M-2 strain was initially grown on potato dextrose agar (PDA) at 28 °C in the dark for 3–4 days. Subsequently, three mycelial plugs (~2 mm in diameter) taken from the colony edge were inoculated into 100 mL of potato dextrose broth (PDB) and incubated at 28 °C with constant shaking at 125 rpm for 3–4 days to promote conidial formation. The suspension was filtered through four layers of sterile gauze and centrifuged at 2000 rpm for 5 min. The conidia were resuspended in sterile water and adjusted to 1 × 10⁶ conidia mL−1 using a hemocytometer, with 0.02% Tween-80 added to improve dispersion. Healthy leaves at the color-change stage (i.e., transitional leaves shifting from light green to fully expanded mature green) were collected, washed with sterile water, and air-dried. No mechanical wounding was applied prior to inoculation. Leaves were placed in plastic boxes lined with moist gauze, and petioles were wrapped with wet cotton to maintain humidity. Inoculation was performed using two methods: (i) spray inoculation, in which conidial suspension was evenly sprayed onto both leaf surfaces using a handheld sprayer, to evaluate disease index and observe infection processes under conditions mimicking natural infection; (ii) drop inoculation, in which 5 μL of suspension was applied to both sides of the leaf using a micropipette, to measure lesion diameter and provide a more direct assessment of resistance differences among germplasm groups. After inoculation, leaves were incubated at 28 °C under relative humidity > 90%. A mock inoculation using sterile water containing 0.02% Tween-80 was included as the control treatment. Each treatment included 12 leaves with three biological replicates, and measurements were performed in triplicate. Disease symptoms were evaluated at 3 days post inoculation. Lesion diameter was measured using the cross method, and disease severity was assessed on a 0–5 scale based on lesion coverage, where 0 indicates no visible symptoms and 5 indicates severe infection (>50% of leaf area affected), according to the agricultural industry standard (NY/T 3518-2019). The disease index was subsequently calculated to classify resistance levels [18].

2.3. Analysis of Leaf Structural Characteristics

Leaf structural traits were analyzed using leaves from all six germplasm accessions at the same developmental stage. Stomatal characteristics were determined using the nail polish imprint method on the abaxial leaf surface. Imprints were observed under a light microscope, and stomatal density was calculated from 10 randomly selected fields per sample. Stomatal length and width were measured for 10 stomata per field, and stomatal aperture area was calculated as S = (length × width × π/4). Leaf anatomical structures were examined using paraffin-embedded sections fixed in 50% FAA solution for 24 h. Sections were stained with safranin–fast green and scanned for analysis. Thickness of the upper epidermis (UET), palisade tissue (PT), spongy tissue (ST) and lower epidermis (LET) and total leaf thickness (LT) were measured. Derived indices were calculated as follows: cell tightness ratio (CTR) = PT/LT; spongy ratio (SR) = ST/LT; and palisade-to-spongy ratio (P/S) = PT/ST. Measurements were performed on 10 fields per sample with three replicates, with each measurement performed in triplicate.

2.4. Physiological and Biochemical Assays

Resistant (ZhanShi 477-6) and susceptible (ZhanShi 5006) germplasm accessions were selected for physiological analysis. Leaves were inoculated as described above, with sterile water used as a control. Samples were collected at 0, 12, 24, 48, and 72 h post inoculation. For enzyme extraction, 0.5 g of leaf tissue was homogenized in 5 mL pre-cooled phosphate buffer (PBS, pH 7.8) and centrifuged at 8500 rpm at 4 °C for 20 min. The supernatant was collected as a crude enzyme extract and used for the determination of SOD, POD, PPO, and PAL activities [19]. SOD activity was determined using the nitroblue tetrazolium (NBT) method and measured at 560 nm after 20 min illumination (4000 lux). POD activity was measured using guaiacol as substrate, and absorbance was recorded at 470 nm every 1 min. PPO activity was determined using catechol as substrate at 525 nm. PAL activity was measured at 290 nm using L-phenylalanine as substrate after incubation at 30 °C for 30 min. For H2O2 determination, 0.2 g of leaf tissue was homogenized in acetone and reacted with titanium sulfate, and absorbance was measured at 425 nm. MDA content was determined using thiobarbituric acid (TBA) reaction and measured at 532 and 600 nm [20]. Enzyme activities were expressed on a fresh weight basis (U g−1 FW), and H2O2 and MDA contents were expressed as μmol g−1 FW and nmol g−1 FW, respectively. Each treatment included three biological replicates, and measurements were performed in triplicate.

2.5. Infection Process Observation

Leaves from resistant and susceptible germplasm were sampled at 0, 2, 4, 12, 24, 36, 48, 72, and 96 h post inoculation. Leaf segments (2 cm × 2 cm) were decolorized in a solution of 0.15% trichloroacetic acid and chloroform (5:1, v/v) for 12 h. After washing, samples were stained with 1% Congo red under vacuum for 10 min and incubated for 2 h. Fungal infection structures, including conidia, germ tubes, appressoria, and penetration pegs, were observed under a light microscope. At least 200 conidia were counted per sample (n = 3 biological replicates), with each measurement performed in triplicate.

2.6. RNA Sequencing and Data Analysis

Leaf samples from resistant and susceptible rubber tree germplasm were collected at 0 and 24 h post inoculation and immediately stored at −80 °C. Total RNA was extracted, and cDNA libraries were prepared for RNA sequencing by a commercial provider. Subsequent steps, including library construction, alignment of reads to the reference genome, quantification of gene expression, and functional enrichment analyses, were carried out by Gene Denovo Biotechnology Co. (Guangzhou, China) following standard protocols [21]. The raw RNA-seq datasets have been deposited in the National Center for Biological Information (CNCB, https://www.cncb.ac.cn/, accessed on 1 April 2026), China, under BioProject accession PRJCA060963. After quality filtering, clean reads were mapped to the rubber tree reference genome (ASM3005281v1) using HISAT2. Gene expression levels were calculated as fragments per kilobase of transcript per million mapped reads (FPKM). Differentially expressed genes (DEGs) were determined with DESeq2 using thresholds of |fold change| > 2 and a false discovery rate (FDR) < 0.05.

2.7. Statistical Analysis

Statistical analyses were performed using SPSS software (version 13.0; SPSS Inc., Armonk, NY, USA). Differences were considered statistically significant at p < 0.05. All results are presented as the mean of at least three independent replicates.

3. Results

3.1. Evaluation of Anthracnose Resistance in Rubber Tree Germplasm

Significant variation in anthracnose resistance was observed across the six rubber tree germplasm accessions under artificial inoculation (Table 1). Reyan 879, Zhanshi 477-6, and RO42 were classified as resistant (R), with lesion diameters ranging from 0.24 to 0.81 cm and disease index values between 10.67% and 14.67%. In contrast, Reyan 73397 and Zhanshi 327-20 were categorized as susceptible (S), showing larger lesion diameters (1.00–1.09 cm) and higher disease index values (32.00%–37.33%). Zhanshi 5006 exhibited the highest lesion diameter (1.17 cm) and disease index (49.33%), and was classified as highly susceptible (HS). Overall, resistant germplasm developed significantly smaller lesions and lower disease index values than susceptible germplasm, indicating robust phenotypic divergence in anthracnose response.

3.2. Differences in Leaf Structural Traits Between Resistant and Susceptible Rubber Tree Germplasm

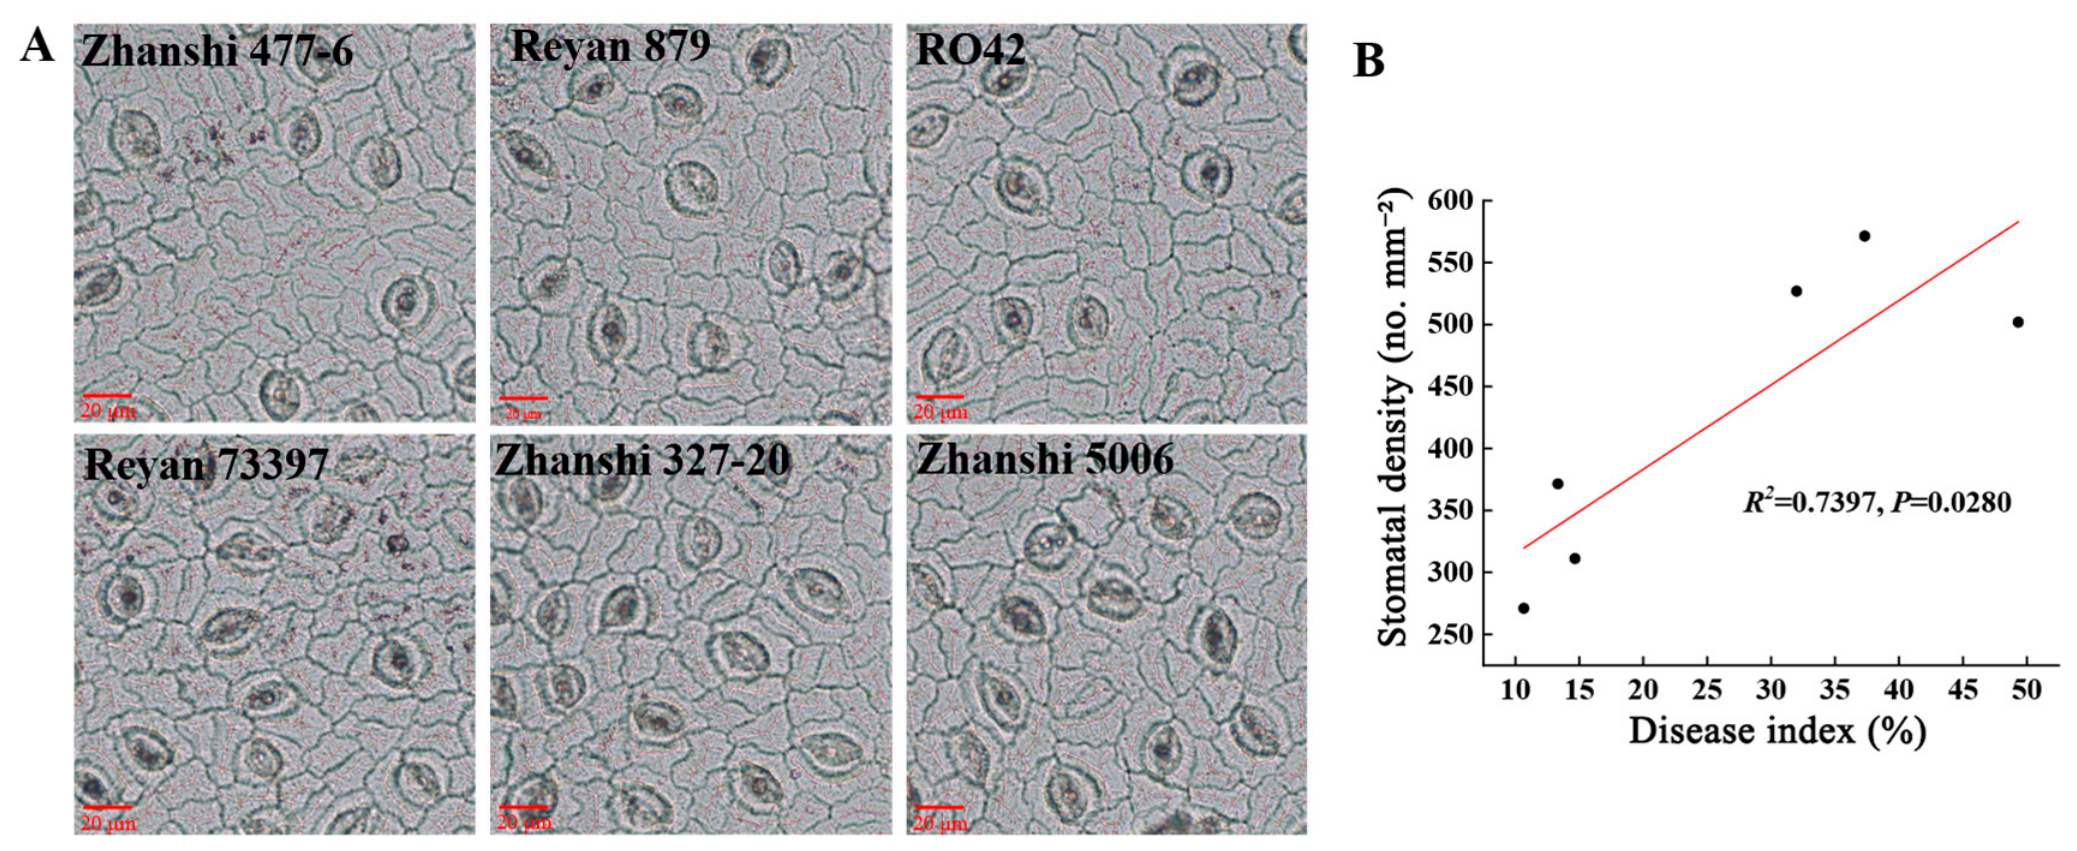
To compare the leaf structural characteristics of resistant and susceptible rubber tree germplasm, six accessions were systematically analyzed. The results showed that stomatal density in resistant germplasm was significantly lower than that in susceptible germplasm, whereas stomatal length, width, and opening area did not exhibit consistent variation patterns between resistant and susceptible groups (Figure 1A; Table 2). Correlation analysis further revealed a significant positive relationship between disease index and stomatal density (R2 = 0.7397; Figure 1B).
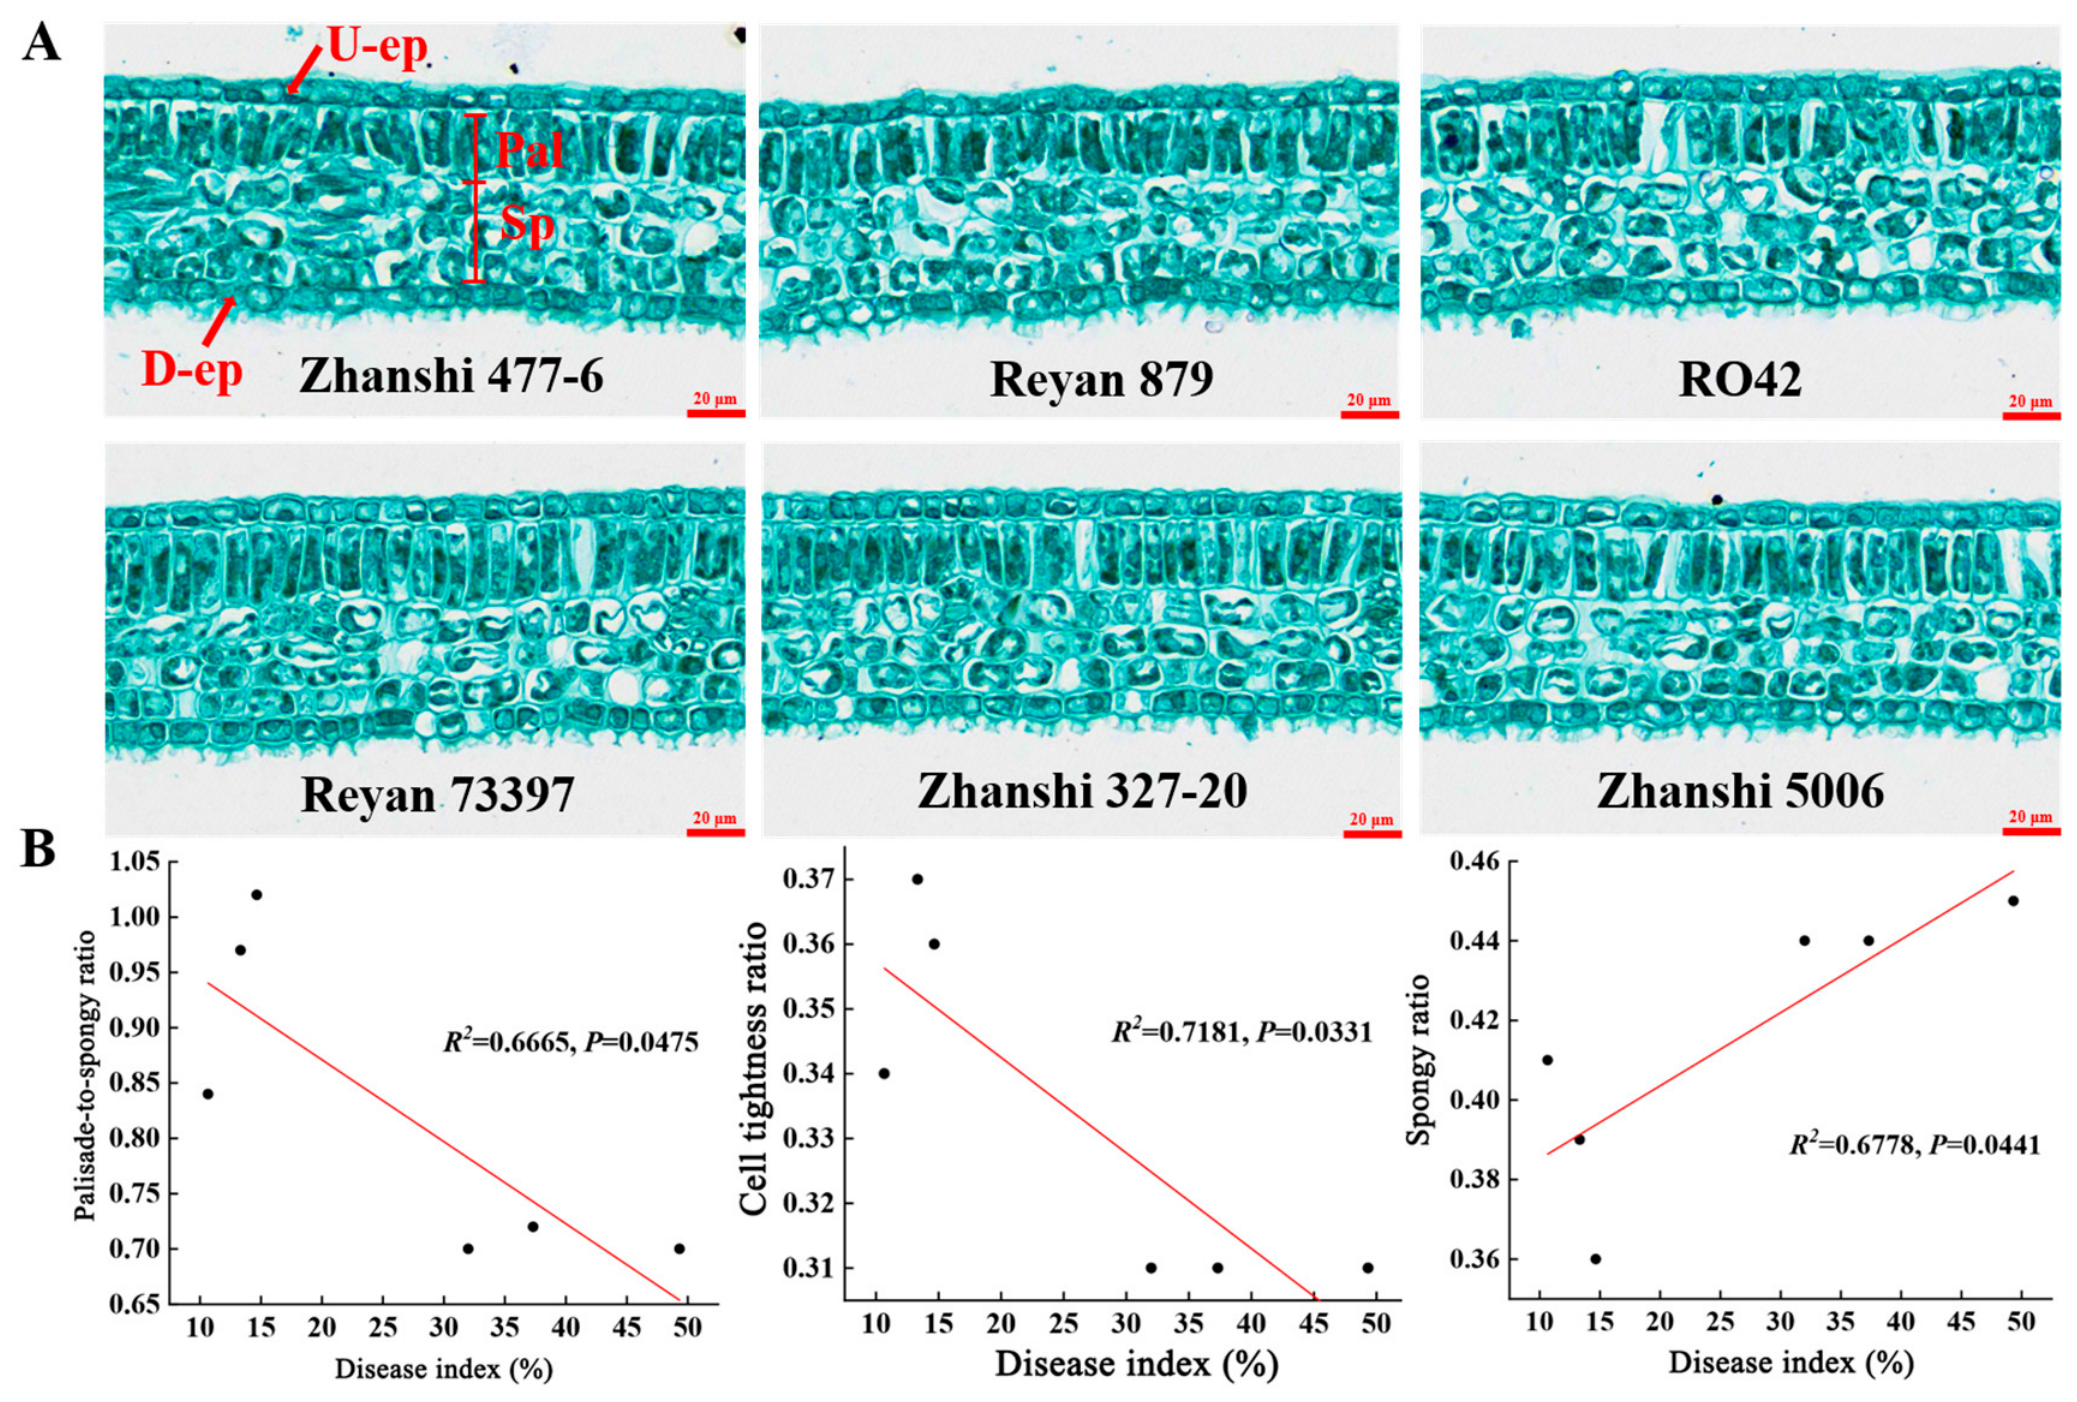
In terms of leaf anatomical structure, no significant differences were observed in the thickness of the upper epidermis, lower epidermis, palisade tissue, or spongy tissue or total leaf thickness between resistant and susceptible germplasm (Figure 2A; Table 3). In contrast, the palisade-to-spongy ratio (P/S) and cell tightness ratio (CTR) were significantly higher in resistant germplasm, whereas the spongy ratio (SR) was significantly lower compared with susceptible germplasm. Further correlation analysis indicated that the disease index was positively correlated with SR (R2 = 0.6778), but negatively correlated with P/S (R2 = 0.6665) and CRT (R2 = 0.7181) (Figure 2B).

3.3. Temporal Changes in Defense-Related Enzyme Activities and Oxidative Stress Indicators

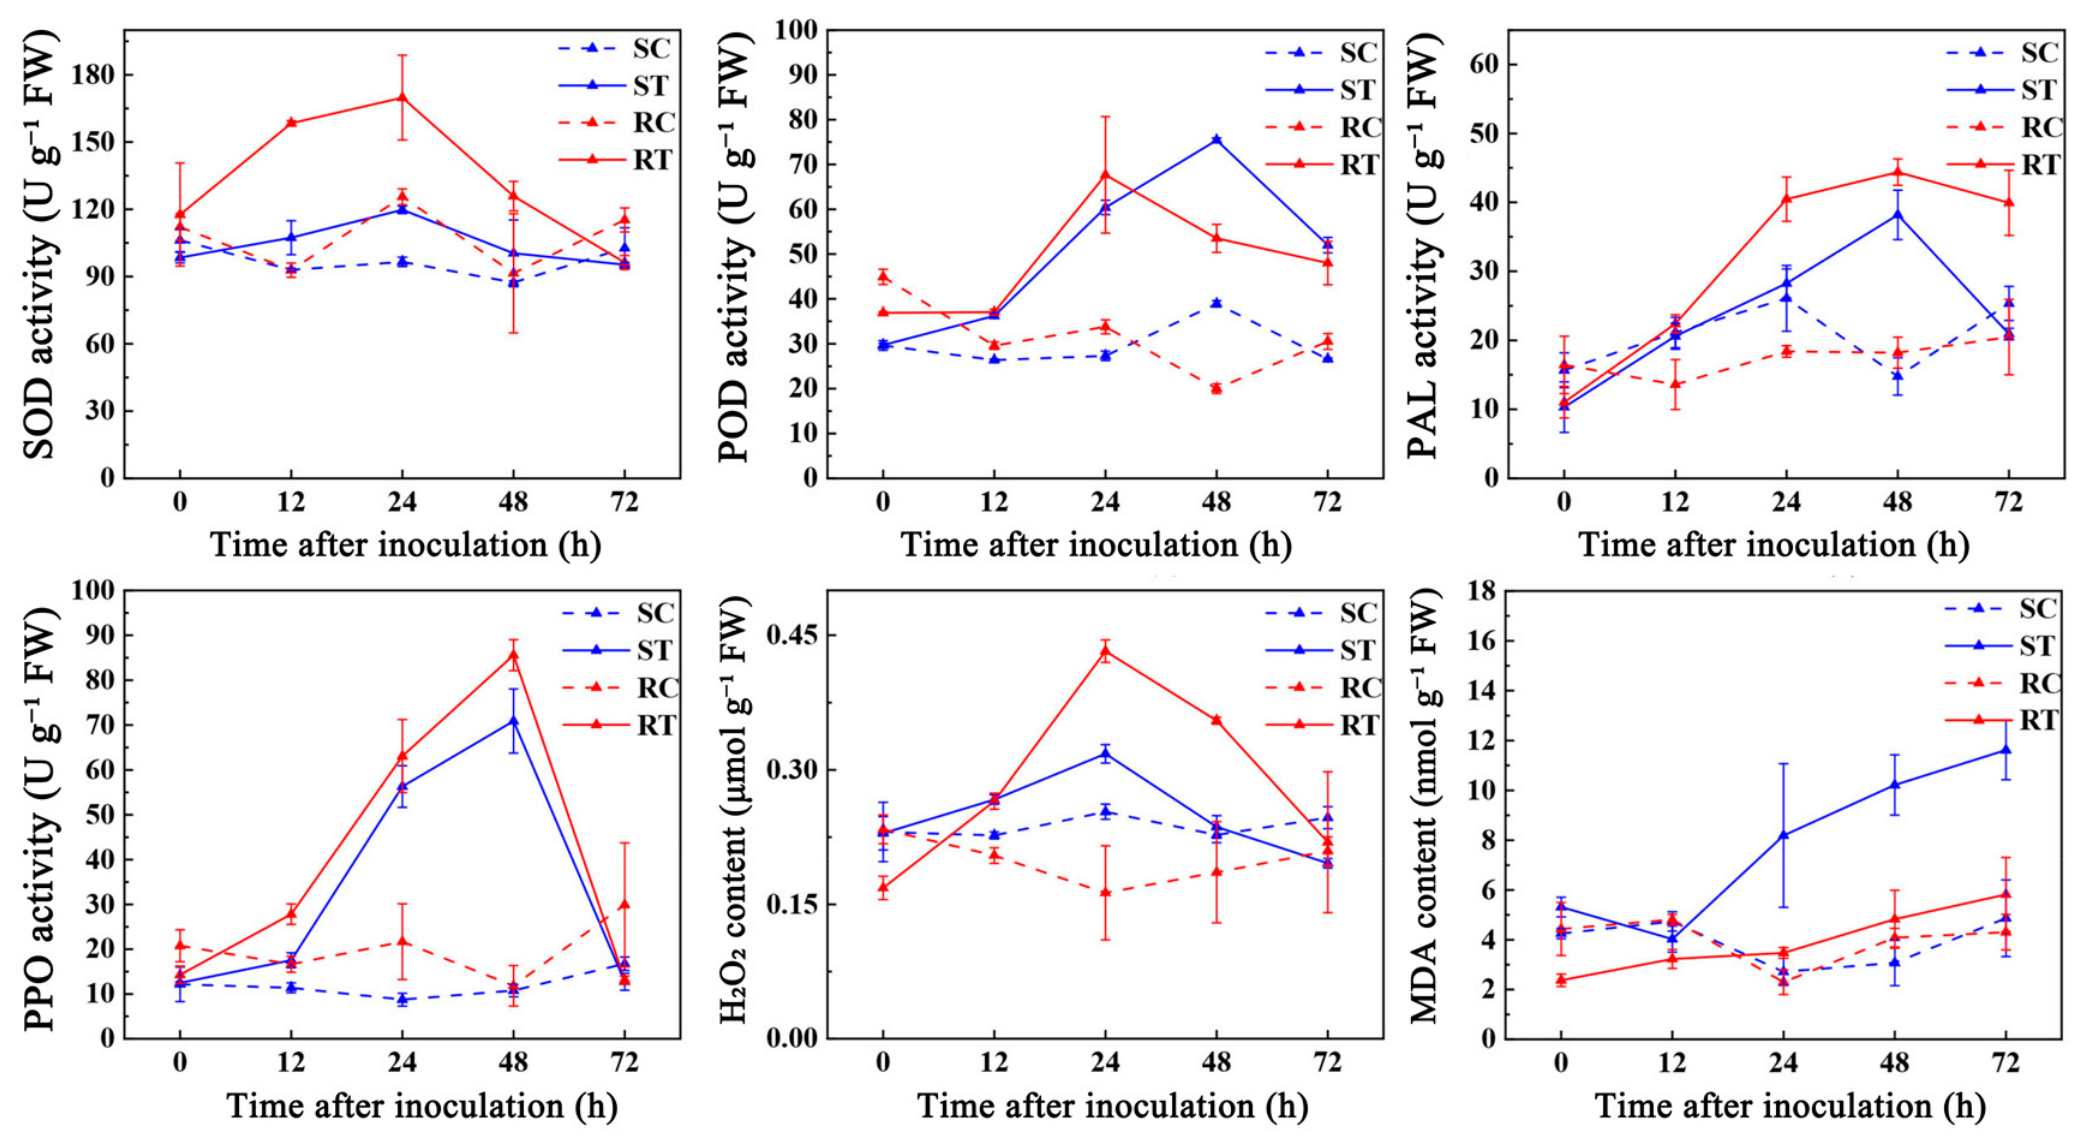
Following anthracnose inoculation, the activities of SOD, POD, PPO, and PAL exhibited dynamic changes in both resistant and susceptible germplasm (Figure 3). Overall, enzyme activities were induced after inoculation, with more pronounced increases observed in the resistant germplasm Zhanshi 477-6 (R) compared with the susceptible germplasm Zhanshi 5006 (S), particularly at peak stages (24–48 h post inoculation). Specifically, SOD activity in resistant germplasm increased rapidly and reached a peak at 24 h, followed by a gradual decline, whereas susceptible germplasm showed a relatively moderate increase. POD activity exhibited a similar early induction pattern, with resistant germplasm peaking at 24 h, although susceptible germplasm showed a delayed peak at 48 h. PPO and PAL activities were also significantly elevated in resistant germplasm, particularly at 24–48 h, with higher peak levels than those observed in susceptible germplasm. Quantitatively, enzyme activities in resistant germplasm were generally higher than those in susceptible germplasm, with differences of approximately 20%–80% depending on the time point.
In addition, oxidative stress indicators showed distinct temporal patterns. H2O2 content increased rapidly after inoculation and reached higher levels in resistant germplasm at early stages (12–24 h), whereas susceptible germplasm exhibited comparatively lower accumulation. In contrast, malondialdehyde (MDA) content increased more markedly in susceptible germplasm, while remaining lower in resistant germplasm at later stages (48–72 h), indicating reduced membrane lipid peroxidation.

3.4. Temporal Progression of Infection and Infection Structure Differentiation in Resistant and Susceptible Rubber Tree Germplasm

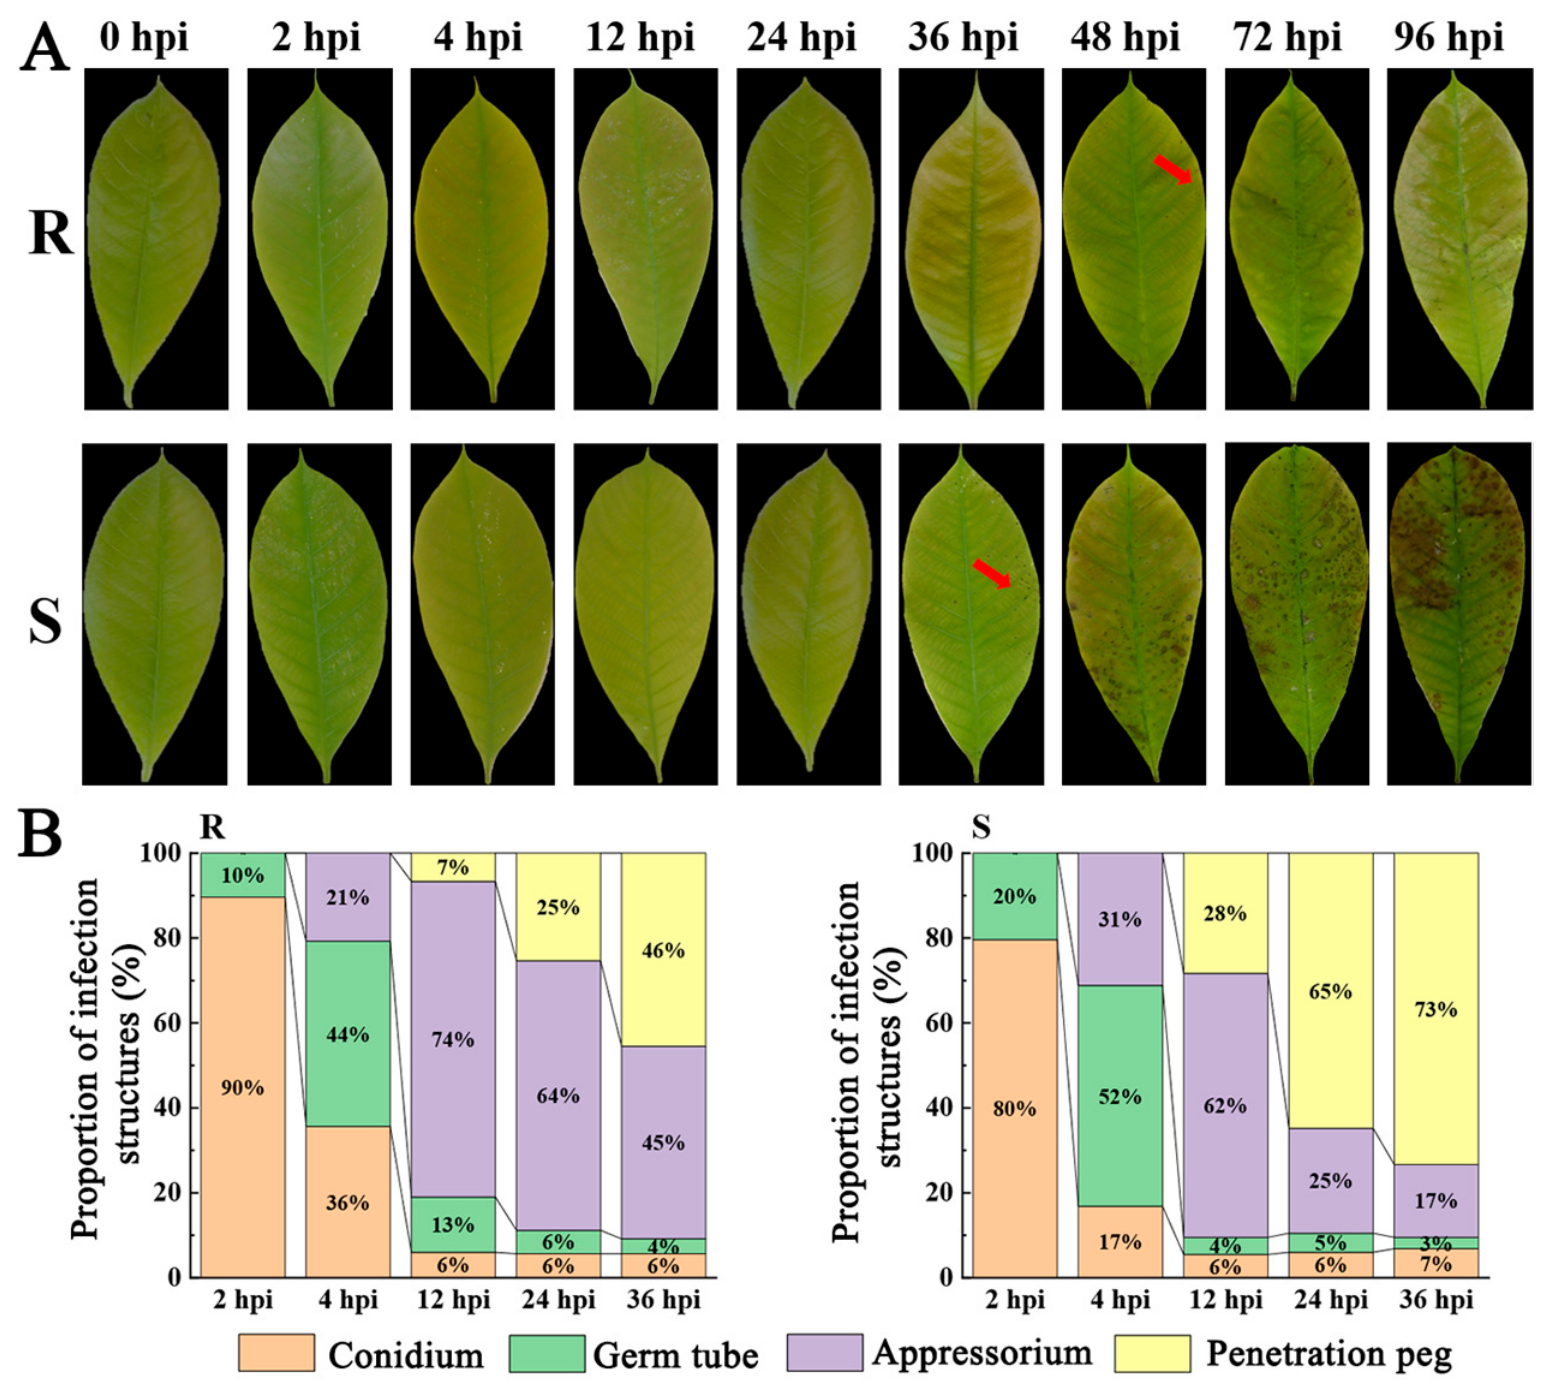
Clear differences in infection progression were observed between resistant and susceptible rubber tree germplasm after inoculation with Colletotrichum siamense (Figure 4). Disease symptoms appeared at 48 hpi in resistant leaves, whereas susceptible leaves showed earlier symptom development at 36 hpi. Resistant leaves exhibited only slight chlorosis with limited lesion expansion, while susceptible leaves displayed rapid lesion development at later stages (48–96 hpi). Infection structure analysis indicated a similar early progression in both germplasm groups, with conidia dominating at 2 hpi and germ tubes and appressoria becoming predominant at 4–12 hpi. However, at later stages, penetration pegs accumulated more rapidly in susceptible germplasm, reaching 65% and 73% at 24 and 36 hpi, respectively, compared with 25% and 46% in resistant germplasm, indicating a faster transition to host penetration in susceptible leaves.

3.5. Transcriptomic Variation and Differential Gene Expression Analysis Between Resistant and Susceptible Germplasm

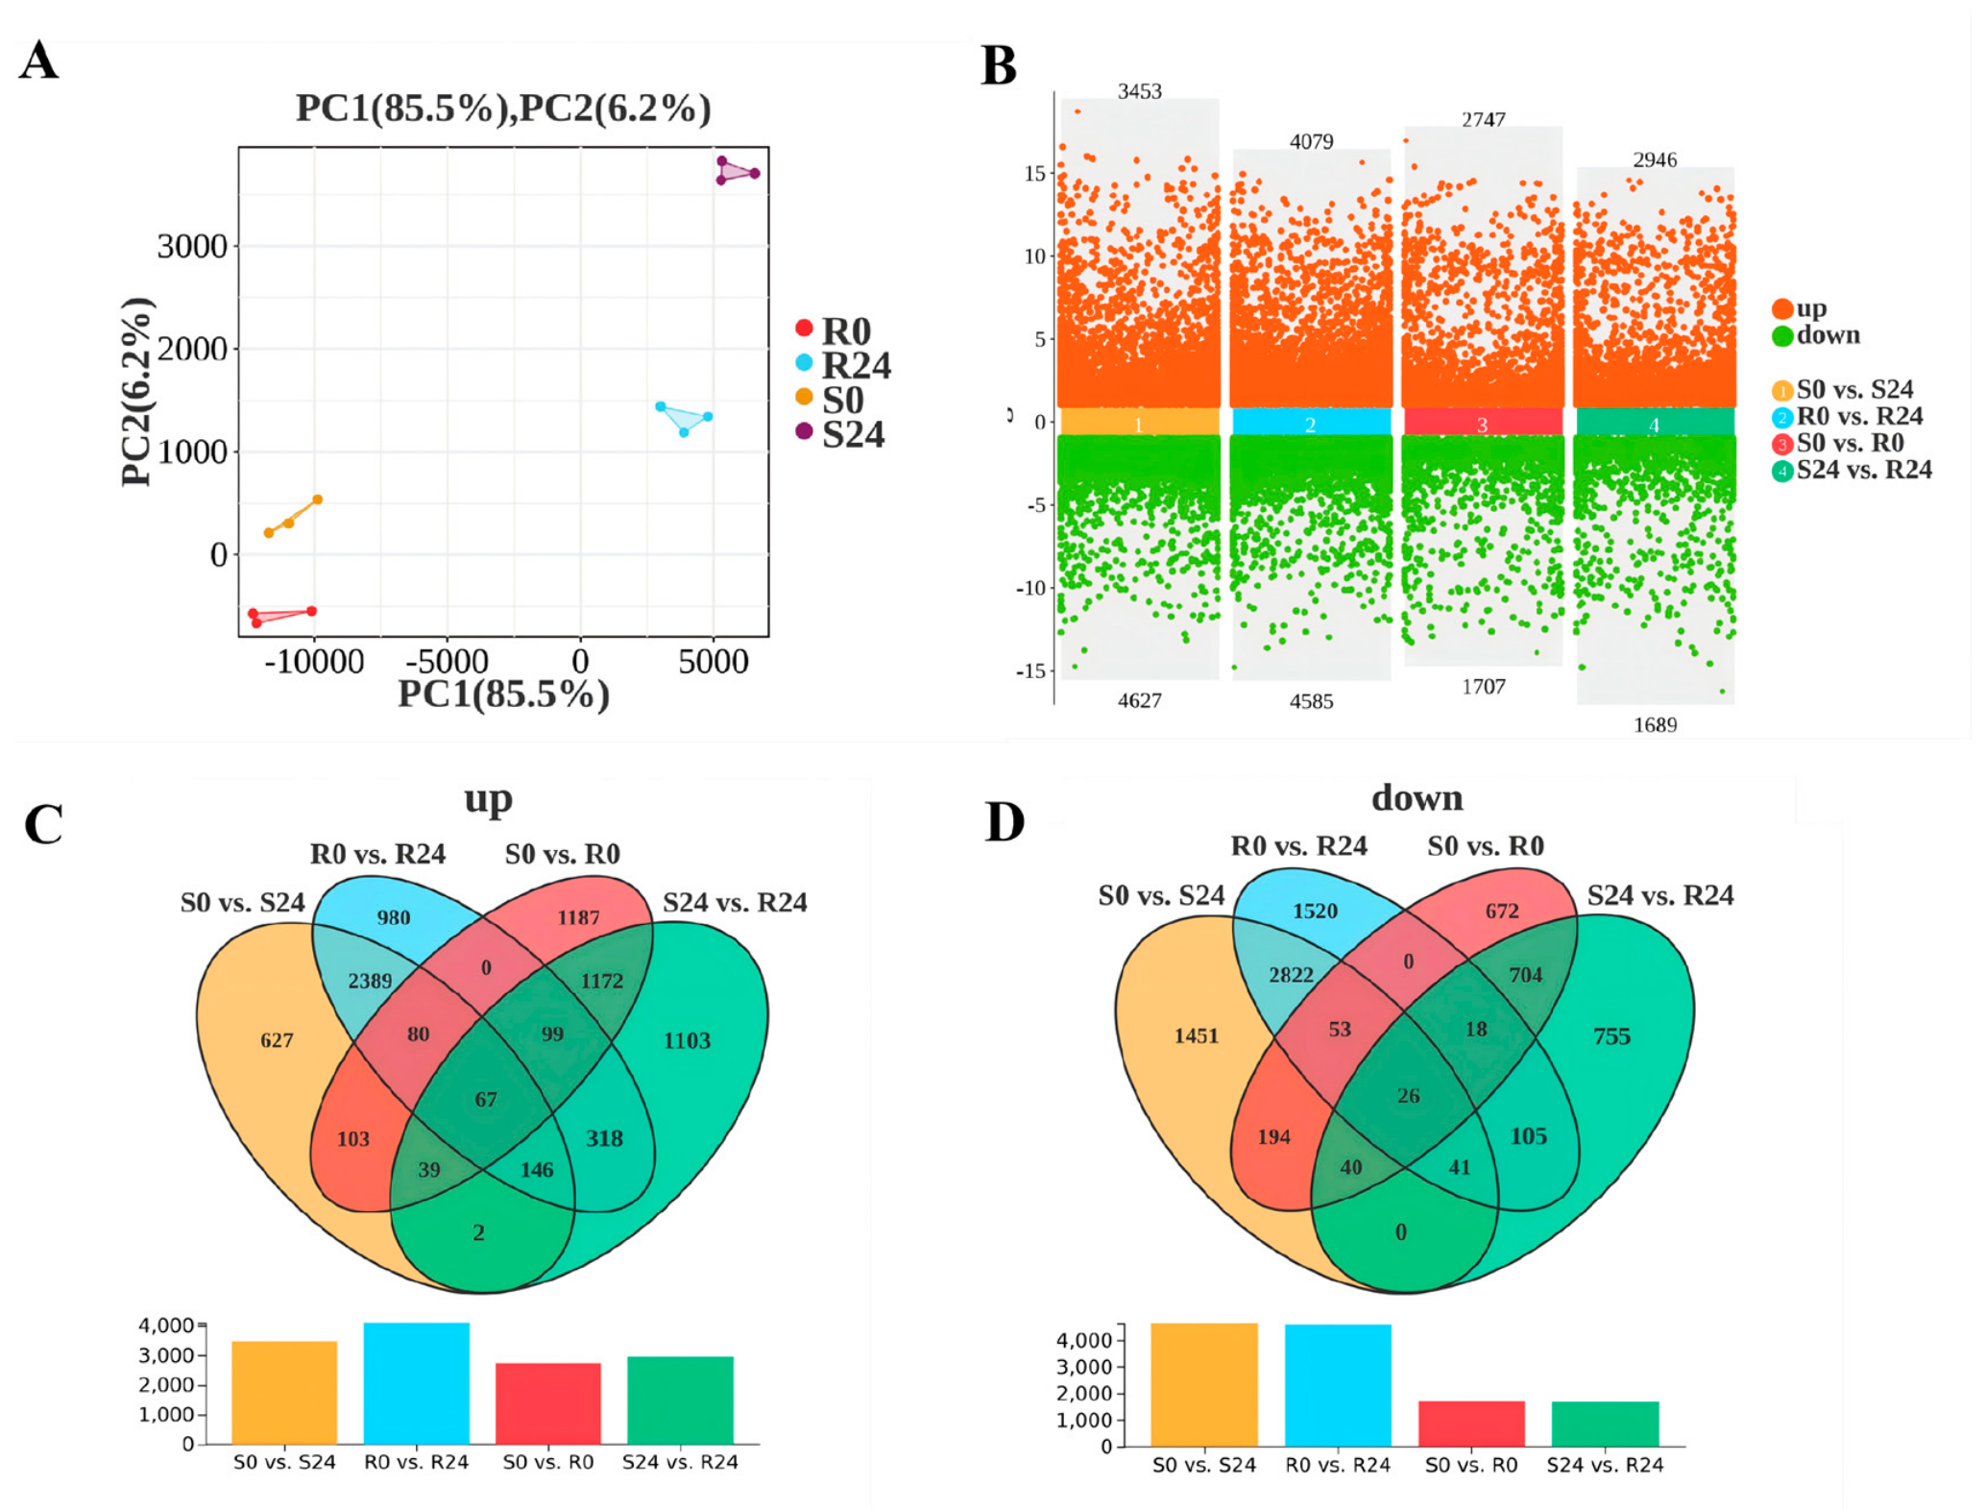
Principal component analysis (PCA) revealed a clear separation among samples (Figure 5A), with PC1 explaining 85.5% of the total variance and PC2 explaining 6.2%. Biological replicates within each group clustered closely, indicating high reproducibility. Resistant (R0 and R24) and susceptible (S0 and S24) samples were distinctly separated along PC1, suggesting substantial transcriptional divergence between the two germplasm groups. In addition, samples at different time points exhibited directional shifts, indicating dynamic transcriptional responses following infection.
Differential expression analysis identified large numbers of differentially expressed genes (DEGs) across all comparisons (Figure 5B). In the R0 vs. R24 comparison, 3453 genes were upregulated and 4627 were downregulated. In S0 vs. S24, 4079 upregulated and 4585 downregulated genes were detected. In S0 vs. R0, 2747 genes were upregulated and 1707 were downregulated, while in S24 vs. R24, 2946 genes were upregulated and 1689 were downregulated. Overall, time-course comparisons (R0 vs. R24 and S0 vs. S24) showed higher numbers of DEGs than genotype comparisons, indicating stronger transcriptional reprogramming during infection.
Venn diagram analysis further revealed both shared and specific DEG patterns. For upregulated genes (Figure 5C), 67 genes were commonly upregulated across all four comparisons, while each comparison also contained a large number of unique DEGs, including 1187 in R0 vs. R24 and 1103 in S24 vs. R24. Similarly, for downregulated genes (Figure 5D), 26 genes were shared among all comparisons, whereas 1520 and 755 genes were uniquely regulated in R0 vs. R24 and S24 vs. R24, respectively.

3.6. Enrichment Analysis of Resistance-Related Pathways and Key Genes

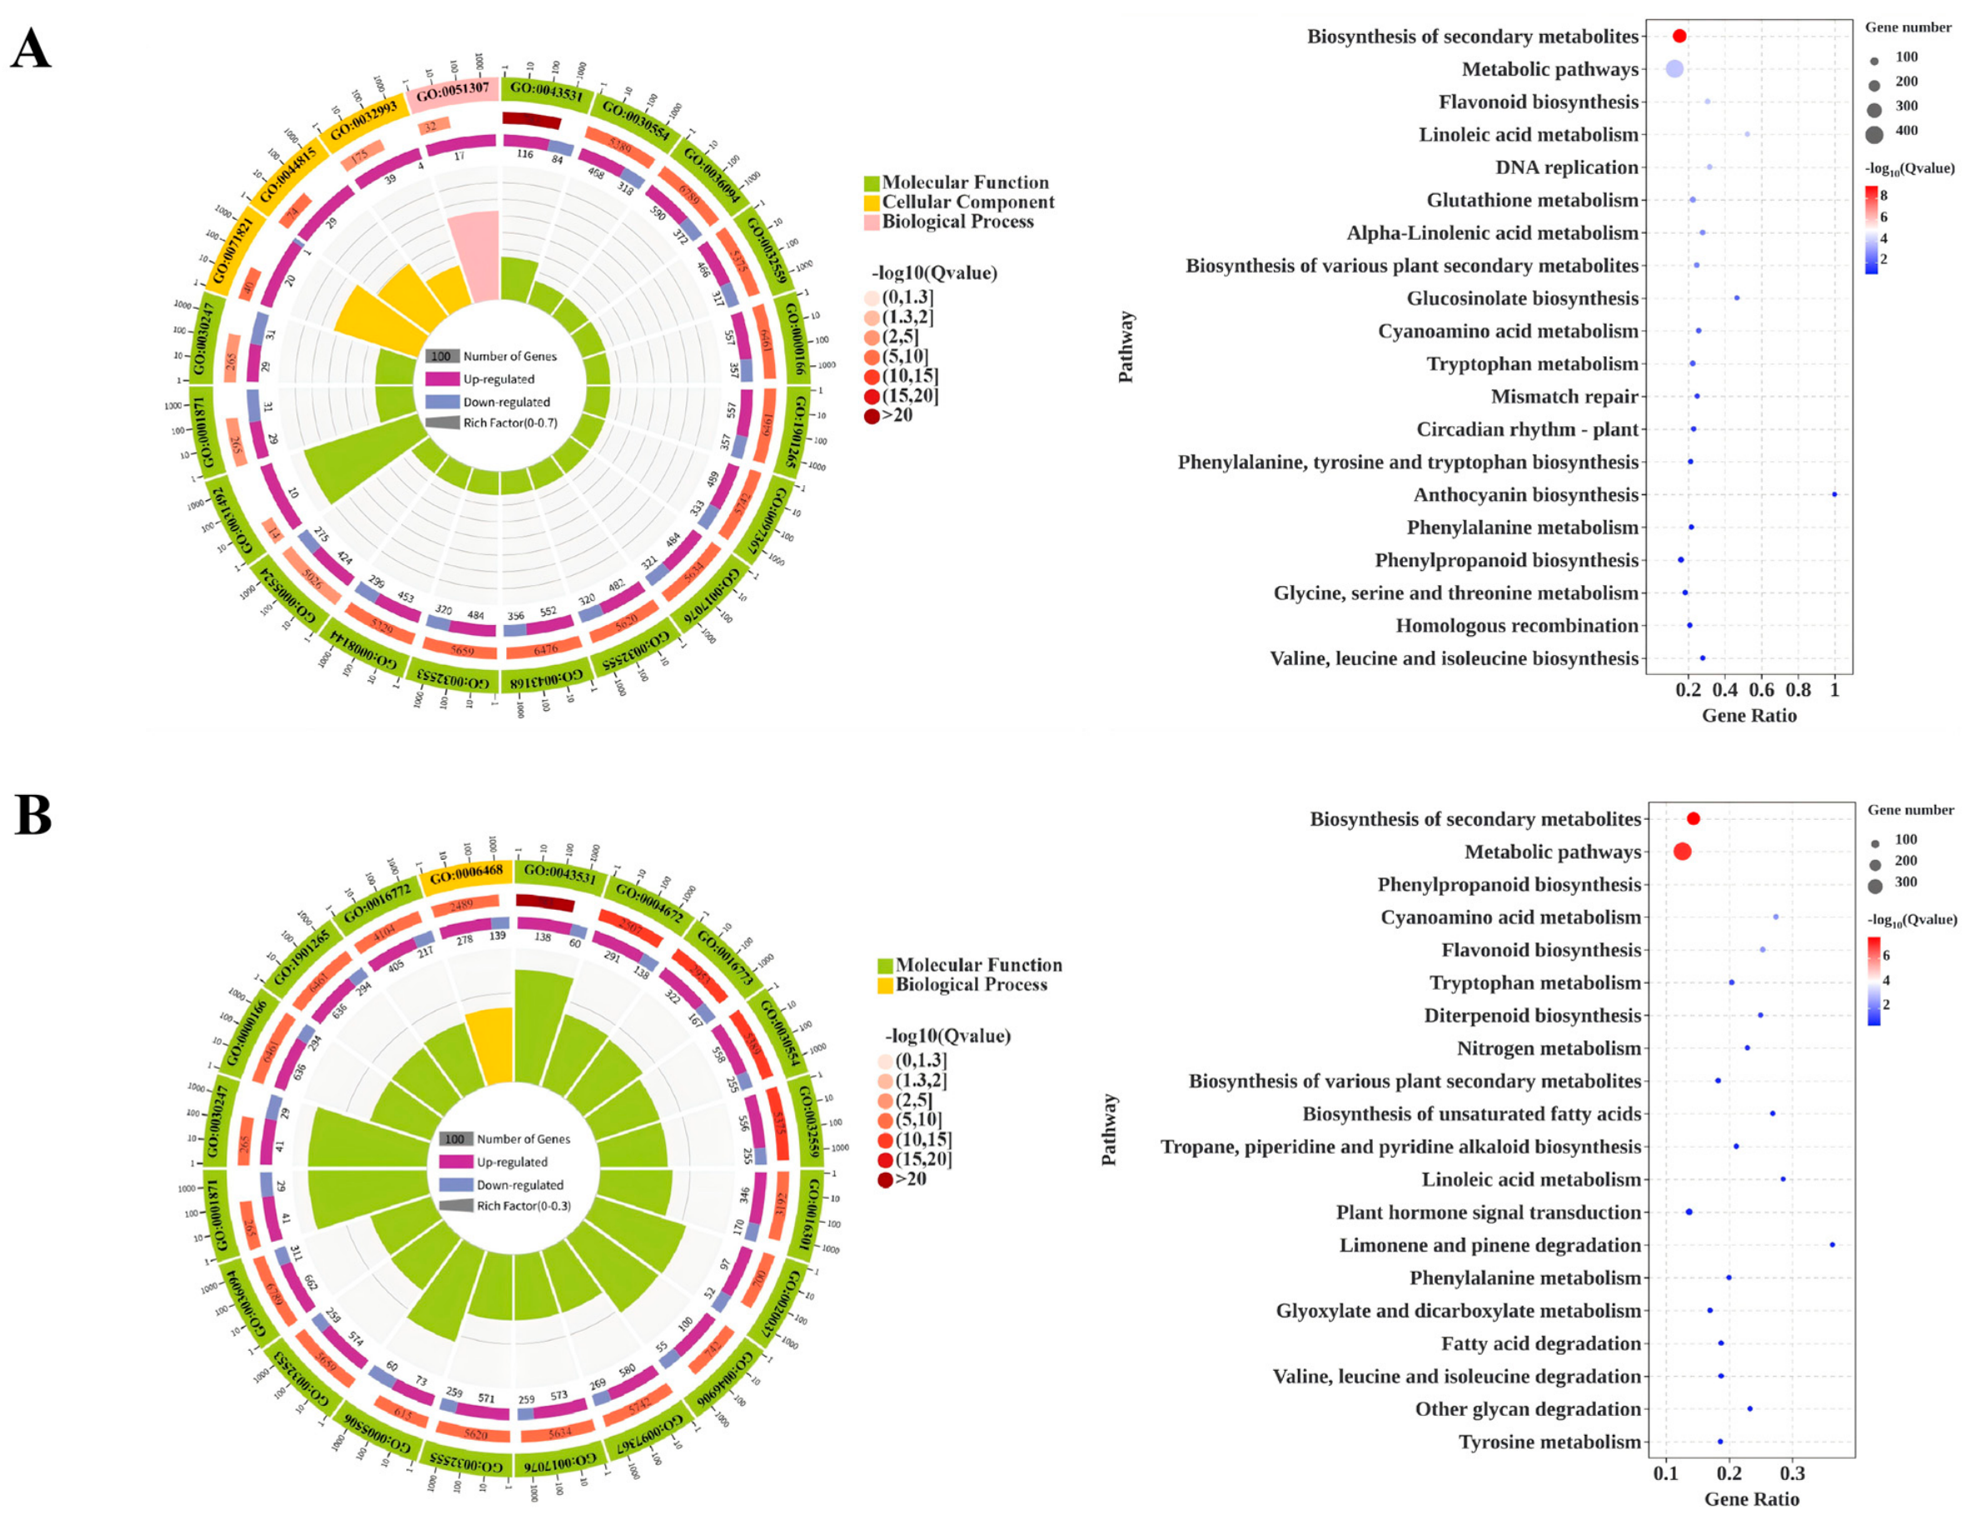
Differentially expressed genes (DEGs) were detected between resistant and susceptible germplasm prior to pathogen infection, indicating inherent transcriptional differences (Figure 6). GO enrichment analysis showed that these DEGs were mainly associated with chloroplast/plastid components (GO:0009570; GO:0009532), ATPase and hydrolase activities (GO:0016887; GO:0016818), and small molecule metabolic processes (GO:0036094; GO:0006082). KEGG enrichment analysis revealed that these genes were primarily involved in secondary metabolite biosynthesis, flavonoid biosynthesis, phenylpropanoid biosynthesis, and glutathione metabolism pathways.
At 24 h post inoculation (hpi), DEGs between resistant and susceptible germplasm (S24 vs. R24) were further analyzed. Among the top 20 enriched GO terms, 18 were classified as molecular function (MF), and 2 as cellular component (CC). These terms were mainly enriched in nucleotide binding (ATP/ADP/purine; GO:0005524), protein kinase activity (GO:0004672), phosphotransferase activity (GO:0016773), and catalytic activity, indicating active energy metabolism and phosphorylation-mediated signaling. KEGG analysis showed enrichment in secondary metabolite biosynthesis, phenylpropanoid biosynthesis, flavonoid biosynthesis, and plant hormone signal transduction pathways. Notably, the number of upregulated genes associated with the phenylpropanoid pathway increased markedly at 24 hpi, with its enrichment ranking rising from 18th at 0 h to 3rd at 24 h, suggesting that this pathway plays a key role in resistance.
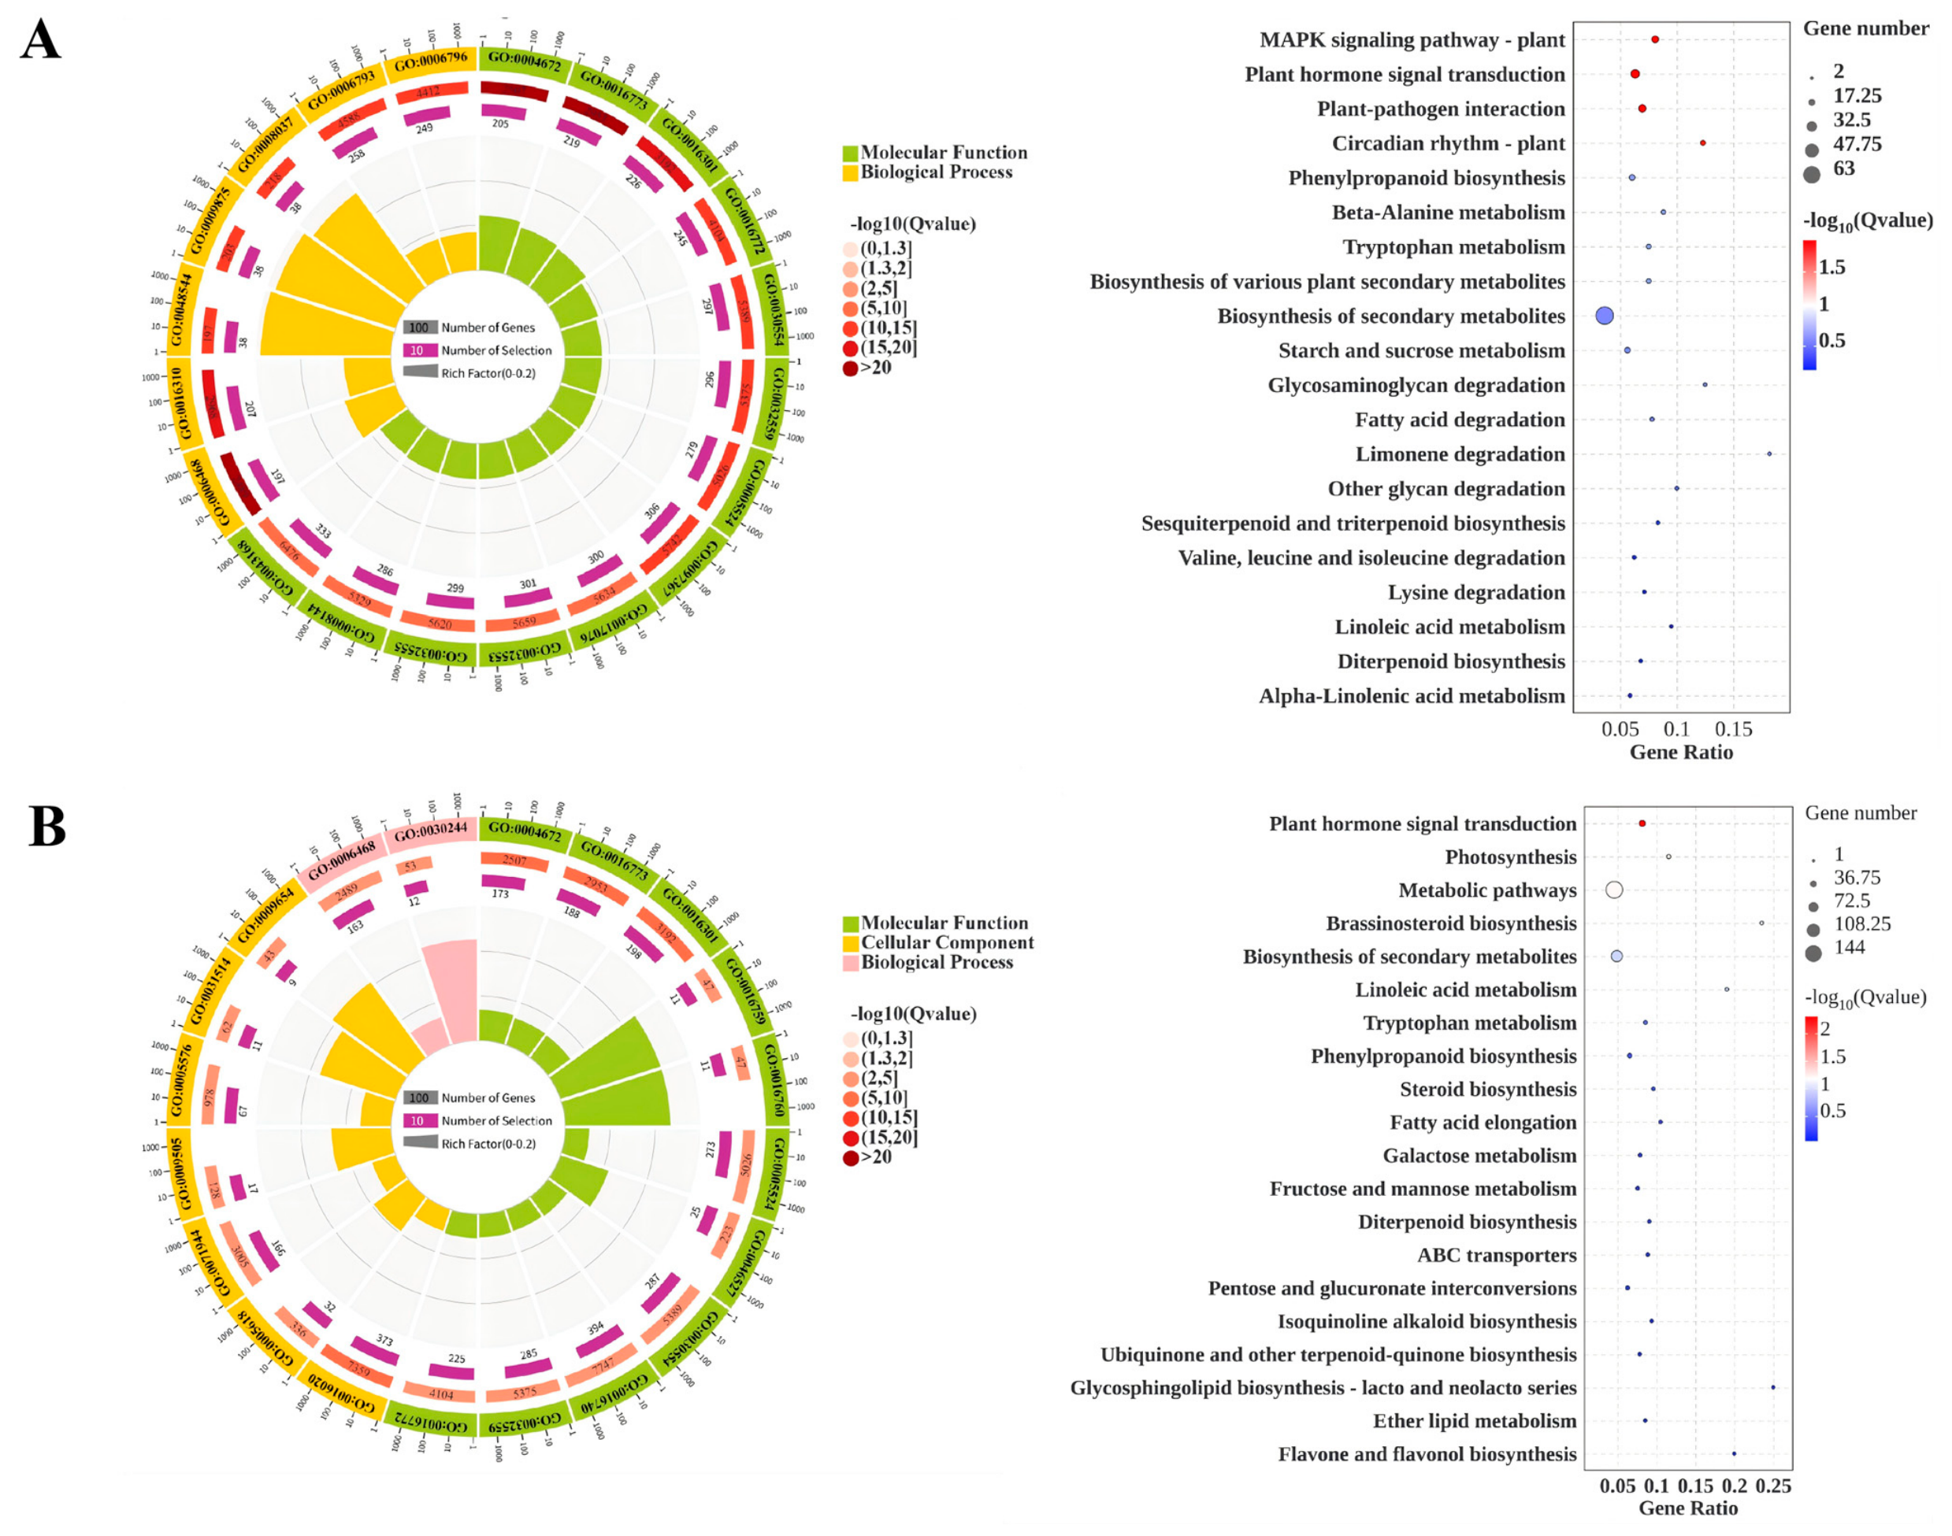
Further analysis of germplasm-specific DEGs revealed distinct patterns (Figure 7). Specifically upregulated DEGs in resistant germplasm were significantly enriched in GO terms related to protein kinase activity (GO:0004672), protein phosphorylation (GO:0006468), phosphotransferase activity (GO:0016773), and ATP binding (GO:0005524), all of which are associated with signal transduction processes. KEGG pathways were significantly enriched in MAPK signaling, plant hormone signal transduction, plant–pathogen interaction, and phenylpropanoid biosynthesis pathways. In contrast, specifically downregulated DEGs in susceptible germplasm were enriched in similar signaling-related GO terms, as well as membrane (GO:0016020), cell wall (GO:0005618), and glycosyltransferase activity (GO:0046527). KEGG pathways included plant hormone signal transduction, photosynthesis, brassinosteroid biosynthesis, and phenylpropanoid biosynthesis. Overall, these results indicate that differences in signaling pathways and secondary metabolism, particularly phenylpropanoid biosynthesis, are closely associated with resistance to anthracnose in rubber tree germplasm.

4. Discussion

Improved resistance to anthracnose may help maintain leaf integrity and photosynthetic capacity, thereby contributing to yield stability in rubber tree. The present study revealed clear phenotypic variation in anthracnose resistance among rubber tree germplasm groups, as reflected by lesion diameter and disease index. The consistency between these two indicators suggests that they reliably represent disease severity and can be used for resistance evaluation. The range of responses from resistant to highly susceptible germplasm suggests that anthracnose resistance is a complex trait influenced by multiple genetic and physiological factors [22,23]. This variation among germplasm groups provides a valuable basis for investigating the structural, physiological, and molecular mechanisms that underlie resistance.
Leaf structural traits constitute the first barrier against pathogen invasion. Stomata, as natural entry sites for Colletotrichum, can directly influence infection efficiency [24]. In this study, resistant germplasm exhibited significantly lower stomatal density, which positively correlated with disease index, suggesting that reduced stomatal density may limit pathogen entry and initial colonization. Although individual tissue thickness did not differ significantly, composite structural parameters—including P/S, CRT, and SR—showed strong correlations with disease index. Resistant germplasm displayed higher P/S and CRT and lower SR, indicating a more compact leaf architecture. Consistent with previous studies, increased tissue compactness can restrict hyphal penetration and intercellular colonization, thereby limiting pathogen spread and disease severity [25,26]. These findings highlight the combined contribution of stomatal traits and internal tissue organization to anthracnose resistance.
Physiological responses further contribute to disease resistance. ROS act as both signaling molecules and mediators of oxidative stress [27]. In this study, resistant germplasm exhibited stronger induction of defense-related enzymes (SOD, POD, PPO, and PAL), accompanied by higher early H2O2 accumulation and lower MDA levels, indicating more effective regulation of redox homeostasis. SOD and POD are involved in ROS scavenging, whereas PPO and PAL participate in phenolic metabolism and defense compound synthesis [21,28]. Previous studies have shown that maintaining a balance between ROS production and scavenging is critical for effective plant defense [29,30]. These findings suggest that coordinated antioxidant and metabolic responses enhance resistance by limiting oxidative damage and promoting defense activation.
The infection process further supports these observations. Although early infection stages, including conidial germination and appressorium formation, were similar between resistant and susceptible germplasm, significant differences emerged at later stages. Penetration structures developed more rapidly and reached higher proportions in susceptible germplasm, and disease symptoms appeared earlier than in resistant germplasm. This indicates that resistance mainly operates by restricting pathogen penetration and post-penetration colonization rather than inhibiting early infection events. This pattern is consistent with the infection strategy of Colletotrichum species, which rely on appressorium-mediated penetration and subsequent colonization for successful infection [31].
Transcriptomic analysis revealed substantial differences between resistant and susceptible germplasm at both constitutive and inducible levels. The presence of DEGs at 0 hpi suggests that resistant germplasm may maintain a primed defense state, which has been widely recognized as an important component of plant immunity [32]. After infection, particularly at 24 hpi, DEGs were significantly enriched in pathways related to signal transduction, including protein kinase activity, MAPK signaling, and plant hormone signaling. MAPK cascades play central roles in plant immune responses by integrating external signals and activating downstream defense pathways [33]. These results indicate that rapid signal perception and transduction are essential for resistance.
Among the enriched pathways, phenylpropanoid biosynthesis showed a marked increase after infection. This pathway is responsible for the production of lignin and phenolic compounds, which contribute to structural reinforcement and antimicrobial defense [34]. Recent studies have further highlighted the importance of phenylpropanoid metabolism and flavonoid biosynthesis in plant resistance to Colletotrichum species [35,36,37]. The consistent enrichment of this pathway suggests that it plays a central role in rubber tree resistance to anthracnose. Furthermore, differences in the regulation of this pathway between resistant and susceptible germplasm indicate that variation in secondary metabolism may be a key factor determining resistance. Further validation of candidate genes using independent approaches such as qRT-PCR will be conducted in future studies to confirm their roles in anthracnose resistance.
Taken together, the results indicate that anthracnose resistance in rubber tree is associated with multiple interacting factors. Resistant germplasm is characterized by reduced stomatal density, more compact leaf structure, stronger activation of defense-related enzymes, and more dynamic transcriptional responses. These traits likely act in a coordinated manner to reduce pathogen entry, limit colonization, and enhance defense capacity, whereas susceptible germplasm exhibits weaker structural and physiological defenses, leading to more rapid disease development.

5. Conclusions

This study provides an integrated comparison of resistant and susceptible rubber tree germplasm under anthracnose challenge. Resistant germplasm is characterized by (i) lower stomatal density and more compact mesophyll architecture, (ii) stronger antioxidant and phenylpropanoid-associated enzyme responses coupled with reduced oxidative damage, (iii) delayed infection progression and postponed differentiation of infection structures, and (iv) distinct constitutive and inducible transcriptome programs enriched in signaling and phenylpropanoid-related pathways. These multilayered traits collectively contribute to restricting pathogen entry, colonization, and symptom development, and offer mechanistic clues and candidate genes for resistance-oriented rubber tree breeding.

Author Contributions

L.X.: Writing—original draft, Formal analysis, Data curation; P.L.: Formal analysis, Data curation; W.L.: Data curation; M.W.: Methodology; X.L.: Writing—review and editing, Conceptualization, Funding acquisition. Y.Z.: Writing—review and editing, Funding acquisition. All authors have read and agreed to the published version of the manuscript.

Funding

This work was supported by the Project of Hainan Province “Nanhai New Star” Technology Innovation Talent Platform (NHXXRCXM202310), the Project of Sanya Yazhou Bay Science and Technology City (SCKJ-JYRC-2023-22), Hainan Provincial Natural Science Foundation of China (326MS0039), and the Modern Agro-industry Technology Research System (CARS-33-BC1).

Data Availability Statement

Data will be made available on request.

Conflicts of Interest

The authors declare that they have no conflicts of interest.

References

  1. Tang, C.; Yang, M.; Fang, Y.; Luo, Y.; Gao, S.; Xiao, X.; An, Z.; Zhou, B.; Zhang, B.; Tan, X.; et al. The rubber tree genome reveals new insights into rubber production and species adaptation. Nat. Plants 2016, 2, 16073. [Google Scholar] [CrossRef] [Scilit]
  2. Tang, C.; Wu, S.; Shi, M.; Li, Z.; Li, H.; Ma, X.; Luo, Y.; Gao, S.; Xiao, X.; An, Z.; et al. Genomic insight into domestication of rubber tree. Nat. Commun. 2023, 14, 4651. [Google Scholar] [CrossRef] [Scilit]
  3. Oghama, O.E.; Omorusi, E.S.; Osazuwa, V.I. Selected leaf diseases of rubber: Symptoms and control—A review. J. Appl. Sci. Environ. Manag. 2023, 27, 2369–2373. [Google Scholar] [CrossRef] [Scilit]
  4. Liu, X.; Li, B.; Cai, J.; Zheng, X.; Feng, Y.; Huang, G. Colletotrichum species causing anthracnose of rubber trees in China. Sci. Rep. 2018, 8, 10435. [Google Scholar] [CrossRef] [Scilit]
  5. Liu, Y.; Shi, Y.; Zhuo, D.; Yang, T.; Dai, L.; Li, L.; Zhao, H.; Liu, X.; Cai, Z. Characterization of Colletotrichum causing anthracnose on rubber trees in Yunnan: Two new records and two new species from China. Plant Dis. 2023, 107, 3037–3050. [Google Scholar] [CrossRef] [Scilit]
  6. Liang, X.; Peng, Y.; Zou, L.; Wang, M.; Yang, Y.; Zhang, Y. Baseline sensitivity of penthiopyrad against Colletotrichum gloeosporioides species complex and its efficacy for the control of Colletotrichum leaf disease in rubber tree. Eur. J. Plant Pathol. 2020, 158, 965–974. [Google Scholar] [CrossRef] [Scilit]
  7. Sobha, S.; Rekha, K.; Uthup, T.K. Biotechnological advances in rubber tree (Hevea brasiliensis Muell. Arg.) breeding. In Advances in Plant Breeding Strategies: Industrial and Food Crops; Al-Khayri, J.M., Jain, S.M., Johnson, D.V., Eds.; Springer: Cham, Switzerland, 2019; Volume 6, pp. 179–236. [Google Scholar]
  8. Kaur, S.; Samota, M.K.; Choudhary, M.; Pandey, A.K.; Sharma, A.; Thakur, J. How do plants defend themselves against pathogens—Biochemical mechanisms and genetic interventions. Physiol. Mol. Biol. Plants 2022, 28, 485–504. [Google Scholar] [CrossRef] [Scilit]
  9. Jian, Y.; Gong, D.; Wang, Z.; Liu, L.; He, J.; Han, X.; Tsuda, K. How plants manage pathogen infection. EMBO Rep. 2024, 25, 31–44. [Google Scholar] [CrossRef] [Scilit] [PubMed]
  10. Hou, S.; Rodrigues, O.; Liu, Z.; Shan, L.; He, P. Small holes, big impact: Stomata in plant–pathogen–climate epic trifecta. Mol. Plant 2024, 17, 26–49. [Google Scholar] [CrossRef] [Scilit]
  11. Chaudhry, V.; Runge, P.; Sengupta, P.; Doehlemann, G.; Parker, J.E.; Kemen, E. Shaping the leaf microbiota: Plant-microbe-microbe interactions. J. Exp. Bot. 2021, 72, 36–56. [Google Scholar] [CrossRef] [Scilit] [PubMed]
  12. Haghpanah, M.; Namdari, A.; Kaleji, M.K.; Nikbakht-Dehkordi, A.; Arzani, A.; Araniti, F. Interplay between ROS and hormones in plant defense against pathogens. Plants 2025, 14, 1297. [Google Scholar] [CrossRef] [Scilit] [PubMed]
  13. Zhai, S.; Guo, H.; Sun, T.; Guo, M.; Chen, J.; Cao, J.; Yang, W.; Chen, G. 3-Methyl-1-Butanol enhances postharvest resistance of red grapes to Botrytis cinerea by activating phenylpropanoid metabolism and antioxidant defences. Plant Biotechnol. J. 2025, 24, 2673–2684. [Google Scholar] [CrossRef] [Scilit] [PubMed]
  14. Dong, B.; Da, F.; Chen, Y.; Ding, X. Melatonin treatment maintains the quality of fresh-cut Gastrodia elata under low-temperature conditions by regulating reactive oxygen species metabolism and the phenylpropanoid pathway. Int. J. Mol. Sci. 2023, 24, 14284. [Google Scholar] [CrossRef] [Scilit]
  15. Dumanović, J.; Nepovimova, E.; Natić, M.; Kuča, K.; Jaćević, V. The significance of reactive oxygen species and antioxidant defense system in plants: A concise overview. Front. Plant Sci. 2021, 11, 552969. [Google Scholar] [CrossRef] [Scilit]
  16. Geng, X.; Gao, Z.; Zhao, L.; Zhang, S.; Wu, J.; Yang, Q.; Liu, S.; Chen, X. Comparative transcriptome analysis of resistant and susceptible wheat in response to Rhizoctonia cerealis. BMC Plant Biol. 2022, 22, 235. [Google Scholar] [CrossRef] [Scilit] [PubMed]
  17. Xu, B.; Qi, G.; Liu, X.; Yuan, C.; Wang, Y.; Li, Y.; Zhang, J.; Zhao, H.; Dong, Y. Transcriptome analysis reveals key pathways and regulatory networks involved in soybean’s early resistance to Peronospora manshurica. BMC Plant Biol. 2025, 25, 1316. [Google Scholar] [CrossRef] [Scilit]
  18. NY/T 3518-2019; Technical Code for Monitoring Pests of Tropical Crops—Anthracnose of Rubber Tree. Ministry of Agriculture and Rural Affairs of the People’s Republic of China: Beijing, China, 2019. (In Chinese)
  19. Deenamo, N.; Kuyyogsuy, A.; Khompatara, K.; Chanwun, T.; Ekchaweng, K.; Churngchow, N. Salicylic acid induces resistance in rubber tree against Phytophthora palmivora. Int. J. Mol. Sci. 2018, 19, 1883. [Google Scholar] [CrossRef] [Scilit]
  20. Li, D.; Xia, Z.; Wang, X.; Yang, H.; Li, Y. Melatonin enhances drought tolerance by regulating the genes underlying photosynthesis and antioxidant defense in rubber tree (Hevea brasiliensis) seedlings. Plants 2025, 14, 2243. [Google Scholar] [CrossRef] [Scilit]
  21. Han, C.; Su, Z.; Zhao, Y.; Li, C.; Guo, B.; Wang, Q.; Liu, F.; Zhang, S. Uncovering the mechanisms underlying pear leaf apoplast protein-mediated resistance against Colletotrichum fructicola through transcriptome and proteome profiling. Phytopathol. Res. 2024, 6, 3. [Google Scholar] [CrossRef] [Scilit]
  22. Mulube, M.; Hamabwe, S.; Kuwabo, K.; Chinji, M.; Nkandela, M.; Botha, J.; Mwense, B.; Tembo, L.; Lungu, D.; Mukuma, C.; et al. Mapping of quantitative trait locus for resistance to anthracnose in a population derived from genotypes PI 527538 and Ervilha of common bean. Front. Plant Sci. 2025, 16, 1691703. [Google Scholar] [CrossRef] [Scilit]
  23. Kadege, E.L.; Venkataramana, P.B.; Assefa, T.; Ndunguru, J.C.; Rubyogo, J.C.; Mbega, E.R. Characterization of phenotypic traits associated with anthracnose resistance in selected common bean (Phaseolus vulgaris L.) breeding material. Heliyon 2024, 10, e26917. [Google Scholar] [CrossRef] [Scilit]
  24. Ren, J.; Pu, J.; Yu, J.; Huang, Y.; Shan, N.; Sun, J.; Chen, A.; Wang, S.; Zhou, Q.; Luo, S. Evaluation of anthracnose-resistant greater yam and the mechanism of abscisic acid-mediated disease resistance. Trop. Plants 2025, 4, e021. [Google Scholar] [CrossRef] [Scilit]
  25. Engelsdorf, T.; Will, C.; Hofmann, J.; Schmitt, C.; Merritt, B.B.; Rieger, L.; Frenger, M.S.; Marschall, A.; Franke, R.B.; Pattathil, S.; et al. Cell wall composition and penetration resistance against the fungal pathogen Colletotrichum higginsianum are affected by impaired starch turnover in Arabidopsis mutants. J. Exp. Bot. 2017, 68, 701–713. [Google Scholar] [CrossRef] [Scilit]
  26. Mittler, R.; Zandalinas, S.I.; Fichman, Y.; Van Breusegem, F. Reactive oxygen species signalling in plant stress responses. Nat. Rev. Mol. Cell Biol. 2022, 23, 663–679. [Google Scholar] [CrossRef] [Scilit]
  27. Rao, M.J.; Duan, M.; Zhou, C.; Jiao, J.; Cheng, P.; Yang, L.; Wei, W.; Shen, Q.; Ji, P.; Yang, Y.; et al. Antioxidant defense system in plants: Reactive oxygen species production, signaling, and scavenging during abiotic stress-induced oxidative damage. Horticulturae 2025, 11, 477. [Google Scholar] [CrossRef] [Scilit]
  28. Liang, X.; Qiu, Y.; Jian, S.; Hu, M.; Zhang, S.; Wang, M.; Zhang, Y. Potassium phosphite effectively controls rubber tree anthracnose by inhibiting melanin biosynthesis ofColletotrichum siamense. Pestic. Biochem. Physiol. 2025, 215, 106648. [Google Scholar] [CrossRef] [Scilit] [PubMed]
  29. Alam, P.; Faizan, M.; Arif, Y.; Azzam, M.M.; Hayat, S.; Afzal, S.; Albalawi, T. Reactive oxygen species: Balancing agents in plants. Front. Plant Sci. 2025, 16, 1713590. [Google Scholar] [CrossRef] [Scilit]
  30. Wang, Y.; Ji, D.; Chen, T.; Li, B.; Zhang, Z.; Qin, G.; Tian, S. Production, signaling, and scavenging mechanisms of reactive oxygen species in fruit–pathogen interactions. Int. J. Mol. Sci. 2019, 20, 2994. [Google Scholar] [CrossRef] [Scilit]
  31. Usman, H.; Hussain, M.; Karim, M.; Nizamani, M.; Mubeen, M.; Hussain, S.; Kamran, A.; Wang, Y.; Liu, F. Colletotrichum: A versatile fungal genus with diverse infection strategies, host interactions, and management challenges. Phytopathol. Res. 2026, 8, 6. [Google Scholar] [CrossRef] [Scilit]
  32. Yang, Z.; Zhi, P.; Chang, C. Priming seeds for the future: Plant immune memory and application in crop protection. Front. Plant Sci. 2022, 13, 961840. [Google Scholar] [CrossRef] [Scilit]
  33. Zhang, M.; Zhang, S. Mitogen-activated protein kinase cascades in plant signaling. J. Integr. Plant Biol. 2022, 64, 301–341. [Google Scholar] [CrossRef] [Scilit]
  34. Yadav, V.; Wang, Z.; Wei, C.; Amo, A.; Ahmed, B.; Yang, X.; Zhang, X. Phenylpropanoid Pathway Engineering: An Emerging Approach towards Plant Defense. Pathogens 2020, 9, 312. [Google Scholar] [CrossRef] [Scilit]
  35. Xing, F.; Zhang, L.; Ge, W.; Fan, H.; Tian, C.; Meng, F. Comparative transcriptome analysis reveals the importance of phenylpropanoid biosynthesis for the induced resistance of 84K poplar to anthracnose. BMC Genom. 2024, 25, 306. [Google Scholar] [CrossRef] [Scilit]
  36. Liu, Y.; Song, Q.; Yin, F.; Liang, Y.; Song, M.; He, M.; Shuai, L. Colletotrichum capsici-Induced disease development in postharvest pepper associated with cell wall metabolism and phenylpropanoid metabolism. Horticulturae 2025, 11, 794. [Google Scholar] [CrossRef] [Scilit]
  37. Jiang, L.; Wu, P.; Yang, L.; Liu, C.; Guo, P.; Wang, H.; Wang, S.; Xu, F.; Zhuang, Q.; Tong, X.; et al. Transcriptomics and metabolomics reveal the induction of flavonoid biosynthesis pathway in the interaction of Stylosanthes–Colletotrichum gloeosporioides. Genomics 2021, 113, 2702–2716. [Google Scholar] [CrossRef] [Scilit]
Figure 1. Stomatal characteristics and their relationship with anthracnose disease index in rubber tree germplasm. (A) Representative stomatal micrographs of six rubber tree germplasm accessions. Stomata are distributed on the abaxial leaf surface and exhibit elliptical openings. Scale bars = 20 μm. (B) Correlation between stomatal density and disease index. Stomatal density is positively correlated with disease index (R2 = 0.7397, p = 0.0280).
Forests 17 00629 g001
Figure 2. Leaf anatomical structure and its relationship with anthracnose disease index in rubber tree germplasm. (A) Representative transverse sections of leaves from six rubber tree germplasm accessions. U-ep, upper epidermis; Pal, palisade tissue; Sp, spongy tissue; D-ep, lower epidermis. Scale bars = 20 μm. (B) Correlation analysis between anatomical structural parameters and disease index.
Forests 17 00629 g002
Figure 3. Temporal dynamics of defense-related enzyme (SOD, POD, PPO, and PAL) activities and oxidative stress indicators (H2O2 and MDA) in resistant and susceptible rubber tree germplasm after anthracnose inoculation. Changes in SOD, POD, PAL, and PPO activities, as well as H2O2 and MDA contents, in rubber tree germplasm at different time points after inoculation with C. siamense. SC, susceptible control (Zhanshi 5006 without inoculation); ST, susceptible treatment (Zhanshi 5006 inoculated with C. siamense); RC, resistant control (Zhanshi 477-6 without inoculation); RT, resistant treatment (Zhanshi 477-6 inoculated with C. siamense).
Forests 17 00629 g003
Figure 4. Infection process and infection structure dynamics in resistant and susceptible rubber tree germplasm after inoculation with C. siamense. (A) Disease development in resistant (R, Zhanshi 477-6) and susceptible (S, Zhanshi 5006) rubber tree leaves at different time points after inoculation (0–96 hpi). Red arrows indicate typical disease symptoms. (B) Proportion of infection structures at different time points (2–36 hpi), including conidia, germ tubes, appressoria, and penetration pegs.
Forests 17 00629 g004
Figure 5. Transcriptome profiling and differential gene expression analysis in resistant and susceptible rubber tree germplasm following anthracnose infection. (A) Principal component analysis (PCA) of transcriptome data from resistant (R) and susceptible (S) rubber tree germplasm at different time points after inoculation. PC1 and PC2 explain 85.5% and 6.2% of the total variance, respectively. (B) Distribution of differentially expressed genes (DEGs) in pairwise comparisons, including R0 vs. R24, S0 vs. S24, S0 vs. R0, and S24 vs. R24. Red and green dots represent upregulated and downregulated genes, respectively. (C,D) Venn diagrams showing the overlap of upregulated (C) and downregulated (D) DEGs among different comparisons. Numbers indicate shared and unique DEGs in each comparison. R0 and R24 represent resistant germplasm (Zhanshi 477-6) at 0 and 24 h post inoculation (hpi), respectively; S0 and S24 represent susceptible germplasm (Zhanshi 5006) at 0 and 24 hpi, respectively.
Forests 17 00629 g005
Figure 6. GO and KEGG enrichment analysis of differentially expressed genes between resistant and susceptible rubber tree germplasm at 0 and 24 h post inoculation with C. siamense (top 20 terms). (A) GO and KEGG enrichment analysis of differentially expressed genes (DEGs) between resistant (R) and susceptible (S) germplasm at 0 h post inoculation (hpi). (B) GO and KEGG enrichment analysis of DEGs between R and S germplasm at 24 hpi. For GO analysis, enriched terms are categorized into molecular function (MF), biological process (BP), and cellular component (CC). The circular plots display the number of DEGs, the proportion of up- and downregulated genes, and the enrichment significance indicated by −log10(Q value). For KEGG analysis, the dot plots show the top 20 enriched pathways. The size of each dot represents the number of genes, and the color indicates the enrichment significance (−log10(Q value)). R and S represent resistant (Zhanshi 477-6) and susceptible (Zhanshi 5006) rubber tree germplasm, respectively.
Forests 17 00629 g006
Figure 7. GO and KEGG enrichment analysis of specifically upregulated genes in resistant germplasm and specifically downregulated genes in susceptible germplasm following anthracnose infection (top 20 terms). (A) GO and KEGG enrichment analysis of specifically upregulated differentially expressed genes (DEGs) in resistant germplasm (R). (B) GO and KEGG enrichment analysis of specifically downregulated DEGs in susceptible germplasm (S). For GO analysis, enriched terms are classified into molecular function (MF), biological process (BP), and cellular component (CC). The circular plots display the number of genes, the number of selected DEGs, and the enrichment significance indicated by −log10(Q value). For KEGG analysis, the dot plots present the top 20 enriched pathways. Dot size represents gene number, and color indicates enrichment significance (−log10(Q value)). R and S represent resistant (Zhanshi 477-6) and susceptible (Zhanshi 5006) rubber tree germplasm, respectively.
Forests 17 00629 g007
Table 1. Resistance evaluation of rubber tree germplasm to anthracnose.
Germplasm NameLesion Diameter (cm)Disease Index (%)Resistance Level
Zhanshi 477-60.29 ± 0.06 d10.67R
Reyan 8790.24 ± 0.08 d13.33R
RO420.81 ± 0.17 c14.67R
Reyan 733971.09 ± 0.03 ab32.00S
Zhanshi 327-201.00 ± 0.07 bcd37.33S
Zhanshi 50061.17 ± 0.08 a49.33HS
Values are mean ± standard deviation (SD). Different letters indicate significant differences at p < 0.05 (Tukey’s test). R, resistant; S, susceptible; HS, highly susceptible.
Table 2. Stomatal characteristics in leaves of resistant and susceptible germplasm.
Germplasm NameStomatal Density
(no. mm−2)
Stomatal Width (μm)Stomatal Length (μm)Stomatal Opening Area (μm2)
Zhanshi 477-6270.99 ± 7.77 b8.43 ± 0.37 b15.93 ± 0.43 ab107.4 ± 6.67 bc
Reyan 879371.35 ± 35.34 b8.48 ± 0.32 b15.11 ± 0.51 ab102.42 ± 6.11 bc
RO42311.13 ± 16.79 b9.38 ± 0.26 ab15.62 ± 0.34 ab115.46 ± 4.48 abc
Reyan 73397526.92 ± 21.64 a9.84 ± 0.27 a17.67 ± 0.34 a136.89 ± 5.03 a
Zhanshi 327-20571.29 ± 13.78 a8.61 ± 0.24 b14.67 ± 0.29 c99.65 ± 3.99 c
Zhanshi 5006501.82 ± 16.79 a9.33 ± 0.30 ab14.68 ± 0.41 bc123.1 ± 5.73 ab
Values are mean ± standard deviation (SD). Different letters indicate significant differences at p < 0.05 (Tukey’s test).
Table 3. Leaf anatomical characteristics of resistant and susceptible rubber tree germplasm.
Germplasm NameUpper Epidermis Thickness (μm)Palisade Tissue Thickness (μm)Spongy Tissue Thickness (μm)Lower Epidermis Thickness (μm)Leaf Thickness (μm)Palisade-to-Spongy Ratio Cell Tightness RatioSpongy Ratio
Zhanshi 477-610.60 ± 1.37 ab27.93 ± 3.17 b33.41 ± 2.39 b10.06 ± 0.89 ab82.01 ± 3.95 b0.84 ± 0.13 b0.34 ± 0.03 b0.41 ± 0.03 b
Reyan 87910.76 ± 1.37 a33.75 ± 3.39 a35.01 ± 3.28 ab11.22 ± 4.12 a90.74 ± 6.29 a0.97 ± 0.13 a0.37 ± 0.03 a0.39 ± 0.03 c
RO429.51 ± 1.35 c23.72 ± 2.41 d23.41 ± 2.81 c8.84 ± 1.11 b65.48 ± 5.11 d1.02 ± 0.13 a0.36 ± 0.03 a0.36 ± 0.03 d
Reyan 7339710.02 ± 1.09 abc23.31 ± 1.55 d33.82 ± 3.07 b9.00 ± 0.97 b76.14 ± 3.71 c0.70 ± 0.08 c0.31 ± 0.02 c0.44 ± 0.02 a
Zhanshi 327-209.78 ± 0.91 bc25.66 ± 2.25 c36.63 ± 2.75 a9.74 ± 1.23 b81.81 ± 3.79 b0.70 ± 0.08 c0.31 ± 0.02 c0.45 ± 0.02 a
Zhanshi 500610.1 ± 0.80 abc24.61 ± 1.69 cd34.5 ± 1.61 b9.17 ± 0.70 b78.37 ± 1.84 c0.72 ± 0.07 c0.31 ± 0.02 c0.44 ± 0.02 a
Values are presented as mean ± standard deviation (SD). Different lowercase letters within a column indicate significant differences at p < 0.05 (Tukey’s test).
Disclaimer/Publisher’s Note: The statements, opinions and data contained in all publications are solely those of the individual author(s) and contributor(s) and not of MDPI and/or the editor(s). MDPI and/or the editor(s) disclaim responsibility for any injury to people or property resulting from any ideas, methods, instructions or products referred to in the content.