1. Introduction
Engineered bamboo possesses excellent physical and mechanical properties, water resistance, and potential for engineering applications, making it highly valuable in fields such as construction, furniture manufacturing, and outdoor decoration [
1]. The hot-pressing process is a critical step in the production of engineered bamboo; the precision of temperature control, the stability of process parameters, and the ability to capture process data directly impact the quality of the final product and production efficiency [
2]. Currently, on-site management of the hot-pressing process in industrial settings is still plagued by issues such as insufficient process monitoring, reliance on manual experience for parameter adjustment, scattered quality data, and delayed identification of anomalies [
3]. These issues not only hiayed identification of anomaliesnder the stable operation of the hot-pressing process but also limit the timeliness of quality management and production decision-making.
Regarding the preparation of reconstituted bamboo and bamboo-based fiber composites, existing research has made some progress in areas such as hot-pressing process optimization, temperature control methods, analysis of quality-influencing factors, and modeling of parameter-quality relationships [
4,
5]. Relevant studies indicate that the precision of hot-pressing temperature control is one of the key factors affecting the stability of formed product quality, while deviations in process parameters such as density, moisture content, sizing amount, and holding time can also cause quality fluctuations [
6]. Based on this, bidirectional predictive models have been employed to describe the nonlinear relationships between process parameters and quality indicators, while temperature control strategies have been used to enhance the stability and control precision of the hot-pressing process [
7,
8]. In other words, current research has evolved from process analysis to control optimization and predictive modeling, providing a relatively clear theoretical foundation for integrated applications at the system level [
9].
During the hot-pressing process of bamboo-based fiber composites, process parameters such as temperature, pressure, displacement, valve opening, and holding time directly influence resin curing, panel compaction, moisture migration, and molding stability. These factors further affect final performance metrics such as thickness swelling ratio upon water absorption, width swelling ratio upon water absorption, static bending strength, horizontal shear strength, and modulus of elasticity. Therefore, continuous monitoring and correlated management of key hot-pressing parameters are essential for achieving material quality traceability and stable process control.
In recent years, digital twin technology has been increasingly applied to condition monitoring, equipment monitoring, and process visualization in manufacturing [
10,
11,
12,
13]. Relevant research indicates that integrating digital twins with PLC data acquisition, database management, and web-based monitoring platforms enables real-time mapping of production process data, status visualization, and anomaly alerts, thereby enhancing information integration and process management capabilities on the manufacturing floor [
14,
15]. In the system described in this paper, the Unity 3D interface serves as the visualization layer of the digital twin system, primarily responsible for scene mapping of equipment status and process parameters. The digital twin framework further integrates PLC field data acquisition, backend data services, database management, and the visualization interface, providing a system foundation for subsequent closed-loop data flow and intelligent control extensions.
In the field of wood, bamboo, and composite materials manufacturing, existing research has primarily focused on optimizing preparation processes, controlling hot-pressing procedures, predicting performance, and analyzing factors affecting quality [
16]. However, compared with digital twin-driven studies on quality traceability, process data management, and quality management in other manufacturing scenarios [
17,
18,
19], there has been limited research on digital monitoring and quality traceability systems for the hot-pressing production of bamboo-based composites, and there remains a lack of systematic integration of process data, quality information, predictive results, and hierarchical management requirements.
Although existing research has provided an important foundation for optimizing the hot-pressing process of reconstituted bamboo and predicting its quality, there remains a relative lack of research on system integration tailored to actual production environments. Most existing work focuses on parameter optimization, temperature control, or the development of predictive models [
20,
21,
22,
23,
24,
25,
26], with limited attention paid to integrating process data acquisition, quality information traceability, retrieval of predictive results, user permission management, and 3D visualization at the system level. Therefore, the development of a digital twin quality monitoring system suitable for the hot-pressing process of reconstituted bamboo remains a challenge that needs to be addressed in the digital management of manufacturing processes.
To address the shortcomings of the aforementioned studies, this paper develops a digital twin quality monitoring system tailored for the hot-pressing process of reconstituted bamboo. Based on PLC-based field data acquisition, the system integrates backend data services, database management, web interaction, and Unity 3D visualization to enable monitoring of the hot-pressing process, traceability of quality information, retrieval of predictive results, and display of equipment status. This paper focuses on the system architecture, data flow, functional integration, and field application methods, providing a systematic implementation path for information integration, process visualization, and quality traceability in the engineered bamboo manufacturing process.
The research contributions of this paper are primarily reflected in three aspects: First, a monitoring-oriented digital twin system framework was developed for the hot-pressing production site of reconstituted bamboo, integrating PLC data acquisition, quality information management, retrieval of predictive results, and Unity 3D visualization. Second, by incorporating hot-pressing process parameters, product information, quality results, and predictive results into a unified data link, system-level information integration for quality traceability was achieved. Third, through on-site deployment at the enterprise, synchronous latency testing, and pre- and post-implementation comparisons, the study validated the system’s feasibility for application in hot-pressing process monitoring and on-site management.
2. Materials and Methods
2.1. System Requirements Analysis
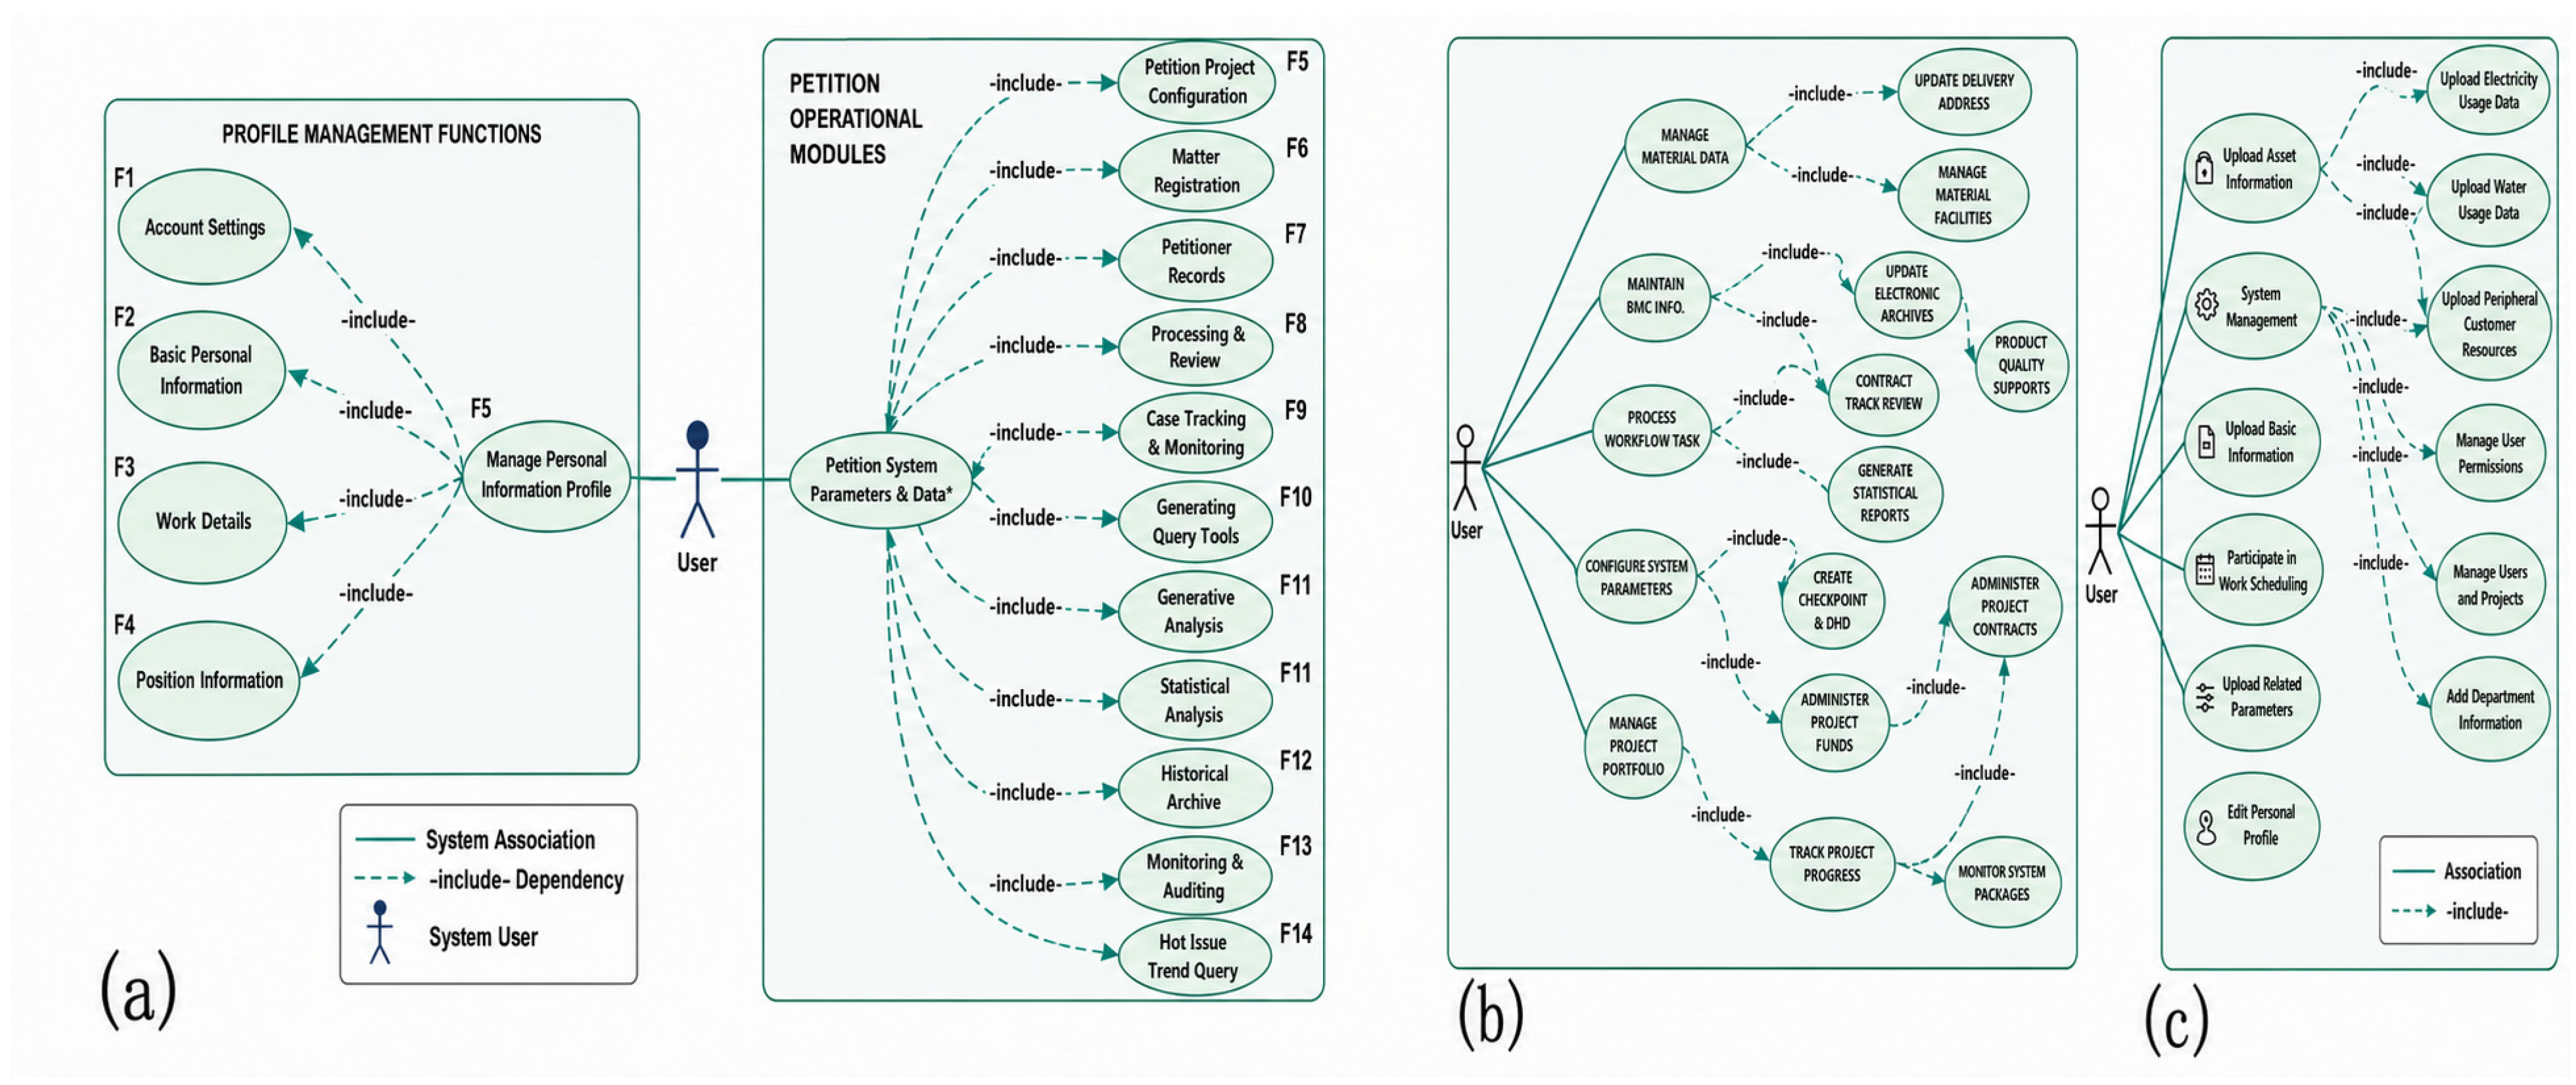
The design of a quality inspection system for the hot-pressing of reconstituted bamboo should first and foremost be grounded in the actual application needs of the enterprise’s on-site operations. Since the hot-pressing production process involves multiple levels—including on-site operations, workshop management, and enterprise management—there are significant differences among various roles in terms of information priorities, usage frequency, and functional objectives. Therefore, system requirements analysis must go beyond a general description of monitoring functions and instead focus on the organization of information and configuration of functions tailored to different roles. The primary users of the system include on-site staff, workshop managers, and corporate management. These roles differ significantly in terms of data entry, result viewing, status monitoring, and access control. The relationships among these use cases are illustrated in
Figure 1.
For on-site personnel, the core task lies in promptly monitoring the operational status of the hot-pressing process and making on-site assessments. Therefore, they focus more on hot-pressing temperature, pressure, displacement, equipment operational status, and changes in key parameters. The system must provide functions such as real-time data viewing, status display, parameter verification, and preliminary identification of anomalies. For shop floor managers, their focus extends from real-time monitoring to process management and quality traceability. Consequently, in addition to real-time operational information, they must prioritize historical data, quality information, process records, and anomaly reports. Accordingly, the system should include functions such as historical data queries, quality management, process tracking, and anomaly review. For enterprise managers, the focus is on system overviews, operational status summaries, overall quality stability, and anomaly statistics. Consequently, the system must also provide system overview and management functions, enabling them to grasp production status at a higher level and support decision-making. As such, the quality inspection system for reconstituted bamboo hot-pressing is not merely a parameter monitoring platform, but a tiered information service system that simultaneously serves on-site operations, workshop management, and enterprise management.
To further summarize the key concerns and functional requirements of users at different levels in system application, the correspondence between primary requirements and system functions is shown in
Table 1.
Once the differences in roles have been clarified, the system requirements must be further translated into an executable functional framework. This involves establishing a coherent business structure centered on basic information queries and quality information management, hot-pressing temperature monitoring, retrieval of predictive results, and system administration. This framework will serve as the basis for the subsequent design of the overall system architecture, front-end and visualization interfaces, as well as the integration of database and back-end interfaces.
2.2. System Architecture and Functional Module Design
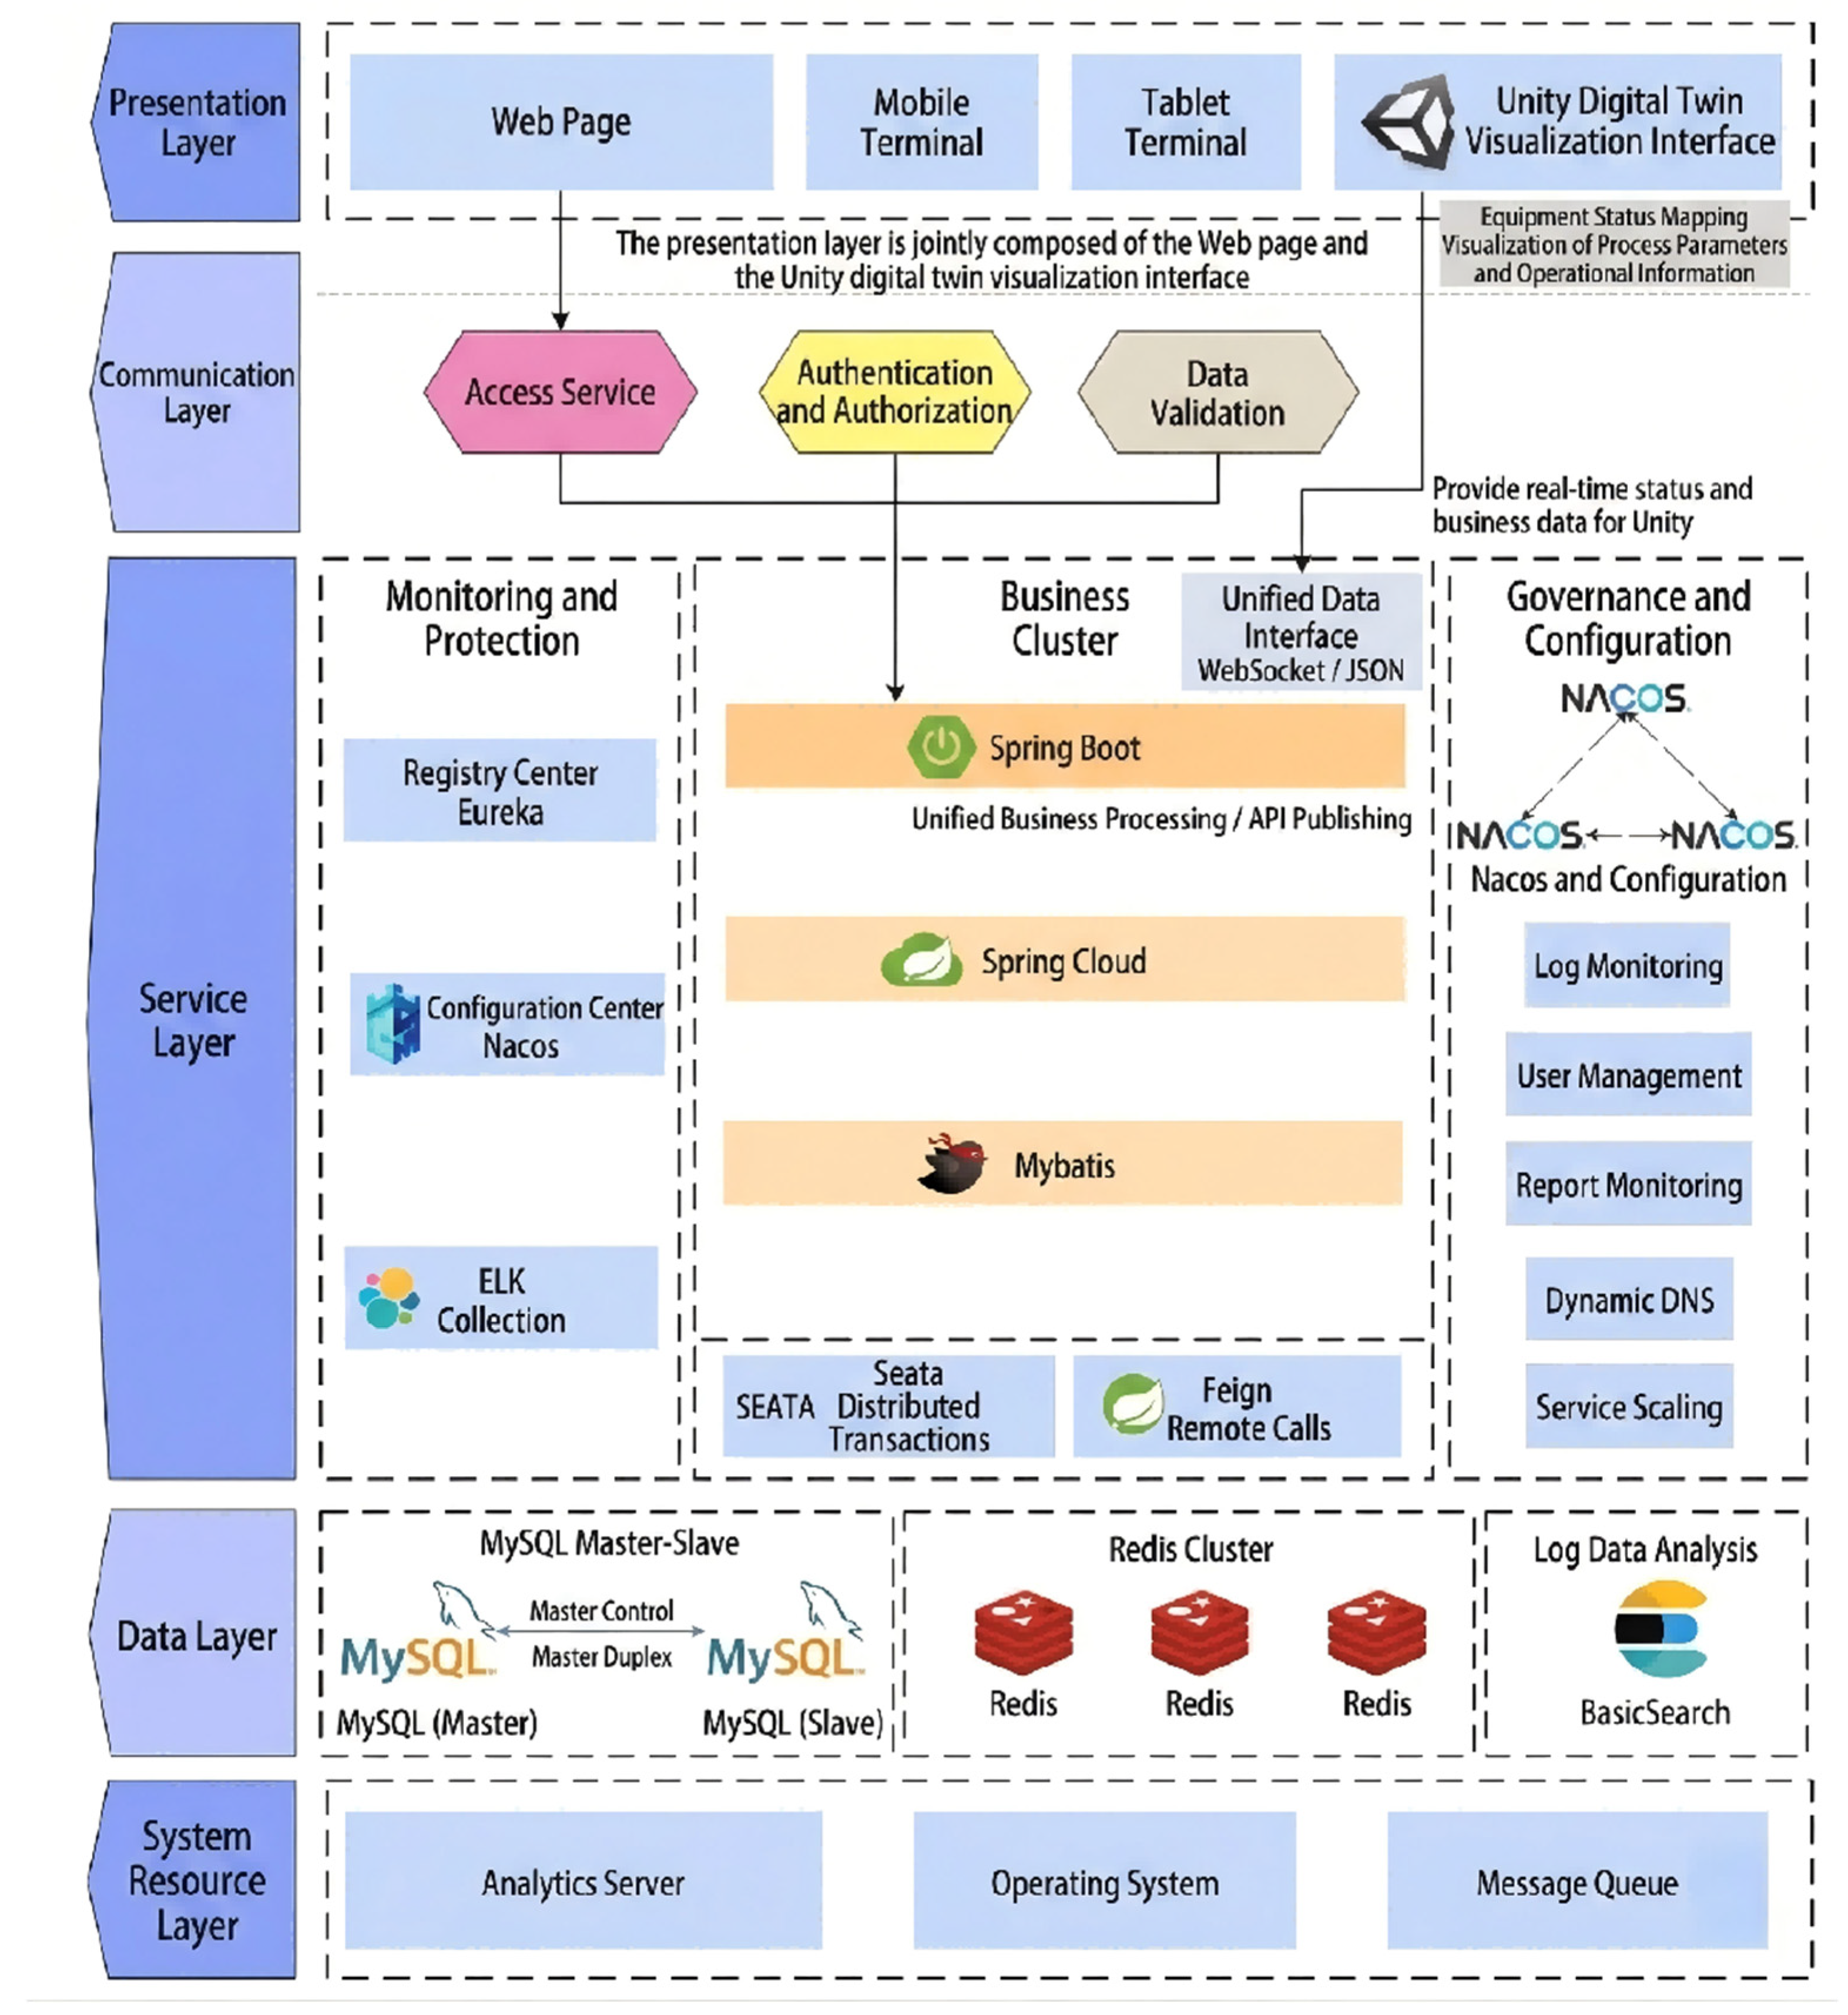
To meet the application requirements of the quality inspection system for the hot-pressing process of reconstituted bamboo in terms of data reception, business processing, and interface display, the system adopts a client-server (B/S) architecture with a separation of front-end and back-end components, and is built using Spring Boot and Vue. The system is broadly divided into the presentation layer, business application layer, data persistence layer, and system resource layer. The presentation layer consists of web pages and Unity 3D interfaces, which are used for business interaction and visual display; the business application layer is responsible for interface services, business logic, and module coordination; the data persistence layer handles the unified storage of process data, quality data, prediction results, and log data; and the system resource layer provides support for the database, cache, and server runtime environment. The overall technical architecture of the system is shown in
Figure 2.
Once the overall architecture has been finalized, the system must further translate the functional requirements into a feasible page and module structure. The system primarily revolves around modules such as System Overview, Basic Information Query, Quality Information Query, Hot Press Temperature Monitoring, Prediction Result Retrieval, and System Management. It achieves unified configuration of functional entry points and business organization through page structure. The corresponding page organization structure is shown in
Figure 3. Through the aforementioned architectural design, the system establishes a correspondence between role requirements, page organization, and data services at the overall level, providing a structural foundation for subsequent front-end and visualization interface design.
2.3. Front-End and Visual Interface Design
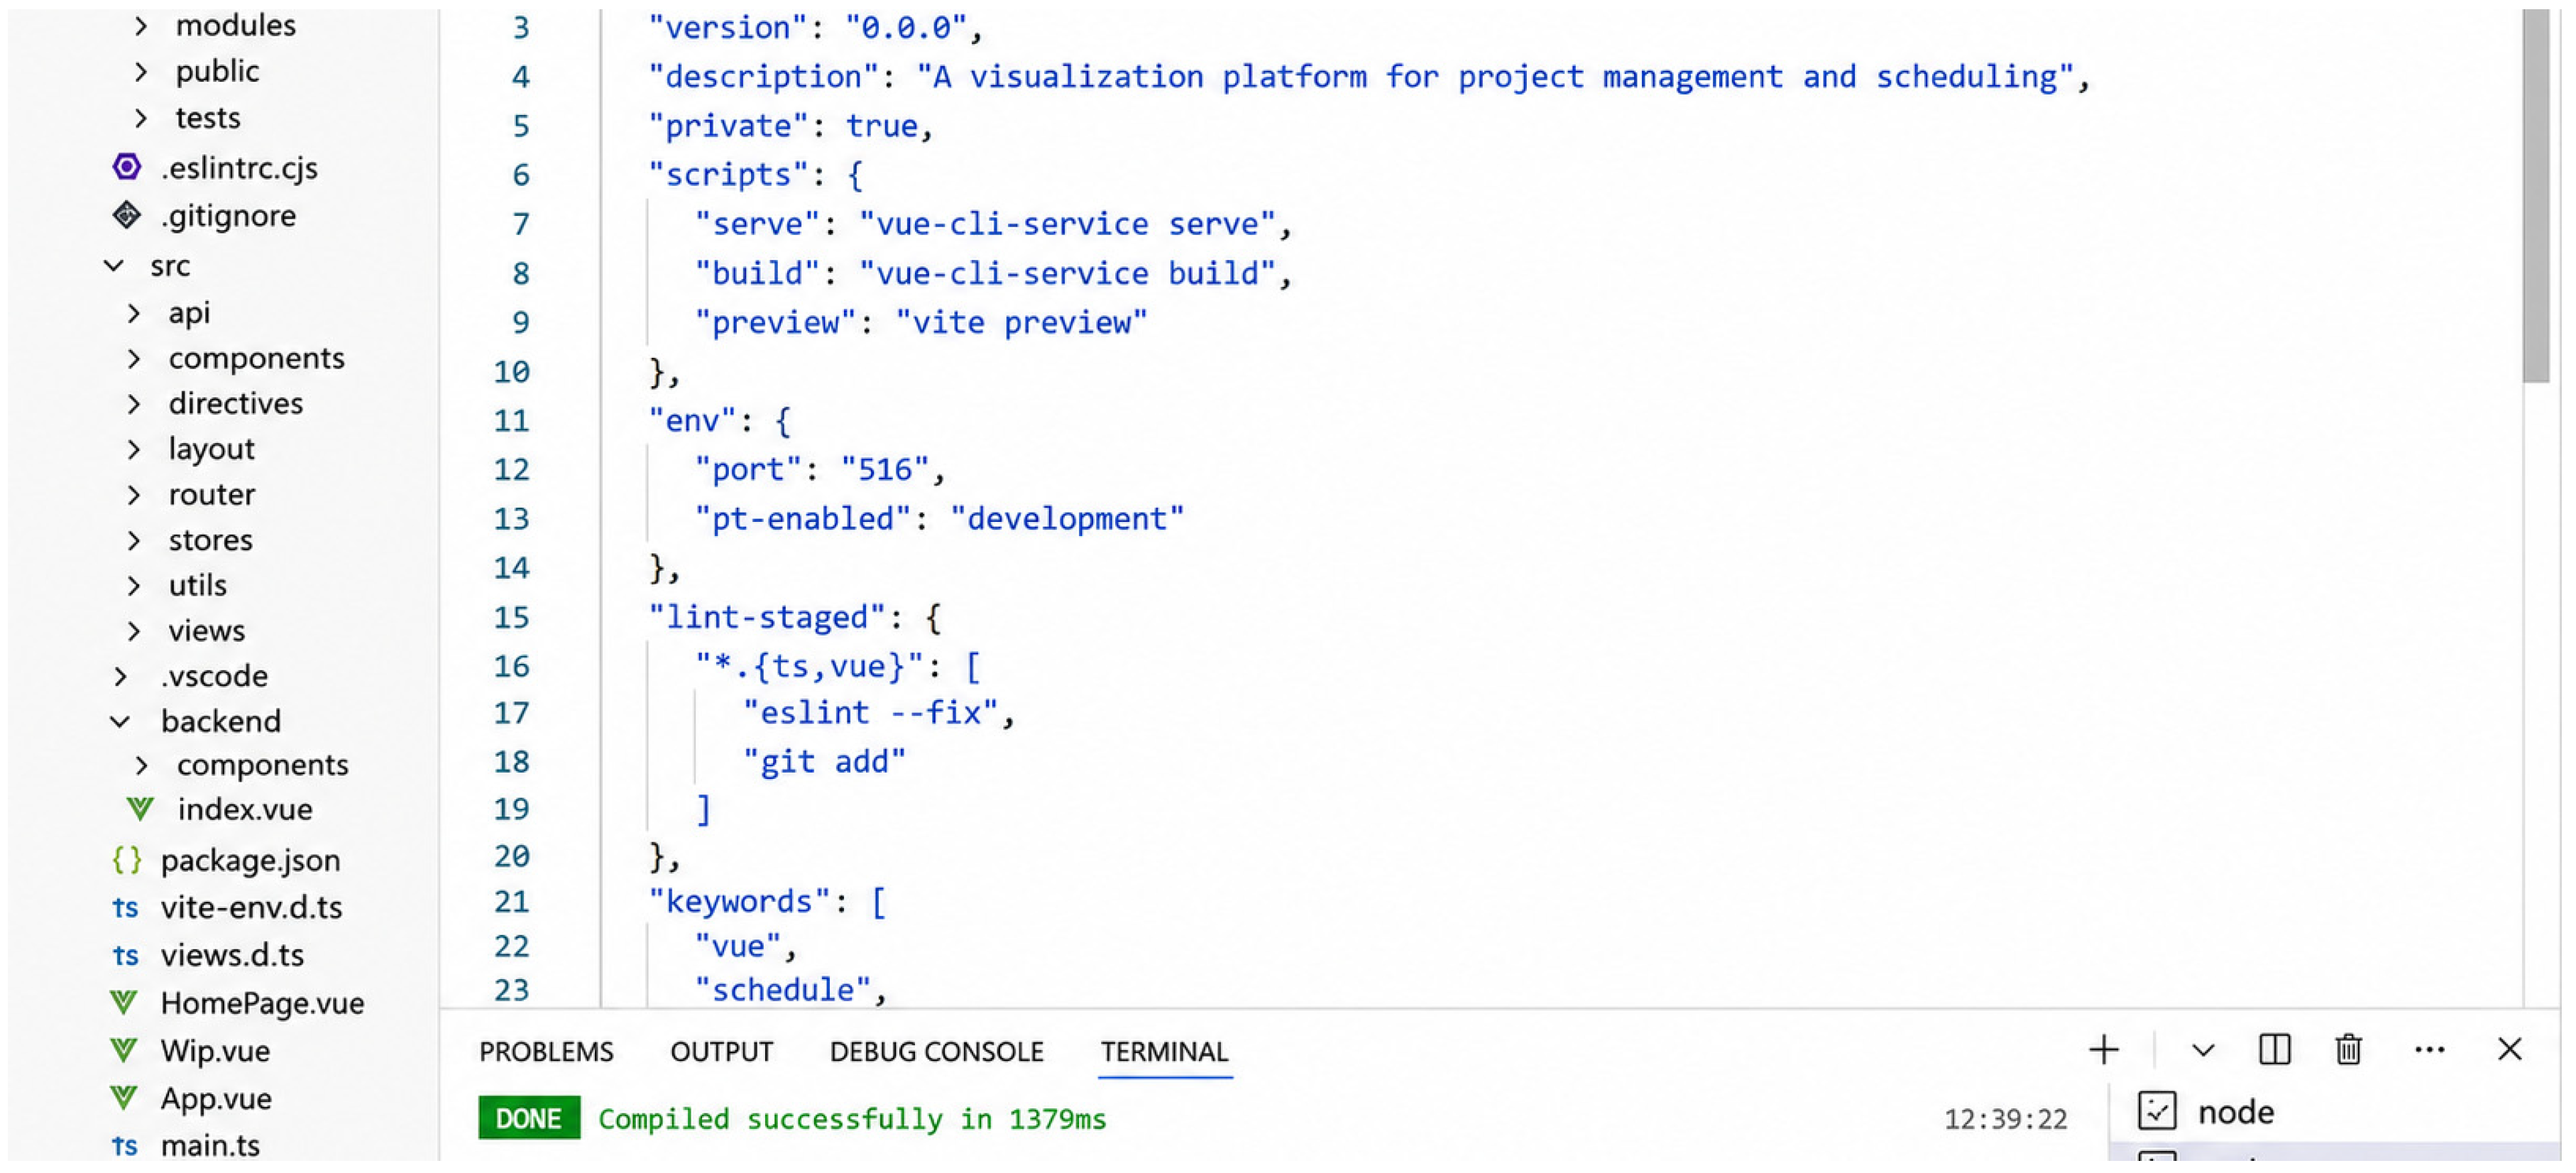
The system’s front end is built around Vue to create the client-side application, which primarily handles interactive functions such as login and authentication, information queries, result retrieval, and system administration. Through page components, routing structures, and state management, modules such as the home page, basic information queries, comprehensive information tracing, quality prediction, and temperature queries can be switched between and accessed within the same interface framework. The front-end project framework is shown in
Figure 4.
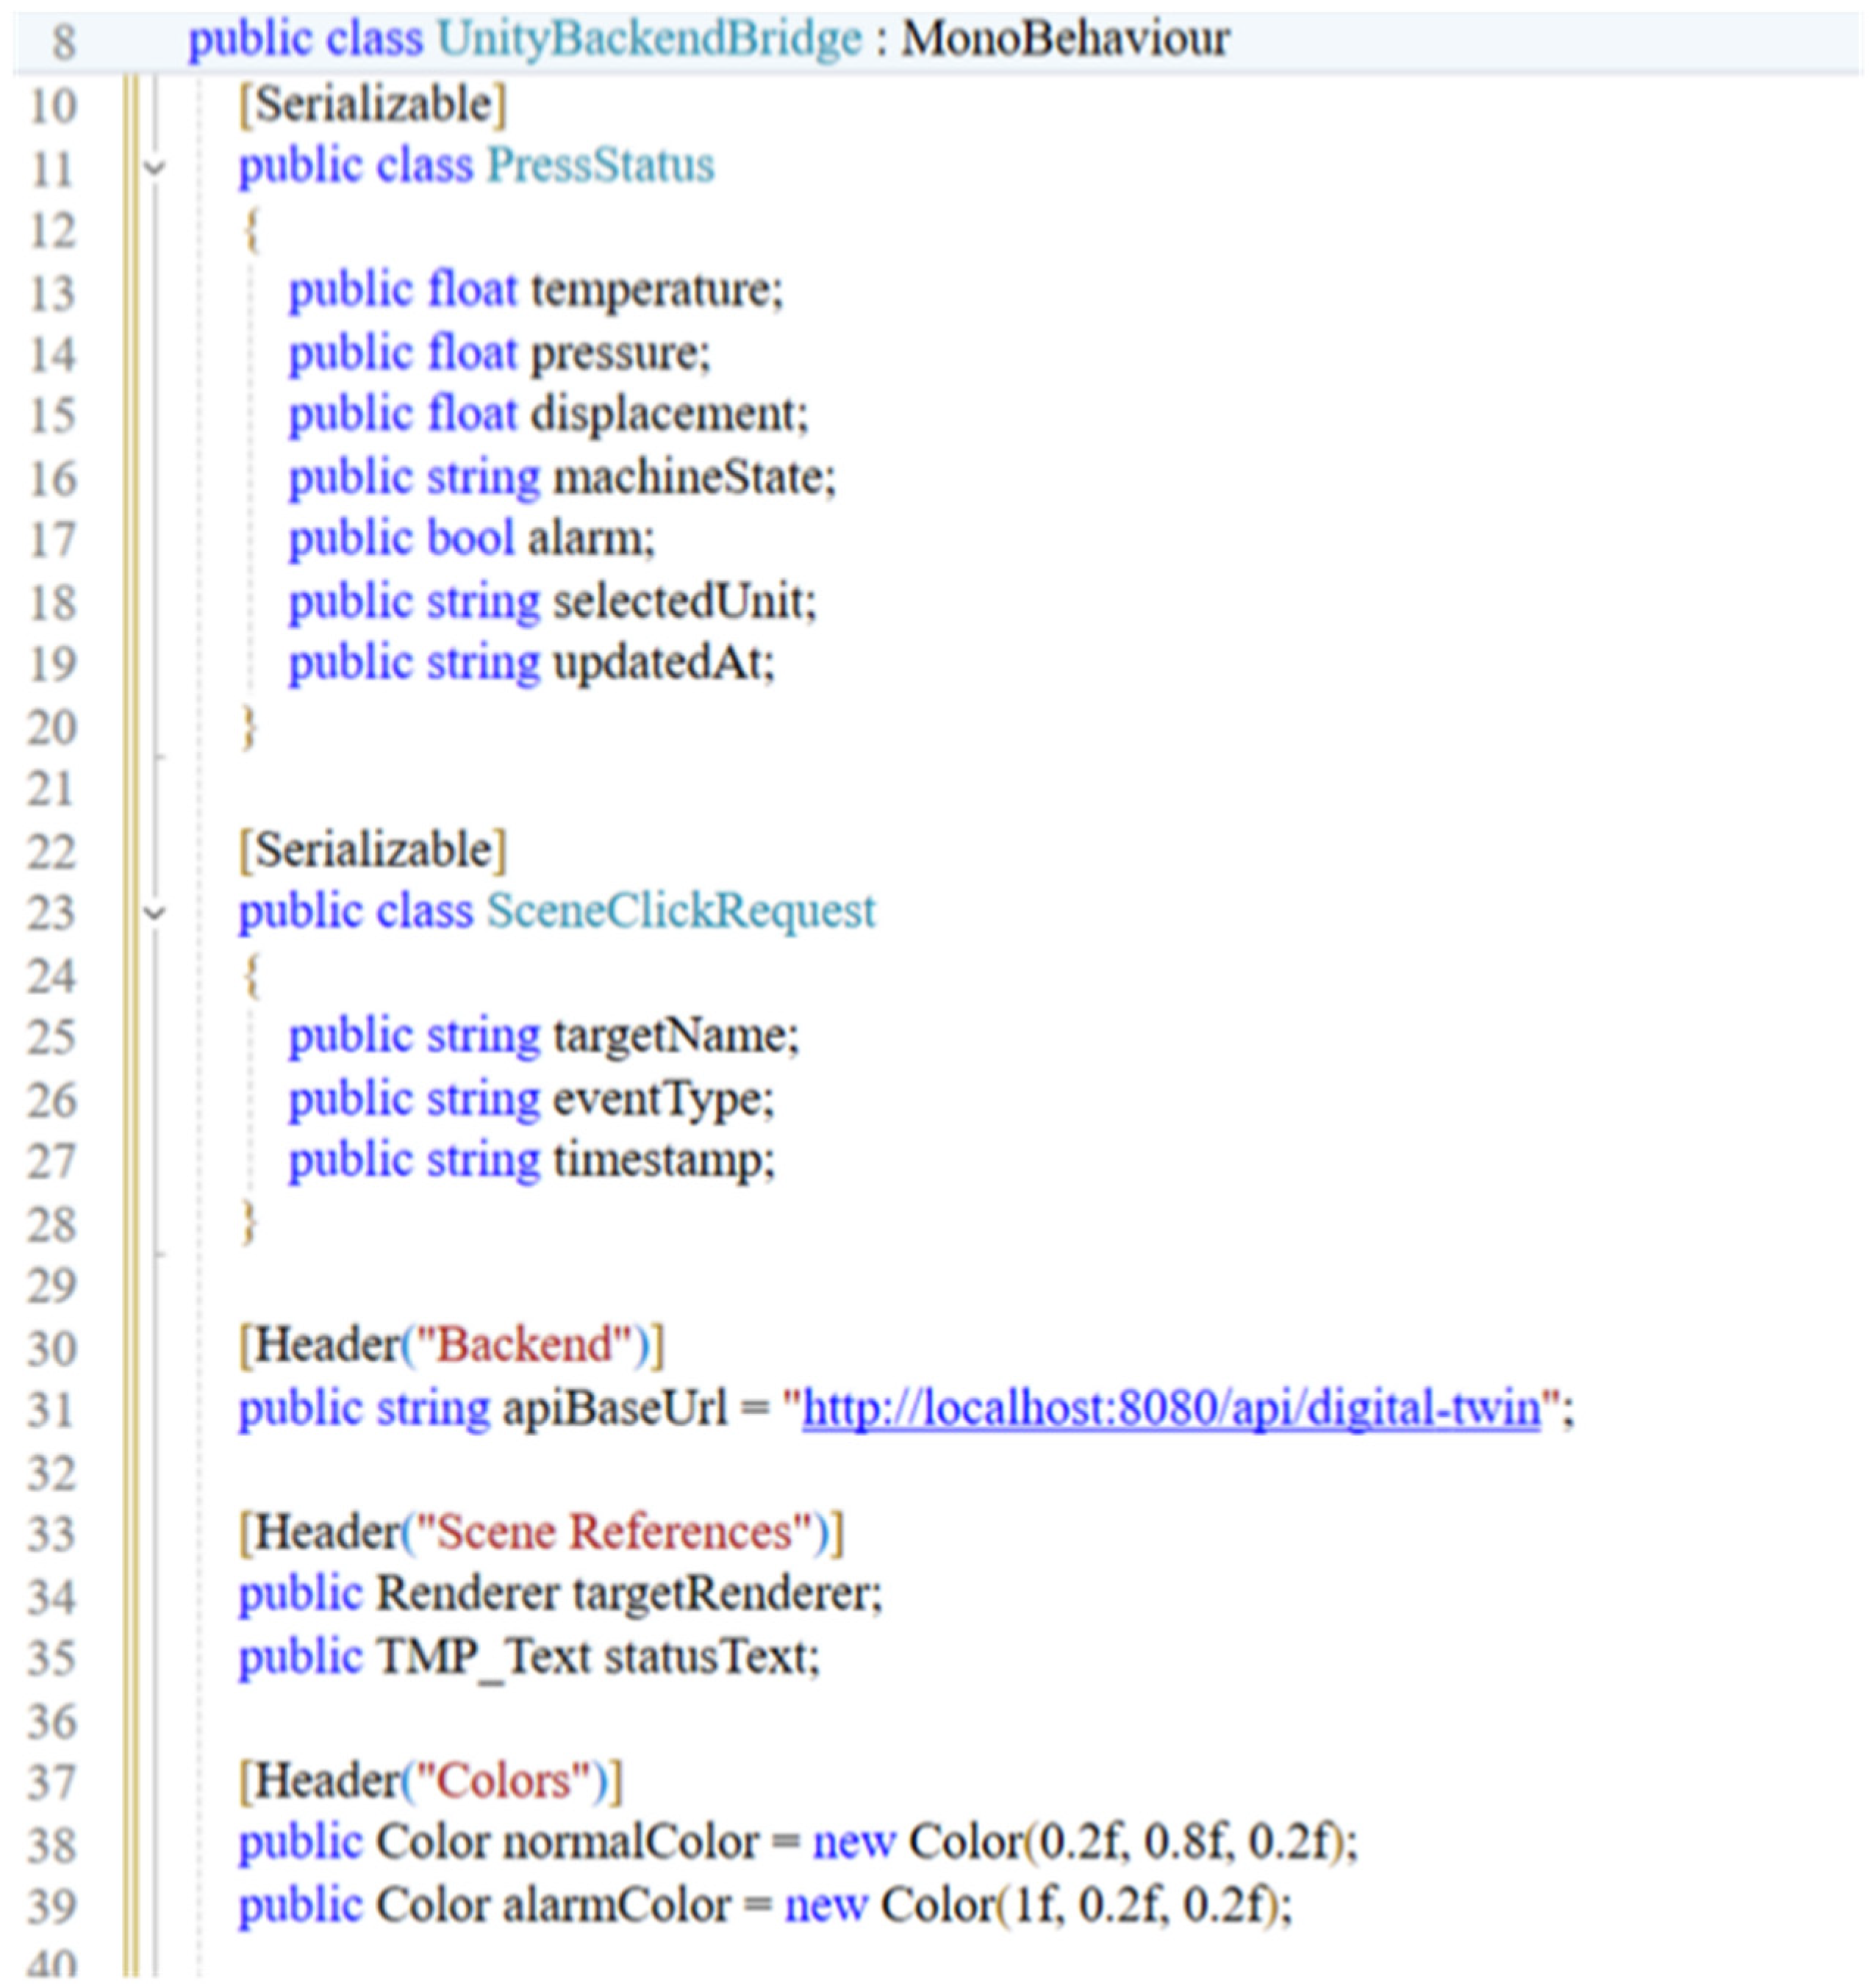
To meet the digital visualization requirements outlined in this document, the system incorporates a Unity 3D interface in addition to the front-end pages to provide a contextualized representation of device status, process parameters, and operational information. The Unity 3D interface serves as the digital twin visualization layer within the system. It primarily receives temperature, pressure, displacement, equipment status, and alarm information published by the backend and maps this data to a virtual equipment scene. The system currently forms a data chain spanning the physical thermal-pressing site, PLC data acquisition, Spring Boot backend services, database management, and the Unity visualization interface, primarily serving process monitoring, quality traceability, and status display. Closed-loop feedback control and intelligent optimization will be further expanded in subsequent research. To illustrate how Unity reads data and performs scene mapping via backend interfaces, its code framework is shown in
Figure 5.
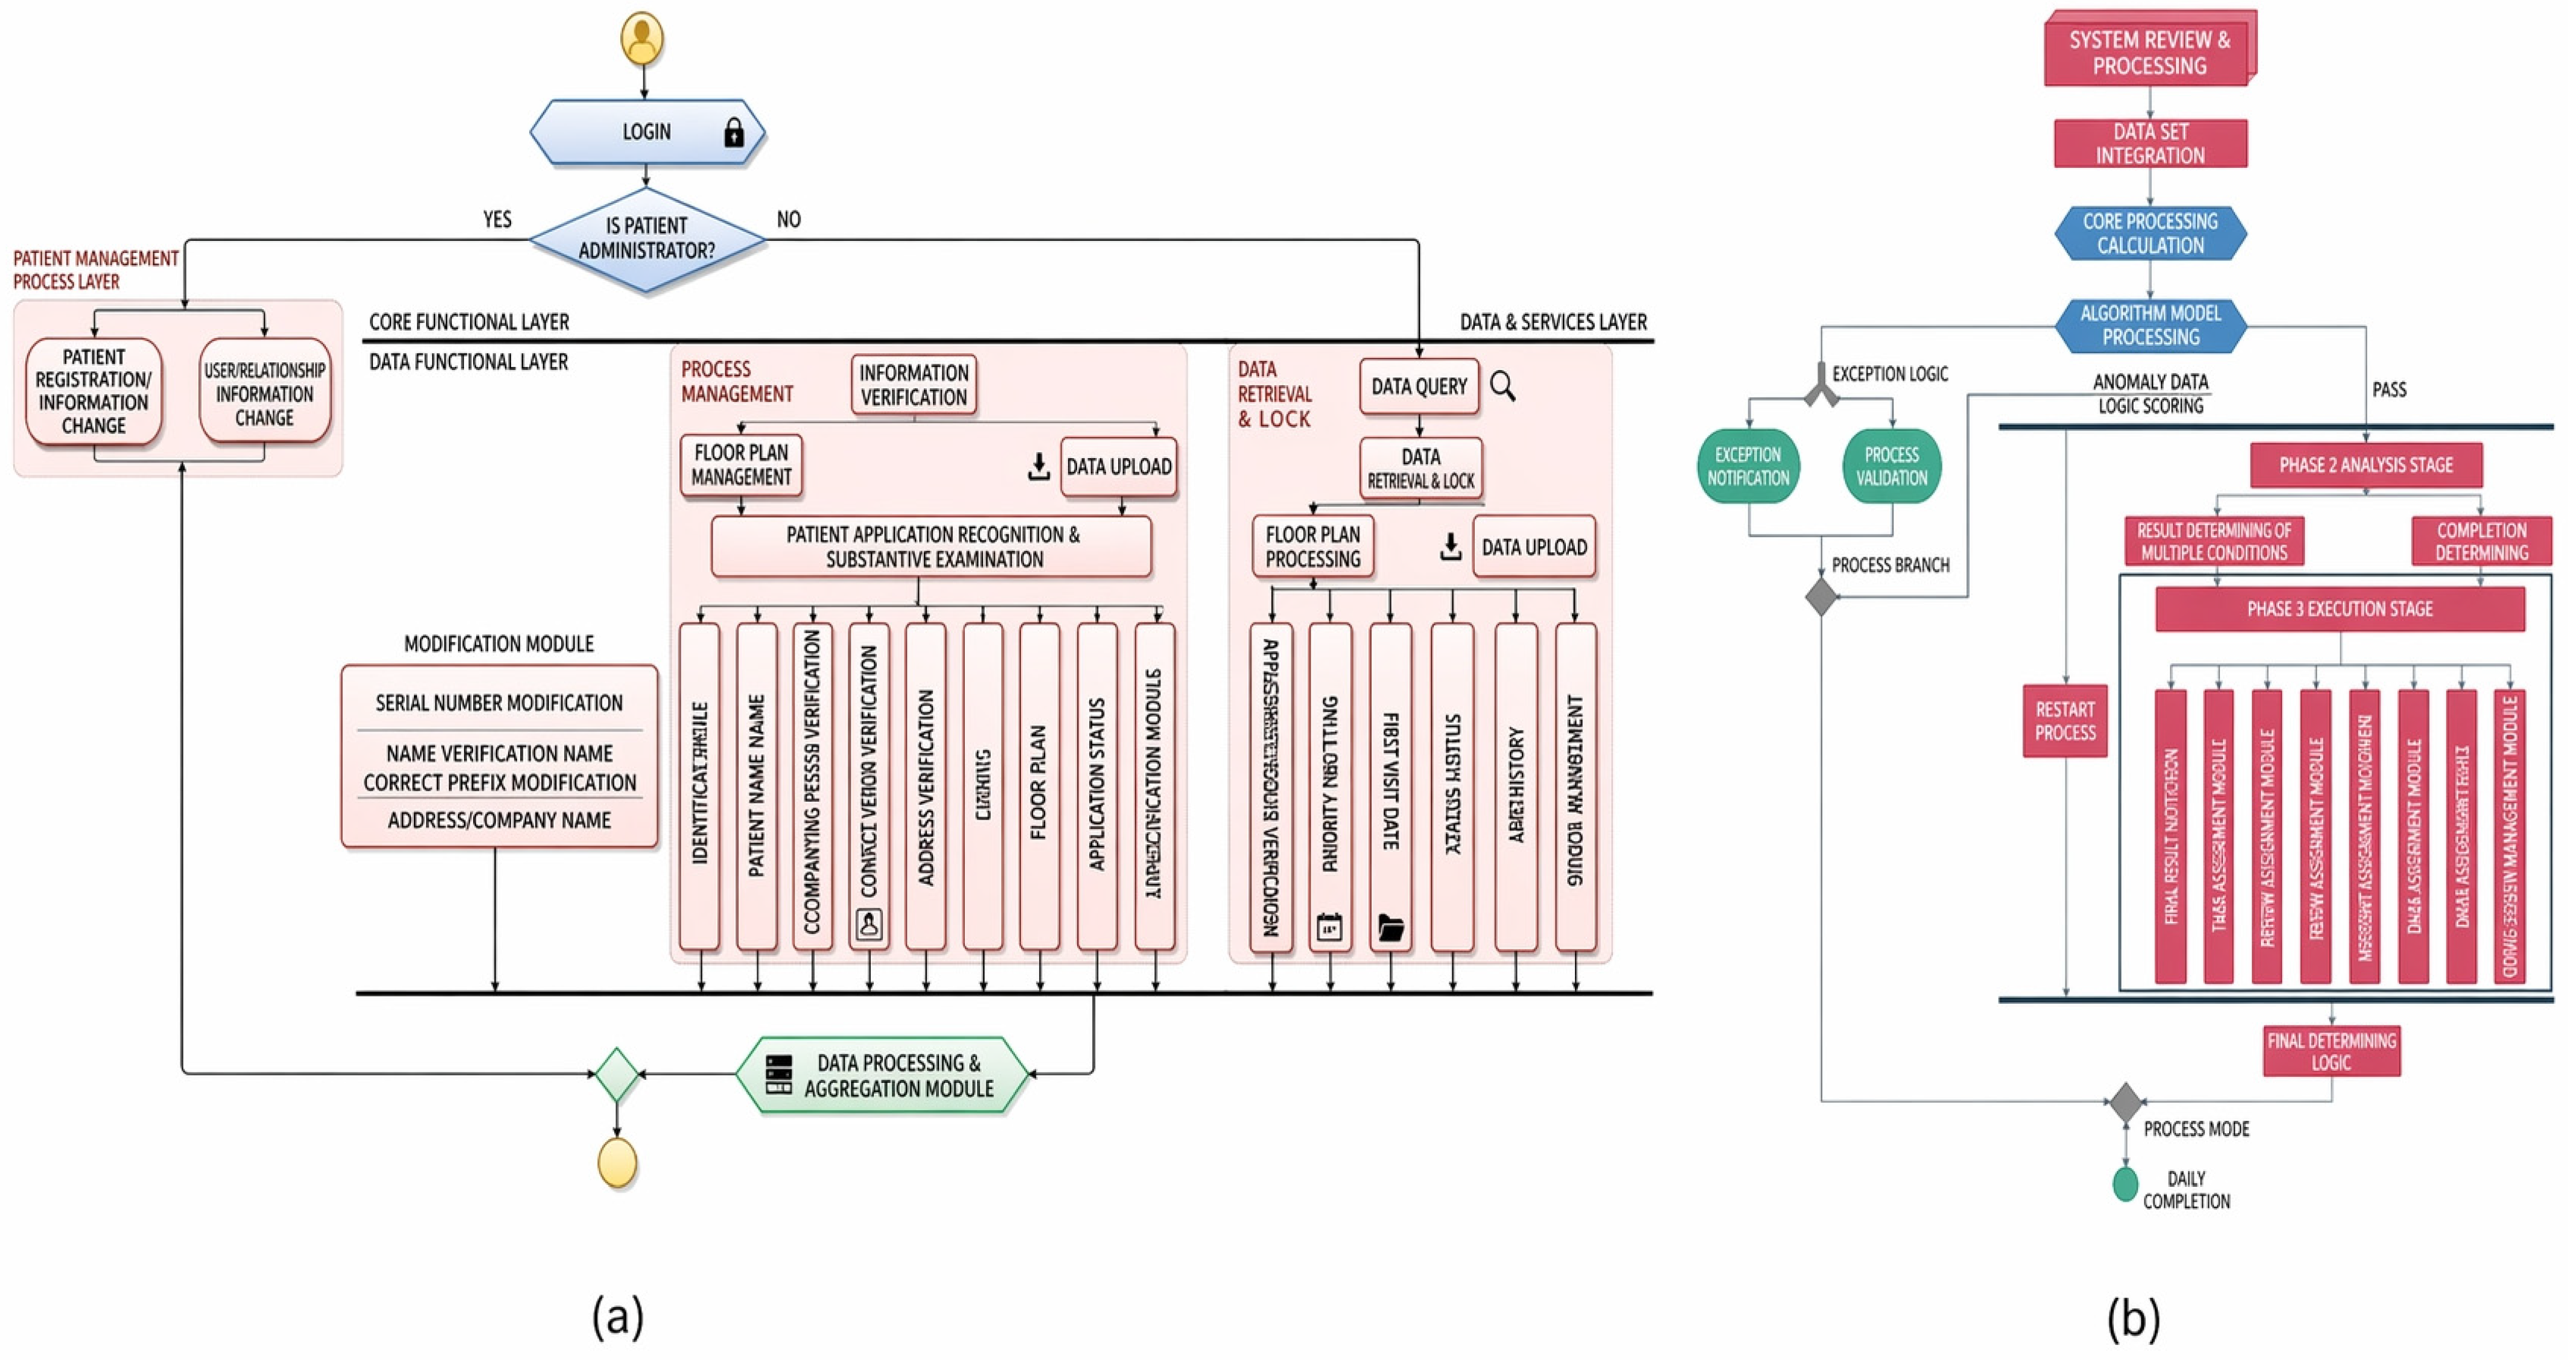
Building on the front-end and visualization interface design, the system further incorporates functional modules tailored to on-site application needs, including login, home page, basic information query, comprehensive information traceability, quality prediction query, temperature query, system management, and system monitoring. Specifically, the login module handles user authentication and permission verification; the home page module provides a system overview and navigation; the basic information query and comprehensive information traceability modules facilitate linked queries of product attributes, process records, and quality information; and the quality prediction and temperature query modules are responsible for retrieving prediction results and displaying process parameters, respectively. From the perspective of typical business processes, the system’s main modules all follow the basic logic of page-initiated requests, backend reception and processing, data reading or updating, and result return and display, with the interaction sequence shown in
Figure 6. Through this design, the front-end pages and the Unity 3D interface form a collaborative working relationship under the support of a unified backend, thereby jointly undertaking the system’s information interaction and digital display tasks.
2.4. Database, Backend API, and Communication Integration Design
To enhance the reproducibility of the system implementation process, this paper summarizes the field hardware, data acquisition, communication interfaces, database structure, API organization, and model invocation methods. The main technical specifications are shown in
Table 2.
Synchronization delay testing was conducted based on field operation logs. The Spring Boot backend records a physical-side timestamp upon completing the reading of PLC data, while the Unity interface records a virtual-side timestamp upon completing the corresponding data refresh. Test subjects include hot press plate temperature, valve opening, and equipment operating status. During the test, hot press process data was continuously recorded for 2040 s, and the average synchronization delay, maximum synchronization delay, and 95th percentile delay between the physical side and the virtual model were calculated.
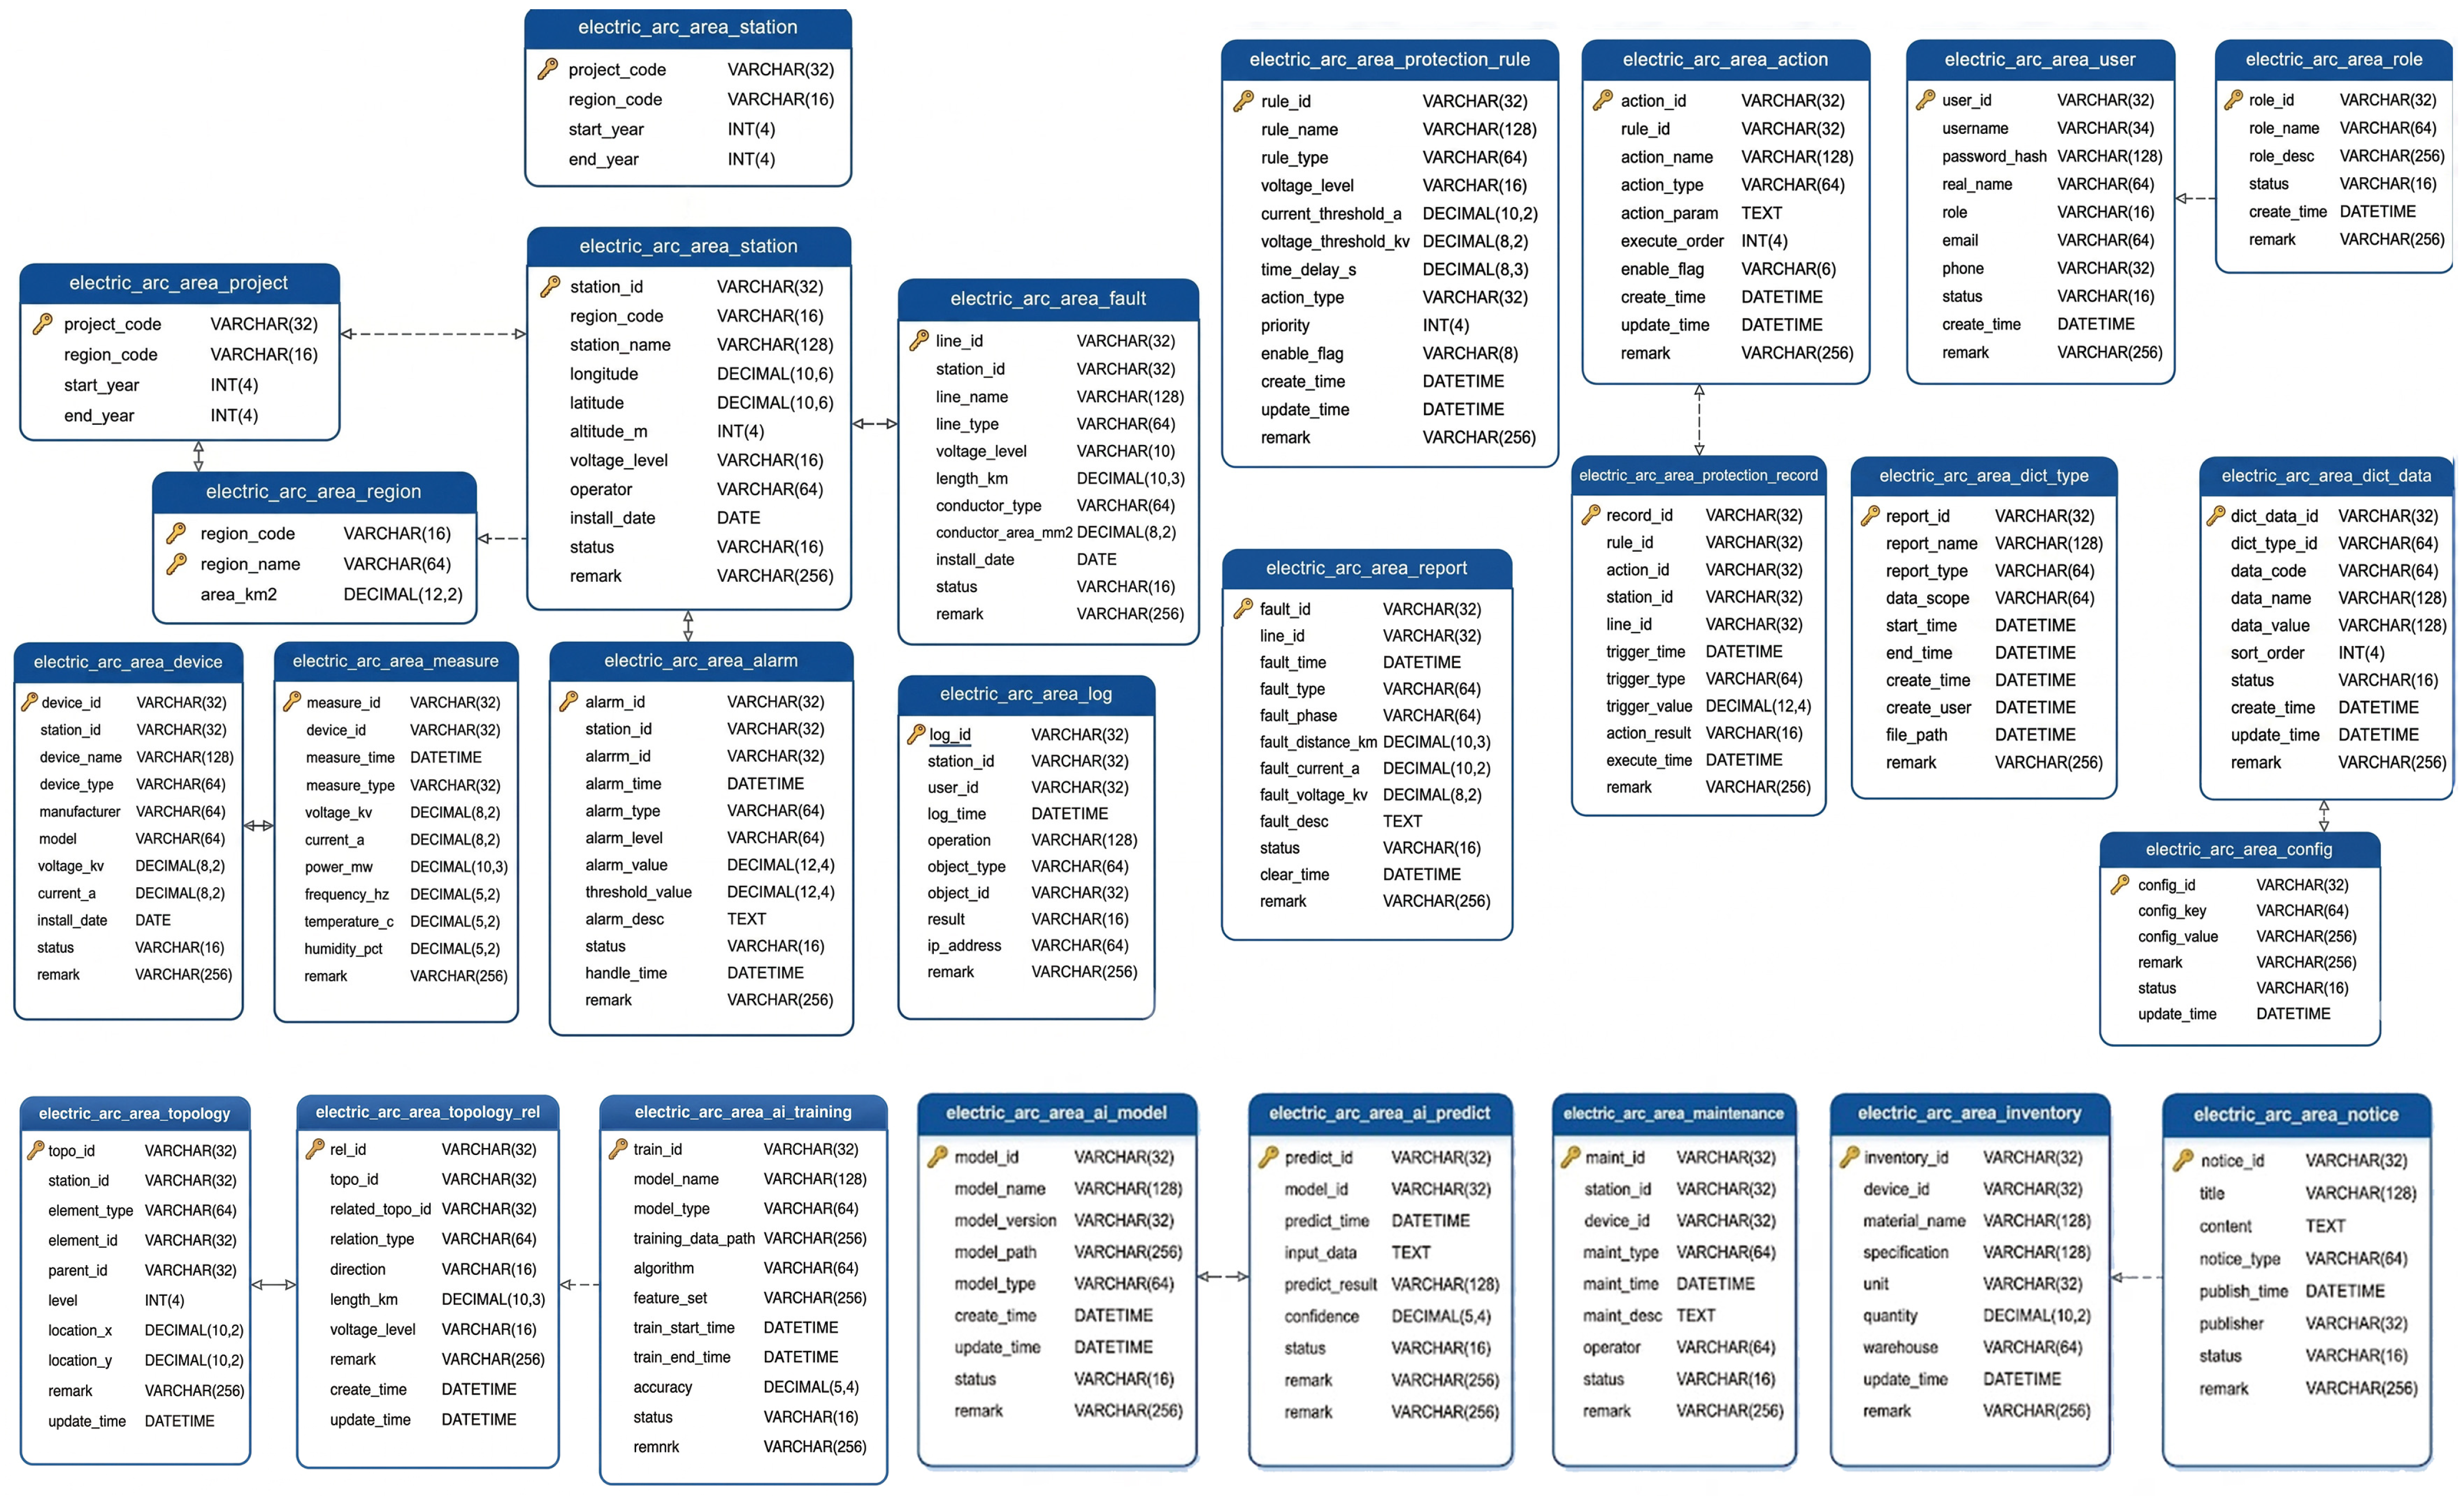
To support the system’s query, traceability, predictive analysis, and real-time monitoring functions, further work is required within the system to complete the design of the database architecture, backend interface services, and data integration with external programs and devices. The system establishes a relational database centered on user information, basic information, process parameters, quality results, prediction results, and control/monitoring data to support functions such as basic information queries, process traceability, prediction retrieval, and system management. On this basis, the database is no longer merely a simple data storage container but serves as a unified data foundation connecting basic information, forming and machining information, quality information, and prediction information. Its table relationship structure is shown in
Figure 7, and representative anonymized database fields and example records are provided in
Supplementary Materials File S1.
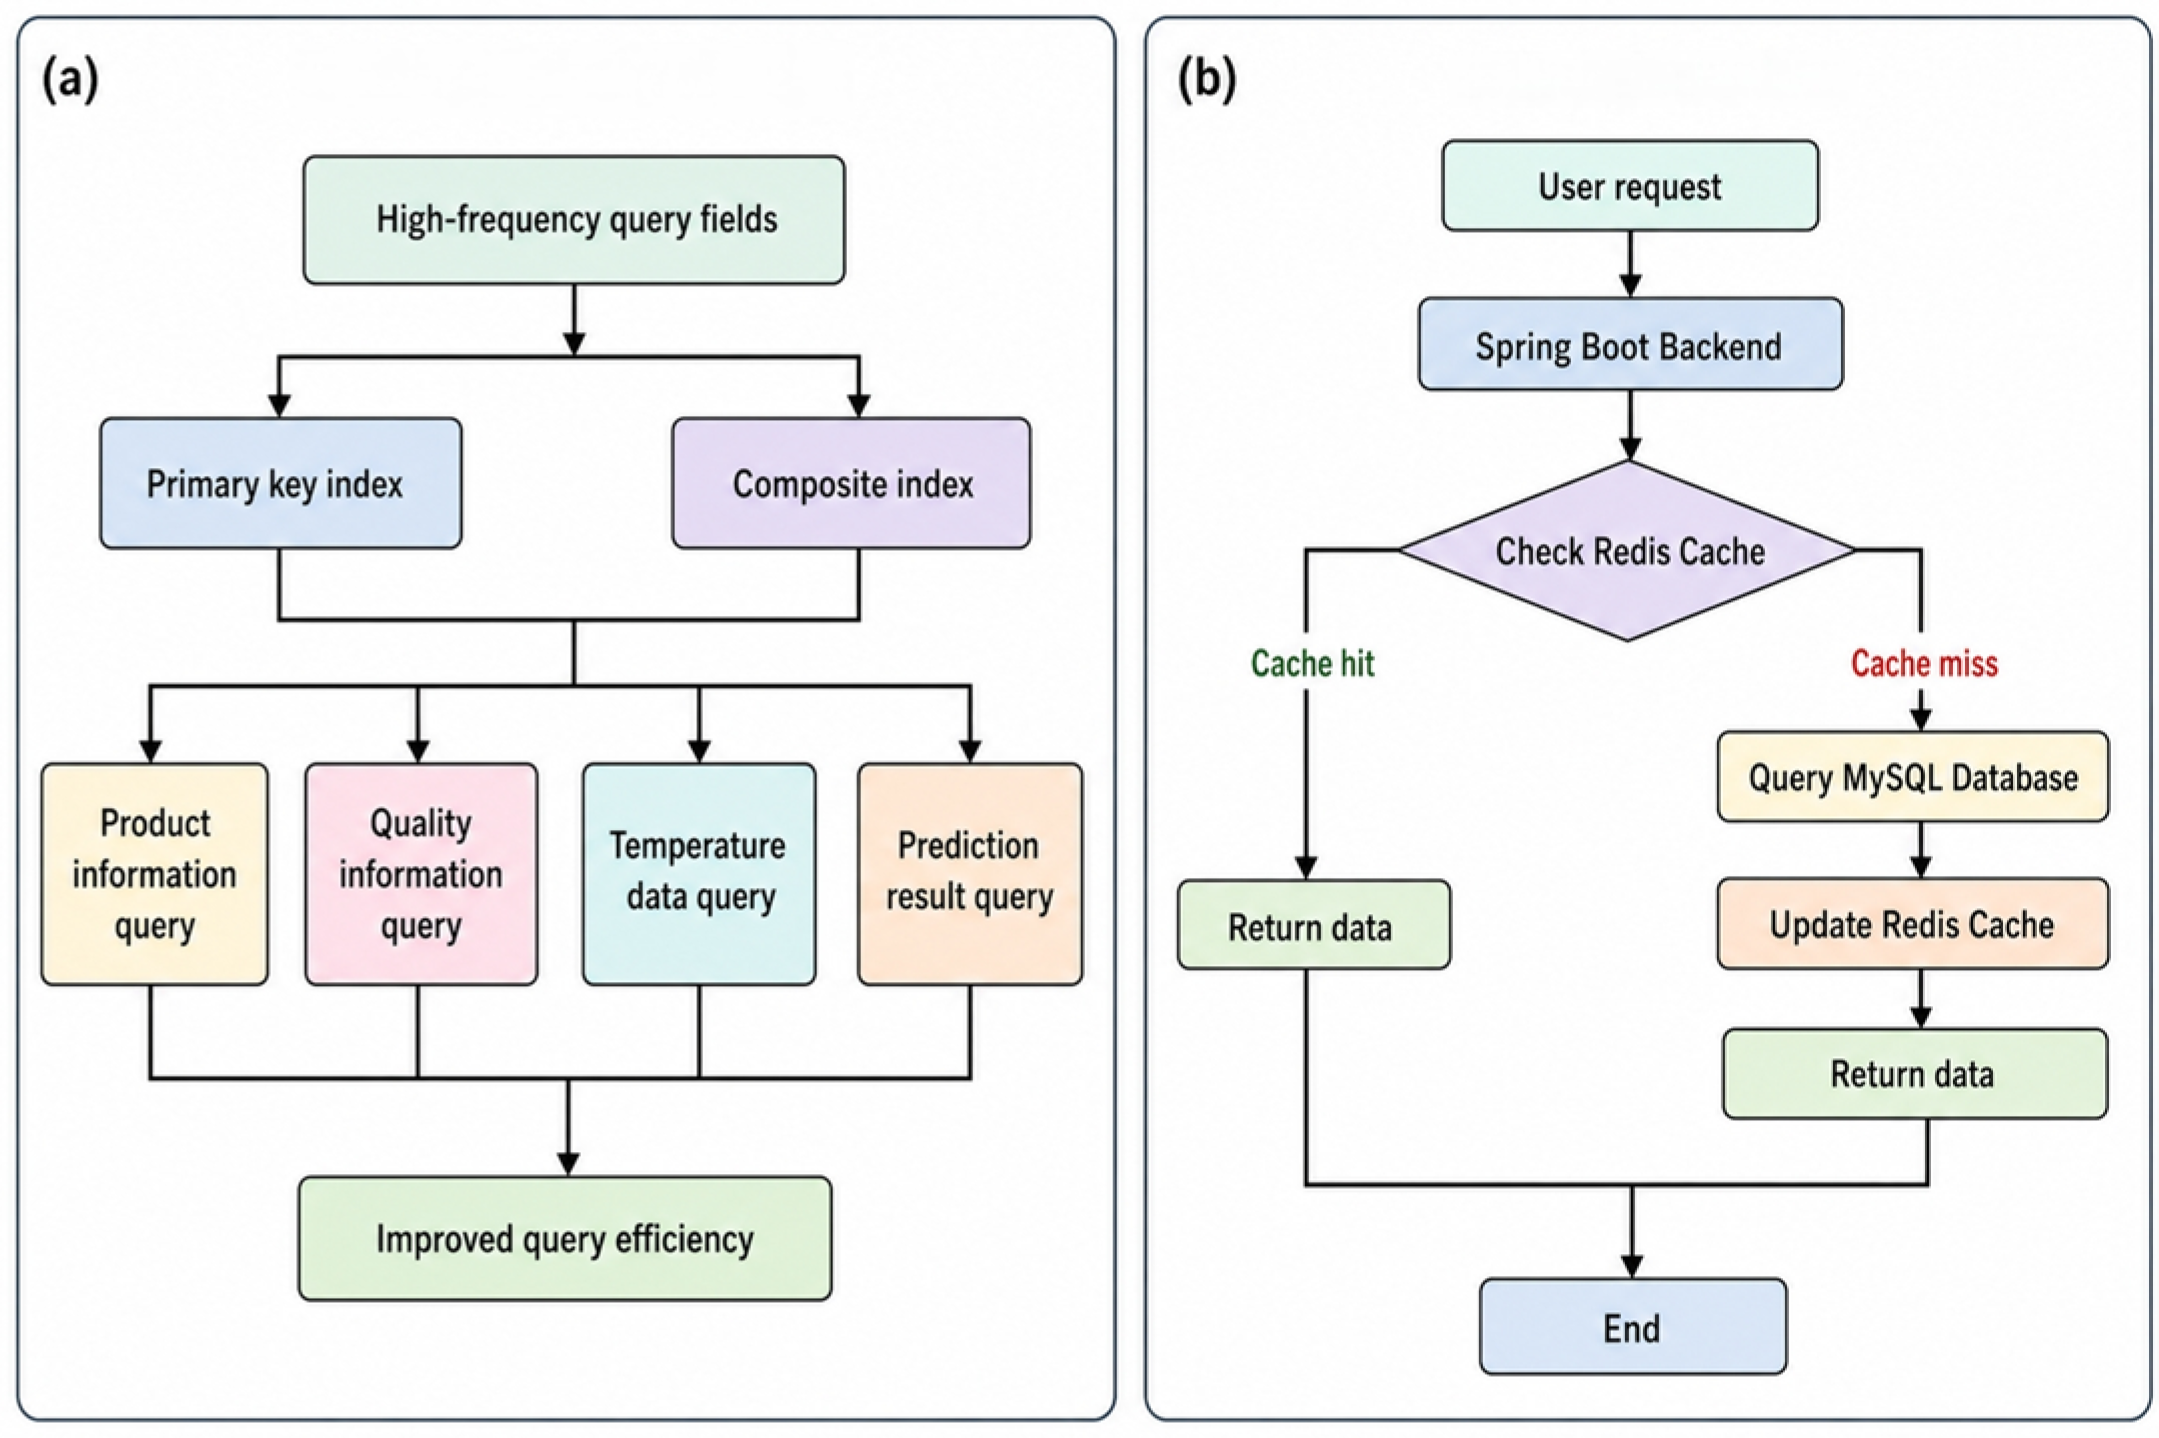
To improve query efficiency and response performance under continuous operation, the database design incorporates additional measures such as index optimization and caching support. Specifically, by creating primary key indexes and composite indexes on frequently queried fields, the system enhances the execution efficiency of multi-table joins and conditional searches. Additionally, the system utilizes Redis to cache hot data and frequently accessed data, thereby reducing the read load on MySQL and improving overall response times. The relevant database optimization design is shown in
Figure 8.
After the database structure was established, the system adopted Spring Boot as its core backend framework to handle tasks such as data reception, business processing, and API publication [
28]. The backend is responsible not only for database read/write operations, user request processing, and permission management, but also for orchestrating calls to predictive models and providing unified data services to both web pages and Unity interfaces. As a result, the backend serves as a unified business and data hub connecting the database, business modules, and user interfaces.
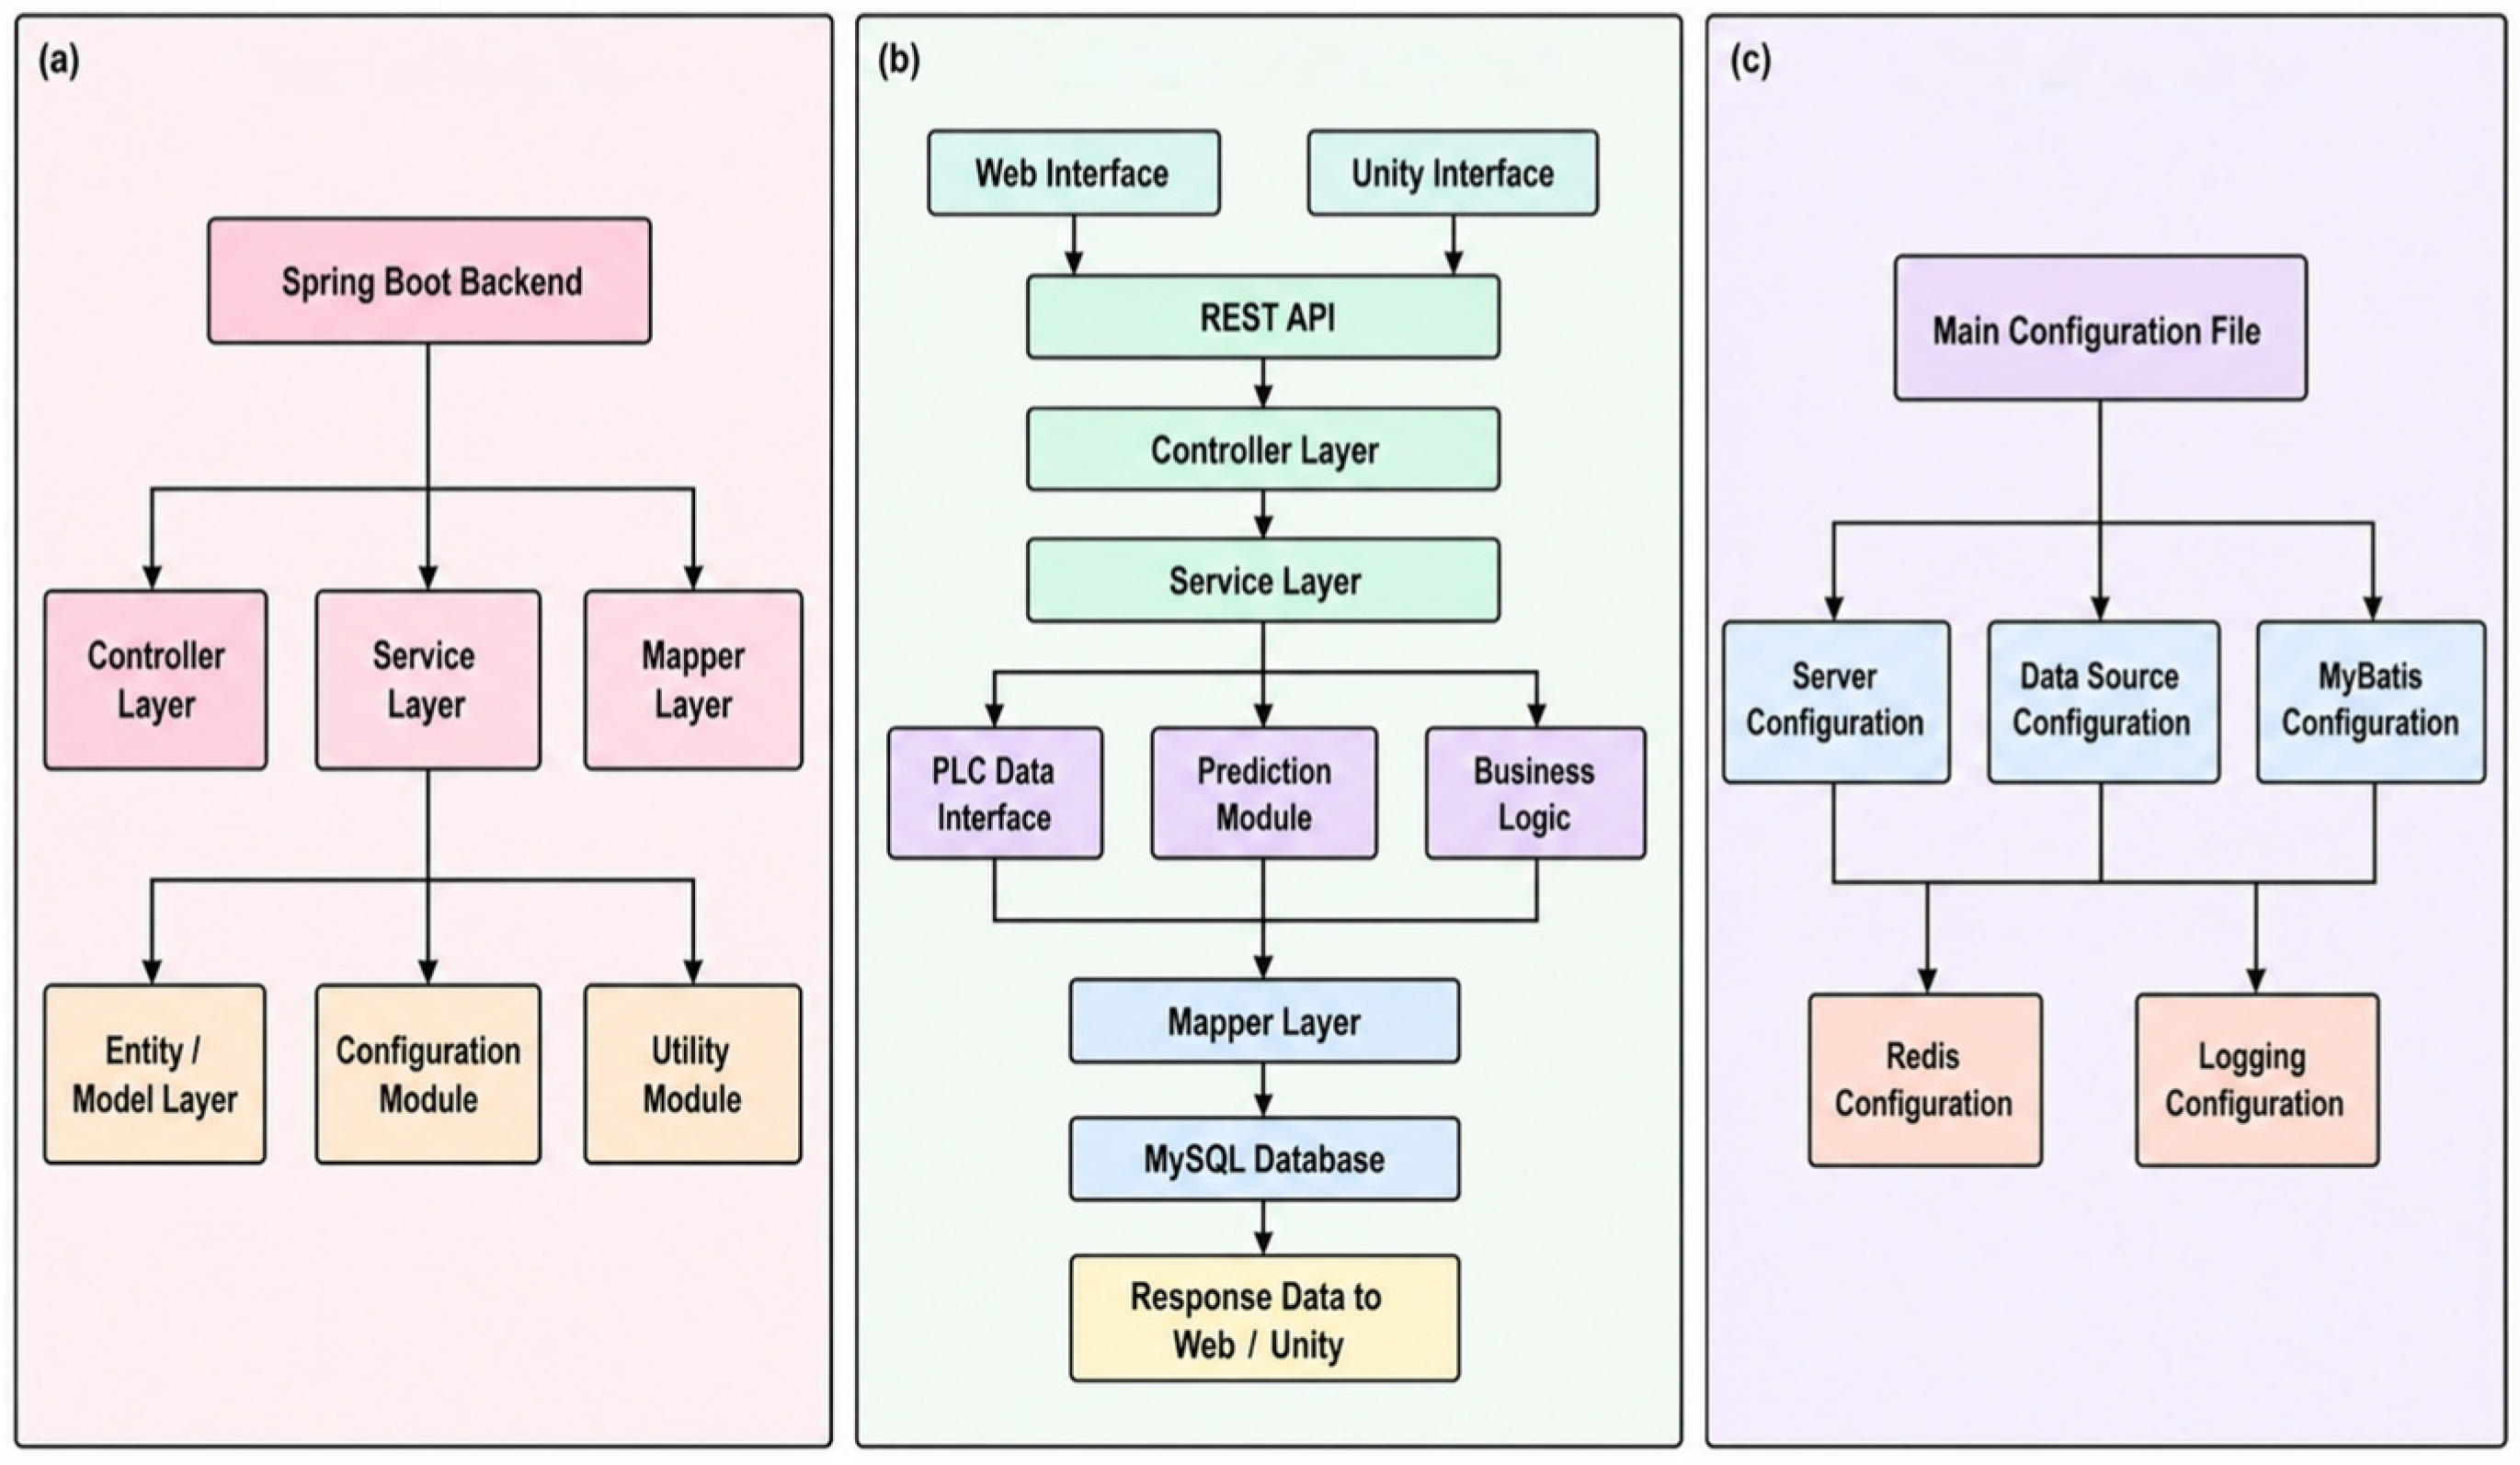
The backend uses the Spring Boot MVC architecture and is responsible for data reception, business logic processing, API publication, database access, and calling predictive models. The system organizes backend logic into layers comprising Controllers, Services, and Mappers, and loads data sources, caches, and runtime parameters via a main configuration file. The backend framework and configuration design are shown in
Figure 9.
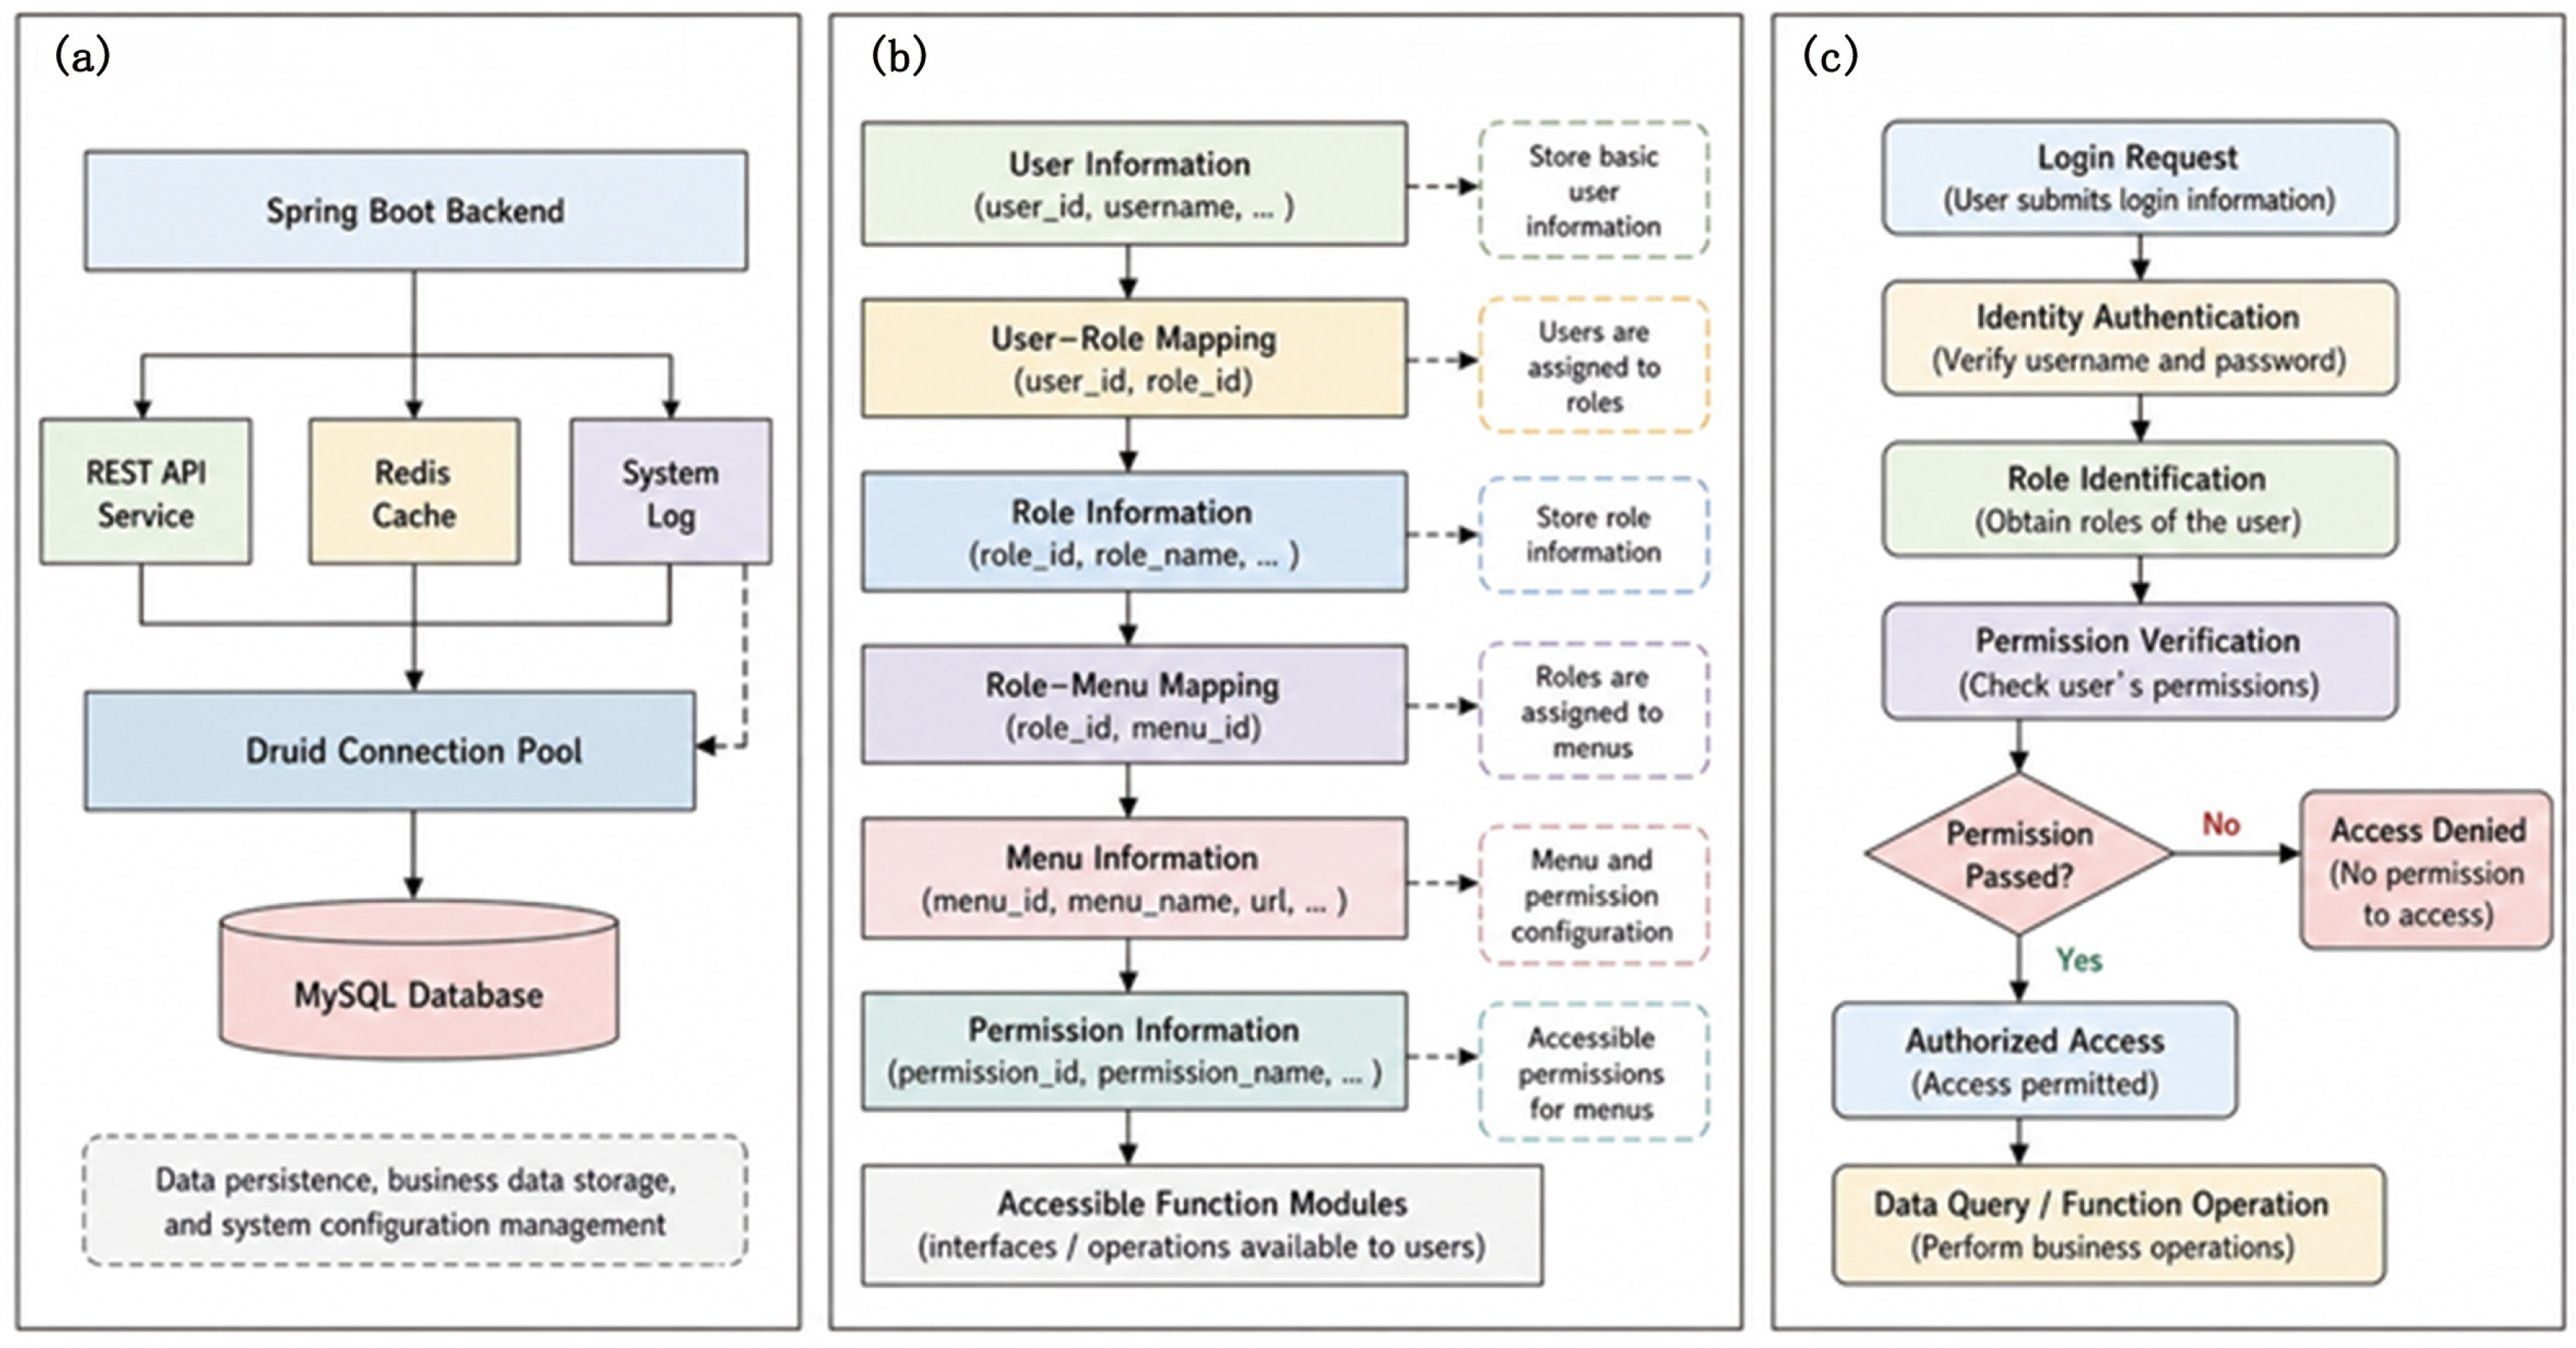
At the same time, the system has been further designed around its business support architecture and permission control relationships to ensure differentiated access for different user roles within the unified system. In particular, permission management primarily controls access scope through mapping relationships between users, roles, and menus, while the relevant support architecture collectively forms the foundation for the stable operation of backend services. The relevant design is shown in
Figure 10.
In practical implementation, the system organizes model results and handles business calls through a unified backend interface [
29]. It also uses a mechanism for reading and converting on-site parameters to transform key parameters—such as temperature—into standardized data that can be displayed on the system interface and utilized by business functions. In this process, the Unity interface primarily receives data—such as real-time temperature, equipment status, and alarm information—integrated by the backend, and maps it to 3D scene objects, thereby enabling a visual representation of the hot-pressing process status and inspection results. Consequently, the database, backend framework, business support structure, and on-site parameter integration are further consolidated into a unified business chain, providing the foundation for the system to achieve coordinated operation of querying, forecasting, and real-time monitoring.
The Spring Boot backend parses, stores, and publishes the prediction results [
30,
31,
32,
33], and synchronizes updates to both the web interface and the Unity interface. On-site personnel adjust process parameters—such as holding time, board exit temperature, and valve opening—based on prediction quality metrics, temperature curves, and equipment status, thereby establishing a manual feedback loop from the prediction results to the physical hot-pressing process [
34,
35]. An automatic feedback interface between the prediction output and PLC control parameters will be incorporated into a subsequent intelligent control module [
36,
37,
38,
39,
40].
2.5. System Deployment and Operational Support Design
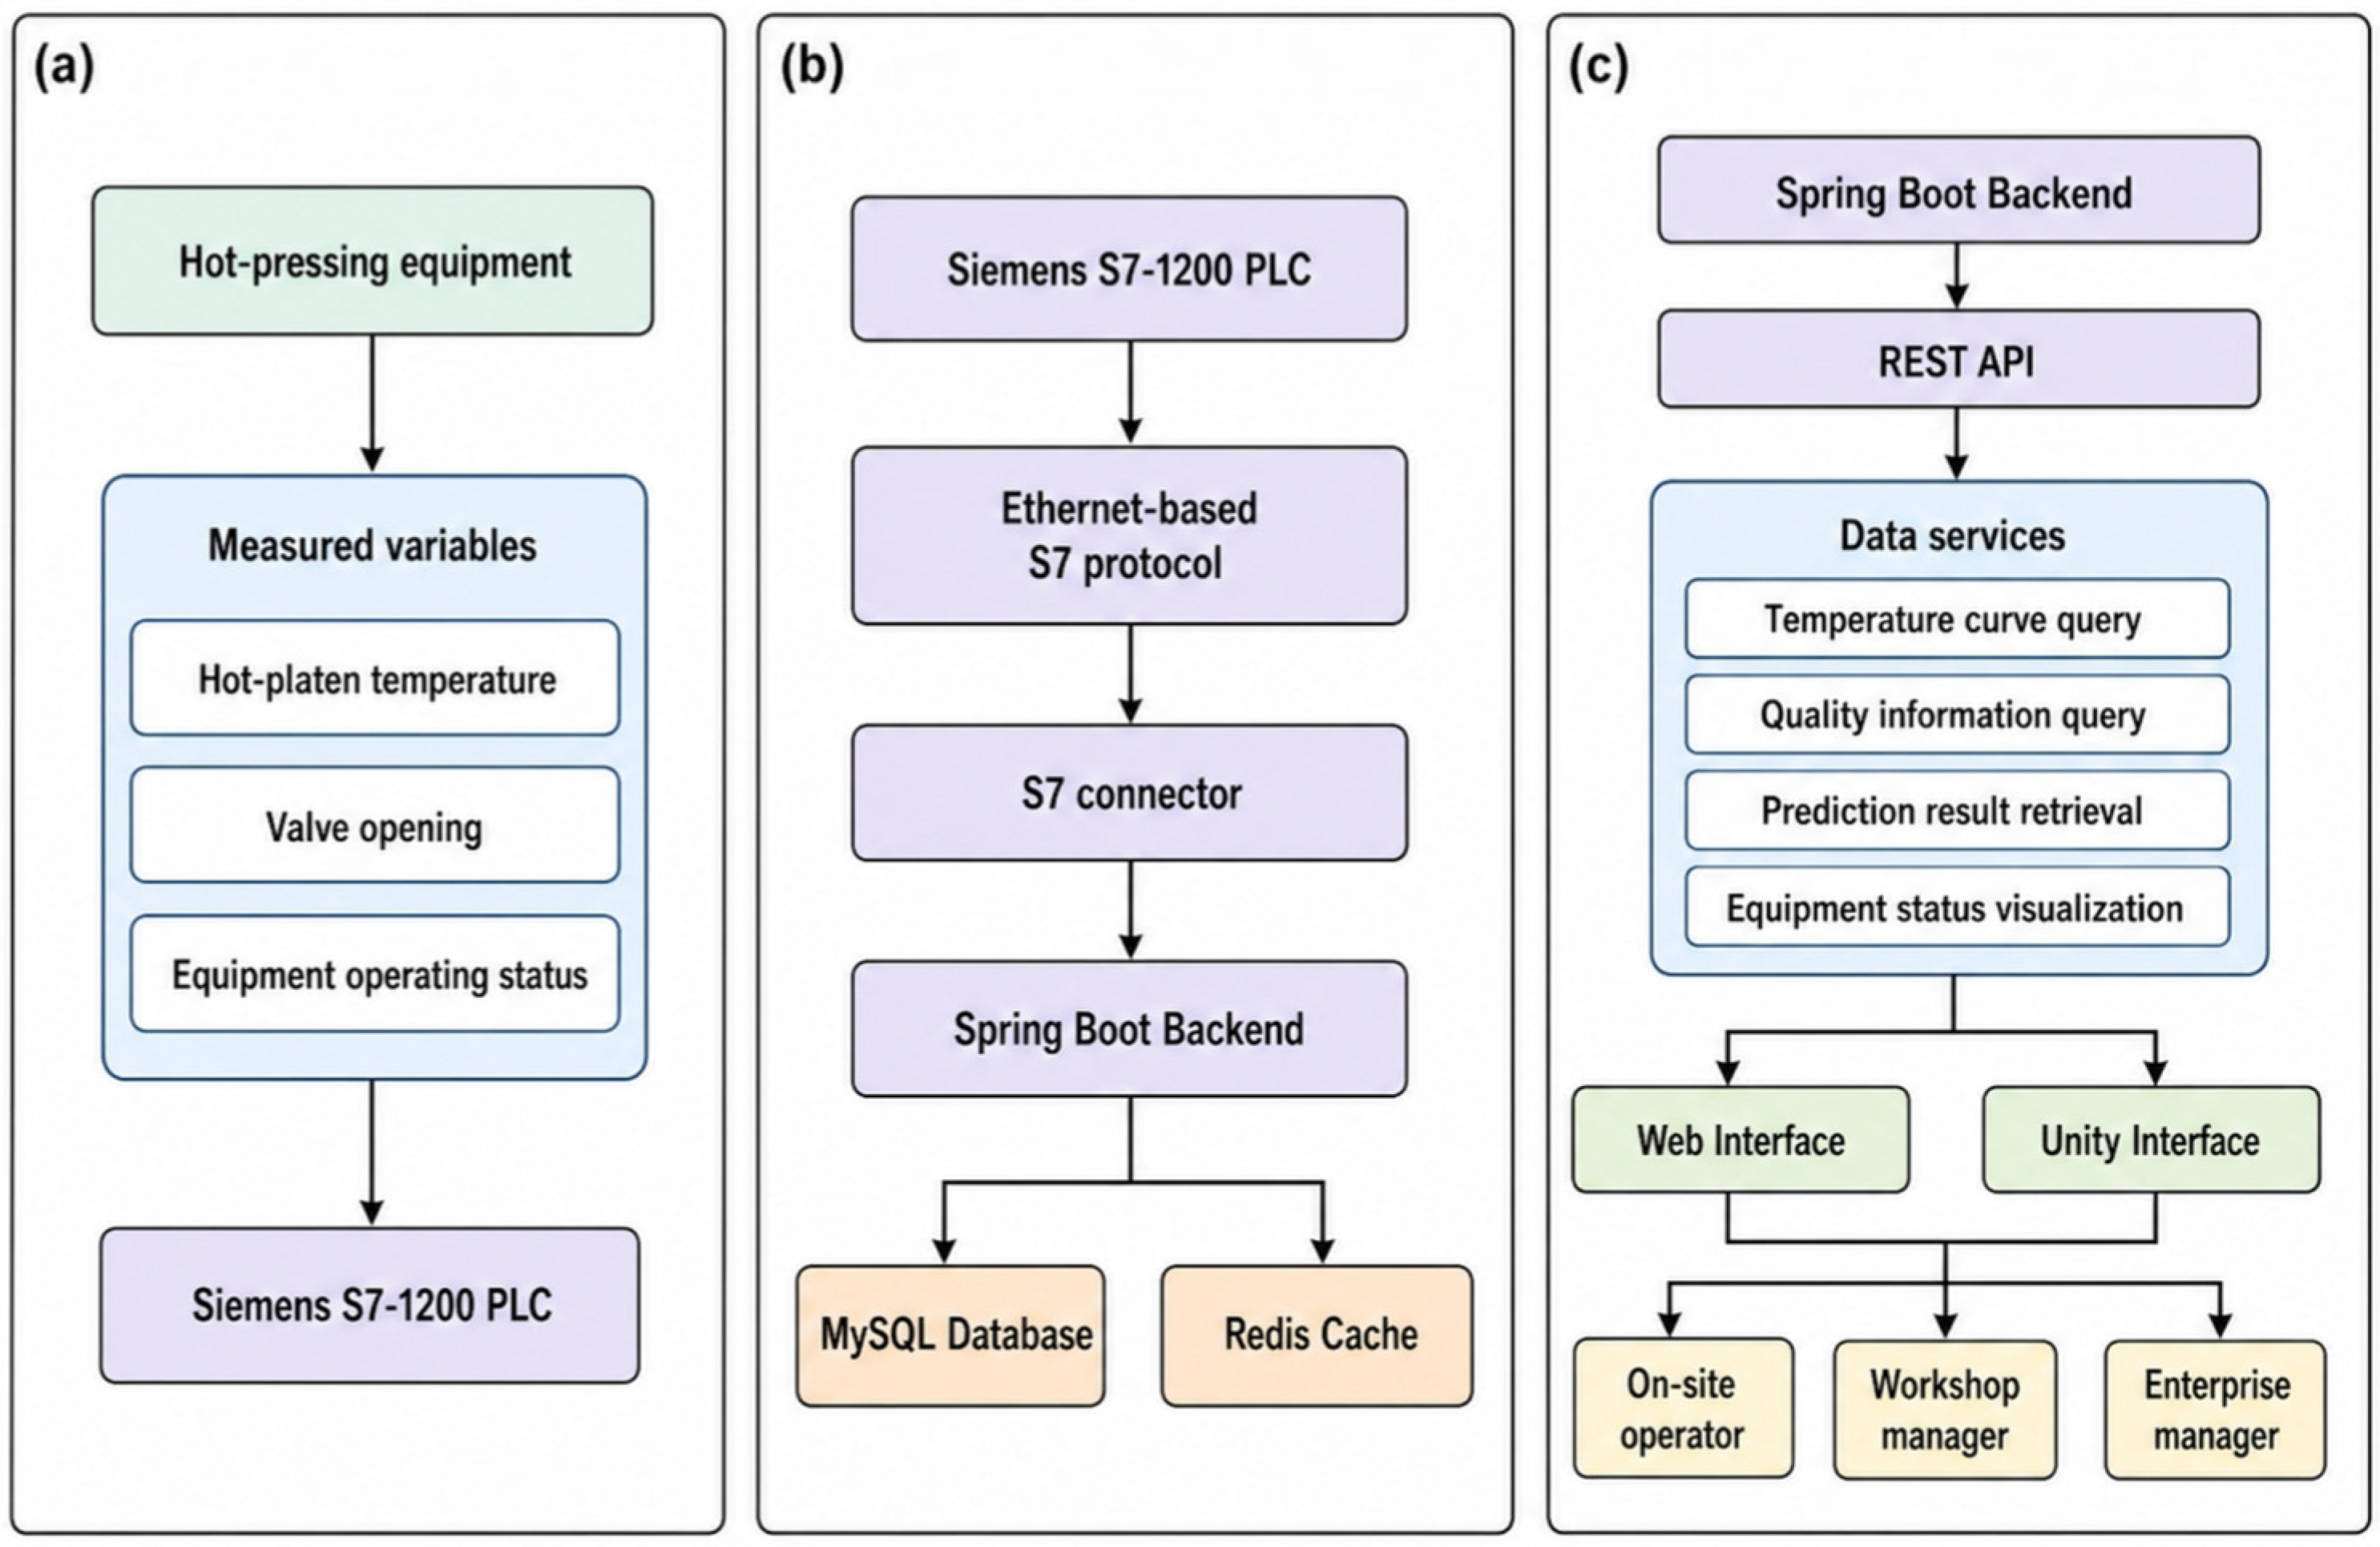
The system is deployed in the enterprise’s on-premises server environment and primarily consists of backend services, a database, a caching service, and a frontend access service. During deployment, the Spring Boot backend, MySQL database, Redis cache, and Web access service work together in a unified runtime environment to support on-site data collection, business processing, result storage, and interface display. The system deployment and data interaction process are shown in
Figure 11.
When the system is running, the database and cache services are initialized first, followed by the startup of the backend services and the establishment of connections with the PLC data acquisition module and the prediction module. Once the system is operational, the hot-pressing process data collected by the PLC is written to the database via the backend services and simultaneously updated on the web page and in the Unity scene. This data pipeline provides operational support for on-site process monitoring, information management, and digital visualization at the enterprise.
3. Results
3.1. Web Page Functionality Implementation and Overall System Presentation
To demonstrate the system’s implementation on 2D web pages, this paper summarizes the main functions of the web pages and explains them in terms of system entry, information querying, process monitoring, and result retrieval. Currently, the system has completed the development of core pages such as the home page overview, login and authentication, basic information querying, quality information querying, real-time temperature monitoring, prediction result retrieval, and system management, forming a relatively comprehensive 2D business page system.
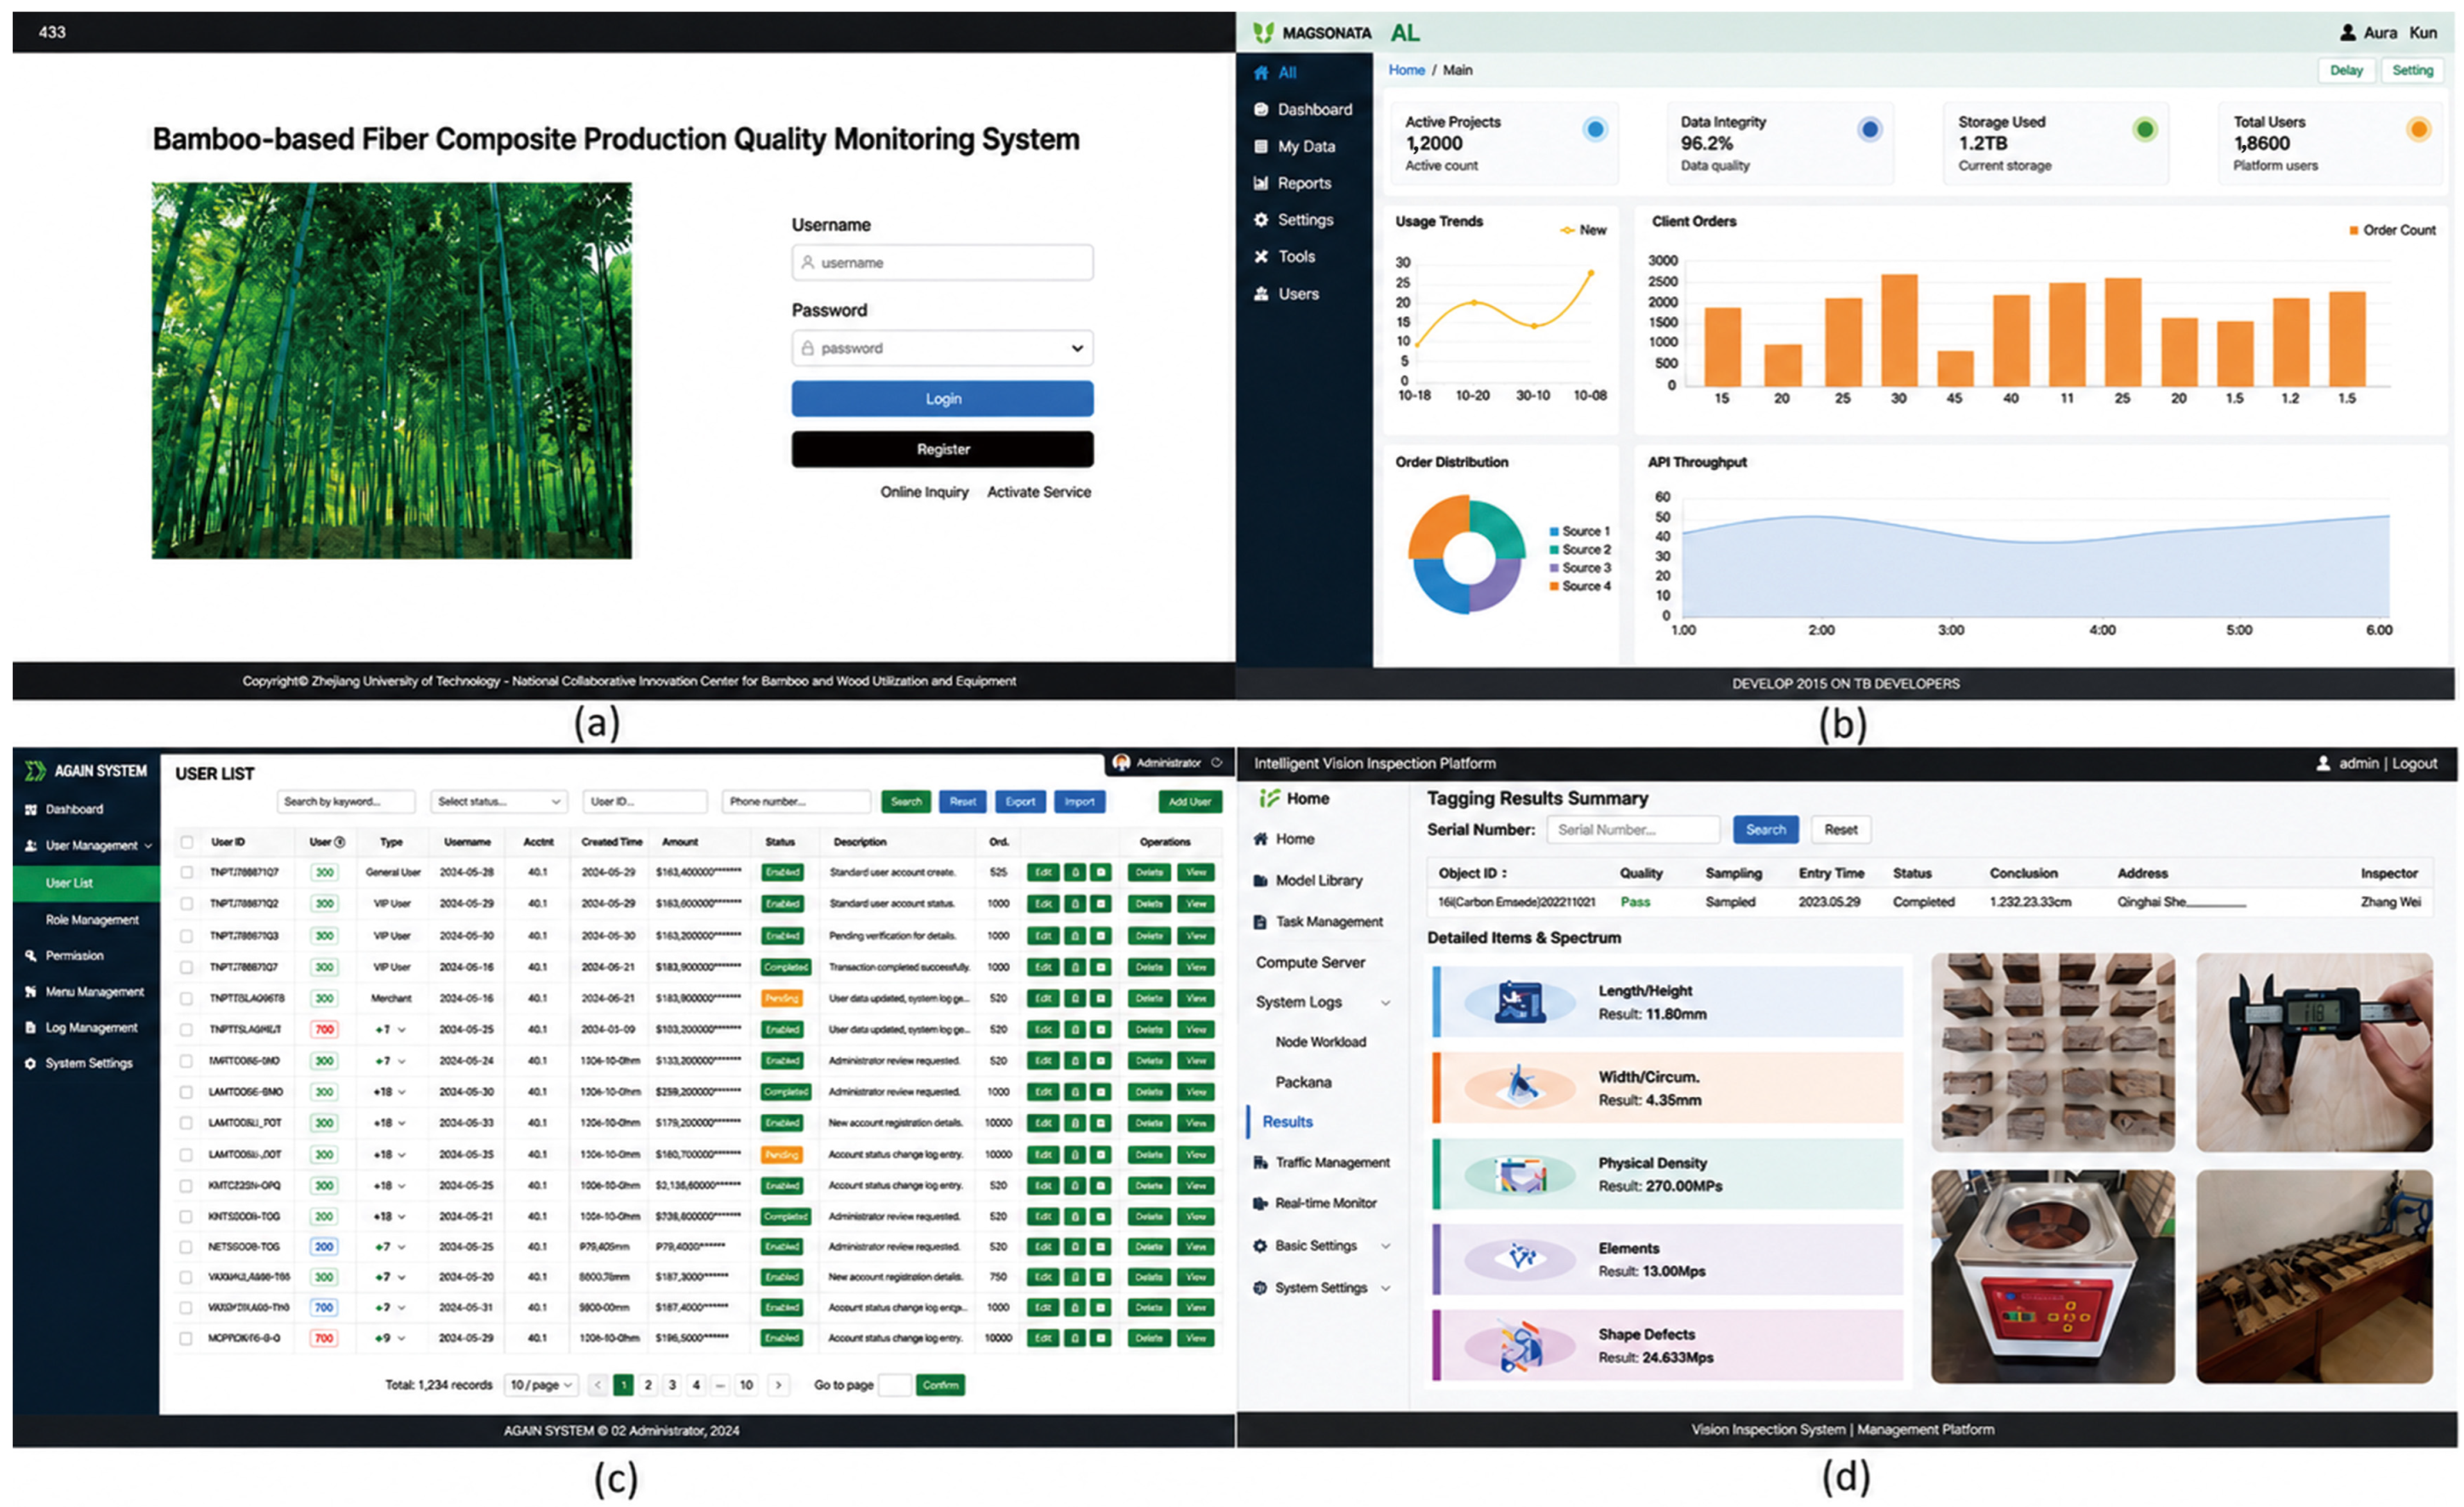
Specifically, the login page and the home page serve as the system’s access point and operational overview, respectively. The former is used for user identification and access authorization, while the latter displays the system name, key statistical information, and entry points to primary functions. Regarding basic information management, the system features a basic information query page that allows users to view fundamental attributes of reconstituted bamboo products—such as product codes, production workshops, sheet dimensions, quality status, and inventory—and supports filtered searches based on criteria including product code, workshop, sheet dimensions, and quality. In terms of quality information management, the system also provides a page for querying the quality information of molded products. The quality metrics managed by the system include water absorption thickness expansion rate, water absorption width expansion rate, static bending strength, horizontal shear strength, and modulus of elasticity. These metrics are obtained from performance tests of molded panels and are stored in the “Molded Product Quality Information” table within the MySQL database based on product codes. Users can retrieve relevant metrics through the quality information query and comprehensive traceability pages, and correlate them with hot-pressing process parameters and predicted results for product quality assessment, quality traceability, and on-site process parameter adjustments. The system’s pages are organized around core business functions including the home page overview, login authentication, basic information queries, and quality information queries; a typical page is shown in
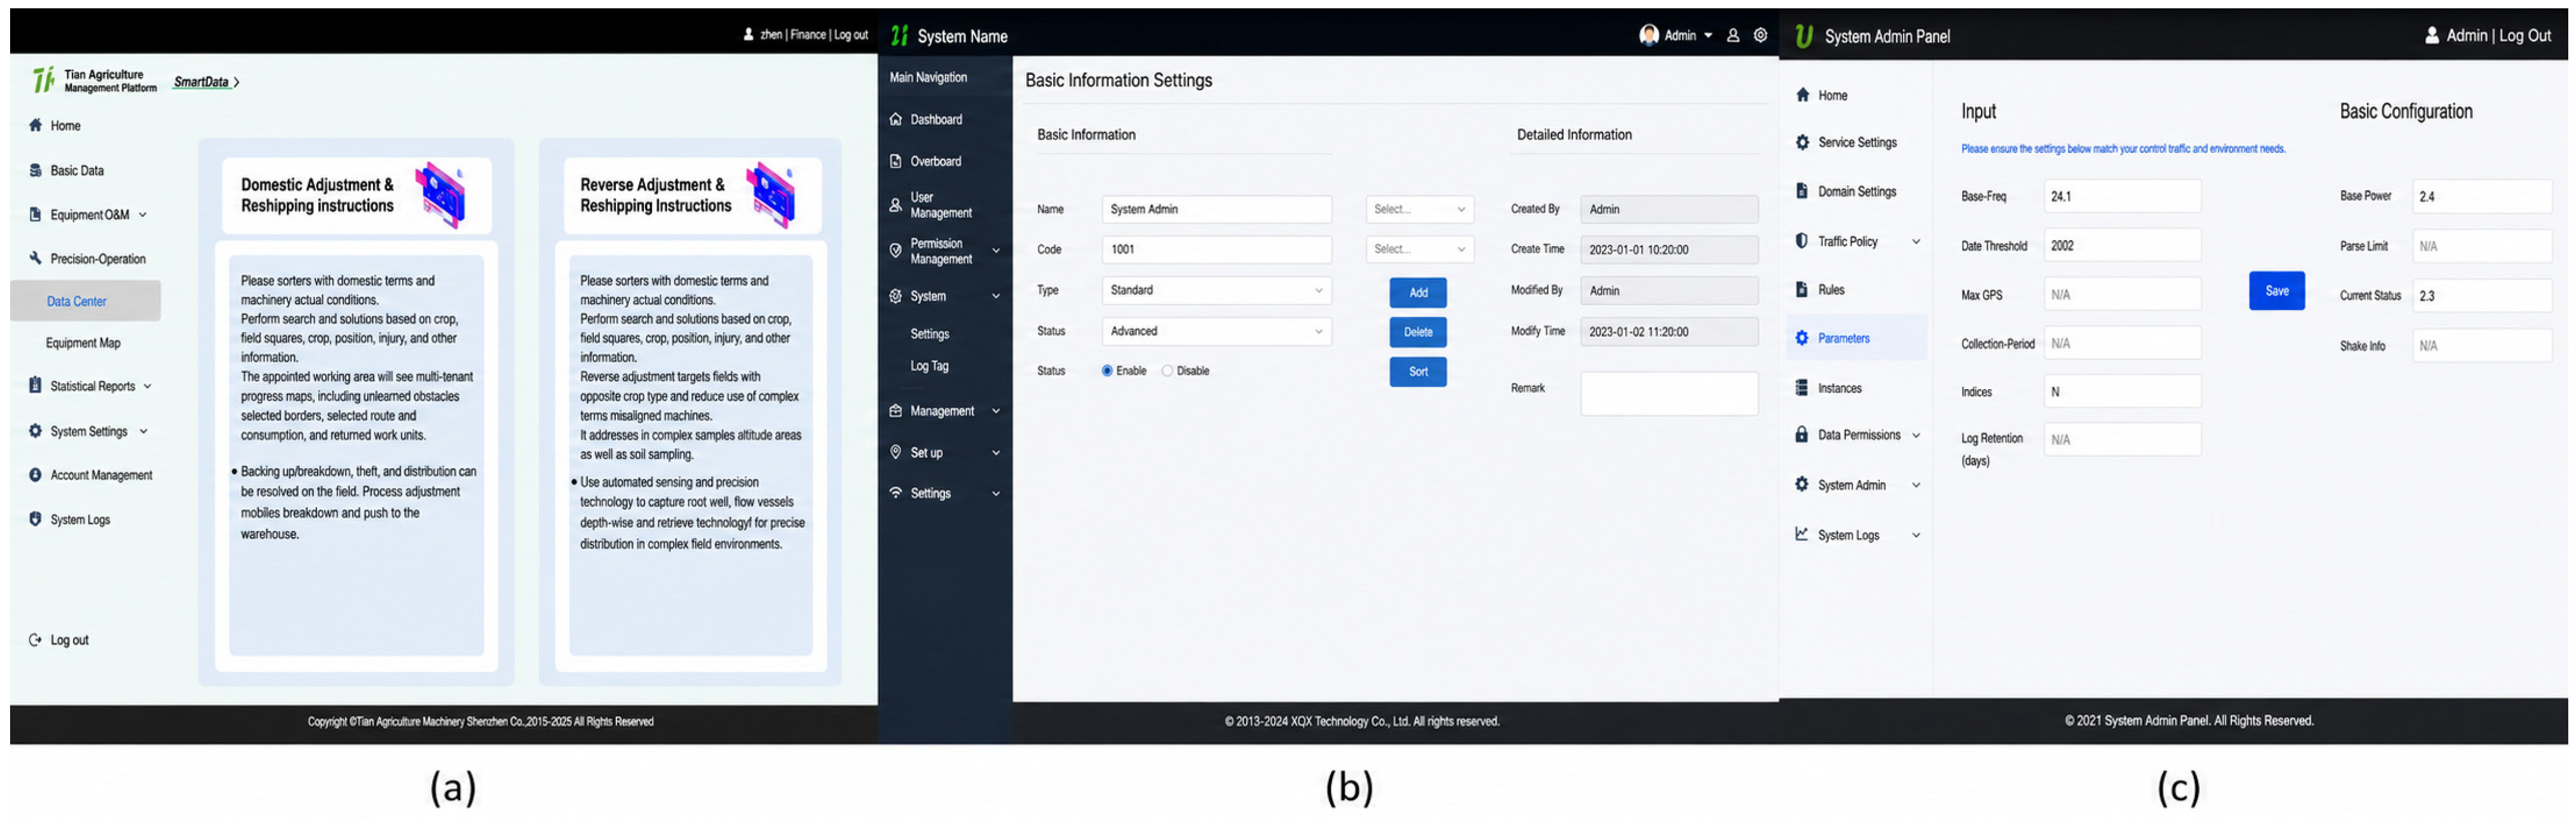
Figure 12.
In addition to static information queries, the system also includes a quality prediction page. The forward prediction feature provides estimated results for corresponding quality indicators based on actual process parameters, thereby offering support for on-site process adjustments and quality assessments. Beyond the basic query page, the system further implements functions such as monitoring of the hot-pressing process and retrieval of prediction results; the relevant pages are shown in
Figure 13.
3.2. Implementation of the Unity Interface and Digital Display of Detection Data
Building upon the implementation of two-dimensional page functionality, the system has further developed a Unity 3D interface for the digital display of the operating status and inspection data of the hot-pressing process. This interface is not an independent business computing platform, but rather a 3D display terminal for equipment status, process information, and inspection results.
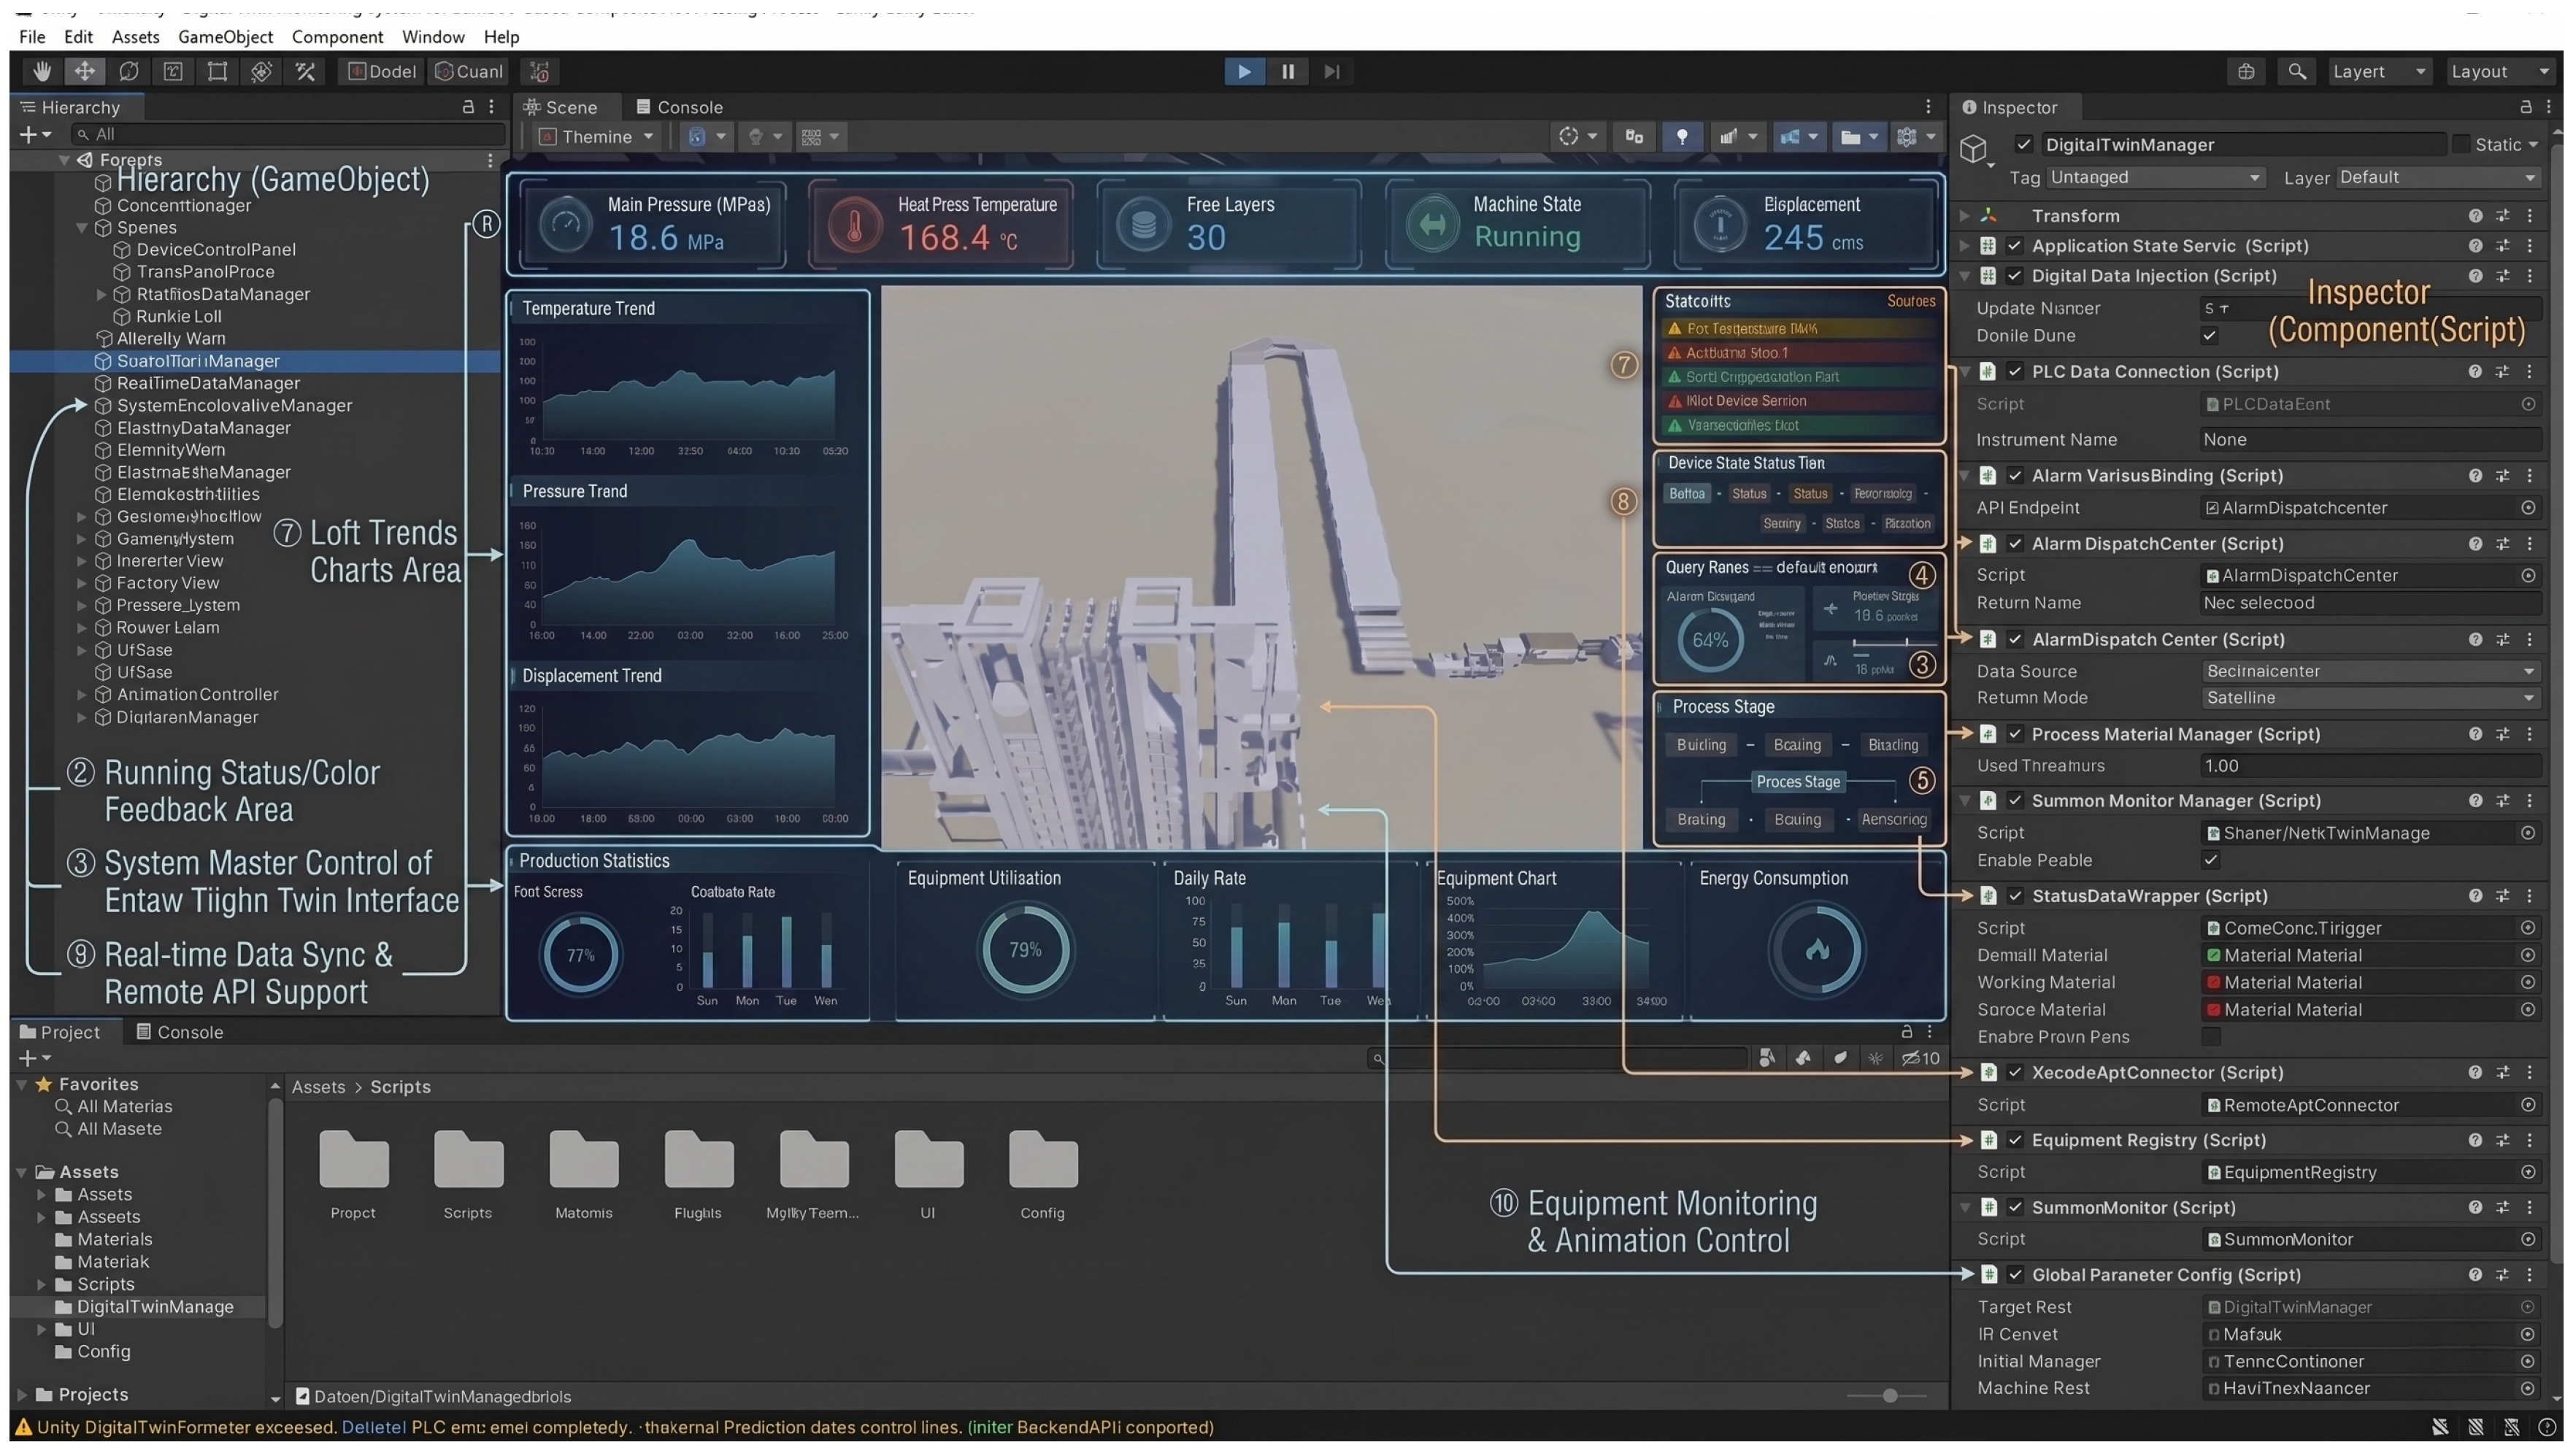
To illustrate the overall structure and functional organization of the Unity interface, this paper organizes the functional zones and core component configurations of the digital twin monitoring interface as shown in
Figure 14. The left side of the figure depicts the scene hierarchy and object organization area, which manages the monitoring interface, gauge panels, alarm system, and digital twin management objects; the central section is the interface display and equipment scene area, which includes the key parameter display bar, trend curve zone, statistical information zone, and equipment 3D model display zone; the right side is the component and script configuration area, used to perform functions such as data service connections, PLC data synchronization, equipment status coordination, alarm distribution, predictive result binding, status color mapping, and remote interface communication.
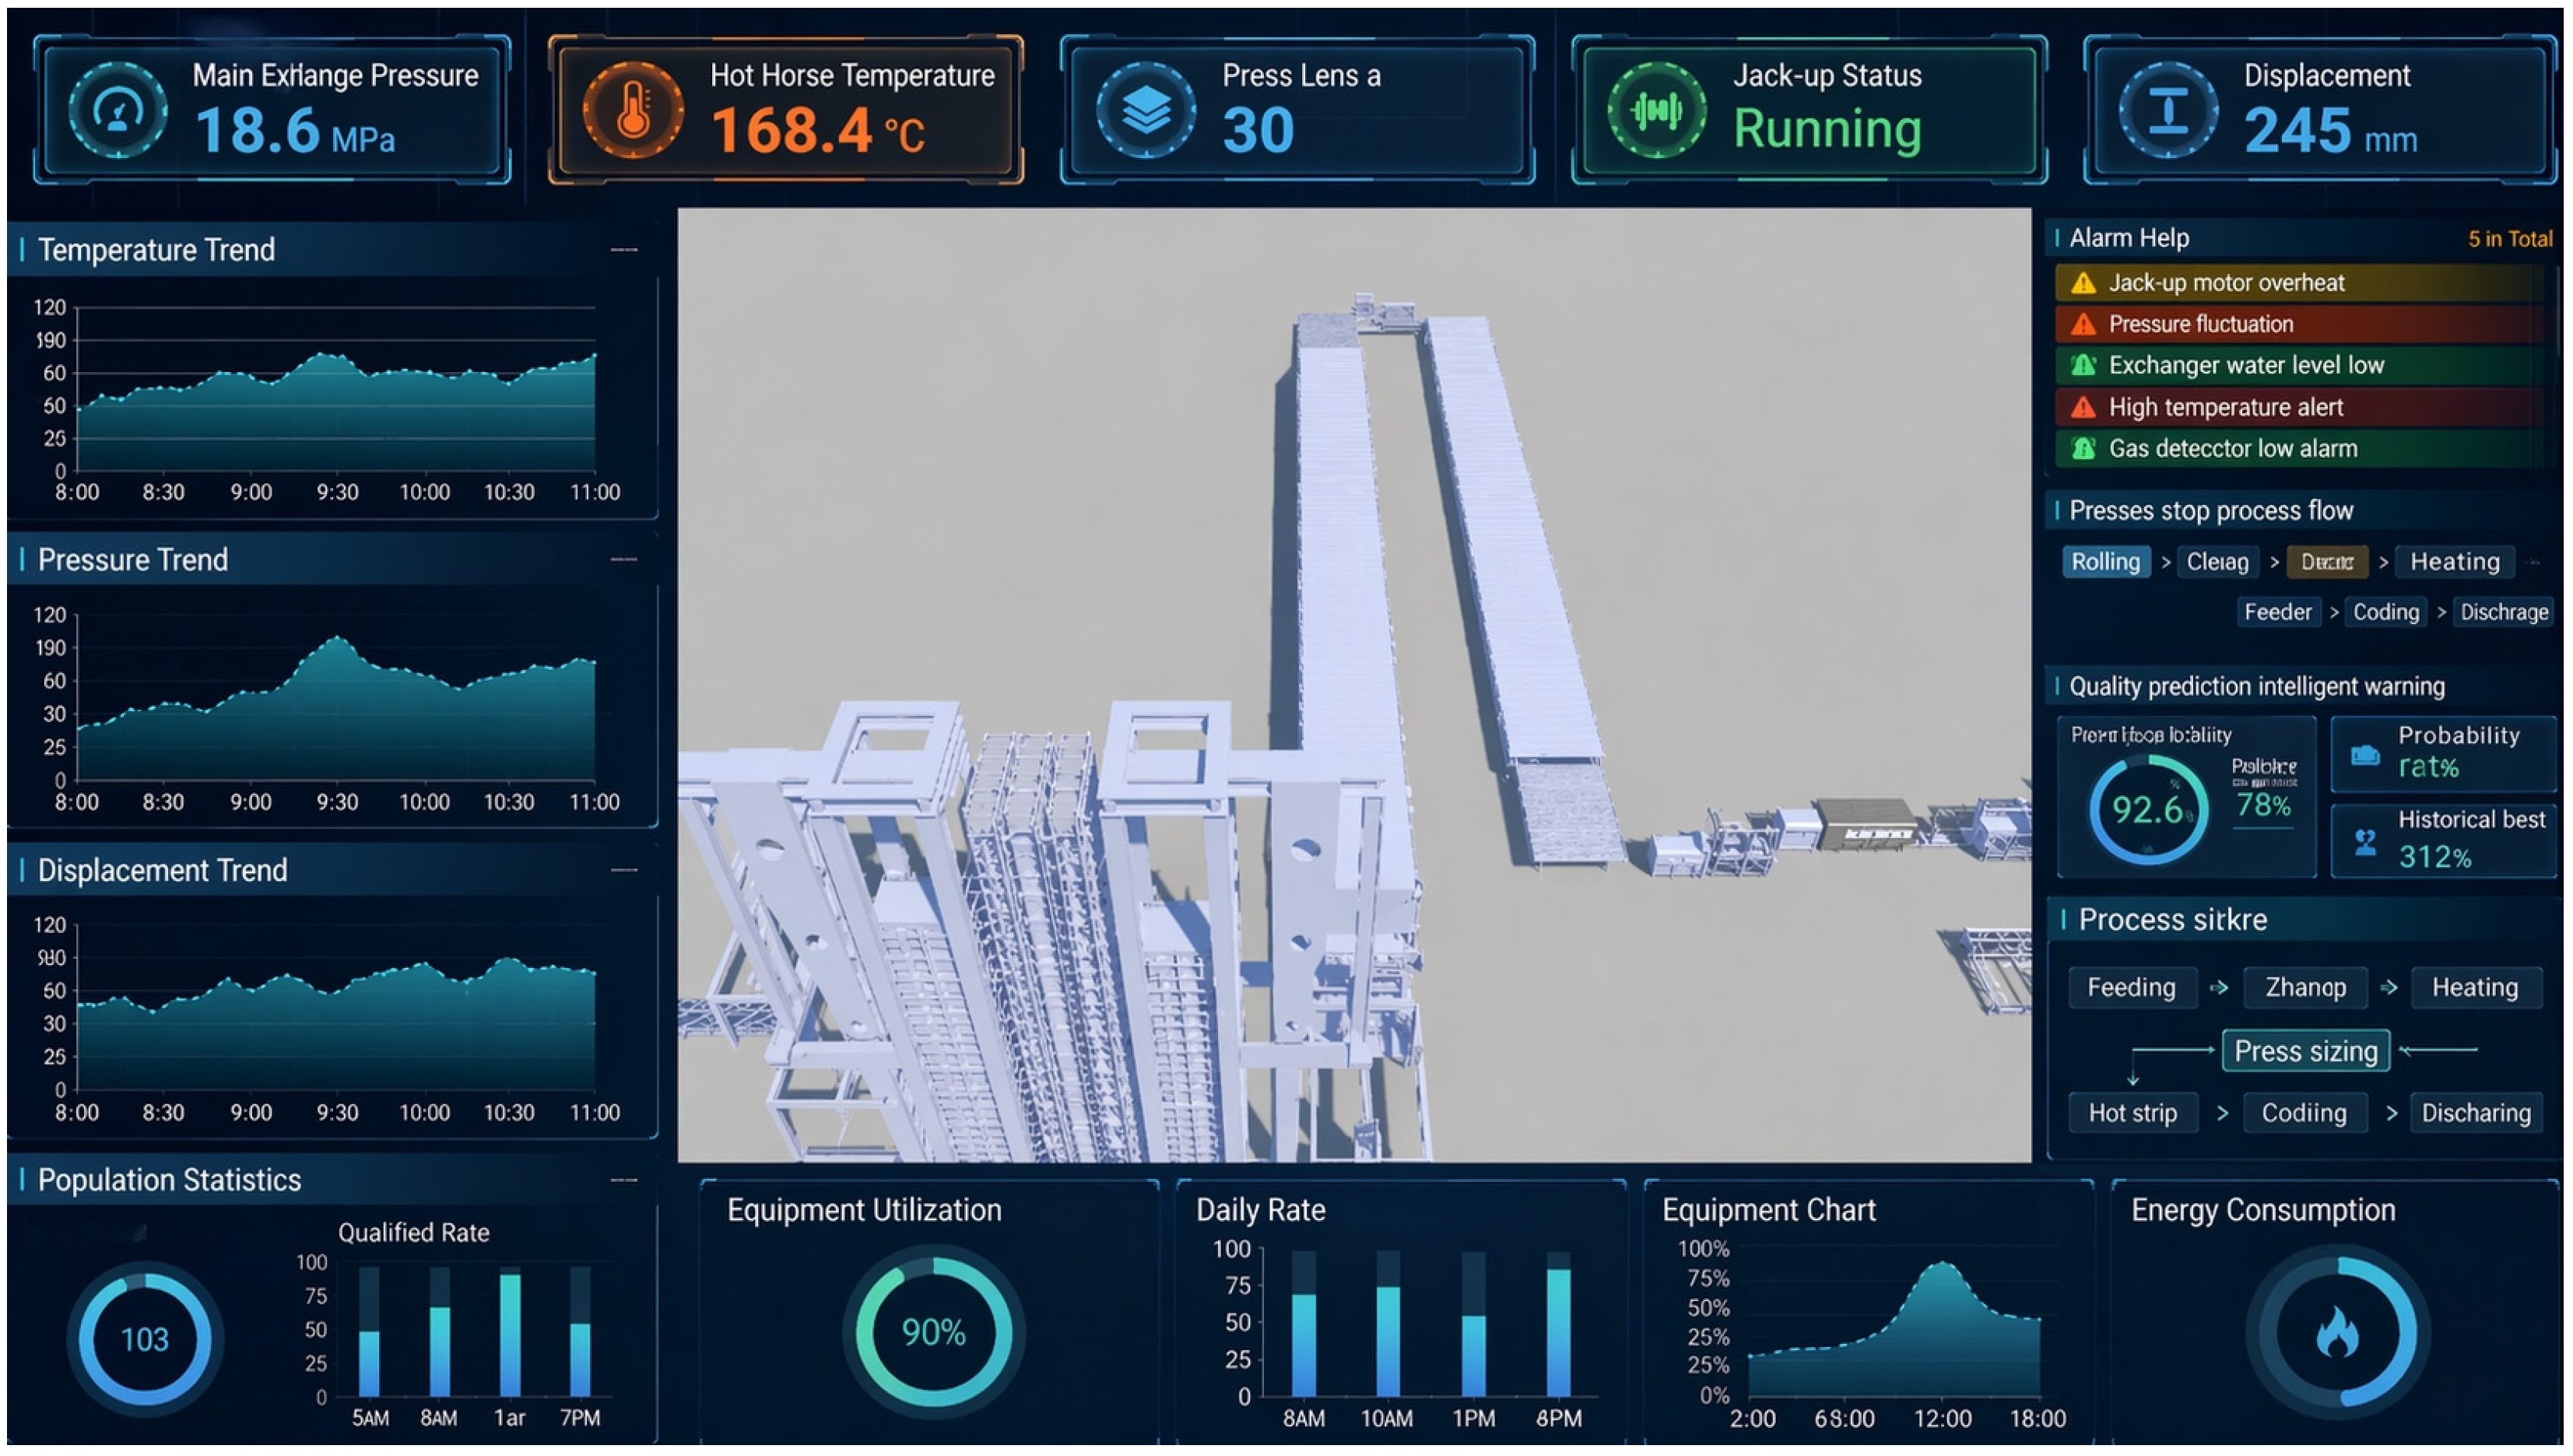
In terms of interface presentation, Unity primarily handles tasks such as mapping equipment status, displaying process information, presenting parameters in an intuitive manner, and providing alarm notifications. Through changes in objects within the 3D scene, status highlighting, and information annotations, the system is able to convert abstract monitoring data processed by the backend into visualizations that correspond to on-site equipment.
As shown in
Figure 15, the Unity interface provides a centralized view of key operational statuses during the hot pressing process, thereby enhancing the user’s overall awareness of process changes and equipment status.
3.3. On-Site System Deployment and Application Validation
After completing the development of the web pages and the Unity 3D interface, the system was deployed on-site at the enterprise. The on-site deployment results demonstrated that the system is capable of coordinating operations among servers, software platforms, and user terminals, thereby establishing an application environment for on-site monitoring and information management.
In practical application scenarios, the system not only enables page access and interface display but also supports users in invoking functions and viewing information in on-site environments. During on-site operation, the system supports both click-based and touch-based interactions, meeting user needs across various terminal configurations. It integrates functions such as temperature monitoring, information querying, result retrieval, and digital visualization within a single operational environment.
It is important to note that the system is not deployed in an abstract software environment, but rather within the actual hot-pressing production process for bamboo-based fiber composites. The hot-pressing process itself involves a series of continuous steps, including mat laying, pre-pressing setup, hot-pressing execution, and subsequent panel removal, accompanied by on-site operations such as parameter recording and status adjustment. Within this process chain, the system performs functions such as viewing process information, displaying operational status, querying quality results, and retrieving predictive results, thereby consolidating previously dispersed process information into a unified platform.
The test results for synchronization latency between the physical end and the virtual model are shown in
Table 3.
The synchronization delay results indicate that the system is capable of meeting the requirements for real-time monitoring and visualization of the hot-pressing process.
To further illustrate the system’s effectiveness in practical applications, this paper compares production information management practices before and after the implementation of the digital twin system; the results are shown in
Table 4. The comparison primarily covers process data logging, temperature monitoring, quality information traceability, retrieval of predictive results, and synchronized display of virtual and physical data.
The comparison results indicate that the system has primarily improved capabilities in the continuous recording of hot-pressing process data, traceability of quality information, and visualization of on-site conditions. Production performance metrics such as scrap rate, energy consumption per unit, and long-term operating costs still require further analysis based on data from subsequent batches and extended operational periods.
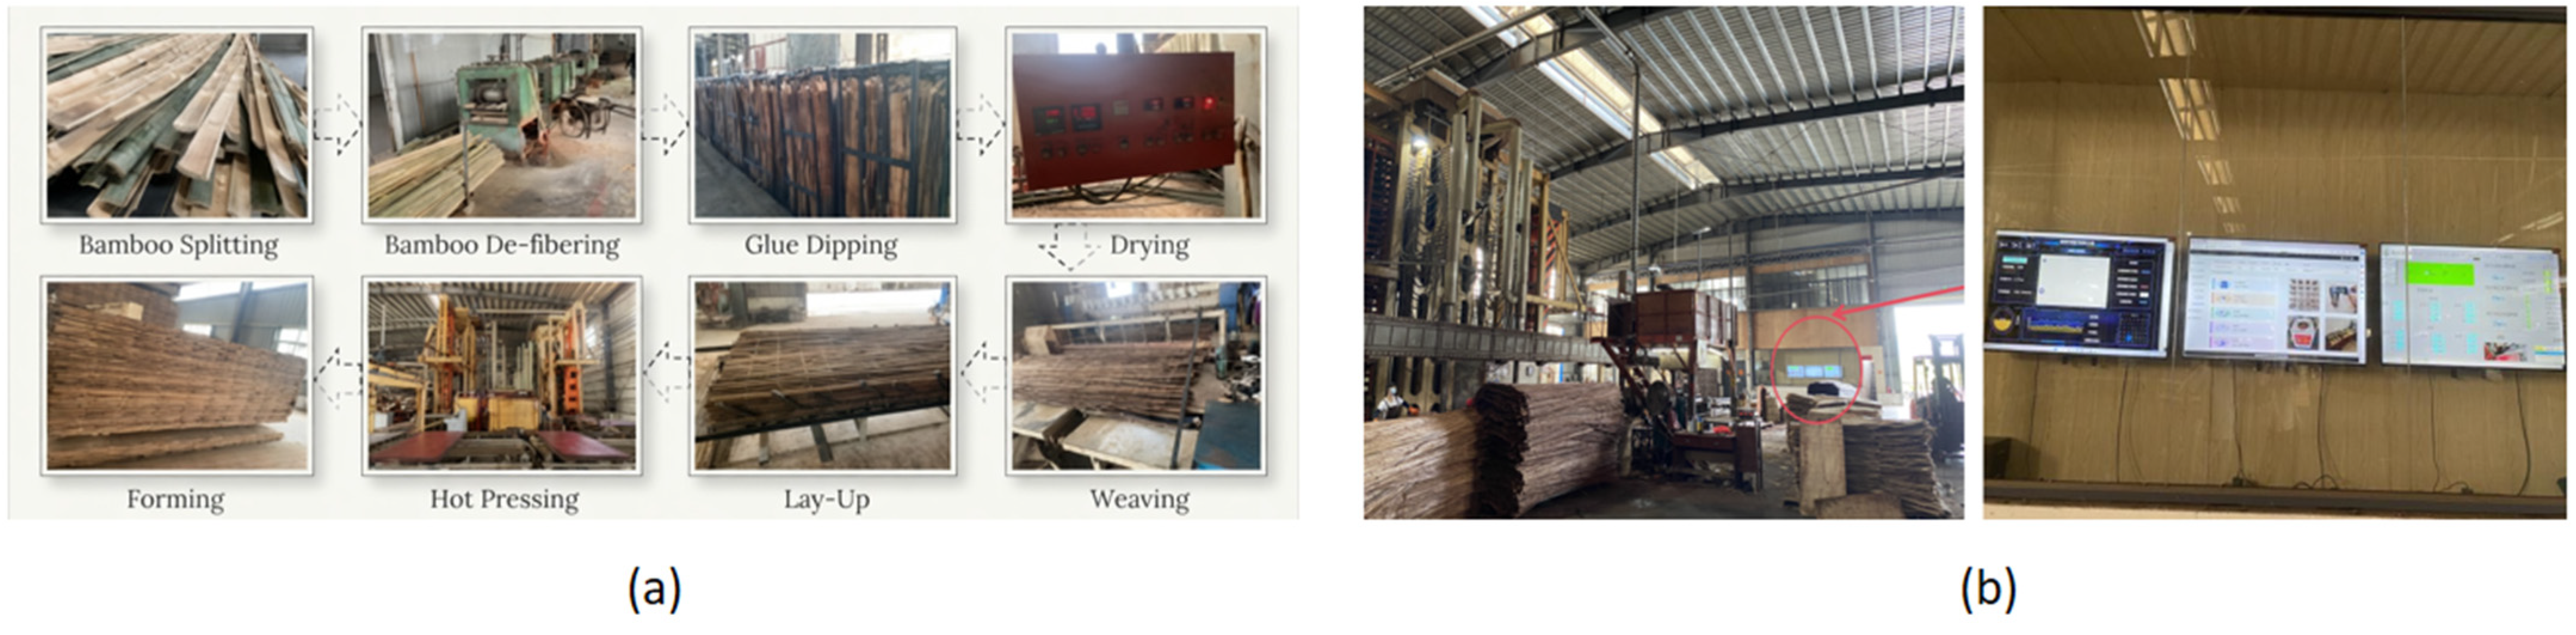
As shown in
Figure 16, the system has been successfully integrated into actual production processes in field applications and established a one-to-one correspondence with on-site operator terminals. Compared to traditional methods that rely on manual record-keeping and experience-based adjustments, the system integrates page queries, 3D visualization, and on-site terminal operations into a unified platform. This enhances the intuitiveness of process information retrieval and operational status display, while also improving the ability of on-site personnel and managers to maintain an overall understanding of the hot-pressing process.
4. Discussion
The results demonstrate that the developed system successfully integrates data acquisition for the hot-pressing process, quality information queries, retrieval of predictive results, and 3D visualization into a unified platform, thereby enhancing the continuity, traceability, and on-site readability of process information. Field application validation further confirms that the system supports hot-pressing process data logging, web-based queries, Unity visualization, and synchronized virtual-physical displays, providing a deployable implementation path for on-site quality monitoring in industrial settings.
In the hot-pressing process for bamboo-based fiber composites, equipment condition monitoring and the recording of key parameters are typically carried out using a PLC and HMI monitoring system, supplemented by manual work order records. Compared to traditional on-site monitoring methods, the system described in this paper integrates MySQL data management, web-based querying, and Unity 3D visualization on top of PLC data acquisition. The system integrates hot-pressing process parameters, product information, quality results, and predictive outcomes into a unified data framework, placing greater emphasis on process information integration, quality traceability, and visualization management. The system’s advantage lies in integrating on-site data acquisition, quality traceability, and 3D visualization management into a unified platform, making it suitable for the digital operation and smart manufacturing upgrade of bamboo and wood composite hot-pressing processes. Its limitations primarily stem from the fact that the current system remains focused on monitoring and traceability; long-term production performance evaluation and automatic closed-loop control still require further refinement.
5. Conclusions
This paper addresses the needs for quality inspection and digital management in the hot-pressing process of reconstituted bamboo by developing a quality monitoring system that integrates on-site data collection, quality information management, retrieval of predictive results, and 3D visualization. System implementation results demonstrate that the platform is capable of recording hot-pressing process data, tracing quality information, retrieving predictive results, and displaying them via Unity visualization, and can be deployed and operated at enterprise sites. Field validation results demonstrate that the system supports real-time process monitoring and synchronized virtual-physical display, providing a viable, systematic solution for process monitoring, quality traceability, and on-site management in the hot-pressing of reconstituted bamboo.
The system described in this paper still has certain limitations. Primarily, the deployment process relies on specific enterprise production scenarios, and its applicability across different production lines and under varying process conditions remains to be verified. Furthermore, on-site production data has not yet been compiled into a public dataset. System validation has focused primarily on functional implementation and on-site application demonstrations; statistical data regarding long-term operational stability, failure rates, and maintenance costs still needs to be supplemented. Additionally, system performance is influenced by on-site network bandwidth, data transmission stability, and client hardware performance, and the Unity 3D scene display places certain demands on the terminal’s graphics processing capabilities. Future research will focus on multi-scenario deployment, the accumulation of long-term operational data, optimization for network environment adaptability, lightweight 3D models, and the integration of intelligent control strategies to enhance the system’s stability, adaptability, and automatic control capabilities.