Article

Spatiotemporal Distribution and Driving Factors of Carbon Storage in the Ecologically Fragile Alpine Region of the Eastern Qinghai–Tibet Plateau

1
College of Forestry, Sichuan Agricultural University, Chengdu 611130, China
2
Forest Ecology and Conservation in the Upper Reaches of the Yangtze River Key Laboratory of Sichuan Province, Chengdu 611130, China
3
Sichuan Mt. Emei Forest Ecosystem National Observation and Research Station, Leshan 614200, China
4
Sichuan Provincial Institute of Forestry and Grassland Inventory and Planning, Chengdu 610081, China
*
Authors to whom correspondence should be addressed.
These authors contributed equally to this work.
Forests 2026, 17(5), 576; https://doi.org/10.3390/f17050576
Submission received: 19 March 2026 / Revised: 2 May 2026 / Accepted: 6 May 2026 / Published: 8 May 2026

Abstract

Accurate prediction and assessment of carbon storage are crucial in the context of global climate change. However, existing research has largely focused on large-scale regions, while studies on small-scale ecologically fragile alpine regions remain insufficient. This study focuses on Zoige County, integrating the PLUS model, InVEST model, and Random Forest model to form a composite analysis workflow. Through this workflow, we simulated the distribution of land use types in 2030 and quantified carbon storage from 1990 to 2030, subsequently analyzing their spatial distribution and driving factors. The key findings include: (1) Under the natural development scenario (NDS) and the ecological protection scenario (EPS) for 2030, the primary land use transition involved the conversion of grassland to forest and wetland. Conversely, wetland was converted into cropland under the economic development scenario (EDS). (2) Under the NDS, EDS, and EPS, carbon storage would be 8.396 × 10⁷ t, 8.252 × 10⁷ t, and 8.432 × 10⁷ t, respectively. The EPS yielded the largest increase in carbon storage. (3) In all three scenarios, carbon storage showed a clustered distribution. Compared with 2020, the carbon storage hot spot areas under both NDS and EPS showed an expansion trend, whereas the cold spot areas also expanded in three scenarios. (4) The key drivers of carbon storage include slope, elevation, soil type, and mean annual temperature. This study concludes that the EPS represents the most favorable development pathway for carbon storage accumulation. This finding can provide a basis for future carbon storage dynamics and land use planning for Zoige County.

1. Introduction

Rapid socioeconomic development, driven by industrialization, has come at the cost of substantial carbon emissions [1]. This phenomenon has intensified global climate change, leading to a series of ecological issues such as shifts in species distribution [2], accelerated extinction risks [3], and the release of greenhouse gases from permafrost, further accelerating climate change [4]. To address this challenge, seeking nature-based solutions has become a consensus within the international community. As a vital carbon sink, terrestrial ecosystems effectively reduce greenhouse gas concentrations in the atmosphere and mitigate global warming, serving as a crucial natural pathway for addressing climate change [5]. Assessments of carbon storage in terrestrial ecosystems help identify key drivers of carbon storage [6], and simulate future dynamics of carbon storage [7]. This is pivotal for formulating evidence-based mitigation strategies and realizing the carbon peak and carbon neutrality, thereby providing a critical pathway for the global community to address the climate crisis more effectively. However, given the spatiotemporal heterogeneity of carbon storage distribution, the complexity of influencing factors, and the uncertainty of land use changes caused by human activities, quantitative assessments of carbon storage remain challenging.
In recent years, carbon storage assessment, prediction, and the investigation of driving mechanisms have gradually become a hot topic in the field of ecology. Traditional carbon storage assessment methods include field measurement techniques such as the stock volume method [8], soil type method, and biomass method [9]. Model-based assessment methods include LPJ-GUESS (Lund–Potsdam–Jena General Ecosystem Simulator) [10], InVEST (Integrated Valuation of Ecosystem Services and Trade-offs) [11], and others. Among these tools, the InVEST model not only enables quantitative assessment of carbon storage but also visually presents the spatial distribution and spatiotemporal variability of evaluation results. These capabilities, coupled with relatively low data demands, have facilitated its widespread application. Previous studies have not only examined the impact of human activity expansion on carbon storage but also investigated the dynamic changes in ecosystem carbon storage. In studies on human activity areas, the research scope exhibits diversity, including the national-scale analyses, such as in Pakistan [12], and town-scale analyses, such as in Baiona [13]. Moreover, research focusing on ecosystems is primarily conducted on a large spatial scale, such as in the Qinghai–Tibet Plateau [14] and the Yellow River basin [15]. Some studies have also explored wildlife-protected areas [16]. However, discussions on small-scale, yet ecologically sensitive plateau wetland ecosystems remain insufficient.
Land use plays a crucial role in determining carbon storage [17], and the InVEST model conducts carbon storage assessments based on land use types. Given the uncertainty surrounding future carbon storage changes and the forward-looking nature of land use planning, predicting land use patterns and carbon storage across different scenarios is crucial. The PLUS (Patch-generating Land Use Simulation) model holds advantages over the CA-ANN (cellular automata and artificial neural network) model [18], FLUS (Future Land Use Simulation Model Software) [19], and CLUE-S models (Spatial Land Use Change and Simulation Model) [20]. It employs a novel land expansion analytical strategy and enables high-precision, dynamic simulations of multi-class land use changes at the patch level [21]. These capabilities facilitate the exploration of the mechanisms driving land use change during the simulation process [22], thereby enabling more effective prediction of land use change under multiple scenarios. Over recent years, research on carbon storage assessment and prediction based on the coupled PLUS-InVEST model has increased significantly [23]. Building upon this foundation, various models have been employed to identify the roles of driving factors and evaluate the magnitude of their effects. Geodetector [24], a commonly used research method in past studies, is applied to assess the explanatory power of driving factors and their interactions. However, this method does not account for spatial heterogeneity. To address this limitation, geographic weighted regression (GWR) [25] is employed for driving factor analysis. Geographic weighted regression requires input data to be free of multicollinearity. In contrast, the machine learning method Random Forest model [26] evaluates driving factors through global nonlinear modeling, enabling it to handle high-dimensional data without feature selection.
Previous studies have primarily focused on the entire Qinghai–Tibet Plateau [27,28] or the vast Zoige Plateau [29]. Research on the smaller-scale Zoige County has mainly centered on historical changes in carbon storage [30], yet not addressed future carbon storage projections, leaving a research gap in this field. This study examines how land use changes and topography-dependent temperature changes interact to drive the spatiotemporal evolution of carbon storage in the ecologically fragile eastern margin of the Qinghai–Tibet Plateau, and assesses the stability of carbon sinks under different future scenarios. Furthermore, we also examine whether the spatial distribution of carbon storage exhibits nonlinear responses to driving factors. Zoige County is located on the alpine ecologically vulnerable zone at the eastern edge of the Qinghai–Tibet Plateau, with wetlands covering approximately 50% of the core area in the Zoige Wetland. In recent years, rapid urbanization has led to significant changes in land use patterns, thereby exerting negative impacts on ecosystem services. Over the past 30 years, the area of grassland desertification has fluctuated, but has shown an overall upward trend [31]. Meanwhile, human activities have intensified, with frequent land reclamation and marsh dredging projects leading to a shrinking trend in the wetland areas [32]. Therefore, simulating the characteristics of carbon storage changes in Zoige County under multiple scenarios holds significant importance for coordinating economic development and environmental protection in the region.
This study integrates land use data from 1990 to 2020 for Zoige County to simulate land use type alterations and the spatiotemporal distribution of carbon storage under three scenarios in 2030, based on the coupled PLUS-InVEST model. Simultaneously, it investigates the spatial autocorrelation of carbon storage and identifies key drivers of carbon storage. The study focuses on the following objectives: (1) Selecting a pathway aligned with the sustainable development direction of Zoige County based on carbon storage change trends under three scenarios and, based on this, managing important carbon sink resources such as wetland and forest. (2) Identifying areas with low carbon storage to enable early intervention for rational management; simultaneously, identifying areas with high carbon storage to establish protected zones and minimize human-induced damage. (3) Ranking the impact levels of factors driving carbon storage to identify primary influencing variables.

2. Materials and Methods

2.1. Study Area

Zoige County is located in the northern Sichuan Province, ranging from 102°08′ E to 103°39′ E in longitude and from 32°56′ N to 34°19′ N in latitude. Situated on the eastern edge of the Qinghai–Tibet Plateau, the area is a transitional zone between the Sichuan Basin and the alpine plateau, exhibiting the characteristics of a typical frigid-temperate humid monsoon climate (Figure 1). The total area of the study region is 1.04 × 10⁴ km2. The western and southern regions predominantly feature hilly plateau terrain, while the southeast and north are dominated by mountain ranges. Major water systems such as the White River, Black River, Quji River, and Bailong River flow through its territory, while its wetland area constitutes an integral component of the Zoige Plateau wetland ecosystem.

2.2. Data Sources

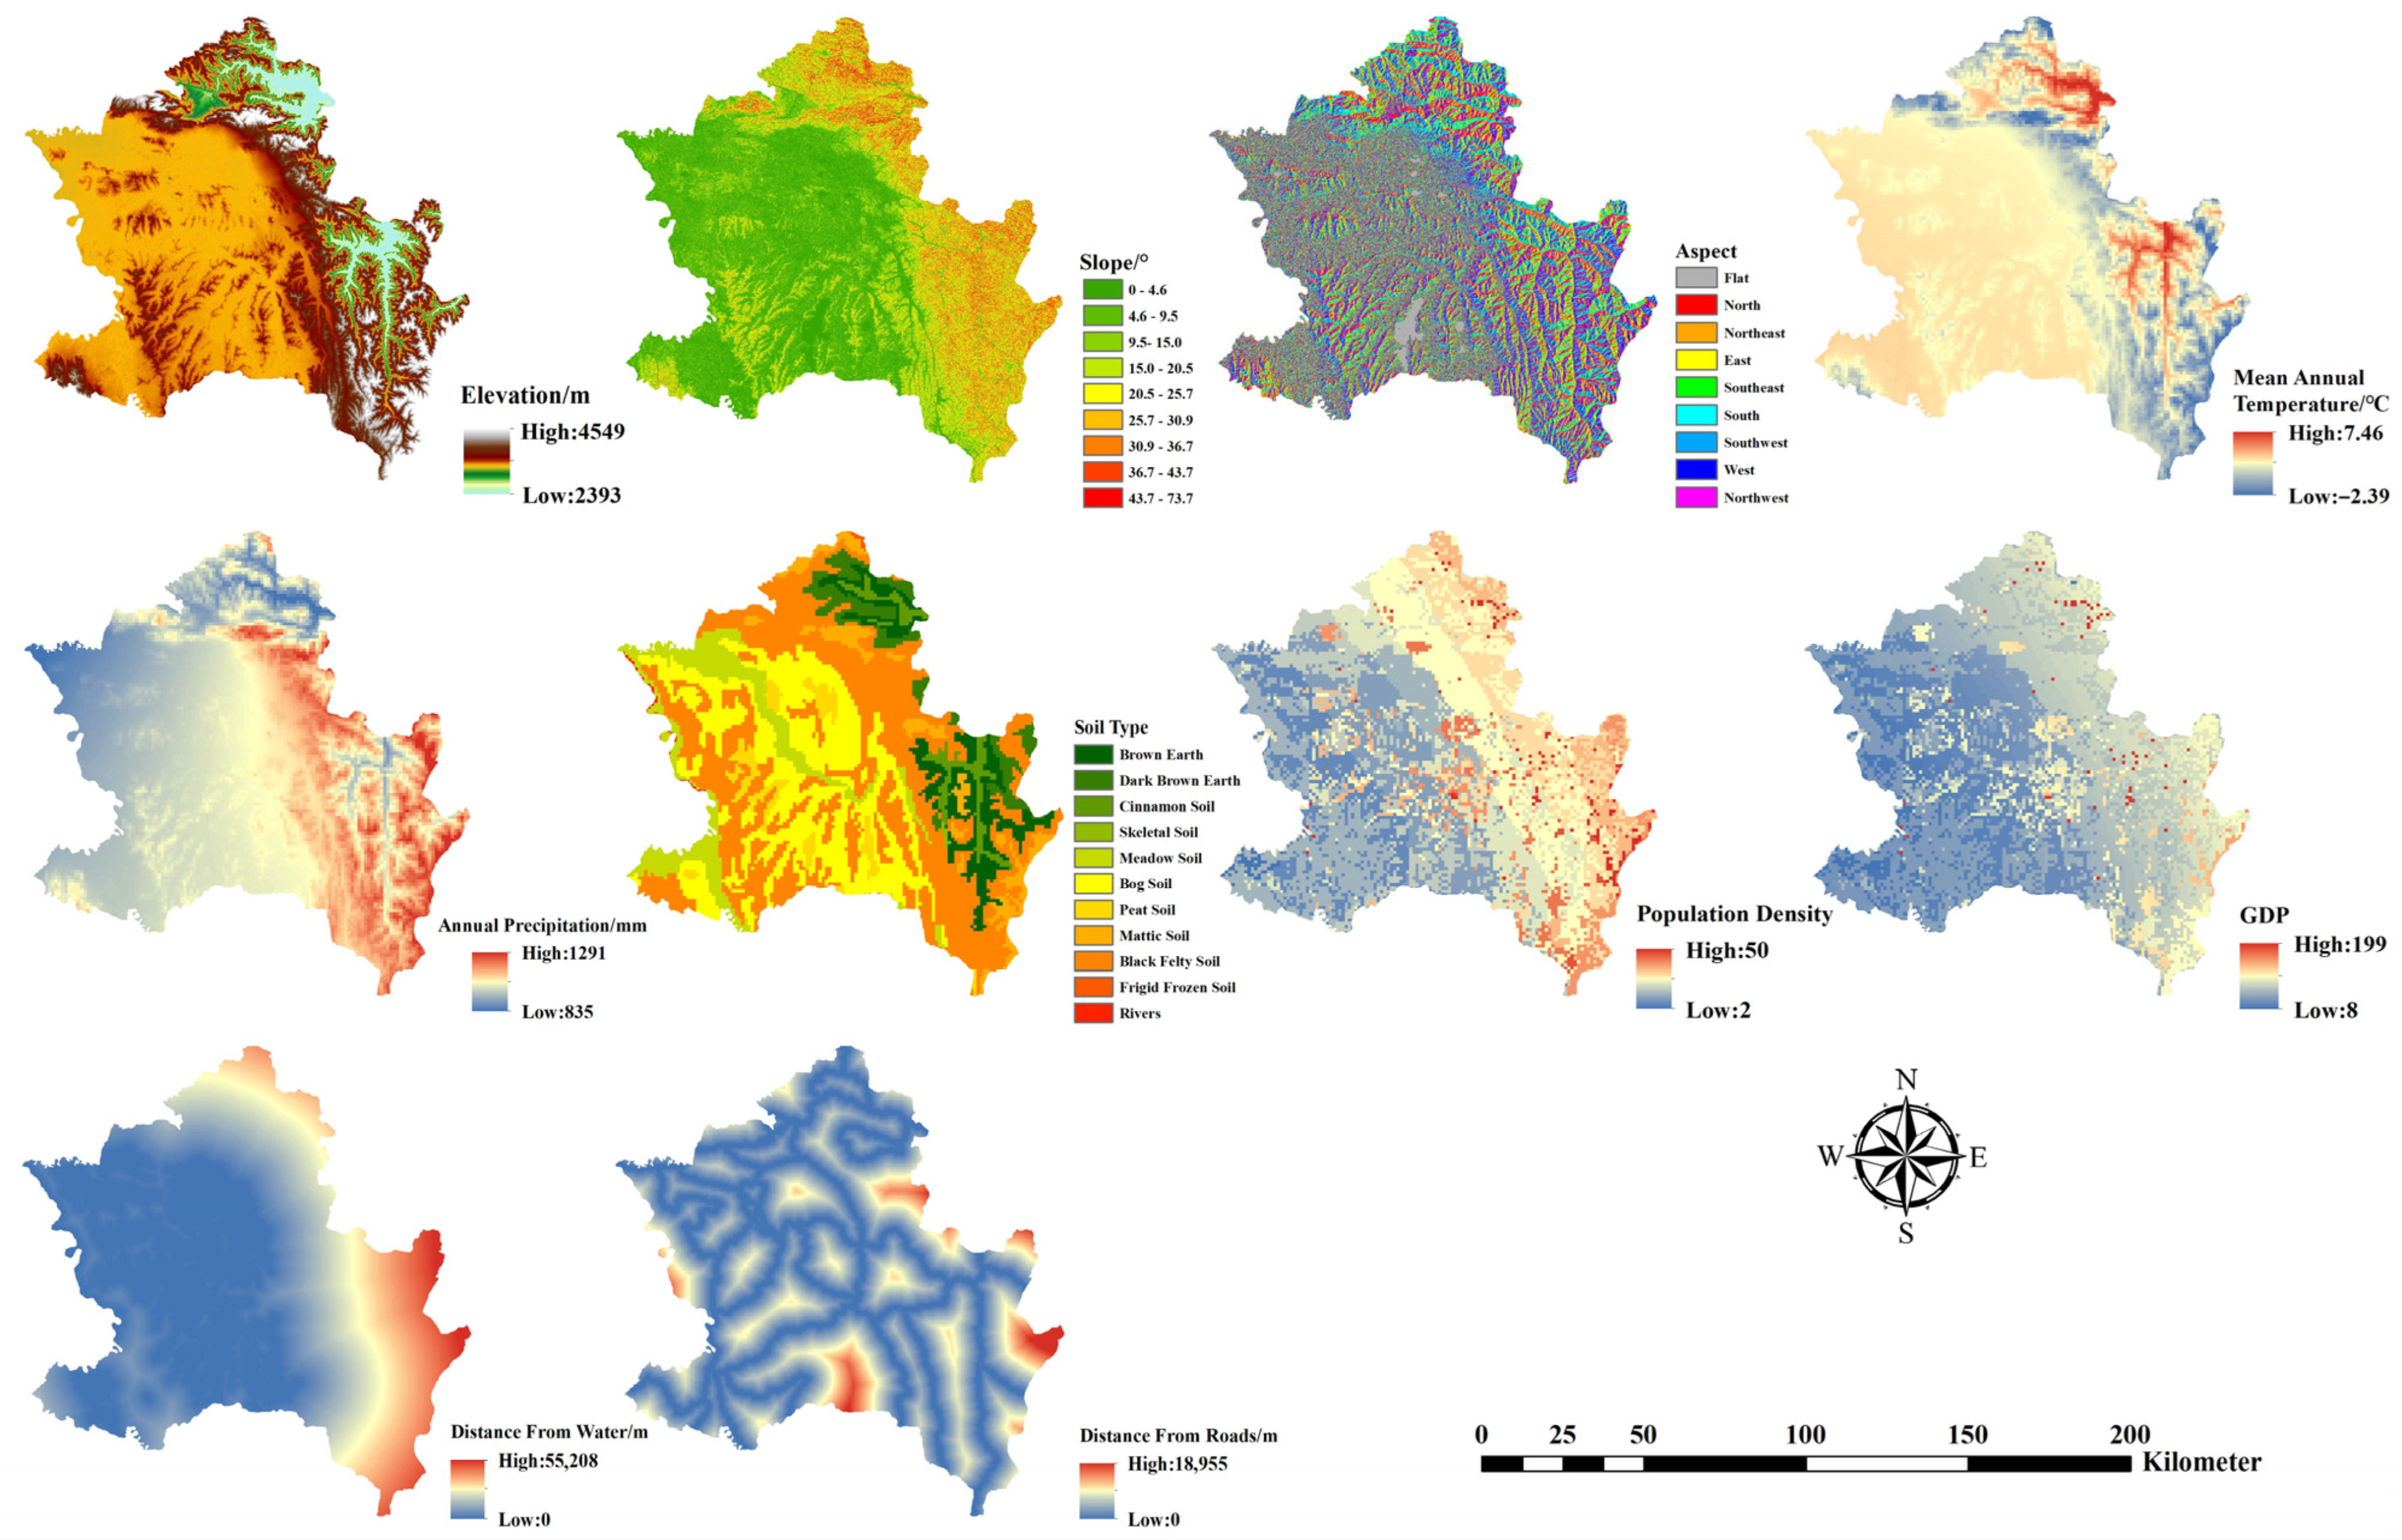
The data used in this study comprise four categories: land use data, natural factor data, socioeconomic data, locational factor data. Specific data and their sources are detailed in Table 1. Meanwhile, based on the CLCD developed by Professor Huangxin’s team at Wuhan University [33] and the land use conditions of Zoige County, the land use types were classified into nine categories: cropland, forest, shrub, grassland, water, snow, unused land, construction land, and wetland. Environment factor raster data is shown in Figure 2. All raster data mentioned above were projected to the WGS_1984_UTM_Zone_48N coordinate system and resampled to a spatial resolution of 30 m × 30 m.

2.3. Research Methodology

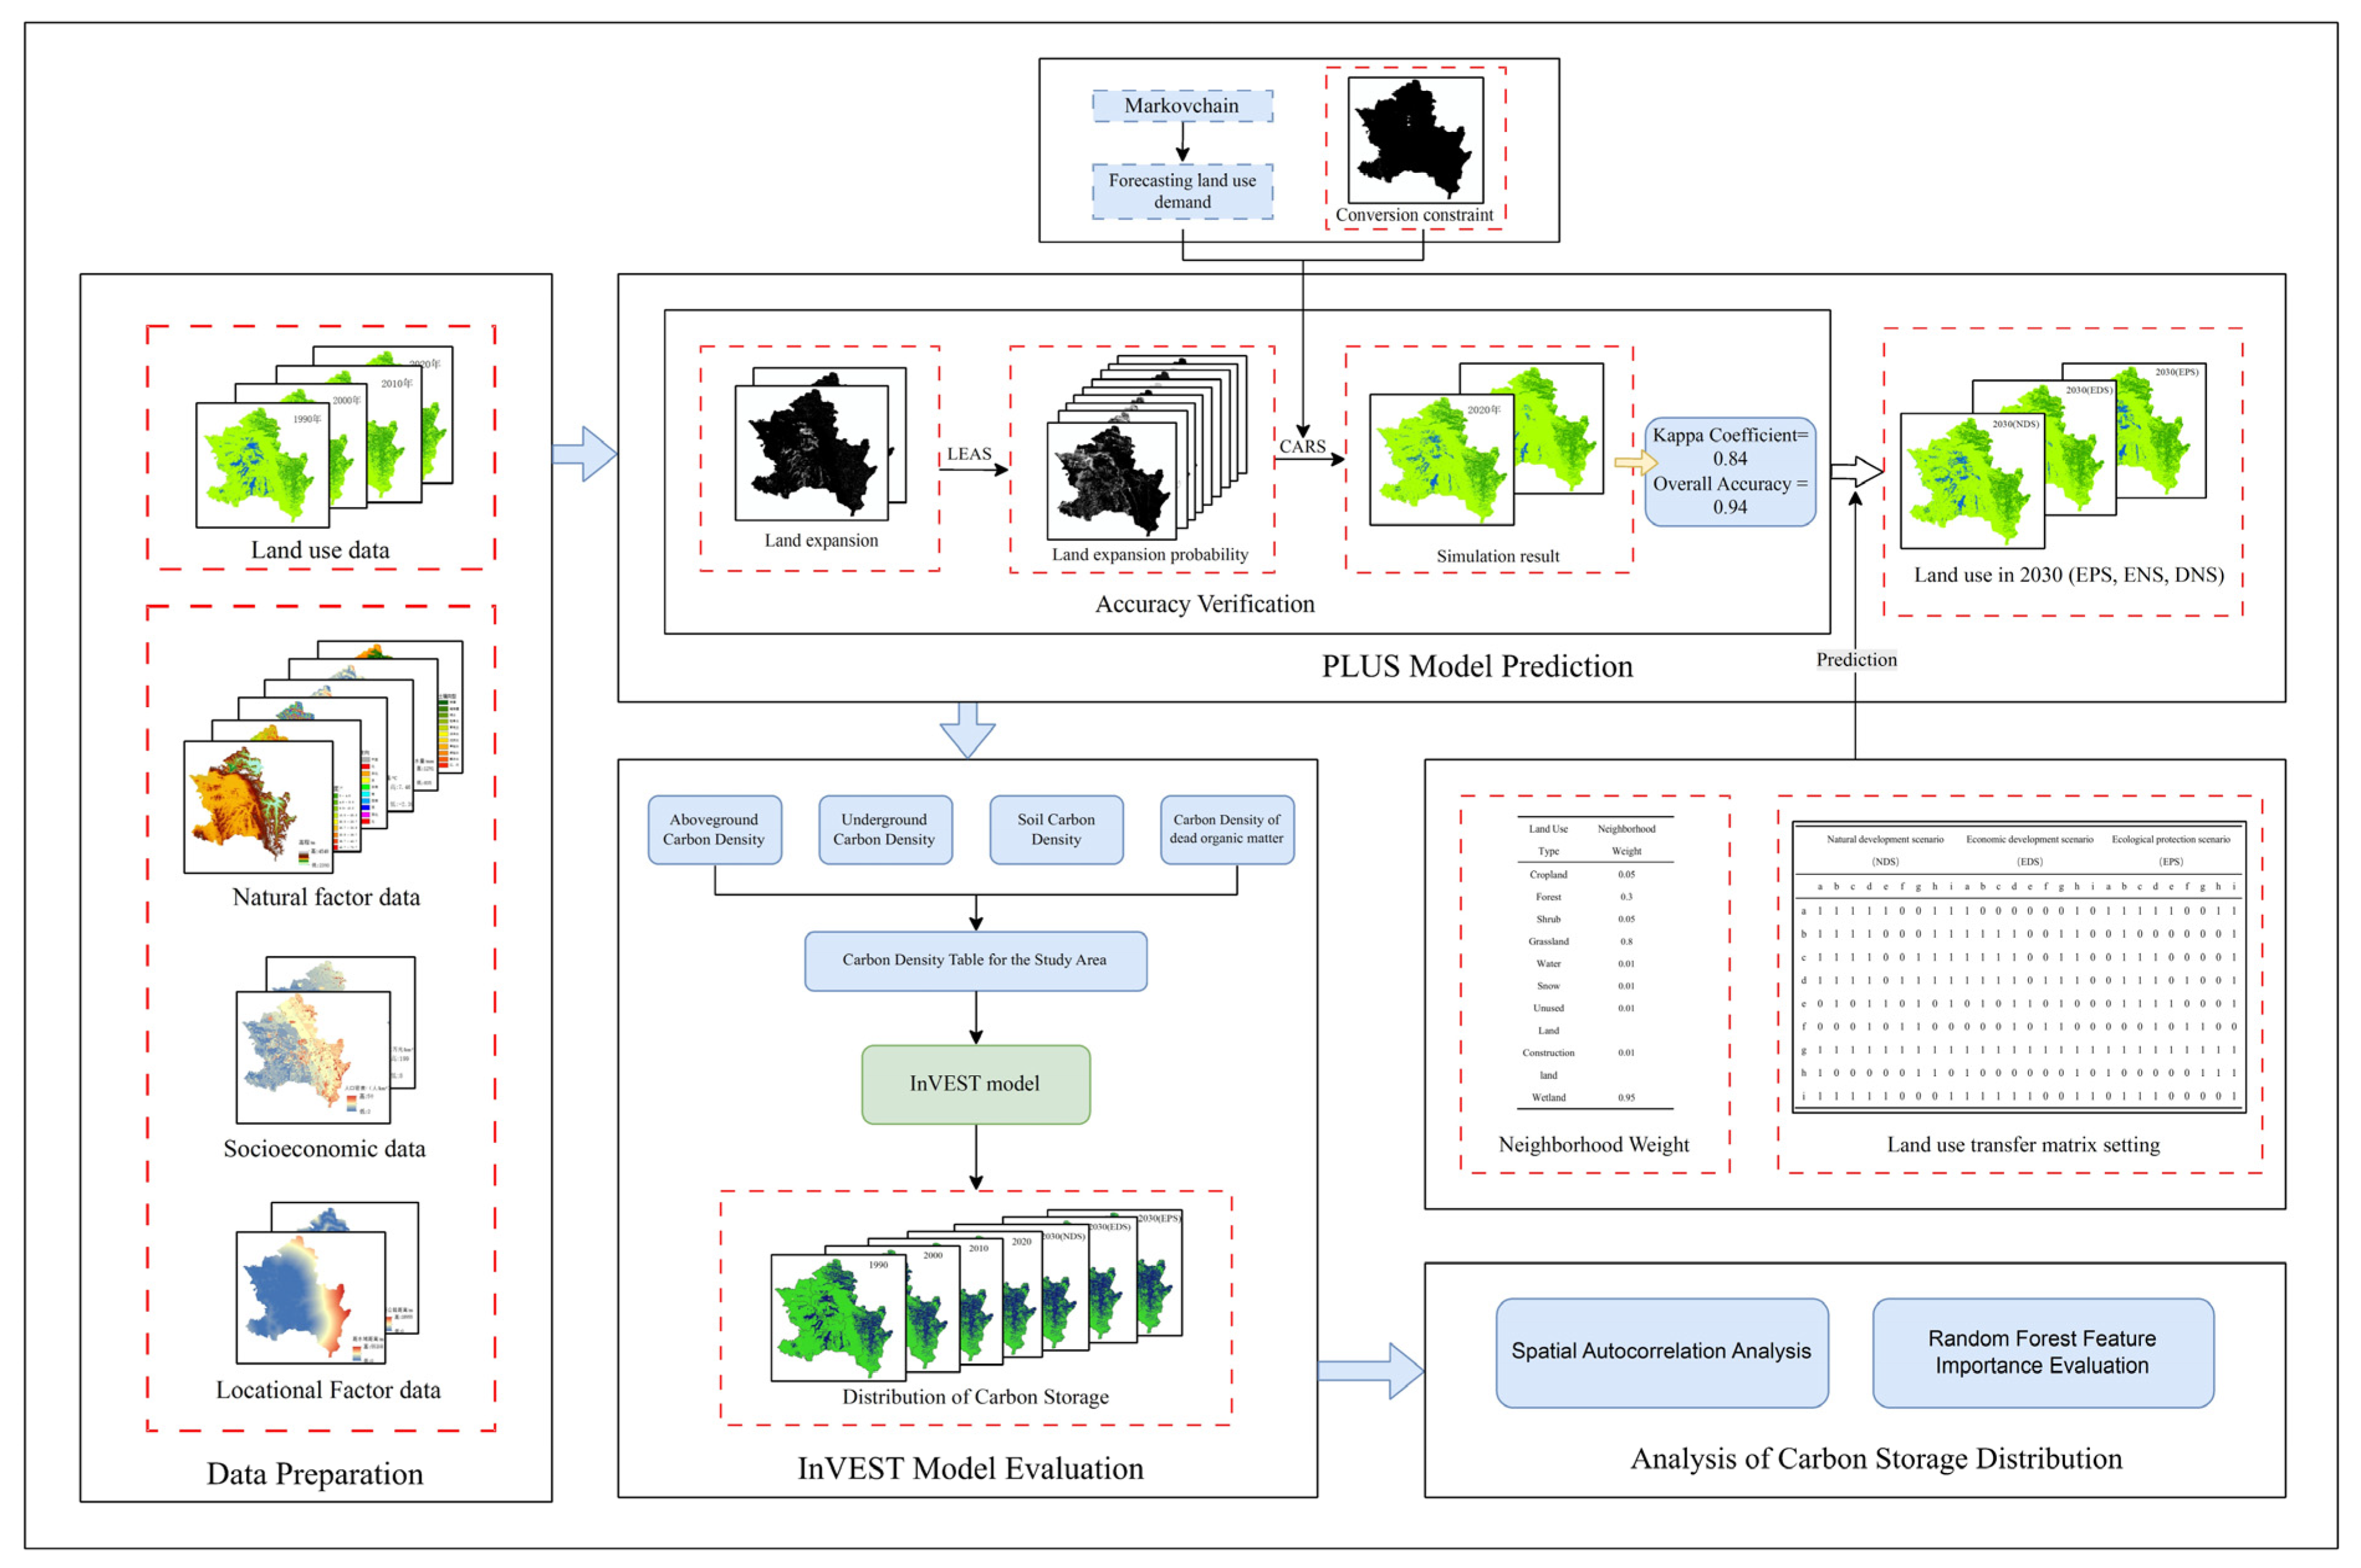
The research framework of the study is shown in Figure 3. Firstly, the PLUS model (version 1.4) was employed to simulate the spatial distribution of land use in 2030 under different scenarios based on historical land use data. Secondly, InVEST model (version 3.16.1) was employed to quantify the total carbon storage and its spatial distribution for different years. Thirdly, the spatial autocorrelation of carbon storage was investigated by using ArcGIS (version 10.8). Finally, the feature importance of the driving factors was assessed by constructing the Random Forest model.

2.3.1. PLUS Model

The PLUS model is a high-precision comprehensive land use simulation tool that integrates two major modules: the Random Forest-based Land Expansion Analysis Strategy (LEAS) and the cellular automata model based on multiple random patch seeds (CARS) [21]. With reference to related studies [34], three categories of driving factors were selected: natural factor data (elevation, slope, soil type, annual precipitation, mean annual temperature), socioeconomic data (GDP, population density), and locational factor data (distance from road and distance from water), comprising a total of nine variables.
This study combines regional characteristics such as economic development and nature conservation in Zoige County to establish three scenarios encompassing natural development scenario (NDS), economic development scenario (EDS), and ecological protection scenario (EPS). In addition, this study draws upon the overarching guidance provided in the Zoige County Territorial Spatial Master Plan (2021–2035) (draft) and the ecological projects prescribed in The Outline of the 14th Five-Year Plan for Economic and Social Development of Zoige County and the Long-Range Objectives Through the Year 2035, including grazing restrictions for wetland restoration, conversion of cropland to forest or grassland, and grazing bans on grasslands. It also takes into account relevant environmental and resource protection documents, such as the Administrative Measures for the Protection and Management of Zoige National Wetland Park and the Zoige Wetlands. These policy documents provide practical references for the setting of multi-scenario parameters in this study. Based on these scenarios (Table 2), we predict the land use pattern of Zoige County in 2030.
The neighborhood weight values for each land use type were calculated using the neighborhood factor weight calculation formula, as shown in Table A1. Based on past studies [37], the land use transfer matrix under multiple scenarios is presented in Table 3. Meanwhile, the water area is designated as a restricted transfer zone. Supplementary instructions on the PLUS model parameter setting for this study are presented in Table A2.
X = X X m i n X m a x X m i n
where X represents the min–max normalized value; X denotes the change area of each land type between the two periods of land use data; X m a x signifies the maximum area change among all land types; X m i n indicates the minimum area change among all land types.
The land use pattern of 2020 was simulated using land use data from 2000 to 2010 and compared with actual data. We employed the Kappa coefficient (a value > 0.75 indicates high simulation accuracy) and overall accuracy to evaluate model performance. The result shows a Kappa coefficient of 0.84 and overall accuracy of 0.94, indicating that the simulated results are largely consistent with the actual land use patterns. Meanwhile, we conducted sensitivity tests on the parameter settings for the multi-scenario projections. Specifically, we increased or decreased each initial probability listed in Table 2 by 5 percentage points. The results show that under EDS (+5%), EDS (−5%), EPS (+5%), and EPS (−5%), the proportions of pixels experiencing land use type changes relative to the total number of pixels were 1.58%, 1.57%, 2.72%, and 2.64%, respectively. Based on these results, we conclude that the probability settings for land use type conversions are reasonably reliable.

2.3.2. InVEST Model

The InVEST model assesses carbon storage based on the area of various land use types and their corresponding carbon density parameters. The formula for total carbon storage is [38]:
C t o t a l = C a b o v e + C b e l o w + C s o i l + C d e a d
where C t o t a l represents the total carbon storage; C a b o v e denotes the above-ground biomass carbon storage; C b e l o w refers to the below-ground biomass carbon storage; C s o i l indicates the soil organic carbon storage; C d e a d signifies the dead organic matter carbon storage.
Since carbon storage in different regions is influenced by local environmental factors, adjustments to carbon density are essential when compiling carbon density table. This study employs the correction formula proposed by Alam et al. [39] and Chen et al. [40] for calibration:
C s p = 3.3968 × M A P + 3996.1
C B P = 6.798 × e 0.0054 × M A P
C B T = 28 × M A T + 398
K B P = C B P C B P
K B T = C B T C B T
K B = K B P × K B T
K S = C S P C S P
where C s p denotes the soil carbon density (kg·m−2) derived from mean annual precipitation; C B P and C B T represent the biomass carbon density (kg·m−2) estimated based on mean annual precipitation and mean annual temperature, respectively; M A P refers to mean annual precipitation (mm), and M A T indicates mean annual temperature (°C). K B P and K B T represent the correction coefficients for biomass carbon density based on precipitation and temperature factors, respectively; C and C denote the carbon density data of Zoige County and the entire nation, respectively; K B and K S indicate the biomass carbon density correction coefficient and soil carbon density correction coefficient, respectively.
The national average carbon density data for different land use types in China referenced in this study are derived from the research by Zhou et al. [41]. Additionally, we consulted carbon storage data from relevant regional studies [15,37,42] and the carbon density data measured by the National Ecological Science Data Center in 2010 [43]. Based on the above data and the modified Formulas (3)–(9), we obtained the correction coefficient ( K B   = 0.72, K S = 1.01) and the corrected carbon density data for the study area (Table 4).
Drawing on previous research on uncertainty [44], we introduce the SCV to assess the uncertainty in carbon storage. The SCV refers to the total carbon storage uncertainty resulting from all types of land use changes during a given period. Through calculations, we obtained SCV (1990–2000), SCV (2000–2010), SCV (2010–2020), SCV (2020–2030NDS), SCV (2020–2030EDS), and SCV (2020–2030EPS), which are 27.60%, 28.24%, 29.54%, 30.32%, 30.33%, and 30.84%, respectively. We speculate that this discrepancy stems from the fact that existing studies in this region do not fully agree on the absolute values of carbon storage in forest, grassland, and wetland, with some variation. However, regarding the relative ranking of carbon storage density, there is no disagreement among the conclusions of existing studies. This study conducts a comprehensive assessment based on data measured by the National Ecological Science Data Center in 2010, combined with a carbon table incorporating correction factors and existing research from neighboring regions, thereby ensuring a certain degree of data reliability.

2.3.3. Spatial Autocorrelation Analysis

This study employs the global Moran’s I, which measures spatial autocorrelation by calculating the similarity between spatial units. Its values range from 1 to 1, where positive values indicate that spatial distribution follows the clustering pattern, and negative values indicate that spatial distribution follows a dispersion pattern. The calculation formula is as follows [45]:
I = n n = 1 n j = 1 n w i j x i x ¯ x j x ¯ n = 1 n j = 1 n w i j i = 1 n x i x ¯ 2
where x i x ¯ is the deviation of the attribute of feature i from its mean value, w i j is the spatial weight between feature i and j , and n is the total number of features.
Meanwhile, High–Low Clustering analysis (Getis–Ord General G) [46] and Hot Spot analysis (Getis–Ord Gi*) [47] within the ArcGIS spatial statistics toolbox were employed to analyze the significant clustering of high/low carbon storage values and their spatial distribution characteristics in the study area.
The results of the Getis–Ord General G are interpreted using Z-values and p-values. A p-value < 0.05 with a positive Z-value indicates the presence of significant high-value clustering, whereas a p-value < 0.05 with a negative Z-value signifies significant low-value clustering. The thresholds for determining hot spot and cold spot significance based on the Getis–Ord Gi* are set at Z = ±2.58, ±1.96, and ±1.65, respectively.
The above analysis was conducted using ArcGIS version 10.8. Considering the limited number of administrative units in Zoige County, spatial autocorrelation analysis was performed using the Fishnet tool in ArcGIS. The selection of the fishnet resolution referenced previous studies in similar regions, such as the Western Sichuan Plateau [48]. Finally, the fishnet was set to 3 km × 3 km. Furthermore, the parameters for hotspot analysis were configured as follows: Conceptualization of Spatial Relationships was set to FIXED_DISTANCE_BAND, and the Distance Band was defined as the threshold automatically calculated by the Spatial Autocorrelation tool in ArcGIS (version 10.8).

2.3.4. Random Forest Model

The Random Forest (RF) model is an ensemble learning algorithm widely used in classification, regression, and other tasks [26]. The Bagging (Bootstrap Aggregating) method is employed for sample selection to ensure random sampling of instances, and a random subset of features is selected at each node split to guarantee feature randomness [49]. The RF model constructs multiple decision trees, each of which makes a prediction for the input. This model has the advantages of the capacity to calculate nonlinear interactions between variables, high predictive accuracy, resistance to overfitting, and strong generalization capabilities [50].
Based on past studies in alpine regions [14,51] and considering the regional characteristics of Zoige County, ten influencing factors were selected: elevation, slope, aspect, soil type, annual precipitation, mean annual temperature, GDP, population density, distance from road, distance from water. This study implemented the RF model using the R programming language (Version 4.5.1) [52]. The dataset was partitioned into training and validation sets using the “createDataPartition” function from the “caret” package (Version 7.0.1, https://doi.org/10.32614/CRAN.package.caret) [53]. Then, the RF model was constructed using the “randomForest” package (Version 4.7.1.2, https://doi.org/10.32614/CRAN.package.randomForest) [54], and the significance of the independent variables was tested using the “rfPermute” package (Version 2.5.5, https://doi.org/10.32614/CRAN.package.rfPermute) [55]. Finally, this study used the “fastshap” package (Version 0.1.1, https://doi.org/10.32614/CRAN.package.fastshap) [56] to perform SHAP value interpretability analysis. The results of the RF model include the percentage increase in mean squared error (%IncRMSE), which is used to measure feature importance, as well as feature significance. These metrics are then sorted by importance value and visualized. Meanwhile, the model’s accuracy is evaluated using the validation set [57], employing assessment metrics including the coefficient of determination (R2) and the root mean square error (RMSE) to ensure the scientific validity of the results.

3. Results

3.1. Spatiotemporal Analysis of Land Use Types

3.1.1. Analysis of Historical Land Use Distribution Changes

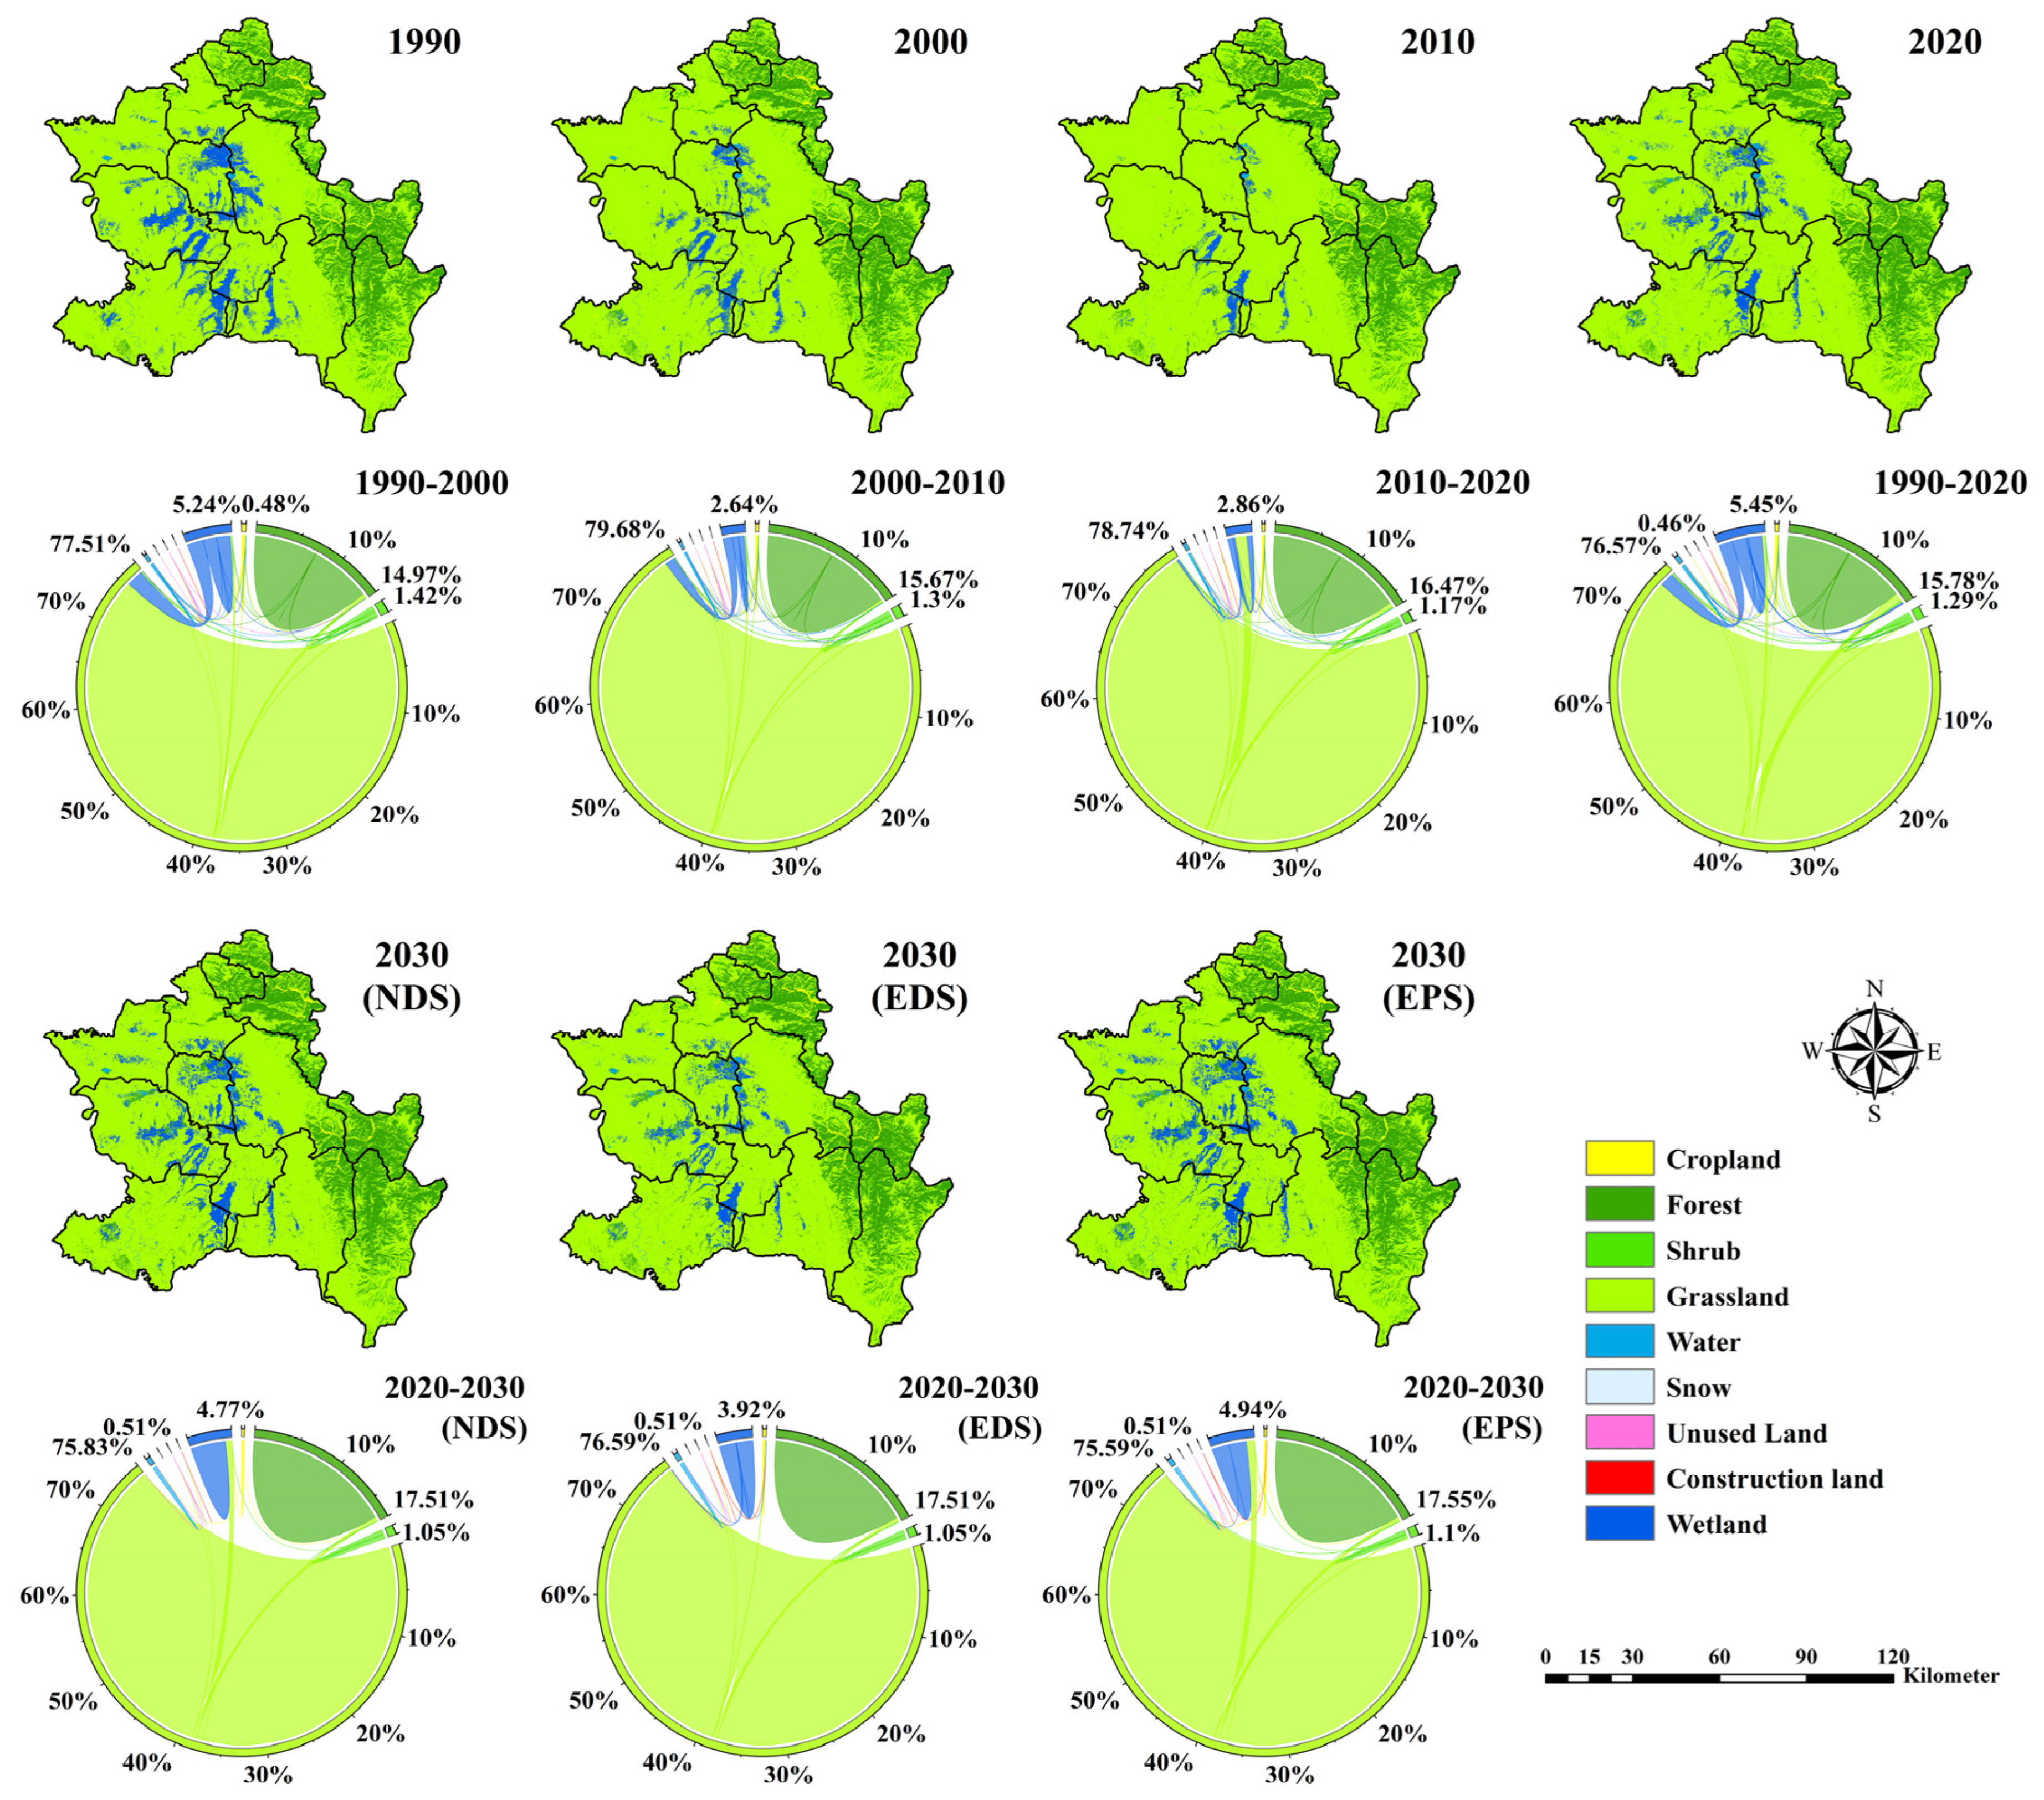
The distribution of land use types from 1990 to 2020 and under three scenarios for 2030 is shown in Figure 4. In 2020, the spatial distribution of land use types in Zoige County remained largely similar to that of 1990, and was still dominated by grassland, which accounted for 76.57% of the total study area, followed by forest, covering 15.78%. The remaining land use types within the study area, ranked from largest to smallest, are: wetland (5.45%), shrub (1.29%), water (0.46%), cropland (0.44%), unused land (0.01%), construction land (0.01%), snow (0.01%).
As shown in Figure 4 and Table A3, the areas of different land use types changed between 1990 and 2020. Specifically, forest and grassland areas increased by 255.74 km2 and 98.27 km2 respectively, while wetland areas decreased by 298.99 km2. The increase in grassland area primarily resulted from two sources: 257.69 km2 from net conversion from wetland and 18.76 km2 from net conversion from cropland. Meanwhile, a small portion of grassland was converted to other land uses, with 182.57 km2 being converted to forest. On this basis, 29.7 km2 of shrub was net converted to forest. This indicates that the areas of other land use types have remained largely stable, with forest and grassland showing significant growth and wetland experiencing a marked decline.

3.1.2. Analysis of Projected Land Use Distribution Changes

Land use changes from 2020 to 2030 under three scenarios are shown in Figure 4 and Table A4. Under the NDS, forest and wetland show the most significant growth, expanding by 103.51 km2 and 159.46 km2 respectively, while water and unused land experience smaller increases. Conversely, grassland areas will decrease by 259.9 km2, while cropland and shrub will also experience slight reductions. Under the EDS, the reduction in grassland areas is less pronounced compared to the NDS. Meanwhile, cropland shifts from a decreasing trend in the NDS to an increase of 15.69 km2, while wetlands transition from an increase to a decrease of 16.14 km2. Under the EPS, forest and wetland areas have increased further compared to the NDS. The forest and wetland areas increased by 110.64 km2 and 193.63 km2 respectively, while shrub also saw a slight increase. The primary shift from cropland and grassland to the aforementioned land uses was observed.

3.2. Spatiotemporal Analysis of Carbon Storage

3.2.1. Analysis of Historical Carbon Storage Distribution

The results from the Carbon Storage module of the InVEST model indicate that the total carbon storage in Zoige County was 8.212 × 10⁷ tons in 1990, 8.003 × 10⁷ tons in 2000, 7.891 × 10⁷ tons in 2010, and 8.174 × 10⁷ tons in 2020, showing an overall trend of first decreasing and then increasing. Despite a rebound from 2010 levels, carbon storage in 2020 remained slightly below 1990 levels. During this study period, the largest decline in carbon storage occurred between 1990 and 2000, decreasing by 2.09 × 10⁶ tons (2.55%).
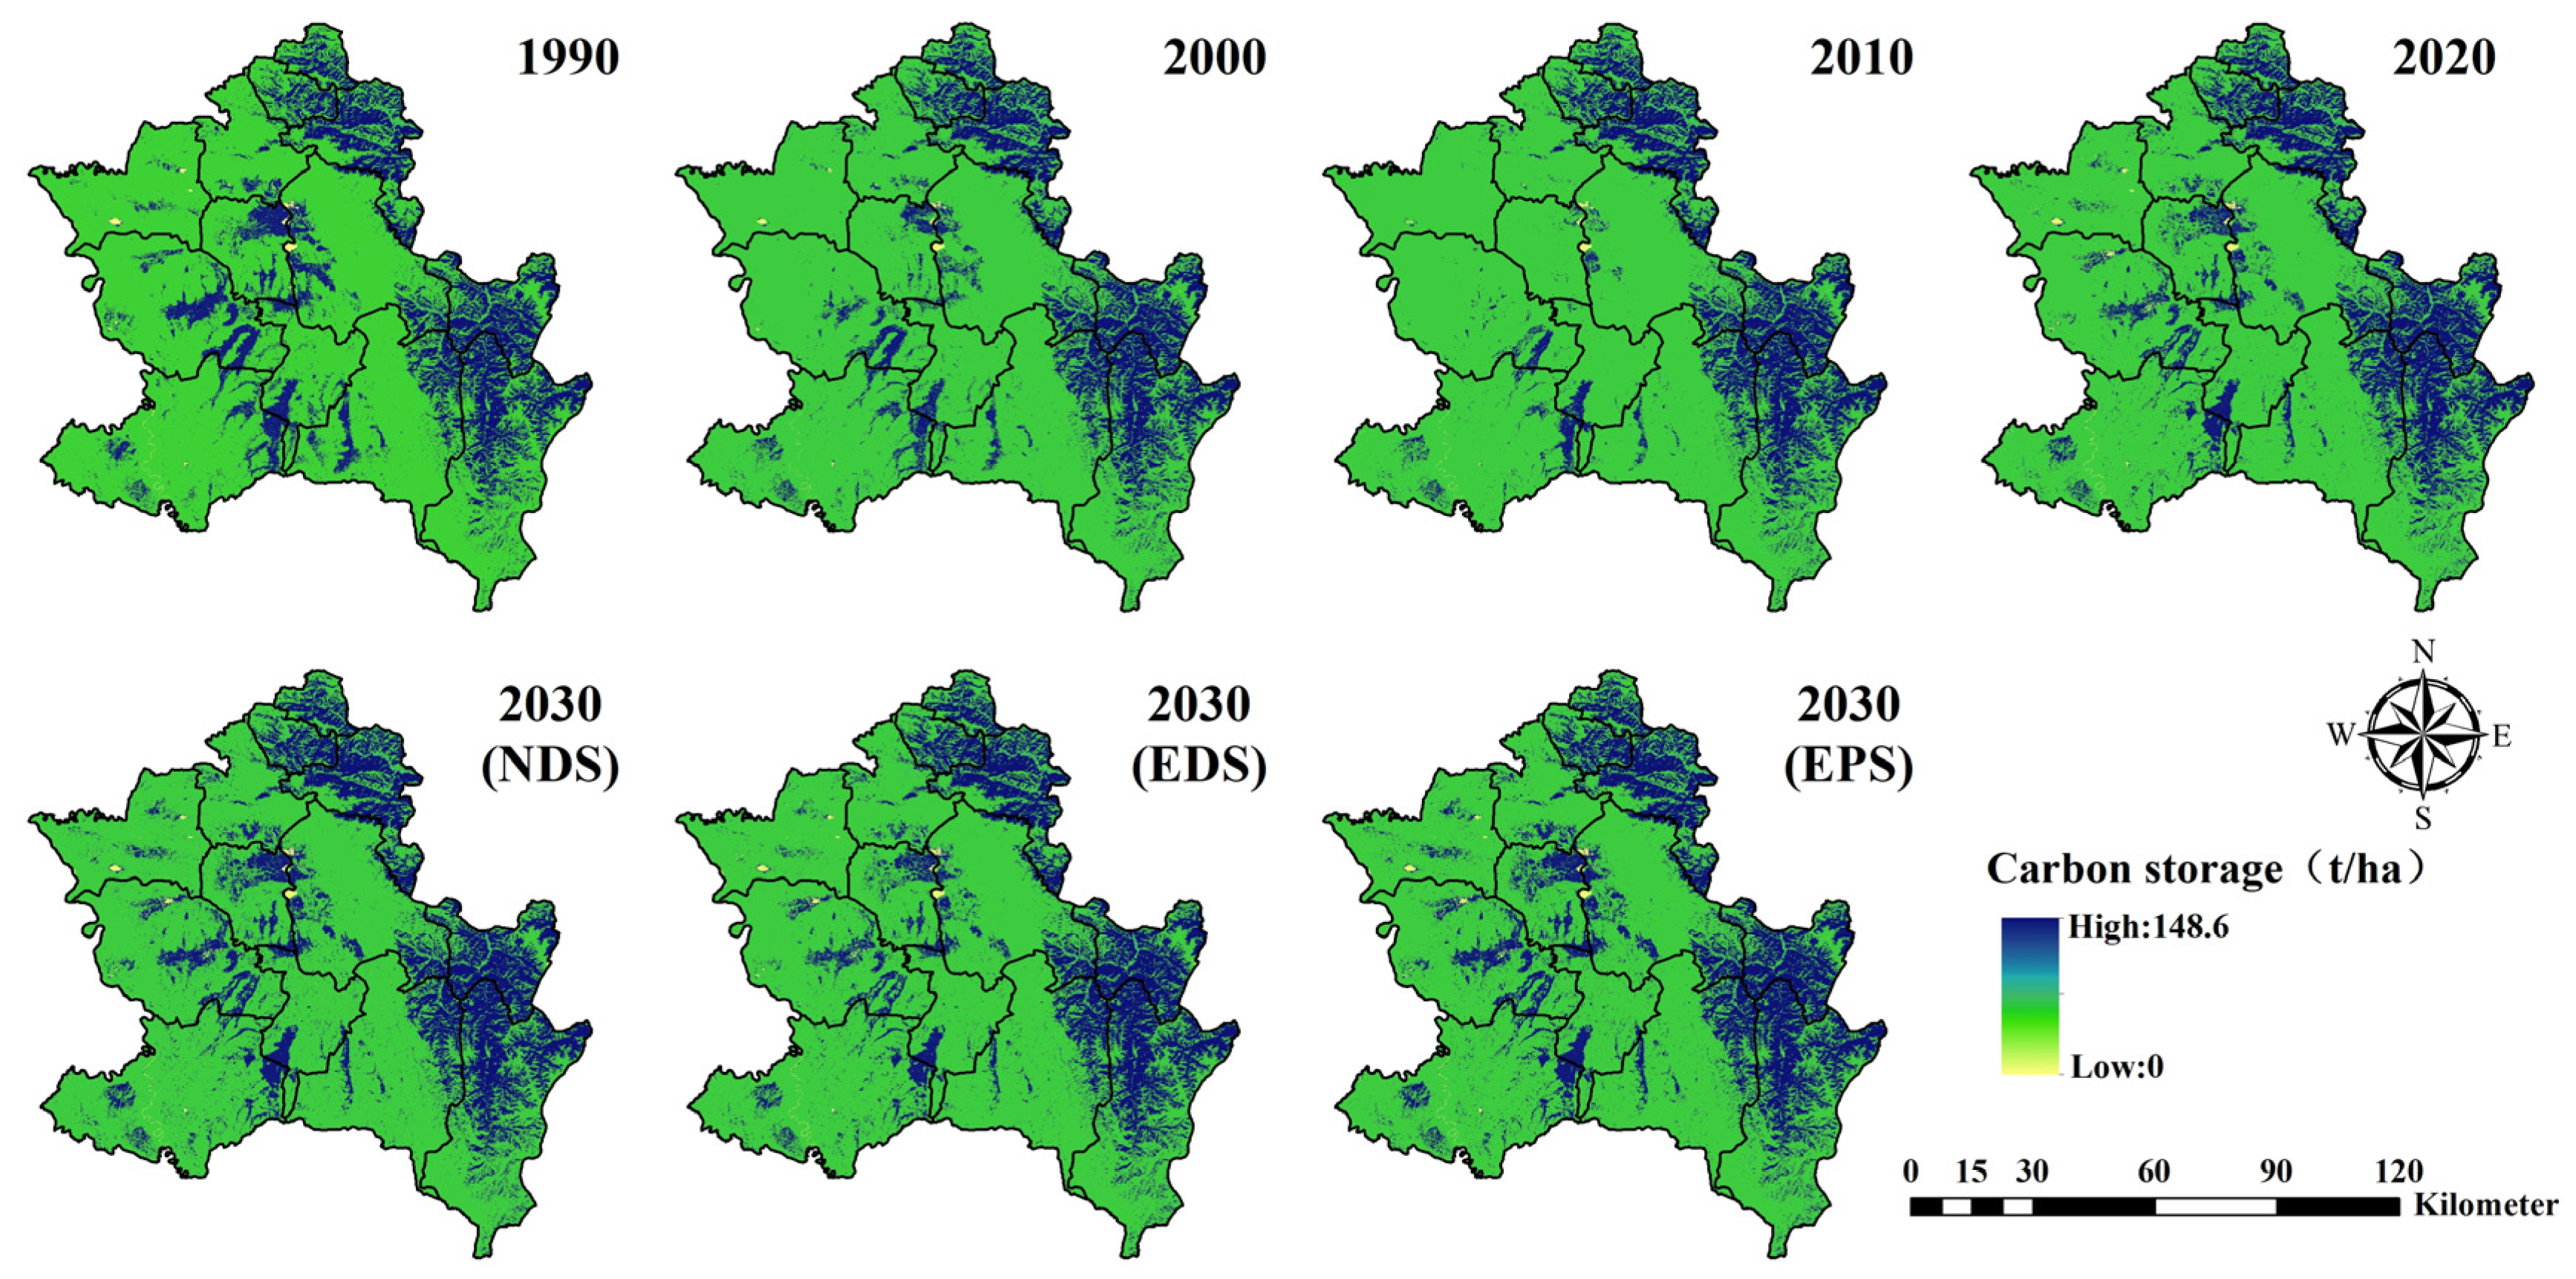
The spatial distribution of carbon storage from 1990 to 2020 is shown in Figure 5. It is worth noting that the land use type of snow did not exist in 1990; therefore, the average carbon storage for that year ranges from 4.92 to 148.6 t/ha. The distribution of carbon storage overall exhibits an east–high, west–low gradient pattern. Areas with high carbon storage are mainly found in the northern and eastern mountainous regions, where land use is dominated by forest and shrub with high vegetation density, as well as in the wetland areas of the central region, which have accumulated substantial amounts of undecomposed organic carbon.

3.2.2. Analysis of Carbon Storage Accumulation Under Different Scenarios

The spatial distribution of carbon storage under the three scenarios for 2030 is shown in Figure 5. Under the NDS, total carbon storage will reach 8.396 × 10⁷ tons, representing an increase of 2.22 × 10⁶ tons (2.72%) compared to 2020. Compared to the NDS, total carbon storage grows slowly under the EDS but remain above 2020 levels, reaching 8.252 × 10⁷ tons. Under the EPS, total carbon storage increased the most, reaching 8.432 × 10⁷ tons. This represents an increase of 3.6 × 10⁵ tons (0.43%) and 1.8 × 10⁶ tons (2.18%) compared to the NDS and EDS, respectively. This reflects differences in carbon storage resulting from the shift in land use types toward forest and wetland under the ecological conservation orientation.

3.2.3. Analysis of Carbon Storage Change Trends

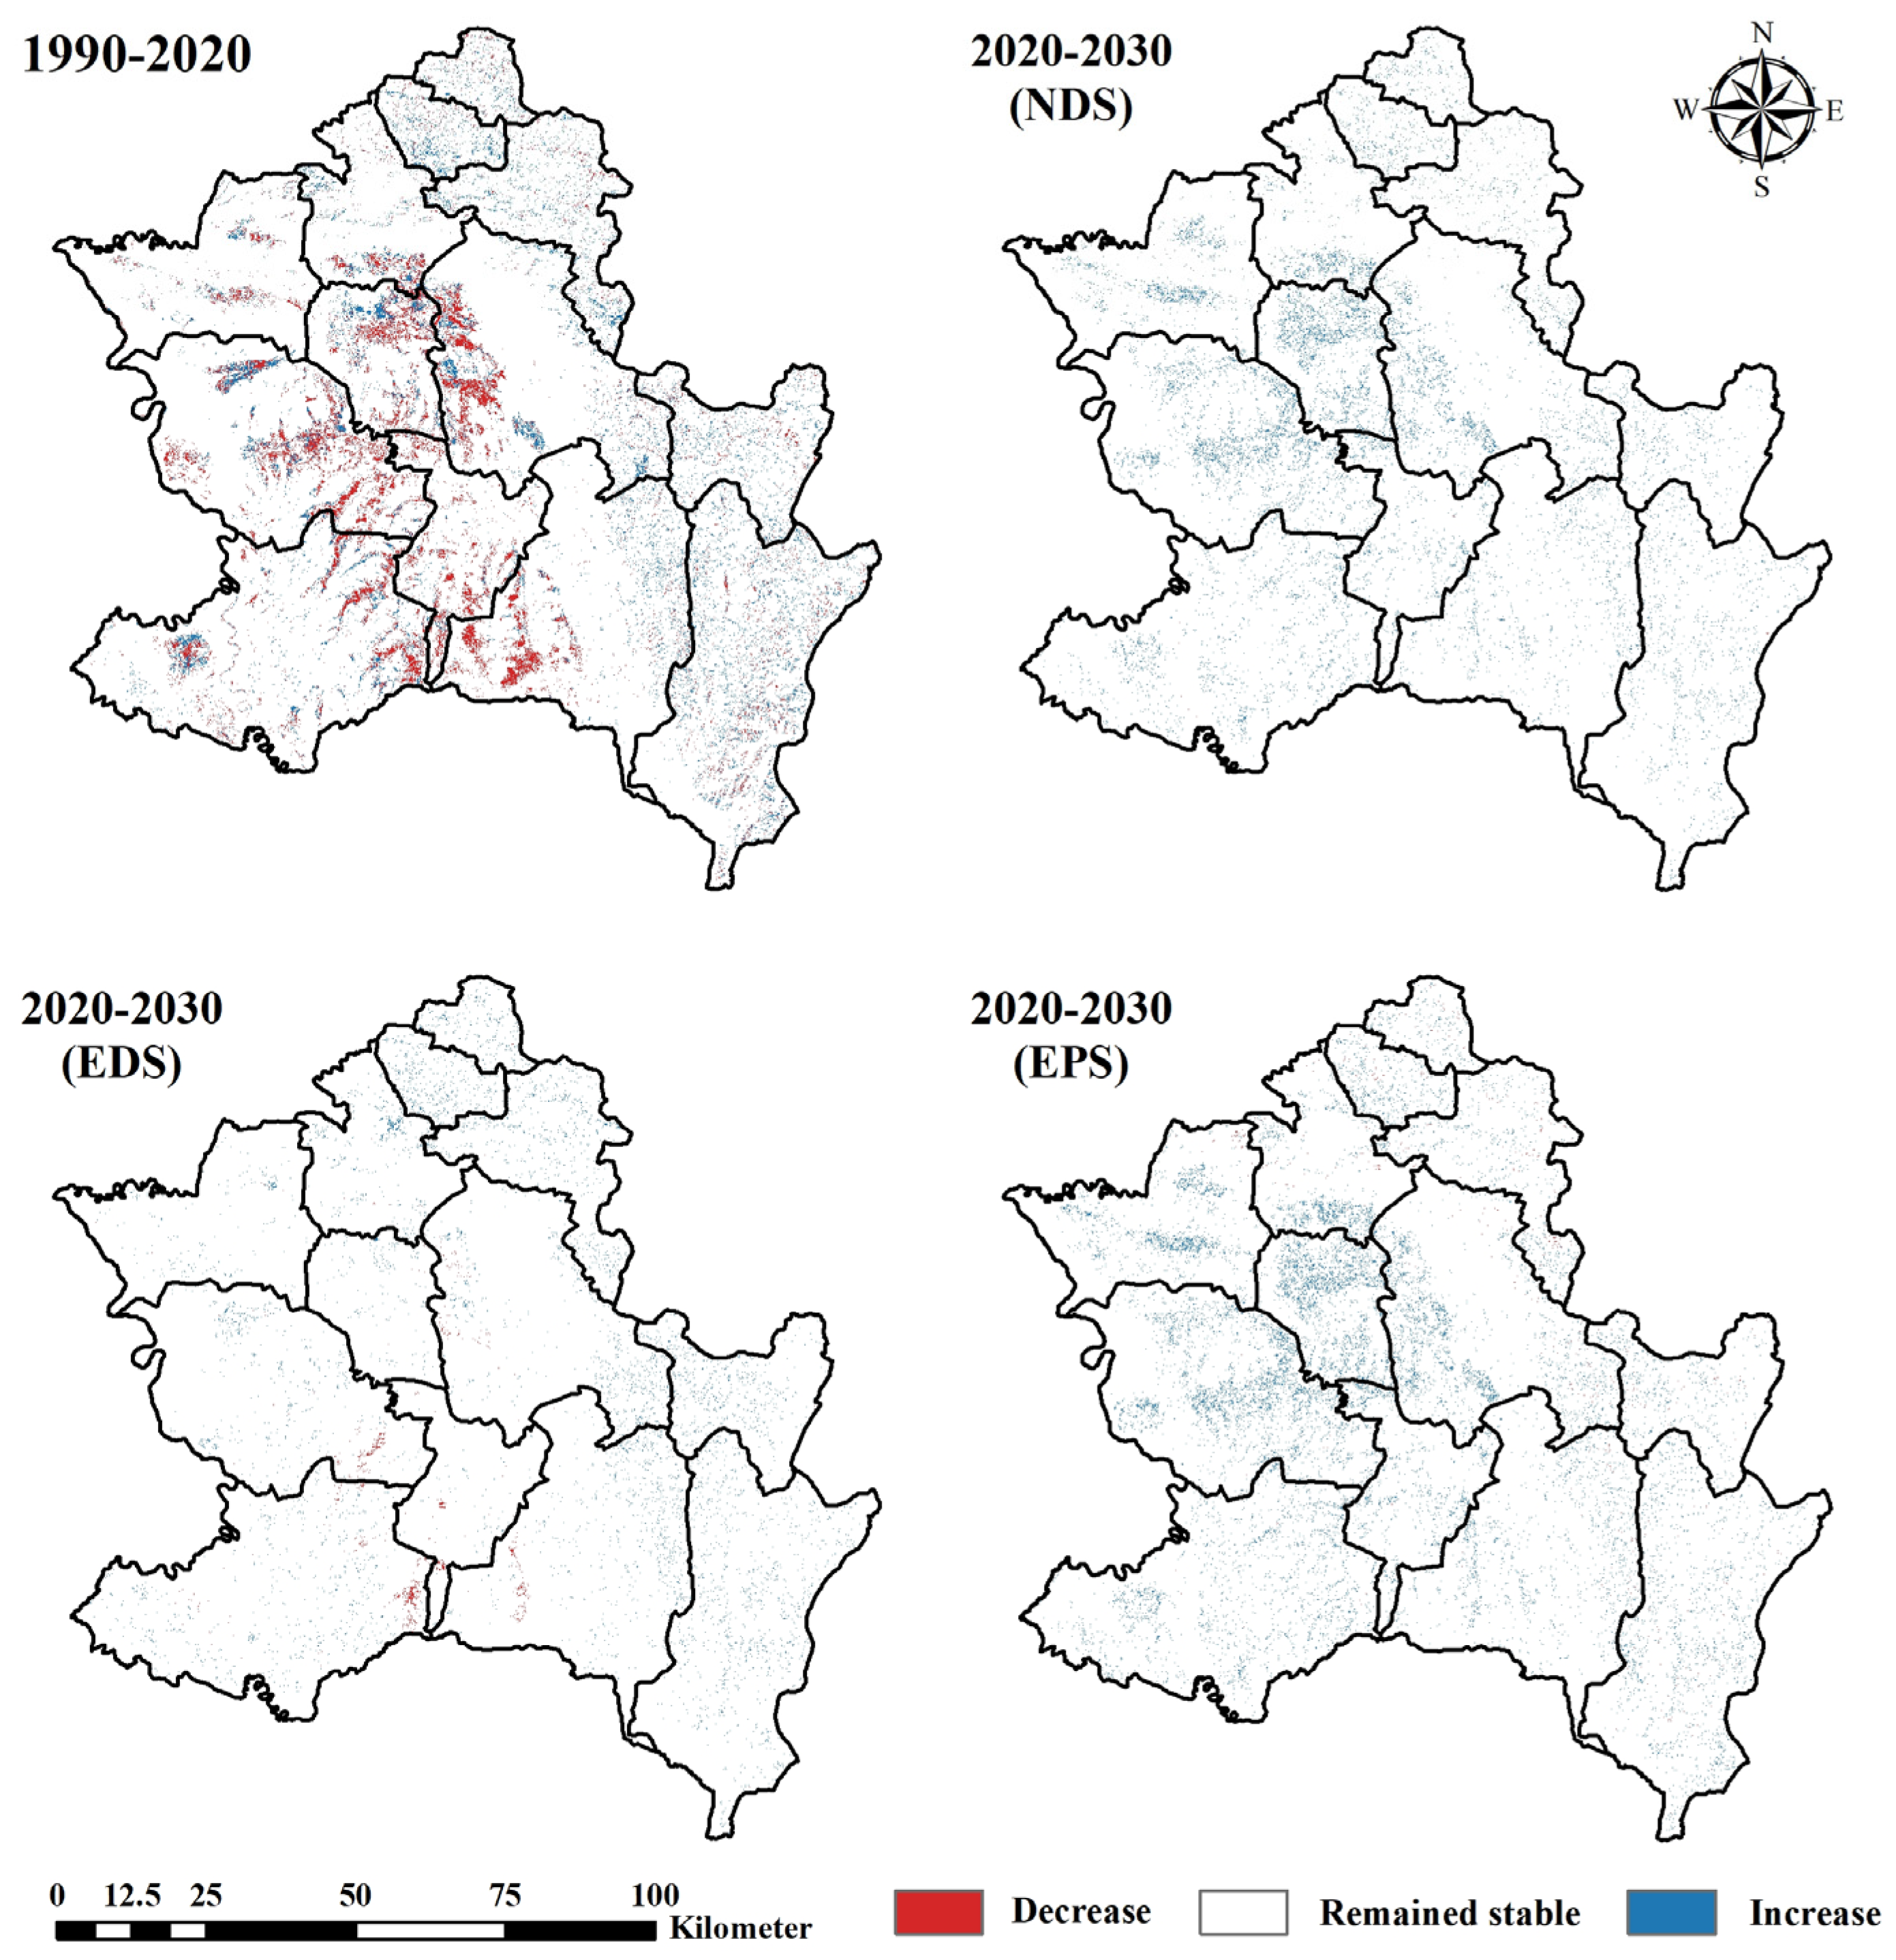
As shown in Figure 6 and Table A5, this result indicates that from 1990 to 2030, approximately 90% of the regions experienced no significant change in carbon storage. During the period from 1990 to 2020, the areas with increased carbon storage were smaller than the areas with decreased carbon storage. The extensive areas with decreased carbon storage are found in central Zoige County, covering 4.32% of the total area, and are primarily concentrated in townships such as Xiaman Township, Axi Town, Tangke Town, and Baxi Town. The areas with increased carbon storage are found in a small portion of the region, covering 3.92% of the total area. These areas are distributed in Baozuo Township in the east and Jiangza Township and Tiebu Town in the north.
In contrast to the changes over the past three decades, the projected changes from 2020 to 2030 under all three scenarios show that the areas with increased carbon storage are larger than the areas with decreased carbon storage. Under the NDS and EPS, the areas with increased carbon storage account for 2.55% and 3.14% of the total area, respectively. Conversely, under the EDS, these areas account for 1.15% of the total area, dispersing across various townships. Moreover, under the EDS, the areas with decreased carbon storage are larger than in the other two scenarios, accounting for 0.16% of the total area.

3.3. Spatial Autocorrelation Analyzing of Carbon Storage

3.3.1. Global Spatial Autocorrelation Analysis

The results of the spatial autocorrelation (Moran’s I) and the High–Low Clustering analysis (Getis–Ord General G) are shown in Table A6. The global Moran’s I values for the years 2020 and 2030 under the NDS, EDS, and EPS were calculated to be 0.80, 0.78, 0.80, and 0.78, respectively. Spatial distribution of carbon storage exhibited positive spatial dependence and passed the significance test at the 0.1% level. Moreover, the global Moran’s I values remained stable within the range of 0.75 to 0.80. Meanwhile, carbon storage in 2020 and under the three 2030 scenarios all exhibited clusters of high values. The clustering patterns were statistically significant at the 0.1% level.

3.3.2. Hot Spot Analysis

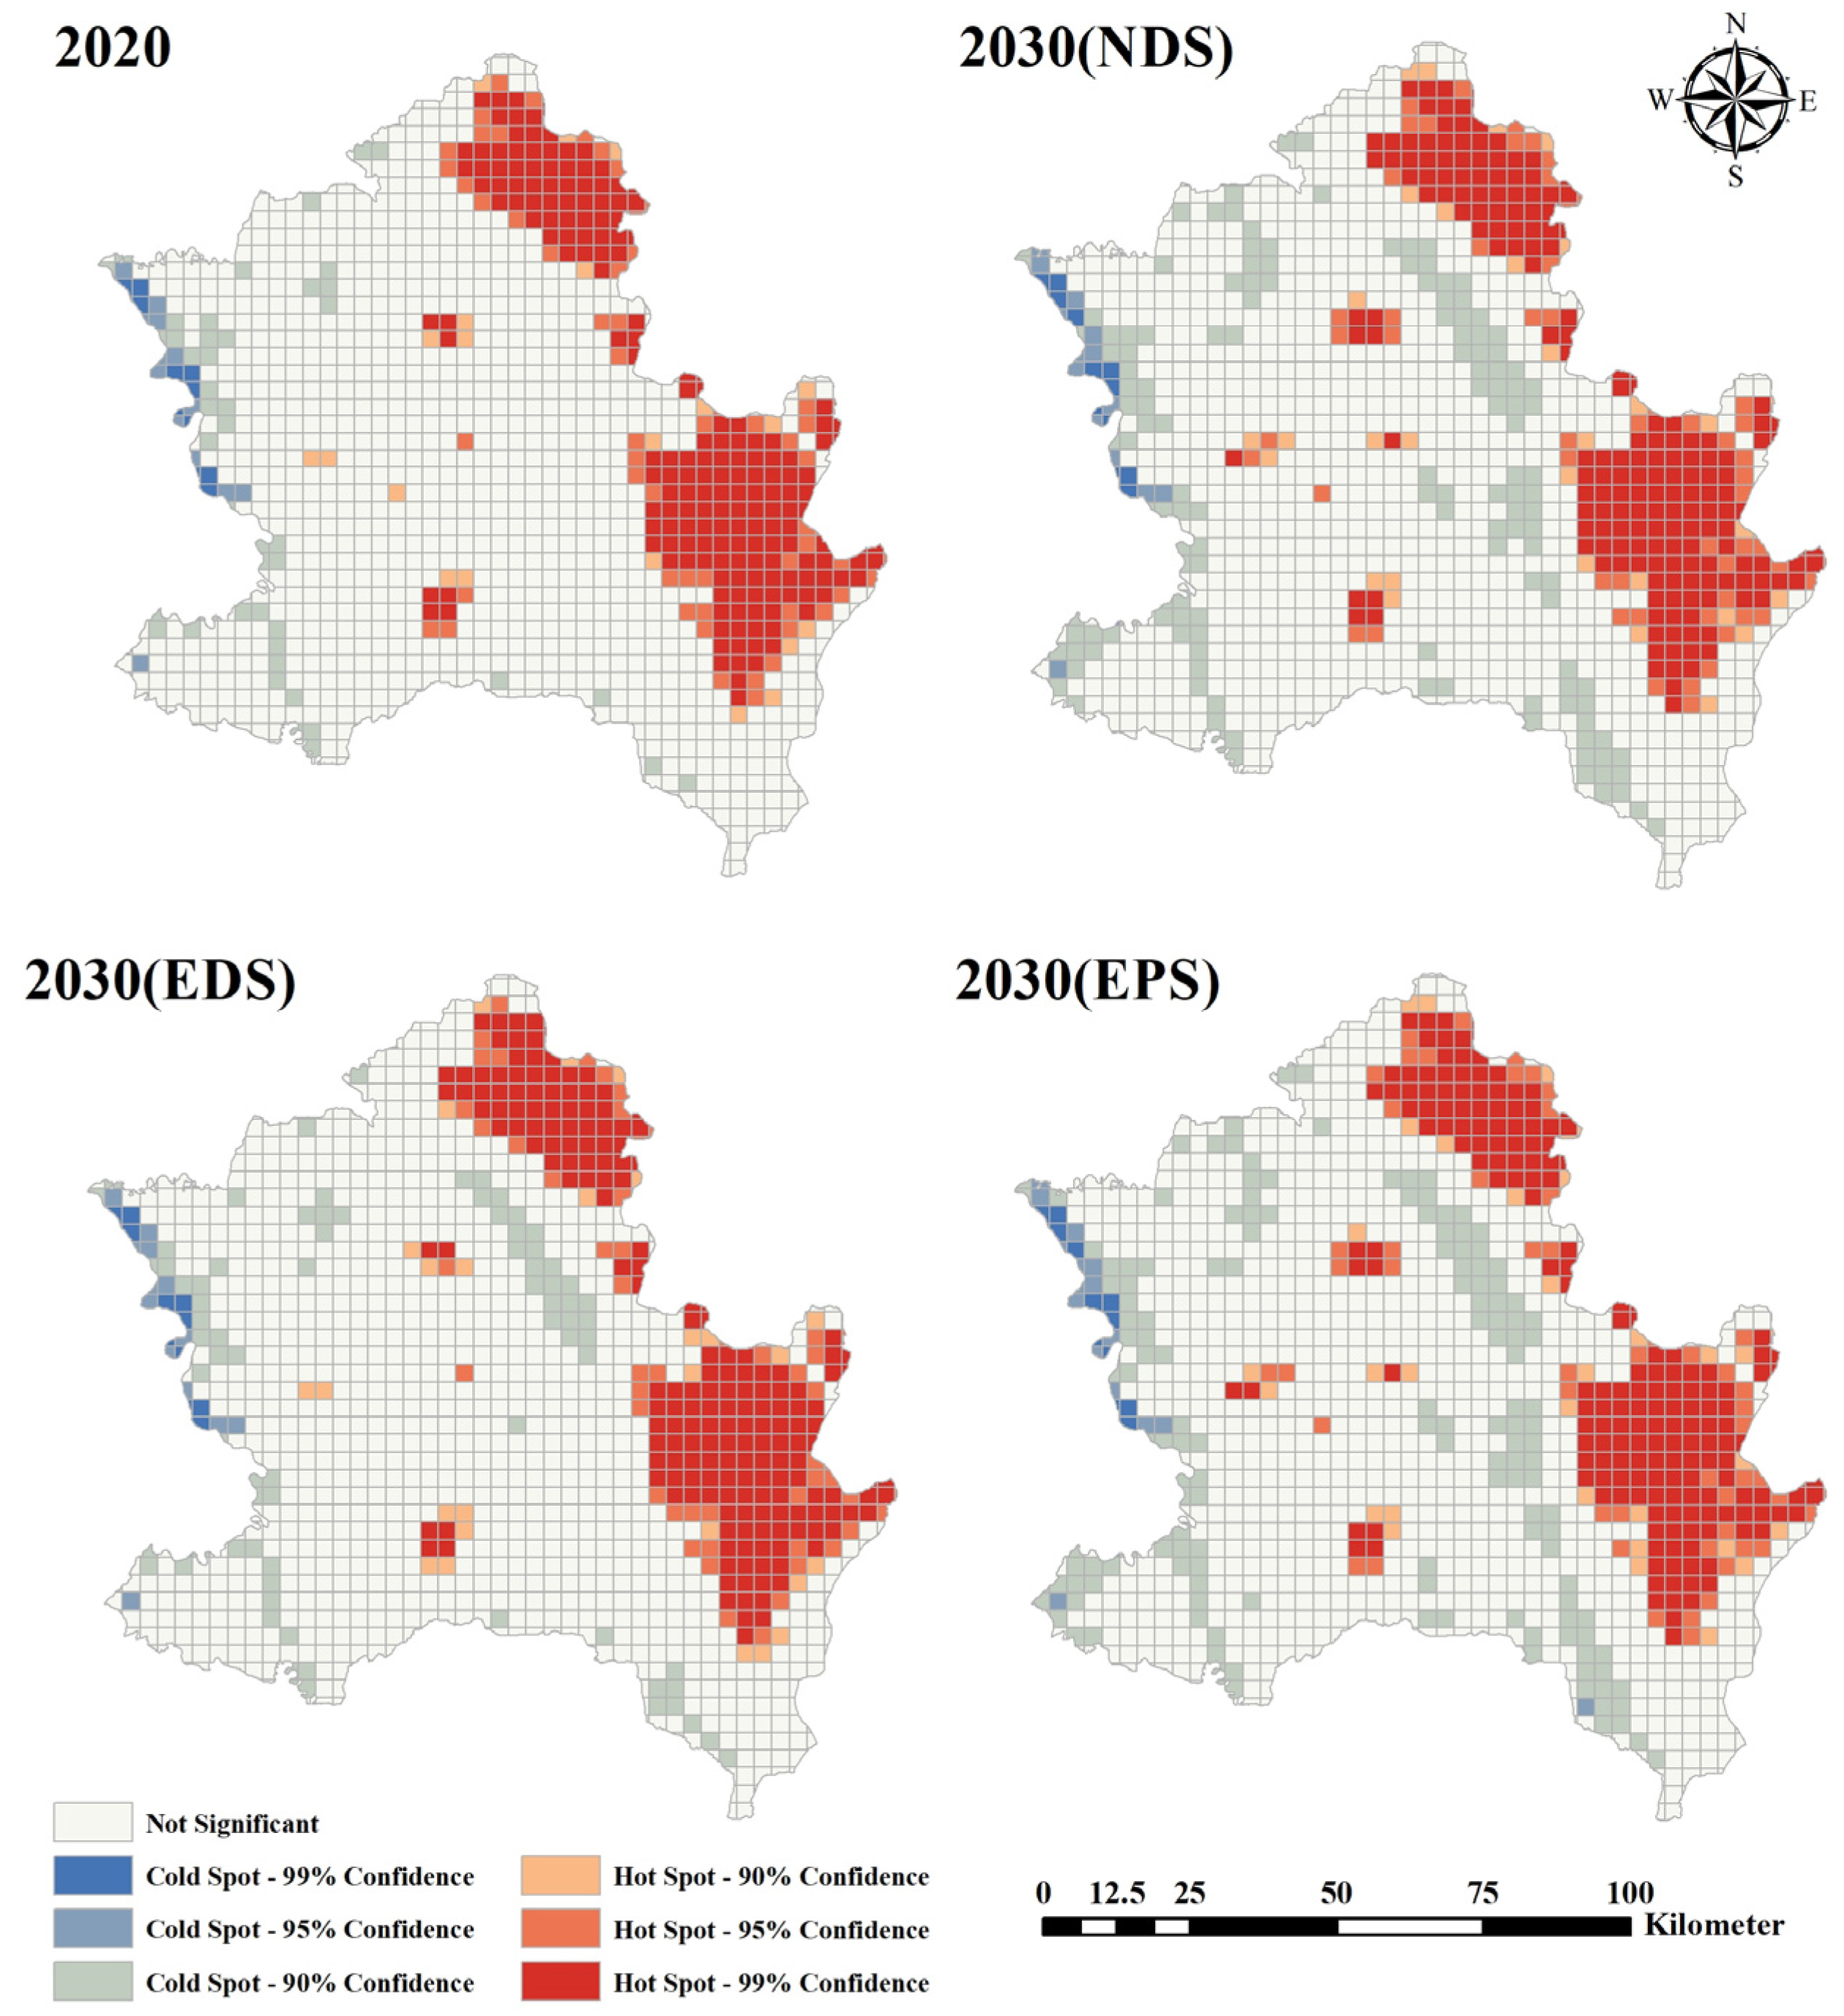
The results of hot spot analysis are shown in Figure 7. The distribution of carbon storage exhibited significant spatial clustering in all years studied. In 2020, hot spots (high-high clusters) are predominantly concentrated in northern and eastern mountainous regions characterized by high-carbon-density land uses such as forest and shrub, as well as in central wetland areas. Cold spots (low–low clusters) are predominantly concentrated in the western marginal water areas. The overall distribution patterns of hot and cold spots under different scenarios in 2030 remain largely similar to those in 2020, with noticeable change occurring in certain regions. Under the NDS and EPS, wetland areas in the central part of the study region expanded by 2030, with hot spot regions showing slight increases. However, the cold spot regions have expanded in the transitional zone between the eastern plains and mountainous regions. Meanwhile, under the EDS, hot spot regions in 2030 remained largely unchanged from 2020, exhibiting a slight reduction trend, while cold spot regions in the northeastern region of Zoige County increased marginally.

3.4. Driving Factors of Carbon Storage Change

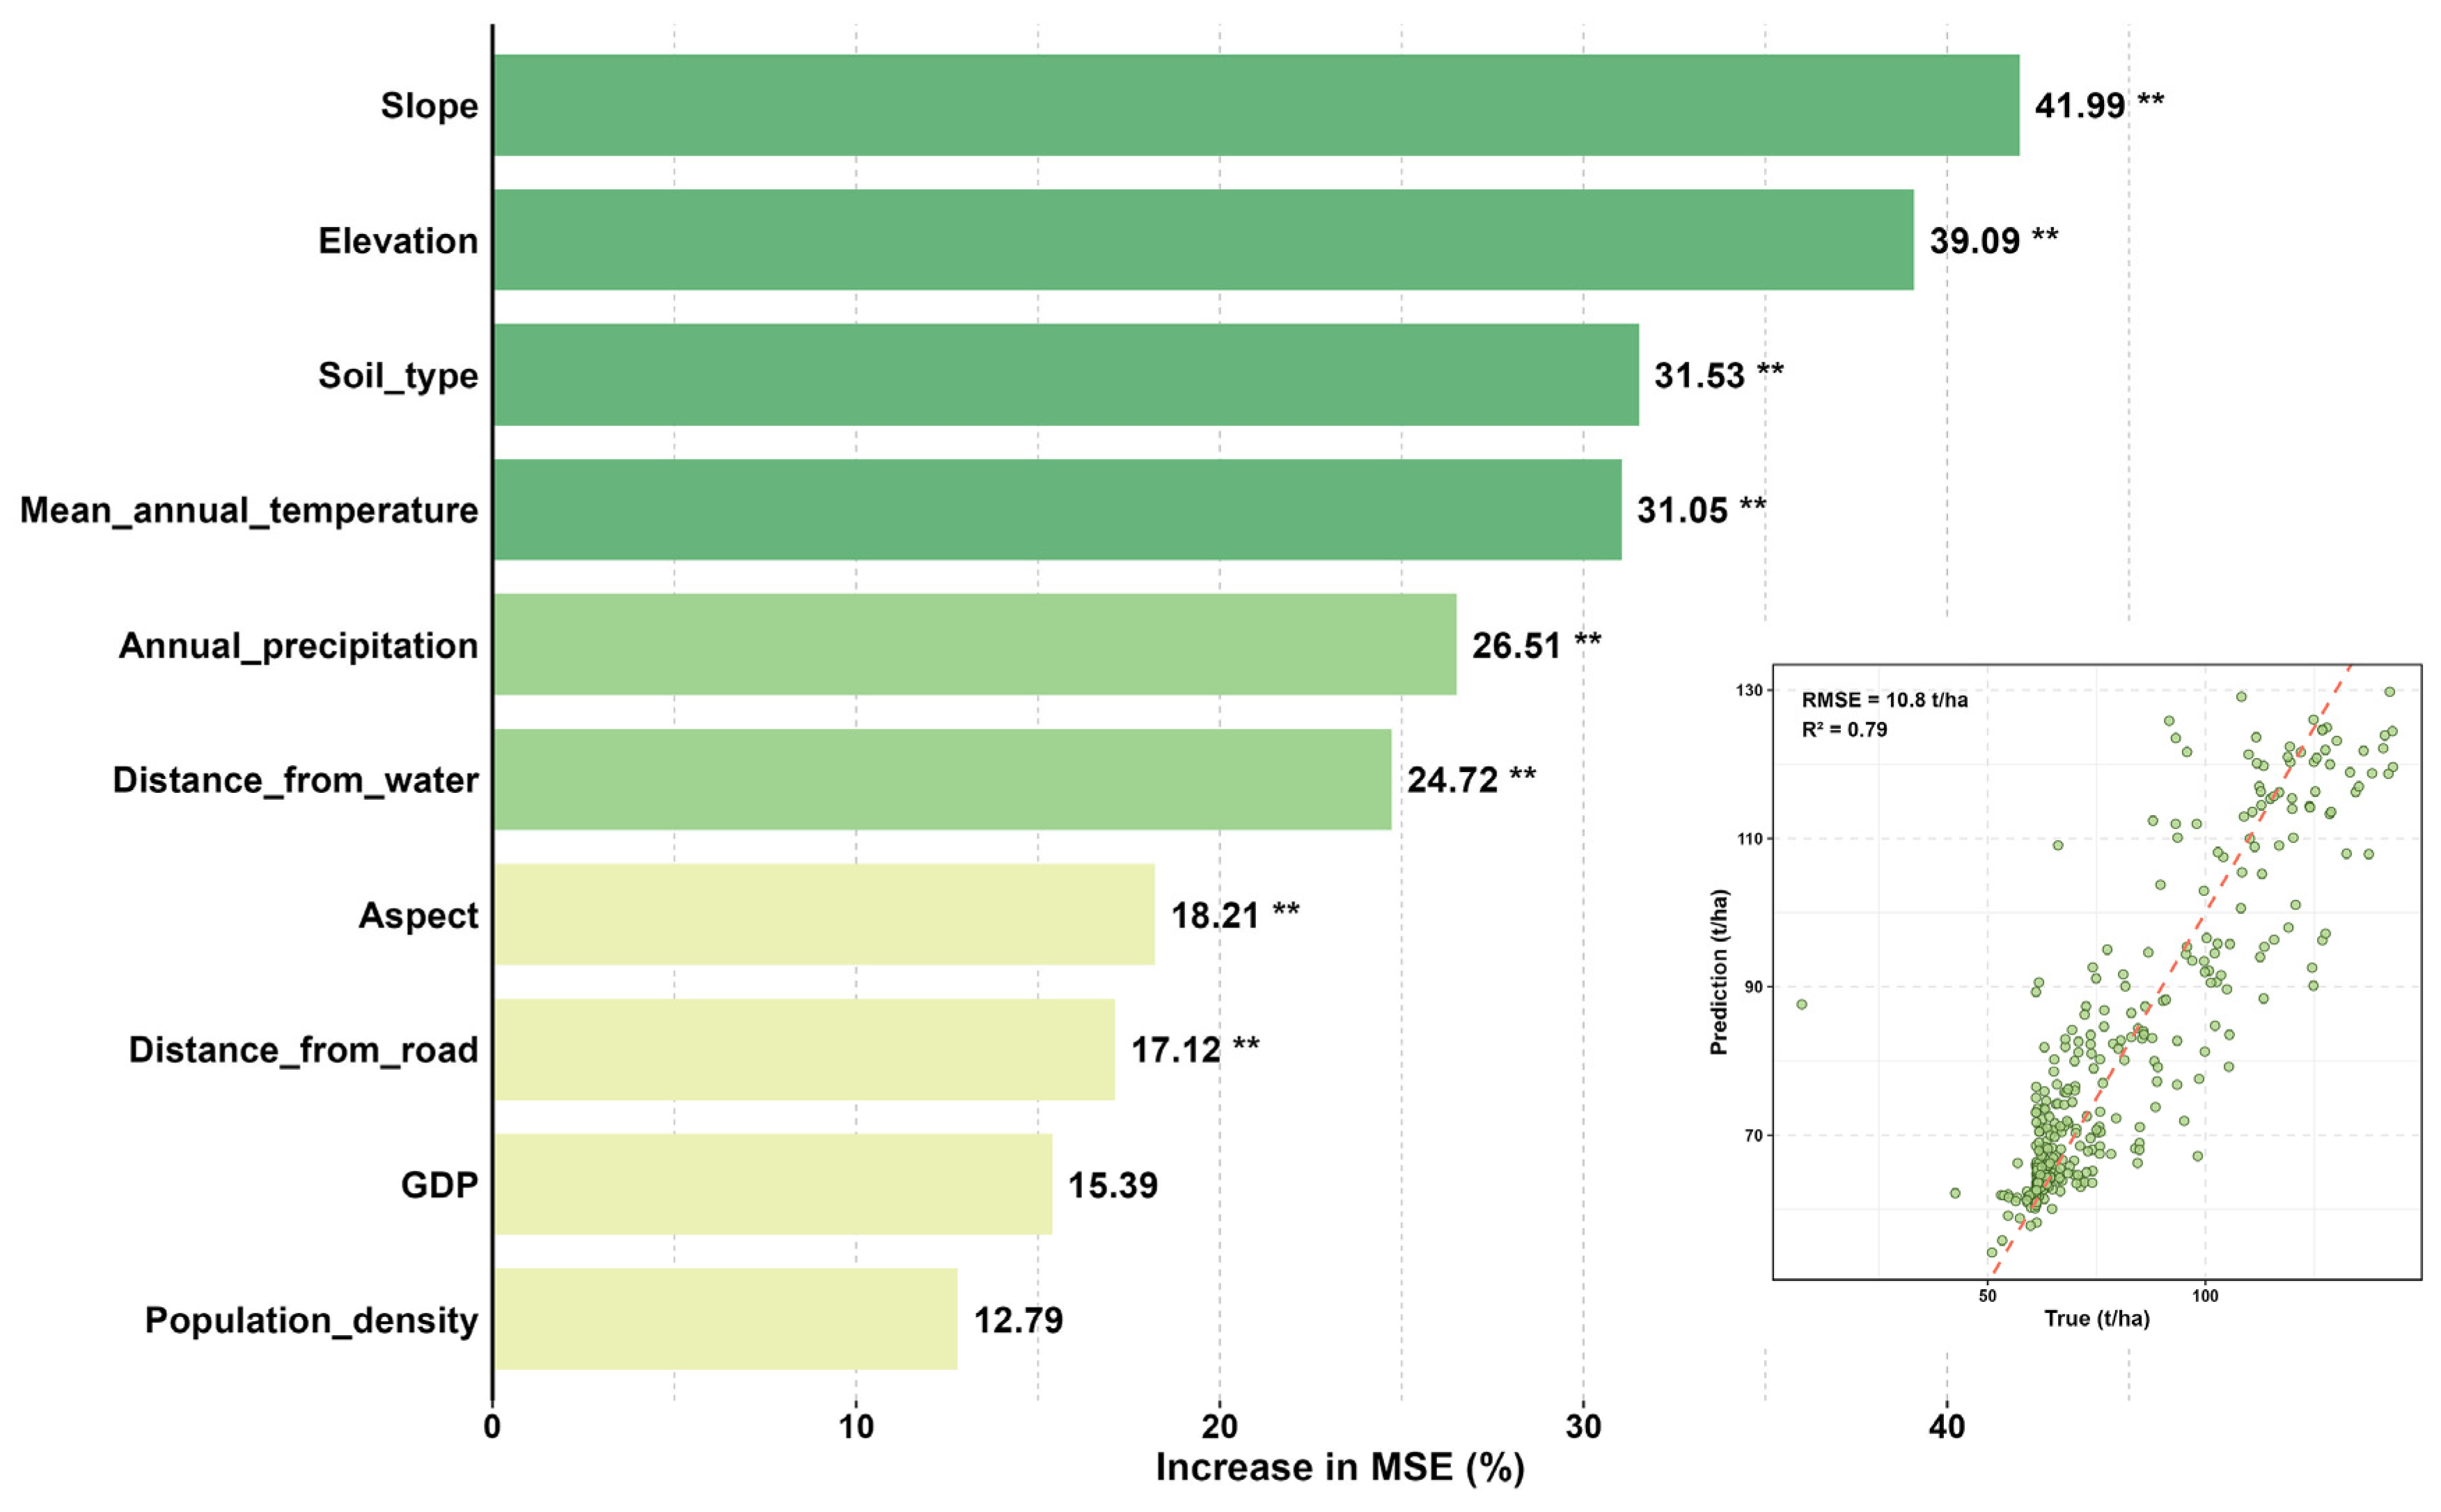
The data on carbon storage and all driving factors within the study area were extracted to this sampling grid. The dataset was exported from the sampling points and then randomly split into training and validation sets, with a split ratio of 7:3. We trained the RF model using the training set and ultimately evaluated the model’s accuracy using the validation set. As depicted in Figure 8, the R2 value of the RF model is 0.79, with the RMSE being 10.8 t/ha.
The feature importance scores of each influencing factor on carbon storage were ranked from highest to lowest, yielding the result shown in Figure 8. The RF model results indicate that the top four factors, in order of importance, are slope, elevation, soil type, and mean annual temperature, with respective importance values of 41.99% (p < 0.01), 39.09% (p < 0.01), 31.53% (p < 0.01), and 31.05% (p < 0.01). Additionally, factors with significance levels below 0.01 included annual precipitation (26.51%, p < 0.01), distance from water (24.72%, p < 0.01), aspect (18.21%, p < 0.01), and distance from roads (17.12%, p < 0.01). Although the feature importance scores of GDP and population density exceeded 10%, they failed to pass the significance test. In summary, both natural and socioeconomic factors jointly influence ecosystem carbon storage, with natural factors playing a dominant role.
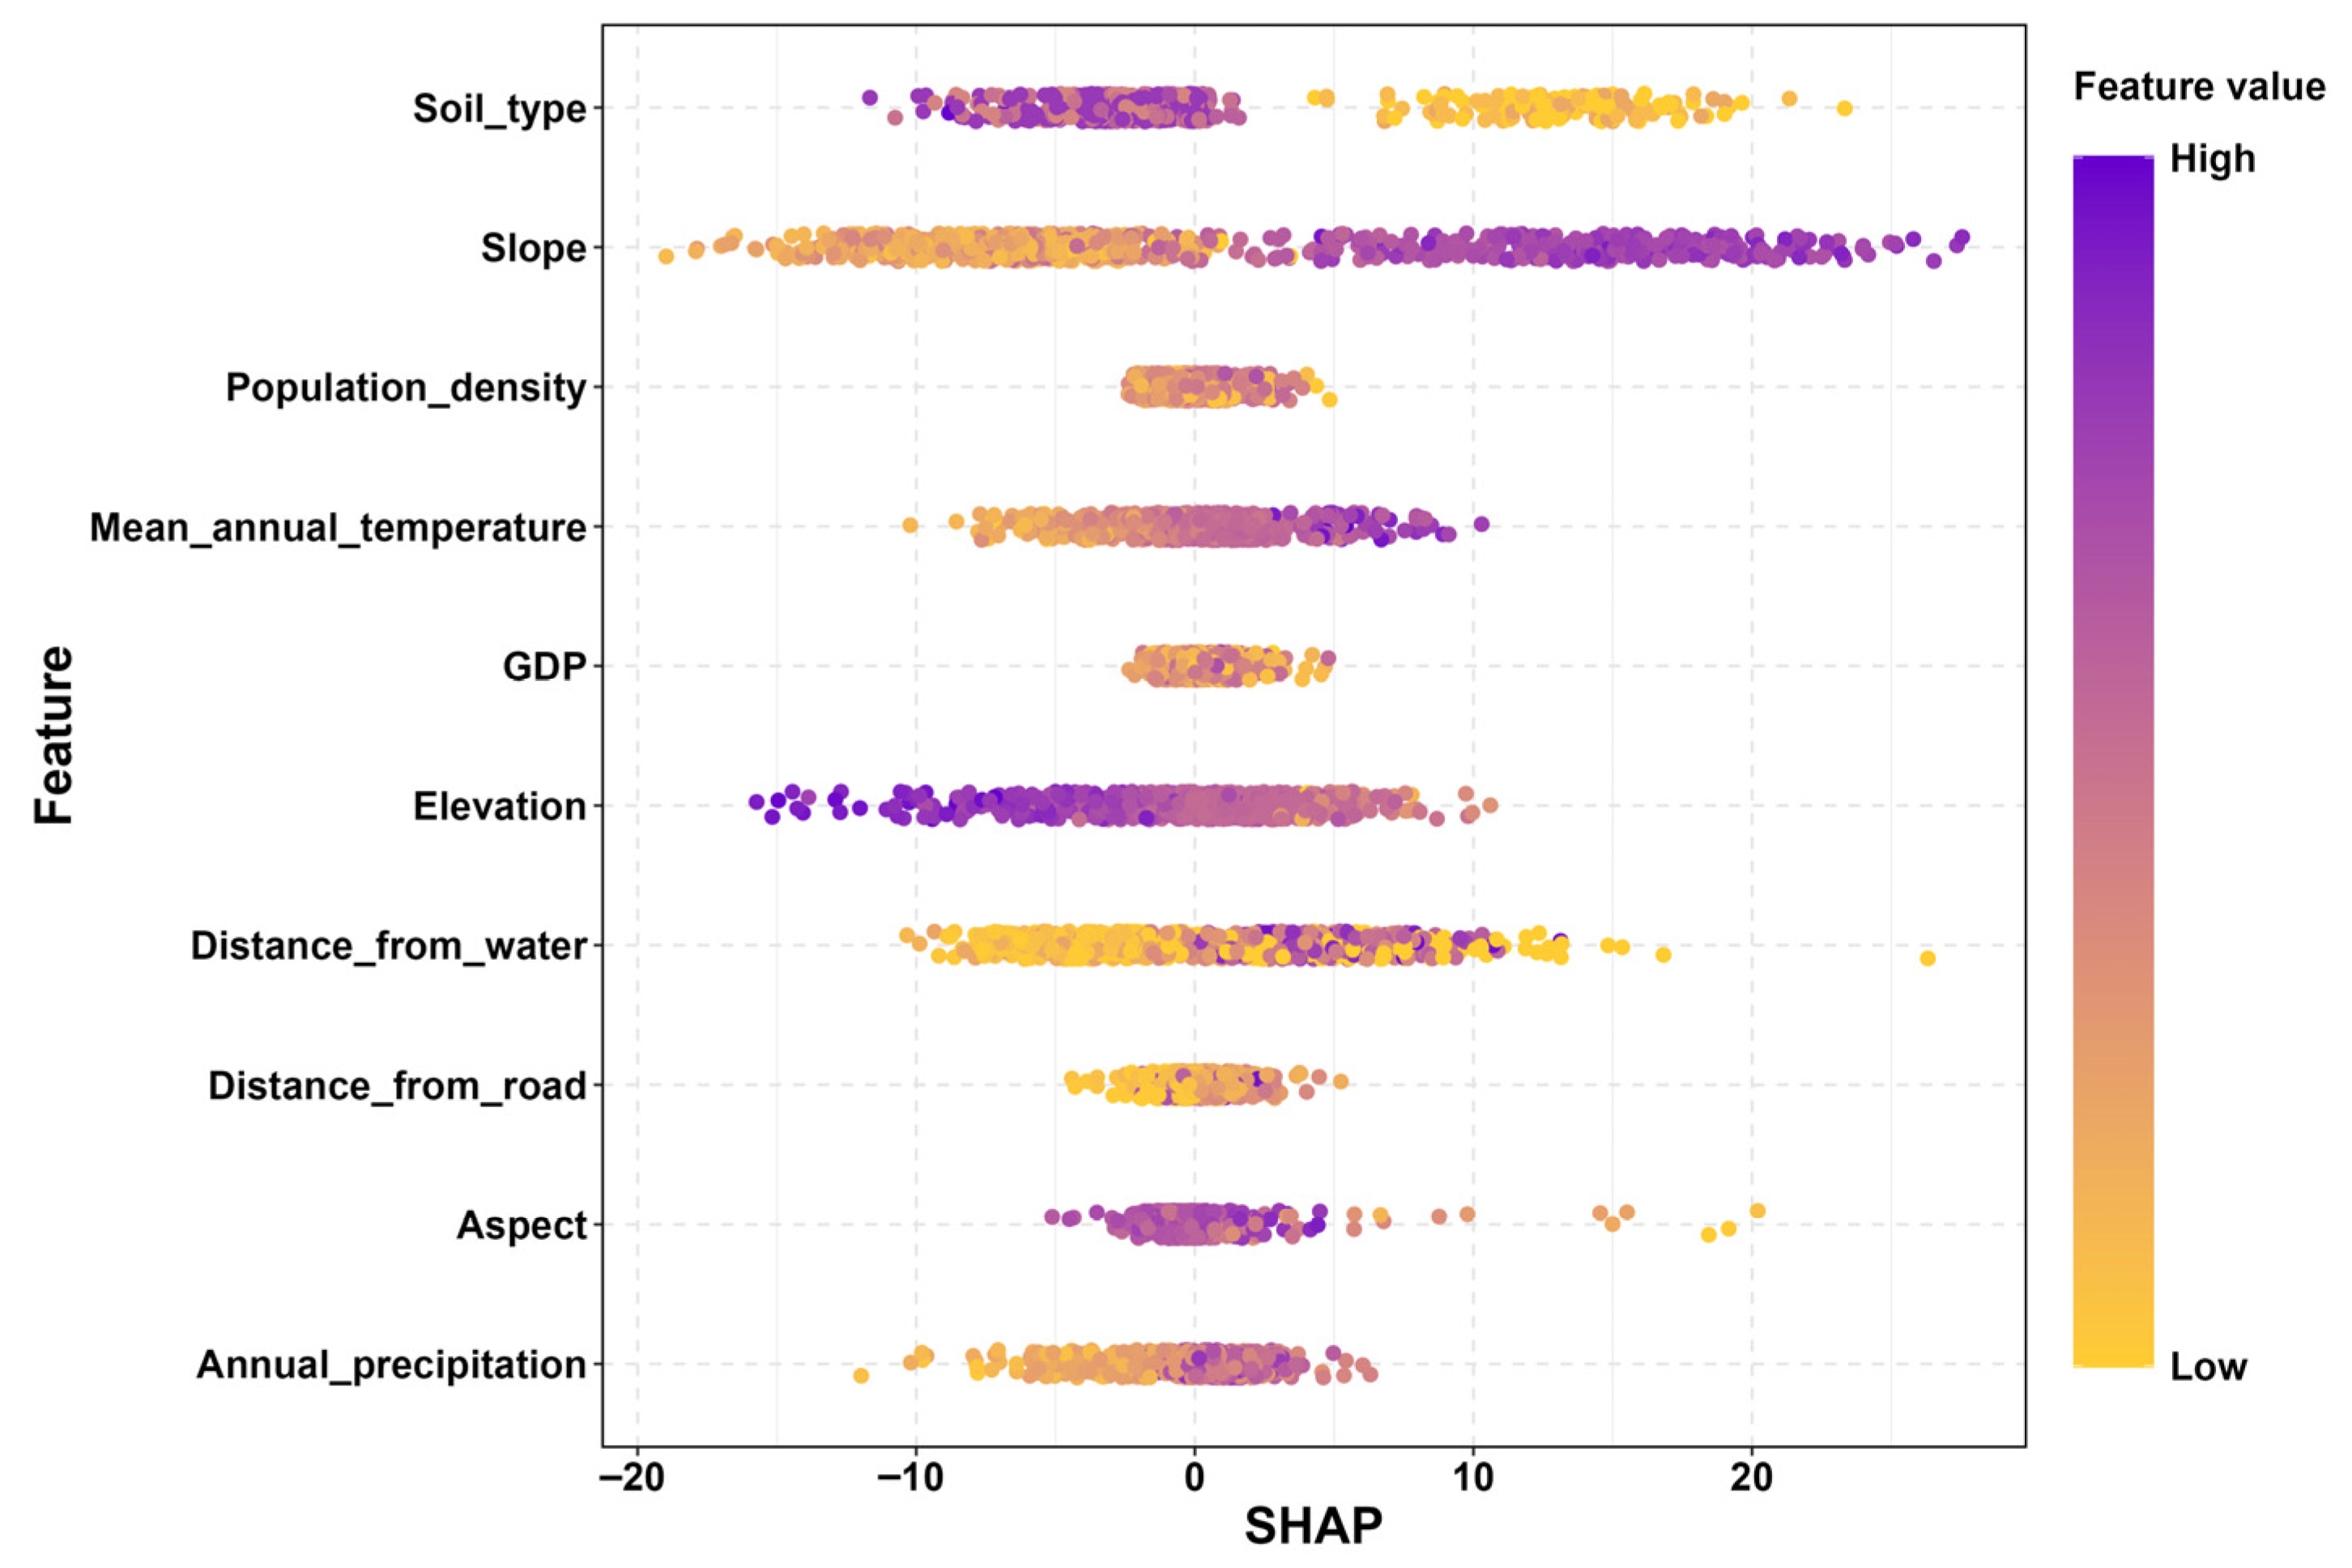
The SHAP value distribution plot illustrates the positive and negative effects of various influencing factors on carbon storage (Figure 9). The Random Forest model was used to identify four primary influencing factors. Among these factors, slope has a significant positive effect on carbon storage, while high-altitude regions have a marked negative effect on carbon storage. It is also worth noting that soil types with lower code numbers have a significant positive effect on carbon storage, such as brown earth, dark brown earth, and cinnamon. Finally, higher mean annual temperature has a significant positive effect on carbon storage.

4. Discussion

4.1. The Impact of Land Use Types on Carbon Storage

Carbon densities vary across different land use types, and land use changes profoundly impact ecosystem carbon storage, resulting in significant temporal dynamics and spatial variations in carbon storage [58]. Overall, the high-carbon areas in Zoige County are primarily concentrated in the northern and eastern mountainous regions, as well as the central area. The predominant land use types in these regions are forest and wetland, both of which possess high carbon sequestration capacity and constitute important components of terrestrial ecosystem carbon sinks [59,60]. The carbon storage hot spot clustering results of this study are similar to those reported by Xiang et al. [48] in western Sichuan, both showing that high carbon storage is significantly concentrated in the forest. We classify water and construction land as land use types with low carbon storage, consistent with the hypothesis proposed by Gao et al. [28]. Moreover, it should be noted that beyond coastal wetland ecosystem studies [61], research in the alpine region has relatively seldomly considered wetland as a distinct land use type separate from water to assess their contribution to carbon storage. However, considering the land use characteristics of Zoige County and the contribution of wetland to carbon storage, this study deems it necessary to account for wetland and utilize the carbon density data measured by the National Ecological Science Data Center in 2010 as a supplementary reference.
During the period from 1990 to 2020, the land use types in Zoige County generally shifted from wetland to grassland and forest. The land use transition matrix indicates that wetland primarily converted into grassland. This result is consistent with the findings of Li et al. [62], whose study found that comprehensive factors such as riverbed incisions and artificial drainage systems all influence the shrinkage of wetland area. Shen et al. [32] also noted that wetland areas experienced a significant decline between 2000 and 2015 due to human activities such as overgrazing, the expansion of cropland, and peat extraction. Meanwhile, the study highlighted the significant impact of artificial drainage channels on wetland reduction. Owing to the significantly lower carbon density of grassland compared to wetland, the total carbon density in the study area has markedly decreased. Guo et al. [63] also found in their study of the Zoige grassland wetland ecological functional zones, that between 2000 and 2020, approximately 6.0% of the area experienced a significant decline in carbon sink capacity. This decline included Zoige County, Hongyuan County, Aba County, and the surrounding areas of these three counties. From the perspective of historical policies, the carbon density in Zoige County during this period showed a trend of first decreasing and then increasing. The primary reasons for this phenomenon may be: from 2000 to 2010, the Zoige County government implemented drainage projects for irrigation channels. However, inadequate restoration efforts during the later stages of these projects led to a reduction in wetland area and a weakening of carbon sequestration capacity. Since implementation of the “Sichuan Provincial Wetland Protection Regulations” in 2010, wetland ecological restoration has been effectively advanced, gradually increasing the carbon storage potential of wetland ecosystems.

4.2. Multi-Scenario Prediction of Carbon Storage Analysis

According to the results of the PLUS multi-scenario simulation, carbon storage in the Zoige County will increase in all three scenarios by 2030 compared to 2020, particularly under the EPS. Under the EPS, carbon storage increases most significantly, consistent with the predicted findings for most regions [64,65]. However, under EPS, the decline in cropland in Zoige County is significantly greater than that driven by the NDS and EDS, consistent with the findings of Zhu et al. [66]. Under the assumptions of the EPS in this study, this result is caused by the high rate of cropland conversion out. To same extent, this warns us that future land planning needs to balance the relationship between the environment and population development. While pursuing ecological conservation, we must also consider the reduction in cropland area and the relationship between the population the land can support and the actual county population.
Under the NDS and EPS, the primary source of increased carbon storage stems from the conversion of grasslands into eastern forest and central wetland. The primary source of carbon storage reduction stems from grassland conversion to construction land and unused land. Jiang et al. [67] also noted in their scenario projections for the Yanqi Basin that the conversion of other land use types to construction land due to human activities will result in a reduction in carbon stored in plants and soil, thereby increasing greenhouse gas emissions. However, compared to the increase in carbon storage, this reduction is relatively minor in Zoige County, resulting in an overall trend of increasing carbon storage. Under the EDS, due to the demands of socioeconomic progress, portions of grassland have been converted into cropland, with a small amount transformed into construction land and unused land. The wetland areas have partially degraded into grassland, with their coverage further decreasing compared to 2020. The conversion of ecological land to non-ecological land results in the smallest increase in carbon storage under the EDS, which is consistent with findings from most studies examining economic development scenarios [68,69]. It should be noted that although the total carbon storage of the EDS is greater than that of 2020, future simulation projection indicates that the wetland area will continue to shrink. This does not align well with the strategic positioning of Zoige County as a western ecological barrier and a highland ecological functional zone, as outlined in the 14th Five-Year Plan for Ecological Environment Protection of Zoige County, nor with the wetland conservation policies. Compared to the other two scenarios, the EPS demonstrates more significant carbon storage growth due to its greater emphasis on protecting ecological land. The study by Li et al. [70] on the northeastern Qinghai–Tibet Plateau also concludes that, under the EP scenario, carbon storage increases are the largest, with the primary land use conversion occurring from cropland and unused land to forest, grassland, and wetland. In Zoige County, the primary land use change involves the conversion of grasslands into forests and wetlands. However, since both represent a shift from low-carbon-storage areas to high-carbon-storage areas, this results in the most significant increase in carbon storage under the EPS.
Although the total carbon storage and hot spot areas increased under both NDS and EPS, it must be noted that cold spot areas expanded in the transitional zone between the eastern plains and mountainous regions. Moreover, this region also exhibits a slight increase in cold spot areas under the EDS. The expansion of cold spots within the study area signals ecosystem degradation, indicating that carbon sequestration capacity is declining further in areas surrounding the zone with low carbon storage. This will create a larger area of ecologically fragile regions, weakening the carbon sink function of the study area. This study suggests that this area is a key region requiring focused attention for promoting future total carbon storage growth in Zoige County. To ensure the healthy development of carbon sequestration functions in this region, we need to prioritize targeted ecological interventions and management in this cold spot area during land use planning. This will enhance its carbon sequestration capacity while preventing further depletion of carbon storage in surrounding areas.

4.3. Analysis of Driving Factors for Carbon Storage

The feature importance derived from the Random Forest model indicates that carbon storage in Zoige County is primarily influenced by four factors: slope, elevation, soil type, and mean annual temperature. Moreover, natural factors exert a dominant influence on carbon storage, consistent with findings from relevant studies on the Tibetan Plateau region [23]. Based on the results of the SHAP analysis, we analyzed the positive and negative effects of the key factors influencing carbon storage. The slope exerts a significant influence on plant community structure and soil properties [71], thereby regulating the distribution of carbon storage. The carbon storage in Zoige County is concentrated in the eastern areas with steeper slopes. Similarly, studies investigating forest ecosystems have found that soil organic carbon content is positively correlated with slope [72]. This may be because changes in slope modulate solar radiation, thereby reducing soil temperature and promoting the accumulation of soil organic carbon. Additionally, the high carbon areas are concentrated in the low-altitude region with forest cover. The elevation influences total carbon storage through its effects on temperature, precipitation, and vegetation composition, while also exerting some influence on the composition ratios of the aboveground carbon pool and underground carbon pool [73]. The high carbon storage areas in Zoige County primarily feature three soil types: brown earth, dark brown earth, and cinnamon soil. D. Balasubramanian et al. [74] also noted in their study of the grassland regions in southwest China that brown earth possesses high soil carbon storage, which is thought to be related to factors such as topographic conditions and functional composition of these soils. Although high temperature can lead to a reduction in soil carbon storage [75], studies in alpine regions indicate that warming can promote an increase in plant community height, thereby enhancing ecosystem net productivity [76]. This may partly explain why the hot spots of carbon storage in Zoige County are primarily concentrated in warmer areas.

4.4. Policy Recommendations and Research Limitations

As a crucial ecological function zone at the edge of the Qinghai–Tibet Plateau, Zoige County possesses extensive wetlands with exceptional carbon sequestration capacity. The ecological fragility and carbon storage potential of this region have drawn significant attention. Over the past three decades, Sichuan Province has implemented a series of ecological projects in Zoige County, including wetland conservation and restoration, as well as the establishment of nature reserves. Based on the historical policies and current land use patterns in the study area, the research concludes that the EPS is more aligned with the sustainable development objectives of Zoige County and future prospects for leveraging wetland carbon sinks. Furthermore, it must be recognized that the maximum growth potential of carbon storage under the EPS in this study is essentially theoretical, constrained by the a priori rule set and cost matrix preset within the PLUS model. In practical implementation, complex real-world factors such as the economic viability of ecological protection measures and associated socioeconomic opportunity costs must also be taken into account. Consequently, while the EPS illustrates the upper boundary of carbon storage potential and provides a theoretical feasibility reference for development pathways, translating this scenario into actual land use policy necessitates a more comprehensive assessment that extends beyond the scope of the present model.
Additionally, carbon storage exhibits extreme sensitivity to topography-dependent temperature changes, necessitating that land-use planning account for multiple factors including topography and temperature. To counter the projected expansion of cold spots under forecast scenarios, precise management measures must be implemented to prevent declines in carbon storage. Moreover, it is essential to strictly adhere to the ecological conservation redline, promote the adoption of green development patterns and lifestyles, and achieve the sustainable development of plateau wetlands.
It should be noted that this study has certain limitations. Firstly, in the carbon density data used by this study, the values for the four components constituting the total carbon storage have not been directly measured. Instead, they were obtained by adjusting existing research findings using modified formulas. Secondly, this study assumes that carbon storage for each land use type remains stable over different time periods. However, in reality, carbon density values fluctuate due to various factors, including natural environmental conditions and socioeconomic factors. For instance, the influence of microtopographic factors on aboveground carbon storage could be taken into account in future research. Finally, the model oversimplifies the calculation process for carbon storage by ignoring internal variations within the same land use type. Considering the above issues and the resolution limitation of the driving factors, the carbon storage distribution shown in the experimental results for Zoige County represents only a preliminary rough estimate, intended to provide a reference for subsequent research. In subsequent studies, multi-scale field measurements of carbon storage in the study area can be conducted to enhance data accuracy and validate model calculations. Meanwhile, secondary classification can be applied to key land use types, refining carbon density values within different land use types to reduce errors caused by heterogeneity. Finally, future research could incorporate climate scenario data to address the need for integrated assessments under the combined effects of climate change and policy interventions.

5. Conclusions

This study analyzed historical land use data using the PLUS-InVEST model and found that, over the past three decades, carbon storage trends have followed a pattern of initial decline followed by increase. Among the three projected scenarios, the EPS exhibits the most significant theoretical increase in carbon storage. Therefore, this study concludes that the EPS better aligns with the carbon storage development prospects in this region. Simultaneously, the plain–mountain transition zone represents the most vulnerable segment within the current ecological security framework. Future ecological compensation efforts should not only focus on core wetlands but also implement targeted restoration or refined management measures in these peripheral transition areas. Finally, carbon storage exhibits extreme sensitivity to topography-dependent warming. Land-use planning must strictly adhere to the carrying capacity thresholds of topographic gradients, avoiding intensive development in climatically sensitive high-altitude areas. Follow-up studies may conduct field measurements of carbon storage within the study area to evaluate model accuracy. Furthermore, secondary classification of key land use types in important regions could enhance prediction precision.

Author Contributions

X.L. (Xingyue Lan): Writing—original draft, Visualization, Methodology, Investigation. Z.H.: Writing—original draft, Visualization, Methodology, Investigation. J.W. (Jiaoling Wu): Methodology, Data Curation, Software. H.D.: Methodology, Visualization, Software. L.C.: Software, Visualization, Conceptualization. J.W. (Junhao Wu): Visualization, Software, Data Curation. J.P.: Visualization, Methodology, Software. K.Z.: Supervision; Conceptualization; Methodology. G.H.: Writing—Review and Editing; Supervision; Conceptualization. X.L. (Xianwei Li): Project administration; Supervision; Conceptualization. All authors have read and agreed to the published version of the manuscript.

Funding

This study was supported by the Sichuan Provincial Forestry and Grassland Survey and Planning Institute Project: “Research on the Calculation and Application of Ecosystem Service Values for Forest, Grassland, and Wetland in Sichuan Province” (2122339012) and the World Bank Loan Project for the Restoration of Forest Ecosystem in the Upper Yangtze River Basin (2122339006), a free exploration project of the dual support plan for discipline construction of Sichuan Agricultural University (2024ZYTS014).

Data Availability Statement

The raw data supporting the conclusions of this article will be made available by the authors on request.

Conflicts of Interest

The authors declare no conflicts of interest.

Appendix A

Table A1. Neighborhood weight values for different land use types in 2030.
CroplandForestShrubGrasslandWaterSnowUnused LandConstruction LandWetland
0.050.30.050.80.010.010.010.010.95
Table A2. Supplementary explanation of parameters for the PLUS model (Version 1.40).
ModuleParameterValue
LEASNumber of regression tree20
Sampling rate0.01
CARSConversion constraintWater area
Patch generation threshold0.2
Expansion coefficient0.1
Neighborhood size3
Table A3. Land use transition matrix from 1990 to 2020 (km2).
CroplandForestShrubGrasslandWaterSnowUnused LandConstruction LandWetlandTotal Area in 1990
Cropland22.534.82025.660.380004.4357.82
Forest0.641469.6925.015.5100000.141500.99
Shrub0.0154.7166.8231.9600000.15153.65
Grassland6.9188.0820.897550.8612.1901.04077.477857.44
Water0.040.4706.0434.3100.2900.6941.84
Snow0000000000
Unused Land0000.510.4500.12001.08
Construction land00000000.2500.25
Wetland2.4338.960.04335.165.28000330.43712.29
Total area in 202032.541756.73112.767955.7152.6101.460.26413.310325.36
Note: Columns correspond to the initial land use types, and rows correspond to the final simulated land use types.
Table A4. Changes in area of different land use types under three scenarios from 2020 to 2030 (km2).
LUCCArea Changes
Natural Development Scenario (NDS)Economic Development Scenario (EDS)Ecological Protection Scenario (EPS)
Cropland−1.3215.69−4.29
Forest103.51103.51110.64
Shrub−9.31−9.582.14
Grassland−252.9−94.25−301.91
Water0.020.280.2
Snow000
Unused Land0.540.54−0.35
Construction land0−0.04−0.05
Wetland159.46−16.14193.63
Table A5. Overview of carbon storage changes: 1990–2020 and multi-scenario projection for 2020–2030.
PeriodAreal Percentage (%)
IncreaseRemained StableDecrease
1990–2020 3.9291.764.32
2020–2030 (NDS)2.5597.450.01
2020–2030 (EDS)1.1598.680.16
2020–2030 (EPS)3.1496.770.09
Table A6. Global Moran’s I and Getis–Ord General G.
YearIgGeneral G
20200.80 (p < 0.001)0.001 (p < 0.001)
2030 (NDS)0.78 (p < 0.001)0.001 (p < 0.001)
2030 (EDS)0.80 (p < 0.001)0.001 (p < 0.001)
2030 (EPS)0.78 (p < 0.001)0.001 (p < 0.001)

References

  1. Shi, K.; Yu, B.; Zhou, Y.; Chen, Y.; Yang, C.; Chen, Z.; Wu, J. Spatiotemporal Variations of CO2 Emissions and Their Impact Factors in China: A Comparative Analysis between the Provincial and Prefectural Levels. Appl. Energy 2019, 233–234, 170–181. [Google Scholar] [CrossRef] [Scilit]
  2. Pecl, G.T.; Araujo, M.B.; Bell, J.D.; Blanchard, J.; Bonebrake, T.C.; Chen, I.-C.; Clark, T.D.; Colwell, R.K.; Danielsen, F.; Evengard, B.; et al. Biodiversity Redistribution under Climate Change: Impacts on Ecosystems and Human Well-Being. Science 2017, 355, eaai9214. [Google Scholar] [CrossRef] [Scilit]
  3. Urban, M.C. Accelerating Extinction Risk from Climate Change. Science 2015, 348, 571–573. [Google Scholar] [CrossRef] [Scilit] [PubMed]
  4. Schuur, E.A.G.; McGuire, A.D.; Schaedel, C.; Grosse, G.; Harden, J.W.; Hayes, D.J.; Hugelius, G.; Koven, C.D.; Kuhry, P.; Lawrence, D.M.; et al. Climate Change and the Permafrost Carbon Feedback. Nature 2015, 520, 171–179. [Google Scholar] [CrossRef] [Scilit] [PubMed]
  5. Piao, S.; He, Y.; Wang, X.; Chen, F. Estimation of China’s Terrestrial Ecosystem Carbon Sink: Methods, Progress and Prospects. Sci. China-Earth Sci. 2022, 65, 641–651. [Google Scholar] [CrossRef] [Scilit]
  6. Wang, N.; Chen, X.; Zhang, Z.; Pang, J. Spatiotemporal Dynamics and Driving Factors of County-Level Carbon Storage in the Loess Plateau: A Case Study in Qingcheng County, China. Ecol. Indic. 2022, 144, 109460. [Google Scholar] [CrossRef] [Scilit]
  7. Fu, K.; Chen, L.; Yu, X.; Jia, G. How Has Carbon Storage Changed in the Yili-Tianshan Region over the Past Three Decades and into the Future? What Has Driven It to Change? Sci. Total Environ. 2024, 945, 174005. [Google Scholar] [CrossRef] [Scilit] [PubMed]
  8. Houghton, R.A. Counting Terrestrial Sources and Sinks of Carbon. Clim. Change 2001, 48, 525–534. [Google Scholar] [CrossRef] [Scilit]
  9. Sun, W.; Liu, X. Review on Carbon Storage Estimation of Forest Ecosystem and Applications in China. For. Ecosyst. 2019, 7, 4. [Google Scholar] [CrossRef] [Scilit]
  10. Zhao, M.; Yue, T.; Zhao, N.; Sun, X.; Zhang, X. Combining LPJ-GUESS and HASM to Simulate the Spatial Distribution of Forest Vegetation Carbon Stock in China. J. Geogr. Sci. 2014, 24, 249–268. [Google Scholar] [CrossRef] [Scilit]
  11. Li, P.; Chen, J.; Li, Y.; Wu, W. Using the InVEST-PLUS Model to Predict and Analyze the Pattern of Ecosystem Carbon Storage in Liaoning Province, China. Remote Sens. 2023, 15, 4050. [Google Scholar] [CrossRef] [Scilit]
  12. Zafar, Z.; Zubair, M.; Zha, Y.; Mehmood, M.S.; Rehman, A.; Fahd, S.; Nadeem, A.A. Predictive Modeling of Regional Carbon Storage Dynamics in Response to Land Use/Land Cover Changes: An InVEST-Based Analysis. Ecol. Inform. 2024, 82, 102701. [Google Scholar] [CrossRef] [Scilit]
  13. Garcia-Ontiyuelo, M.; Acuna-Alonso, C.; Valero, E.; Alvarez, X. Geospatial Mapping of Carbon Estimates for Forested Areas Using the InVEST Model and Sentinel-2: A Case Study in Galicia (NW Spain). Sci. Total Environ. 2024, 922, 171297. [Google Scholar] [CrossRef] [Scilit]
  14. Zhao, H.; Yang, C.; Lu, M.; Wang, L.; Guo, B. Patterns and Dominant Driving Factors of Carbon Storage Changes in the Qinghai-Tibet Plateau under Multiple Land Use Change Scenarios. Forests 2024, 15, 418. [Google Scholar] [CrossRef] [Scilit]
  15. Chen, X.; Yu, L.; Hou, S.; Liu, T.; Li, X.; Li, Y.; Du, Z.; Li, C.; Wu, H.; Gao, G.; et al. Unraveling Carbon Stock Dynamics and Their Determinants in China’s Loess Plateau over the Past 40 Years. Ecol. Indic. 2024, 159, 111760. [Google Scholar] [CrossRef] [Scilit]
  16. Verma, P.; Siddiqui, A.R.; Mourya, N.K.; Devi, A.R. Forest Carbon Sequestration Mapping and Economic Quantification Infusing MLPnn-Markov Chain and InVEST Carbon Model in Askot Wildlife Sanctuary, Western Himalaya. Ecol. Inform. 2024, 79, 102428. [Google Scholar] [CrossRef] [Scilit]
  17. Chang, X.; Xing, Y.; Wang, J.; Yang, H.; Gong, W. Effects of Land Use and Cover Change (LUCC) on Terrestrial Carbon Stocks in China between 2000 and 2018. Resour. Conserv. Recycl. 2022, 182, 106333. [Google Scholar] [CrossRef] [Scilit]
  18. Park, M.; Lee, J.; Won, J. Navigating Urban Sustainability: Urban Planning and the Predictive Analysis of Busan’s Green Area Dynamics Using the CA-ANN Model. Forests 2024, 15, 1681. [Google Scholar] [CrossRef] [Scilit]
  19. Lai, J.; Qi, S.; Chen, J.; Guo, J.; Wu, H.; Chen, Y. Exploring the Spatiotemporal Variation of Carbon Storage on Hainan Island and Its Driving Factors: Insights from InVEST, FLUS Models, and Machine Learning. Ecol. Indic. 2025, 172, 113236. [Google Scholar] [CrossRef] [Scilit]
  20. Liu, G.; Jin, Q.; Li, J.; Li, L.; He, C.; Huang, Y.; Yao, Y. Policy Factors Impact Analysis Based on Remote Sensing Data and the CLUE-S Model in the Lijiang River Basin, China. Catena 2017, 158, 286–297. [Google Scholar] [CrossRef] [Scilit]
  21. Liang, X.; Guan, Q.; Clarke, K.C.; Liu, S.; Wang, B.; Yao, Y. Understanding the Drivers of Sustainable Land Expansion Using a Patch-Generating Land Use Simulation (PLUS) Model: A Case Study in Wuhan, China. Comput. Environ. Urban Syst. 2021, 85, 101569. [Google Scholar] [CrossRef] [Scilit]
  22. Zeng, X.; Huang, Y.; Xie, H.; Ma, Q.; Li, J. Impacts of Land Use and Land Cover Change on the Landscape Pattern and Ecosystem Services in the Poyang Lake Basin, China. Landsc. Ecol. 2024, 39, 183. [Google Scholar] [CrossRef] [Scilit]
  23. Li, H.; Zhang, K.; Liu, Y.; Qin, Y.; Wang, W.; Wang, M.; Liu, Y.; Li, Y. Spatiotemporal Evolution of Land Use and Carbon Storage in China: Multi-Scenario Simulation and Driving Factor Analysis Based on the PLUS-InVEST Model and SHAP. Environ. Res. 2025, 279, 121860. [Google Scholar] [CrossRef] [Scilit]
  24. Wang, Y.; Wang, M.; Zhang, J.; Wu, Y.; Zhou, Y. Assessment of Carbon Stocks and Influencing Factors in Terrestrial Ecosystems Based on Surface Area. iScience 2024, 27, 111431. [Google Scholar] [CrossRef] [Scilit]
  25. Liu, W.; Liu, D.; Liu, Y. Spatially Heterogeneous Response of Carbon Storage to Land Use Changes in Pearl River Delta Urban Agglomeration, China. Chin. Geogr. Sci. 2023, 33, 271–286. [Google Scholar] [CrossRef] [Scilit]
  26. Breiman, L. Statistical Modeling: The Two Cultures. Stat. Sci. 2001, 16, 199–215. [Google Scholar] [CrossRef] [Scilit]
  27. Liu, Y.; Zhao, M. Coupling Coordination between Carbon Storage Protection in Alpine Wetlands and SDGs: A Case Study of the Qinghai-Tibet Plateau, China. J. Clean. Prod. 2024, 483, 144260. [Google Scholar] [CrossRef] [Scilit]
  28. Gao, M.; Xu, R.; Huang, J.; Su, B.; Jiang, S.; Shi, P.; Yang, H.; Xing, Y.; Wang, D.; Jiang, H.; et al. Increase of Carbon Storage in the Qinghai-Tibet Plateau: Perspective from Land-Use Change under Global Warming. J. Clean. Prod. 2023, 414, 137540. [Google Scholar] [CrossRef] [Scilit]
  29. Qu, R.; He, L.; He, Z.; Wang, B.; Lyu, P.; Wang, J.; Kang, G.; Bai, W. A Study of Carbon Stock Changes in the Alpine Grassland Ecosystem of Zoige, China, 2000–2020. Land 2022, 11, 1232. [Google Scholar] [CrossRef] [Scilit]
  30. Feng, X.; Wang, Z.; Zhang, Z.; Zhang, J.; Zeng, Q.; Tian, D.; Li, C.; Jiang, L.; Wang, Y.; Yuan, B.; et al. Temporal and Spatial Changes and Driving Forces of Carbon Stocks and Net Ecosystem Productivity: A Case Study of Zoige County, Sichuan Province, China. J. Indian Soc. Remote Sens. 2024, 52, 1737–1749. [Google Scholar] [CrossRef] [Scilit]
  31. Tu, M.; Lu, H.; Shang, M. Monitoring Grassland Desertification in Zoige County Using Landsat and UAV Image. Pol. J. Environ. Stud. 2021, 30, 5789–5799. [Google Scholar] [CrossRef] [Scilit]
  32. Shen, G.; Yang, X.; Jin, Y.; Luo, S.; Xu, B.; Zhou, Q. Land Use Changes in the Zoige Plateau Based on the Object-Oriented Method and Their Effects on Landscape Patterns. Remote Sens. 2020, 12, 14. [Google Scholar] [CrossRef] [Scilit]
  33. Yang, J.; Huang, X. The 30 m Annual Land Cover Dataset and Its Dynamics in China from 1990 to 2019. Earth Syst. Sci. Data 2021, 13, 3907–3925. [Google Scholar] [CrossRef] [Scilit]
  34. Wang, H.; Wu, L.; Yue, Y.; Jin, Y.; Zhang, B. Impacts of Climate and Land Use Change on Terrestrial Carbon Storage: A Multi-Scenario Case Study in the Yellow River Basin (1992–2050). Sci. Total Environ. 2024, 930, 172557. [Google Scholar] [CrossRef] [Scilit]
  35. Zhou, X.; Wang, J.; Tang, L.; He, W.; Li, H. Impact of Land Use Change on Carbon Storage Dynamics in the Lijiang River Basin, China: A Complex Network Model Approach. Land 2025, 14, 1042. [Google Scholar] [CrossRef] [Scilit]
  36. Sun, B.; Du, J.; Chong, F.; Li, L.; Zhu, X.; Zhai, G.; Song, Z.; Mao, J. Spatio-Temporal Variation and Prediction of Carbon Storage in Terrestrial Ecosystems in the Yellow River Basin. Remote Sens. 2023, 15, 3866. [Google Scholar] [CrossRef] [Scilit]
  37. Xu, C.; Zhang, Q.; Yu, Q.; Wang, J.; Wang, F.; Qiu, S.; Ai, M.; Zhao, J. Effects of Land Use/Cover Change on Carbon Storage between 2000 and 2040 in the Yellow River Basin, China. Ecol. Indic. 2023, 151, 110345. [Google Scholar] [CrossRef] [Scilit]
  38. Zhang, K.; Fang, B.; Zhang, Z.; Liu, T.; Liu, K. Exploring Future Ecosystem Service Changes and Key Contributing Factors from a “Past-Future-Action” Perspective: A Case Study of the Yellow River Basin. Sci. Total Environ. 2024, 926, 171630. [Google Scholar] [CrossRef] [Scilit]
  39. Alam, S.A.; Starr, M.; Clark, B.J.F. Tree Biomass and Soil Organic Carbon Densities across the Sudanese Woodland Savannah: A Regional Carbon Sequestration Study. J. Arid Environ. 2013, 89, 67–76. [Google Scholar] [CrossRef] [Scilit]
  40. Chen, G.S.; Yang, Y.S.; Liu, L.Z.; Li, X.B.; Zhao, Y.C.; Yuan, Y.D. Research Progress on Subtropical Resources and Environment (TBCA) in Forests. J. Subtrop. Resour. Environ. 2007, 8, 34–42. [Google Scholar] [CrossRef]
  41. Zhou, J.; Zhao, Y.; Huang, P.; Zhao, X.; Feng, W.; Li, Q.; Xue, D.; Dou, J.; Shi, W.; Wei, W.; et al. Impacts of Ecological Restoration Projects on the Ecosystem Carbon Storage of Inland River Basin in Arid Area, China. Ecol. Indic. 2020, 118, 106803. [Google Scholar] [CrossRef] [Scilit]
  42. Wu, X.; Shen, C.; Shi, L.; Wan, Y.; Ding, J.; Wen, Q. Spatio-Temporal Evolution Characteristics and Simulation Prediction of Carbon Storage: A Case Study in Sanjiangyuan Area, China. Ecol. Inform. 2024, 80, 102485. [Google Scholar] [CrossRef] [Scilit]
  43. Xu, L.; He, N.P.; Yu, G.R. A dataset of carbon density in Chinese terrestrial ecosystems (2010s). China Sci. Data 2019, 4, 90–96. [Google Scholar] [CrossRef] [Scilit]
  44. Zhou, H.; Tang, M.; Huang, J.; Zhang, J.; Huang, J.; Zhao, H.; Yu, Y. Instability and Uncertainty of Carbon Storage in Karst Regions under Land Use Change: A Case Study in Guiyang, China. Front. Environ. Sci. 2025, 13, 1551050. [Google Scholar] [CrossRef] [Scilit]
  45. Qiu, Z.; Gong, D.; Zhao, M.; Dong, D. Spatiotemporal Dynamics and Driving Mechanisms of Soil Conservation Services (SCS) in Zhejiang Province, China: Insights from InVEST Modeling and Machine Learning. Remote Sens. 2025, 17, 2865. [Google Scholar] [CrossRef] [Scilit]
  46. Gao, M.-N.; Hu, Y.-X.; Shang, G.-F.; Li, W. Research on the Impact of Spatial and Temporal Changes in Ecological Product Value in Hebei Province Based on Land Use Changes. Sci. Rep. 2025, 15, 9571. [Google Scholar] [CrossRef] [Scilit] [PubMed]
  47. Xu, J.; Jiao, A.; Deng, M.; Ling, H. Changes in Ecosystem Carbon Sequestration and Influencing Factors from a “Past-Future” Perspective: A Case Study of the Tarim River. Ecol. Indic. 2024, 169, 112861. [Google Scholar] [CrossRef] [Scilit]
  48. Xiang, M.; Wang, C.; Tan, Y.; Yang, J.; Duan, L.; Fang, Y.; Li, W.; Shu, Y.; Liu, M. Spatio-Temporal Evolution and Driving Factors of Carbon Storage in the Western Sichuan Plateau. Sci. Rep. 2022, 12, 8114. [Google Scholar] [CrossRef] [Scilit]
  49. Meng, Y.; Yang, M.; Liu, S.; Mou, Y.; Peng, C.; Zhou, X. Quantitative Assessment of the Importance of Bio-Physical Drivers of Land Cover Change Based on a Random Forest Method. Ecol. Inform. 2021, 61, 101204. [Google Scholar] [CrossRef] [Scilit]
  50. Tang, Z.; Mei, Z.; Liu, W.; Xia, Y. Identification of the Key Factors Affecting Chinese Carbon Intensity and Their Historical Trends Using Random Forest Algorithm. J. Geogr. Sci. 2020, 30, 743–756. [Google Scholar] [CrossRef] [Scilit]
  51. Zhang, M.; Chen, A.; Xing, X.; Yang, D.; Wang, Z.; Yang, X. Changes in Grassland Types Caused by Climate Change and Anthropogenic Activities Have Increased Carbon Storage in Alpine Grassland Ecosystem. Glob. Planet. Change 2025, 250, 104803. [Google Scholar] [CrossRef] [Scilit]
  52. R Core Team. R: A Language and Environment for Statistical Computing; R Foundation for Statistical Computing: Vienna, Austria, 2022; Available online: https://www.R-project.org/ (accessed on 9 October 2025).
  53. Kuhn, M. Building Predictive Models in R Using the Caret Package. J. Stat. Softw. 2008, 28, 1–26. [Google Scholar] [CrossRef] [Scilit]
  54. Liaw, A.; Wiener, M. Classification and Regression by randomForest. R News 2002, 2, 18–22. [Google Scholar]
  55. Archer, E. rfPermute: Estimate Permutation p-Values for Random Forest Importance Metrics. 2025. Available online: https://CRAN.R-project.org/package=rfPermute (accessed on 9 October 2025).
  56. Štrumbelj, E.; Kononenko, I. Explaining Prediction Models and Individual Predictions with Feature Contributions. Knowl. Inf. Syst. 2014, 41, 647–665. [Google Scholar] [CrossRef] [Scilit]
  57. He, S.; Qian, H.; Liu, Y.; Zhao, X.; Su, F.; Ma, H.; Guan, Z.; Zhang, T. Water Conservation Assessment and Its Influencing Factors Identification Using the InVEST and Random Forest Model in the Northern Piedmont of the Qinling Mountains. J. Hydrol.-Reg. Stud. 2025, 57, 102194. [Google Scholar] [CrossRef] [Scilit]
  58. Liang, Y.; Hashimoto, S.; Liu, L. Integrated Assessment of Land-Use/Land-Cover Dynamics on Carbon Storage Services in the Loess Plateau of China from 1995 to 2050. Ecol. Indic. 2021, 120, 106939. [Google Scholar] [CrossRef] [Scilit]
  59. Pan, Y.; Birdsey, R.A.; Fang, J.; Houghton, R.; Kauppi, P.E.; Kurz, W.A.; Phillips, O.L.; Shvidenko, A.; Lewis, S.L.; Canadell, J.G.; et al. A Large and Persistent Carbon Sink in the World’s Forests. Science 2011, 333, 988–993. [Google Scholar] [CrossRef] [Scilit]
  60. Jiang, M.; Li, H.; Zhang, W.; Liu, J.; Zhang, Q. Effects of Climate Change and Grazing on the Soil Organic Carbon Stock of Alpine Wetlands on the Tibetan Plateau from 2000 to 2018. Catena 2024, 238, 107870. [Google Scholar] [CrossRef] [Scilit]
  61. Zhang, Z.; Jiang, W.; Peng, K.; Wu, Z.; Ling, Z.; Li, Z. Assessment of the Impact of Wetland Changes on Carbon Storage in Coastal Urban Agglomerations from 1990 to 2035 in Support of SDG15.1. Sci. Total Environ. 2023, 877, 162824. [Google Scholar] [CrossRef] [Scilit]
  62. Li, Z.-W.; Wang, Z.-Y.; Brierley, G.; Nicoll, T.; Pan, B.-Z.; Li, Y.-F. Shrinkage of the Ruoergai Swamp and Changes to Landscape Connectivity, Qinghai-Tibet Plateau. Catena 2015, 126, 155–163. [Google Scholar] [CrossRef] [Scilit]
  63. Guo, B.; Chen, C.; Pang, Y.; Luo, Y. Characteristics and Influencing Factors of Carbon Source/Sink Variations in the Zoige Grassland Wetland Ecological Function Zone on the Eastern Slope of the Tibetan Plateau. Environ. Res. Commun. 2024, 6, 085009. [Google Scholar] [CrossRef] [Scilit]
  64. Fan, L.; Cai, T.; Wen, Q.; Han, J.; Wang, S.; Wang, J.; Yin, C. Scenario Simulation of Land Use Change and Carbon Storage Response in Henan Province, China: 1990–2050. Ecol. Indic. 2023, 154, 110660. [Google Scholar] [CrossRef] [Scilit]
  65. Guo, X.; Wang, L.; Wang, Z.; Fu, Q.; Ma, F. Comparative Analysis of Dynamic Changes and Scenario Predictions of Carbon Storage in a Small Watershed Driven by Social-Natural Factors in Cold Regions. Land Degrad. Dev. 2025, 36, 3134–3149. [Google Scholar] [CrossRef] [Scilit]
  66. Zhu, W.; Zhang, J.; Cui, Y.; Zhu, L. Ecosystem Carbon Storage under Different Scenarios of Land Use Change in Qihe Catchment, China. J. Geogr. Sci. 2020, 30, 1507–1522. [Google Scholar] [CrossRef] [Scilit]
  67. Jiang, Y.; Alifujiang, Y.; Feng, P.; Yang, P.; Feng, J. A Simulated Assessment of Land Use and Carbon Storage Changes in the Yanqi Basin under Different Development Scenarios. Land 2024, 13, 744. [Google Scholar] [CrossRef] [Scilit]
  68. Wu, A.; Wang, Z. Multi-Scenario Simulation and Carbon Storage Assessment of Land Use in a Multi-Mountainous City. Land Use Pol. 2025, 153, 107529. [Google Scholar] [CrossRef] [Scilit]
  69. Zhu, K.; Cheng, Y.; Zhou, Q.; Azadi, H. Understanding Future Water-Carbon-Land Coupled Systems in the Era of COP 27: The Case of the Hanjiang River Basin, China. J. Clean. Prod. 2024, 479, 144054. [Google Scholar] [CrossRef] [Scilit]
  70. Li, J.; Gong, J.; Guldmann, J.-M.; Li, S.; Zhu, J. Carbon Dynamics in the Northeastern Qinghai-Tibetan Plateau from 1990 to 2030 Using Landsat Land Use/Cover Change Data. Remote Sens. 2020, 12, 528. [Google Scholar] [CrossRef] [Scilit]
  71. Zhang, Q.-P.; Wang, J.; Gu, H.-L.; Zhang, Z.-G.; Wang, Q. Effects of Continuous Slope Gradient on the Dominance Characteristics of Plant Functional Groups and Plant Diversity in Alpine Meadows. Sustainability 2018, 10, 4805. [Google Scholar] [CrossRef] [Scilit]
  72. Malla, R.; Neupane, P.R.; Kohl, M. Modelling Soil Organic Carbon as a Function of Topography and Stand Variables. Forests 2022, 13, 1391. [Google Scholar] [CrossRef] [Scilit]
  73. Ma, W.; Shi, P.; Li, W.; He, Y.; Zhang, X.; Shen, Z.; Chai, S. Changes in Individual Plant Traits and Biomass Allocation in Alpine Meadow with Elevation Variation on the Qinghai-Tibetan Plateau. Sci. China-Life Sci. 2010, 53, 1142–1151. [Google Scholar] [CrossRef] [Scilit]
  74. Balasubramanian, D.; Zhou, W.-J.; Ji, H.-L.; Grace, J.; Bai, X.-L.; Song, Q.-H.; Liu, Y.-T.; Sha, L.-Q.; Fei, X.-H.; Zhang, X.; et al. Environmental and Management Controls of Soil Carbon Storage in Grasslands of Southwestern China. J. Environ. Manag. 2020, 254, 109810. [Google Scholar] [CrossRef] [Scilit]
  75. Hartley, I.P.; Hill, T.C.; Chadburn, S.E.; Hugelius, G. Temperature Effects on Carbon Storage Are Controlled by Soil Stabilisation Capacities. Nat. Commun. 2021, 12, 6713. [Google Scholar] [CrossRef] [Scilit]
  76. Quan, Q.; He, N.; Zhang, R.; Wang, J.; Luo, Y.; Ma, F.; Pan, J.; Wang, R.; Liu, C.; Zhang, J.; et al. Plant Height as an Indicator for Alpine Carbon Sequestration and Ecosystem Response to Warming. Nat. Plants 2024, 10, 890–900. [Google Scholar] [CrossRef] [Scilit]
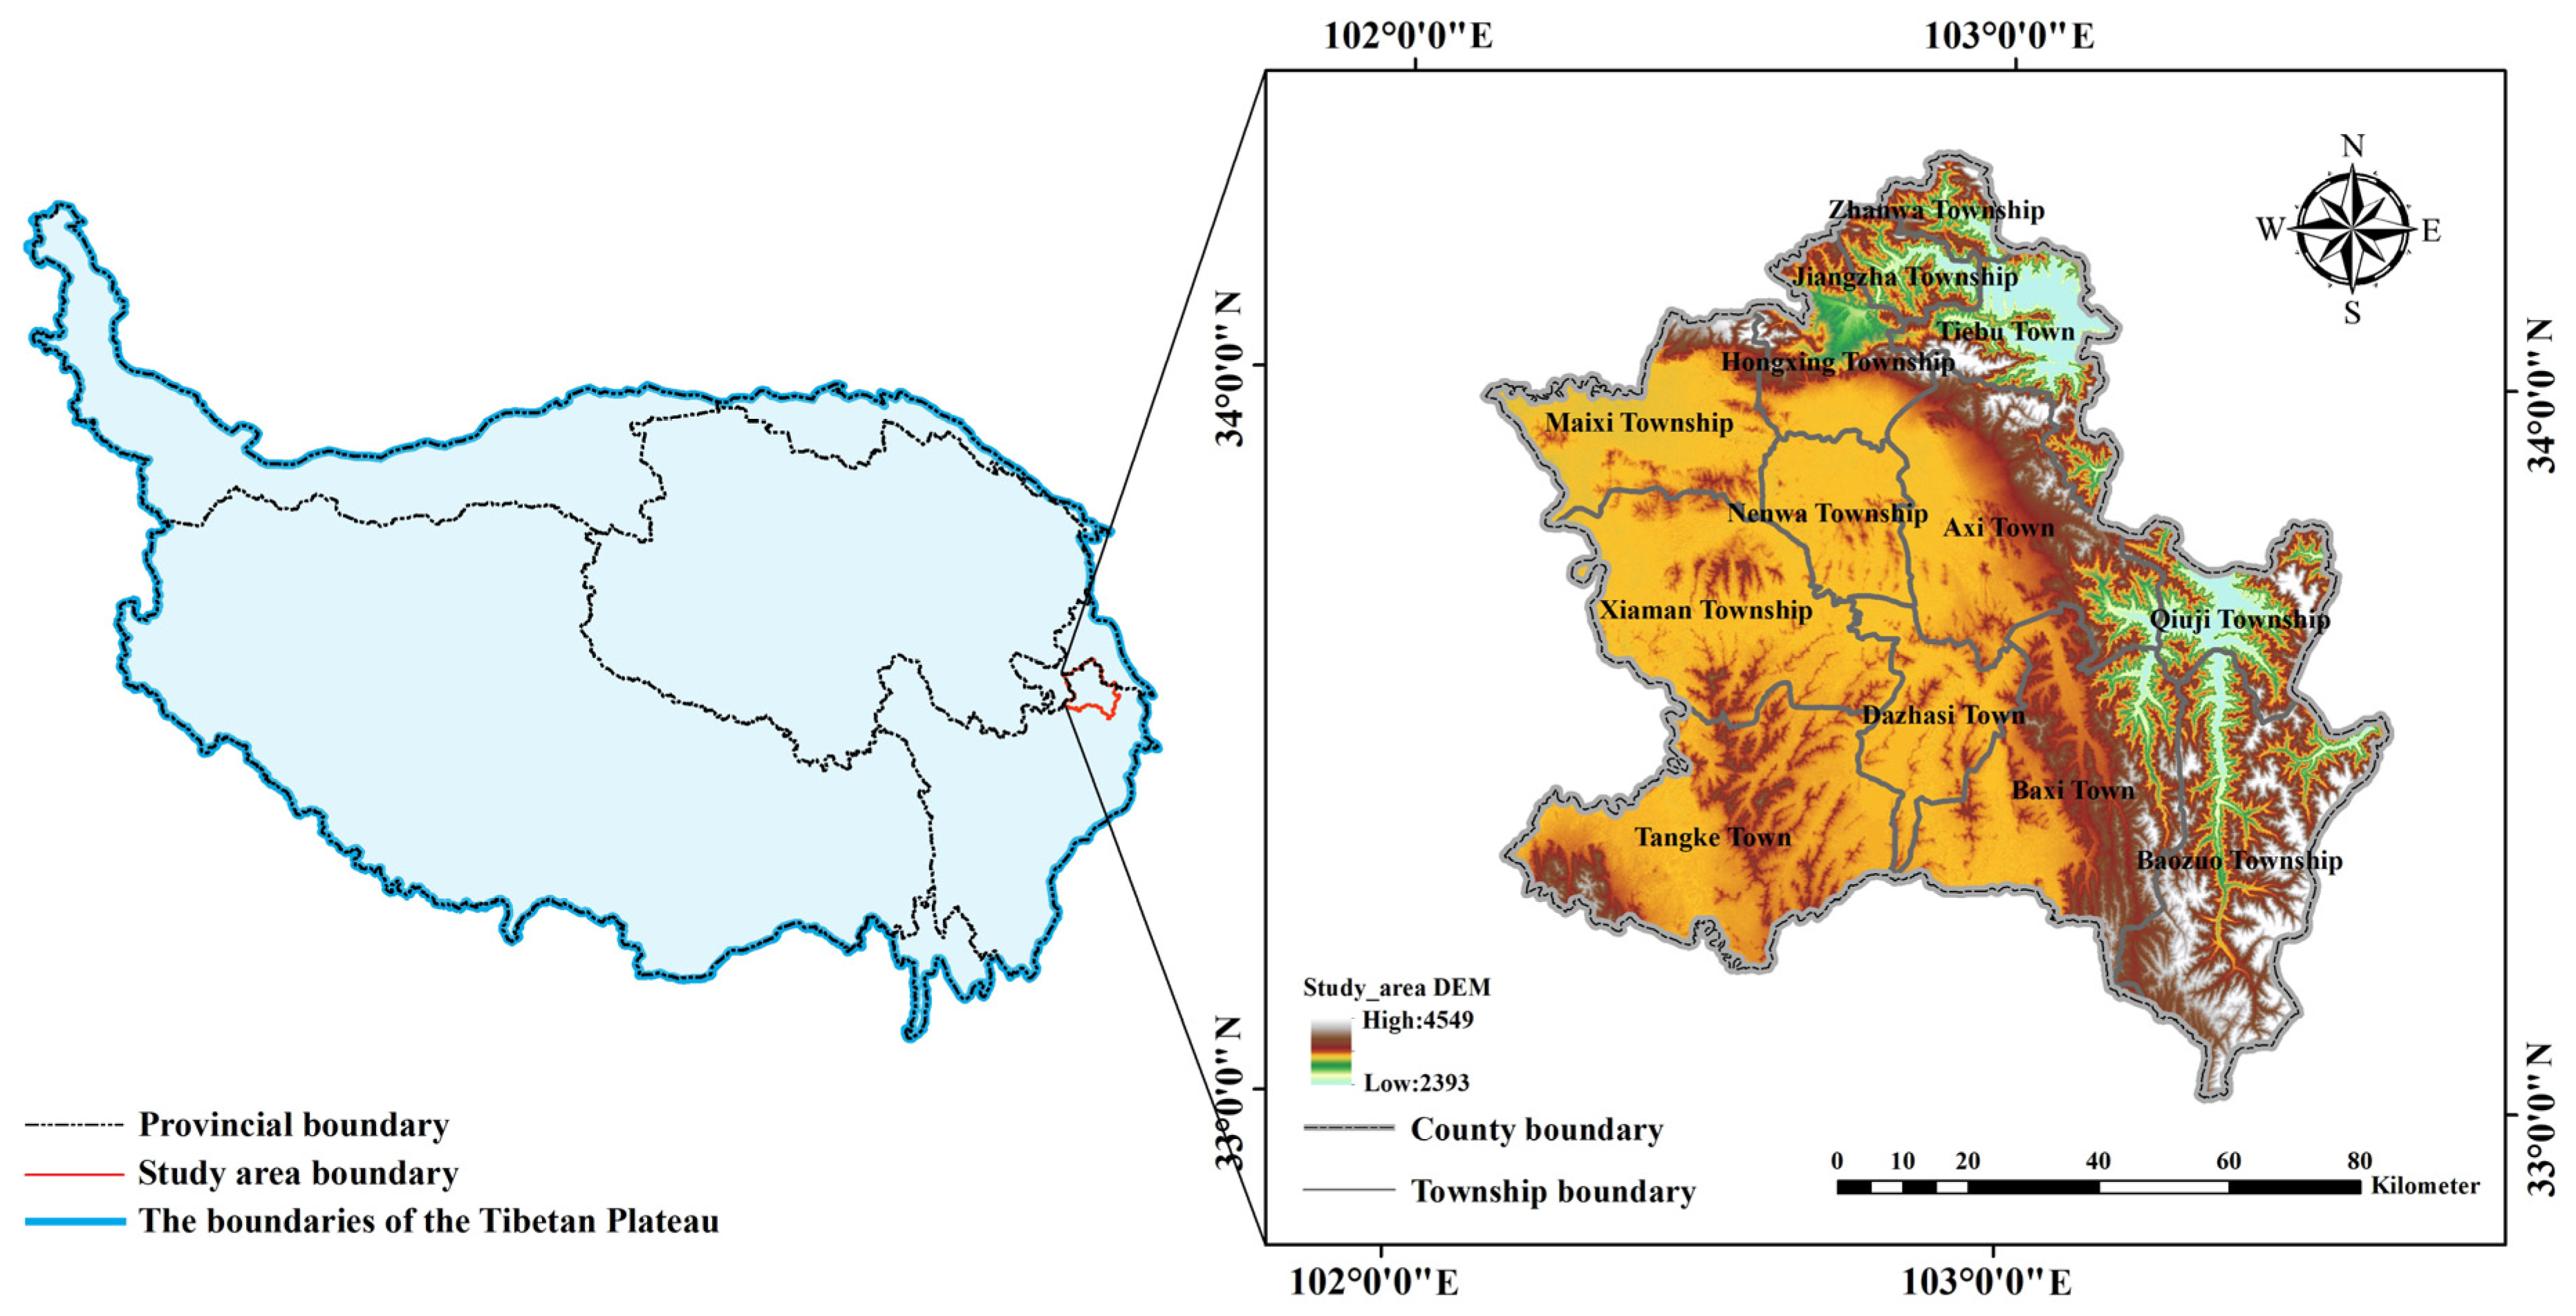
Figure 1. Overview of the study area.
Forests 17 00576 g001
Figure 2. Main driving factors of land use change in the study area.
Forests 17 00576 g002
Figure 3. Research framework of the study.
Forests 17 00576 g003
Figure 4. Spatiotemporal variation in different land use types and chord diagram of land use transitions in the study area from 1990 to 2030.
Forests 17 00576 g004
Figure 5. Spatial distribution of carbon storage in the study area from 1990 to 2030.
Forests 17 00576 g005
Figure 6. Spatial distribution of carbon storage change: 1990–2020 and multi-scenario projection for 2020–2030.
Forests 17 00576 g006
Figure 7. Spatial distribution of carbon storage hot spots in the study area.
Forests 17 00576 g007
Figure 8. The feature importance of impact factors in the Random Forest model. Note: ** in the figure indicates p < 0.01.
Forests 17 00576 g008
Figure 9. The SHAP explanation plot of driving factors for carbon storage.
Forests 17 00576 g009
Table 1. Data sources.
Data TypeData NameYearResolution/mSources
Land use dataLUCC1990, 2000, 2010, 202030China Land Cover Dataset
http://doi.org/10.5281/zenodo.4417809 (accessed on 10 August 2025)
Natural factor dataDEM202030Geospatial Data Clound
https://www.gscloud.cn (accessed on 10 August 2025)
Slope30
Aspect30
Annual precipitation20201000Resource and Environment Science and Data Center
https://www.resdc.cn/ (accessed on 10 August 2025)
Mean annual temperature1000
Soil type1000
Socioeconomic dataPopulation density20201000Resource and Environment Science and Data Center
https://www.resdc.cn/ (accessed on 10 August 2025)
GDP20201000
Locational factor dataDistance from road20201000National Catalog Service for Geographic Information
https://www.webmap.cn/ (accessed on 10 August 2025)
Distance from water20201000
Table 2. Parameter setting for three projection scenarios in 2030.
Projected ScenariosParameter Settings
Natural Development Scenario (NDS)This scenario assumes that land use changes in Zoige County from 2020 to 2030 follow historical trends without introducing policy planning constraints. Markov chain was employed to simulate land use types based on data from 2010 and 2020, thereby projecting the demand for various land classes in 2030.
Economic Development Scenario (EDS)This scenario adjusts land use arrangements based on policy planning, significantly accelerating the pace of urbanization and industrial development. The Markov transition probability matrix is modified to reduce the transition probabilities of construction land to other land categories (excluding cropland) by 30%, while increasing the transition probabilities of cropland, forest, shrub, wetland, and grassland to construction land by 20% [27].
Ecological Protection Scenario (EPS)This scenario prioritizes maintaining ecosystem balance and promoting environmental restoration. Conversions of forest, shrub, and grassland to construction land were prohibited [7]. Additionally, the transition probabilities of forest and wetland to other land uses were reduced by 30%. Meanwhile, in response to the Grain-for-Green project in Zoige County, the transition probabilities of cropland to forest, grassland, and wetland were increased by 30%, respectively [35]. The transition probabilities of construction land to forest, grassland, shrub, and wetland have increased by 30%, respectively [36].
Table 3. Land use transfer matrix setting for multiple scenarios in 2030.
Natural Development Scenario (NDS)Economic Development Scenario (EDS)Ecological Protection Scenario (EPS)
abcdefghiabcdefghiabcdefghi
a111110011100000010111110011
b111100011111100110010000001
c111100111111100110011100001
d111101111111101110011101001
e010110101010110100011110001
f000101100000101100000101100
g111111111111111111111111111
h100000110100000010100000111
i111110001111110011011100001
Note: a, b, c, d, e, f, g, h, and i represent cropland, forest, shrub, grassland, water, snow, unused land, construction land, and wetland, respectively; “1” indicates that land use types can undergo conversion, while “0” indicates that conversion is not possible; Columns correspond to the initial land use types, and rows correspond to the final simulated land use types.
Table 4. Carbon density of each land use type in the study area (t/hm2).
CodeLand Use TypeAboveground Carbon DensityUnderground Carbon DensitySoil Carbon DensityCarbon Density of Dead Organic Matter
1Cropland1.774.2664.133.7
2Forest42.5611.3590.054.64
3Shrub3.867.56551.45
4Grassland1.184.1955.390.34
5Water0.290.166.460.43
6Snow0000
7Unused Land1.690.679.010.3
8Construction land1.342.670.420.49
9Wetland1.9720.62118.413.6
Disclaimer/Publisher’s Note: The statements, opinions and data contained in all publications are solely those of the individual author(s) and contributor(s) and not of MDPI and/or the editor(s). MDPI and/or the editor(s) disclaim responsibility for any injury to people or property resulting from any ideas, methods, instructions or products referred to in the content.