Article

Tree Species Effects on Microbial Nutrient Limitation in Afforested Mine Soils Revealed by Enzyme Stoichiometry and Substrate-Induced Respiration

Department of Environmental Management and Protection, AGH University of Krakow, al. Mickiewicza 30, 30–059 Kraków, Poland
*
Author to whom correspondence should be addressed.
Forests 2026, 17(5), 543; https://doi.org/10.3390/f17050543
Submission received: 31 March 2026 / Revised: 26 April 2026 / Accepted: 28 April 2026 / Published: 29 April 2026
(This article belongs to the Special Issue The Role of Soil Fauna and Microbial Communities in Forests)

Abstract

Microbial nutrient cycling in afforested mine soils may be affected by the plant litter quality. This study investigated how different tree species—Scots pine (Pinus sylvestris), silver birch (Betula pendula), European larch (Larix decidua), and black alder (Alnus glutinosa)—influence microbial carbon (C), nitrogen (N), and phosphorus (P) limitations in reclaimed sandy mine soils. We combined substrate-induced respiration (SIR) and ecoenzymatic stoichiometry (EES) to diagnose these metabolic constraints. The SIR analysis revealed a universal primary limitation by labile C across all tree species, with glucose addition stimulating respiration by 271%–333%, regardless of the soil organic carbon content. However, EES revealed distinct secondary nutrient constraints driven by species-specific litter quality. Alder stands exhibited severe P limitation, likely due to high P demand for symbiotic N-fixation and intense competition for P between trees and microbes. In contrast, birch stands showed stoichiometric homeostasis and a slight N deficiency. Coniferous species exhibited P limitation and low enzymatic activity, indicating a strategy focused on intensive nutrient acquisition under low-energy conditions associated with recalcitrant needle litter. These findings demonstrate that while energy limitation is a universal constraint in mine soils, tree species determine the nature and intensity of secondary nutrient limitations due to differences in litter stoichiometry.

1. Introduction

Soil microbial activity is highly important for C, N, and P cycling in mine soils, where the low quality of soil substrates often limit nutrients availability and organic matter turnover. The balance between microbial demand and the resource supply of C, N, and P affects soil microbial activity and nutrient release to plants. In nutrient-deficient mine substrates, stoichiometric imbalances can restrict the growth of microbial communities and their activity, slowing nutrient turnover and affecting important ecosystem-forming processes such as organic matter accumulation [1,2,3]. The rate of soil microbial community development in post-industrial soils may be stimulated by the introduction of appropriate species of trees. Various tree species differ in terms of the quantity and quality of the produced organic matter, as it is a source of energy and nutrients for soil microorganisms [4]. The litter of coniferous tree species typically has a higher C:N ratio and is more recalcitrant than the litter of deciduous tree species [5,6]; thus, it may have a different effect on soil microbes compared to more labile deciduous leaves. N-fixing tree species are often planted as an admixture to forest stands on post-mining lands because they alleviate N deficiency, which is often considered the most limiting factor for plant growth [7,8]. N-fixing tree species not only enrich developing soils with N but also affect the cycling of P, which is an important constraint for plant growth and ecosystem development [9]. Chodak et al. [10] found that the N-fixing species planted on various degraded lands stimulated phosphatase activity more strongly than non-N-fixing species. Soil microbial communities are considered to be inherently limited by organic C [11]. This limitation by carbon tends to show up strongly when plant inputs (litter and root exudates) are low. Low C availability and low C inputs are typical in the ecosystems present on post-mining lands. Symbiotic N-fixation has been described to not only increase the soil’s N content but also to contribute to the increase in soil organic matter [12]. Thus, N-fixing tree species may support the development of soil microbial communities and stimulate their activity. On the other hand, there is evidence that increasing N inputs can increase C limitation [13]. Therefore, the effect of N-fixing tree species on the elements limiting the activity of soil microorganisms remains unclear.
It is sometimes not a single element but co-limitation by several elements (e.g., C + P or N + P), which may restrict the activity of soil microbes. Microbial activity depends on the least available element, but other limiting elements modulate the strength of that limitation. In recent years, measurements of extracellular enzyme activities have been increasingly used to diagnose limitations. Extracellular enzymes are primarily derived from soil microorganisms and play a critical role in soil biogeochemical cycles [14,15]. Of particular importance are those involved in the acquisition of C, N, and P [16], such as 1,4-β-glucosidase (BG), β-1,4-N-acetylglucosaminidase (NAG), L-leucine aminopeptidase (LAP), and acid/alkaline phosphatase (AcPh/AlkPh). Soil ecoenzymatic stoichiometry (EES) has been increasingly used in soil research in the last decade. For instance, Tapia-Torres et al. [17] used EES to study how microbes cope in ultra-oligotrophic desert soil. Zhang et al. [18] demonstrated that the C:N:P stoichiometry of soil microbes and ecoenzymatic activity in Loess Plateau soils was not homeostatic but nutrient dependent. Although EES is a useful tool for determining factors limiting soil microbial activity, it has certain limitations [19,20], and its results may be difficult to interpret when not accompanied by other methods. The measurement of substrate-induced respiration (SIR) a few hours after the addition of C, N, and P sources could be a promising method for detecting the most limiting elements and improving understanding of microbial limitation in soils [21]. The responses of respiration rate a few hours after the addition of glucose to N and/or P addition reflect in situ nutrient availability in soils and are not affected by the changes in microbial biomass induced by glucose or nutrient addition used in long-term approaches.
The objective of this study was to assess how different tree species commonly used in the reclamation of infertile and nutrient-poor sandy post-mining wastelands affect the C, N, and P limitations of microorganisms in mine soils. We hypothesized that differences in organic matter stoichiometry under different tree species would result in different elements limiting soil microbial activity.

2. Materials and Methods

2.1. Study Site

This study was carried out in the reclaimed areas of the sand quarry Szczakowa, located in Upper Silesia, Poland (50°16′ N; 19°26′ E). The climate of this region is temperate, with a mean annual precipitation of ca. 700 mm and a mean annual temperature of 8.1 °C. The extracted sand deposits are fluvioglacial Quaternary sediments of a pre-Quaternary morphological depression. The open-cast quarry Szczakowa has been extracting sand since 1954. Mining created an open-cast that is 5–25 m deep, covering over 3100 ha. Since the late 1950s, it has been reclaimed and reforested. The reclamation procedure included forming and levelling the surface, followed by lupine (Lupinus polyphyllus Lindl.) cultivation for one year as a green manure, start-up mineral fertilization with NPK (70 kg N ha−1, 120 kg P ha−1, 120 kg K ha−1), and planting trees [22].

2.2. Soil Sampling and Sample Preparation

Samples of the uppermost soil horizons were taken in November 2024 from plots (10 × 10 m) under pure Scots pine (Pinus sylvestris), silver birch (Betula pendula), European larch (Larix decidua), and black alder (Alnus glutinosa) forest stands (n = 3 for each tree species). The sampled pine, birch, and larch stands were 37 years old, and the alder stands were 24 years old and grew on coarse-textured sandy soils (clay content < 2%) [23]. The collected material under the pine, larch, and alder stands represented O or O/A horizons, while that collected under the birch stands represented the A horizon, as there was no litter deposited on the mineral soil.
At each plot, five samples were taken—four of them were located at the corners and one in the middle of the plot. The five samples were combined to make a composite sample representative of the plot. The samples were sieved (2 mm mesh for mineral soil and 10 mm for O horizon) and divided into two parts. One part was air-dried and used for physical, physicochemical, and chemical analyses, and the other was stored field-moist at 4 °C and used for microbial and biochemical analyses. Prior to microbial analyses, the samples were adjusted to 50% of the maximum water holding capacity (WHC) and pre-incubated at 22 °C for 5 days. WHC was determined gravimetrically.

2.3. Chemical Analyses

The samples were analyzed for soil organic carbon (SOC) by dry combustion using an Eltra CS 500 analyzer (ELTRA GmbH, Haan, Germany). Nitrogen (N) concentration was determined using the Kjeldahl method (KjelMaster K-375, Büchi, St. Gallen, Switzerland). Total phosphorus (P) was determined colorimetrically by the molybdate blue method from 60% HClO4 extracts using a Varian CARY 300 Conc UV–Visible Spectrophotometer (Varian Australia Pty Ltd., Melbourne, Australia). The pH of the samples was measured in H2O (soil/water ratio 1:5, w/v) with a digital pH meter (CPC-411, ELMETRON, Zabrze, Poland).

2.4. Enzyme Analyses

Soil extracellular enzyme activities associated with carbon (β-glucosidase, BG), nitrogen (N-acetyl-β-D-glucosaminidase, NAG; leucine aminopeptidase, LAP), and phosphorus (acid and alkaline phosphomonoesterases, AcPh and AlkPh, respectively) acquisition were determined using standardized colorimetric assays under controlled conditions (37 °C, 1 h incubation) [24]. BG and NAG activities were measured using p-nitrophenyl-β-D-glucopyranoside and p-nitrophenyl-N-acetyl-β-D-glucosaminide, respectively, in modified universal buffer (MUB, pH 6.0–6.5), while LAP activity was assessed using L-leucine-p-nitroanilide in Tris buffer (pH 8.0). Acid and alkaline phosphomonoesterase activities were determined using p-nitrophenyl phosphate (pNPP) in MUB at pH 6.5 and pH 11, respectively, following established protocols. All assays were performed on soil samples corresponding to 0.5–1.0 g dry weight. After incubation, reactions were terminated by alkaline extraction; for BG, NAG, AcPh, and AlkPh, CaCl2 followed by NaOH was applied, whereas for LAP, a modified termination step was used, consisting of 0.5 M CaCl2 followed by 0.1 M Tris buffer adjusted to pH 12. This approach was adopted to ensure controlled alkaline conditions for the detection of p-nitroaniline and to reduce the risk of the abiotic hydrolysis of chromogenic substrates under strongly alkaline conditions [25]. The released p-nitrophenol (BG, NAG, AcPh, and AlkPh) or p-nitroaniline (LAP) was quantified spectrophotometrically at 400 nm. Due to large differences in organic C contents between the studied soils, the enzyme activities initially expressed in µmol product per g of dry soil per hour were recalculated into µmol product g−1 SOC h−1.

2.5. Vector Analysis of Ecoenzyme Activities

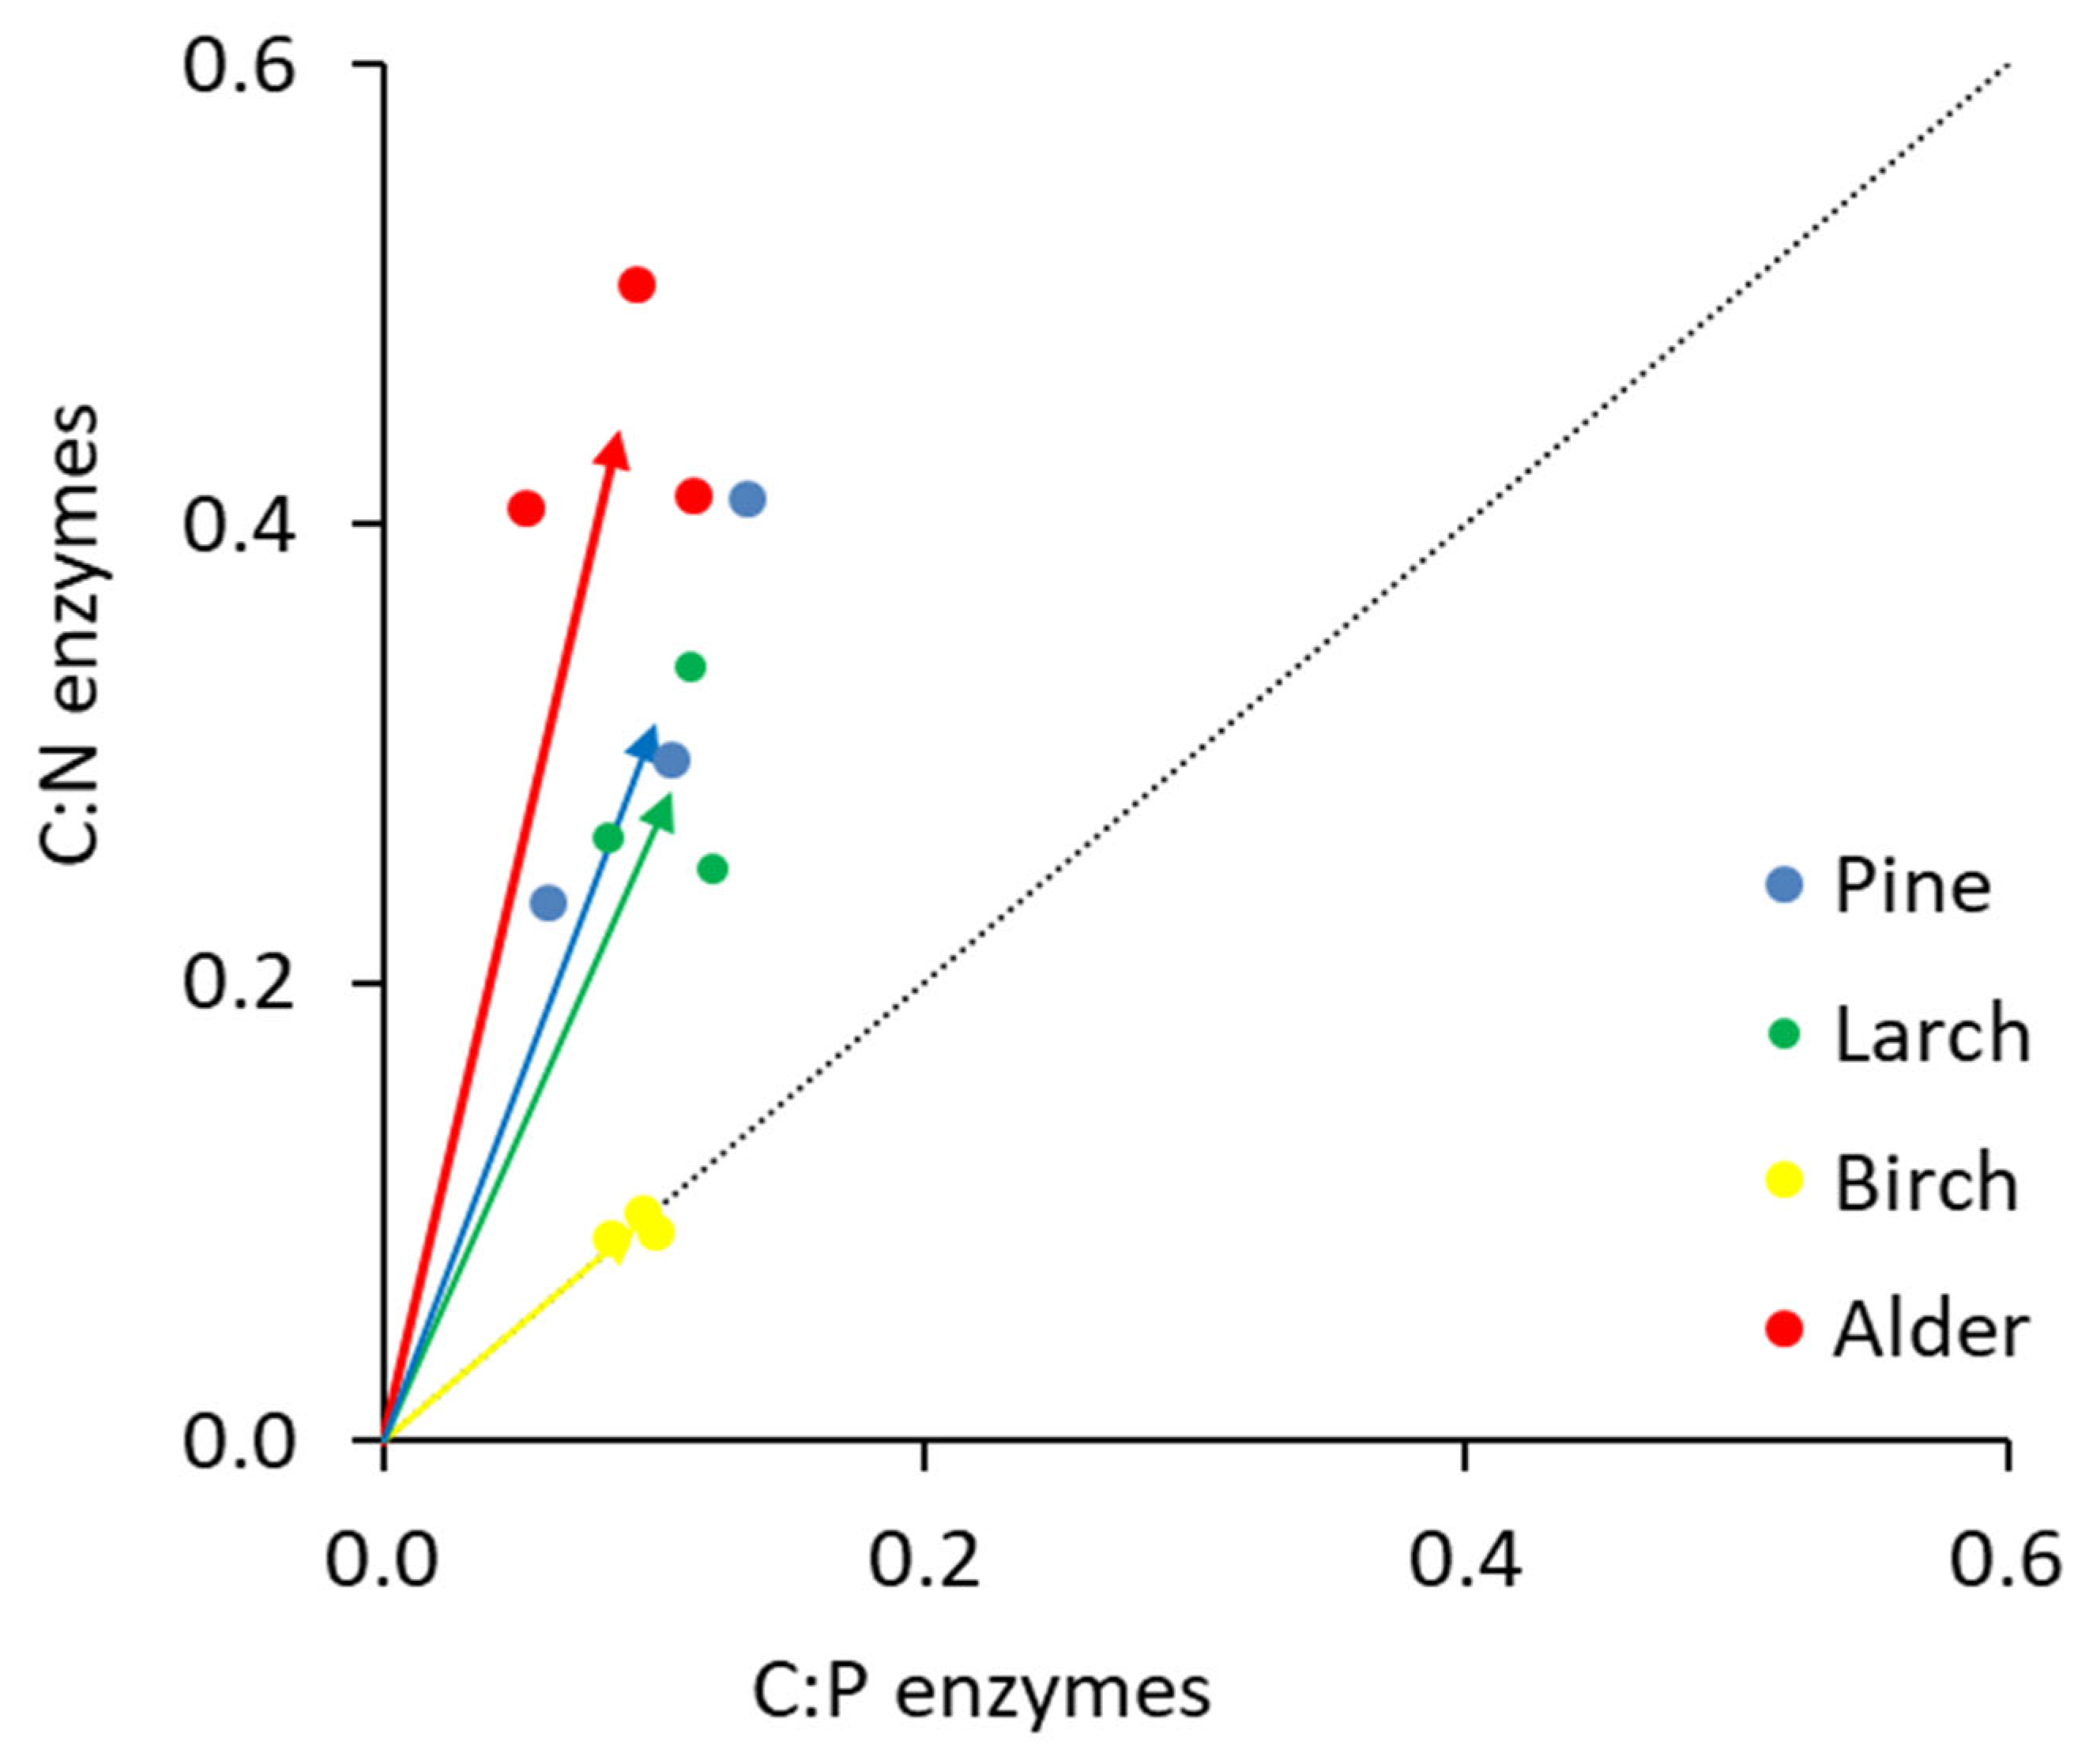
The ratios of enzyme activities involved in C (BG), N (NAG + LAP), and P (AcPh + AlkPh) cycling in the studied soils were calculated as proportional ratios (C:N = BG/(BG + NAG + LAP); C:P = BG/(BG + AcPh + AlkPh)) based on untransformed values following recommendations given in [15]. The vector length of the enzyme ratios was calculated as the square root of the sum of the squared values of x and y, where x represents C:P enzyme ratios and y represents C:N enzyme ratios [15] according to the following formula:
Vector   length   =   x 2 + y 2
The vector angle (in degrees) was calculated as the arctangent of the line extending from the plot origin to point (x, y) according to the following formula:
Vector angle = DEGREES(ATAN2(x,y))
Calculations of vector length and angle employed Microsoft Excel (Microsoft Office for Windows 2013).

2.6. Substrate-Induced Respiration Measurements

To measure short-term SIR rates to C, N, and/or P additions, the soil samples were split into subsamples that contained exactly 2 g of organic C after a pre-incubation period. Subsequently, the subsamples were amended with substrate solutions containing glucose as a C source, mineral N, and/or P to a final moisture content of about 50%–60% of their maximum WHC [26]. SIR analysis included the following treatments: a control with no nutrient addition (CONT), glucose addition (+C), glucose + nitrogen (+CN), glucose + phosphorus (+CP), glucose + nitrogen and phosphorus (+CNP), nitrogen +(N), and phosphorus (+P). All combinations were prepared in triplicate. The amount of C in glucose was 100 mg, corresponding to 5% of the SOC content in the soil. Nitrogen was applied as ammonium nitrate (NH4NO3) and P as K2HPO4. The amounts of added N and P were adjusted to C in a C:N:P ratio of 60:7:1, which was found to be a globally well-constrained stoichiometry of microbial biomass [27]. The amounts of N and P in the +N and +P treatments were based on the treatments involving glucose addition (33.3 mg NH4NO3 and 7.3 mg K2HPO4 per sample in +N and +P treatments, respectively). The CONT treatment received distilled water. The amended soil subsamples were placed in gas-tight jars along with beakers containing 5 mL of 0.2 M NaOH to trap the evolved CO2 and incubated at 22 °C for 4 h. After opening the jars, 2 mL BaCl2 (0.5 M) was added to the NaOH solution, and the excess hydroxide was titrated with 0.1 M HCl in the presence of phenolphthalein as an indicator. Respiration of control samples was referred to as basal respiration and expressed in ug C-CO2 g−1 SOC h−1. The respiration rates of other treatments involving the addition of glucose (C source) and/or N and P were expressed as the % of basal respiration measured in the CONT treatment. For this purpose, the measured respiration rate of each amended soil sample (mean value of three laboratory repetitions) was divided by the basal respiration rate of the same soil (mean value of three laboratory repetitions) and multiplied by 100.

2.7. Statistical Analysis of Data

Differences in the chemical and microbial properties of the forest stands were tested using one-way ANOVA. Tukey’s honestly significant differences test for multiple comparisons was run if significant differences were found (p < 0.05). Prior to ANOVA, the dependent variables were tested for distribution normality (Shapiro–Wilk test, p < 0.05) and homoscedasticity (Levene’s test, p < 0.05) and transformed (logarithmic, square root, or power transformation) if necessary. Simple linear regression analysis was carried out to test the relationships between chemical and microbial properties. The significance of correlations was tested at p < 0.05. Statistical calculations were performed using Statgraphics Centurion XVII software.

3. Results

3.1. Chemical Properties of Soils

The soils under birch had the lowest contents of C (63 mg g−1), N (2.7 mg g−1), and P (238 μg g−1). However, due to large variability, the differences were significant only when compared with pine for C content (373 mg g−1) and alder for N (11.4 mg g−1) and P (580 μg g−1) contents (Table 1). The soils under both coniferous species exhibited significantly larger C:N ratios (35.2–42.4) and lower pH values (4.1–4.2) than those under birch and alder (C:N = 19.9–24.5 under birch; pH = 5.3–5.4). The soils under pine had the highest values (756), while those under birch had the lowest (279) C:P ratio (Table 1).

3.2. Enzyme Activities

Soils under birch and alder exhibited significantly higher acid and alkaline phosphatase activities (AcPh = 203.6–231.9 μmol pNP g SOC−1 h−1; AlkPh = 28.2–33.0 μmol pNP g SOC−1 h−1) than soils under coniferous species (AcPh = 58.5–91.1 μmol pNP g SOC−1 h−1; AlkPh = 8.5–8.8 μmol pNP g SOC−1 h−1) (Figure 1a). There was a tendency for higher BG activities under deciduous trees compared with conifers, although the difference was not statistically significant. The highest activities of enzymes involved in N cycling, LAP and NAG, were measured under birch (48.9 μmol pNP g SOC−1 h−1 and 215.1 μmol pNP g SOC−1 h−1, respectively). Under all the other tree species studied, the activities of LAP (6.9–11.2 μmol pNP g SOC−1 h−1) and NAG (8.8–20.3 μmol pNP g SOC−1 h−1) were significantly lower and did not differ between the tree species. The soils under birch exhibited the highest total enzymatic activity (551.3 μmol pNP g SOC−1 h−1), followed by soils under alder (292.3 μmol pNP g SOC−1 h−1), whereas the soils under larch and pine had the lowest enzymatic activity (141.4 μmol pNP g SOC−1 h−1 and 90.3 μmol pNP g SOC−1 h−1, respectively) (Figure 1b).
Vector lengths differed significantly between the tree species studied. The soils under alder had the longest vectors, the soils under both conifers had intermediate vectors, and the soils under birch had the shortest vectors (Figure 2). The vector angles differed significantly between alder (78.8°), larch (62.9°), and birch (45.0°). The average vector angle under pine (72.5°) did not differ from alder and pine but was significantly larger compared to birch (Figure 2).
There was a significant negative relationship between the (NAG + LAP):(AlkPh + AcPh) ratio and the soil N:P ratio (r2 = 0.58; p = 0.004). However, the BG:(NAG + LAP) and BG:(AlkPh + AcPh) ratios were not related to soil C:N or C:P ratios.

3.3. SIR Measurements

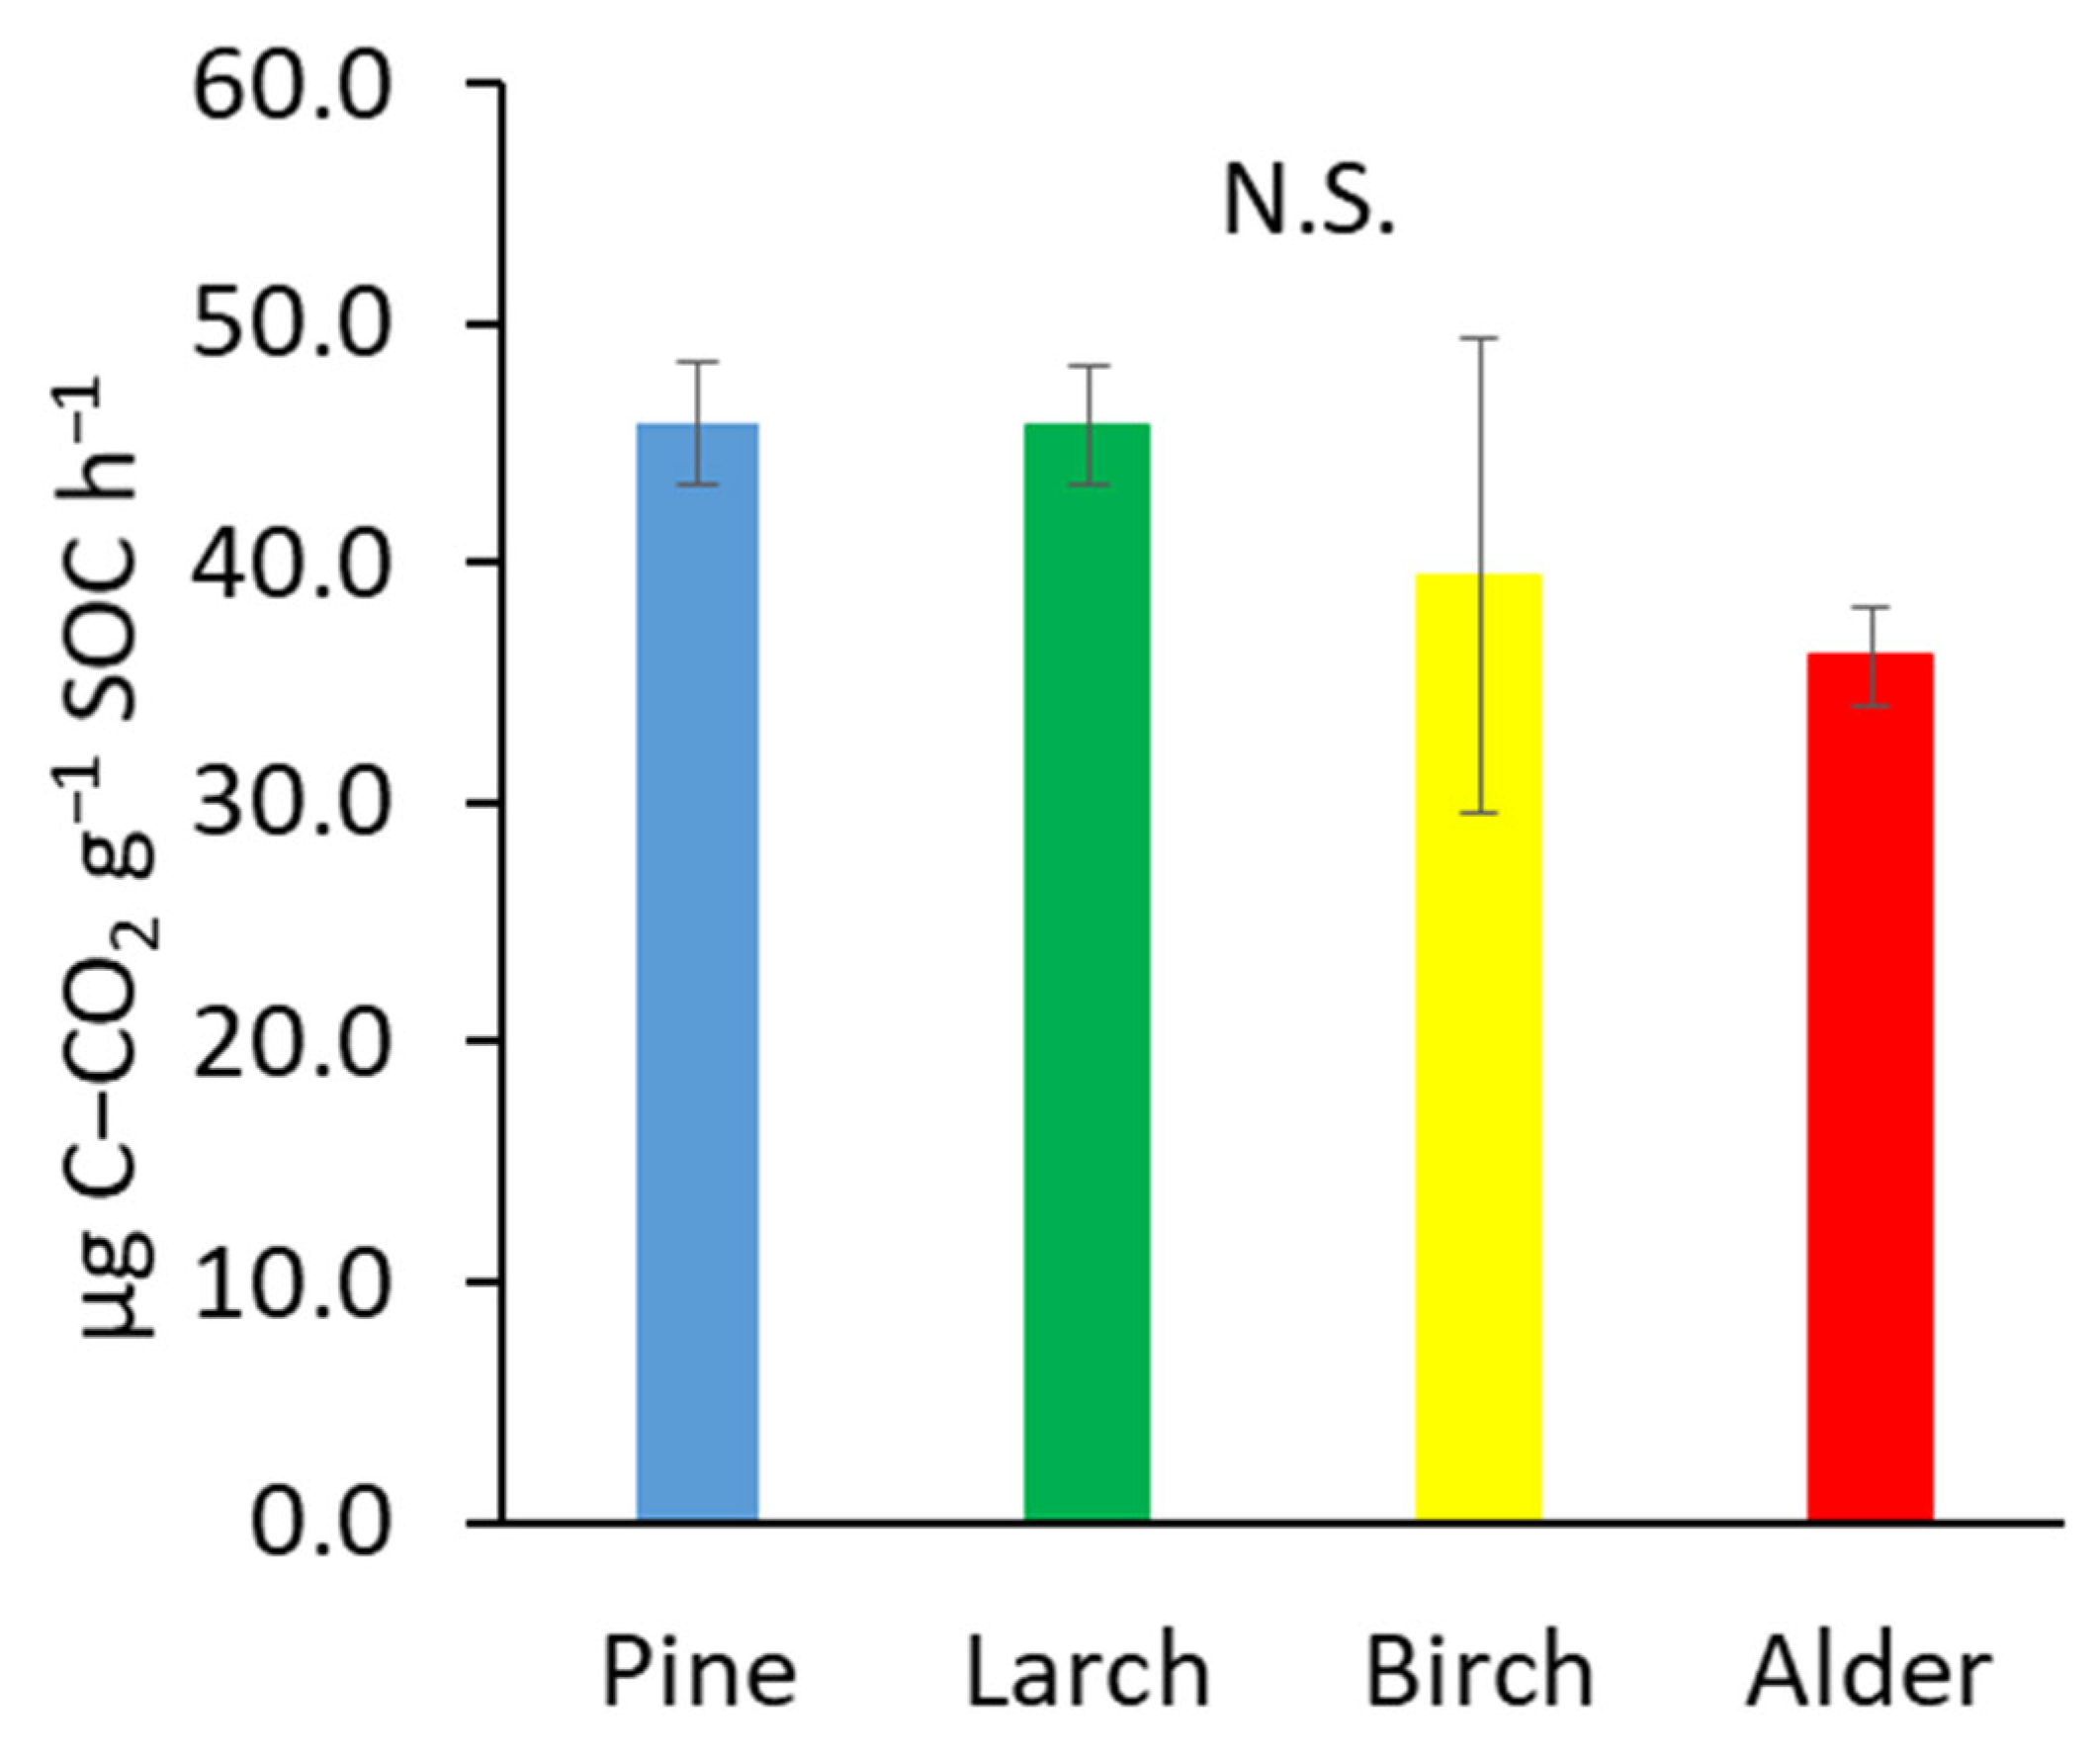
Despite large differences in organic matter stoichiometry, soils under all tree species studied exhibited similar basal respiration (36.1–45.9 ug C-CO2 g−1 SOC h−1) (Figure 3).
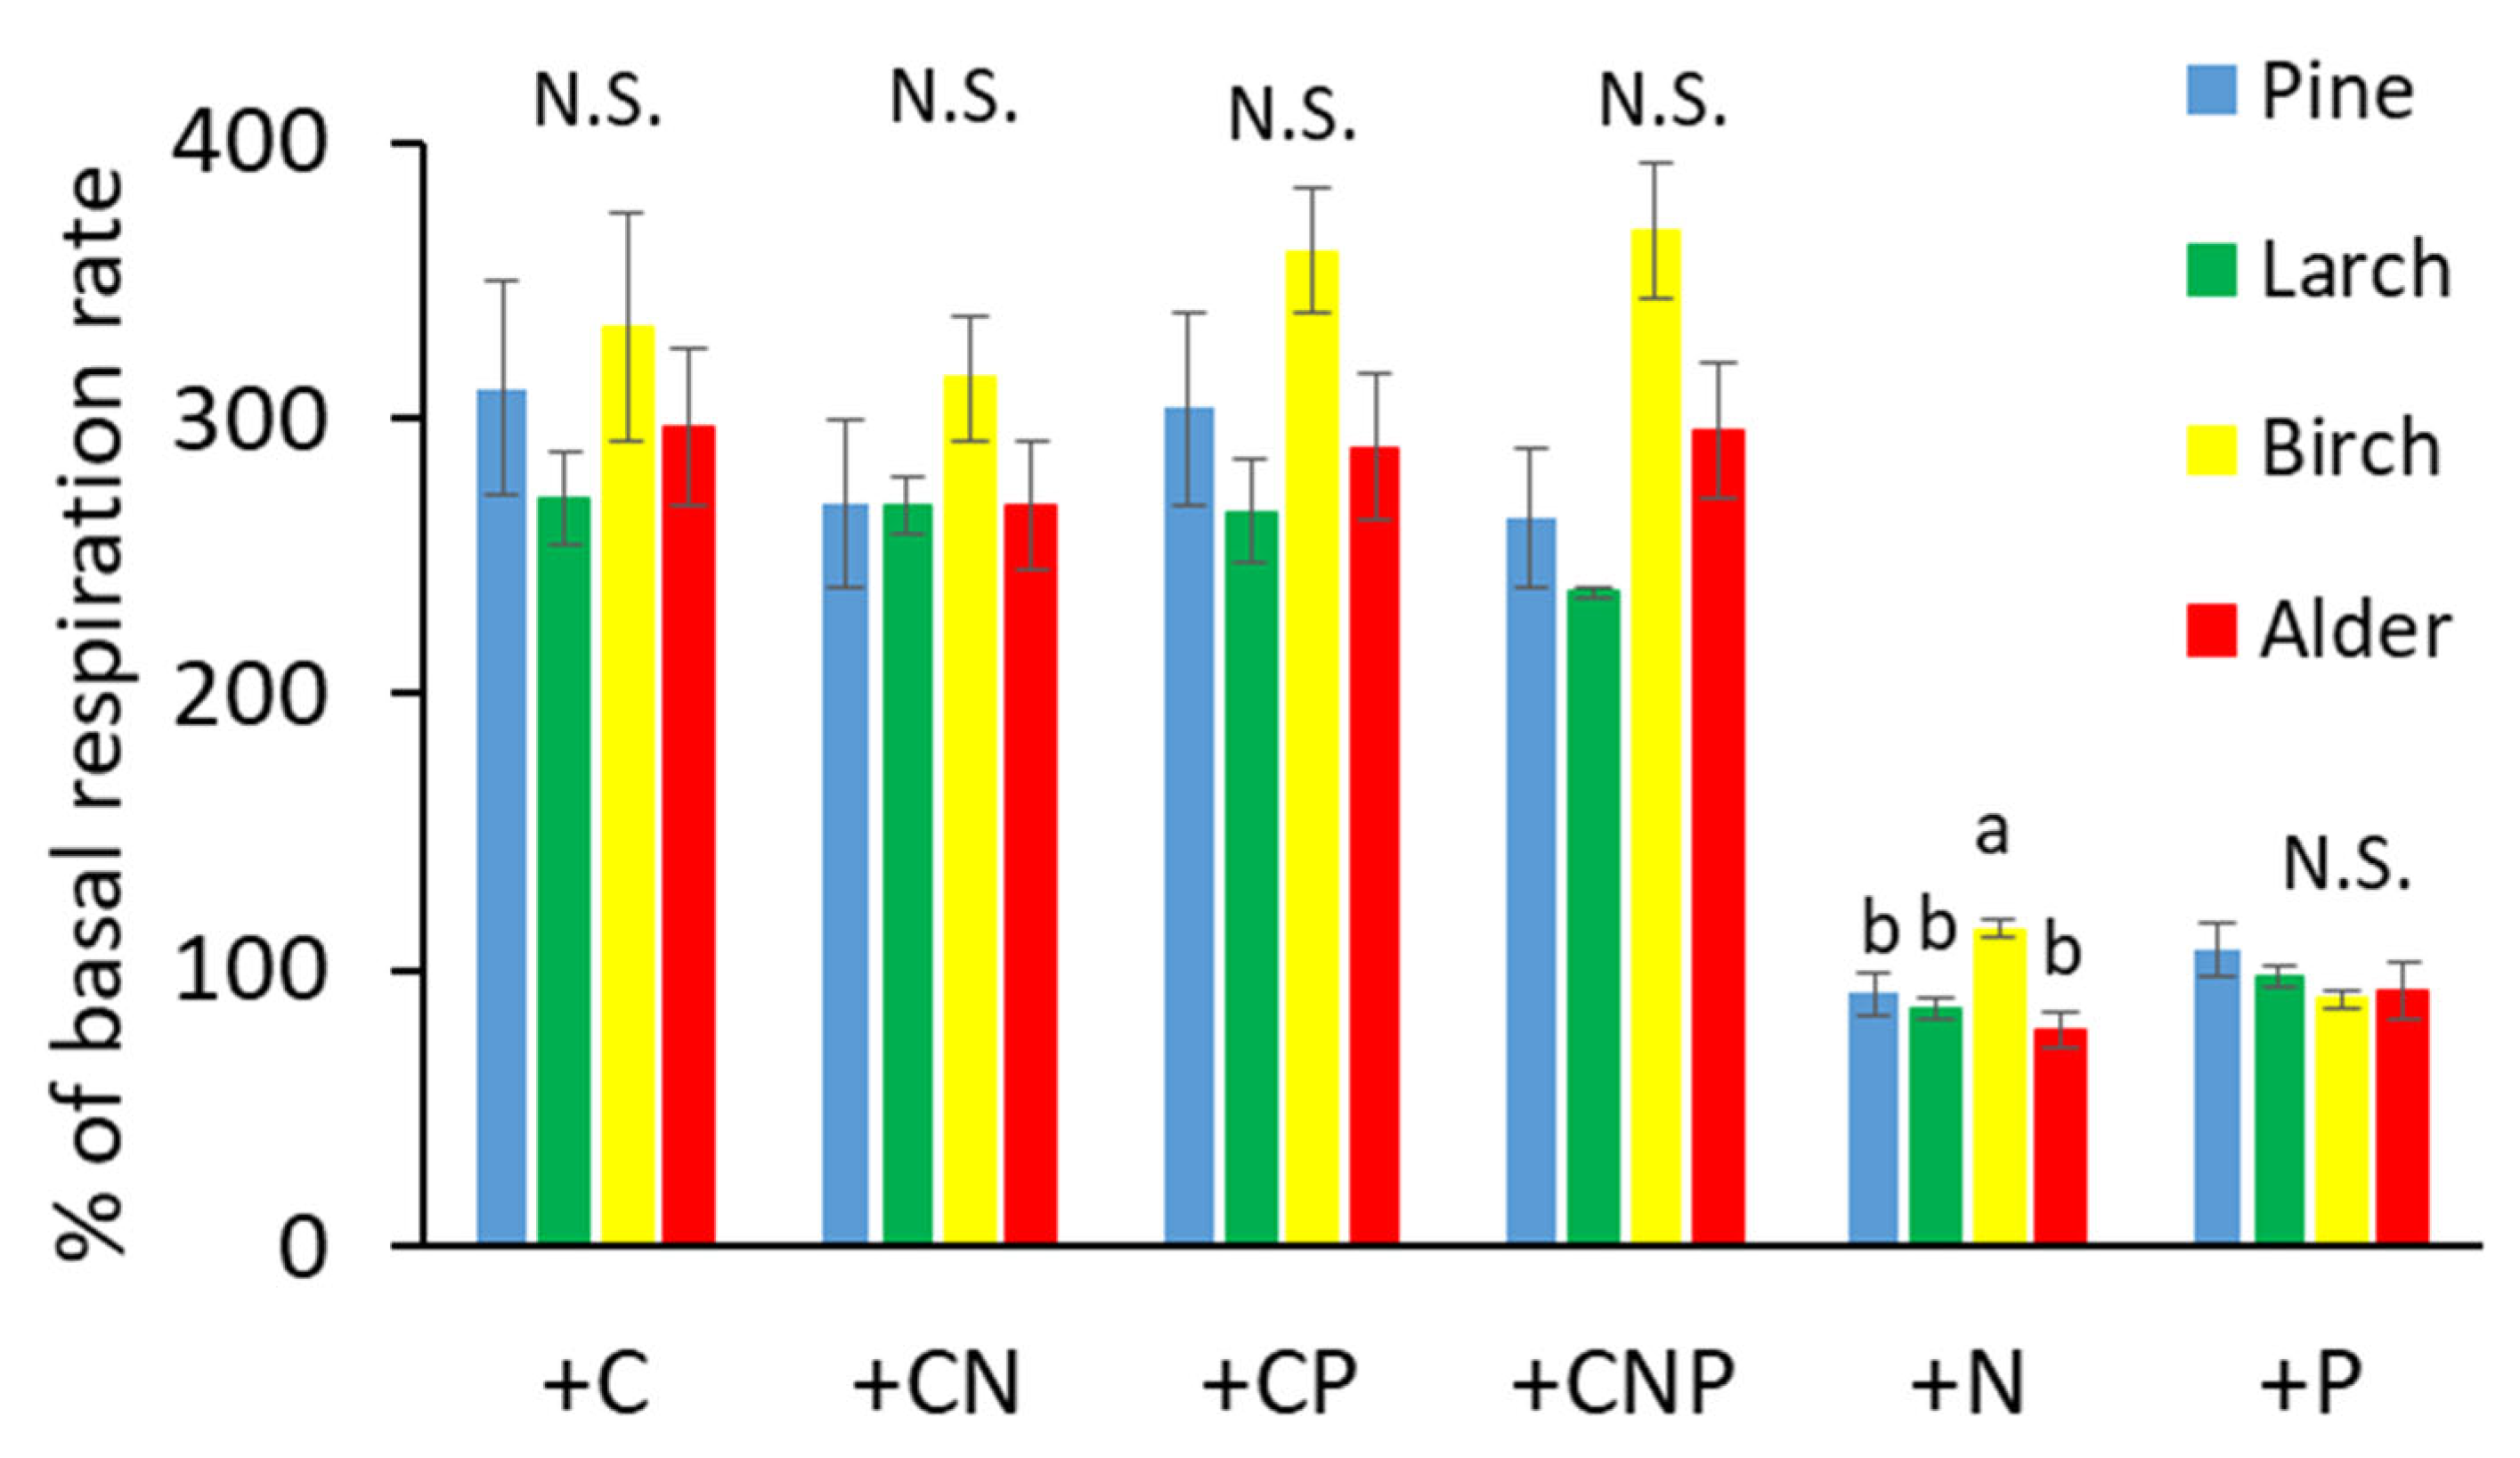
Glucose amendment (+C treatment) resulted in a large increase in soil respiration rates. The measured values were 271%–333% of basal respiration. However, there were no differences between the tree species.
The other treatments involving glucose addition (+CN, +CP, +CNP) also distinctly increased the respiration rate (the measured values ranged from 237% to 368% of the basal respiration rate) but also did not differ between the studied tree species (Figure 4). The addition of P had no effect on the respiration rate, as the measured values ranged from 89% to 107% of the basal respiration rate. However, N addition resulted in decreased respiration rates under alder, pine, and larch (79%–92% of the basal respiration) but increased respiration under birch (115% of the basal respiration). The reactions of soils to the applied treatments were not correlated to C:N or C:P ratios.

4. Discussion

4.1. Soil Chemical Properties

As expected, the studied soils differed significantly in their chemical properties. The soils under coniferous species were more acidic than the soils under birch and alder. Stronger soil acidification under conifers compared with deciduous trees has often been described in natural and reclaimed forests [12,28,29]. Coniferous litter is more acidic than deciduous litter [30], and our soils had very limited buffering capacities as a result of their sandy structure, leading to relatively large observed differences in pH. The soils under pine and larch had significantly higher C:N and C:P ratios than soils under birch and alder. The phenomenon of larger C:N ratios in conifer litter is well known [31,32,33], and we expected such a result. In our study, soils under pine had C:N and C:P ratios that greatly exceeded critical values, indicating N and P limitation [34]. The soils under larch also exceeded these values, but to a somewhat lesser extent. Under alder, only the C:P ratio was greater than 300, while the C:N ratio was low, indicating sufficient N supply. The soils under birch had both C:N and C:P ratios within an optimal range. The soil stoichiometric ratios pointed to N and P co-limitation of soil microbes under pine and larch, P limitation under alder, and C limitation under birch.

4.2. C, N, and P Limitation Revealed by Soil Enzymatic Activities and Substrate-Induced Respiration

Total soil organic carbon (SOC) contents varied significantly among tree species—from 373 mg/g under pine to 63 mg/g under birch—but soil microorganisms were universally constrained by the availability of labile C. The substantial and equal stimulation of respiration (271%–333% of basal respiration rates) upon glucose addition in all stands, coupled with the lack of response to mineral N or P alone, underscored a pervasive energy limitation across all tree species studied [11]. Our results are in accordance with the recent study of Kim and Min [35], who found that microbial communities experienced similar degrees of carbon limitation regardless of soil organic carbon content. It appears that the large pools of organic carbon in the soil, particularly under coniferous trees, are characterized by high chemical resistance, which renders them functionally inaccessible to the current microbial community. The similar basal respiration rates normalized per gram of soil C suggest that the size of the active microbial biomass has adjusted to the long-term flux of accessible C, regardless of the tree species. The content of labile C, a primary energy source, has been described as the most common constraint to the growth and activity of heterotrophic soil microorganisms [5,11,36,37].
In addition to the primary limitation related to the readily available carbon content revealed by the SIR analysis, the vector analysis of enzyme activities showed that species-specific litter quality and nutrient supply determined secondary limitations. The most pronounced effect was observed in the alder stands, where the high activity of phosphatases and the very high vector angle (78.8°) indicated severe phosphorus limitation. We presume that the strong P limitation under alder reflected an intense competition between the host–symbiont complex and the free-living soil microbial community. N-fixing species have a high P demand, as the N-fixation process carried out by their symbiotic bacteria is energy-expensive and large amounts of ATP are needed [38,39]. The efficient uptake of P by alders depletes the soil’s inorganic P pool and forces soil microorganisms to upregulate phosphatase synthesis to meet their own phosphorus requirements. The lack of respiratory response to P-amendment and strong reaction to glucose addition indicate a primary limitation by labile C (energy), although the high activity of phosphatases resulting in steep vector angles suggests that microbial communities are in a state of P deficiency and must allocate a large part of their energetic resources to the synthesis of P-acquiring enzymes. This could also explain the strong C limitation revealed by the vector analysis, as soil microorganisms need energy to produce phosphatases.
In contrast to alder, the birch stands represented a fast-cycling system characterized by stoichiometric homeostasis. The vector angle of nearly 45°, combined with the highest N-cycling enzyme activities (NAG and LAP) and a positive respiratory response to N-only addition (115%), suggests that microbial communities under birch exhibit a high demand for N to support rapid turnover in a relatively labile C environment. Birch is known to produce easily decomposable litter [40,41], and in our study, it was the only species where no O horizon accumulated.
The microbial communities under coniferous species (pine and larch) were characterized by a high degree of metabolic dormancy, resulting from the chemical recalcitrance of the litter [40]. Despite the highest soil C concentrations—particularly under pine—these stands exhibited the lowest overall extracellular enzyme activities. This result suggests that the sheer volume of organic matter does not equate to biological availability; rather, the high content of recalcitrant C compounds typical of conifer needles [40,42] likely restricts microbial access to energy-rich substrates. This was further evidenced by the large increase in respiration upon glucose addition, confirming that a considerable part of C in these soils is unavailable to the present microbiome. The enzymatic stoichiometry in these stands revealed a significant shift toward phosphorus acquisition. With soil C:P ratios (756 for pine and 424 for larch) exceeding critical values, the microbial communities were in a state of chronic P limitation, revealed by vector angles significantly exceeding 45° (72.5° and 62.9°, respectively). Unlike the birch stands, which showed respiratory stimulation following N addition, the coniferous stands exhibited a decrease in SIR when supplemented with N. This suppressed response suggests that additional nitrogen loading in these P-limited soils exacerbates stoichiometric imbalances, potentially even inducing osmotic stress. Compared with the alder stands, the soils under conifers exhibited general enzymatic activity that was two to three times lower, mainly due to the much lower activity of phosphatases. This drives us to the conclusion that the microbial strategy under conifers relies on high-cost nutrient acquisition within the low-energy environment associated with recalcitrant needle litter. This leads to the slow decomposition rates and significant organic matter accumulation observed under coniferous species.
The significant negative correlation between the (NAG + LAP):(AcPh + AlkPh) ratio and soil N:P observed in the studied soils supports the microbial resource allocation theory [42]. In accordance with the economic principles of enzyme production, microbes systematically downregulated investment in N-acquiring enzymes as N availability increased relative to P [42]. The observed decoupling of BG activity from bulk soil C:N and C:P ratios indicated that C acquisition was regulated by the immediate availability of fresh substrate rather than the broader stoichiometric properties of the stabilized SOC. However, it is also possible that the measurement of BG activity was insufficient to capture C limitations. Mori [20] found that BG:(NAG + LAP) may reflect microbial C vs. N limitations only when cellulose is the predominant C source. When other C sources dominate, the measurement of other enzymes involved in C cycling may be required.
Collectively, our results indicated that, although energy was a common limiting factor for microbial activity in the studied mine soils, the specific nutritional cost—understood as the requirement to synthesize the relevant extracellular enzymes—depended on the C:N:P ratio of organic material produced by the dominant tree species.

5. Conclusions

Our study, which involved SIR and EES approaches, demonstrated that tree species exerted a profound influence on soil microbial metabolism by modulating the stoichiometric quality and accessibility of organic matter. Substrate-induced respiration identified a universal limitation by labile carbon availability across all tree species studied, obscuring the effects of other nutrient constraints. The application of EES and vector analysis of soil enzyme activities allowed a better understanding of other factors affecting microbial activity in mine soils afforested with different tree species. The microbial communities under the birch trees were characterized by stoichiometric homeostasis and showed a slight nitrogen (N) deficiency, likely driven by the rapid turnover of the birch litter. In contrast, the nitrogen-fixing capacity of alder and the high carbon-to-phosphorus (C:P) ratios of coniferous litter (pine and larch) induced a severe limitation by phosphorus, which was clearly diagnosed through vector analysis of extracellular enzymes. Microbes in these P-limited soils systematically prioritized the synthesis of phosphatases over the enzymes involved in C or N acquisition. Enzyme analysis indicated a different mechanism of P limitation under alder stands and both coniferous stands. Under alder, soil microbes had access to easily degradable organic matter but faced strong competition for P from the dominant tree species, while poor decomposability and low P content were a main reason for P limitation under the conifers. However, these conclusions should be interpreted with caution due to the limited number of replicates (n = 3 per species). Furthermore, the observed tree species effects are potentially confounded by differences in stand age and soil horizon types—specifically the comparison between alder and birch, where the uppermost soil horizon was O and A, respectively. Future research with more extensive sampling is required to fully decouple these site-specific characteristics from the direct physiological influence of the tree species.
Ultimately, our findings indicate that tree species have a profound effect on the microbial activity and resource allocation of microbes in afforested mine soils. For forest management in reclaimed post-mining areas, our results emphasize that increasing soil carbon through recalcitrant litter (e.g., in pine stands) does not necessarily translate to higher microbial processing rates but rather forces a shift toward expensive nutrient-mining strategies that may exacerbate P limitation in aging forest ecosystems.

Author Contributions

A.K.: Writing—original draft; Data analysis; Sample collection and laboratory analyses; Sample collection and laboratory analyses. M.C.: Conceptualization; Data analysis; Writing—original draft; Funding acquisition, Project administration; Sample collection and laboratory analyses. All authors have read and agreed to the published version of the manuscript.

Funding

This study was financially supported by AGH University of Krakow, project no. 150000-501.00-10000.

Data Availability Statement

The data for this study are available from the corresponding author upon reasonable request.

Conflicts of Interest

The authors have no conflicts of interest to declare.

Abbreviations

AcPhAcid Phosphomonoesterase
AlkPhAlkaline Phosphomonoesterase
BGβ-1,4-Glucosidase
EESEcoenzymatic Stoichiometry
LAPL-leucine Aminopeptidase
NAGβ-1,4-N-acetylglucosaminidase
SIRSubstrate-Induced Respiration
SOCSoil Organic Carbon
WHCWater Holding Capacity

References

  1. Vindušková, O.; Pánek, T.; Frouz, J. Soil C, N and P dynamics along a 13 ka chronosequence of landslides under semi-natural temperate forest. Quat. Sci. Rev. 2019, 213, 18–29. [Google Scholar] [CrossRef]
  2. Hüblová, L.; Frouz, J. Contrasting effect of coniferous and broadleaf trees on soil carbon storage during reforestation of forest soils and afforestation of agricultural and post-mining soils. J. Environ. Manag. 2021, 290, 112567. [Google Scholar] [CrossRef]
  3. Wang, X.; Cui, Y.; Wang, Y.; Duan, C.; Niu, Y.; Sun, R.; Shen, Y.; Guo, X.; Fang, L. Ecoenzymatic stoichiometry reveals phosphorus addition alleviates microbial nutrient limitation and promotes soil carbon sequestration in agricultural ecosystems. J. Soils Sediments 2022, 22, 536–546. [Google Scholar] [CrossRef]
  4. Lorenz, M.; Thiele-Bruhn, S. Tree species affect soil organic matter stocks and stoichiometry in interaction with soil microbiota. Geoderma 2019, 353, 35–46. [Google Scholar] [CrossRef]
  5. Demoling, F.; Figuera, D.; Bååth, E. Comparison of factors limiting bacterial growth in different soils. Soil Biol. Biochem. 2007, 39, 2485–2495. [Google Scholar] [CrossRef]
  6. Berg, B. Decomposition patterns for foliar litter–a theory for influencing factors. Soil Biol. Biochem. 2014, 78, 222–232. [Google Scholar] [CrossRef]
  7. Zipper, C.E.; Burger, J.; Skousen, J.G.; Angel, P.N.; Barton, C.D.; Davis, V.; Franklin, J.A. Restoring forests and associated ecosystem services on Appalachian coal surface mines. Environ. Manag. 2011, 47, 751–765. [Google Scholar] [CrossRef] [PubMed]
  8. Cross, A.T.; Ivanov, D.; Stevens, J.C.; Sadler, R.; Zhong, H.; Lambers, H.; Dixon, K.W. Nitrogen limitation and calcifuge plant strategies constrain the establishment of native vegetation on magnetite mine tailings. Plant Soil 2021, 461, 181–201. [Google Scholar] [CrossRef]
  9. Manimel Wadu, M.C.W.; Duan, M.; Chang, S.X. Phosphorus availability and fractionation vary among forest site types in reconstructed oil sands soils. Can. J. For. Res. 2017, 47, 1372–1380. [Google Scholar] [CrossRef]
  10. Chodak, M.; Sroka, K.; Pietrzykowski, M. Activity of phosphatases and microbial phosphorus under various tree species growing on reclaimed technosols. Geoderma 2021, 401, 115320. [Google Scholar] [CrossRef]
  11. Soong, J.L.; Fuchslueger, L.; Maranon-Jimenez, S.; Torn, M.S.; Janssens, I.A.; Penuelas, J.; Richter, A. Microbial carbon limitation: The need for integrating microorganisms into our understanding of ecosystem carbon cycling. Glob. Change Biol. 2020, 26, 1953–1961. [Google Scholar] [CrossRef] [PubMed]
  12. Chodak, M.; Niklińska, M. The effect of different tree species on the chemical and microbial properties of reclaimed mine soils. Biol. Fertil. Soils 2010, 46, 555–566. [Google Scholar] [CrossRef]
  13. Chen, Z.; Jin, P.; Wang, H.; Hu, T.; Lin, X.; Xie, Z. Ecoenzymatic stoichiometry reveals stronger microbial carbon and nitrogen limitation in biochar amendment soils: A meta-analysis. Sci. Total. Environ. 2022, 838, 156532. [Google Scholar] [CrossRef]
  14. Moorhead, D.; Rinkes, Z.; Sinsabaugh, R.; Weintraub, M. Dynamic relationships between microbial biomass, respiration, inorganic nutrients and enzyme activities: Informing enzyme-based decomposition models. Front. Microbiol. 2013, 4, 223. [Google Scholar] [CrossRef]
  15. Moorhead, D.L.; Sinsabaugh, R.L.; Hill, B.H.; Weintraub, M.N. Vector analysis of ecoenzyme activities reveal constraints on coupled C, N and P dynamics. Soil Biol. Biochem. 2016, 93, 1–7. [Google Scholar] [CrossRef]
  16. Sinsabaugh, R.L.; Lauber, C.L.; Weintraub, M.N.; Ahmed, B.; Allison, S.D.; Crenshaw, C.; Contosta, A.R.; Cusack, D.; Frey, S.; Gallo, M.E.; et al. Stoichiometry of soil enzyme activity at global scale. Ecol. Lett. 2008, 11, 1252–1264. [Google Scholar] [CrossRef]
  17. Tapia-Torres, Y.; Elser, J.J.; Souza, V.; García Oliva, F. Ecoenzymatic stoichiometry at the extremes: How microbes cope in an ultra-oligotrophic desert soil. Soil Biol. Biochem. 2015, 87, 34–42. [Google Scholar] [CrossRef]
  18. Zhang, W.; Xu, Y.; Gao, D.; Wang, X.; Liu, W.; Deng, J.; Han, X.; Yang, G.; Feng, Y.; Ren, G. Ecoenzymatic stoichiometry and nutrient dynamics along a revegetation chronosequence in the soils of abandoned land and Robinia pseudoacacia plantation on the Loess Plateau, China. Soil Biol. Biochem. 2019, 134, 1–14. [Google Scholar] [CrossRef]
  19. Rosinger, C.; Rousk, J.; Sandén, H. Can enzymatic stoichiometry be used to determine growth-limiting nutrients for microorganisms?-A critical assessment in two subtropical soils. Soil Biol. Biochem. 2019, 128, 115–126. [Google Scholar] [CrossRef]
  20. Mori, T. Does ecoenzymatic stoichiometry really determine microbial nutrient limitations? Soil Biol. Biochem. 2020, 146, 107816. [Google Scholar] [CrossRef]
  21. Sawada, K.; Inagaki, Y.; Toyota, K.; Kosaki, T.; Funakawa, S. Substrate-induced respiration responses to nitrogen and/or phosphorus additions in soils from different climatic and land use conditions. Eur. J. Soil Biol. 2017, 83, 27–33. [Google Scholar] [CrossRef]
  22. Pietrzykowski, M.; Gruba, P.; Sproull, G. The effectiveness of Yellow lupine (Lupinus luteus L.) green manure cropping in sand mine cast reclamation. Ecol. Eng. 2017, 102, 72–79. [Google Scholar] [CrossRef]
  23. Chodak, M.; Pietrzykowski, M.; Niklińska, M. Development of microbial properties in a chronosequence of sandy mine soils. Appl. Soil Ecol. 2009, 41, 259–268. [Google Scholar] [CrossRef]
  24. de Carvalho Mendes, I. Standard Operating Procedure for Soil Enzyme Activities—β-glucosidases, Arylsulfatase, N-acetyl-β-glucosaminidase, Dehydrogenase, Phosphomonoesterases; FAO: Rome, Italy, 2025. [Google Scholar] [CrossRef]
  25. Daughtridge, R.C.; Nakayama, Y.; Margenot, A.J. Sources of abiotic hydrolysis of chromogenic substrates in soil enzyme assays: Storage, termination, and incubation. Soil Biol. Biochem. 2021, 158, 108245. [Google Scholar] [CrossRef]
  26. Anderson, J.P.E.; Domsch, K.H. A physiological method for the quantitative measurement of microbial biomass in soils. Soil Biol. Biochem. 1978, 10, 215–221. [Google Scholar] [CrossRef]
  27. Cleveland, C.C.; Liptzin, D. C:N:P stoichiometry in soil: Is there a “Redfield ratio” for the microbial biomass? Biogeochemistry 2007, 85, 235–252. [Google Scholar] [CrossRef]
  28. Rigueiro-Rodríguez, A.; Mosquera-Losada, M.R.; Fernández-Núñez, E. Afforestation of agricultural land with Pinus radiata D. don and Betula alba L. in NW Spain: Effects on soil pH, understorey production and floristic diversity eleven years after establishment. Land Degrad. Dev. 2012, 23, 227–241. [Google Scholar] [CrossRef]
  29. Burgess-Conforti, J.R.; Moore, P.A.; Owens, P.R.; Miller, D.M.; Ashworth, A.J.; Hays, P.D.; Evans-White, M.A.; Anderson, K.R. Are soils beneath coniferous tree stands more acidic than soils beneath deciduous tree stands? Environ. Sci. Pollut. Res. 2019, 26, 14920–14929. [Google Scholar] [CrossRef]
  30. Prescott, C.E.; Zabek, L.M.; Staley, C.L.; Kabzems, R. Decomposition of broadleaf and needle litter in forests of British Columbia: Influences of litter type, forest type, and litter mixtures. Can. J. For. Res. 2000, 30, 1742–1750. [Google Scholar] [CrossRef]
  31. Vesterdal, L.; De Vos, B.; Vanguelova, E.; Hansen, K. Tree species is the major factor explaining C:N ratios in European forest soils. For. Ecol. Manag. 2014, 311, 3–16. [Google Scholar] [CrossRef]
  32. Hansson, K.; Fröberg, M.; Helmisaari, H.-S.; Kleja, D.B.; Olsson, B.A.; Olsson, M.; Persson, T. Carbon and nitrogen pools and fluxes above and below ground in spruce, pine and birch stands in southern Sweden. For. Ecol. Manag. 2013, 309, 28–35. [Google Scholar] [CrossRef]
  33. Moore, T.R.; Trofymow, J.A.; Prescott, C.E.; Fyles, J.; Titus, B.D. Patterns of carbon, nitrogen and phosphorus dynamics in decomposing foliar litter in Canadian forests. Ecosystems 2006, 9, 46–62. [Google Scholar] [CrossRef]
  34. Kim, S.; Min, K. Similar microbial carbon limitation with soil depth despite decreasing carbon availability. J. Microbiol. Biotechnol. 2025, 35, e2506002. [Google Scholar] [CrossRef]
  35. Spohn, M.; Kuzyakov, Y. Phosphorus mineralization can be driven by microbial need for carbon. Soil Biol. Biochem. 2013, 61, 69–75. [Google Scholar] [CrossRef]
  36. Spohn, M.; Schleuss, P.M. Addition of inorganic phosphorus to soil leads to desorption of organic compounds and thus to increased soil respiration. Soil Biol. Biochem. 2019, 130, 220–226. [Google Scholar] [CrossRef]
  37. Vance, C.P.; Graham, P.H.; Allan, D.L. Biological nitrogen fixation: Phosphorus-a critical future need? In Nitrogen Fixation: From Molecules to Crop Productivity; Springer: Dordrecht, The Netherlands, 2000; pp. 509–514. [Google Scholar]
  38. Rastetter, E.B.; Vitousek, P.M.; Field, C.; Shaver, G.R.; Herbert, D.; Gren, G.I. Resource optimization and symbiotic nitrogen fixation. Ecosystems 2001, 4, 369–388. [Google Scholar] [CrossRef]
  39. Kanerva, S.; Kitunen, V.; Loponen, J.; Smolander, A. Phenolic compounds and terpenes in soil organic horizon layers under silver birch, Norway spruce and Scots pine. Biol. Fertil. Soils 2008, 44, 547–556. [Google Scholar] [CrossRef]
  40. Adamczyk, B.; Kitunen, V.; Smolander, A. Protein precipitation by tannins in soil organic horizon and vegetation in relation to tree species. Biol. Fertil. Soils 2008, 45, 55–64. [Google Scholar] [CrossRef]
  41. Preston, C.M.; Trofymow, J.A. Variability in litter quality and its relationship to litter decay in Canadian forests. Can. J. Bot. 2000, 78, 1269–1287. [Google Scholar] [CrossRef]
  42. Allison, S.D.; Weintraub, M.N.; Gartner, T.B.; Waldrop, M.P. Evolutionary-economic principles as regulators of soil enzyme production and ecosystem function. In Soil Enzymology; Springer: Berlin/Heidelberg, Germany, 2010; pp. 229–243. [Google Scholar] [CrossRef]
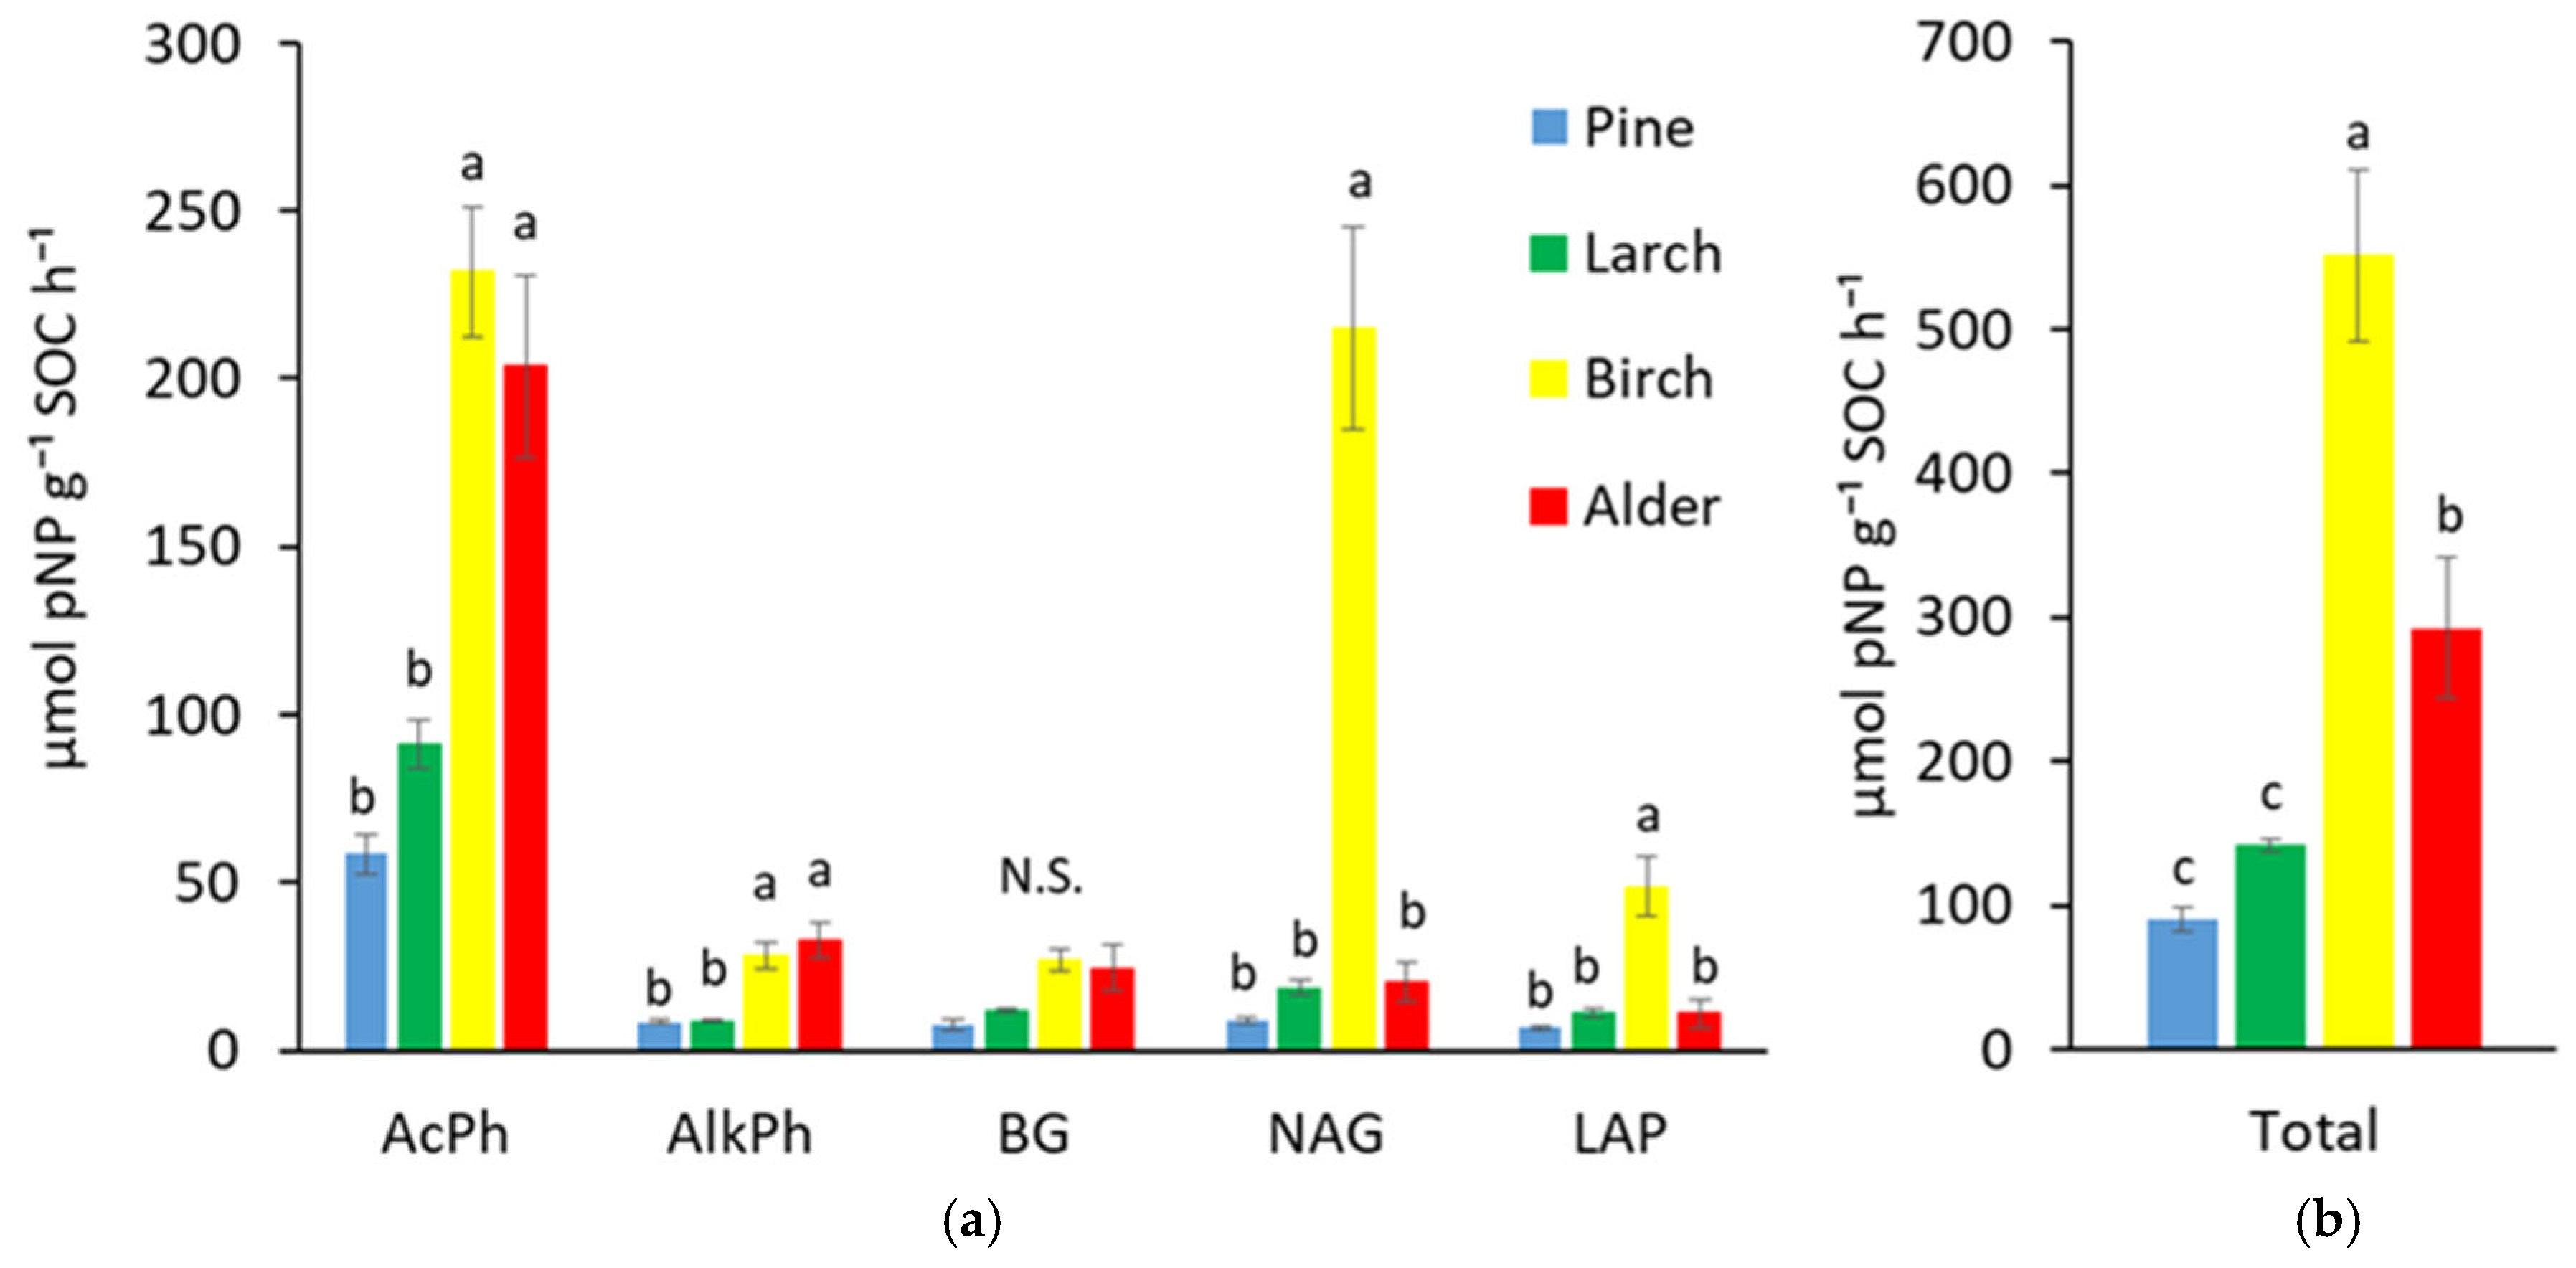
Figure 1. Activities of acid and alkaline phosphatase (AcPh and AlkPh, respectively), β-glucosidase (BG), leucine aminopeptidase (LAP), and N-acetyl-β-D-glucosaminidase (NAG) (a), and total enzyme activity (sum of the above five enzymes) (b) in soils under pine, larch, birch, and alder stands. Error bars present standard errors. Columns denoted with different letters differ significantly (p = 0.05; HSD Tukey test), N.S.—no significant effect of tree species.
Forests 17 00543 g001
Figure 2. Ratio of extracellular enzymes involved in C and N acquisition (C:N enzymes = BG:(BG + NAG + LAP) in relation to extracellular enzymes involved in C and P acquisition (C:P enzymes = BG:(BG + AcPh + AlkPh). Dots indicate vector endpoints for individual sites representing soils under alder (red), birch (yellow), larch (green), and pine (blue). Arrows represent vectors averaged over three sites representative of the tree species. The dotted line indicates 1:1 values.
Forests 17 00543 g002
Figure 3. Soil basal respiration rate. Mean values under alder, birch, larch, and pine. Error bars indicate standard errors. Differences are not statistically significant (N.S., p > 0.05).
Forests 17 00543 g003
Figure 4. Substrate-induced (SIR) respiration after the addition of glucose (+C), glucose and nitrogen (+CN), glucose and phosphorus (+CP), glucose and nitrogen and phosphorus (+CNP), nitrogen (+N), and phosphorus alone (+p). SIR is presented as the percentage of basal respiration. Columns denoted with different letters differ significantly (p = 0.05; HSD Tukey test), N.S.—no significant effect of tree species.
Forests 17 00543 g004
Table 1. ANOVA for C, N, and P contents, their ratios, and pH values in the soils under pine, larch, birch, and alder stands (n = 3).
SpeciesCNPC:NC:PpH
(mg g−1)(mg g−1)(µg g−1)
Pine373 ± 22 a8.8 ± 4.4 ab492 ± 10 ab42.4 ± 1.9 a756 ± 32 a4.1 ± 0.1 b
Larch219 ± 23 ab6.2 ± 0.3 ab458 ± 32 ab35.2 ± 2.5 a474 ± 22 b 4.2 ± 0.1 b
Birch63 ± 8 b2.7 ± 0.5 b238 ± 44 b24.5 ± 1.8 b279 ± 35 c5.3 ± 0.2 a
Alder228 ± 58 ab11.4 ± 2.7 a580 ± 103 a19.9 ± 0.5 b379 ± 29 bc5.4 ± 0.1 a
Notes: Presented are mean values ± standard errors. Values sharing the same letter do not differ significantly (p = 0.05, HSD Tukey test).
Disclaimer/Publisher’s Note: The statements, opinions and data contained in all publications are solely those of the individual author(s) and contributor(s) and not of MDPI and/or the editor(s). MDPI and/or the editor(s) disclaim responsibility for any injury to people or property resulting from any ideas, methods, instructions or products referred to in the content.