Article

Local Tree Cover and Regional Climate Hierarchically Shape Ant Communities in Mediterranean Dehesas

by
Francisco Jiménez-Carmona
* and
Joaquín L. Reyes-López
Department of Botany, Ecology and Plant Physiology, University of Córdoba, 14071 Córdoba, Spain
*
Author to whom correspondence should be addressed.
Forests 2026, 17(3), 397; https://doi.org/10.3390/f17030397
Submission received: 27 February 2026 / Revised: 17 March 2026 / Accepted: 20 March 2026 / Published: 23 March 2026
(This article belongs to the Section Forest Biodiversity)

Abstract

Mediterranean dehesas are open agroforestry systems in which tree configuration and climatic regime condition the organisation of biodiversity. In these landscapes, ants are commonly used as ecological indicators, although the relative importance of local versus regional factors in structuring their communities remains poorly defined. Ant assemblages were sampled using pitfall traps at 15 farms in southern Spain, and the influence of environmental variables defined at two spatial scales was analysed: microhabitat, distinguishing between areas under tree canopy and open areas, and farm as a unit representative of the regional context. The multivariate analyses applied (dbRDA, PERMANOVA and variance partitioning) reveal a hierarchical organisation of community assemblages. At the local scale, community variation was primarily explained by structural attributes of the tree layer, particularly canopy cover and distance to trees. At the farm scale, environmental predictors explained a modest proportion of community variation, with strong overlap among climatic, vegetation and structural variables. Overall, the structure of ant communities in dehesas follows a scale-dependent pattern, in which climate sets the regional framework and tree structure modulates assemblage organisation at a fine scale.

1. Introduction

Dehesas constitute one of the most extensive and representative agrosilvopastoral systems in southwestern Europe, particularly in the Iberian Peninsula, where they form landscapes of high ecological, productive and cultural value [1,2,3]. They are characterised by a dispersed tree canopy dominated by species of the genus Quercus and an herbaceous matrix subject to extensive livestock grazing and long-term historical management. This management consists of the combination of extensive grazing and the selection and management of trees, which has generated high structural and functional heterogeneity [4,5]. This complexity has enabled dehesas to maintain high levels of biodiversity compared with other ecosystems subjected to intensive agriculture, acting as refuges for numerous plant and animal species [6,7]. However, these ecosystems are currently threatened by processes of intensification, abandonment of traditional management and socio-economic changes, which are compromising their ecological functionality and their capacity to provide ecosystem services [6,8].
Dispersed trees constitute a key structural element in dehesas, as they directly modulate the microclimatic and edaphic conditions of the environment. The presence of trees reduces the radiation reaching the soil, buffers extreme temperatures, increases soil moisture, and promotes the accumulation of organic matter, generating mosaics of microhabitats that contrast with the surrounding matrix [9,10,11,12,13,14]. In human-modified landscapes, isolated trees have been identified as keystone structures [15]: structures whose contribution to ecosystem functioning and biodiversity maintenance is disproportionately high relative to the small area they occupy.
Assessing the ecological status of complex agroforestry systems such as dehesas requires the use of biological indicators that are sensitive to environmental gradients and management changes. Among epigeic arthropods, ants (Hymenoptera: Formicidae) stand out due to their high diversity, abundance, and functional relevance, as well as their predictable responses to environmental factors and disturbances, which has widely supported their use as bioindicators [16,17]. In addition, they play an essential role as ecosystem engineers as they alter soil structure and fertility, nutrient cycling and the redistribution of resources, with effects that extend beyond their own biomass [18,19,20].
In Mediterranean ecosystems, the composition and structure of ant communities have been closely linked to thermal gradients, resource availability and habitat structure, showing different patterns depending on the spatial scale considered [21,22,23]. At the local scale, factors such as vegetation cover, proximity to trees and immediate microclimatic conditions can modulate surface activity and species diversity [24,25]. At broader scales, regional environmental filters, particularly maximum temperatures during the period of activity and water availability, condition community presence and composition, acting as physiological and biogeographical limits [26,27].
Beyond their value as bioindicators, there is growing applied interest in the use of ants as a surrogate group for epigeic arthropods as a whole. In dehesa systems of northern Andalusia, a significant correspondence has been demonstrated between the patterns of diversity and composition of ant communities and those of the overall epigeic arthropod assemblage captured using pitfall traps, reinforcing their usefulness as an efficient ecological diagnostic tool in these landscapes [28]. Nevertheless, the effectiveness of surrogacy and the interpretation of observed patterns depend critically on the spatial scale at which both communities and their environmental predictors are evaluated [16,29].
In this context, the present study adopts a multiscale approach to evaluate the factors structuring ant communities in Mediterranean dehesa systems. Two main hypotheses are proposed: (H1) at the local (microhabitat) scale, vegetation cover and, in particular, dispersed trees act as generators of microenvironmental heterogeneity, modulating community diversity and composition; and (H2) at the landscape (farm) scale, the main determinants of community composition correspond to climatic filters, especially maximum temperatures during the period of activity and water availability, overriding local structural factors. Testing these hypotheses advances our understanding of the multiscale processes operating in dehesas and helps assess the potential of ants as ecological bioindicators in these agroforestry systems.

2. Materials and Methods

2.1. Study Area

The study was conducted in the dehesa system of Sierra Morena (southern Iberian Peninsula), a Mediterranean agroforestry landscape characterised by a matrix of wooded grasslands mainly dominated by species of the genus Quercus. This system exhibits high structural and functional heterogeneity, resulting from the historical interaction between climatic, edaphic, and traditional management factors. The climate is Mediterranean, with hot, dry summers and mild winters, and marked interannual variability in precipitation.
A total of 15 farms were sampled (Figure 1, Table 1), corresponding to those included in a LIFE project focused on the conservation and sustainable management of dehesas. Taken together, these farms encompass a large proportion of the environmental and structural variability characteristic of dehesa systems in Sierra Morena, including gradients of tree cover, vegetation productivity, and topographic conditions.

2.2. Sampling Design and Ant Sampling

At each farm, a total of 40 pitfall traps were established for the capture of epigeic ants. The traps were arranged along a single linear transect of approximately 1600 m in length and placed at intervals of at least 40 m (Figure S1). This distance is commonly used in studies of surface-active ant communities and is considered sufficient to ensure sample independence without compromising spatial representativeness. For field organisation, the traps were grouped into sets of 10, hereafter referred to as “lines”. This term is used only for logistical purposes and does not represent an analytical unit. Each trap consisted of a translucent plastic urine-sample container (mouth diameter 5.7 cm, base diameter 5 cm, depth 7.3 cm, capacity 150 mL; Ref. 409702, Deltalab SL, Rubí, Spain).
The traps consisted of plastic containers buried flush with the soil surface and partially filled (30–35 mL) with a 1% soapy solution, intended to reduce surface tension and increase capture efficiency [30]. The sampling period was selected to coincide with the peak of surface activity of ants in Mediterranean ecosystems, determined primarily by thermal constraints [31]. Traps remained active for 48 h, an exposure time that minimises the digging-in effect associated with their installation; in Mediterranean ecosystems, differences in community composition attributable to this effect disappear after 48 h [32].
Sampling was conducted in 2016 and 2017, with each farm surveyed in a single year (see Table 1). Consequently, year was treated as descriptive metadata rather than as a predictor, based on the interannual stability documented in previous studies [28]. Captured ants were separated from the rest of the sample and preserved in ethanol for identification to species level using specialised taxonomic keys. Other epigeic arthropods collected in the pitfall traps were not considered in the present study and were excluded from further analyses.

2.3. Data Treatment and Quality Control

Traps with no captures were excluded from the analyses when sampling incidents were identified (e.g., trampled traps, incorrectly placed traps, or traps that had been disturbed). To rule out potential ecological bias, the environmental conditions of excluded traps were visually compared with those retained, and no systematic differences likely to affect the results were detected.

2.4. Environmental Variables

Environmental variables were compiled at two spatial scales (trap and farm) and grouped into different ecological blocks, including climate, vegetation/productivity, topography, and tree structure (Table S1). Climatic variables corresponded to the 19 bioclimatic variables (BIO1–BIO19) derived from the CHELSA v2.1 database [33]. Given the spatial resolution of the CHELSA dataset (~1 km), climatic values did not vary among traps within the same farm and therefore represent the broader climatic context of each site rather than local microhabitat conditions. Vegetation and productivity variables were obtained as spectral indices (NDVI, EVI, NDMI, BSI, NBR, and SAVI) calculated from Landsat [34] and Sentinel-2 imagery [35], processed using Google Earth Engine [36]. In addition, NDVI metrics derived from MODIS [37] were included to characterise peak productivity. Topographic variables (elevation, slope, and aspect) were obtained from the 5 m resolution Digital Elevation Model of the PNOA [38].
At the trap scale, vegetation and tree structure variables were calculated within a circular buffer with a radius of 10 m, an appropriate scale for capturing microhabitat conditions relevant to epigeic ants, which influence their activity and foraging [25]. Local tree structure metrics included canopy cover within a 10 m buffer around each trap (TREE_COV10_PCT), calculated from classified high-resolution PNOA orthophotographs refined by manual crown delineation, and distance to the nearest tree (TREE_DIST), together with topographic variables.

2.5. Tree Sampling and Dehesa Canopy Cover

Different tree-related variables were measured between spring and autumn of 2014 and 2015. At each farm, two transects approximately 120 m in length and 20 m in width were established, including a total of 20 trees. In farms with low tree density, transects were extended until 20 trees were reached or a maximum length of 300 m was attained.
Trees were marked with numbered tags and the species of each individual was recorded. For each tree, dasometric measurements were obtained, including trunk circumference at breast height (CBH, measured at 1.3 m above ground level), total height, and crown diameter. Height and crown diameter were measured using a Christen ruler, while trunk circumference was measured with a measuring tape. Mean values per farm were calculated from these variables and used to characterise tree structure at the farm scale.

2.6. Statistical Analyses

To examine the relationship between ant communities and the environment, multivariate analyses were conducted at two spatial scales (trap and farm). In all cases, analyses focused on community-level patterns.

2.6.1. Response Matrices and Dissimilarities

At the trap scale, the community matrix was constructed from species abundances per trap. At the farm scale, community response was defined as species occupancy, expressed as the number of traps occupied and the corresponding percentage relative to the total number of traps sampled at each farm. Community dissimilarities were calculated using the Bray–Curtis index (for abundance or percentage occupancy data) and, additionally at the trap scale, using the Jaccard index based on presence–absence data.

2.6.2. Selection of Environmental Predictors

Environmental variables were grouped into ecological blocks (climate, vegetation/productivity, topography, and tree structure). Within each block, collinearity was assessed using Spearman correlations, and highly correlated predictors (r ≥ 0.7) were removed, retaining a non-redundant subset of variables.
The BIOENV procedure [39], implemented in the vegan package [40], was applied to the previously filtered set of variables. BIOENV identifies the subset of predictors showing the highest Spearman correlation with community dissimilarities through an exhaustive search of possible combinations. At the trap scale, BIOENV was run for both Bray–Curtis and Jaccard dissimilarities, and the union of variables selected under both criteria was used in subsequent analyses. At the farm scale, BIOENV was applied to Bray–Curtis dissimilarities calculated from percentage occupancy data.
In all cases, BIOENV was applied to the original (untransformed) community matrices, as the method is rank-based and robust to data scale.

2.6.3. Community–Environment Relationships

To explore patterns of community structure and their relationship with environmental predictors, we applied a complementary multivariate framework combining constrained ordination (dbRDA), unconstrained ordination (NMDS), and permutation-based hypothesis testing (PERMANOVA).
The association between community composition and selected environmental predictors was evaluated using distance-based redundancy analysis (dbRDA), employing the capscale function of the vegan package. For these analyses, community matrices were first Hellinger-transformed in order to operate in a Euclidean space, and model significance was subsequently assessed using permutation tests.
In addition, permutational analysis of variance (PERMANOVA; adonis2 function) was applied using Bray–Curtis dissimilarities, performing both sequential and marginal tests. At the trap scale, permutations were restricted by farm to account for the hierarchical sampling structure, using restricted permutation schemes defined with the permute package.
To verify that differences detected by PERMANOVA were not influenced by heterogeneity in multivariate dispersion among groups, homogeneity of dispersions was assessed using PERMDISP (betadisper function, vegan package), with permutation tests (permutest), considering farms as groups.
As a complement to constrained multivariate analyses, a non-metric multidimensional scaling (NMDS) ordination was performed based on Bray–Curtis dissimilarities calculated from species percentage occupancy at the farm scale. Environmental variables selected for this scale were fitted to the ordination using envfit (999 permutations), and only those showing significant associations with the ordination configuration (p < 0.05) were represented.

2.6.4. Variance Partitioning

Finally, the relative contribution of different predictor blocks to variation in community composition at the farm scale was quantified using variance partitioning (varpart). Predictor sets included climate, vegetation/productivity, topography, and space, with the spatial component represented by the geographic coordinates (XM, YM) of farm centroids. Variance partitioning was conducted exclusively at the farm scale; therefore, local tree structure variables derived at the trap scale were not included. The significance of individual fractions was evaluated using partial redundancy models (pRDA) using the capscale function.
All statistical analyses were performed in the R environment [41], using primarily the vegan package for ecological community analyses [40] and the permute package for defining restricted permutation schemes [42].

3. Results

3.1. Trap Scale: Local Variation in Community Composition

A total of 568 traps out of the 600 deployed were analysed. The 32 traps not included in the analyses corresponded to traps that were filled with soil, broken, or displaced (see Table 1). A total of 49 ant species belonging to 17 genera were recorded (Table 2).
The ant community was dominated by thermophilous species characteristic of open Mediterranean environments, particularly Cataglyphis hispanica (Emery, 1906), Messor barbarus (Linnaeus, 1767), Iberoformica subrufa (Roger, 1859), and the Tapinoma nigerrimum species complex (Nylander, 1856), which were present in most of the sampled farms. In addition, species associated with more structurally complex microhabitats or higher tree cover were recorded, especially representatives of the genus Aphaenogaster and several species of Temnothorax, reflecting the structural heterogeneity characteristic of dehesa ecosystems. The coexistence of a high number of generalist species together with the presence of specialist taxa suggests a community assemblage influenced by both regional thermal conditions and local microenvironmental variability.
The set of environmental variables selected by BIOENV to explain variation in community composition at this scale included two climatic variables (BIO2_trap, mean diurnal temperature range; BIO3_trap, isothermality), two tree-structure variables (TREE_COV10_PCT, tree canopy cover within a 10 m radius; TREE_DIST, distance to the nearest tree), and one topographic variable (ELEV_M, elevation) (Table 3).
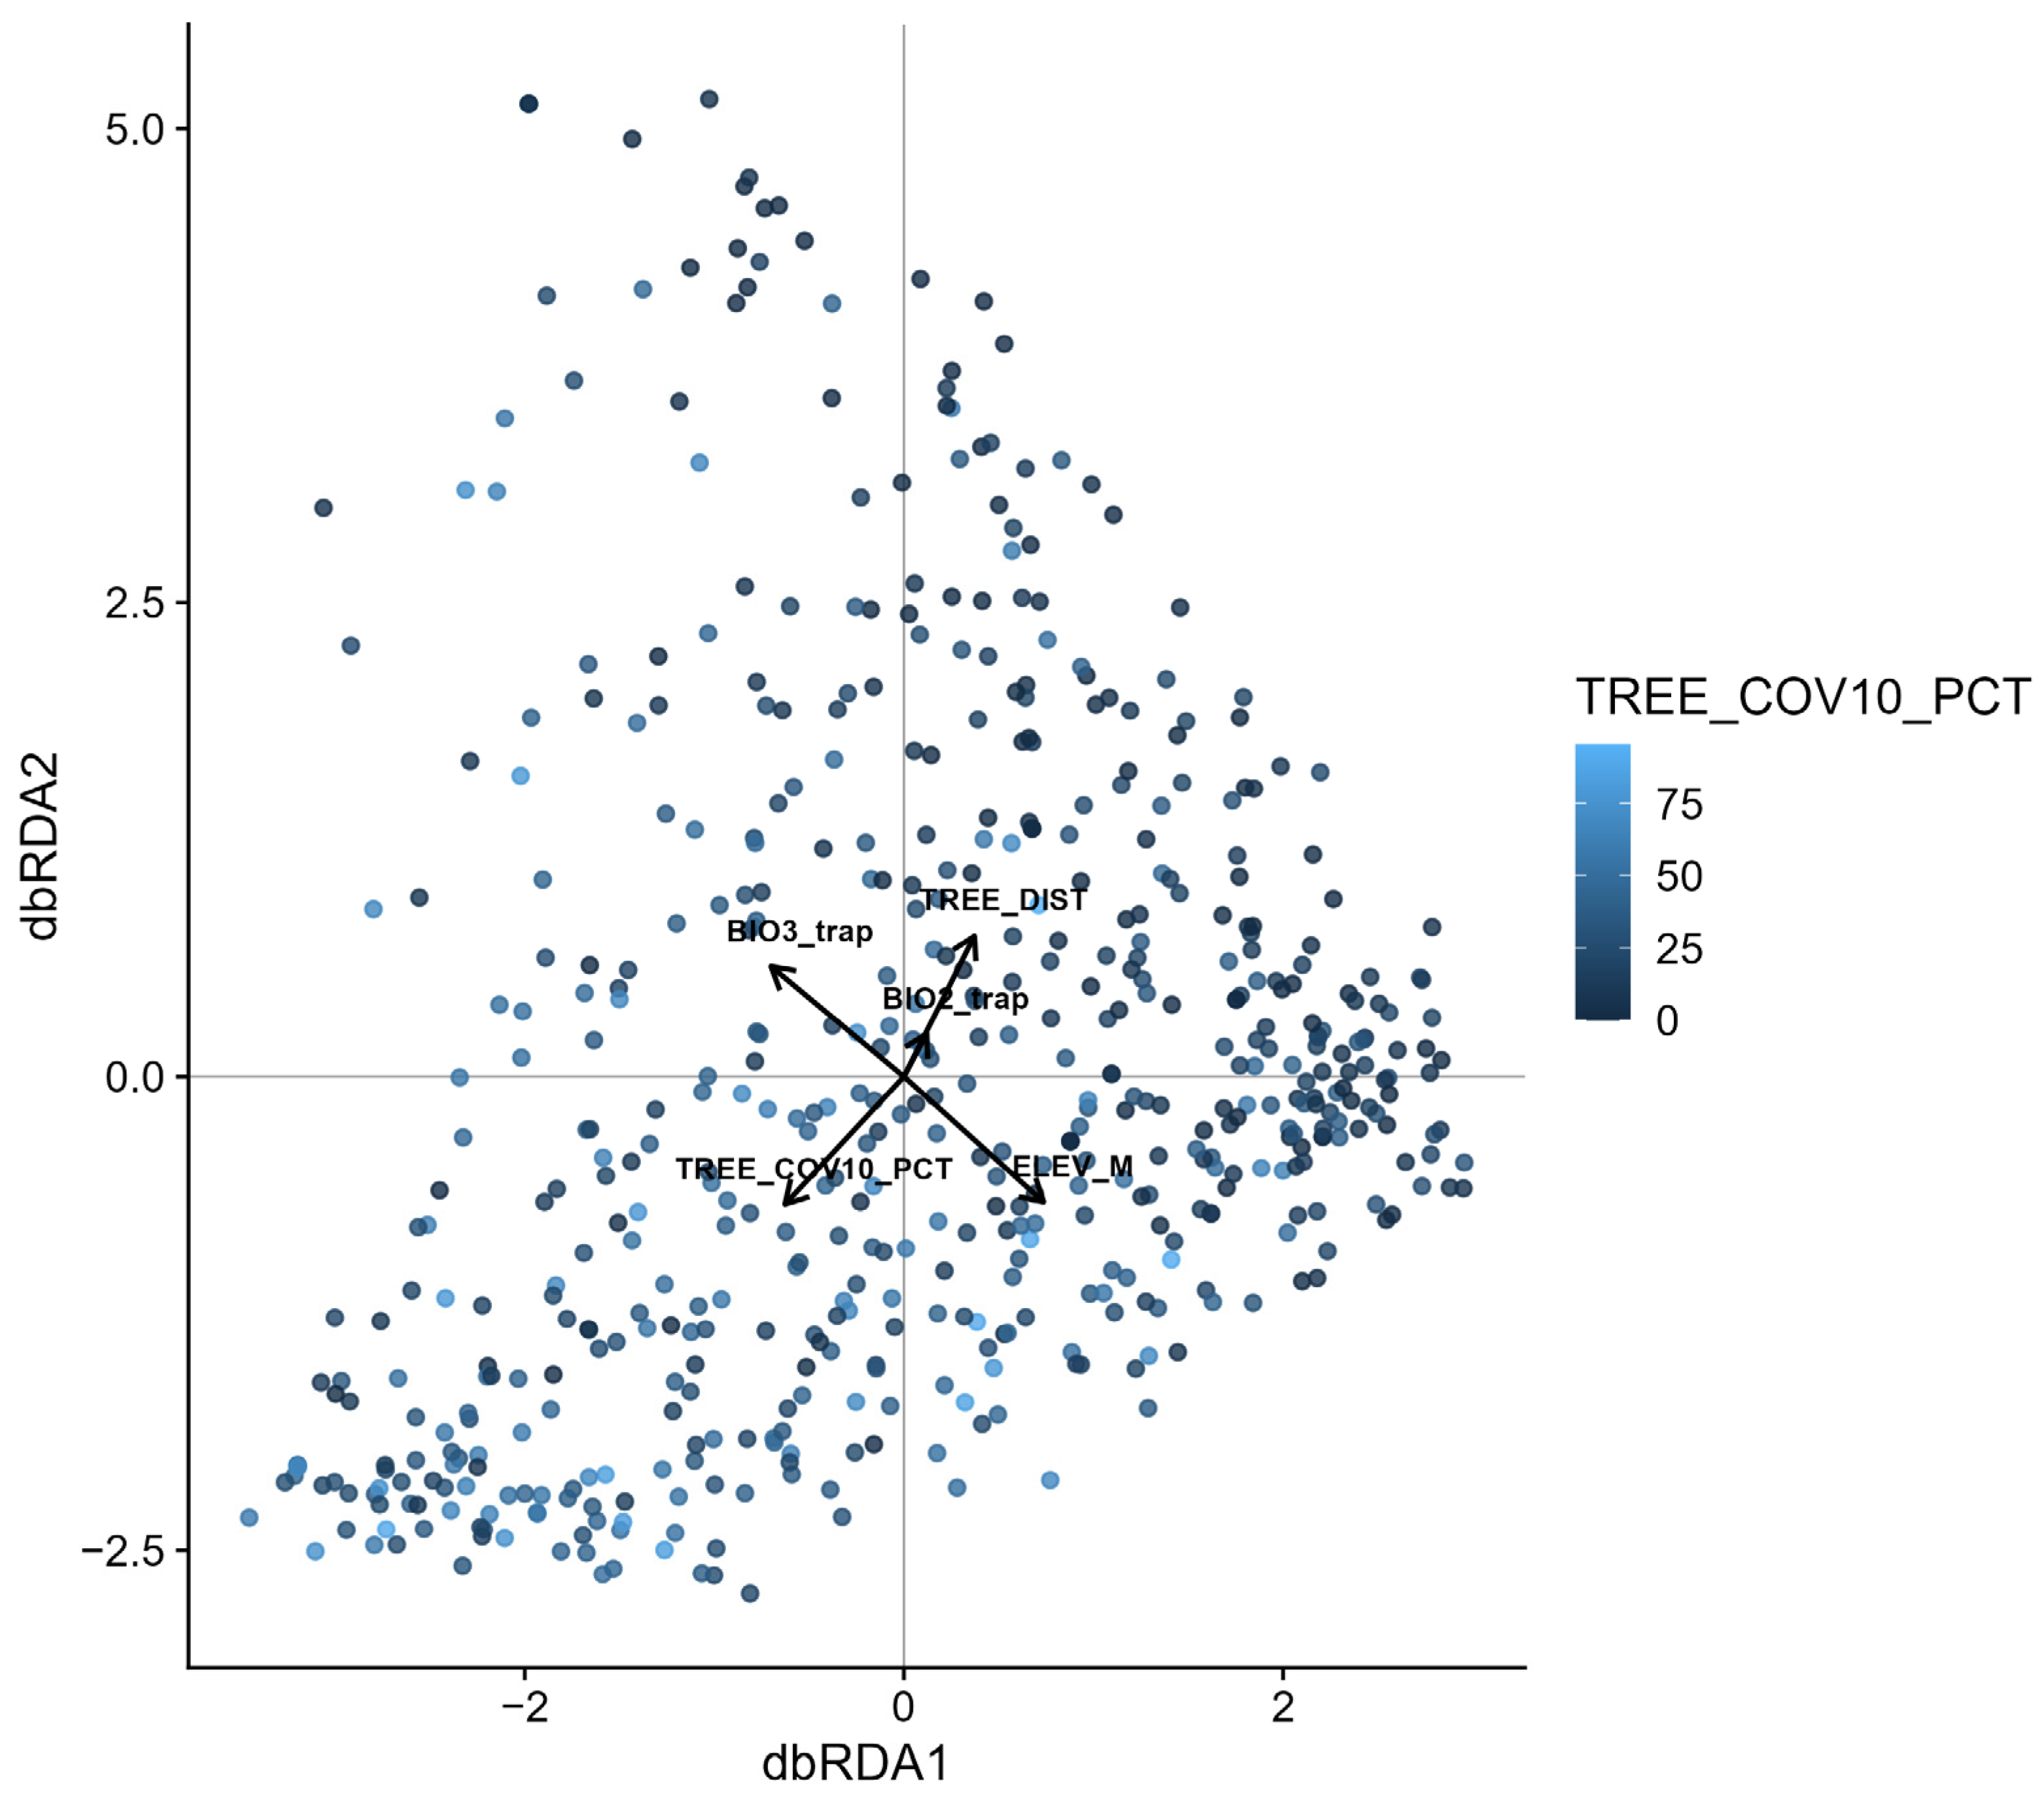
The distance-based redundancy analysis (dbRDA) indicated that the global model was significant (F = 12.389, p = 0.001). In the sequential analysis, four of the five predictors contributed significantly to explaining community variation (BIO3_trap, TREE_COV10_PCT, ELEV_M, and TREE_DIST; p = 0.001), whereas BIO2_trap did not show a significant effect (p = 0.257). In the marginal analysis, which evaluates the unique contribution of each variable, only tree canopy cover (TREE_COV10_PCT; p = 0.001), elevation (ELEV_M; p = 0.002), and distance to the nearest tree (TREE_DIST; p = 0.001) showed significant effects (Figure 2).
PERMANOVA analyses showed a similar pattern, with all terms significant in the sequential analysis (bio2: F = 9.1147, R2 = 0.0147, p = 0.001; bio3: F = 20.5492, R2 = 0.0332, p = 0.001; TREE_COV10_PCT: F = 16.5282, R2 = 0.0267, p = 0.001; ELEV_M: F = 6.9171, R2 = 0.0112, p = 0.003; TREE_DIST: F = 3.3054, R2 = 0.0053, p = 0.001), whereas in the marginal analysis only TREE_COV10_PCT (F = 6.5619, R2 = 0.0106, p = 0.001), ELEV_M (F = 6.9915, R2 = 0.0113, p = 0.004), and TREE_DIST (F = 3.3054, R2 = 0.0053, p = 0.001) remained significant. The PERMDISP test revealed significant heterogeneity in multivariate dispersion among farms (F = 3.6716, p = 0.001), indicating that differences detected by PERMANOVA may reflect both shifts in centroid position and variation in within-group dispersion. Dispersion diagnostics showed that farms EN04, AP05, CO05, AP06, and CO01 had the greatest mean distances to the centroid (0.569–0.604), compared with an overall range of 0.493–0.604 across all farms.

3.2. Farm Scale: Landscape-Level Variation

At the farm scale, community composition was characterised using the percentage occupancy of the 49 species across the 15 sampled farms. The set of selected environmental variables included two climatic variables (BIO3_farm, isothermality; BIO10_farm, mean temperature of the warmest quarter), one vegetation variable (NDVIsd_farm, temporal variability of NDVI), one topographic variable (ELEVm_farm, median elevation), and one structural variable (CBHm_farm, mean trunk circumference at breast height).
The global dbRDA was significant (F = 1.8133, p = 0.001). In the sequential analysis, the climatic variables BIO3_farm (F = 3.8247, p = 0.001) and BIO10_farm (F = 1.8811, p = 0.036) contributed significantly to explaining community variation, whereas NDVIsd_farm (F = 1.3799, p = 0.156), ELEVm_farm (F = 1.0689, p = 0.358), and CBHm_farm (F = 0.9121, p = 0.507) did not show significant effects. In the marginal analysis, none of the predictors showed a significant unique contribution (BIO3_farm: F = 1.0188, p = 0.400; BIO10_farm: F = 1.1592, p = 0.282; NDVIsd_farm: F = 1.3489, p = 0.165; ELEVm_farm: F = 1.0287, p = 0.392; CBHm_farm: F = 0.9121, p = 0.536). PERMANOVA results reflected the same pattern, with significant sequential effects for BIO3_farm (F = 4.0560, R2 = 0.2128, p = 0.001) and BIO10_farm (F = 2.2334, R2 = 0.1172, p = 0.019), but no significant marginal effects.
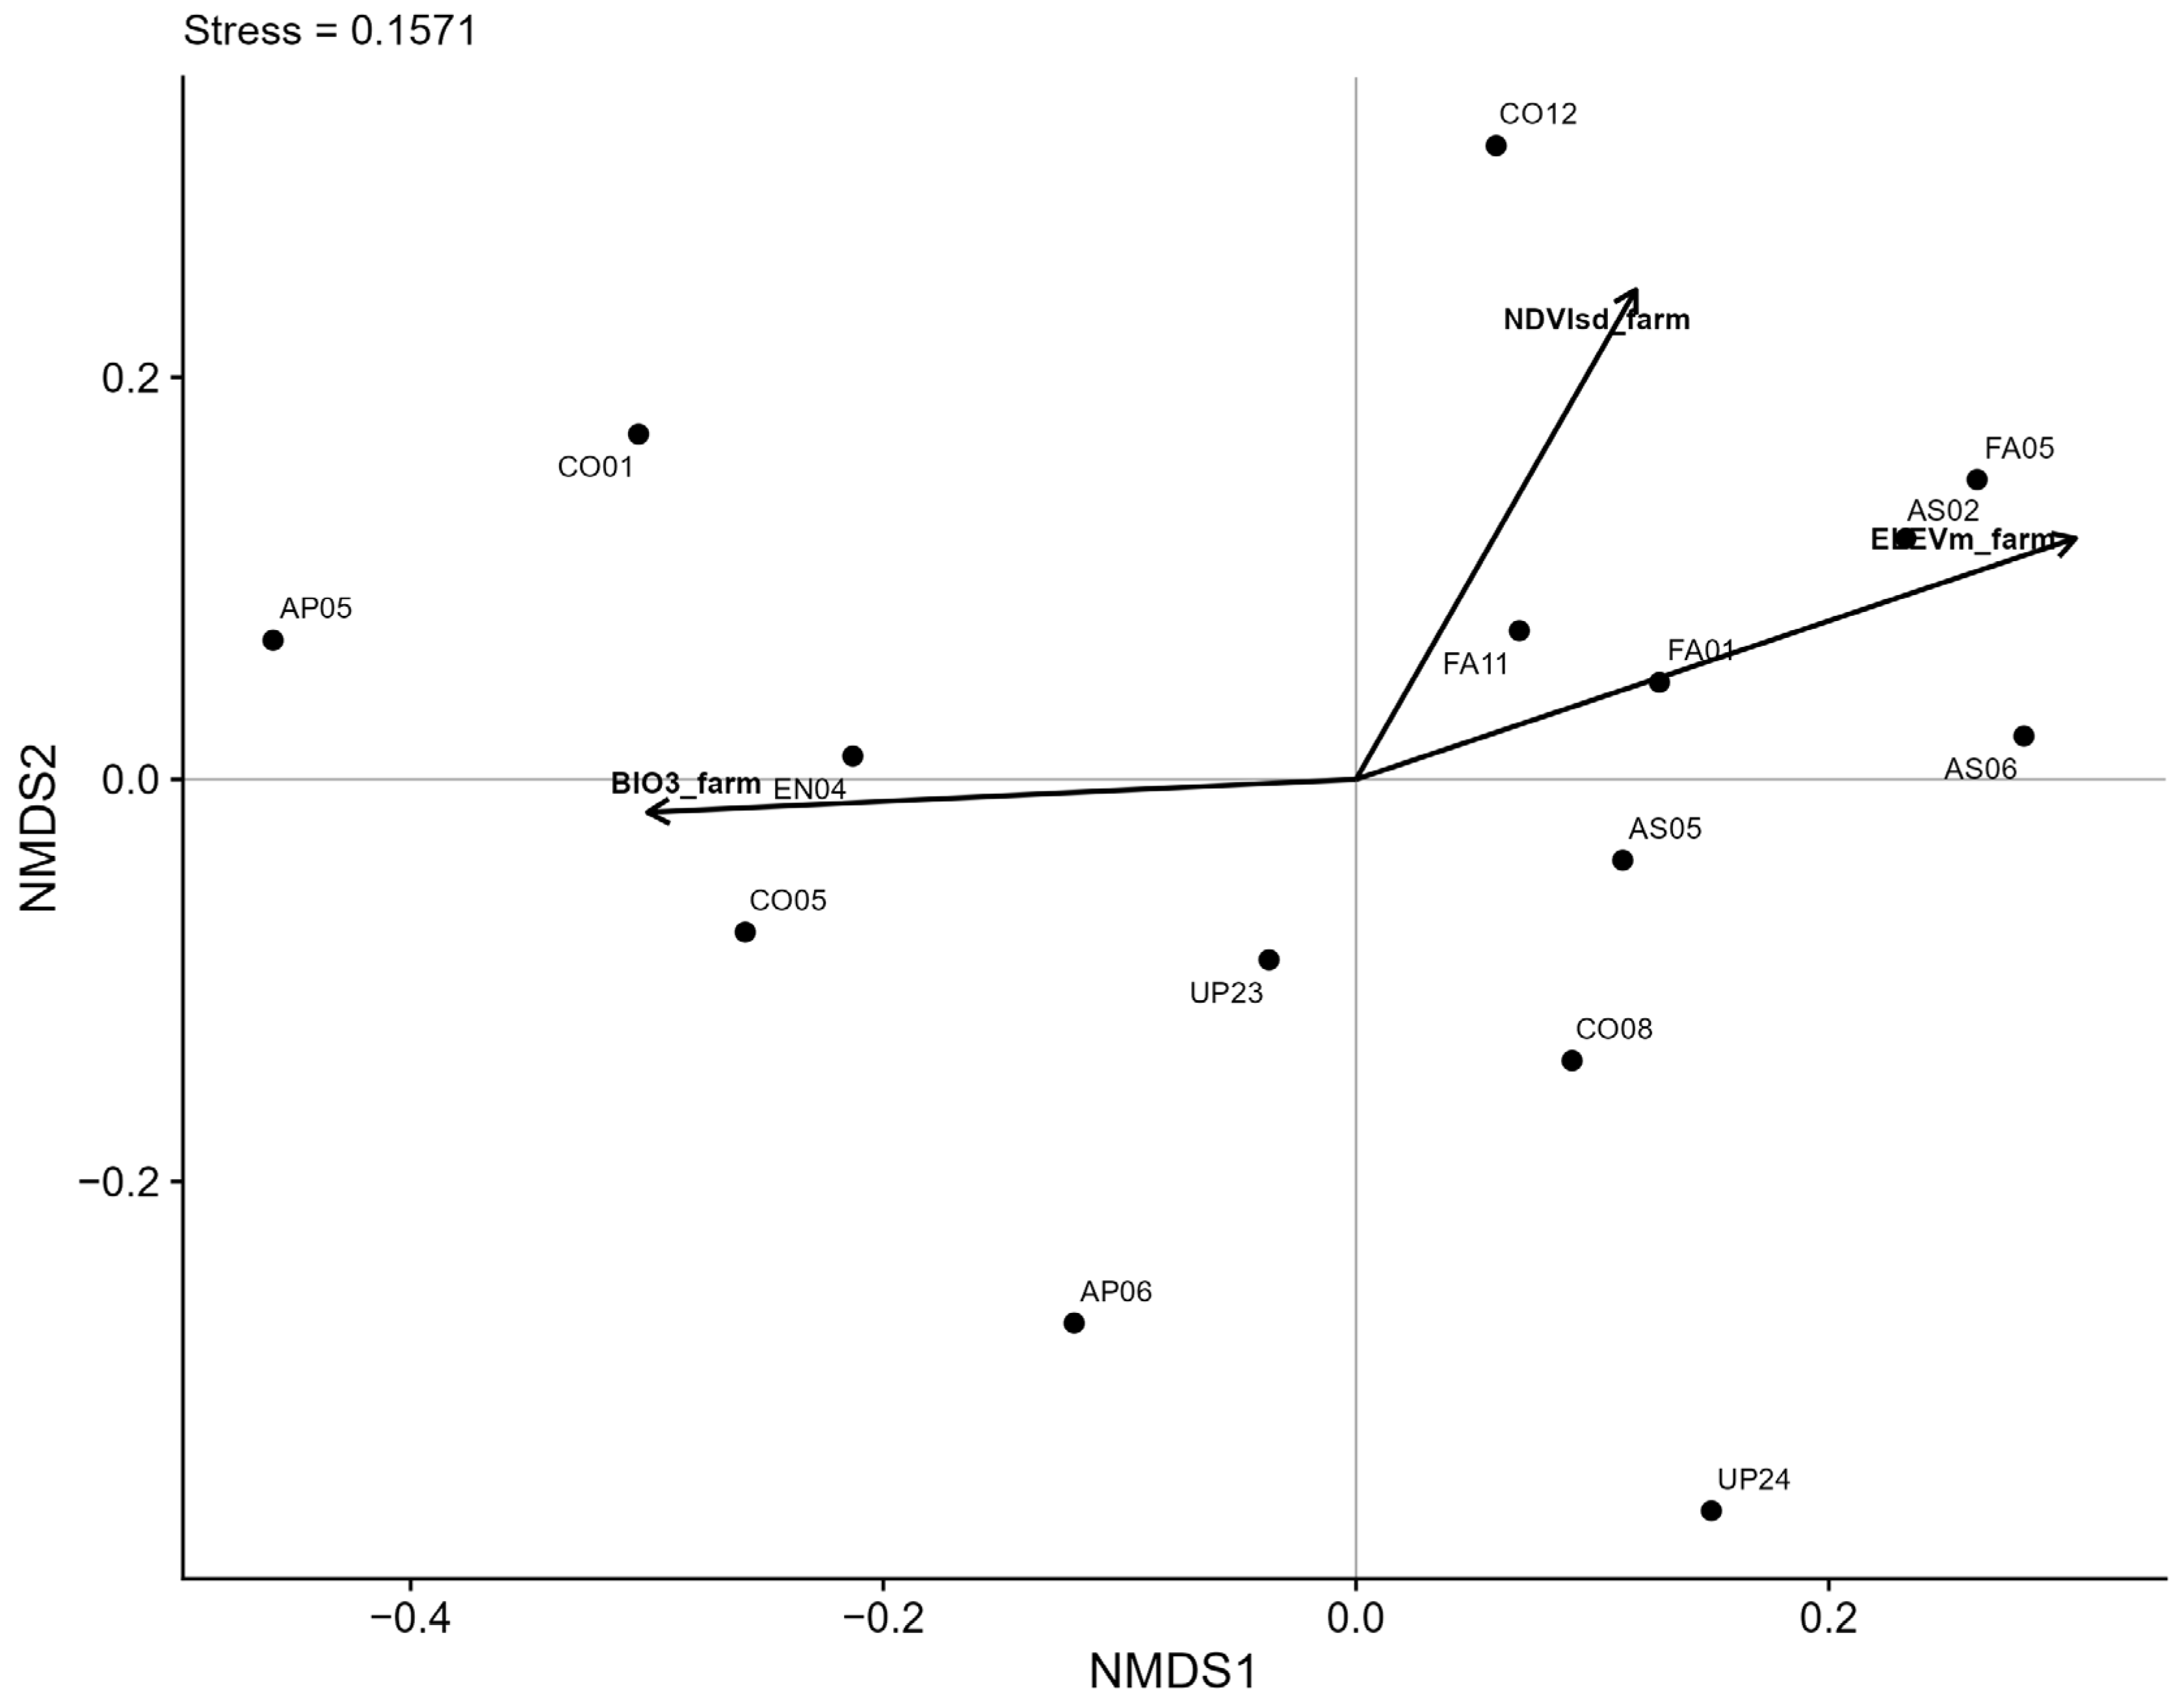
The NMDS ordination at the farm scale (stress = 0.157) showed a community structure mainly associated with broad climatic gradients and environmental heterogeneity among farms. Environmental variables fitted using envfit showed significant associations with isothermality (BIO3_farm), elevation (ELEVm_farm), and temporal variability of NDVI (NDVIsd_farm), whereas other variables considered at this scale, such as mean temperature of the warmest quarter (BIO10_farm) or mean tree cover, did not show significant relationships with the ordination configuration (Figure S2; Figure 3).
Variance partitioning (VARPART) showed that the four predictor sets considered (climate, vegetation, topography, and space) jointly explained 21.8% of the variation in community composition. However, partial redundancy analyses (pRDA) indicated that none of the individual fractions were significant, including the pure climate fraction (F = 0.8927, p = 0.651) and the vegetation fraction (F = 0.9933, p = 0.481), reflecting strong overlap among predictor blocks and a predominance of unexplained variation (78.2%).

4. Discussion

This study addresses a central question in the ecology of Mediterranean agroforestry systems: whether the clearly detectable local-scale influence of dispersed trees on ant communities is maintained when the analysis is expanded to the farm level, or whether regional climatic gradients instead predominantly structure assemblages. The distinction between local and regional processes, widely formalised in spatial ecology [43,44], is particularly relevant in dehesas, an intensively managed system where structural heterogeneity coexists with a strong anthropogenic imprint. Our results show that the relative importance of environmental factors is scale-dependent, revealing a hierarchical pattern in community structuring.

4.1. Local Processes: Tree Structure and Microenvironmental Heterogeneity

At the trap scale, local tree structure was consistently associated with ant community composition. Both tree canopy cover within a 10 m radius and distance to the nearest tree emerged as relevant predictors, outweighing the influence of local climatic variables. Genera such as Aphaenogaster and Temnothorax, which are more frequently associated with shaded and structurally complex microhabitats, were preferentially linked to tree-influenced traps. This pattern is consistent with the recognition of dispersed trees as keystone structures in open systems, as they generate differentiated microenvironments that directly modify the thermal, hydric, and structural conditions of the soil [10,12,15]
The presence of trees buffers thermal extremes, reduces incident radiation, and promotes litter accumulation and substrate complexity [3,13], thereby affecting surface activity, nest placement, and the coexistence of species with different physiological tolerances and ecological strategies in Mediterranean ants [22,45]. Overall, our results reinforce evidence that fine-scale structural heterogeneity plays a key role in the organisation of assemblages in semi-natural landscapes [46]. Similar patterns have also been reported in other European wood–pasture systems, where scattered trees and microhabitat heterogeneity promote shifts in ant community composition and diversity [14,47].
In the specific context of dehesas, holm oaks have been described as generators of “islands of diversity” whose influence extends beyond the canopy [10,12,14,28,48]. The detected association between tree structure and community composition confirms that this heterogeneity is ecologically functional at the local scale.

4.2. Climate and Topography at the Local Scale

Climatic variables considered at the trap scale showed limited and non-independent effects in marginal analyses, suggesting that climate sets a general environmental framework within which other, more organism-proximate factors operate. This result may partly reflect the coarse spatial resolution of the CHELSA dataset (~1 km), which captures regional climatic conditions rather than microhabitat variation among traps. This pattern is consistent with hierarchical frameworks of community structuring in ants across spatial scales. Against this climatic background, habitat structure and topography appear to modulate the effective distribution of species, in line with studies highlighting the interaction between broad environmental filters and local modulators in ant assemblages [49]. Accordingly, numerous studies show that temperature imposes broad physiological limits on ants [23,27], but that its effects can be attenuated by local structural heterogeneity [45].
Elevation showed a consistent effect, probably due to its integrative nature across multiple environmental gradients. In Mediterranean ecosystems, these results support the idea that regional climatic gradients define the general environmental framework, while microenvironmental factors determine the fine-scale organisation of communities [22,50].
The significant heterogeneity in multivariate dispersion among farms detected by PERMDISP provides additional insight into the internal variability of the system. This result suggests that differences observed among farms may involve both shifts in centroid position and patterns of internal heterogeneity in community composition. Given that multivariate dispersion can be interpreted as a measure of community heterogeneity [51], the observed differences likely reflect real contrasts in the internal ecological complexity of farms. These differences may be associated with management factors not quantified in this study, such as grazing pressure or management history, a hypothesis that would require specific experimental designs to test.

4.3. Farm Scale: Shared Climatic Signal and Residual Variance

When the analysis was scaled up to the farm level, the environmental signal was dominated by broad climatic variables, particularly isothermality, together with elevation and temporal variability in vegetation productivity. The significant association with isothermality suggests that annual thermal stability constitutes a relevant filter at this scale, in agreement with studies emphasising the importance of broad thermal gradients in structuring Mediterranean ant communities [23,52]. Likewise, elevation may act as an integrative variable encompassing multiple environmental gradients, including temperature, moisture, and productivity, and has been widely documented as a key determinant of ant community composition at regional scales [53,54]. The observed relationship with temporal variability in NDVI indicates that interannual differences in productive dynamics among farms may indirectly modulate community structure, in line with studies linking heterogeneity in resource availability to arthropod community assembly patterns [54,55]. In contrast, other structural or thermal variables did not show independent associations in the unconstrained ordination, reinforcing, within the context of this study, the idea that, at this scale, climatic and productivity filters dominate over purely structural habitat effects.
In human-modified systems such as dehesas, this residual variance should not necessarily be interpreted as an explanatory weakness, but rather as a reflection of the historical and management singularity of each farm. Unmeasured site-specific and historical characteristics, not captured by the environmental predictors considered, may contribute to this residual variation, diluting the signal of general environmental gradients [6,56].
The NMDS ordination supports this interpretation, showing moderate differentiation among farms without a clear dominance of a single gradient (Figure 3), in agreement with regional studies reporting broad climatic responses in ant communities modulated by spatial and biogeographical context [21,26].

4.4. Multiscale Integration

Overall, the results support a hierarchical model in which climate acts as a first-order filter, defining the regional pool of potential species, while local tree structure modulates effective assemblage composition at finer scales. This framework is consistent with conceptual models proposed for ant communities in heterogeneous landscapes, which emphasise the need to integrate multiple spatial scales to understand community organisation [16,45].
This scale-dependent response highlights that the interpretation of ecological patterns in dehesas requires explicitly multiscale approaches.

4.5. Implications for Bioindication, Management, and Climate Change

The sensitivity of ant communities to both local structural heterogeneity and regional climatic filters reinforces their usefulness as bioindicators in Mediterranean agroforestry systems. Previous studies have demonstrated their value as a surrogate group for epigeic arthropods in dehesas [28]; our results extend this evidence by showing that ant communities integrate environmental signals operating at different spatial scales. This reinforces the applicability of ant-based indicators for management-oriented monitoring in dehesa systems and provides a practical basis for the design of long-term monitoring schemes focused on key structural and climatic variables identified at complementary spatial scales.
From a management perspective, the relevance of local tree structure suggests that landscape homogenisation processes, whether through tree removal or excessive densification, could reduce the diversity of microhabitats that facilitate species coexistence. In this system, trees do not represent merely a structural element, but rather a functional component that conditions key ecological processes [57].
At the regional scale, the observed climatic influence highlights the potential vulnerability of dehesas to climate change, particularly in the Mediterranean region, which has been identified as one of the main global warming hotspots [58,59].

5. Conclusions

The results demonstrate a hierarchical and scale-dependent structuring of ant communities in Mediterranean dehesas. The interaction between regional climatic filters and local structural modulators shapes assemblages and highlights the need for explicitly multiscale approaches. This framework provides a robust ecological basis for integrating the conservation of structural heterogeneity into sustainable management strategies and reinforces the value of ants as diagnostic tools in complex agroforestry systems. Future studies incorporating additional site-specific and historical information may help disentangle the substantial unexplained variation observed at the farm scale.

Supplementary Materials

The following supporting information can be downloaded at: https://www.mdpi.com/article/10.3390/f17030397/s1, Figure S1: Spatial arrangement of pitfall traps in farm AS05 (“Lote de los Pérez”, Cazalla de la Sierra, Seville, Spain), with red dots indicating the 40 traps distributed along a linear transect; Table S1: Environmental variables considered at trap and farm scales and their retention in the final analyses; Figure S2: Multivariate dispersion (PERMDISP) of ant communities among farms, showing the distances of traps to their respective farm centroids based on Bray–Curtis dissimilarities.

Author Contributions

Conceptualization, F.J.-C. and J.L.R.-L.; methodology, F.J.-C.; software, F.J.-C.; validation, F.J.-C. and J.L.R.-L.; formal analysis, F.J.-C.; investigation, F.J.-C.; resources, J.L.R.-L.; data curation, F.J.-C.; writing—original draft preparation, F.J.-C.; writing—review and editing, F.J.-C. and J.L.R.-L.; visualization, F.J.-C.; supervision, J.L.R.-L.; project administration, J.L.R.-L.; funding acquisition, J.L.R.-L. All authors have read and agreed to the published version of the manuscript.

Funding

This research was funded by the European Commission under the LIFE+ bioDEHESA project (LIFE11/BIO/ES/000726), “Dehesa ecosystems: development of policies and tools for the management and conservation of biodiversity”. Available online: https://webgate.ec.europa.eu/life/publicWebsite/project/LIFE11-BIO-ES-000726/dehesa-ecosystemsdevelopment-of-policies-and-tools-for-biodiversity-conservation-and-management (accessed on 19 March 2026).

Data Availability Statement

The data supporting the findings of this study are available from the corresponding author upon reasonable request.

Acknowledgments

This work was carried out in the framework of the LIFE+ bioDEHESA project (LIFE11/BIO/ES/000726), “Dehesa ecosystems: Development of policies and tools for the management and conservation of biodiversity”, financed by the European Union. We are very grateful to José Emilio Guerrero-Ginel (University of Córdoba) for the coordination of the project, and to Manuel Olmo Prieto, Rafa Villar, and Sergio Andicoverry de los Reyes (LIFE+ bioDEHESA project) for their contribution to the field measurements of tree structure and habitat characteristics. We also thank Soledad Carpintero, for her scientific guidance and support, as well as Alma Mª García Moreno, Belén Caño Vergara, and Pedro J. Gómez Giráldez (IFAPA Córdoba, Junta de Andalucía) for their participation in the field work. During the preparation of this manuscript, the authors used ChatGPT (OpenAI, San Francisco, CA, USA; GPT-4/5-based model) for language editing and improvement of text clarity; the authors reviewed and edited the output and take full responsibility for the content of this publication.

Conflicts of Interest

The authors declare no conflicts of interest. The funders had no role in the design of the study; in the collection, analyses, or interpretation of data; in the writing of the manuscript; or in the decision to publish the results.

References

  1. Costa Pérez, J.C.; Martín Vicente, Á.; Fernández Alés, R.; Estirado Oliet, M. Dehesas de Andalucía: Caracterización Ambiental, 1st ed.; Consejería de Medio Ambiente y Ordenación del Territorio. Junta de Andalucia: Sevilla, Spain, 2006. [Google Scholar]
  2. Joffre, R.; Rambal, S.; Damesin, C. Functional Attributes in Mediterranean-Type Ecosystems. In Functional Plant Ecology, 2nd ed.; CRC Press: Boca Raton, FL, USA, 2007; pp. 285–312. [Google Scholar] [CrossRef]
  3. Moreno, G.; Gonzalez-Bornay, G.; Pulido, F.; Lopez-Diaz, M.L.; Bertomeu, M.; Juárez, E.; Diaz, M. Exploring the Causes of High Biodiversity of Iberian Dehesas: The Importance of Wood Pastures and Marginal Habitats. Agrofor. Syst. 2016, 90, 87–105. [Google Scholar] [CrossRef]
  4. Díaz Esteban, M.; Pulido Díaz, F.J. Dehesas Perennifolias de Quercus Spp., 1st ed.; Ministerio de Medio Ambiente, y Medio Rural y Marino: Madrid, Spain, 2009. [Google Scholar]
  5. Olea, L.; San Miguel-Ayanz, A. The Spanish Dehesa. A Tradicional Mediterranean Silvopastoral System Linking Production and Nature Conservation. In Sustainable Grassland Productivity; Lloveras, J., González-Rodríguez, A., Vázquez-Yáñez, O., Eds.; European Grassland Federation/SEEP: Badajoz, Spain, 2006; Volume 11, pp. 3–13. [Google Scholar]
  6. Plieninger, T.; Flinzberger, L.; Hetman, M.; Horstmannshoff, I.; Reinhard-Kolempas, M.; Topp, E.; Moreno, G.; Huntsinger, L. Dehesas as High Nature Value Farming Systems: A Social-Ecological Synthesis of Drivers, Pressures, State, Impacts, and Responses. Ecol. Soc. 2021, 26, 23. [Google Scholar] [CrossRef]
  7. Schmitz, M.; Arnaiz-Schmitz, C.; Sarmiento-Mateos, P. High Nature Value Farming Systems and Protected Areas: Conservation Opportunities or Land Abandonment? A Study Case in the Madrid Region (Spain). Land 2021, 10, 721. [Google Scholar] [CrossRef]
  8. Pulido, F.; Picardo, Á. Libro Verde de La Dehesa; Documento Para El Debate Hacia Una Estragegia Ibérica de Gestión; Consejer’ia de Medio Ambiente: Madrid, Spain, 2010. [Google Scholar]
  9. Gallardo, A. Effect of Tree Canopy on the Spatial Distribution of Soil Nutrients in a Mediterranean Dehesa. Pedobiologia 2003, 47, 117–125. [Google Scholar] [CrossRef]
  10. García-Tejero, S.; Taboada, Á. Microhabitat Heterogeneity Promotes Soil Fertility and Ground-Dwelling Arthropod Diversity in Mediterranean Wood-Pastures. Agric. Ecosyst. Environ. 2016, 233, 192–201. [Google Scholar] [CrossRef]
  11. López-Sánchez, A.; San Miguel, A.; López-Carrasco, C.; Huntsinger, L.; Roig, S. The Important Role of Scattered Trees on the Herbaceous Diversity of a Grazed Mediterranean Dehesa. Acta Oecologica 2016, 76, 31–38. [Google Scholar] [CrossRef]
  12. Rossetti, I.; Bagella, S.; Cappai, C.; Caria, M.C.; Lai, R.; Roggero, P.P.; Martins da Silva, P.; Sousa, J.P.; Querner, P.; Seddaiu, G. Isolated Cork Oak Trees Affect Soil Properties and Biodiversity in a Mediterranean Wooded Grassland. Agric. Ecosyst. Environ. 2015, 202, 203–216. [Google Scholar] [CrossRef]
  13. Thornes, J. Environmental Crises in the Mediterranean. In Geography, Environment and Development in the Mediterranean; King, R., De Mas, P., Mansvelt Beck, J., Eds.; Sussex University Press: Brighton, UK, 2000; pp. 281–291. [Google Scholar]
  14. Gaytán, Á.; Bautista, J.L.; Bonal, R.; Moreno, G.; González-Bornay, G. Trees Increase Ant Species Richness and Change Community Composition in Iberian Oak Savannahs. Diversity 2021, 13, 115. [Google Scholar] [CrossRef]
  15. Manning, A.D.; Fischer, J.; Lindenmayer, D.B. Scattered Trees Are Keystone Structures—Implications for Conservation. Biol. Conserv. 2006, 132, 311–321. [Google Scholar] [CrossRef]
  16. Andersen, A.N. Using Ants as Bioindicators: Multiscale Issues in Ant Community Ecology. Conserv. Ecol. 1997, 1, 8. [Google Scholar] [CrossRef]
  17. Schmidt, F.A.; Ribas, C.R.; Schoereder, J.H. How Predictable Is the Response of Ant Assemblages to Natural Forest Recovery? Implications for Their Use as Bioindicators. Ecol. Indic. 2013, 24, 158–166. [Google Scholar] [CrossRef]
  18. Folgarait, P. Ant Biodiversity to Ecosystem Functioning: A Review. Biodivers. Conserv. 1998, 7, 1121–1244. [Google Scholar] [CrossRef]
  19. Prather, C.M.; Pelini, S.L.; Laws, A.; Rivest, E.; Woltz, M.; Bloch, C.P.; del Toro, I.; Ho, C.K.; Kominoski, J.; Newbold, T.A.S.; et al. Invertebrates, Ecosystem Services and Climate Change. Biol. Rev. 2013, 88, 327–348. [Google Scholar] [CrossRef]
  20. Whitford, W.G. Keystone Arthropods as Webmasters in Desert Ecosystems. In Invertebrates as Webmasters in Ecosystems; CABI: Wallingford, UK, 2000; pp. 25–41. [Google Scholar]
  21. Dunn, R.R.; Agosti, D.; Andersen, A.N.; Arnan, X.; Bruhl, C.A.; Cerdá, X.; Ellison, A.M.; Fisher, B.L.; Fitzpatrick, M.C.; Gibb, H.; et al. Climatic Drivers of Hemispheric Asymmetry in Global Patterns of Ant Species Richness. Ecol. Lett. 2009, 12, 324–333. [Google Scholar] [CrossRef]
  22. Retana, J.; Cerdá, X. Patterns of Diversity and Composition of Mediterranean Ground Ant Communities Tracking Spatial and Temporal Variability in the Thermal Environment. Oecologia 2000, 123, 436–444. [Google Scholar] [CrossRef]
  23. Sanders, N.J.; Lessard, J.-P.; Fitzpatrick, M.C.; Dunn, R.R. Temperature, but Not Productivity or Geometry, Predicts Elevational Diversity Gradients in Ants across Spatial Grains. Glob. Ecol. Biogeogr. 2007, 16, 640–649. [Google Scholar] [CrossRef]
  24. Azcárate, F.M.; Kovacs, E.; Peco, B. Microclimatic Conditions Regulate Surface Activity in Harvester Ants Messor barbarus. J. Insect Behav. 2007, 20, 315–329. [Google Scholar] [CrossRef]
  25. Barton, P.S.; Evans, M.J.; Lewis, J. Microhabitats Shape Ant Community Structure in a Spatially Heterogeneous Grassy Woodland. Ecosphere 2024, 15, e4798. [Google Scholar] [CrossRef]
  26. Economo, E.P.; Narula, N.; Friedman, N.R.; Weiser, M.D.; Guénard, B. Macroecology and Macroevolution of the Latitudinal Diversity Gradient in Ants. Nat. Commun. 2018, 9, 1778. [Google Scholar] [CrossRef] [PubMed]
  27. Kaspari, M.; Ward, P.S.; Yuan, M. Energy Gradients and the Geographic Distribution of Local Ant Diversity. Oecologia 2004, 140, 407–413. [Google Scholar] [CrossRef]
  28. Jiménez-Carmona, F.; Carpintero, S.; Reyes-López, J.L. Ants (Hymenoptera: Formicidae) as Surrogates for Epigeic Arthropods in Northern Andalusian ‘Dehesas’ (Spain). Sociobiology 2020, 67, 201–212. [Google Scholar] [CrossRef]
  29. Caro, T. Conservation by Proxy: Indicator, Umbrella, Keystone, Flagship and Other Surrogate Species, 1st ed.; Island Press: Washington, DC, USA, 2010. [Google Scholar]
  30. Greenslade, P.J.M. Sampling Ants with Pitfall Traps: Digging-in Effects. Insectes Sociaux 1973, 20, 343–353. [Google Scholar] [CrossRef]
  31. Cerda, X.; Retana, J.; Cros, S. Critical Thermal Limits in Mediterranean Ant Species: Trade-off between Mortality Risk and Foraging Performance. Funct. Ecol. 1998, 12, 45–55. [Google Scholar] [CrossRef]
  32. Jiménez-Carmona, F.; Carpintero, S.; Reyes-López, J.L. The Digging-in Effect on Ant Studies with Pitfall Traps: Influence of Type of Habitat and Sampling Time. Entomol. Exp. Appl. 2019, 167, 906–914. [Google Scholar] [CrossRef]
  33. Karger, D.N.; Conrad, O.; Böhner, J.; Kawohl, T.; Kreft, H.; Soria-Auza, R.W.; Zimmermann, N.E.; Linder, H.P.; Kessler, M. Data Descriptor: Climatologies at High Resolution for the Earth’s Land Surface Areas. Sci. Data 2017, 4, 170122. [Google Scholar] [CrossRef] [PubMed]
  34. USGS. Landsat 8 OLI/TIRS Collection 1 Level-2 Surface Reflectance Data; USGS: Reston, VA, USA, 2016.
  35. Drusch, M.; Del Bello, U.; Carlier, S.; Colin, O.; Fernandez, V.; Gascon, F.; Hoersch, B.; Isola, C.; Laberinti, P.; Martimort, P.; et al. Sentinel-2: ESA’s Optical High-Resolution Mission for GMES Operational Services. Remote Sens. Environ. 2012, 120, 25–36. [Google Scholar] [CrossRef]
  36. Gorelick, N.; Hancher, M.; Dixon, M.; Ilyushchenko, S.; Thau, D.; Moore, R. Google Earth Engine: Planetary-Scale Geospatial Analysis for Everyone. Remote Sens. Environ. 2017, 202, 18–27. [Google Scholar] [CrossRef]
  37. Didan, K. MODIS/Terra Vegetation Indices 16-Day L3 Global 250m SIN Grid V061; NASA Land Processes Distributed Active Archive Center: Sioux Falls, SD, USA, 2021.
  38. Instituto Geográfico Nacional Plan Nacional de Ortofotografía Aérea. Available online: https://pnoa.ign.es/ (accessed on 15 February 2026).
  39. Clarke, K.; Ainsworth, M. A Method of Linking Multivariate Community Structure to Environmental Variables. Mar. Ecol. Prog. Ser. 1993, 92, 205–219. [Google Scholar] [CrossRef]
  40. Oksanen, J.; Simpson, G.L.; Blanchet, F.G.; Kindt, R.; Legendre, P.; Minchin, P.R.; O’Hara, R.B.; Solymos, P.; Stevens, M.H.H.; Szoecs, E.; et al. Community Ecology Package; R Package Vegan Version 2.7-2; CRAN: Contributed Packages; CRAN: Vienna, Austria, 2025. [Google Scholar] [CrossRef]
  41. R Core Team. R: A Language and Environment for Statistical Computing; R Core Team: Vienna, Austria, 2025. [Google Scholar]
  42. Simpson, G.L. Functions for Generating Restricted Permutations of Data; R Package Permute Version 0.9-10; CRAN: Contributed Packages; CRAN: Vienna, Austria, 2026. [Google Scholar] [CrossRef]
  43. Levin, S.A. The Problem of Pattern and Scale in Ecology: The Robert H. MacArthur Award Lecture. Ecology 1992, 73, 1943–1967. [Google Scholar] [CrossRef]
  44. Wiens, J.A. Spatial Scaling in Ecology. Funct. Ecol. 1989, 3, 385. [Google Scholar] [CrossRef]
  45. Arnan, X.; Cerdá, X.; Retana, J. Ant Functional Responses along Environmental Gradients. J. Anim. Ecol. 2014, 83, 1398–1408. [Google Scholar] [CrossRef]
  46. Pérez-Sánchez, A.J.; Schibalski, A.; Schröder, B.; Klimek, S.; Dauber, J. Local and Landscape Environmental Heterogeneity Drive Ant Community Structure in Temperate Seminatural Upland Grasslands. Ecol. Evol. 2023, 13, e9889. [Google Scholar] [CrossRef]
  47. Lőrincz, Á.; Frei, K.; Hábenczyus, A.A.; Ratkai, B.; Lőrinczi, G.; Kelemen, A.; Tölgyesi, C.; Bátori, Z.; Maák, I.E. Contrasting Trait-Based Assembly Mechanisms on Different Trophic Levels: Ants and Plants on Wood-Pastures. Oecologia 2025, 207, 166. [Google Scholar] [CrossRef]
  48. Reyes-López, J.; Ruiz, N.; Fernández-Haeger, J. Community Structure of Ground-Ants: The Role of Single Trees in a Mediterranean Pastureland. Acta Oecologica 2003, 24, 195–202. [Google Scholar] [CrossRef]
  49. Baccaro, F.B.; Rocha, I.F.; del Aguila, B.E.G.; Schietti, J.; Emilio, T.; Pinto, J.L.P.d.V.; Lima, A.P.; Magnusson, W.E. Changes in Ground-Dwelling Ant Functional Diversity Are Correlated with Water-Table Level in an Amazonian Terra Firme Forest. Biotropica 2013, 45, 755–763. [Google Scholar] [CrossRef]
  50. Arnan, X.; Cerdá, X.; Retana, J. Relationships among Taxonomic, Functional, and Phylogenetic Ant Diversity across the Biogeographic Regions of Europe. Ecography 2017, 40, 448–457. [Google Scholar] [CrossRef]
  51. Anderson, M.J.; Ellingsen, K.E.; McArdle, B.H. Multivariate Dispersion as a Measure of Beta Diversity. Ecol. Lett. 2006, 9, 683–693. [Google Scholar] [CrossRef]
  52. Lázaro-González, A.; Arnan, X.; Boulay, R.; Cerdá, X.; Rodrigo, A. Short-Term Ecological and Behavioural Responses of Mediterranean Ant Species Aphaenogaster gibbosa (Latr. 1798) to Wildfire. Insect Conserv. Divers. 2013, 6, 627–638. [Google Scholar] [CrossRef]
  53. Bishop, T.R.; Parr, C.L.; Gibb, H.; van Rensburg, B.J.; Braschler, B.; Chown, S.L.; Foord, S.H.; Lamy, K.; Munyai, T.C.; Okey, I.; et al. Thermoregulatory Traits Combine with Range Shifts to Alter the Future of Montane Ant Assemblages. Glob. Change Biol. 2019, 25, 2162–2173. [Google Scholar] [CrossRef]
  54. Gibb, H.; Dunn, R.R.; Sanders, N.J.; Grossman, B.F.; Photakis, M.; Abril, S.; Agosti, D.; Andersen, A.N.; Angulo, E.; Armbrecht, I.; et al. A Global Database of Ant Species Abundances. Ecology 2017, 98, 883–884. [Google Scholar] [CrossRef] [PubMed]
  55. Lassau, S.A.S.; Hochuli, D.F.D. Effects of Habitat Complexity on Ant Assemblages. Ecography 2004, 27, 157–164. [Google Scholar] [CrossRef]
  56. Borcard, D.; Gillet, F.; Legendre, P. Numerical Ecology with R; Springer: New York, NY, USA, 2011. [Google Scholar]
  57. Bugalho, M.N.; Lecomte, X.; Gonçalves, M.; Caldeira, M.C.; Branco, M. Establishing Grazing and Grazing-Excluded Patches Increases Plant and Invertebrate Diversity in a Mediterranean Oak Woodland. For. Ecol. Manag. 2011, 261, 2133–2139. [Google Scholar] [CrossRef]
  58. Giorgi, F.; Lionello, P. Climate Change Projections for the Mediterranean Region. Glob. Planet. Change 2008, 63, 90–104. [Google Scholar] [CrossRef]
  59. IPCC. Climate Change 2021—The Physical Science Basis; Cambridge University Press: Cambridge, UK, 2023. [Google Scholar]
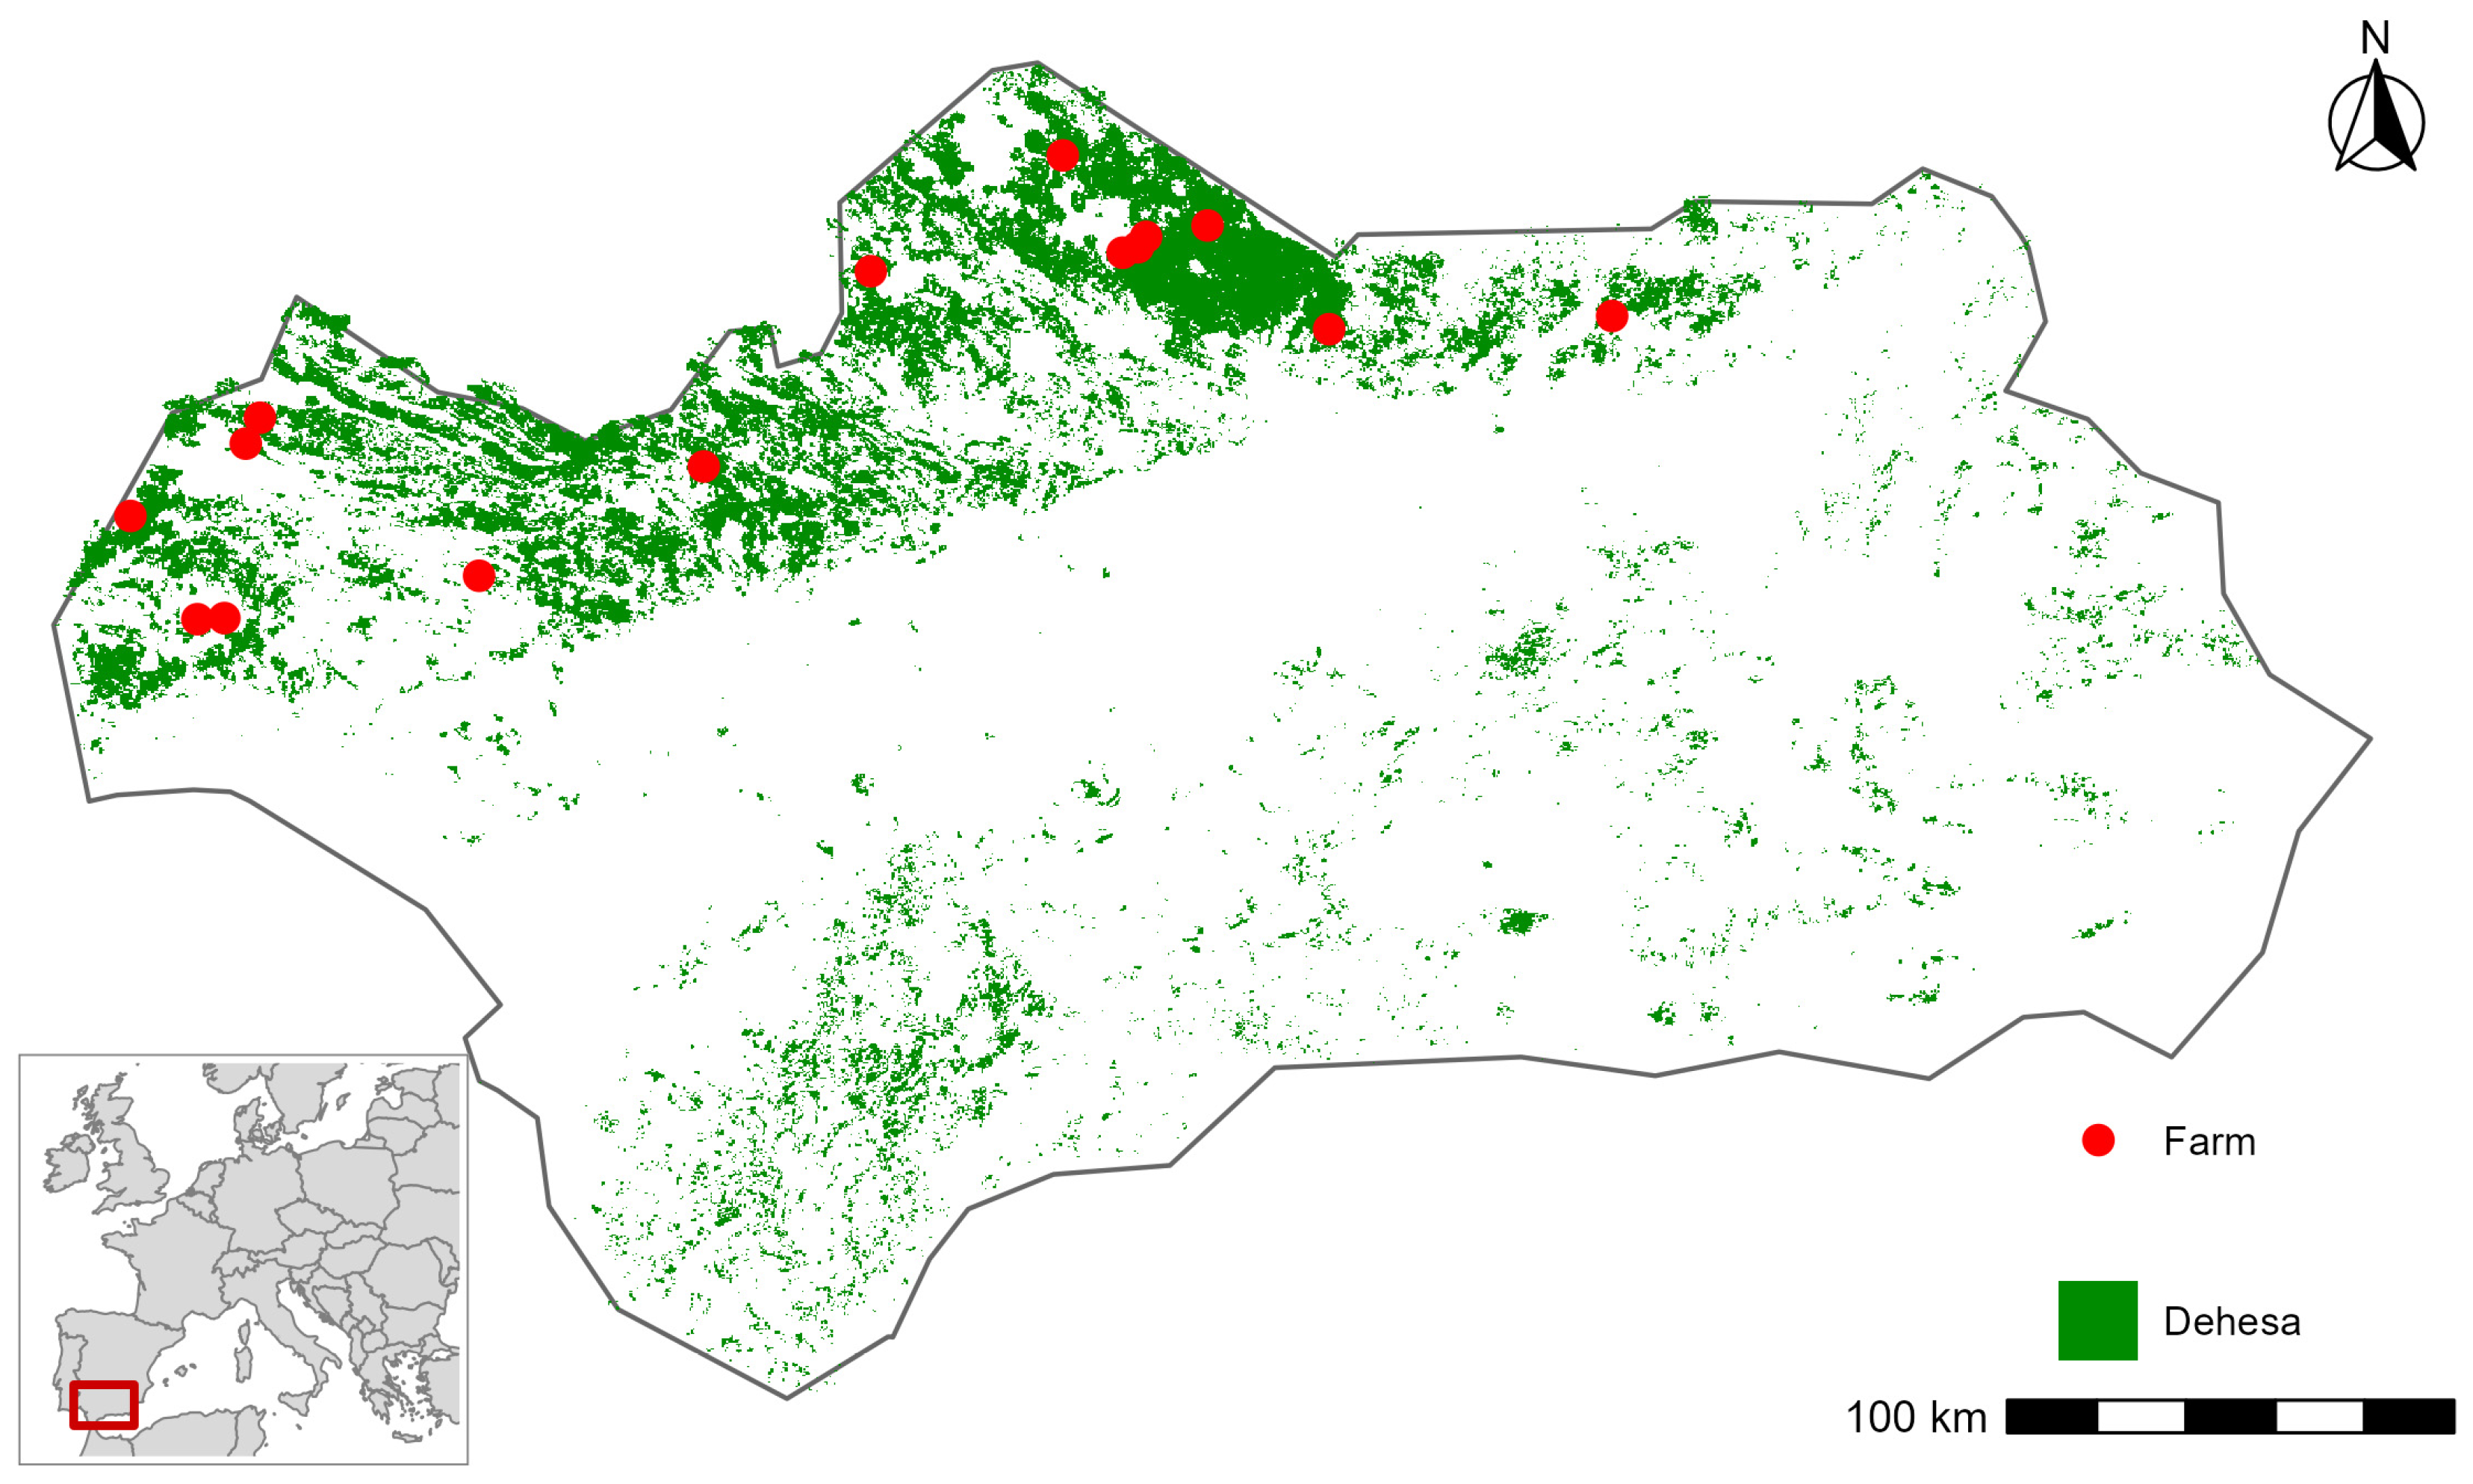
Figure 1. Location of the study dehesas in Andalusia (southern Spain). Red points indicate sampled farms, and green areas represent dehesa ecosystems. The dehesa distribution layer was obtained from REDIAM (Andalusian Environmental Information Network).
Forests 17 00397 g001
Figure 2. Distance-based redundancy analysis (dbRDA) ordination of ant community composition at the trap scale. Points represent individual traps. Vectors indicate the direction and strength of environmental predictors showing significant marginal effects (p < 0.05).
Forests 17 00397 g002
Figure 3. Non-metric multidimensional scaling (NMDS) ordination of ant communities at the farm scale based on Bray–Curtis dissimilarities of species occupancy (stress = 0.157). Farms are represented by their codes. Vectors indicate environmental variables significantly correlated with the ordination (envfit, p < 0.05).
Forests 17 00397 g003
Table 1. Geographic location and general characteristics of the dehesa farms included in the study.
CodeFarmLocationProvinceLatLongSurface (ha)Sampling Year
AP05La JuanitaAlosnoHuelva37.555913−7.08225191.142017
AP06PaymoguilloPaymogoHuelva37.751957−7.330534109.42016
AS02El Palomar de la MorraPozoblancoCórdoba38.348277−4.81924196.692017
AS05Lote de los PérezCazalla de la SierraSevilla37.896797−5.875586107.72016
AS06Las MorrillasPozoblancoCórdoba38.36055−4.771079157.422017
CO01Las ÁnimasArocheHuelva37.962325−7.0123977.622016
CO05Monterrey y CarreteroArocheHuelva37.905465−7.049219119.592017
CO08QuebradahondaCastillo de las GuardasSevilla37.653961−6.421098114.142016
CO12Majada del IndioEl VisoCórdoba38.545339−4.986985123.942016
EN04EncinarejoAlosnoHuelva37.551441−7.148217281.332016
FA01Las HazasVillanueva de CórdobaCórdoba38.40372−4.603515459.092016
FA05La PanaderaPozoblancoCórdoba38.381964−4.75897183.62017
FA11Santa ClotildeCardeñaCórdoba38.202356−4.2869782922016
UP23OropesaFuente OvejunaCórdoba38.299421−5.463488110.692016
UP24Las CarasVilchesJaén38.229856−3.544986592.612016
Table 2. Percentage of traps occupied by each ant species in each farm, and number of farms in which each species was recorded; values represent the percentage of analysed traps occupied by each species within each farm; a trap was considered occupied when at least one worker of the species was recorded; the final column (“P/F”) indicates the number of farms in which each species was detected, and the last row (“N_SPECIES”) shows the total number of species recorded per farm.
SpeciesAP05AP06AS02AS05AS06CO01CO05CO08CO12EN04FA01FA05FA11UP23UP24P/F
Aphaenogaster dulcineae
Emery, 1924
0021113303008355510
Aphaenogaster gibbosa
(Latreille, 1798)
11821135355161485393515
Aphaenogaster iberica
Emery, 1908
01873425830285017546656101813
Aphaenogaster senilis
Mayr, 1853
66203005550034300045139
Camponotus cruentatus
(Latreille, 1802)
00460282934337204158810011
Camponotus fallax
(Nylander, 1856)
0030000000050803
Camponotus foreli
Emery, 1881
13000030083033307
Camponotus lateralis
(Olivier, 1792)
3303300000000004
Camponotus micans
(Nylander, 1856)
0000050050300003
Camponotus piceus
(Leach, 1825)
0000000000005001
Camponotus pilicornis
(Roger, 1859)
3561330031138055011
Camponotus sylvaticus
(Olivier, 1792)
0303000306000556
Cataglyphis hispanica
(Emery, 1906)
40688895731868659066979787856915
Cataglyphis iberica
(Emery, 1906)
1310330011000301601507
Cataglyphis rosenhaueri
Santschi, 1925
00016300100003823137
Colobopsis truncata
(Spinola, 1808)
0005000000050002
Crematogaster auberti
Emery, 1869
1800005335688105010
Crematogaster scutellaris
(Olivier, 1792)
161091128131650111131015314
Crematogaster sordidula
(Nylander, 1849)
0000000330000002
Formica cunicularia
Latreille, 1798
0000300000000001
Formica gerardi
Bondroit, 1917
0030300000000002
Goniomma baeticum
Reyes & Rodriguez, 1987
00120350303030037
Goniomma hispanicum
(André, 1883)
3093101603030110101310
Goniomma kugleri
Espadaler, 1986
3300000009000003
Iberoformica subrufa
(Roger, 1859)
21754982355053853734514274732115
Lasius grandis
Forel, 1909
0000000000008001
Lasius lasioides
(Emery, 1869)
313351035503168320013
Messor barbarus
(Linnaeus, 1767)
37509466855821332926628746786915
Messor bouvieri
Bondroit, 1918
30300000008030185
Messor celiae
Reyes, 1985
0000050000030002
Messor hispanicus
Santschi, 1919
30001030800083558
Oxyopomyrmex saulcyi
Emery, 1889
303505318063530311
Pheidole pallidula
(Nylander, 1849)
1320000330216030038
Plagiolepis pygmaea
(Latreille, 1798)
26181834811185243114339151015
Plagiolepis schmitzii
Forel, 1895
1810050135251363035011
Proformica ferreri
Bondroit, 1918
00000000000013001
Solenopsis sp. 50324103538058108313
Tapinoma nigerrimum complex
(Nylander, 1856)
4710495530501653763122744668315
Temnothorax alfacariensis
Tinaut & Reyes-López, 2000
0000000000050001
Temnothorax angustulus
(Nylander, 1856)
0000000000500302
Temnothorax racovitzai
(Bondroit, 1918)
50083000166353008
Temnothorax recedens
(Nylander, 1856)
5000000000000001
Temnothorax tyndalei
(Forel, 1909)
0000000030000001
Tetramorium caespitum
(Linnaeus, 1758)
0800005030000504
Tetramorium forte
Forel, 1904
21561295834264056147123153315
Tetramorium semilaeve
André, 1883
45154940151837401329325041132115
N_SPECIES262023222326182422252228262721
Table 3. Environmental variables used in the final analyses at trap and farm scales.
ScaleVariableBlockDescriptionSource
TrapBIO2_trapClimate 1Mean diurnal temperature rangeCHELSA
TrapBIO3_trapClimate 1IsothermalityCHELSA
TrapTREE_DISTTree structure 5Distance from each trap to the nearest tree (m)Remote sensing
TrapTREE_COV10_PCTTree structure 5Tree canopy cover within a 10 m buffer around each trap (%)Remote sensing
FarmBIO3_farmClimate 1IsothermalityCHELSA
FarmBIO10_farmClimate 1Mean temperature of the warmest quarterCHELSA
FarmNDVIsd_farmVegetation productivity 3Temporal variability of NDVI during 2016–2017 (50th percentile)Remote sensing
FarmCBHm_farmTree structure 4Mean trunk circumference at breast height (cm)Field-derived
FarmELEVm_farmTopography 2Elevation (50th percentile)Remote sensing
1 Climatic variables were obtained from the CHELSA v2.1 bioclimatic dataset and extracted at trap locations or aggregated at farm scale using spatial zonal statistics. 2 Topographic variables were derived from digital elevation models. 3 Vegetation indices were calculated from multispectral satellite imagery processed using the Google Earth Engine platform. 4 Tree-structure variables at farm scale were obtained from standardised field-based dendrometric measurements. 5 Tree-structure variables derived from remote sensing were obtained from the SIOSE (Sistema de Información sobre Ocupación del Suelo de España) land-use database and complemented with high-resolution orthophotographs from the PNOA (Plan Nacional de Ortofotografía Aérea) for spatial verification and refinement.
Disclaimer/Publisher’s Note: The statements, opinions and data contained in all publications are solely those of the individual author(s) and contributor(s) and not of MDPI and/or the editor(s). MDPI and/or the editor(s) disclaim responsibility for any injury to people or property resulting from any ideas, methods, instructions or products referred to in the content.