Article

Management Effects on Biomass Partitioning in Fast-Growing Poplar in Brandenburg

by
Lisa Schulz-Nielsen
1,*,
Josafat-Mattias Burmeister
2,
Cäcilia Fiege
1,
Rico Richter
2 and
Ralf Pecenka
1
1
Leibniz Institute for Agricultural Engineering and Bioeconomy, Max-Eyth-Allee 100, 14469 Potsdam, Germany
2
Digital Engineering Faculty, University of Potsdam, Prof-Dr-Helmert-Str. 2–3, 14482 Potsdam, Germany
*
Author to whom correspondence should be addressed.
Forests 2026, 17(3), 395; https://doi.org/10.3390/f17030395
Submission received: 17 February 2026 / Revised: 18 March 2026 / Accepted: 20 March 2026 / Published: 23 March 2026

Abstract

Woody biomass crops are increasingly considered a promising alternative to conventional agricultural systems due to their potential for sustained carbon sequestration under accelerating climate change. Optimizing management practices in such systems is therefore critical to enhance biomass production and carbon storage. In this study, we investigated how management influences biomass allocation in four poplar plots differing in planting density, variety, and harvest-rotation design during their 6th and 7th year of growth. Biomass stocks were quantified for crown, stem, coarse roots, and fine roots. Management effects were most pronounced in aboveground biomass, whereas belowground responses were less consistent. The highest aboveground biomass was observed in the high-density system within the first rotation (MxHD1), reaching 55.32 Mg ha−1 in 2024 and 94.91 Mg ha−1 in 2025. Belowground biomass ranged from 8.12 to 18.35 Mg ha−1 across plots and years. The root:shoot ratio declined with increasing shoot basal diameter and was highest in the year following harvest. Based on these data, we developed general and management-specific allometric models to predict aboveground and belowground biomass from diameter at breast height. Including management factors improved prediction accuracy, supporting more precise quantification of biomass allocation under different cultivation strategies.

1. Introduction

Perennial woody crops have gained increasing attention for their role in carbon capture and storage, making them a vital component in global strategies to mitigate climate change. Among these, poplar (genus Populus) stands out due to its rapid juvenile growth, high adaptability to various environments, and broad utility in biomass production, especially for renewable energy [1,2]. Poplar is cultivated across a range of systems, including short-rotation coppices, agroforestry systems, and plantation forests, each adapted to regional goals and ecological contexts [3,4].
In Mediterranean and subtropical regions, poplars are typically grown in widely spaced monoculture systems for high-quality timber production (<2000 trees/ha), often managed with irrigation and fertilization to maximize stem volume [5,6,7]. In contrast, temperate regions, particularly Northern and Central Europe, more commonly use short-rotation coppice (SRC) systems, which involve higher planting densities (e.g., 6000–12,000 trees/ha) and shorter harvest cycles, aiming to maximize biomass yield for energy or pulp production [8,9].
Poplar SRCs are characterized by fast regrowth and repeated harvesting cycles. While much of the carbon fixation in these systems is attributed to aboveground biomass, belowground compartments continue to store carbon long after harvest [10,11,12]. The root systems of poplars have been shown to account for 25–35% of the total biomass, with juvenile stands often showing even higher proportions [13,14,15]. This makes belowground biomass particularly relevant in discussions on long-term carbon sequestration.
In the scope of climate change, the role of biomass systems in the bioeconomy is becoming increasingly important, particularly in emerging concepts such as Bioenergy with Carbon Capture and Storage (BECCS) and Biological Carbon Removal and Storage (BiCRS) [16,17]. In this context, the carbon storage potential of poplar plantations may soon outweigh their value in timber or energy yield [18], although the economic value of carbon sequestration relative to wood products is likely to vary across regions and markets. Against this background, understanding how management practices influence carbon dynamics, especially those contributing to long-term storage belowground, is vital.
Several studies have demonstrated that belowground carbon sequestration can be significantly enhanced on sites with poor soil quality, where aboveground growth is limited and plants allocate proportionally more biomass to root systems [19,20,21], as suggested by Optimal Partitioning Theory [22]. In such conditions, root:shoot ratios may serve as valuable indicators of the plant’s adaptive response to its environment, as they tend to increase with resource constraints, while long-term carbon storage in the soil is promoted. This phenomenon is especially relevant in the context of marginal or degraded lands, where conventional agriculture is less productive, but the cultivation of perennial biomass like poplar can offer both ecological and economic benefits [3,23,24,25]. The federal state of Brandenburg in Northeastern Germany, characterized by sandy soils, low precipitation, and relatively poor site fertility [26], presents an ideal case for studying such land-use transitions. In the scope of this potential, optimal management configurations for maximizing carbon sequestration while maintaining economic viability would benefit the development of the local bioeconomy and promote climate mitigation in this part of Germany.
Existing studies demonstrate substantial variability in biomass partitioning among poplar systems, likely driven by differences in site conditions, stand age, management intensity, and measurement methodology [27,28]. For instance, site conditions can influence biomass allocation through differences in water and nutrient availability, whereas stand age affects allocation patterns through ontogenetic shifts in growth and allometric scaling between root and shoot biomass [29,30,31].
Some research has highlighted that planting density can significantly influence biomass distribution, affecting both the quantity and allocation of carbon to different plant compartments [15,20,32]. For example, denser stands may increase competition for soil resources, prompting a shift toward root growth, while larger spacing may favor coarse root development for mechanical support [15,33].
Assessing belowground biomass, especially of coarse roots, is notoriously labor-intensive and methodologically uncertain [34]. In the poplar plantation located next to the plots investigated in this study, Fiege et al. [12] showed that the choice of sampling method, root size classes, and sampling depth directly affects root biomass estimates and, consequently, carbon estimates. However, accurate quantification remains essential for assessing total ecosystem carbon storage. Despite increasing interest, research on belowground biomass in poplar remains limited.
A range of studies have developed allometric models to estimate poplar biomass above and below ground that are specific to certain management scenarios or locations. Several of these highlight the importance of adapting models to site-specific conditions [11,31,35], while others did not find a clear benefit in fitting specific models or argue for a general approach [36,37]. Developing simple but targeted models to enhance the precision of biomass estimates would promote effective management strategies for carbon farming in regions like Eastern Germany, where poplar cultivation systems are gaining importance.
This study aims to advance the understanding of how management factors—particularly planting density, shoot age, and poplar variety—affect carbon allocation in poplar biomass systems in Brandenburg under the hypothesis that management significantly influences biomass partitioning and, thus, the carbon sequestration potential of different compartments.
For this, four poplar plots at different developmental and management stages, but with similar site conditions, were investigated. These included two lower-density stands and two higher-density stands, one of which had undergone a full coppice harvest in the previous season. The specific objectives were:
(1)
To quantify and compare biomass in aboveground and belowground compartments, as well as system-level root:shoot ratios;
(2)
To examine the effect of management factors (planting density, variety, and rotation stage) on carbon allocation in different biomass compartments;
(3)
To test whether allometric modelling in poplar can be improved by specifying according to SRC management systems;
By addressing these objectives, this study contributes to optimizing poplar cultivation systems for improved biomass production and modelling of carbon storage.

2. Materials and Methods

2.1. Experimental Site

The study was conducted in a poplar plantation at the Leibniz Institute for Agricultural Engineering and Bioeconomy (ATB) in Potsdam, Brandenburg (13°01′00″ E, 52°26′22″ N), which comprises plots with different cultivars and management regimes. Ground moraine deposits, composed of unconsolidated rock material with high proportions of clay and sand, characterize the soil in this area. The classified Cambisol consists of slightly loamy sand down to a depth of 60 cm and silty sand to sandy loam in the deeper layer (60–100 cm). The climate in this region is temperate, with a mean annual temperature of 10.93 °C and an average annual precipitation of 559.9 mm (measured between 2014 and 2024) [38]. Since all experimental plots are in close proximity, the environmental conditions are assumed to be identical on all plots.
Experiments were carried out on four different experimental plots, which were all established in 2018. These are part of a long-term, high-value timber trial, aiming to evaluate the suitability of different poplar cultivars and management regimes for wood utilization beyond bioenergy production. In contrast to typical short-rotation coppice systems, these plots were designed to allow for extended rotation periods and the development of larger stem dimensions.
For the present study, these plots were of particular interest because they represent the only available experimental stands with comparatively high tree age at the study site, which was especially valuable for the belowground biomass measurements. Such conditions are relatively rare in poplar biomass research, which predominantly focuses on younger stands managed under short rotation cycles.
However, a trade-off of using these long-established experimental plots is that the management history differs between plots, resulting in a partially unbalanced experimental design. For the purposes of this study, the experiment was therefore treated as a split-plot design, while differences in management were explicitly accounted for in the statistical analysis by grouping data into comparable management categories (see Section Exploratory Analysis of the Data).
For better understanding, when reading this study, we used management codes, based on the conditions described in Table 1, instead of numbers when referring to the plots. The codes consist of abbreviations for the cultivars (Ma for Matrix 49, Sk for Skado and Mx for Max 3) and descriptions of the planting density (HD for high density, LD for low density) and rotation stage (first rotation = 1, second rotation = 2).
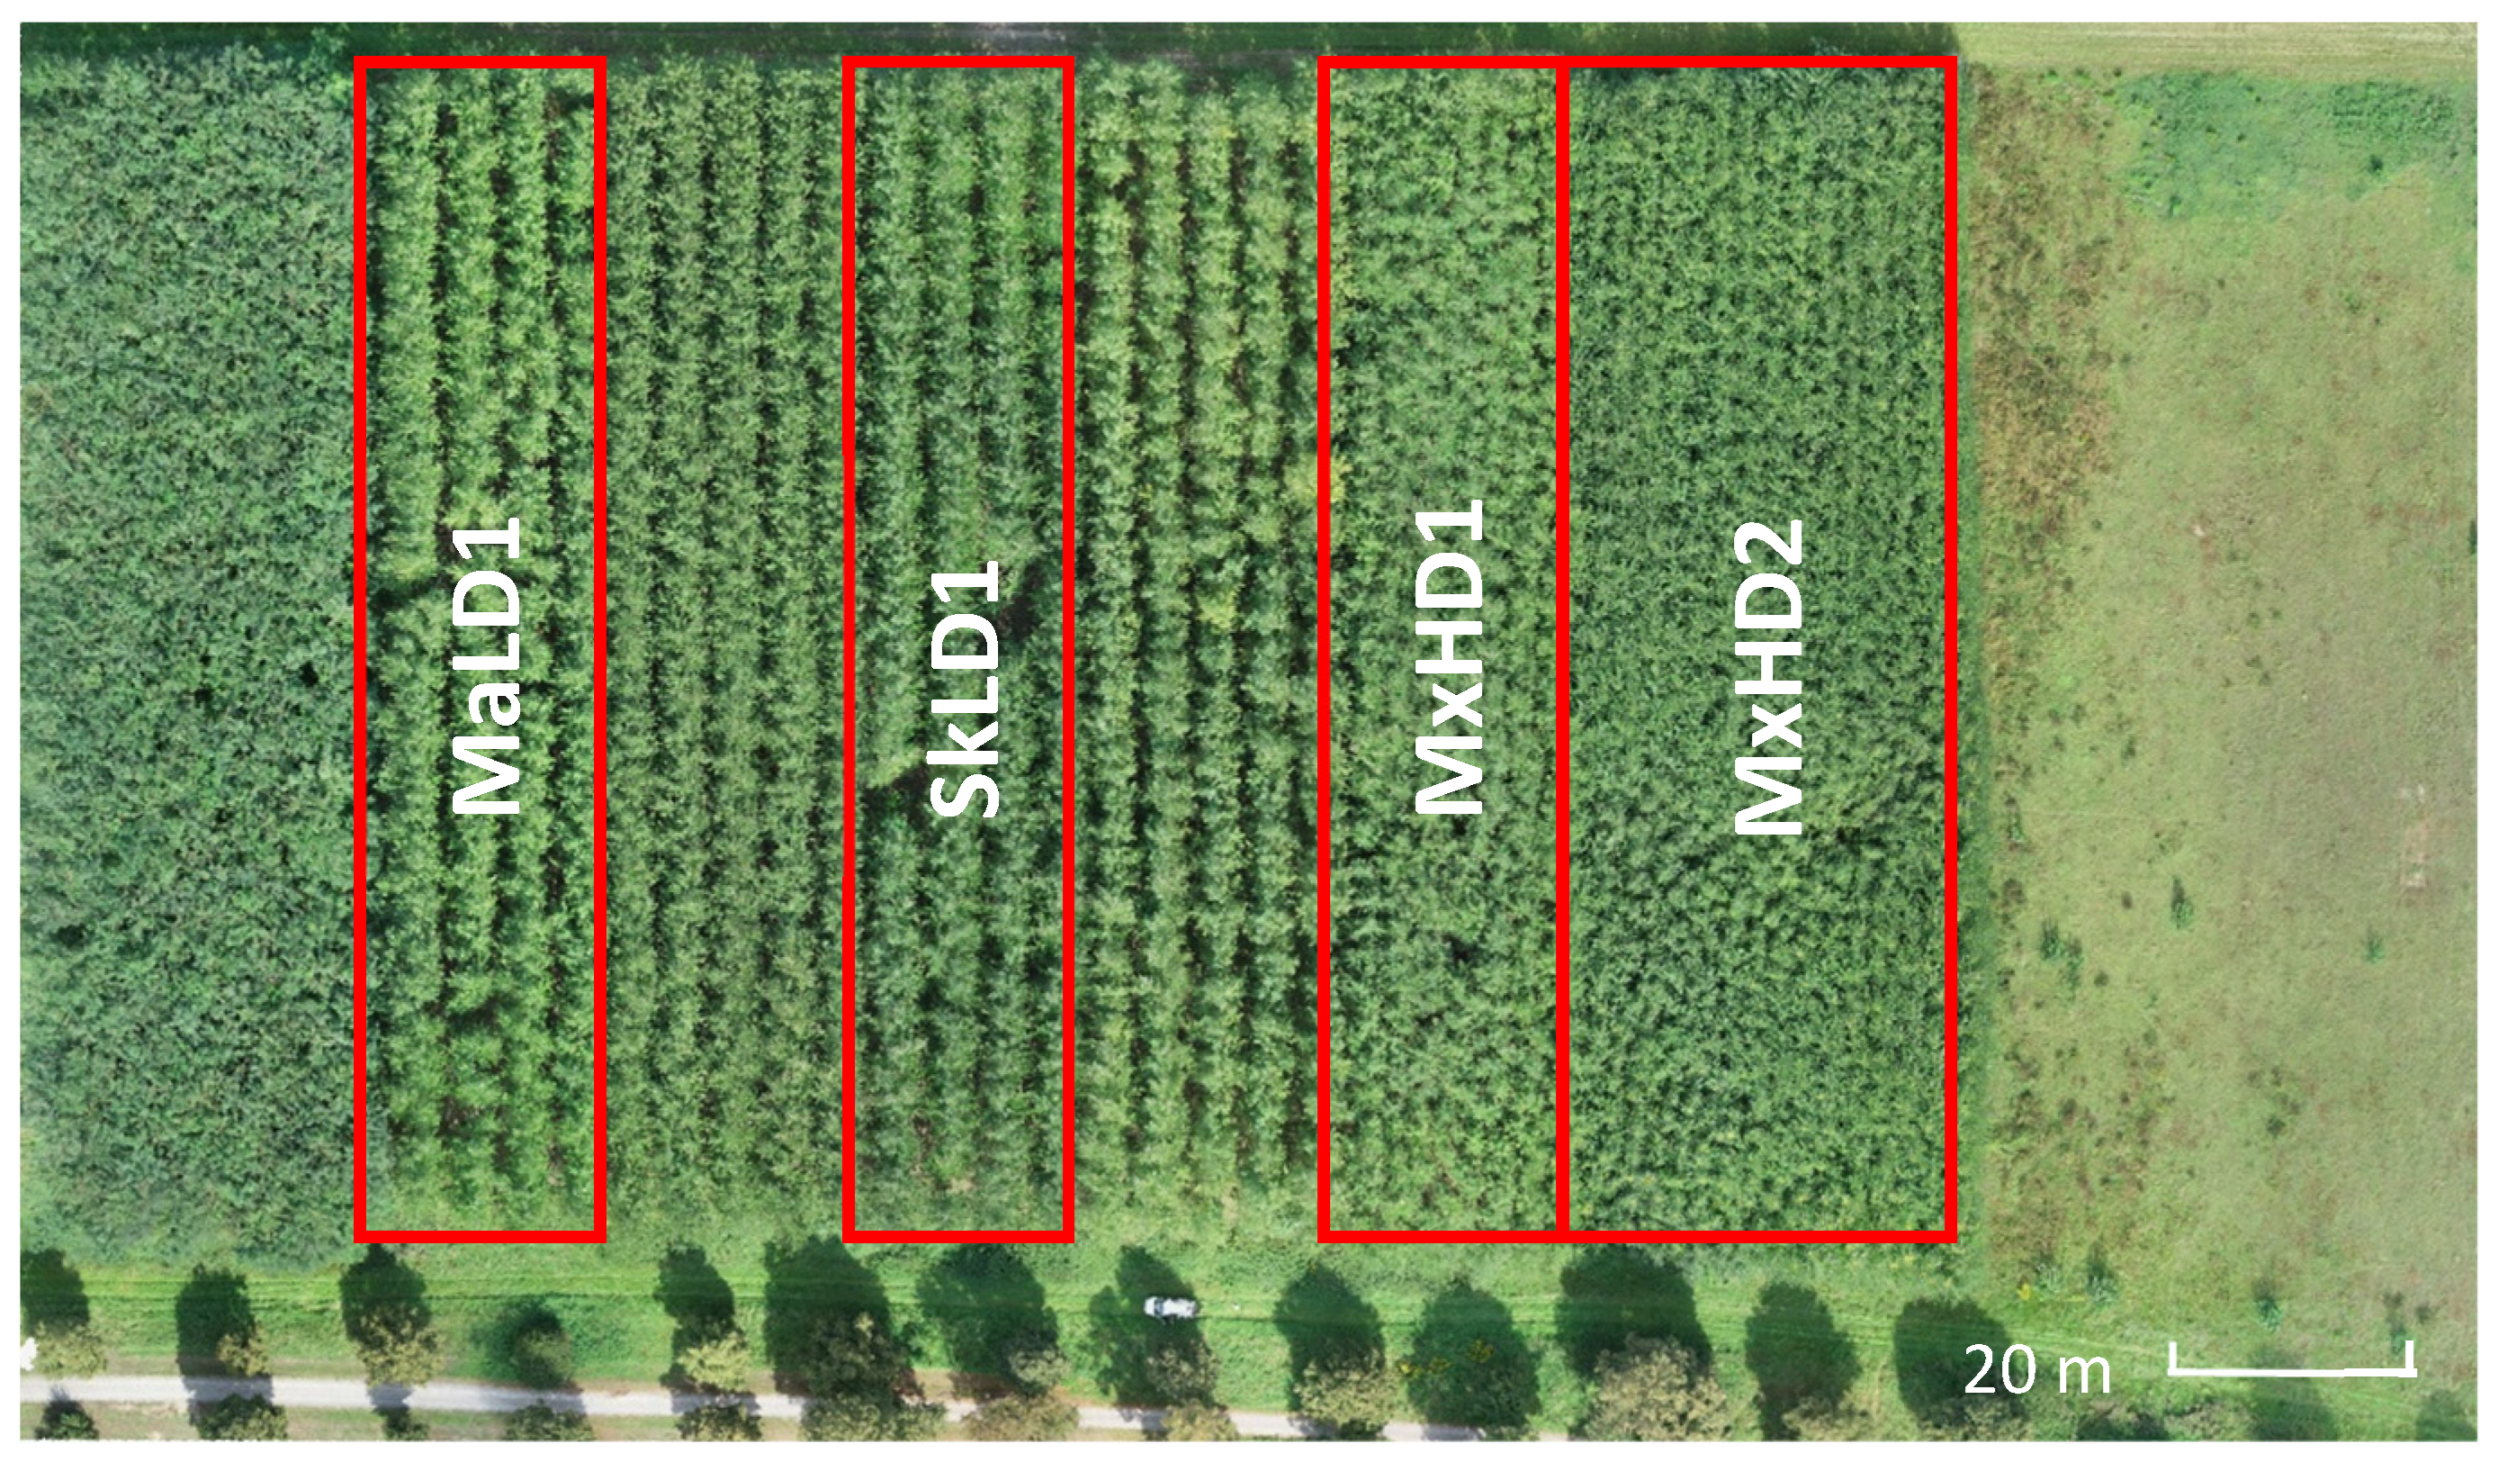
MaLD1 and SkLD1 are part of a bigger plot, which was planted with a density of approximately 4166 cuttings per hectare (see Figure 1). In these plots, a partial harvest, including every second row, was conducted at the beginning of 2023, reducing the planting density by half. The harvested rows were repeatedly cut down in the following year to suppress re-growth. MxHD1 and MxHD2 were planted in a density of 8333 cuttings per hectare. The latter was fully harvested in 2023 and was in the stage of re-growth when conducting this study, while MxHD1 remained in its first growing cycle. Detailed information regarding spacing, rotation system, and cultivar is shown in Table 1.

2.2. Sample Tree Selection and Aboveground Biomass Measurement

In two inventory campaigns, from February to March during the years 2024 and 2025, the shoot diameter at breast height, as well as the basal diameter at a height of 10 cm above ground were measured for all trees in the experimental plots using a digital caliper (Vogel Germany, accuracy to 1 mm). To quantify the mortality rate in all plots, the number of shoots and living stools were counted and compared to the initial planting design.
Biomass data were sampled destructively by harvesting 10 trees per plot in 2024 and 15 in 2025, resulting in a total number of 25 trees per plot (resp. 100 in total for all plots). To account for structural and spatial variability in aboveground biomass, two complementary sampling strategies were used to select trees for harvesting in the two inventory years.
In 2024, sample trees were selected based on DBH (diameter at breast height) classes (mean ± standard deviation) to ensure a representative coverage of the diameter distribution within each plot, which is a common approach in destructive biomass sampling. This strategy primarily accounts for structural variability at the stand level. In the previously harvested plot (MxHD2), mean DBH was calculated as the quadratic mean diameter (QMD). This metric is widely used in biomass assessments of forests or woody crops, including poplar plantations (e.g., Hauk et al. [40,41] and Oliveira et al. [41]).
In 2025, sample trees were selected along a diagonal transect across each plot to explicitly capture potential spatial heterogeneity within the stands, particularly small-scale variations in soil properties (e.g., minor differences in soil texture, organic matter content, or microtopography) that could not be fully controlled for in the experimental design. In both years, trees located directly next to the stand edge were excluded to reduce the potential impact of additional light and wind exposure on growth or root distribution patterns.
Although the selection criteria differed between years, both approaches were designed to sample representative trees within each plot and to minimize systematic bias. The combined dataset, therefore, integrates structural and spatial variability, improving the robustness of biomass estimates across plots and years.
The selected trees were hand-felled at approximately 10 cm above the ground. The entire harvested portion above the stump (above 10 cm height) was considered aboveground biomass. For all felled trees, the height of the tallest shoot and the total fresh aboveground biomass were recorded, with biomass measured using a scale attached to a tractor. To assess biomass distribution across tree compartments, aboveground biomass was separated into stem and crown based on branch diameter. Initial inspections of individual trees showed that stems at around 4 m height in 2024 and 6 m in 2025 had an average diameter of approximately 5 cm; thus, this is where separation between stem wood from crown biomass was placed. Woody material with a basal diameter greater than 5 cm was assigned to the stem, while branches thinner than or equal to 5 cm were assigned to the crown. This practical approach was chosen to allow a distinction between valuable stem wood and crown biomass, which generally has lower economic value. In the case of the MxHD2 plot, where trees were in their second rotation and consisted of multiple shoots rather than a single stem with a crown, this distinction was not possible. Therefore, for statistical comparison, all aboveground biomass from this plot was assigned to the “stem” fraction. This assignment was based on a functional interpretation of aboveground biomass components, allowing a consistent comparison of annual biomass increment across management systems.
For the determination of wood moisture, two trees per plot were randomly selected for sampling of approximately 1 kg per crown and stem biomass. As moisture content within plots was expected to be relatively homogeneous due to uniform site conditions, tree age, and cultivar, subsampling was considered sufficient to derive representative DM conversion factors. These samples were dried in a drying oven to constant weight at 105 °C, according to EN ISO 18134-2 [42]. Dry matter (DM) values for the biomass compartments were derived based on these wood moisture values. After drying, the same samples were sent to the laboratory for follow-up carbon analysis. All biomass values mentioned in this study refer to DM values.

2.3. Belowground Biomass Measurement and Root:Shoot Ratio

2.3.1. Coarse Root Sampling

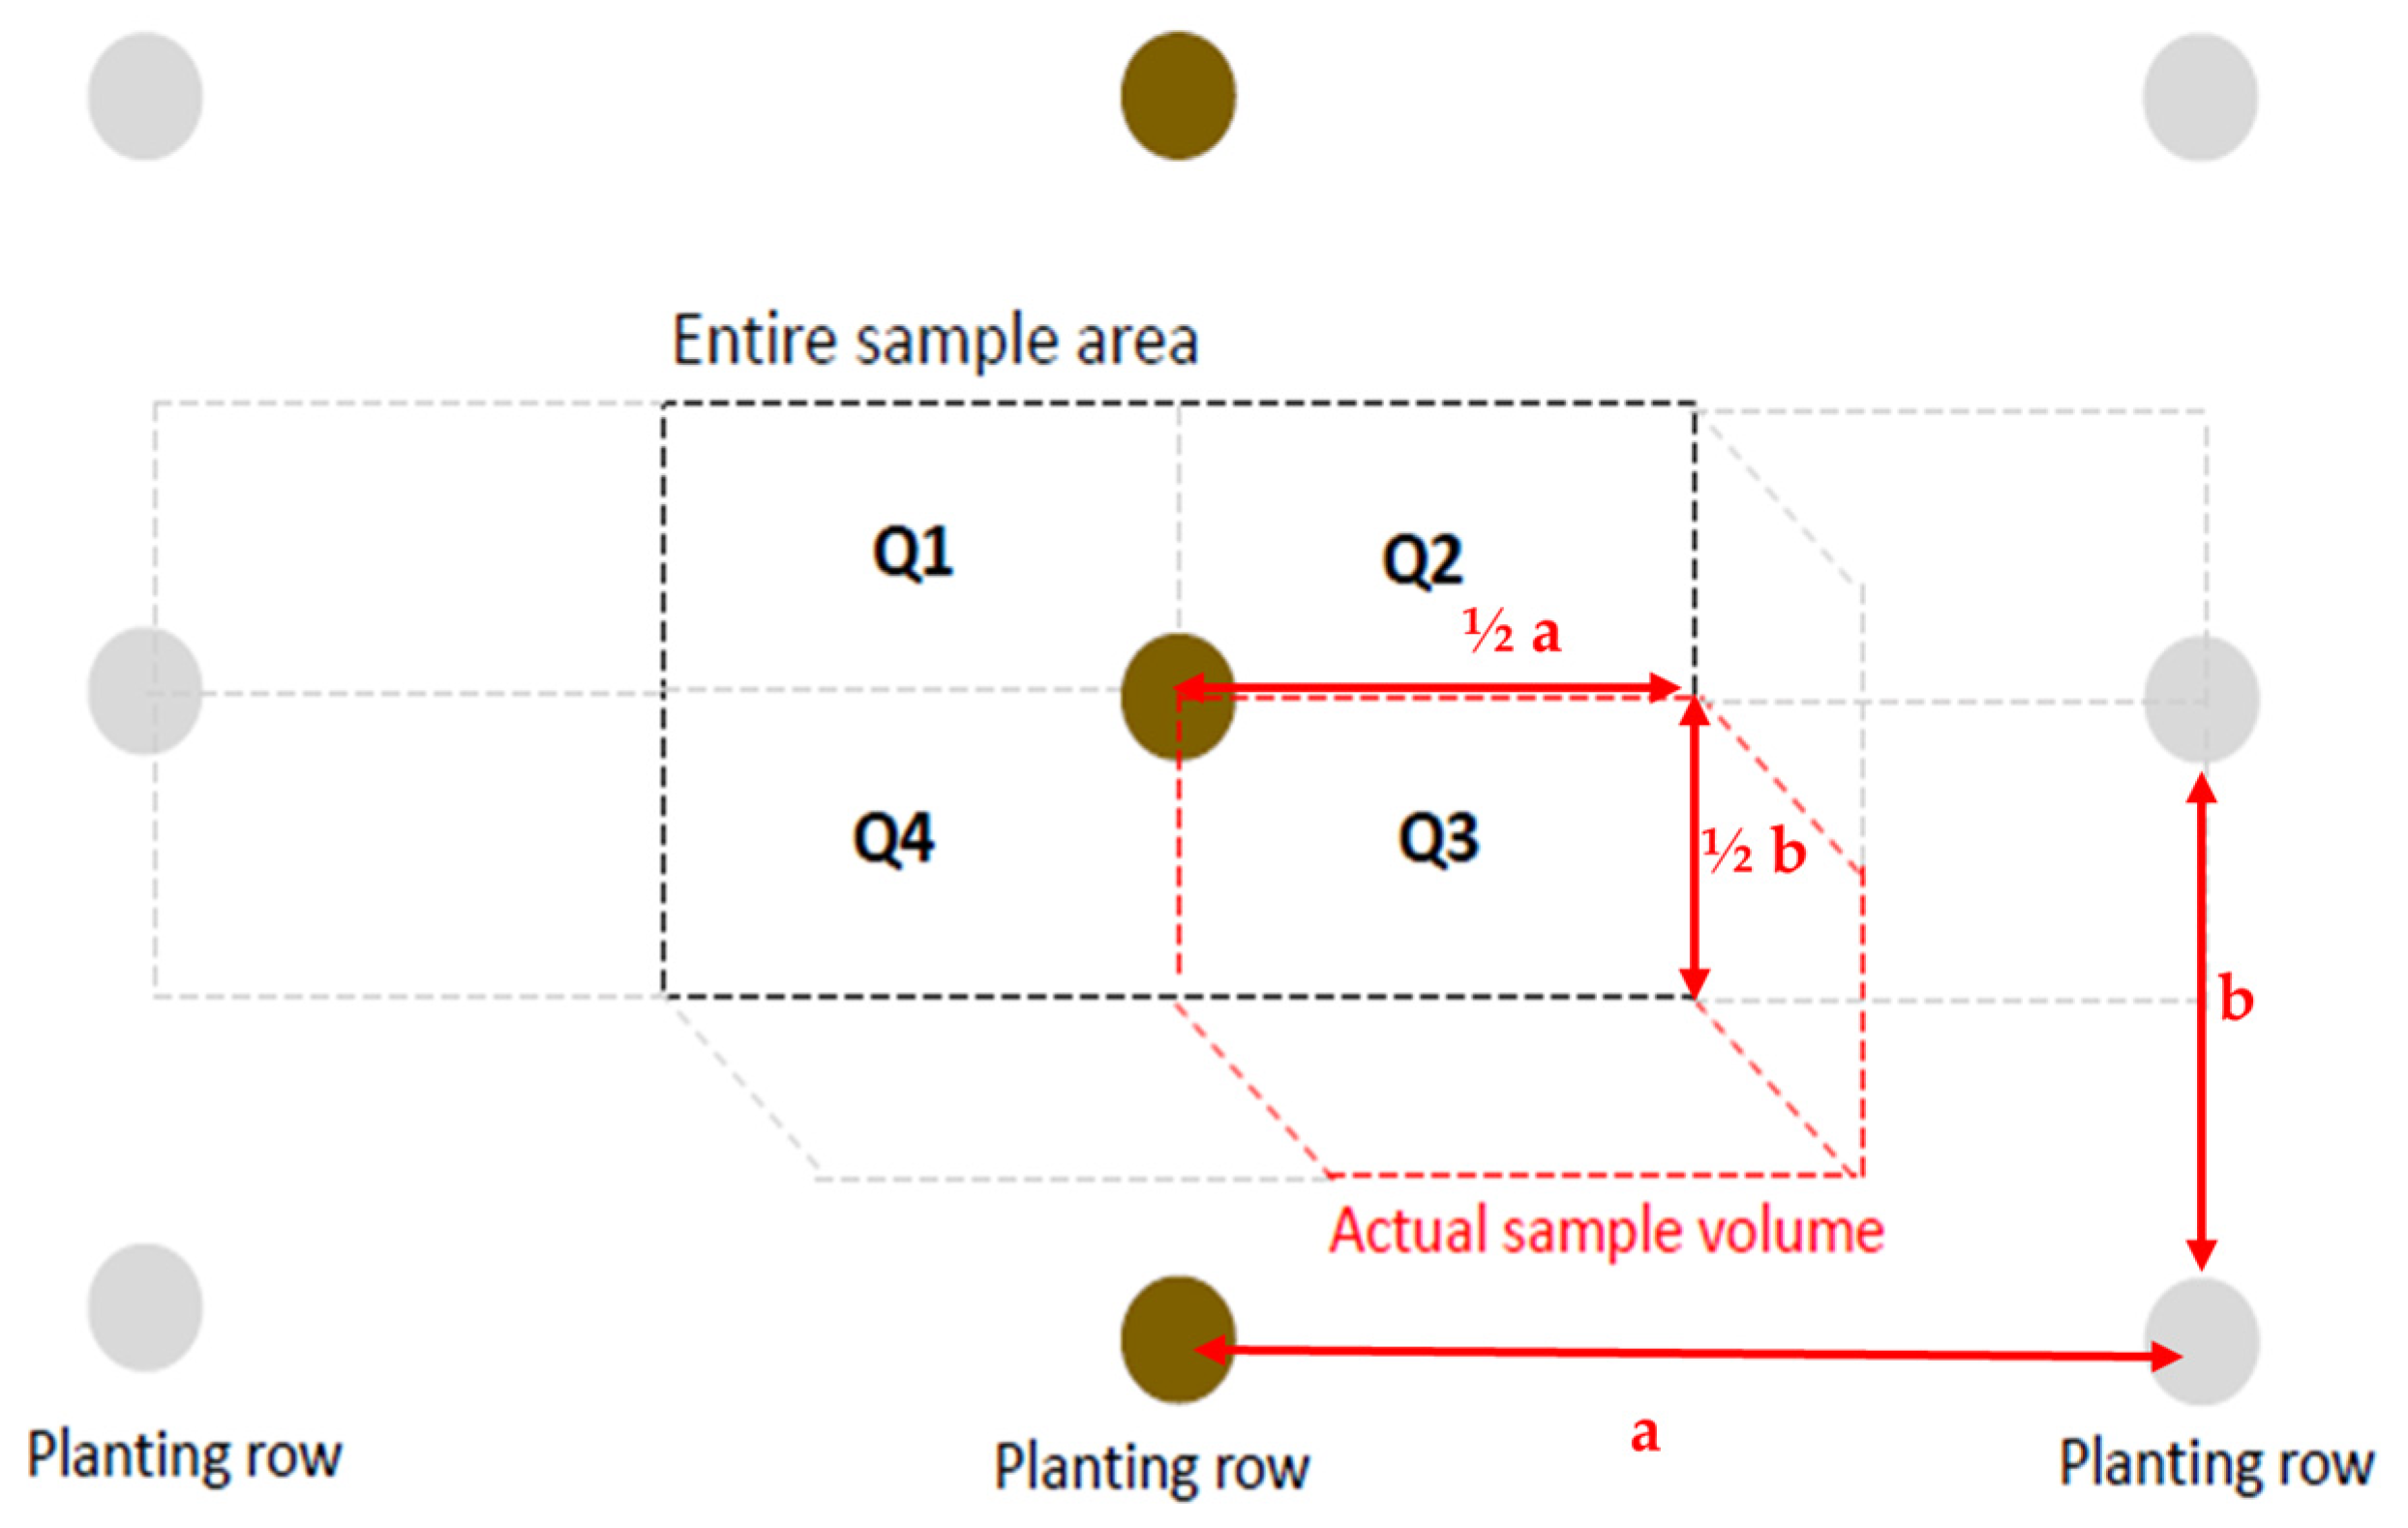
In both years, four of the trees selected for aboveground biomass estimation per plot per year were randomly chosen for destructive belowground biomass determination. A sample area around the root stumps was defined, determined by the row spacing and planting distance within the row. It was assumed that if a line is drawn in the middle between two trees, the same root mass is excluded from the sample tree as is added from the neighboring trees, and that the roots were evenly distributed radially around the stump (Figure 2).
The root stumps were pulled out using a chain hoist attached to a tripod made of steel, specifically designed for this purpose. Beforehand, the marked sample area was cut with a spade to split roots at the boundaries of the sample area and facilitate extraction. After the root extraction, one-fourth of the remaining soil volume, referred to here as “quadrant” (Q1–Q4), was excavated with a mini-excavator (quadrant method inspired by Fortier et al. [31]). The soil was separated into topsoil (0–30 cm) and subsoil (30–60 cm), sieved on-site, and additional roots (down to a minimum size of 2 mm in diameter) were collected. Due to the labor intensity and based on literature research, the excavation depth was limited to 60 cm, assuming that after the root extraction with the tripod, only a negligible amount of root biomass would remain in the soil below 60 cm [27,33].
The extracted root stumps and the sieved roots were separated according to the soil layers, washed with water, and weighed the next day for fresh weight determination. Biomass samples from different root fractions were taken from two trees per plot per year and dried at 105 °C for 2 days for DM determination, according to EN ISO 18134-2 [42]. After they were sent to the laboratory for carbon content analysis (see Section 2.4).

2.3.2. Fine Roots Sampling

To determine fine root biomass, soil samples were collected in both years, at the beginning of March to a depth of 30 cm, using a 50 mm diameter manual soil auger (Eijelkamp, NL) with a collection cylinder. Fine roots were sampled in the upper 0–30 cm of the soil using soil cores, as numerous studies have shown that the majority of fine root biomass is concentrated in the topsoil layers where nutrient availability is highest.
In each of the plots, four sampling sites were selected, scattered over the area to cover potential variations in soil characteristics. At each sampling site, two soil samples were taken, one between two trees of the same row, and one between two different rows, and pooled into one sample. This resulted in a total of 32 boreholes and 16 samples (4 samples per plot). The samples were then sieved through a sieve with a 2.5 mm mesh size and examined for fine roots (roots < 2 mm), which were collected by hand. An analogue calliper with an accuracy of 0.05 mm (BGS Technik, Wermelskirchen, Germany) was used to measure root diameter.
From the sieved soil, soil samples were taken and freshly weighed. The collected fine roots of were washed with water and dried at 105 °C for dry matter determination. Based on the abovementioned data, we calculated fine roots biomass (DM) per hectare in the topsoil layer (0–30 cm).

2.3.3. Root:Shoot Ratio

To explore the allocation of biomass in the belowground parts of the plant, the root:shoot ratio was calculated. Specifically, each individual sample tree’s belowground biomass (four stools per plot) was divided by the aboveground biomass and the values were averaged across all samples from the same plot (Equation (1)):
r o o t : s h o o t = 1 N i = 1 N r o o t   b i o m a s s i s h o o t   b i o m a s s i
Since fine root biomass sampling was done with the core–auger method, the biomass within this soil compartment could not be determined tree-specific. Therefore, we used the plot mean values to calculate belowground biomass values as the sum of fine root biomass and coarse root biomass.

2.4. Carbon Content Determination and Extrapolation

The carbon content of the sampled biomass was determined by CHNS analysis, using an elemental analyzer(Vario ELIII) (Elementar, Langenselbold, DE, Germany). All biomass samples had previously been dried until constant weight [42] and were ground to 1 mm grain size afterwards. The carbon content for each biomass compartment was calculated based on the carbon density of the sampled biomass and the measured total biomass.
Total stand biomass was estimated by multiplying the data of the harvested trees with the total number of living trees per ha per plot.

2.5. Data Analysis

Exploratory Analysis of the Data

To investigate differences in biomass stocks within each compartment and between planting systems, and to assess the effects of management (variety, planting density, shoot age), pairwise comparisons were carried out for the relevant subsets of plots (stem biomass, crown biomass, total aboveground biomass, fine root biomass, coarse root biomass, total belowground biomass).
Since normality and homoscedasticity assumptions required for parametric tests were not consistently met, the non-parametric Mann-Whitney U test [43,44] was applied for pairwise comparisons.
Because the poplar plots had been established several years prior to this study, they did not allow for a full factorial design. Therefore, statistical comparisons were conducted with different subsets of the plots to minimize collinearity of effects due to the nested structure of some variables:
Subset 1—variety: To test for the effect of variety, MaLD1 and SkLD1 were compared, which had the same planting density and shoot age.
Subset 2—shoot age: To test for the effect of shoot age and rotation stage, MxHD1 and MxHD2 were compared, which were of the same variety and planting density.
Subset 3—planting density: To test for the effect of planting density, MaLD1 and SkLD1 were compared with MxHD1. All plots in this comparison had the same shoot age but included different varieties, which was neglected because the experiment did not include repetitions of all varieties at differing planting densities.
The non-parametric Mann-Whitney U test was conducted in Python (version 3.11.5) using the SciPy package [45] (version 1.11.3), with exact p-value calculation for small sample sizes and without continuity correction. Statistical significance was determined at a threshold of α = 0.05. Since multiple hypotheses were tested, p-values were adjusted using the Holm–Šídák method to control the family-wise error rate at α = 0.05. The total number of null hypotheses was 28. The correction was implemented using the statsmodels package (version 0.14.4).

2.6. Allometric Scaling Models

General allometric equations were developed with the data collected across all plots for aboveground biomass (n = 100) and belowground biomass (n = 32). Additionally, management-specific equations were developed based on the planted variety, the growth stage within a rotation cycle (first or second rotation), and the planting density in the plot (Table 1).
All equations had the form of a simple power–law function, as allometric scaling theory assumes a power relationship between plant size and biomass (Equation (2)), describing growth as a multiplicative process [32,41]. This type of function is commonly applied in forestry and short-rotation coppice systems to describe biomass development as a function of tree diameter at breast height (DBH) [19,32,42]. The general allometric equation is given as:
Y = a X b
where X represents the predictor variable (DBH), Y the response variable (aboveground or belowground biomass), a the allometric coefficient, and b the allometric exponent. To estimate the parameters using ordinary least squares regression, Equation (2) was linearized through logarithmic transformation and fitted as:
log Y = log a + b log ( X )
This log-transformation is based on the assumption that the residuals of the allometric models follow a log–normal distribution and that the data are heteroscedastic, i.e., the variance of the response variable increases with increasing values of the predictor variable [46]. Model parameters were obtained from the log-transformed models, while the corresponding power-law equations were obtained by back-transformation of the parameter estimates.
In addition to DBH, some studies have used further variables such as tree height or planting density to predict poplar biomass [5,43,44]. DBH and tree height are generally considered the most important predictors in allometric biomass models, with DBH commonly used as the primary variable and tree height sometimes included to further improve model accuracy (e.g., Ter-Mikaelian and Korzukhin [47]). However, these additional predictors were not included in the present study. According to allometric theory, tree height and stand density are generally correlated with DBH, and including correlated predictors may introduce multicollinearity when developing allometric models [32,45,46]. In our dataset, aboveground biomass showed a significant positive correlation with DBH (Pearson r = 0.65, p < 0.001, n = 100), supporting the use of DBH as the predictor variable in the present model. Furthermore, accurate measurement of tree height can be challenging within dense stands, particularly when trees reach larger sizes and destructive measurements are not feasible. To evaluate the goodness-of-fit of the models, we used the standard error of model parameters, the statistical significance of model parameters (p-values), the root of mean square error (RMSE) (Equation (4)), and the coefficient of determination (R2) (Equation (5)), which represents the proportion of variance explained by the models. The RMSE is given by:
R M S E = i = 1 n ( y i y ^ i ) 2 n 1
R2 measures the proportion of variance in the dependent variable that is explained by the independent variables, often referred to as the fit of the linear relationship:
R 2 = 1 i = 1 n ( y i y ^ i ) 2 i = 1 n ( y i y ¯ i ) 2
where y i is the observed value of the dependent variable for observation i, y ^ i is the predicted value, and y ¯ is the mean of the observed values.

3. Results

3.1. Carbon Content

We determined the carbon content of the sampled biomass of all tree compartments separately for each plot (Table 2). For simplicity, we report only biomass in the following results, as the carbon content was relatively consistent across all plots and individual sampled trees and can be reliably derived from biomass values.

3.2. Biomass Measurement

The results of the two biomass measurement campaigns conducted in 2024 and 2025 (6 and 7 years after planting) were analysed separately to account for the growth between both measurement campaigns. The measured values showed notable year-to-year and plot-specific variations, with generally higher standard deviations in the 2nd year, due to the different method in sample tree selection. The mean biomass in the different compartments, as well as their standard deviation, is shown in Table 3.
Mean DBH measured in 2024 was 9.74 cm in MaLD1 and 9.61 cm in SkLD1. In the high-density plots, mean DBH was lower, with 7.09 cm in MxHD1 and 4.73 cm in MxHD2. In 2025, mean DBH increased to 11.28 cm in MaLD1 and 12.0 cm in SkLD1, while the high-density plots showed mean values of 8.08 cm and 8.11 cm, respectively.
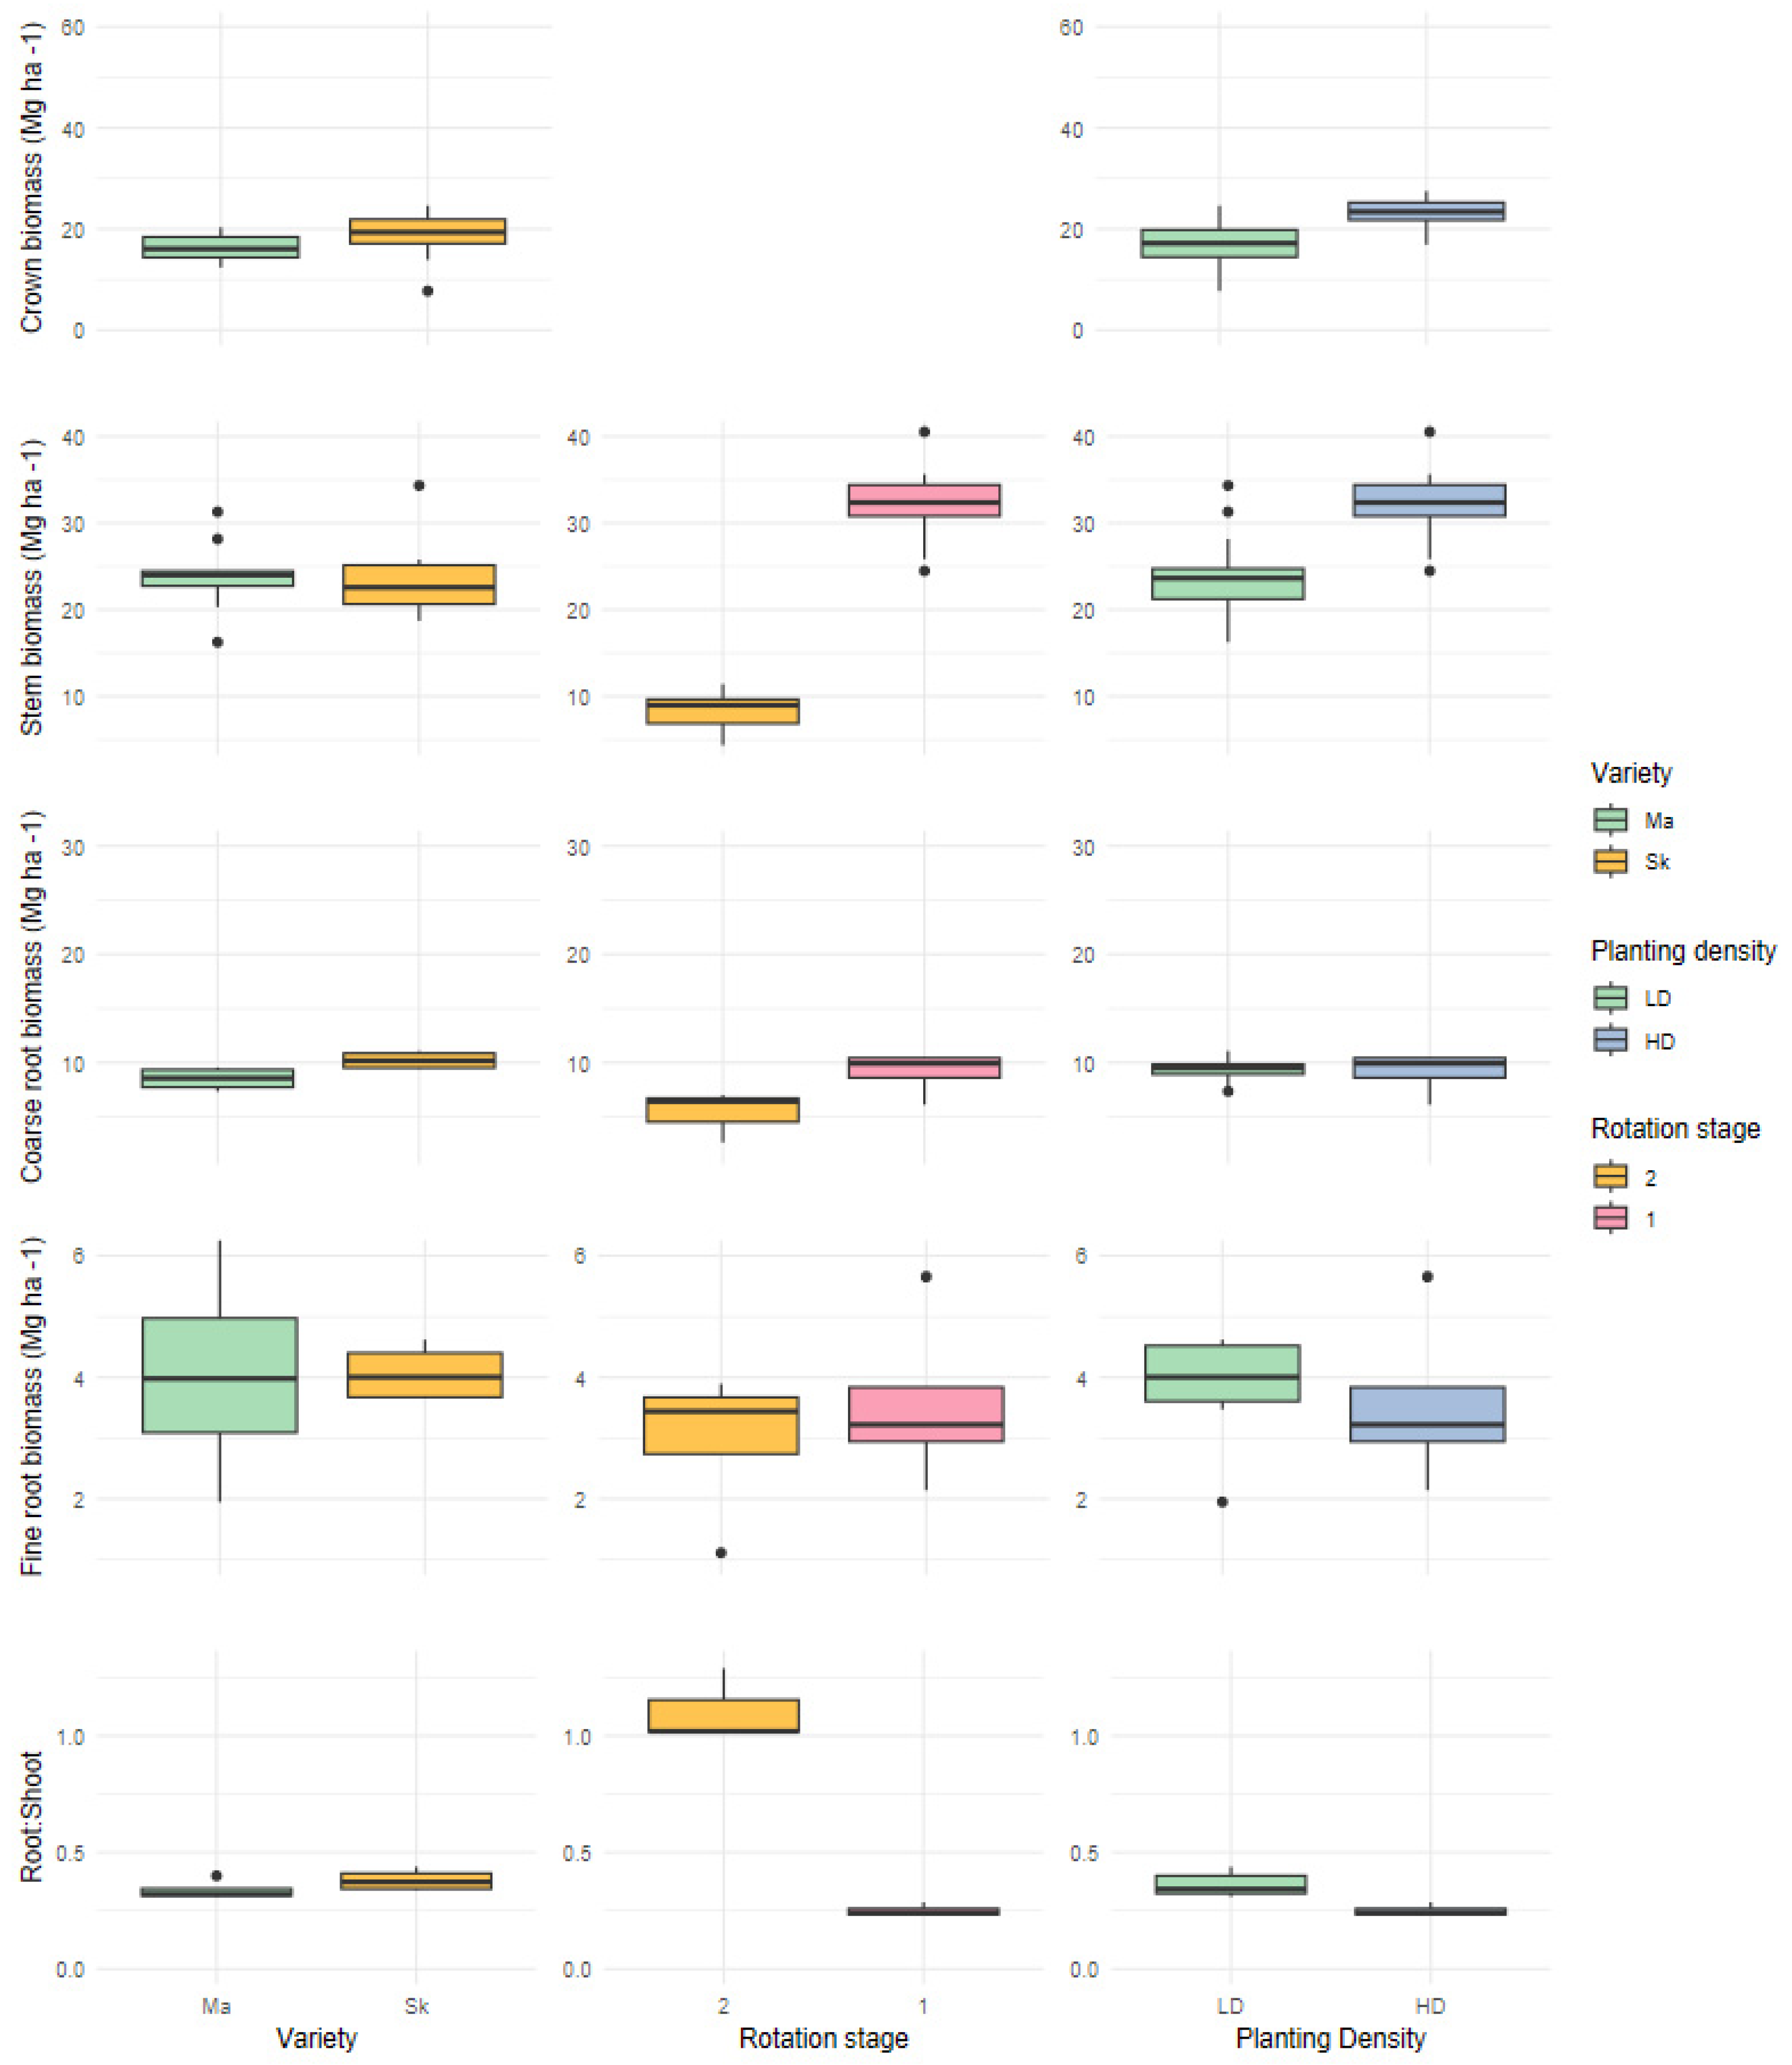
Crown biomass ranged from 16.31 to 23.18 Mg ha−1 in 2024 and from 17.81 to 32.12 Mg ha−1 in 2025, with all plots showing higher values in 2025. In both measurement campaigns, the largest crown biomass was observed for the variety Max3 in MxHD1.
Stem biomass was higher than crown biomass in both years and increased over time in all plots. The measured values ranged from 8.23 Mg ha−1 (MxHD2) to 32.15 Mg ha−1 (MxHD1) in 2024, both managed as higher density systems. As expected, the smallest aboveground biomass was exhibited by MxHD2, which only had a shoot age of one year, after having been harvested the year before. Between the measurement campaigns, stem biomass increased substantially, reaching a minimum of 27.69 Mg ha−1 in MxHD2 and a maximum of 62.79 Mg ha−1 in MxHD1 in 2025.
The biomass in the coarse root compartment showed a less distinct increase between years and generally followed different patterns. In 2024, coarse root biomass ranged from 5.35 to 10.22 Mg ha−1, with the highest amount measured in SkLD1. In 2025, the same plot had the lowest biomass in the coarse root compartment, with a substantially smaller biomass (5.27 Mg ha−1). The maximum value for that year and compartment was observed in MxHD1 with 14.82 Mg ha−1. Fine root biomass remained relatively stable across plots and years. In 2024, values ranged from 2.97 (MxHD2) to 4.09 Mg ha−1 (MaLD1), and in 2025 from 2.57 (MxHD2) to 3.89 Mg ha−1 (MaLD1).
Analysing root:shoot ratios, we observed considerable variation between plots and years. In 2024, MxHD2, as expected, showed the highest ratio (1.11), while MxHD1 exhibited the lowest (0.25). This changed in 2025, where especially plot MxHD2 invested in aboveground biomass and shifted to a root:shoot ratio of 0.49. Interestingly, the values measured for MxHD1 and SkLD1 increased in 2025 (0.25 to 0.28 and from 0.38 to 0.54, respectively), while dropping from 0.34 to 0.26 in MaLD1.
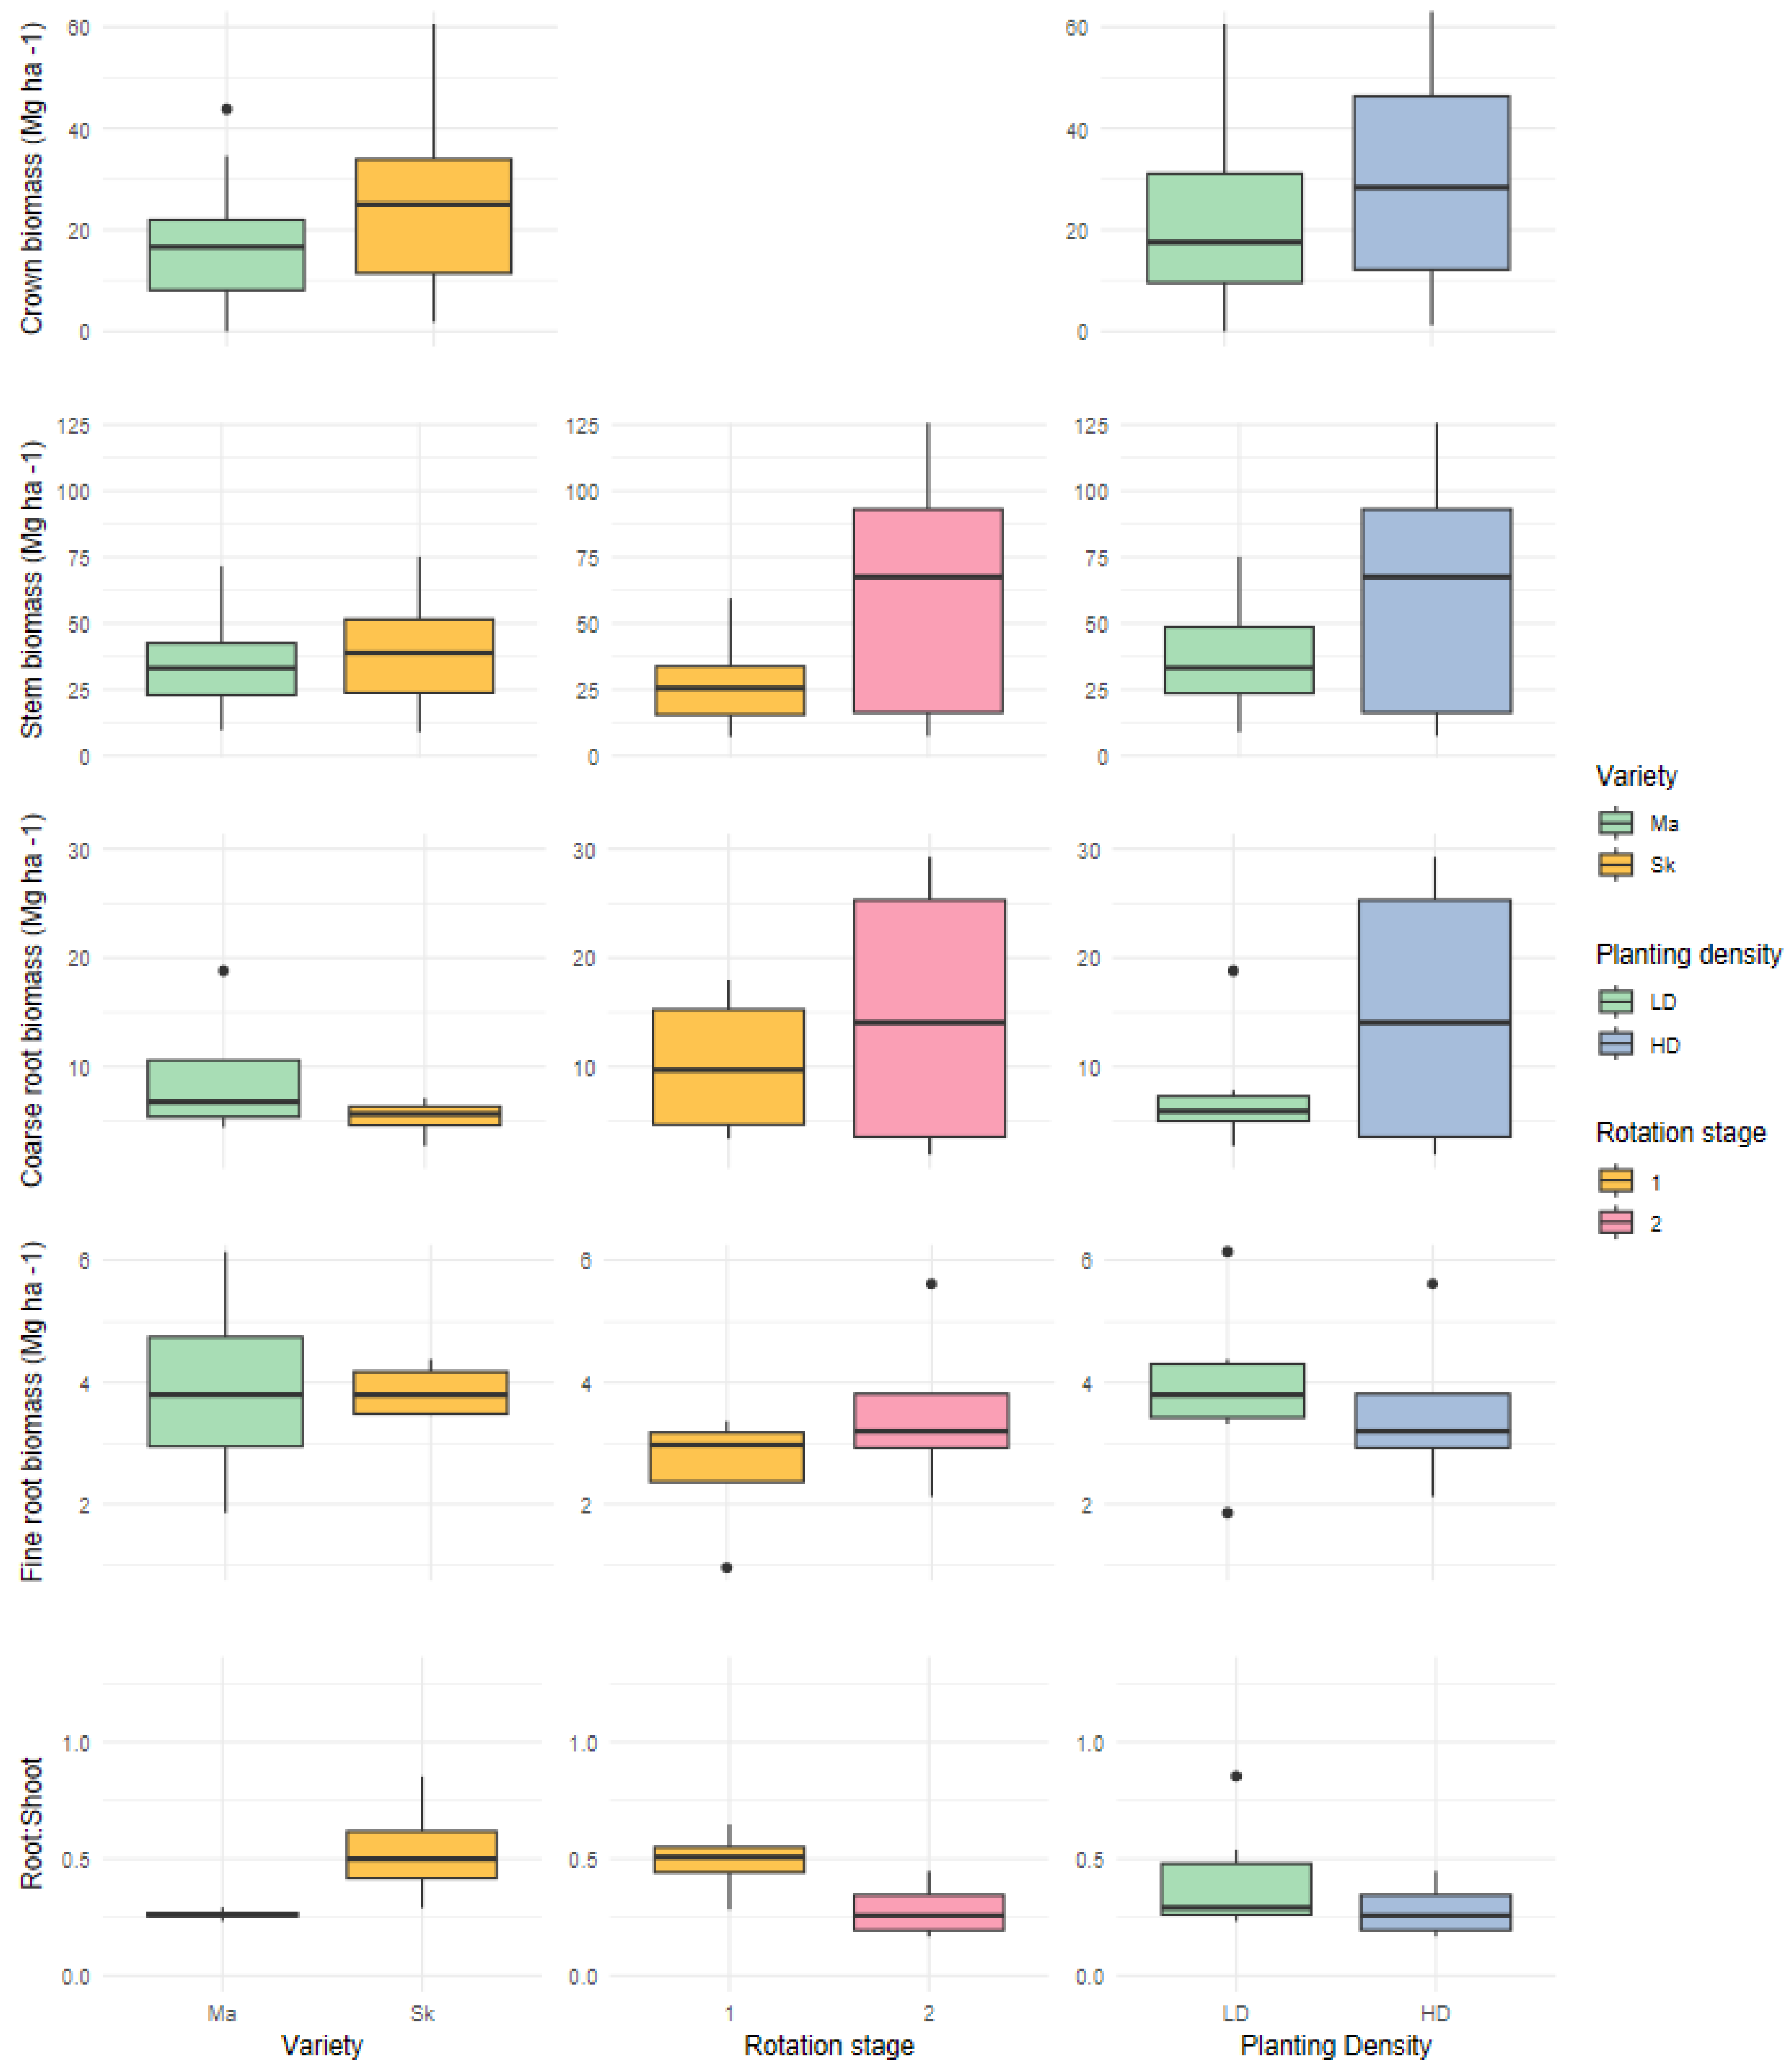
In Figure 3 and Figure 4, we display boxplots that visualise the comparisons within the previously described groups. p-values of the non-parametric Mann-Whitney U test can be found in Table 4 and Table 5. Figure 3 and Figure 4 show a slight difference between varieties in crown biomass in both years, which proved not to be of statistical significance. On the contrary, planting density was identified as an influencing factor determining crown biomass. This difference was statistically significant in 2024, where the data overall showed lower variance. For stem biomass, both planting density and rotation stage emerged as significant influencing factors. Again, both effects stand out as more distinct in 2024, where the data showed lower variability due to a smaller range of tree sizes in the sampled trees.
In the belowground compartments, detecting statistical differences between management groups was challenging due to the small sample size and high variability, particularly in the 2025 data.
For the root:shoot ratio, planting density had a marginal effect in 2024, while no significant differences between varieties and rotation stages were detected in that year. In 2025, the root:shoot ratios were not significantly affected by variety, planting density, or rotation stage had no significant effects.

3.3. Allometric Scaling Models

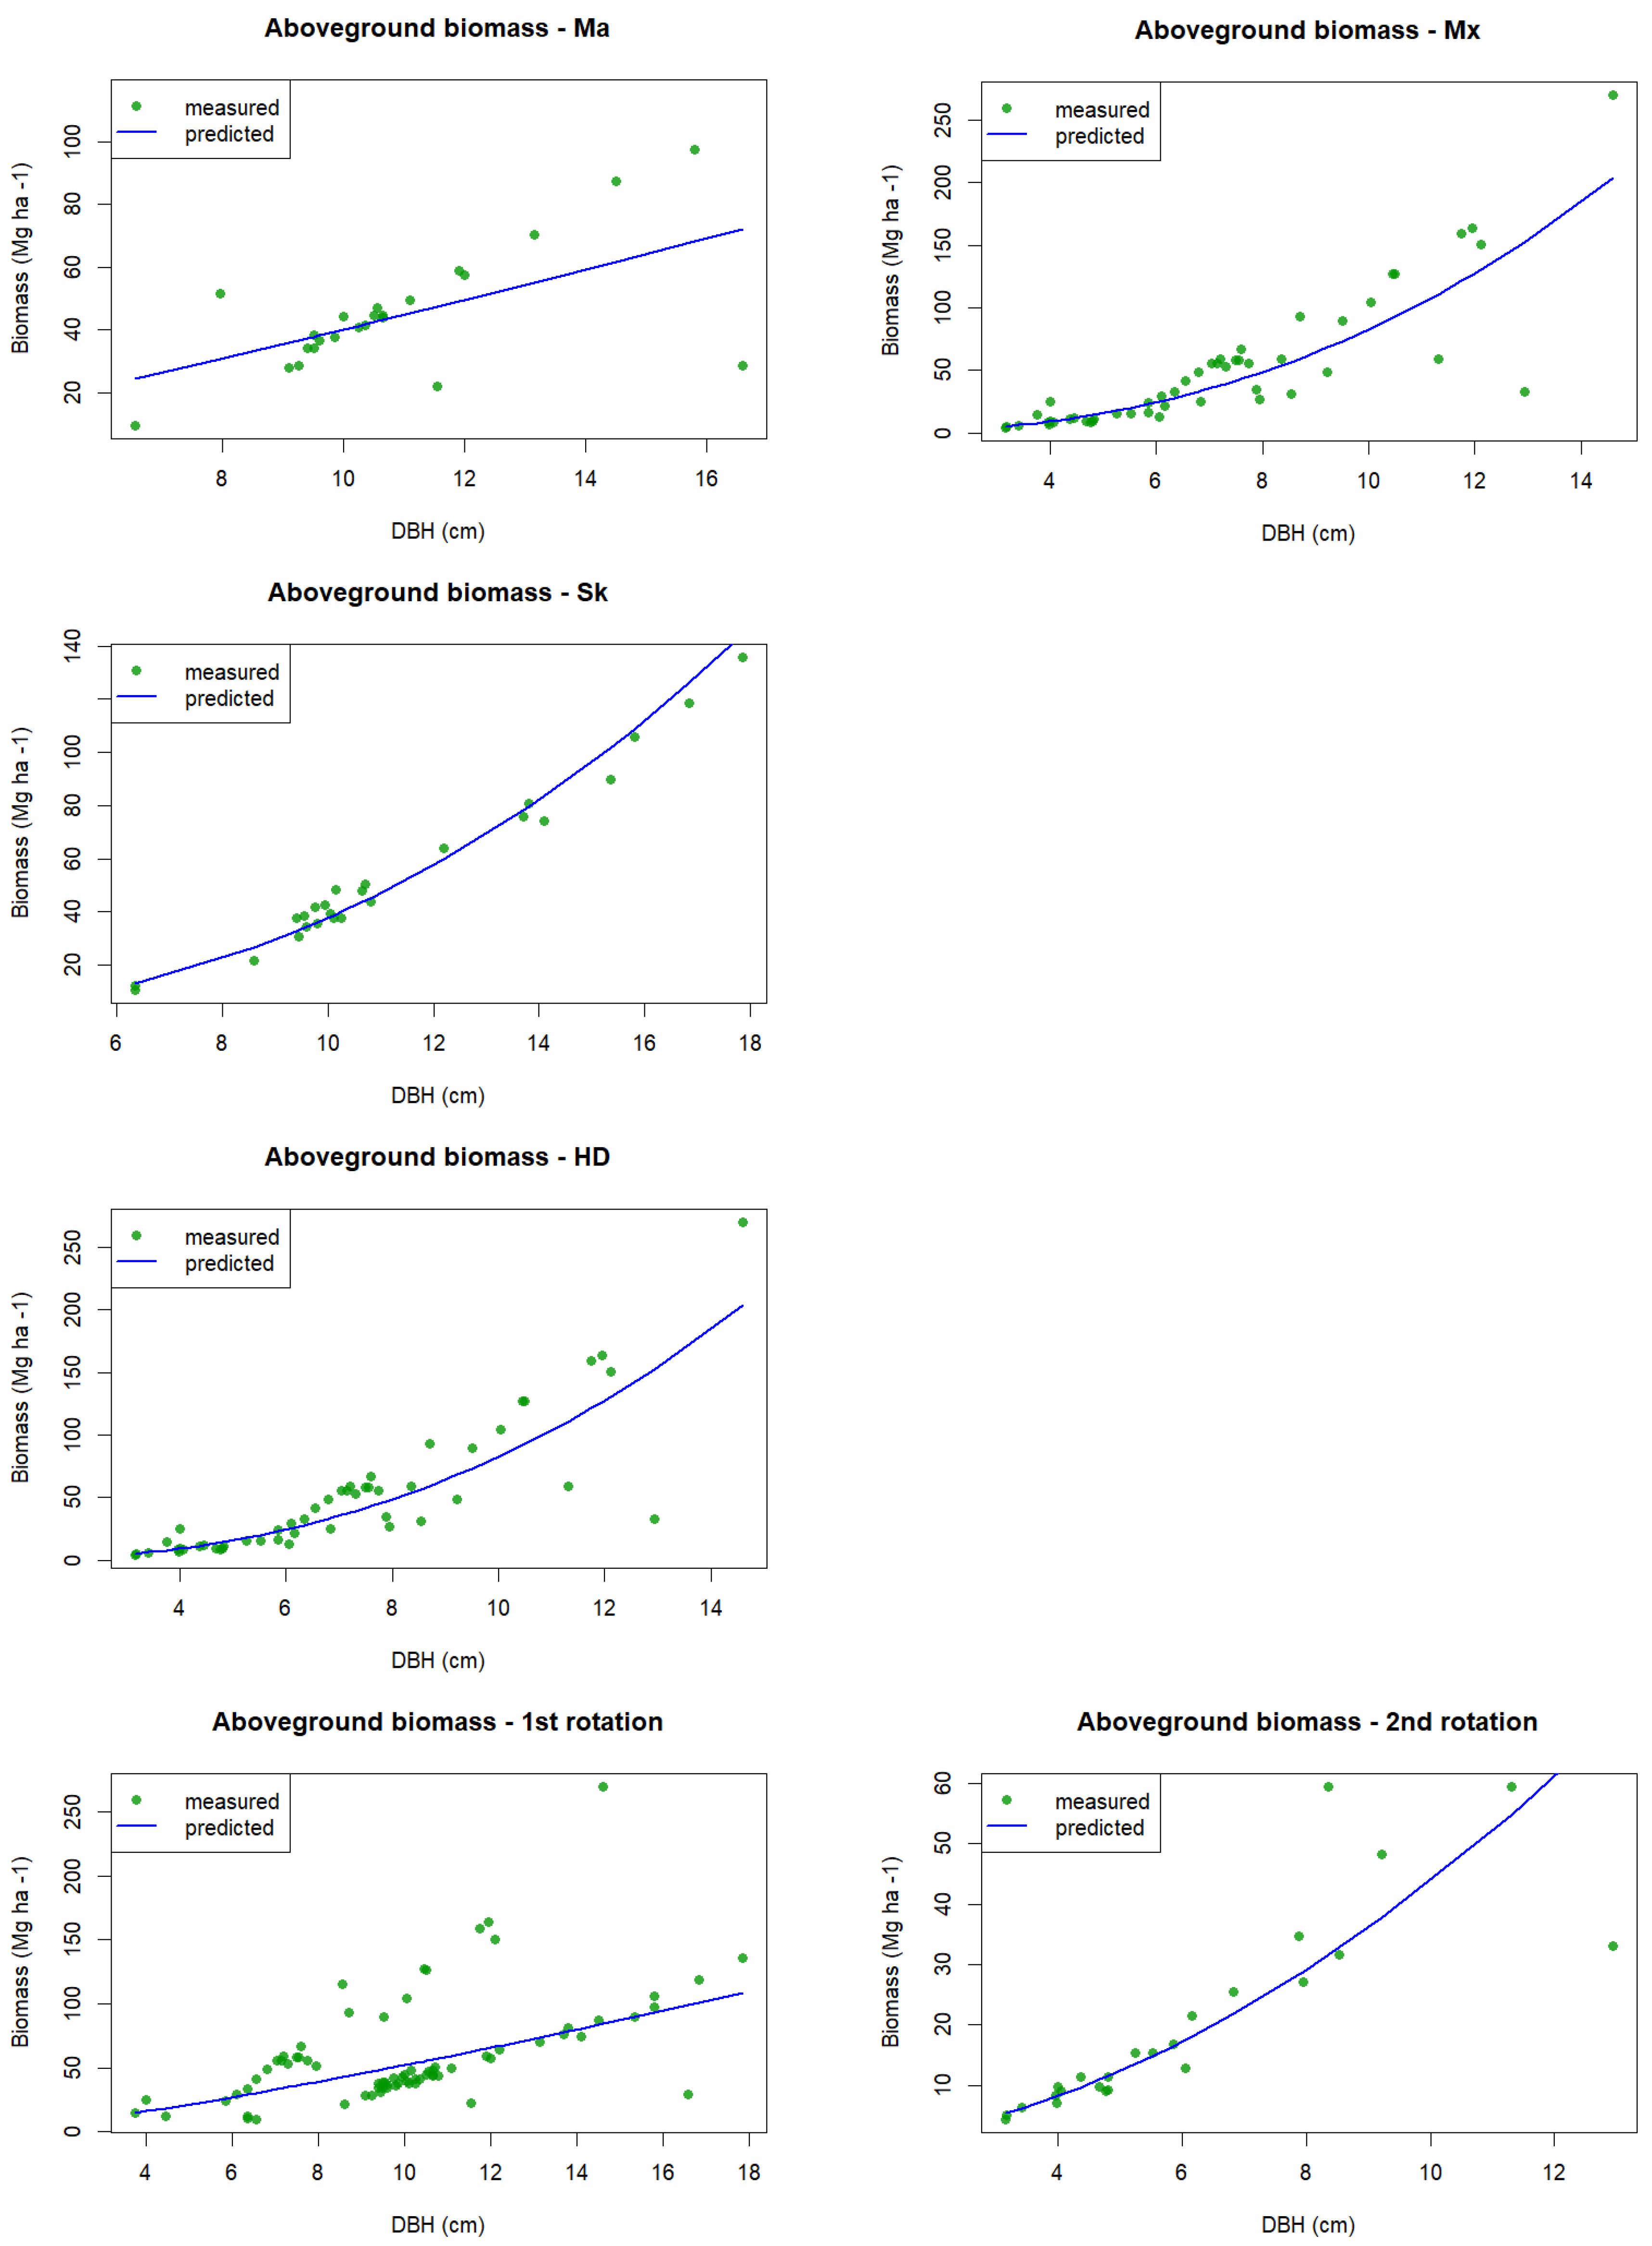
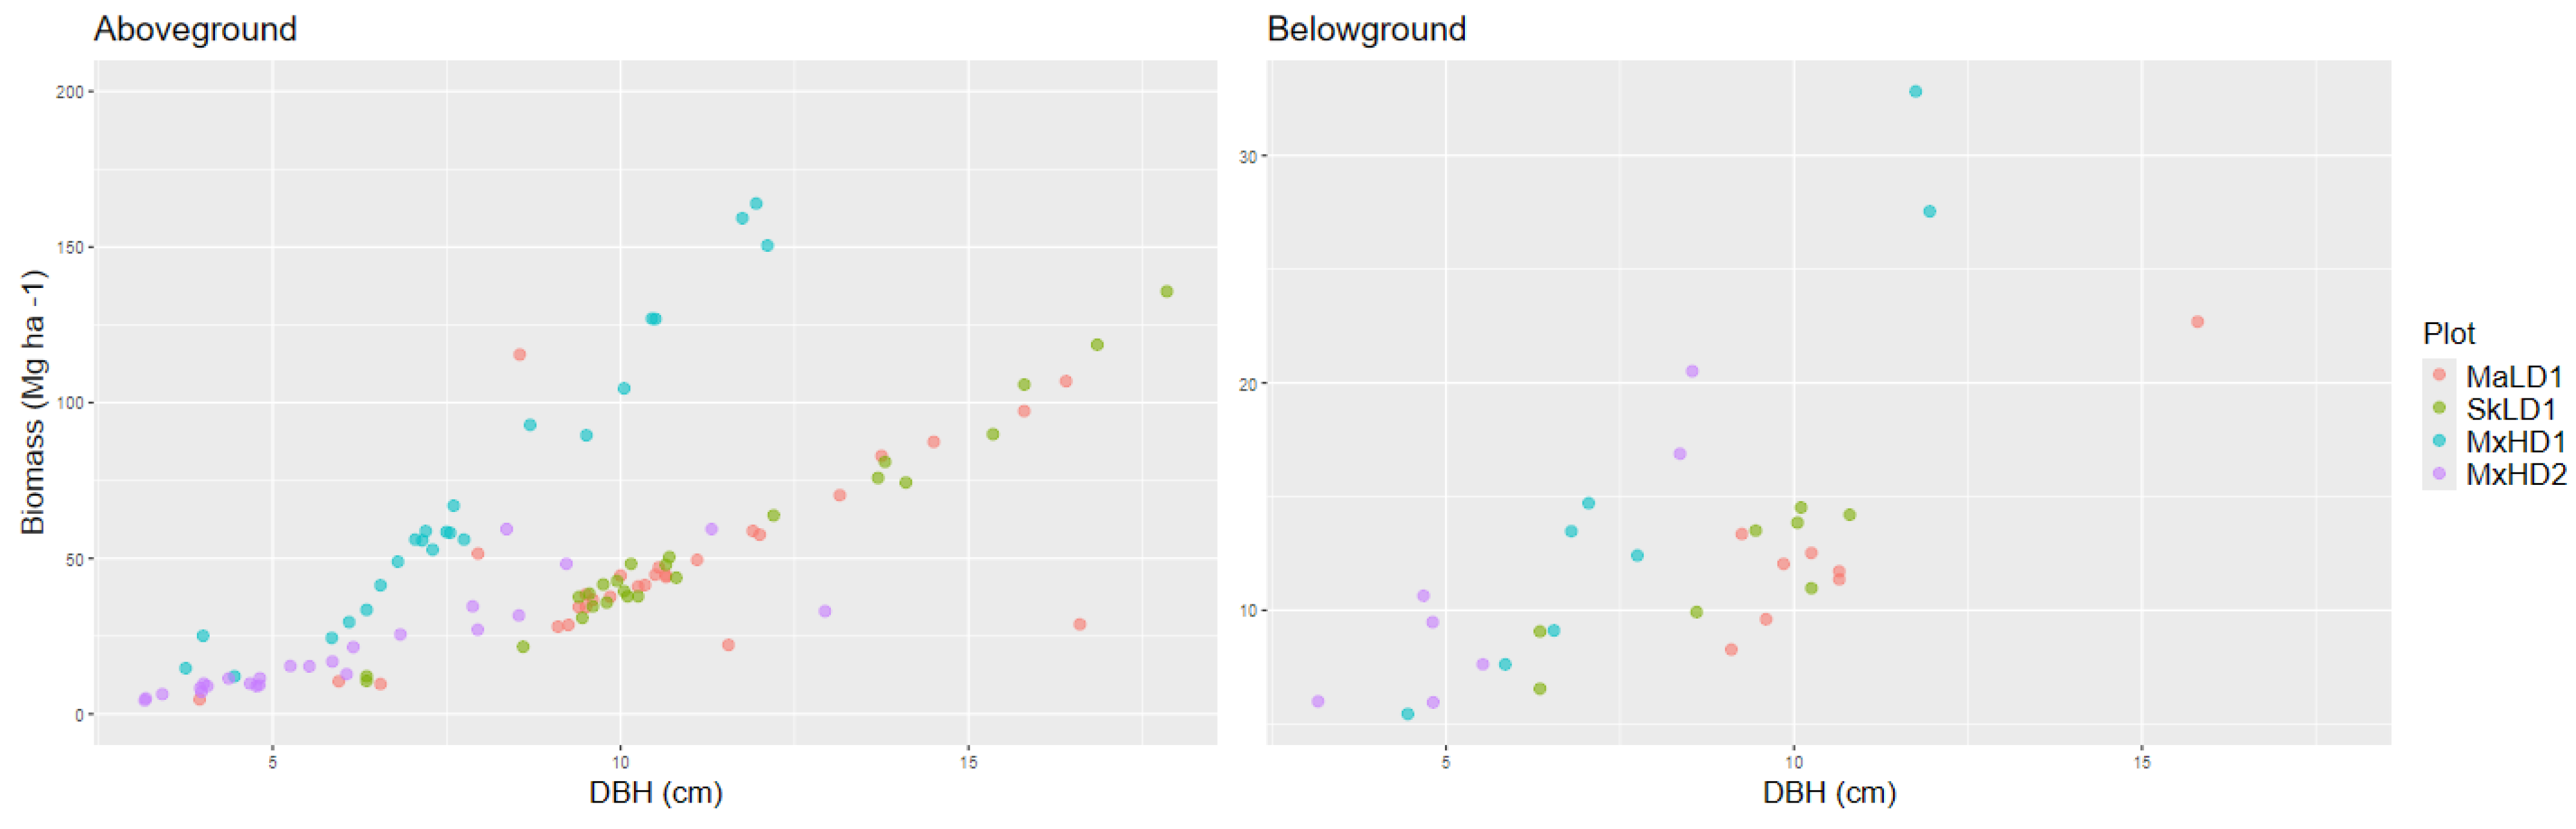
General allometric equations were developed using data from all plots to estimate both aboveground and belowground biomass. The relationship between biomass and DBH within each field is depicted in Figure 5.
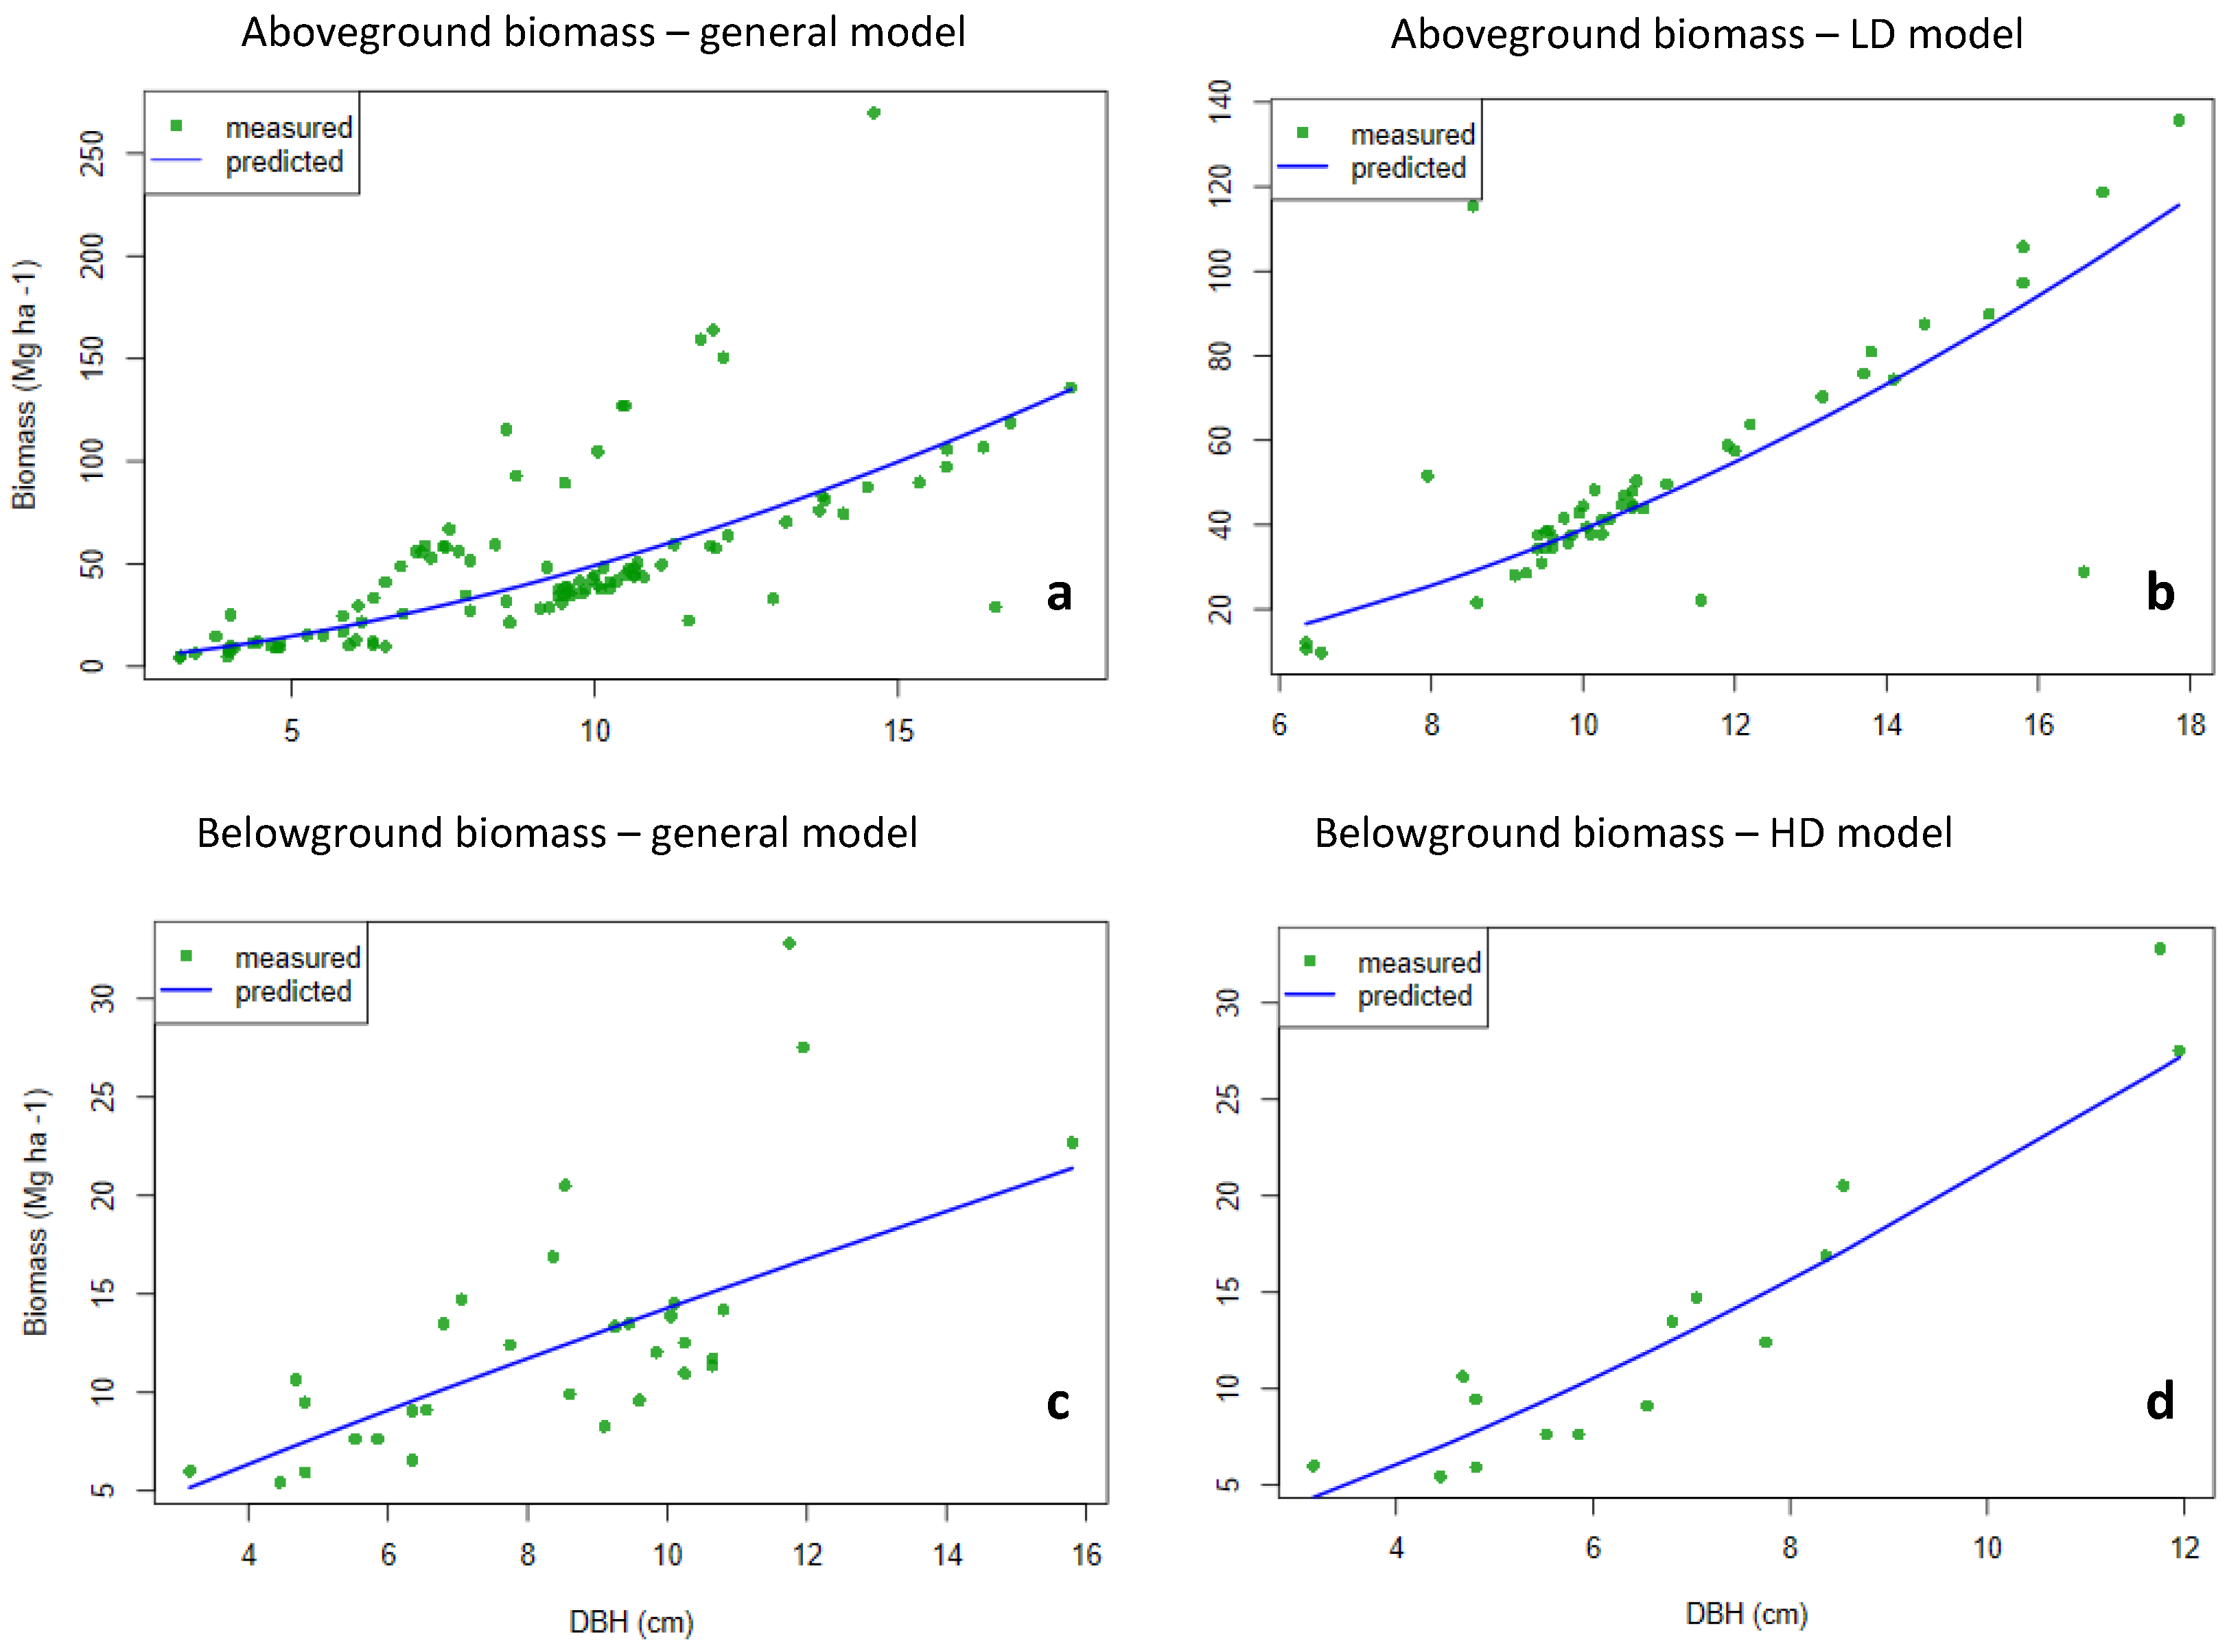
In addition, management-specific models were created based on planting density, variety, and growth stage (Table 1). Detailed results, including model performance metrics, are presented in Table 6 and Figure 6.
For aboveground biomass, the general model, based on equation 2, explained 67% of the variance in the data. Management-specific models generally improved estimation accuracy, with the variety-specific model for SkLD1 achieving the best performance (R2 = 0.97).
Grouping data by planting density also led to improved model performance, with R2 values of 0.74 for a density of 2083 trees ha−1 and 0.83 for 8333 trees ha−1. Notably, each group included data from various varieties and rotation stages, yet the grouping still enhanced predictive power.
When grouping by growth stage, model performance was more variable. The group containing the first rotation data (with varying planting densities) showed relatively poor performance with an R2 of 0.39. Only the model based on data from MxHD2, the only plot in its second rotation, benefited from this, creating a rotation-specific model.
Figure 5 illustrates that both aboveground and belowground biomass follow distinct allometric relationships depending on planting density. These findings align with the results in Section 3.1, which showed statistically significant effects of planting density and variety on aboveground biomass.
The modelling of belowground biomass produced similar results. The general model explained 55% of the variance in root biomass, despite incorporating data across all varieties, planting densities, and growth stages. Management-specific models improved predictive accuracy, especially when grouped by variety or planting density, reaching over 80% explained variance in some cases. However, models grouped by growth stage again showed weaker performance, particularly when combining different varieties and planting densities within a single model.

4. Discussion

4.1. Exploratory Data Analysis

To frame the subsequent discussion, we first explored the biomass data to reveal patterns related to planting density, clone variety, and harvest-rotation design. This analysis highlights how aboveground and belowground biomass is distributed among different tree compartments and provides insight into the relative influence of management factors on growth dynamics.

4.1.1. Drivers of Aboveground Biomass Partitioning

In our two measurement campaigns, we observed an increase of aboveground biomass over time, as expected. However, due to the varying sampling methods used in the two years, the increase extrapolated to the plot level is not representative of the yearly productivity. This, in part, also explains the higher variance observed in the data from the 2025 campaign.
When deriving plot-specific individual annual productivities from the 2025 biomass data, we obtain 7.54 (MaLD1), 8.92 (SkLD1), 13.56 (MxHD1), and 13.98 Mg ha−1 year−1 (MxHD2). These values align well with those reported in comparable poplar systems across Europe and North America. For example, Polish trials recorded up to 13.6 Mg ha−1 year−1 for high-performing clones (e.g., UWM 2) [48], while German alley-cropping systems yielded between 9.8 and 13.3 Mg ha−1 year−1 over a 13-year period [49].
It is well-established that environmental and genetic factors shape tree growth, but the extent to which planting density and variety influence biomass partitioning in the different compartments of poplar trees remain a subject of debate. In the present study, higher aboveground biomass was observed in the denser plots for both structural components (stem and crown). This observation aligns with findings of Fang et al. [5], who reported increased stand productivity at higher planting densities [21]. However, not all studies report similar trends. For instance, Qiao et al. [50] observed greater biomass production at lower planting densities in Populus tomentosa plantations in Northern China. Their results suggest that reduced density had a positive impact not only on individual tree growth but also on overall site conditions, including soil nutrient availability, levels of organic carbon, and microbial biomass and diversity.
When interpreting our results, it should be taken into consideration that the LD plots had undergone partial harvest, meaning that half of the biomass had previously been removed prior to this study. Unfortunately, we do not have yield values available for the amount of aboveground biomass removed in these plots, but it seems reasonable to assume that the denser planting design in the years before the partial harvest influenced individual tree productivity, thereby lowering the overall stand biomass at the time of observation. Considering this, the effect of planting density might have been less pronounced if the lower density planting design had been established at the time of planting. In line with this thought, Truax et al. [20] found that planting density only had a marginal effect on aboveground carbon stocks in a Canadian poplar plantation (P. canadensis × P. maximowiczii). Truax et al. also observed an increasing stem:branch ratio with denser planting, likely due to intensified competition for light. Although our study did not directly examine the stem:branch ratio, we instead observed a consistent increase in biomass of both stem and crown with increasing planting density in both years (Figure 3 and Figure 4). This suggests that any impact of planting density on the stem:branch ratio would likely be minimal. However, the range of planting densities examined by Truax et al. (494 to 1975 trees/ha) was considerably lower than in our experiment (2083 and 8333 trees/ha). This lower tree density may have resulted in weaker intra-specific competition, potentially explaining the more muted response to density changes observed in their study. For better comparison, we calculated stem:crown ratio and found similar values across plots in both years (1.27 to 1.46 in 2024 and 1.61 to 1.97 in 2025). The values increased over time, and there seemed to be a tendency for one of the varieties planted at a lower density (Sk), having a higher crown biomass in comparison to the other two plots. This indicates that differences caused by genetics might be of greater impact than those caused by planting density, although more data are needed in order to draw reliable conclusions.
In spite of these differences, we could not find statistically significant differences in the aboveground biomass components between the varieties Ma and Sk in our trials. This could be attributed to the fact that the two compared varieties were both hybrids derived from the same parental species (P. trichocarpa × P. maximowiczii), which may have led to similar growth performance due to their genetic proximity. Many studies have reported significant varietal differences in aboveground biomass partitioning [51,52,53]. Additionally, the relationship between biomass and diameter at breast height (DBH), referred to as allometric plasticity, has been reported to be genetically influenced [31,54], which affirms our observations regarding the stem:crown ratio. However, other research suggests that when clones or hybrids from the same type species or with the same parents are cultivated under comparable environmental conditions and are of similar age, their aboveground biomass development tends to follow similar patterns [55].
Moreover, findings from hybrid poplar studies indicate that the genomic regions controlling biomass traits can change over time, meaning that different sets of genes may be expressed at different developmental stages [56]. These genetic variations and temporal dynamics may explain the inconsistent findings across studies and highlight the difficulty of directly comparing results from poplar stands that differ in age, genetic background, or growing conditions.

4.1.2. Drivers of Belowground Biomass Partitioning

The above-described complications regarding the comparability of results from different studies also apply to belowground biomass and maybe even to a greater extent. As aboveground and belowground biomass partitioning in poplar cultivation systems respond differently to distinct environmental and physiological drivers, they do not necessarily follow parallel patterns [11,27,57]. For instance, aboveground biomass allocation is largely influenced by light availability and competitive interactions among shoots [58], while belowground biomass development is more tightly coupled to soil resource availability, particularly water and nutrients [20].
In the present study, root biomass measured across the four 7-year-old poplar plots decreased in the following order: MxHD1 (18.35 Mg ha−1) > MaLD1 (13.06 Mg ha−1) > MxHD2 (12.79 Mg ha−1) > SkLD1 (9.25 Mg ha−1). When dividing stand-level root biomass by stand age, this corresponds to approximate average annual belowground biomass increments ranging from 0.35 to 0.70 Mg ha−1 year−1. These values fall within the lower to mid-range of those reported for comparable systems, which varied widely depending on stand age, genotype, site conditions, and management intensity [11,19,59].
The variability observed in root biomass both within this study and across the literature highlights the complexity of belowground biomass allocation patterns. Root biomass can be significantly influenced by environmental and management factors [19,60,61], particularly planting density [15,20,32], but also by genotype and stand development stage [14,62]. However, not all studies agree on the role of genotype, with some finding significant varietal effects on root allocation [19,63,64,65], while others report contradictory results [11].
A growing body of literature suggests that different root components—coarse and fine roots—serve distinct ecological functions and respond differently to environmental and stand structural parameters [66,67]. Coarse root biomass has been shown to increase with wider spacing, likely reflecting the need for stronger anchorage in more open-grown trees [68]. In contrast, fine root biomass often increases under higher planting densities, driven by intensified competition for limited soil resources [15,20,33].
These trends were only partially reflected in our data. Fine root biomass varied only slightly between the plots and tended to be slightly higher under lower planting densities, contrary to expectations. Coarse root biomass, on the other hand, showed more pronounced differences in the 2024 dataset, particularly linked to growth stage and variety, but these patterns were not detectable in the 2025 dataset. This inconsistency, as well as apparent year-to-year differences such as the shift in SkLD1 from the highest coarse root biomass in 2024 to the lowest in 2025, may partly reflect methodological differences between the sampling campaigns, with greater variability observed in the 2025 dataset. Nevertheless, as is the case with the aboveground data, our results for the lower-density plots (MaLD1, SkLD1) may not be fully representative. During our measurement campaigns, we only included planting rows that had not been affected by the partial harvest conducted the year before the study. However, in the harvested rows, the roots were left intact and the tree stumps remained alive despite being suppressed and repeatedly cut back. As a result, the actual root biomass, and thus belowground carbon storage, was likely substantially higher than our reported values.
While the observed differences in biomass allocation between plots and management regimes were generally consistent, it is likely that some effects would have been more pronounced under a fully balanced and strictly controlled experimental design. An idealized setup would have a replicated factorial arrangement of cultivars and management treatments. However, such conditions were not achievable in the available long-term field experiments.
Despite these limitations, the results provide valuable insights into biomass distribution patterns in comparatively mature poplar stands, a growth stage that is underrepresented in biomass-oriented poplar research.

4.1.3. Optimal Partitioning Theory and Root:Shoot Ratio

From a theoretical standpoint, the allocation of biomass is commonly understood within the framework of the optimal partitioning theory, which posits that plants prioritize biomass investment in organs responsible for acquiring the most limiting resource [22]. We measured the lowest amount of both coarse and fine root biomass in 2024 in the MxHD2 plot, which was harvested one year before. In 2025, root biomass in this plot had increased and was comparable to that of the other plots. This aligns with the optimal partitioning theory, assuming that the plants were using resources stored in the roots to invest in aboveground biomass production in the 1st year after harvest. In the 2nd year after, the tree starts to acquire an increasing amount of resources via photosynthesis in the aboveground parts and is therefore able to invest more into belowground biomass allocation again.
In this context, the root:shoot ratio serves as an informative metric for assessing the impact of management on allocation strategies. The root:shoot ratios computed by us confirm the shift in allocation in the MxHD2 plot over our study period. While in 2024 this plot, as expected after harvest, stands out due to a high root:shoot ratio, already one year later we observed a substantial drop in this value as aboveground biomass increases.This characteristic is what makes poplar an interesting plant for bioenergy production, as it recovers quickly after harvest and is efficient in biomass partitioning, also in non-irrigated and non-fertilized management systems [69,70].
Regarding the other plots, we see overall higher root:shoot values in the variety Sk in comparison to Ma, and in both years, a higher value for the LD plots, although more pronounced in the 2024 data. Other studies support the idea that planting density can shift allocation patterns and that this plasticity is influenced by genetics. Benomar et al. [32], for instance, reported a significant decline in root biomass in relation to shoot biomass under high-density conditions. Similar findings were reported by Puri et al. [15], suggesting that lower density may drive greater investment belowground, potentially enhancing soil carbon content. Evidently, stand density and genetics appear to be a critical lever for both total root biomass accumulation and partitioning strategy, and there is most likely an interaction between the two.
Lowering planting density in poplar stands may promote more extensive coarse root development, which, over longer rotations, could translate into greater belowground carbon storage [12,20]. However, these benefits must be weighed against practical and economic constraints. For example, harvest costs for fields with longer rotation periods can be up to 20% higher than those for fully mechanized short-rotation coppice systems [71,72]. Consequently, extended rotations with lower-density plantings may not be feasible for all landowners, particularly in systems focused on short-term biomass production. Nevertheless, carbon credit schemes and emerging legislation supporting carbon farming could provide financial incentives for maintaining longer rotations. In such cases, partial harvest systems, like those used in our experimental plots MaLD1 and SkLD1, may offer a viable compromise: they allow for biomass removal while retaining a substantial portion of belowground carbon, making longer rotations economically attractive for farmers.

4.2. Allometric Models

To further investigate the patterns of biomass allocation observed in the previous analysis, we developed and evaluated allometric models relating diameter at breast height (DBH) to aboveground and belowground biomass. These models allow us to quantify how management factors such as planting density, variety, and rotation stage influence the allocation of biomass in poplar stands.
Specification by management improved model estimation in aboveground compartments in almost all cases, with exception of the rotation-stage specific group (R2 = 0.39). This group contained data points of plots within their first rotation, but of differing planting densities and varieties. This indicates that planting density has an influence on the allometric relationship between DBH and aboveground biomass, and that biomass patterns, even after harvest of the first rotation, follow similar patterns within the same variety. This is in line with the findings of Svystun and Böhlenius [73], who tracked the biomass development of a clone through its second rotation and found comparable DBH–biomass patterns after thinning treatments.
In both our datasets, varietal effects could not be distinguished via likelihood ratio tests, but the variety-specific grouping of the data for allometric modelling improved model performance substantially in the case of Mx and Sk, which is in line with results from other studies [31,35].
Similarly, we observed that management-specific allometric models generally improved the estimation of belowground biomass, with enhanced performance in all but one scenario (rotation-stage-specific grouping of all trees within the first rotation, R2 = 0.56). Model specification by genotype produced improvements in predictive accuracy comparable to those achieved through planting-density stratification. This may partly reflect the inclusion of the third variety (Mx) in this group, whose higher planting density in the two fields may have introduced collinearity between genotype and density effects. Generally, both our exploratory analysis and previous studies suggest that genotype effects on belowground biomass are difficult to detect [11], and accordingly, other researchers have recommended developing generalized models that accommodate variation across genotypes [27,55].
Despite the limited detectable influence of genotype, planting density clearly affected model performance. For instance, the planting density-specific model for stands at 2083 trees ha−1 showed strong predictive power (R2 = 0.71), even though it combined data across different genotypes. In contrast, model performance declined when data from plot MxHD1 (8333 trees ha−1) were included, as in the shoot-age-specific scenario, reducing R2 to 0.56. This performance drop indicates that tree allometry in poplar responds to planting density, corroborating previous findings that highlight density-dependent shifts in biomass allocation patterns [15,20,32]. These results emphasize the importance of accounting for planting density when developing allometric models for belowground biomass in poplar.
Many studies have advocated for the inclusion of additional stand structural variables—such as tree height, crown diameter, and basal area—to enhance the accuracy of allometric models, including those for estimating belowground biomass [5,37,74,75,76]. These variables often serve as proxies for individual tree vigor and competitive status, which can influence biomass partitioning. However, findings in the literature have been mixed: while some studies report improved model performance with the addition of such variables [76], others find little-to-no enhancement, particularly when multicollinearity or site-specific interactions are present [77]. This suggests that the benefits of incorporating more parameters may be context-dependent.
Recent advances in remote sensing, including terrestrial LiDAR, drone-based photogrammetry, and mobile scanning, enable detailed measurement of tree and stand structure. Such techniques can generate high-resolution datasets of aboveground biomass, capturing tree height, canopy geometry, and even entire tree architecture. In this context, simple allometric models remain valuable, as they allow scaling biomass estimates to larger areas where full high-resolution scans may not be feasible. For example, UAV-based surveys may provide tree heights, but not reliable DBH estimates, making models that use height as the input variable practical for biomass estimation. Conversely, in plots with detailed terrestrial LiDAR scans of the lower tree portions, diameter-based models can provide accurate biomass estimates when upper canopy data are missing. In this way, simple allometric models complement digital measurement technologies by enabling scalable and flexible biomass assessment across different levels of data availability [78,79,80].
While the present study focused on the development of management-specific allometric models, alternative statistical approaches could be considered to integrate management effects within a unified modeling framework. In particular, dummy variable models or nonlinear mixed-effects models have been suggested as suitable tools to account for categorical factors such as genotype, planting density, and rotation stage within a single model structure. Such approaches allow the simultaneous estimation of multiple factor effects and may improve statistical efficiency when appropriate experimental designs are available (e.g., (e.g., Fu et al. [81] and Wang et al. [82]).
However, in the present study, the experimental design does not provide a full factorial combination of the investigated management factors. As certain varieties are not represented across all planting densities and rotation stages, the dataset exhibits a partially confounded structure. Under these conditions, the application of dummy variables or mixed-effects models would require strong assumptions and may lead to unstable or non-interpretable parameter estimates.
For this reason, we adopted a more conservative modeling strategy based on management-specific model stratification and targeted pairwise comparisons, which allowed us to minimize confounding effects within subsets of the data. Nevertheless, future studies based on more comprehensive and balanced experimental designs could benefit from applying such unified modeling approaches to further disentangle the effects of management factors on biomass allocation.

5. Conclusions and Outlook

This study investigated how biomass partitioning—and consequently carbon sequestration—in poplar stands is influenced by management factors such as genotype, planting pattern, and rotation cycle. Among these, planting density showed the most consistent effect, shaping both aboveground and belowground biomass allocation. Denser stands exhibited higher aboveground productivity, whereas belowground development showed no clear response to density. Varietal effects were occasionally observed but proved inconsistent across years, likely moderated by stand structure and site conditions.
Root biomass patterns also deviated from theoretical expectations, for instance, that lower planting densities would promote substantially increased belowground allocation. This underlines the complexity of root processes and the challenges associated with their reliable quantification.
Observed biomass dynamics, particularly in plot MxHD2, align with optimal partitioning theory: after harvest, aboveground allocation increased, while belowground biomass gradually recovered. Partial harvest strategies may exploit this dynamic, allowing biomass removal while preserving belowground carbon stocks.
Looking ahead, these findings highlight several research needs. First, variability in root biomass across years emphasizes the necessity of standardized and more precise sampling methodologies, potentially supported by advances in imaging or sensor technologies. Second, future studies should systematically investigate partial harvest systems as a means to balance aboveground biomass extraction with the preservation of belowground carbon stocks. Such approaches would benefit from integrated assessments that combine carbon sequestration potential, economical shortcomings and practicability in terms of harvest.
In addition, allometric modelling proved useful when incorporating management factors as grouping variables, particularly for belowground biomass estimation, but requires validation across a wider range of sites, genotypes, and rotation cycles. Coupling such models with remote sensing approaches may enable cost-effective, large-scale monitoring of biomass and carbon dynamics.
Overall, these findings stress the importance of considering management factors in biomass modelling and carbon accounting. Advancing knowledge of how genotype, planting density, and rotation timing interact will be key for optimizing productivity and enhancing carbon storage. Achieving this will depend on coordinated, long-term experiments and methodological innovations, especially for root systems, to capture the full potential of poplar-based systems for sustainable biomass production and climate mitigation.

Author Contributions

L.S.-N.: Conceptualization, methodology, validation, formal analysis, investigation, data curation, writing—original draft preparation, visualization. J.-M.B.: software, validation, formal analysis, investigation, data curation, writing—review and editing. C.F.: methodology, data curation, writing—review and editing. R.R.: writing—review and editing, project administration, funding acquisition. R.P.: Validation, resources, writing—review and editing, supervision, project administration, funding acquisition. All authors have read and agreed to the published version of the manuscript.

Funding

This research was funded by The German Federal Ministry of Education and Research (BMBF), grant number 033L305C.

Data Availability Statement

For access of data, please contact lschulz-nielsen@tutamail.com.

Acknowledgments

We gratefully acknowledge Max Stattauer, Benjamin Selge, and Fatemeh Dehghaninezhad for their valuable technical support throughout the study. Their assistance in fieldwork, data collection, and laboratory analyses substantially contributed to the successful completion of this research.

Conflicts of Interest

The authors declare no conflicts of interest.

Appendix A

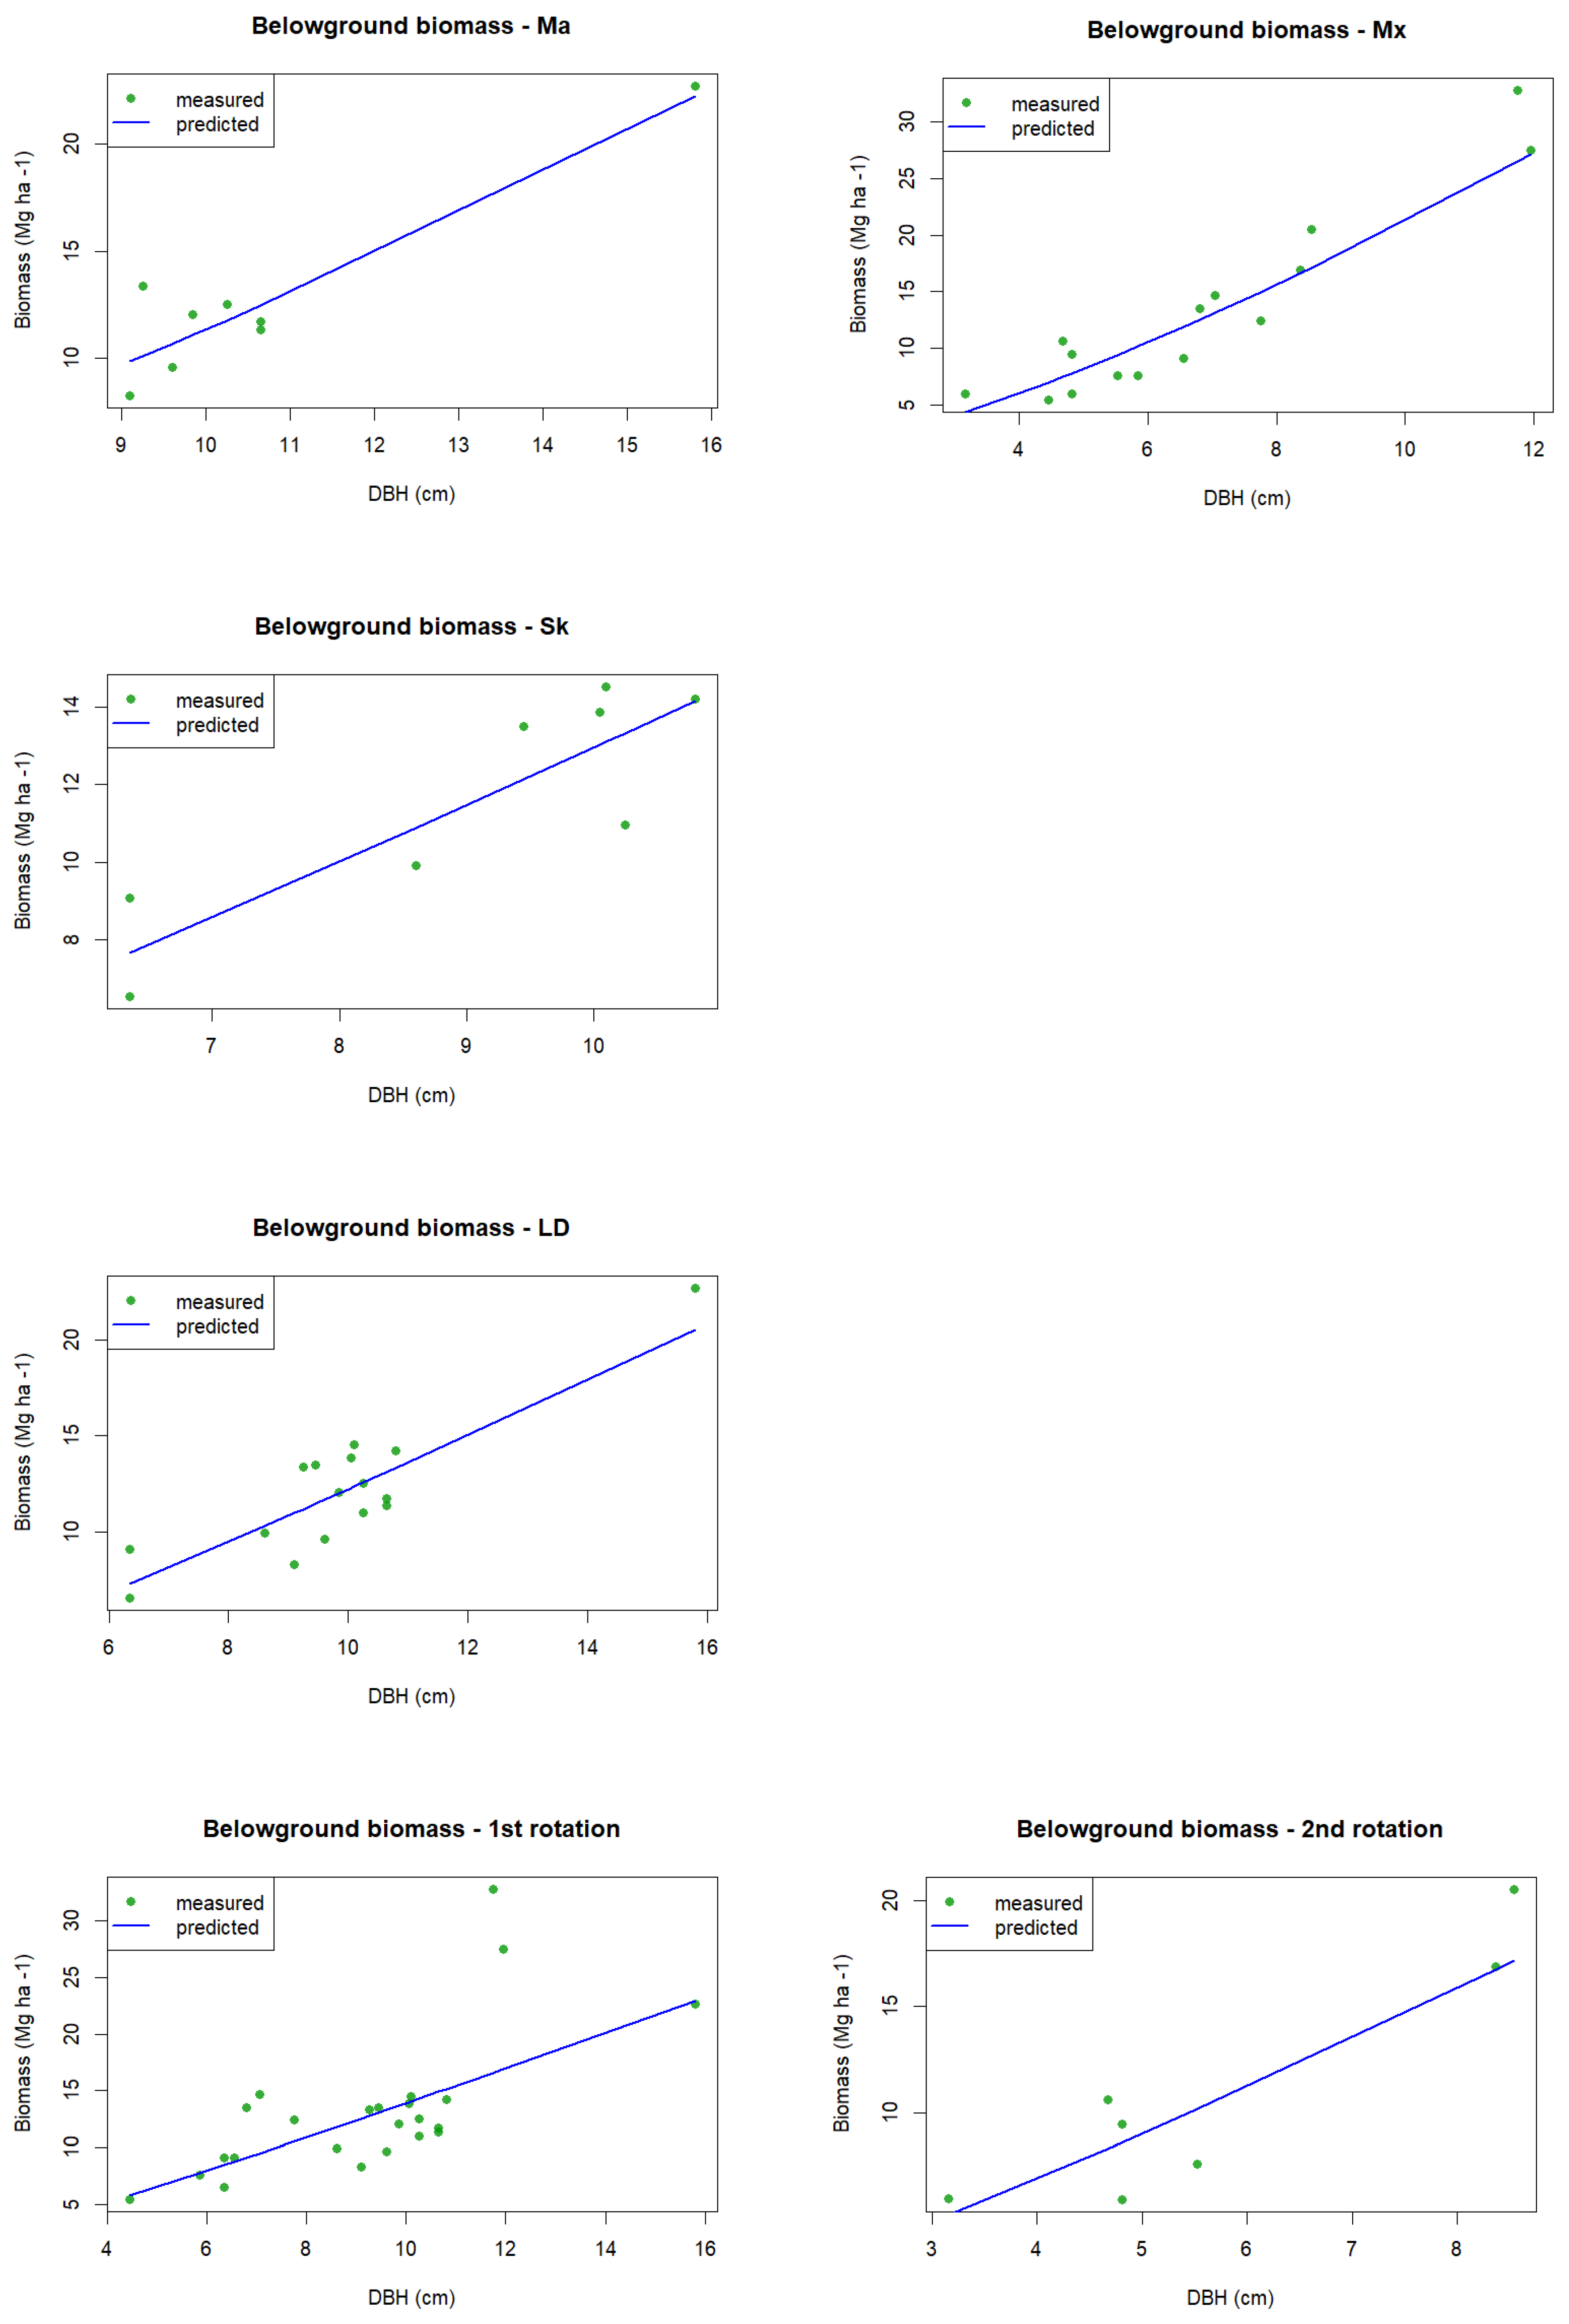
Figure A1. Supplementary plots to Section 3.3, Figure 6—Comparison of allometric model prediction (blue line) and measured values (green) for aboveground biomass (variety-specific models for Ma variety, Sk variety, Mx variety; planting density-specific model for LD (2083 trees ha−1); and rotation stage-specific model for first and second rotation).
Forests 17 00395 g0a1
Figure A2. Supplementary plots to Section 3.3, Figure 6—Comparison of allometric model prediction (blue line) and measured values (green) for belowground biomass (variety-specific models for Ma variety, Sk variety, Mx variety; planting density-specific model for LD (2083 trees ha−1); and rotation stage-specific model for first and second rotation).
Forests 17 00395 g0a2

References

  1. Isebrands, J.G.; Aronsson, P.; Carlson, M.; Ceulemans, R.; Coleman, M.; Dickinson, N.; Dimitriou, J.; Doty, S.; Gardiner, E.; Heinsoo, K.; et al. Environmental Applications of Poplars and Willows. In Poplars and Willows: Trees for Society and the Environment; Isebrands, J.G., Richardson, J., Eds.; CABI: Wallingford, UK, 2014; pp. 258–336. ISBN 978-1-78064-108-9. [Google Scholar]
  2. Stanturf, J.A.; Oosten, C.V. Operational Poplar and Willow Culture. In Poplars and Willows: Trees for Society and the Environment; Isebrands, J.G., Richardson, J., Eds.; CABI: Wallingford, UK, 2014; pp. 200–257. ISBN 978-1-78064-108-9. [Google Scholar]
  3. Baum, C.; Leinweber, P.; Weih, M.; Lamersdorf, N.; Dimitriou, I. Effects of Short Rotation Coppice with Willows and Poplar on Soil Ecology. Agric. For. Res. 2009, 3, 183–196. [Google Scholar]
  4. Beuschel, R.; Piepho, H.-P.; Joergensen, R.G.; Wachendorf, C. Effects of Converting a Temperate Short-Rotation Coppice to a Silvo-Arable Alley Cropping Agroforestry System on Soil Quality Indicators. Agrofor. Syst. 2020, 94, 389–400. [Google Scholar] [CrossRef]
  5. Fang, S.; Xue, J.; Tang, L. Biomass Production and Carbon Sequestration Potential in Poplar Plantations with Different Management Patterns. J. Environ. Manag. 2007, 85, 672–679. [Google Scholar] [CrossRef] [PubMed]
  6. Oliveira, N.; Pérez-Cruzado, C.; Cañellas, I.; Rodríguez-Soalleiro, R.; Sixto, H. Poplar Short Rotation Coppice Plantations under Mediterranean Conditions: The Case of Spain. Forests 2020, 11, 1352. [Google Scholar] [CrossRef]
  7. Xi, B.; Clothier, B.; Coleman, M.; Duan, J.; Hu, W.; Li, D.; Di, N.; Liu, Y.; Fu, J.; Li, J.; et al. Irrigation Management in Poplar (Populus spp.) Plantations: A Review. For. Ecol. Manag. 2021, 494, 119330. [Google Scholar] [CrossRef]
  8. Dillen, S.Y.; Djomo, S.N.; Al Afas, N.; Vanbeveren, S.; Ceulemans, R. Biomass Yield and Energy Balance of a Short-Rotation Poplar Coppice with Multiple Clones on Degraded Land during 16 Years. Biomass Bioenergy 2013, 56, 157–165. [Google Scholar] [CrossRef]
  9. Karačić, A. Production and Ecological Aspects of Short Rotation Poplars in Sweden; Department of Short Rotation Forestry, Swedish Department of Agricultural Sciences: Uppsala, Sweden, 2005; ISBN 978-91-576-7012-0. [Google Scholar]
  10. Quinkenstein, A.; Jochheim, H.; Schneider, B.; Hüttl, R.F. Modellierung Des Kohlenstoffhaushalts von Pappel-Kurzumtriebsplantagen in Brandenburg. Anbau Nutz. Von Bäumen Auf Landwirtsch. Flächen 2009, 193–203. [Google Scholar] [CrossRef]
  11. Oliveira, N.; Rodríguez-Soalleiro, R.; Pérez-Cruzado, C.; Cañellas, I.; Sixto, H.; Ceulemans, R. Above-and below-Ground Carbon Accumulation and Biomass Allocation in Poplar Short Rotation Plantations under Mediterranean Conditions. For. Ecol. Manag. 2018, 428, 57–65. [Google Scholar] [CrossRef]
  12. Fiege, C.; Germer, S.; Schwarz, A.; Bischoff, W.-A.; Pecenka, R. Coarser Root Residues Are a Major Subsoil Carbon Sink after Re-Conversion of Poplar Short Rotation Coppice Plantation to Cropland. Biomass Bioenergy 2025, 200, 108029. [Google Scholar] [CrossRef]
  13. Heilman, P.E.; Ekuan, G.; Fogle, D. Above-and below-Ground Biomass and Fine Roots of 4-Year-Old Hybrids of Populus Trichocarpa × Populus Deltoides and Parental Species in Short-Rotation Culture. Can. J. For. Res. 1994, 24, 1186–1192. [Google Scholar] [CrossRef]
  14. King, J.S.; Pregitzer, K.S.; Zak, D.R. Clonal Variation in Above-and below-Ground Growth Responses of Populus Tremuloides Michaux: Influence of Soil Warming and Nutrient Availability. Plant Soil 1999, 217, 119–130. [Google Scholar] [CrossRef]
  15. Puri, S.; Singh, V.; Bhushan, B.; Singh, S. Biomass Production and Distribution of Roots in Three Stands of Populus Deltoides. For. Ecol. Manag. 1994, 65, 135–147. [Google Scholar] [CrossRef]
  16. Fuertes, A.; Oliveira, N.; Cañellas, I.; Sixto, H.; Rodríguez-Soalleiro, R. An Economic Overview of Populus spp. in Short Rotation Coppice Systems under Mediterranean Conditions: An Assessment Tool for Decision-Making. Renew. Sustain. Energy Rev. 2021, 151, 111577. [Google Scholar] [CrossRef]
  17. Bastin, J.-F.; Finegold, Y.; Garcia, C.; Mollicone, D.; Rezende, M.; Routh, D.; Zohner, C.M.; Crowther, T.W. The Global Tree Restoration Potential. Science 2019, 365, 76–79. [Google Scholar] [CrossRef] [PubMed]
  18. Dees, J.P.; Sagues, W.J.; Woods, E.; Goldstein, H.M.; Simon, A.; Sanchez, D.L. Leveraging the Bioeconomy for Carbon Drawdown. Green Chem. 2023, 25, 2930–2957. [Google Scholar] [CrossRef]
  19. Fortier, J.; Truax, B.; Gagnon, D.; Lambert, F. Plastic Allometry in Coarse Root Biomass of Mature Hybrid Poplar Plantations. BioEnergy Res. 2015, 8, 1691–1704. [Google Scholar] [CrossRef]
  20. Truax, B.; Fortier, J.; Gagnon, D.; Lambert, F. Planting Density and Site Effects on Stem Dimensions, Stand Productivity, Biomass Partitioning, Carbon Stocks and Soil Nutrient Supply in Hybrid Poplar Plantations. Forests 2018, 9, 293. [Google Scholar] [CrossRef]
  21. Fortier, J.; Truax, B.; Gagnon, D.; Lambert, F. Abiotic and Biotic Factors Controlling Fine Root Biomass, Carbon and Nutrients in Closed-Canopy Hybrid Poplar Stands on Post-Agricultural Land. Sci. Rep. 2019, 9, 6296. [Google Scholar] [CrossRef]
  22. Mccarthy, M.C.; Enquist, B.J. Consistency between an Allometric Approach and Optimal Partitioning Theory in Global Patterns of Plant Biomass Allocation. Funct. Ecol. 2007, 21, 713–720. [Google Scholar] [CrossRef]
  23. Fernando, A.L.; Duarte, M.P.; Almeida, J.; Boléo, S.; Mendes, B. Environmental Impact Assessment of Energy Crops Cultivation in Europe. Biofuels Bioprod. Biorefining 2010, 4, 594–604. [Google Scholar] [CrossRef]
  24. Don, A.; Osborne, B.; Hastings, A.; Skiba, U.; Carter, M.S.; Drewer, J.; Flessa, H.; Freibauer, A.; Hyvönen, N.; Jones, M.B.; et al. Land-use Change to Bioenergy Production in Europe: Implications for the Greenhouse Gas Balance and Soil Carbon. GCB Bioenergy 2012, 4, 372–391. [Google Scholar] [CrossRef]
  25. Kahle, P.; Hildebrand, E.; Baum, C.; Boelcke, B. Long-Term Effects of Short Rotation Forestry with Willows and Poplar on Soil Properties. Arch. Agron. Soil Sci. 2007, 53, 673–682. [Google Scholar] [CrossRef]
  26. Ministerium für Landwirtschaft, Umwelt und Klimaschutz des Landes Brandenburg. Steckbrief Brandenburger Böden; Öffentlichkeitsarbeit MLUK; Ministerium für Landwirtschaft, Umwelt und Klimaschutz des Landes Brandenburg: Potsdam, Germany, 2020. [Google Scholar]
  27. Verlinden, M.; Broeckx, L.; Zona, D.; Berhongaray, G.; De Groote, T.; Serrano, M.C.; Janssens, I.; Ceulemans, R. Net Ecosystem Production and Carbon Balance of an SRC Poplar Plantation during Its First Rotation. Biomass Bioenergy 2013, 56, 412–422. [Google Scholar] [CrossRef]
  28. Berhongaray, G.; Verlinden, M.; Broeckx, L.; Ceulemans, R. Changes in Belowground Biomass after Coppice in Two Populus Genotypes. For. Ecol. Manag. 2015, 337, 1–10. [Google Scholar] [CrossRef]
  29. Glynn, C.; Herms, D.A.; Egawa, M.; Hansen, R.; Mattson, W.J. Effects of Nutrient Availability on Biomass Allocation as Well as Constitutive and Rapid Induced Herbivore Resistance in Poplar. Oikos 2003, 101, 385–397. [Google Scholar] [CrossRef]
  30. Tripathi, A.M.; Klem, K.; Fischer, M.; Orság, M.; Trnka, M.; Marek, M.V. Water Availability Influences Accumulation and Allocation of Nutrients and Metals in Short-Rotation Poplar Plantation. Biomass Bioenergy 2018, 116, 151–160. [Google Scholar] [CrossRef]
  31. Fortier, J.; Truax, B.; Gagnon, D.; Lambert, F. Allometric Equations for Estimating Compartment Biomass and Stem Volume in Mature Hybrid Poplars: General or Site-Specific? Forests 2017, 8, 309. [Google Scholar] [CrossRef]
  32. Benomar, L.; DesRochers, A.; Larocque, G.R. The Effects of Spacing on Growth, Morphology and Biomass Production and Allocation in Two Hybrid Poplar Clones Growing in the Boreal Region of Canada. Trees 2012, 26, 939–949. [Google Scholar] [CrossRef]
  33. Berhongaray, G.; King, J.S.; Janssens, I.A.; Ceulemans, R. An Optimized Fine Root Sampling Methodology Balancing Accuracy and Time Investment. Plant Soil 2013, 366, 351–361. [Google Scholar] [CrossRef]
  34. Levillain, J.; Thongo M’Bou, A.; Deleporte, P.; Saint-André, L.; Jourdan, C. Is the Simple Auger Coring Method Reliable for Below-Ground Standing Biomass Estimation in Eucalyptus Forest Plantations? Ann. Bot. 2011, 108, 221–230. [Google Scholar] [CrossRef] [PubMed]
  35. Headlee, W.L.; Zalesny, R.S. Allometric Relationships for Aboveground Woody Biomass Differ Among Hybrid Poplar Genomic Groups and Clones in the North-Central USA. BioEnergy Res. 2019, 12, 966–976. [Google Scholar] [CrossRef]
  36. Oliveira, N.; Rodríguez-Soalleiro, R.; Pérez-Cruzado, C.; Cañellas, I.; Sixto, H. On the Genetic Affinity of Individual Tree Biomass Allometry in Poplar Short Rotation Coppice. BioEnergy Res. 2017, 10, 525–535. [Google Scholar] [CrossRef]
  37. Brahim, M.B.; Gavaland, A.; Cabanettes, A. Generalized Allometric Regression to Estimate Biomass of Populus in Short-Rotation Coppice. Scand. J. For. Res. 2000, 15, 171–176. [Google Scholar] [CrossRef]
  38. Wetterdienst, D. Klimadaten Deutschland. Messstation Potsdam 2025. [Google Scholar]
  39. Reder, S. UAV Orthomosaic of Experimental Plots Block 15 and 16 at ATB Potsdam 2025.
  40. Hauk, S.; Skibbe, K.; Röhle, H.; Schröder, J.; Wittkopf, S.; Knoke, T. Nondestructive Estimation of Biomass Yield for Short-Rotation Woody Crops Is Reliable and Shows High Yields for Commercial Stands in Bavaria. BioEnergy Res. 2015, 8, 1401–1413. [Google Scholar] [CrossRef]
  41. Oliveira, N.; Sixto, H.; Cañellas, I.; Rodríguez-Soalleiro, R.; Pérez-Cruzado, C. Productivity Model and Reference Diagram for Short Rotation Biomass Crops of Poplar Grown in Mediterranean Environments. Biomass Bioenergy 2015, 72, 309–320. [Google Scholar] [CrossRef]
  42. ISO 18134-2:2017; Solid Biofuels—Determination of Moisture Content—Oven Dry Method—Part 2: Total Moisture—Simplified Method. International Organization for Standardization: Geneva, Switzerland, 2017.
  43. Mann, H.B.; Whitney, D.R. On a Test of Whether One of Two Random Variables Is Stochastically Larger than the Other. Ann. Math. Stat. 1947, 18, 50–60. [Google Scholar] [CrossRef]
  44. Wilcoxon, F. Individual Comparisons by Ranking Methods. Biom. Bull. 1945, 1, 80–83. [Google Scholar] [CrossRef]
  45. Virtanen, P.; Gommers, R.; Oliphant, T.E.; Haberland, M.; Reddy, T.; Cournapeau, D.; Burovski, E.; Peterson, P.; Weckesser, W.; Bright, J.; et al. SciPy 1.0: Fundamental Algorithms for Scientific Computing in Python. Nat. Methods 2020, 17, 261–272. [Google Scholar] [CrossRef]
  46. Packard, G.C. The Logarithmic Transformation in Bivariate Allometry. Biol. J. Linn. Soc. 2023, 138, 341–350. [Google Scholar] [CrossRef]
  47. Ter-Mikaelian, M.T.; Korzukhin, M.D. Biomass Equations for Sixty-Five North American Tree Species. For. Ecol. Manag. 1997, 97, 1–24. [Google Scholar] [CrossRef]
  48. Stolarski, M.J.; Warmiński, K.; Krzyżaniak, M. Energy Value of Yield and Biomass Quality of Poplar Grown in Two Consecutive 4-Year Harvest Rotations in the North-East of Poland. Energies 2020, 13, 1495. [Google Scholar] [CrossRef]
  49. Lamerre, J.; Schwarz, K.-U.; Langhof, M.; von Wühlisch, G.; Greef, J.-M. Productivity of Poplar Short Rotation Coppice in an Alley-Cropping Agroforestry System. Agrofor. Syst. 2015, 89, 933–942. [Google Scholar] [CrossRef]
  50. Qiao, R.; Song, Z.; Chen, Y.; Xu, M.; Yang, Q.; Shen, X.; Yu, D.; Zhang, P.; Ding, C.; Guo, H. Planting Density Effect on Poplar Growth Traits and Soil Nutrient Availability, and Response of Microbial Community, Assembly and Function. BMC Plant Biol. 2024, 24, 1035. [Google Scholar] [CrossRef]
  51. Sixto Blanco, H.C.; Cañellas, I.; van Arendonk, J.; Ciria, P.; Camps, F.; Sánchez, M.; Sánchez-González, M. Growth Potential of Different Species and Genotypes for Biomass Production in Short Rotation in Mediterranean Environments. For. Ecol. Manag. 2015, 354, 291–299. [Google Scholar] [CrossRef]
  52. Fang, S.; Zhai, X.; Wan, J.; Tang, L. Clonal Variation in Growth, Chemistry and Calorific Value of New Poplar Hybrids at Nursery Stage. Biomass Bioenergy 2013, 54, 303–311. [Google Scholar] [CrossRef]
  53. Niemczyk, M.; Kaliszewski, A.; Jewiarz, M.; Wróbel, M.; Mudryk, K. Productivity and Biomass Characteristics of Selected Poplar (Populus spp.) Cultivars under the Climatic Conditions of Northern Poland. Biomass Bioenergy 2018, 111, 46–51. [Google Scholar] [CrossRef]
  54. Wu, R.; Ma, C.-X.; Lou, X.-Y.; Casella, G. Molecular Dissection of Allometry, Ontogeny, and Plasticity: A Genomic View of Developmental Biology. BioScience 2003, 53, 1041–1047. [Google Scholar] [CrossRef]
  55. Dillen, S.Y.; Marron, N.; Bastien, C.; Ricciotti, L.; Salani, F.; Sabatti, M.; Pinel, M.P.; Rae, A.M.; Taylor, G.; Ceulemans, R. Effects of Environment and Progeny on Biomass Estimations of Five Hybrid Poplar Families Grown at Three Contrasting Sites across Europe. For. Ecol. Manag. 2007, 252, 12–23. [Google Scholar] [CrossRef]
  56. Rae, A.M.; Street, N.R.; Robinson, K.M.; Harris, N.; Taylor, G. Five QTL Hotspots for Yield in Short Rotation Coppice Bioenergy Poplar: The Poplar Biomass Loci. BMC Plant Biol. 2009, 9, 23. [Google Scholar] [CrossRef]
  57. Dickmann, D.I.; Nguyen, P.V.; Pregitzer, K.S. Effects of Irrigation and Coppicing on Above-Ground Growth, Physiology, and Fine-Root Dynamics of Two Field-Grown Hybrid Poplar Clones. For. Ecol. Manag. 1996, 80, 163–174. [Google Scholar] [CrossRef]
  58. Weiner, J. Allocation, Plasticity and Allometry in Plants. Perspect. Plant Ecol. Evol. Syst. 2004, 6, 207–215. [Google Scholar] [CrossRef]
  59. Johansson, T.; Hjelm, B. Stump and Root Biomass of Poplar Stands. Forests 2012, 3, 166–178. [Google Scholar] [CrossRef]
  60. Krabel, D.; Meyer, M.; Solger, A.; Müller, R.; Carvalho, P.; Foulkes, J. Early Root and Aboveground Biomass Development of Hybrid Poplars (Populus spp.) under Drought Conditions. Can. J. For. Res. 2015, 45, 1289–1298. [Google Scholar] [CrossRef]
  61. Luo, J.; Zhou, J.-J. Growth Performance, Photosynthesis, and Root Characteristics Are Associated with Nitrogen Use Efficiency in Six Poplar Species. Environ. Exp. Bot. 2019, 164, 40–51. [Google Scholar] [CrossRef]
  62. Al Afas, N.; Marron, N.; Zavalloni, C.; Ceulemans, R. Growth and Production of a Short-Rotation Coppice Culture of Poplar—IV: Fine Root Characteristics of Five Poplar Clones. Biomass Bioenergy 2008, 32, 494–502. [Google Scholar] [CrossRef]
  63. Douglas, G.B.; McIvor, I.R.; Potter, J.F.; Foote, L.G. Root Distribution of Poplar at Varying Densities on Pastoral Hill Country. Plant Soil 2010, 333, 147–161. [Google Scholar] [CrossRef]
  64. Wullschleger, S.D.; Yin, T.; DiFazio, S.; Tschaplinski, T.; Gunter, L.; Davis, M.; Tuskan, G. Phenotypic Variation in Growth and Biomass Distribution for Two Advanced-Generation Pedigrees of Hybrid Poplar. Can. J. For. Res. 2005, 35, 1779–1789. [Google Scholar] [CrossRef]
  65. Berhongaray, G.; Janssens, I.; King, J.; Ceulemans, R. Fine Root Biomass and Turnover of Two Fast-Growing Poplar Genotypes in a Short-Rotation Coppice Culture. Plant Soil 2013, 373, 269–283. [Google Scholar] [CrossRef]
  66. Fantozzi, D.; Montagnoli, A.; Trupiano, D.; Di Martino, P.; Scippa, G.S.; Agosto, G.; Chiatante, D.; Sferra, G. A Systematic Review of Studies on Fine and Coarse Root Traits Measurement: Towards the Enhancement of Urban Forests Monitoring and Management. Front. For. Glob. Change 2024, 7, 1322087. [Google Scholar] [CrossRef]
  67. Freschet, G.T.; Roumet, C.; Comas, L.H.; Weemstra, M.; Bengough, A.G.; Rewald, B.; Bardgett, R.D.; De Deyn, G.B.; Johnson, D.; Klimešová, J. Root Traits as Drivers of Plant and Ecosystem Functioning: Current Understanding, Pitfalls and Future Research Needs. New Phytol. 2021, 232, 1123–1158. [Google Scholar] [CrossRef]
  68. Babi, K.; Guittonny, M.; Bussière, B.; Larocque, G.R. Influence of Competition on Root Architecture and Root Anchorage of Young Hybrid Poplar Plantations on Waste Rock Slopes. Écoscience 2023, 30, 97–112. [Google Scholar] [CrossRef]
  69. Di Matteo, G.; Nardi, P.; Verani, S.; Sperandio, G. Physiological Adaptability of Poplar Clones Selected for Bioenergy Purposes under Non-Irrigated and Suboptimal Site Conditions: A Case Study in Central Italy. Biomass Bioenergy 2015, 81, 183–189. [Google Scholar] [CrossRef]
  70. Stanton, B.J.; Bourque, A.; Coleman, M.; Eisenbies, M.; Emerson, R.M.; Espinoza, J.; Gantz, C.; Himes, A.; Rodstrom, A.; Shuren, R.; et al. The Practice and Economics of Hybrid Poplar Biomass Production for Biofuels and Bioproducts in the Pacific Northwest. BioEnergy Res. 2021, 14, 543–560. [Google Scholar] [CrossRef]
  71. Pecenka, R.; Hoffmann, T. Harvest Technology for Short Rotation Coppices and Costs of Harvest, Transport and Storage. Agron. Res. 2015, 13, 361–371. [Google Scholar]
  72. Pecenka, R.; Schweier, J.; Lenz, H. Was Kostet Die Ernte von KUP? Praxiserprobte Erntetechnologien Im Vergleich. In Proceedings of the 20th Conference ‘Energetische Nutzung Nachwachsender Rohstoffe’, Dresden, Germany, 4–5 September 2014. [Google Scholar]
  73. Svystun, T.; Böhlenius, H. Biomass Production of the Poplar Clone OP42 During the Second Rotation Plantation–The Effects of Four Thinning Treatments. BioEnergy Res. 2024, 17, 1425–1435. [Google Scholar] [CrossRef]
  74. Zabek, L.; Prescott, C. Biomass Equations and Carbon Content of Aboveground Leafless Biomass of Hybrid Poplar in Coastal British Columbia. For. Ecol. Manag. 2006, 223, 291–302. [Google Scholar] [CrossRef]
  75. Chave, J.; Andalo, C.; Brown, S.; Cairns, M.A.; Chambers, J.Q.; Eamus, D.; Fölster, H.; Fromard, F.; Higuchi, N.; Kira, T. Tree Allometry and Improved Estimation of Carbon Stocks and Balance in Tropical Forests. Oecologia 2005, 145, 87–99. [Google Scholar] [CrossRef] [PubMed]
  76. Peichl, M.; Arain, M.A. Allometry and Partitioning of Above-and Belowground Tree Biomass in an Age-Sequence of White Pine Forests. For. Ecol. Manag. 2007, 253, 68–80. [Google Scholar] [CrossRef]
  77. Cairns, M.A.; Brown, S.; Helmer, E.H.; Baumgardner, G.A. Root Biomass Allocation in the World’s Upland Forests. Oecologia 1997, 111, 1–11. [Google Scholar] [CrossRef]
  78. Dassot, M.; Constant, T.; Fournier, M. The Use of Terrestrial LiDAR Technology in Forest Science: Application Fields, Benefits and Challenges. Ann. For. Sci. 2011, 68, 959–974. [Google Scholar] [CrossRef]
  79. Calders, K.; Newnham, G.; Burt, A.; Murphy, S.; Raumonen, P.; Herold, M.; Culvenor, D.; Avitabile, V.; Disney, M.; Armston, J. Nondestructive Estimates of Above-ground Biomass Using Terrestrial Laser Scanning. Methods Ecol. Evol. 2015, 6, 198–208. [Google Scholar] [CrossRef]
  80. Wilkes, P.; Lau, A.; Disney, M.; Calders, K.; Burt, A.; de Tanago, J.G.; Bartholomeus, H.; Brede, B.; Herold, M. Data Acquisition Considerations for Terrestrial Laser Scanning of Forest Plots. Remote Sens. Environ. 2017, 196, 140–153. [Google Scholar] [CrossRef]
  81. Fu, L.Y.; Zeng, W.S.; Tang, S.Z.; Sharma, R.P.; Li, H.K. Using Linear Mixed Model and Dummy Variable Model Approaches to Construct Compatible Single-Tree Biomass Equations at Different Scales—A Case Study for Masson Pine in Southern China. J. Forensic Sci. 2012, 58, 101–115. [Google Scholar] [CrossRef]
  82. Wang, M.; Borders, B.E.; Zhao, D. An Empirical Comparison of Two Subject-Specific Approaches to Dominant Heights Modeling: The Dummy Variable Method and the Mixed Model Method. For. Ecol. Manag. 2008, 255, 2659–2669. [Google Scholar] [CrossRef]
Figure 1. Adjacent experimental plots in Potsdam, Germany (UAV orthomosaic from [39]) with no buffer zones between plots MxHD1 and MxHD2. See Table 1 for detailed information.
Forests 17 00395 g001
Figure 2. Determination of sampling area for foot root biomass measurement; a: inter-row distance, b: intra-row distance.
Forests 17 00395 g002
Figure 3. Boxplots showing management effects on biomass in different compartments, measured in 2024, separated by biomass compartment, variety (Ma, Sk), Rotation stage (1, 2) and planting density (LD, HD).
Forests 17 00395 g003
Figure 4. Boxplots showing management effects on biomass in different compartments, measured in 2025, separated by biomass compartment, variety (Ma, Sk), Rotation stage (1, 2), and planting density (LD, HD).
Forests 17 00395 g004
Figure 5. Relationship between diameter at breast height (DBH) and biomass (aboveground and belowground) (Mg ha−1); data collected in 2024 and 2025, divided by management system.
Forests 17 00395 g005
Figure 6. Comparison of allometric model prediction (blue line) and measured values (green) for aboveground biomass: (a) general model including all data, (b) planting-density-specific model for LD (2083 trees ha−1); and belowground biomass: (c) general model including all data, (d) planting-density-specific model for HD (8333 trees ha−1)—in dependence of DBH. All other allometry plots (aboveground biomass: Ma variety, Sk variety, Mx variety, HD, rotation stage 1, rotation stage 2; belowground biomass: Ma variety, Sk variety, Mx variety, LD, rotation stage 1, rotation stage 2) can be found in the Appendix A.
Forests 17 00395 g006
Table 1. Experimental plots investigated in this study.
PlotCultivarPlantedHarvestRotation 1Area (ha) Inter-Row Spacing (m)Intra-Row Spacing (m)Planting Density (Trees/ha)Management Code
1Matrix 492018partly, 202310.254.81.02083 (f. 4166)MaLD1
2Skado2018partly, 202310.254.81.02083 (f. 4166)SkLD1
3Max 32018none10.252.40.58333MxHD1
4Max 32018fully, 202320.332.40.58333MxHD2
1 Rotation results from harvest cycle. Plots 1, 2, and 3 remain within their first rotation, while plot 4 was harvested in 2023 and is within its second rotation. Root age is the same in all plots and was 6 years in 2024 and 7 years in 2025.
Table 2. Mean values for biomass C content (%) in shoot and root biomass.
PlotShoot Biomass C (%)Root Biomass C (%)
2024 2025 2024 2025
MaLD148.88±0.0949.30±0.6747.10±0.8745.28±0.67
SkLD149.06±0.4748.88±0.1546.87±1.5845.61±0.15
MxHD148.46±0.2048.73±0.2048.22±0.5145.84±0.20
MxHD248.68±0.2648.72±0.1049.72±3.8646.58±0.10
Table 3. Mean biomass (Mg ha−1, dry matter) and standard deviation, by tree compartments and plots. Standard deviation values for total belowground biomass and root:shoot ratio are not displayed, due to the varying sampling methods for coarse and fine root biomass (see Section 2.3.1 and Section 2.3.2). Note the different sample sizes for aboveground and belowground biomass.
CompartmentnMaLD1SkLD1MxHD1MxHD2
2024
crown1016.31±2.6418.49±4.9023.18±3.14
stem1023.87±4.0423.55±4.4732.15±4.688.23±2.26
total aboveground1040.18±5.5942.04±5.9355.32±6.738.23±2.26
coarse roots48.51±1.0710.22±0.849.11±2.055.35±2.37
fine roots44.09±1.884.07±0.483.56±1.492.97±1.27
total belowground412.59 14.29 12.67 8.32
total aboveground for trees w. coarse root measurements437.83±6.6737.97±5.3650.59 ±7.017.80±3.00
root:shoot40.34 0.38 0.25 1.11
2025
crown1517.81 ±11.89 23.96 ±17.61 32.12 ±24.62
stem1535.01 ±17.62 38.45 ±21.66 62.79 ±49.52 27.96 ±16.68
total aboveground1552.81 ±29.44 62.41 ±39.08 94.91 ±73.65 27.96 ±16.68
coarse roots49.17±6.575.27±1.8914.82±13.8510.17±7.07
fine roots43.90±1.803.86±0.463.53±1.482.57±1.09
total belowground413.07 9.13 18.35 12.74
total aboveground for trees w. coarse root measurements451.66±31.1720.53±12.4989.94±82.94 29.46±21.79
Root:shoot40.26 0.54 0.28 0.49
Table 4. p-values of pairwise comparisons with non-parametric Mann-Whitney U test, by factor and biomass compartment, for the year 2024. The p-values were adjusted using the Holm-Šídák method to account for multiple testing.
CompartmentVarietyRotation StagePlanting Density
Crown0.922n.s. <0.01**
Stem>0.999n.s.<0.001***<0.002**
Coarse0.922n.s.0.980n.s.>0.999n.s.
Fine>0.999n.s.>0.999n.s.0.998n.s.
Root:shoot0.922n.s.0.756n.s.0.096.
Significance codes: *** p ≤ 0.001, ** p ≤ 0.01, ns (not significant) for p > 0.1.
Table 5. p-values of pairwise comparisons with non-parametric Mann-Whitney U test, by factor and biomass compartment, for the year 2025. The p-values were adjusted using the Holm-Šídák method to account for multiple testing.
CompartmentVarietyRotation StagePlanting Density
Crown0.998n.s. 0.963n.s.
Stem>0.999n.s.0.916n.s.0.963n.s.
Coarse0.999n.s.> 0.999n.s.>0.999n.s.
Fine>0.999n.s.0.999n.s.0.998n.s.
Root:shoot0.756n.s.0.922n.s.0.998n.s.
Significance codes: ns (not significant) for p > 0.1.
Table 6. Parameter estimates and goodness of fit statistics for the allometric relationships of aboveground and belowground biomass. a denotes the allometric coefficient (intercept of the log-transformed regression), while b represents the allometric exponent (slope); see Section 2.6 for details on model structure and parameter estimation.
Model Level EstimateStd. ErrorRMSER2DF
Aboveground Biomass
general a 0.99
b 1.70
0.26
0.12
32.450.6798
varietyMaa 2.81
b 1.16
1.06
0.45
21.900.2223
Ska 0.18
b 2.32
0.21
0.09
5.280.9723
Mxa 0.35
b 2.37
0.29
0.15
26.120.8348
Planting densityLDa 0.52
b 1.88
0.51
0.21
17.810.7448
HDa 0.35
b 2.37
0.29
0.15
26.120.8348
Rotation stage1a 2.75
b 1.28
0.43
0.19
36.820.3973
2a 0.65
b 1.83
0.24
0.13
9.780.8923
Belowground Biomass
general a 1.87
b 0.88
0.31
0.15
4.520.5529
varietyMaa 0.39
b 1.47
0.78
0.33
1.480.776
Ska 0.91
b 1.15
0.56
0.26
1.340.776
Mxa 0.90
b 1.38
0.33
0.17
2.580.8313
Planting densityLDa 0.89
b 1.38
0.44
0.19
1.670.7114
HDa 0.90
b 1.38
0.33
0.17
2.580.8313
Rotation stage1a 1.31
b 1.09
0.45
0.21
4.600.5622
2a 1.31
b 1.20
0.52
0.31
2.30.765
Disclaimer/Publisher’s Note: The statements, opinions and data contained in all publications are solely those of the individual author(s) and contributor(s) and not of MDPI and/or the editor(s). MDPI and/or the editor(s) disclaim responsibility for any injury to people or property resulting from any ideas, methods, instructions or products referred to in the content.