Article

Viscoelastic Behaviour of a Sixteenth-Century Panel Painting: Experimental Analysis and Bilayer Modelling


1
DAGRI, University of Florence, 50145 Florence, Italy
2
CNRS, Institut Pascal, Université Clermont Auvergne, 63000 Clermont-Ferrand, France
3
INRAE, PIAF, Université Clermont Auvergne, 63000 Clermont-Ferrand, France
4
Opificio delle Pietre Dure, 50121 Florence, Italy
*
Author to whom correspondence should be addressed.
These authors contributed equally to this work.
Forests 2026, 17(2), 238; https://doi.org/10.3390/f17020238
Submission received: 30 December 2025 / Revised: 23 January 2026 / Accepted: 30 January 2026 / Published: 10 February 2026
(This article belongs to the Section Wood Science and Forest Products)

Abstract

This research focuses on the analysis of the viscoelastic (VE) behaviour of panel paintings (PPs), which are artworks made of various materials. Each PP is different from others because of their unique assembly, the changes due to the passage of time and human interventions. Thus, a thorough understanding of the hygro-mechanical behaviour of PPs is needed for their conservation. This study analyses the VE behaviour of an original PP from the 16th century, taking it both as a global structure and as a bilayer system. The PP was tested under constant climatic conditions and subjected to a constant load for at least 3 days, followed by a recovery period. The experimental results show that the PP exhibited VE behaviour and that the deformation was recoverable. The PP was loaded at two stress levels, and the results were consistent with the linear VE behaviour expected for moderately loaded wood. The bilayer approach allowed us to separate the contributions of wood and the paint layer, assuming that the latter behaved elastically.

1. Introduction

Viscoelasticity in wood is a well-known mechanical phenomenon characterised by time-dependent deformation under applied stress or time-dependent stress under imposed deformation [1,2]. Although deformation is triggered by varying climatic conditions, it also occurs when temperature and relative humidity (RH) remain constant: even when a load remains constant and the climate is kept stable over time, wood will continue deforming due to its viscoelastic (VE) properties. Extensive research has documented this behaviour in wood both in the longitudinal [3,4] and transverse directions [5,6], as well as at the level of the wooden cell wall [7]. However, the influence of viscoelasticity on the hygro-mechanical behaviour of panel paintings (PPs) remains underexplored.
Panel paintings are multilayered structural objects [8] made of different materials (wood, gypsum, canvas, glue and pigments) assembled following various construction techniques and resulting in different structural typologies. They are sometimes modified by remedial conservation interventions. All the structural components of such systems may interact and change over time because they are sensitive to environmental thermo-hygrometric variations. This results in non-linear hygro-mechanical behaviours [9,10] where a simple transfer of wood properties and behaviour to the structure as a whole does not represent the actual range of response. Over the last 20 years, researchers have attempted to model the hygro-mechanical behaviour of complex artworks using different approaches. According to [8], mechanical variables such as elastic moduli, shear moduli and Poisson’s ratios should be considered when modelling the elastic behaviour of wood in PPs. However, the model of [8] did not incorporate VE parameters. Similarly, Dureisseix et al. [11] applied a partitioning strategy to model painted panels, focusing on the elastic properties of wood and excluding VE effects. Furthermore, Riparbelli et al. [9,10] relied solely on elastic properties when interpreting the mechanical phenomena in original PPs, reaching a good fit between the experimental data and numerical results. Conversely, Froidevaux [12] based the mechanical model on a generalised viscoelastic Maxwell model. VE tests were conducted on recent, small, clear-wood spruce by applying a 25% tensile load for 2 days and measuring the VE deformation and the resulting recovery for 12 h after the load was removed.
The above-mentioned studies highlight the uncertainties in assessing the importance of viscoelasticity in modelling the hygro-mechanical behaviour of PPs, partly because no original artworks have been subjected to direct VE testing. Current models are often based on data from recent wood, which may not accurately represent the properties of aged wood in historic works of art, nor the effects of other structural components on these properties.
General mechanical models derived from modern multilayer wood composites (e.g., glulam or plywood) are often inadequate for historical PPs. The interaction between the aged wooden support and the stiff, brittle gesso and paint layers—frequently characterised by a stabilised crack pattern—creates a unique mechanical system. Therefore, applying standard multilayer theories without experimental validation on historical objects risks oversimplifying the actual mechanical response. Previous studies have highlighted that mock-ups and new wood and new paint layer samples do not accurately represent the complex mechanical behaviour of historical PPs, particularly regarding the strong interaction between the various components in a highly non-linear evolving system. Thus, we must consider that small variations in the properties and boundary conditions of a painting or some of its components lead to marked changes in its deformation tendencies [10]. Recreating a complex system is impossible because it would mean reproducing the work in exactly the same way (both in terms of identical materials and production techniques), subjecting it to the same cycles of humidity and ageing (centuries of unknown climate conditions), and then exposing the object to the same anthropogenic and fortuitous events it has undergone over centuries. Even a small discrepancy can generate large differences between the behaviour of the copy and the original; thus, the only analytical way of understanding a work of art is to measure its behaviour to obtain representative data.
In the previously mentioned study [13], the authors carried out a broader experimental campaign aimed at the non-invasive hygro-mechanical characterisation of six original 16th-century PPs. The authors adopted a ‘learning from objects’ approach to overcome the limitations of literature-based values and mock-ups, which often fail to capture the complex phenomena of historical panel paintings, both at the level of the whole art piece and at the material interaction level. The hygro-mechanical properties of each panel were identified through hygroscopic tests performed in a climatic chamber and an inverse identification process based on the FEM and Sobol sensitivity analysis. The specific mechanical properties of each panel were identified [10]. The VE effects could not be observed directly because they were intertwined with other phenomena affecting the hygro-mechanical response [10,11]. As previously mentioned, a finite element method (FEM) model that does not consider VE phenomena was developed. Nonetheless, the results were excellent, with R2 values consistently above 0.89.
This outcome could be partly explained by the testing conditions, with no external loading applied to the panel. Thus, the stress occurrence was due only to the internal interaction between the panel components, resulting from the moisture gradient and heterogeneous properties.
This research represents the direct continuation of that experimental campaign focused on the observation and measurement of VE effects in one of those six original panel paintings. PPs commonly experience boundary conditions that include an external loading, such as that imposed by a framing system. Under such conditions, the VE component of the mechanical response may become significant. Therefore, we conducted an experimental characterisation of the VE behaviour to assess the weight of the VE response in the hygro-mechanical behaviour of the PPs. A creep recovery test was performed on an original work of art under constant climatic conditions. In this test, a constant load was applied and then removed. The resulting deformation was monitored over time in a climatic chamber. The loading was performed under safe conditions in agreement with the conservators and restorers.

2. Materials and Methods

2.1. The Panel Painting

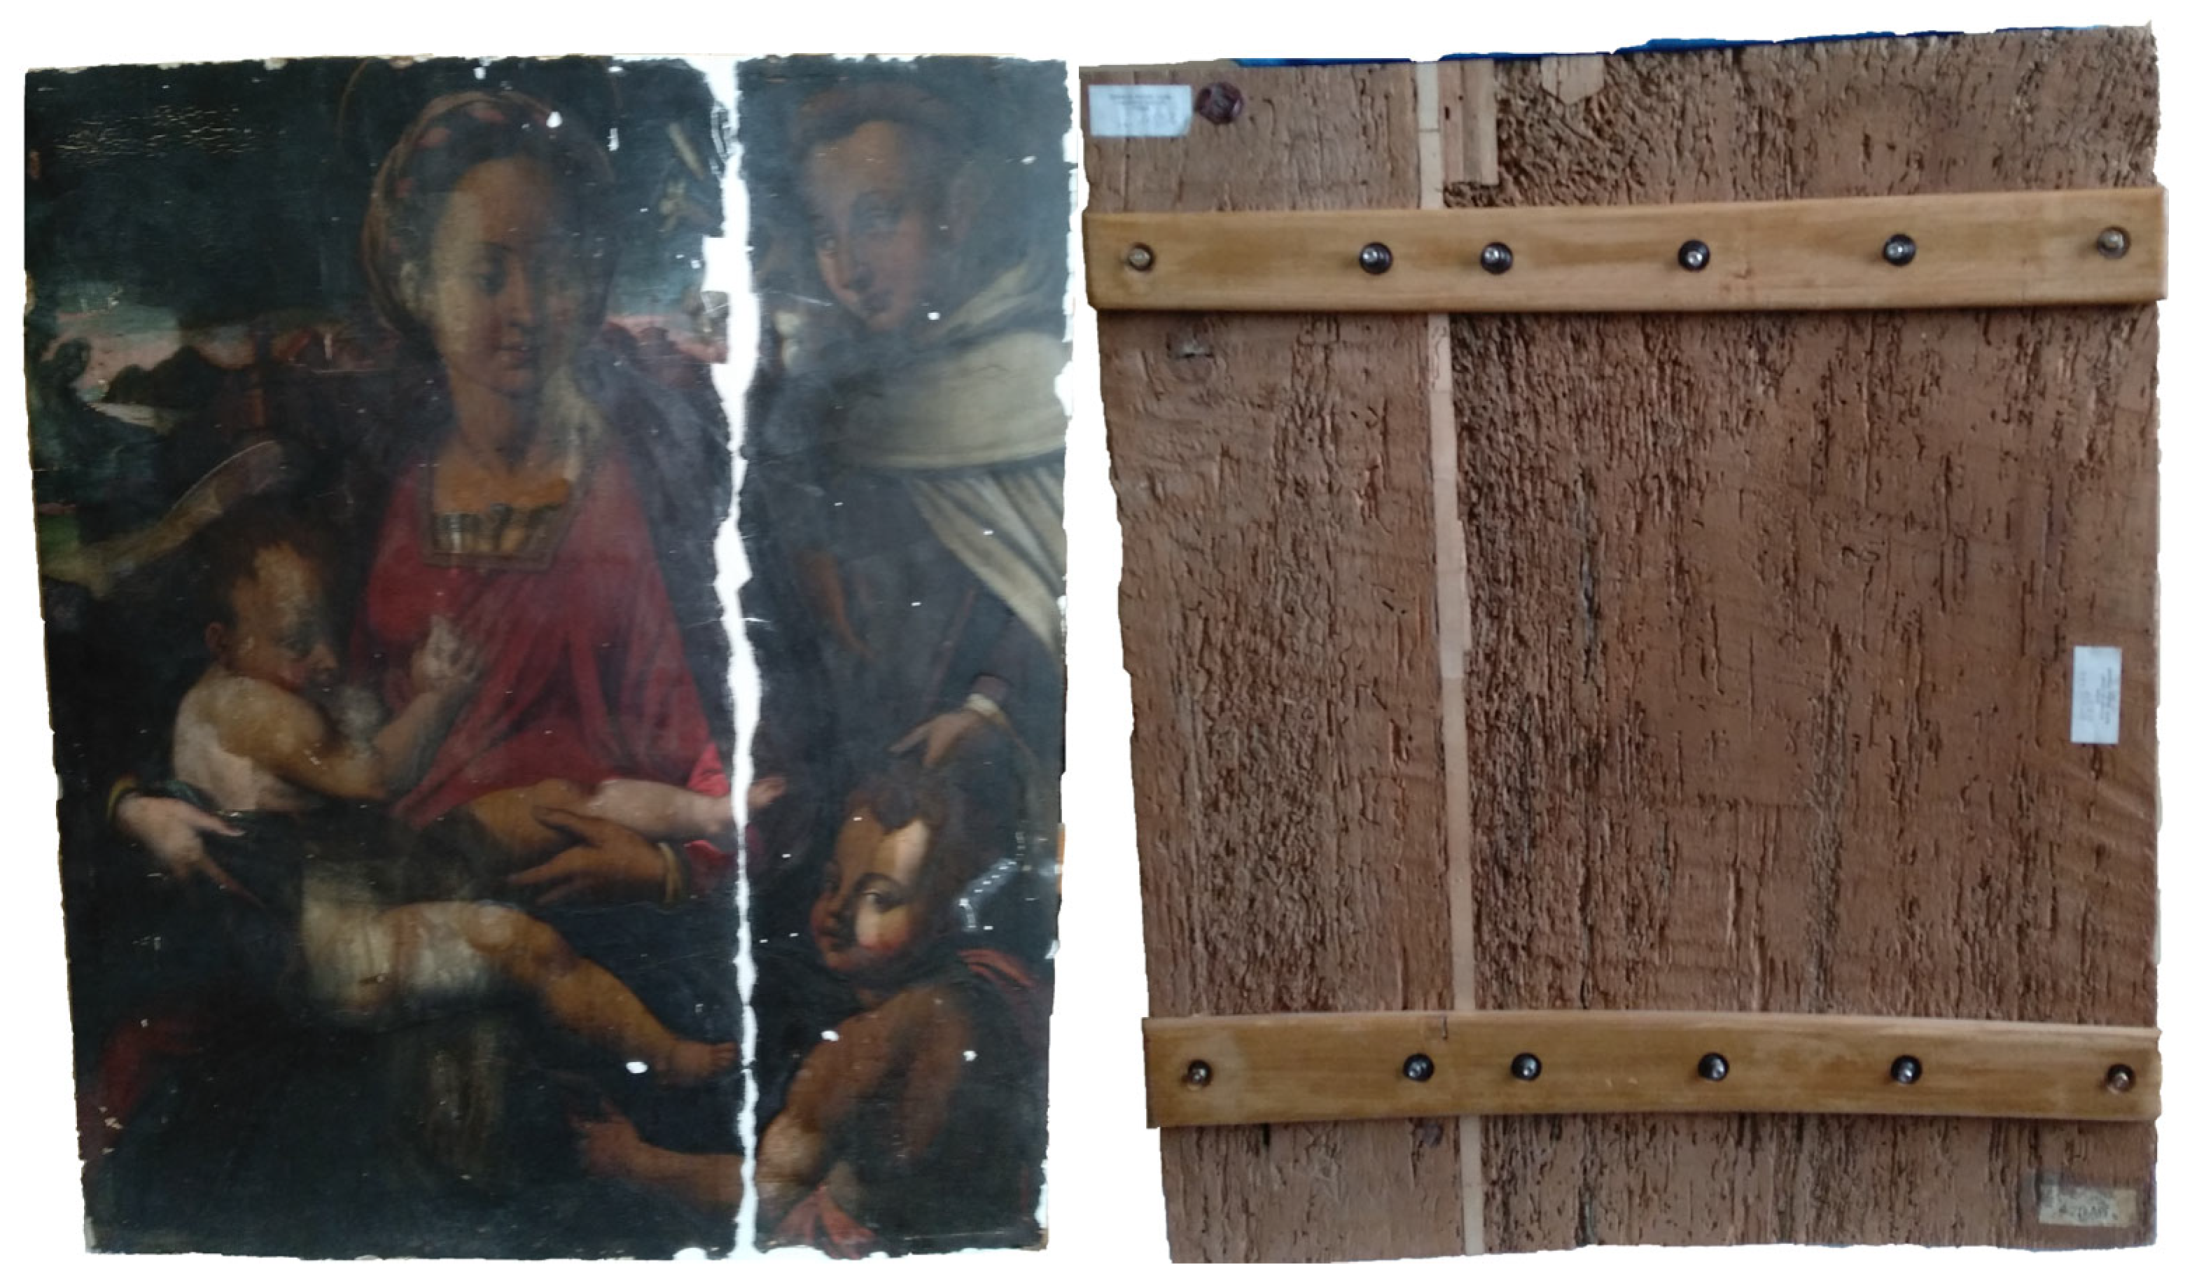
The tests were conducted on one original PP from the 16th century, labelled WPP4 (Figure 1). The artwork is attributed to an anonymous artist, possibly from the Florentine School (Italy) and is titled Madonna with Child, Saint John, and a Monk. The wooden panel support is made of two tangential boards of poplar wood (645 × 775 × 23 mm3) and thick ground layer and oil paint. The wooden support had been previously restored, the joint between the two boards was reconstructed using wooden wedges, and the lost original crossbeams were substituted with two new ones equipped with springs. On the other hand, the painted surface shows extensive areas of paint loss and is under restoration. This artwork was chosen among the six characterised in [13] because it represents a complex case with a particular structural significance as a result of the high rigidity of the paint layers. The inverse optimisation results revealed that WPP4 possesses a paint layer with an elastic modulus (Ep)—here defined as an average elastic modulus for an arbitrary small thickness —of 10.5 GPa, significantly higher than that of the other panels in the cohort (e.g., WPP1 ≈ 1.5 GPa, WPP6 ≈ 0.5 GPa). This arbitrary thickness was set to 0.5 mm following both the direct observation and a range of values measured by [14].
Therefore, WPP4 was selected for the present investigation because it represents a ‘worst-case scenario’ in terms of mechanical interaction. The high rigidity of its ground layers exerts the maximum constraint on the wooden support, making WPP4 the ideal candidate to test the robustness of the bilayer model and analyse VE behaviour under critical conditions. The parameters adopted for the bilayer modelling, particularly the paint layer rigidity (defined as the product of elastic modulus and paint layer thickness), are experimentally derived values specific to this object. The hygro-mechanical characterisation performed in [13], which is akin to an ID of the artwork, highlighted that when WPP4 was subjected to varying RH, it showed a non-flying-wood behaviour. This occurred when the PP was free to exchange moisture through the paint layers and when they were completely waterproofed by aluminium foil [13]. The adoption of both configurations is required to achieve a complete hygro-mechanical characterisation of the system. This behaviour is a consequence of the non-linear combination of (a) the permeability of the paint layers, (b) the rigidity of the paint layers and (c) the anatomical characteristics of the object.

2.2. The Climatic Conditions

The tests were conducted under constant climatic conditions, using a climatic box made of chipboard and thermal insulation panels sized 1 × 0.8 × 0.6 m3. The RH was kept at 58 ± 0.5%, and T was maintained at 25 ± 0.2 °C using a humidity controller and a heater connected to a thermostat. The RH spikes caused by the humidification process were filtered by salts equilibrated to the set value, through which the incoming vapour passed before being distributed throughout the box. The climatic data were recorded using a data logger (Hobo U12-006 by Onset, Bourne, MA, USA) at the same rate as the deformation data.

2.3. The Tests and Load Conditions

The stress level was calculated as a percentage of the estimated bending strength. For such a calculation, the PP was considered a single board of new poplar wood and the following simplifications were assumed: (a) the Euler–Bernoulli beam theory was used for the pure-bending calculation; (b) the calculation was performed using the mechanical properties in [5]; (c) the panel painting was considered an isotropic homogeneous beam made of wood. The span was set by the test geometry (Section 2.4). Two tests were performed on WPP4: WPP4-L was performed at a moderate stress level of 6% of the estimated bending strength (a load of 83.4 N, corresponding to a calculated maximum stress of 0.26 MPa); WPP4-H was conducted at a higher stress level of 10% (a load of 142.2 N, corresponding to a calculated maximum stress of 0.45 MPa). A stress level of 20% is commonly considered for wood the threshold between viscoelastic behaviour and viscoplastic behaviour under compression [3], particularly when applied perpendicular to the grain [5,15]. The applied forces are well below this threshold, so that no viscoplastic behaviour is expected. According to [10], the paint layer rigidity was 10.5 GPa associated with a thickness of 0.5 mm in a 23 mm thick panel. Each test consisted of a loading phase followed by a recovery phase. The duration of the load was 72 h for test H and 165 h for test L, based on the time required to reach equilibrium. Equilibrium was defined as the point at which the measurement increased by an amount equivalent to the resolution of the measuring system over 24 h. The increasing deformation of the PP was continuously monitored to assess any possible deviation from the VE properties and to prevent any possible damage (Figure 2). The load magnitudes were deliberately kept low to ensure the safety of the artwork, prioritising conservation requirements over the signal-to-noise ratio. Therefore, the measurements were performed near the resolution limits of the equipment, accepting a higher degree of experimental noise to prevent any damage to the original historic material.

2.4. The Geometry of the Tests and the Measuring System

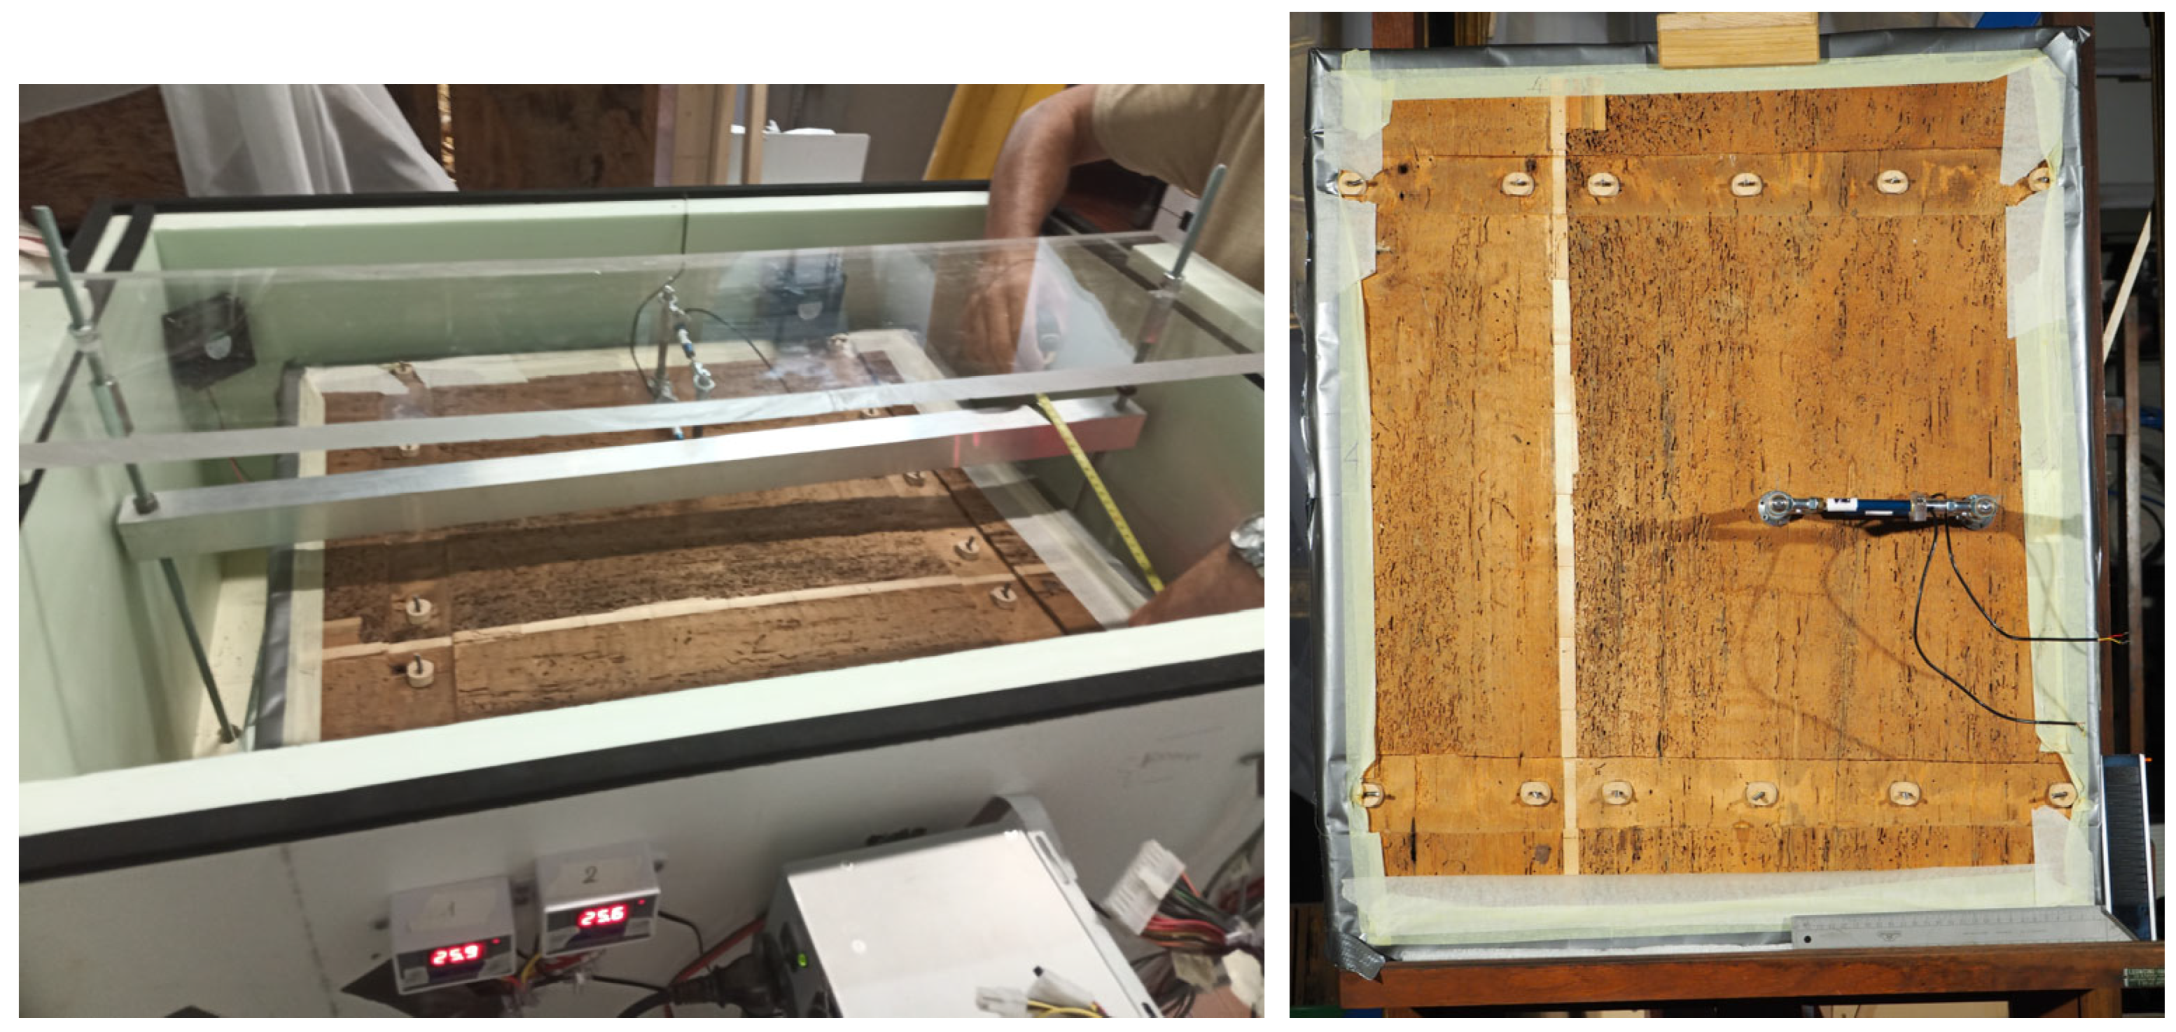
The PP was placed horizontally inside the climatised box on four steel supports shaped as semi-spheres to perfectly mimic a frictionless pinned joint. The artwork leant on the supports with its painted face down. This position was chosen so the load was applied on its back and the deformation induced by the test produced an elongation strain of the front face and a consequent stretching of the painted layers, instead of a compression, to avoid a dangerous contraction. A PET foil was inserted as a protection between the paint layers and the stainless-steel supports. The load was applied to the back of the PP at two specific loading points. The contact point was a semi-cylinder aluminium piece that distributed the load along a 20 mm long line. A hollow square aluminium bar connected the two loading points, which were at a distance of 380 mm. The loads were hung up at each end of the aluminium loading bar through a rigid threaded bar with a diameter of 20 mm. The threaded bars carrying the loads were screwed onto the loading bar and passed through the bottom of the climatised box, so the loads were hung on the outside. The holes on the climatised box were slightly larger than the diameter of the threaded bars, so no friction occurred. The components used to apply the load had a total mass of 1.5 kg, which was included in the overall load calculated in Section 2.3. When PP was not subjected to loading, the loading bar and the suspended weights were supported by the lid of the climatised box, so that the entire load was transferred to the box rather than to the panel painting. Figure 3 illustrates the setup.
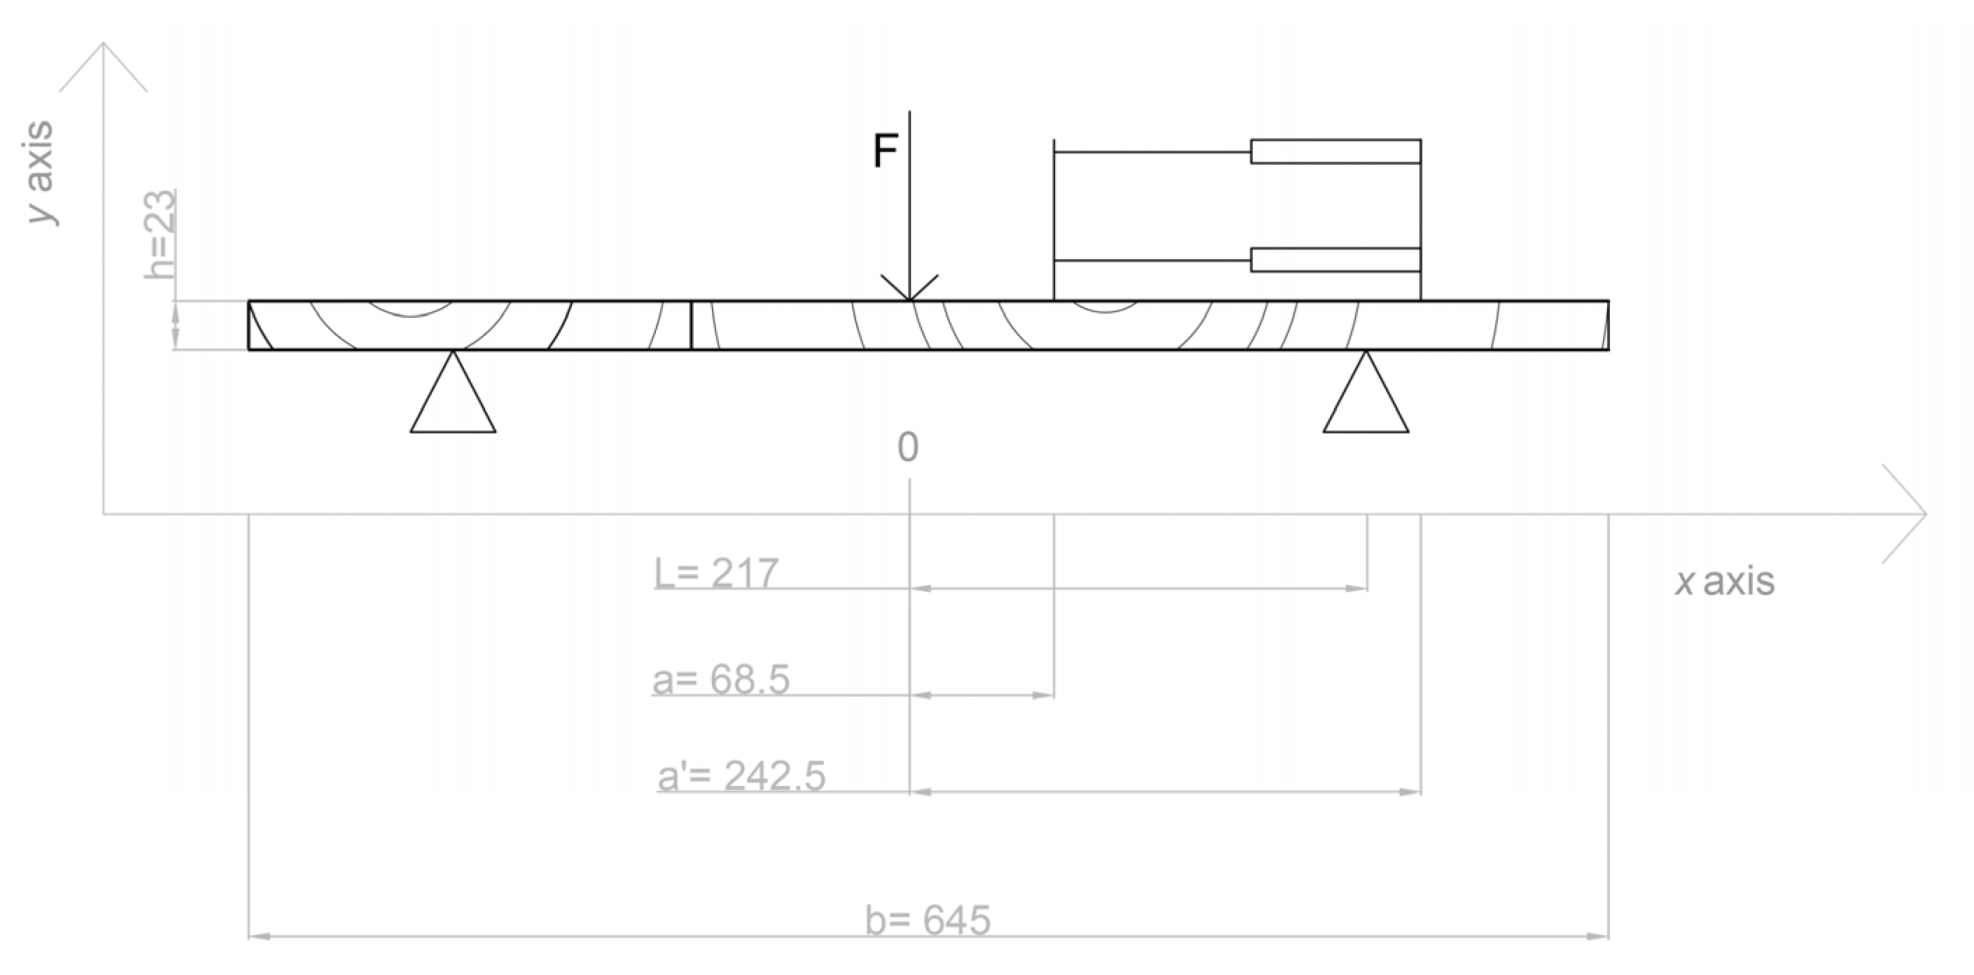
The PP was equipped with a deformometric kit (DK) [16] to measure the deformation, and the data were collected using a data logger (Hobo U12-006 by Onset). The data were recorded at different rates depending on the timing of the test: every 1 s for the first 10 min after loading or unloading, every 30 s for the next 30 min and every 600 s for the rest of the test. Figure 4 displays the geometry of the test.

2.5. Modelling the Time-Dependent Behaviour of the Panel Painting

2.5.1. Effective Panel Rigidity and Time-Dependent Compliance

According to the Euler–Bernoulli bending theory, which explains small displacements and small rotations, the deflection y along the direction x verifies the following equations:
d 2 y d x 2 = F 2 E I ( L x ) f o r x < L , d 2 y d x 2 = 0   f o r   x L
where F is the applied load, L represents the half span and I = b h 3 / 12 the second moment of inertia of a section of the panel orthogonal to direction x, with h being the panel thickness and b its width. In Equation (1), the origin of the x axis is taken at the middle of the panel, and it is assumed that the elastic modulus E of the panel, in the direction x measured by the DK, is homogeneous in the cross-section. As shown in Figure 1, the left arm of the DK, fixed on the back of the panel, is placed within the lateral supports at position a < L , and the right arm outside the range, at position a > L . The integration of Equation (1) gives the following:
d y d x = F 2 E I ( L x x 2 2 ) f o r x < L , d y d x = y ( L ) f o r x L
so that the cupping angle φ measured by the DK, equal to the relative rotation of the two bars, is given by the following:
φ = y ( L ) y ( a ) = F ( L a ) 2 4 E I
When a constant load F is applied, the angle φ increases. Hence, E decreases. J = 1 / E can be considered the effective creep compliance of the panel in direction x:
J ( t ) = 1 E ( t ) = 4 I F ( L a ) 2 φ ( t )

2.5.2. The Panel Painting as a Bilayer Structure

The panel is a complex structure composed of several materials. As a first level of approximation, it can be considered a bilayer structure made of wood and a paint layer, both assumed homogeneous. Let E w and E p be their respective elastic moduli in direction x and αh, the small thickness of the paint layer ( α 1 ). The expression of E is given by the following:
E = [ K 2 ( K 1 ) 2 / K 0 ] / I
where the rigidities K i are given by integral expressions through the cross-section orthogonal to direction x:
K i = E ( y ) y i d y = b · E w h / 2 ( 1 2 α ) h / 2 y i d y + b · E p ( 1 2 α ) h / 2 + h / 2 y i d y         i = 0   t o   2
with the origin of the coordinate y in the middle of the panel thickness. The calculation of K i leads to the following:
K 0 = b h · [ E w + α ( E p E w ) ]
K 1 = ( b h 2 / 2 ) · [ α ( 1 α ) ( E p E w ) ]
K 2 = ( b h 3 / 12 ) · [ E w + 3 α ( 1 2 α + 4 3 α 2 ) ( E p E w ) ]
so that the global bending elastic modulus is expressed by the following:
E = E w + 3 α ( 1 2 α + 4 3 α 2 ) ( E p E w ) 3 α 2 ( 1 α ) 2 ( E p E w ) 2 E w + α ( E p E w )
The relative paint layer thickness α is small, so only the terms up to α 2 can be kept in this expression, leading to the following:
E E w + 3 α ( 1 2 α ) ( E p E w ) 3 α 2 ( E p E w ) 2 / E w
If E, E p and α are known, the value of E w can be obtained as the positive root of a second-order polynomial:
0 ( 1 3 α + 3 α 2 ) ( E w ) 2 ( E 3 α E p ) E w 3 α 2 ( E p ) 2
Keeping again the terms up to α 2 , the following expression is obtained for E w :
E w E 3 α E p 1 3 α + 3 α 2 + 3 α 2 ( E p ) 2 E 3 α E p
In the case of a paint layer behaving elastically, so that E p can be considered a constant, an expression of time-dependent compliance J w = 1 / E w can be deduced for wood:
J w ( t ) 1 E w ( t ) [ E ( t ) 3 α E p 1 3 α + 3 α 2 + 3 α 2 ( E p ) 2 E ( t ) 3 α E p ] 1
J w is not, strictly speaking, a creep compliance because the wooden part of the panel is not subjected to a constant bending moment. Nevertheless, Equation (14) can be considered a reasonable approximation to evaluate the contribution of wood alone to the creep of the panel. In this expression, the paint contributes through the rigidity α E p , which is expected because the value of E p in [10] was obtained for an arbitrary paint layer thickness, which was not actually measured.

3. Results

Time-Dependent Cupping Angle

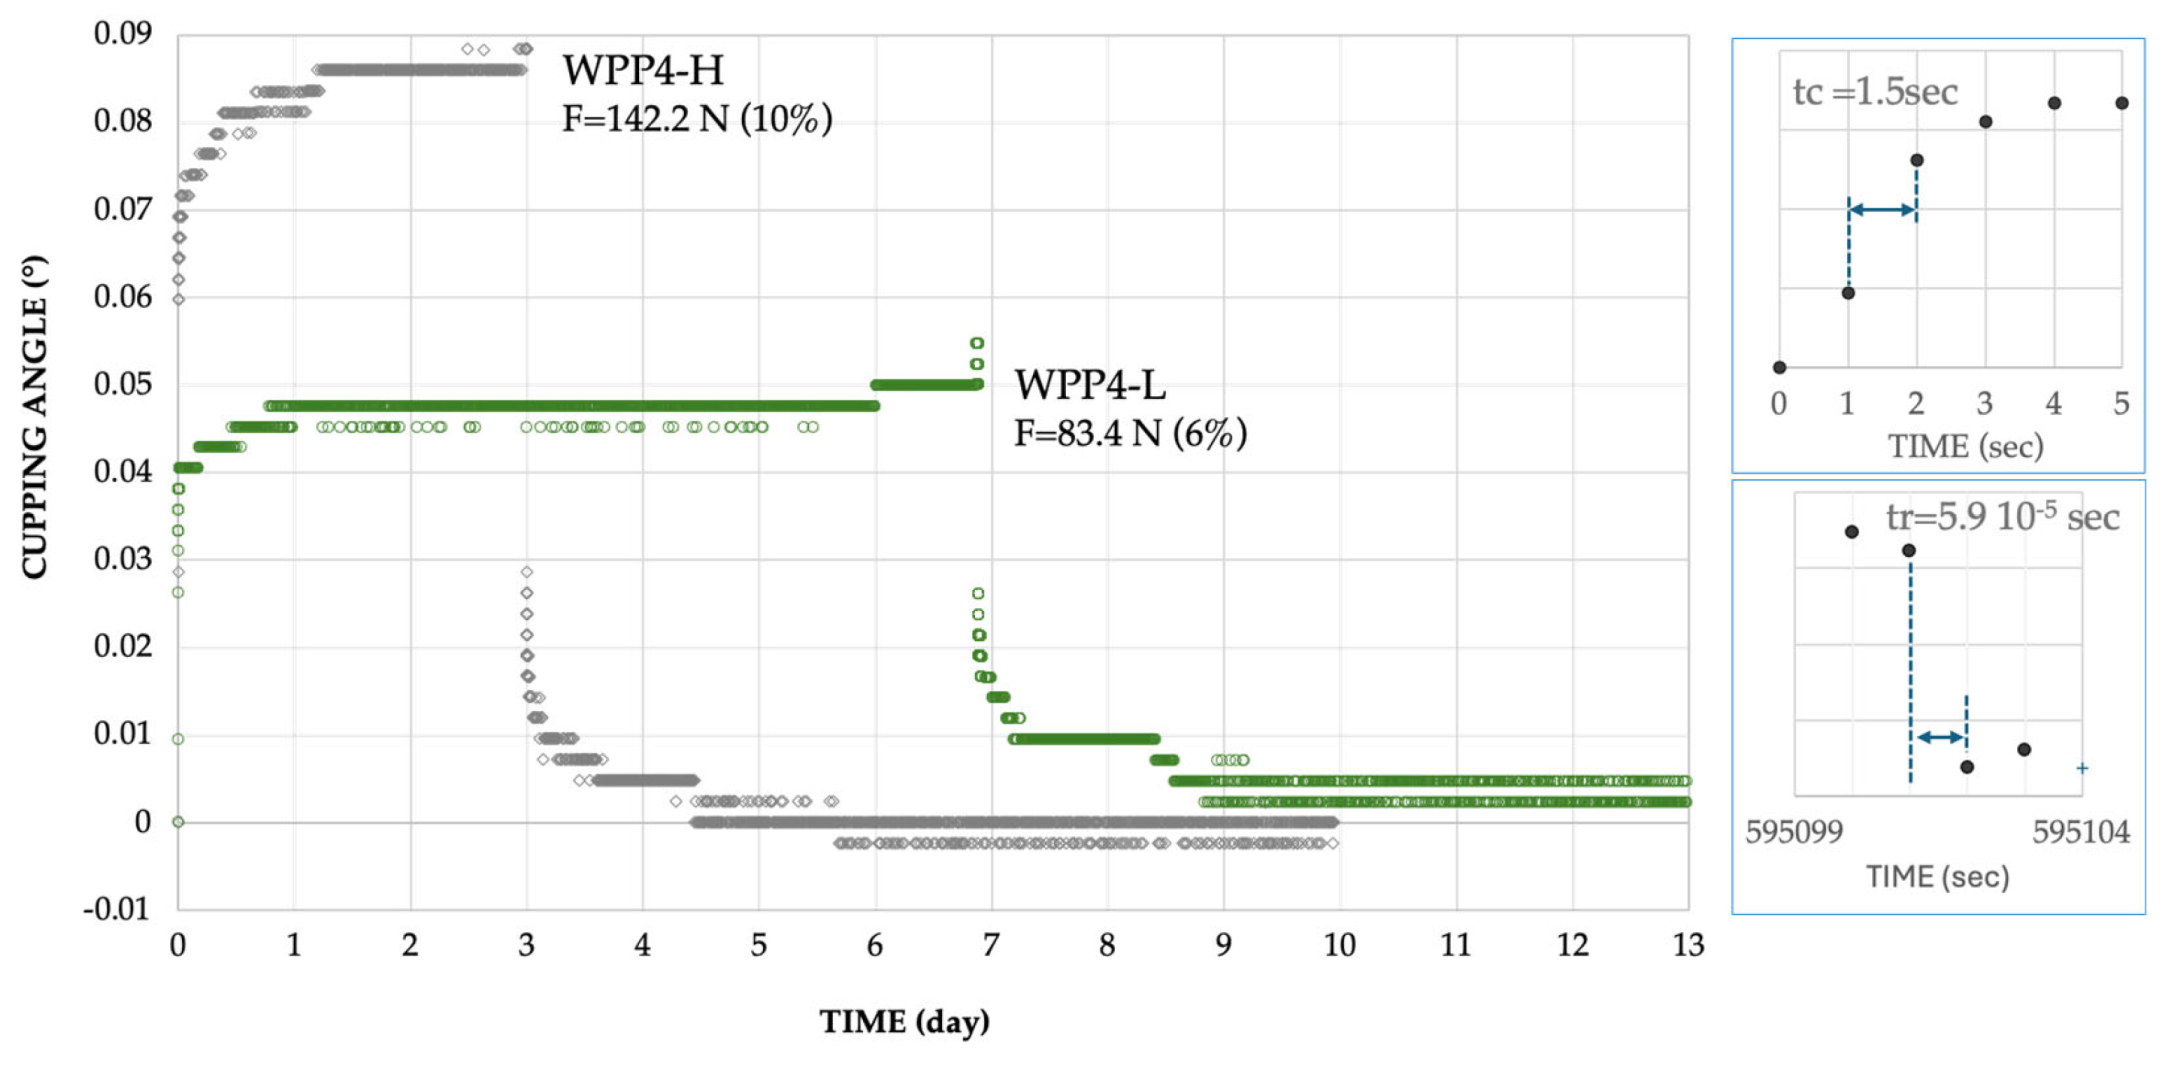
Figure 5 shows the results of the loading tests as the variation of the cupping angle (Δφ) versus time. The change in cupping angle over time is clearly visible in all tests: each curve initially shows the instantaneous elastic variation in cupping angle, followed by a second part where the cupping angle increases rapidly until equilibrium is reached (i.e., when the increase in cupping angle is smaller than the resolution of the measurement system, approximately 24 h). When the variation of the cupping angle was considered complete, the load was removed and the recovery took place. The elastic recovery occurred first, consistent with the elastic reaction of the WPP. Then, the delayed recovery was observed. The tests were stopped when the cupping angle variation was approximately zero (Figure 5).
The elastic part was consistent between the two tests conducted on WPP4, resulting in a value proportional to the load applied. When this part was completed, the VE behaviour was evident, and the cupping angle increased in time with a decreasing rate. WPP4-L is marked by friction during the recovery, caused by the low load applied, combined with a low resolution.

4. Discussion

4.1. Time-Dependent Compliance of the Panel Obtained from Creep and Recovery Tests

The results shown in Figure 5 were used to analyse the time-dependent compliance of the PP. The precise times of loading t c and unloading t r were determined by zooming the curve in the vicinity of the event (boxes in Figure 5). The curvature was then converted into creep compliance using Equation (4) and plotted as a function of l o g ( t t c ) . A smoothing interpolation macro was employed by fitting a moving parabola centred on equally spaced times along the log scale, applying a weight to the data defined by a Gaussian function. For a given value of x = l o g ( t t c ) , the following error function was minimised:
Ψ ( a 0 , a 1 , a 2 ) = x i > l o g ( t c ) x i < l o g ( t r ) e [ ( x i x ) 2 2 s 2 ] [ a 0 + a 1 ( x i x ) + a 2 ( x i x ) 2 J ( x i ) ] 2
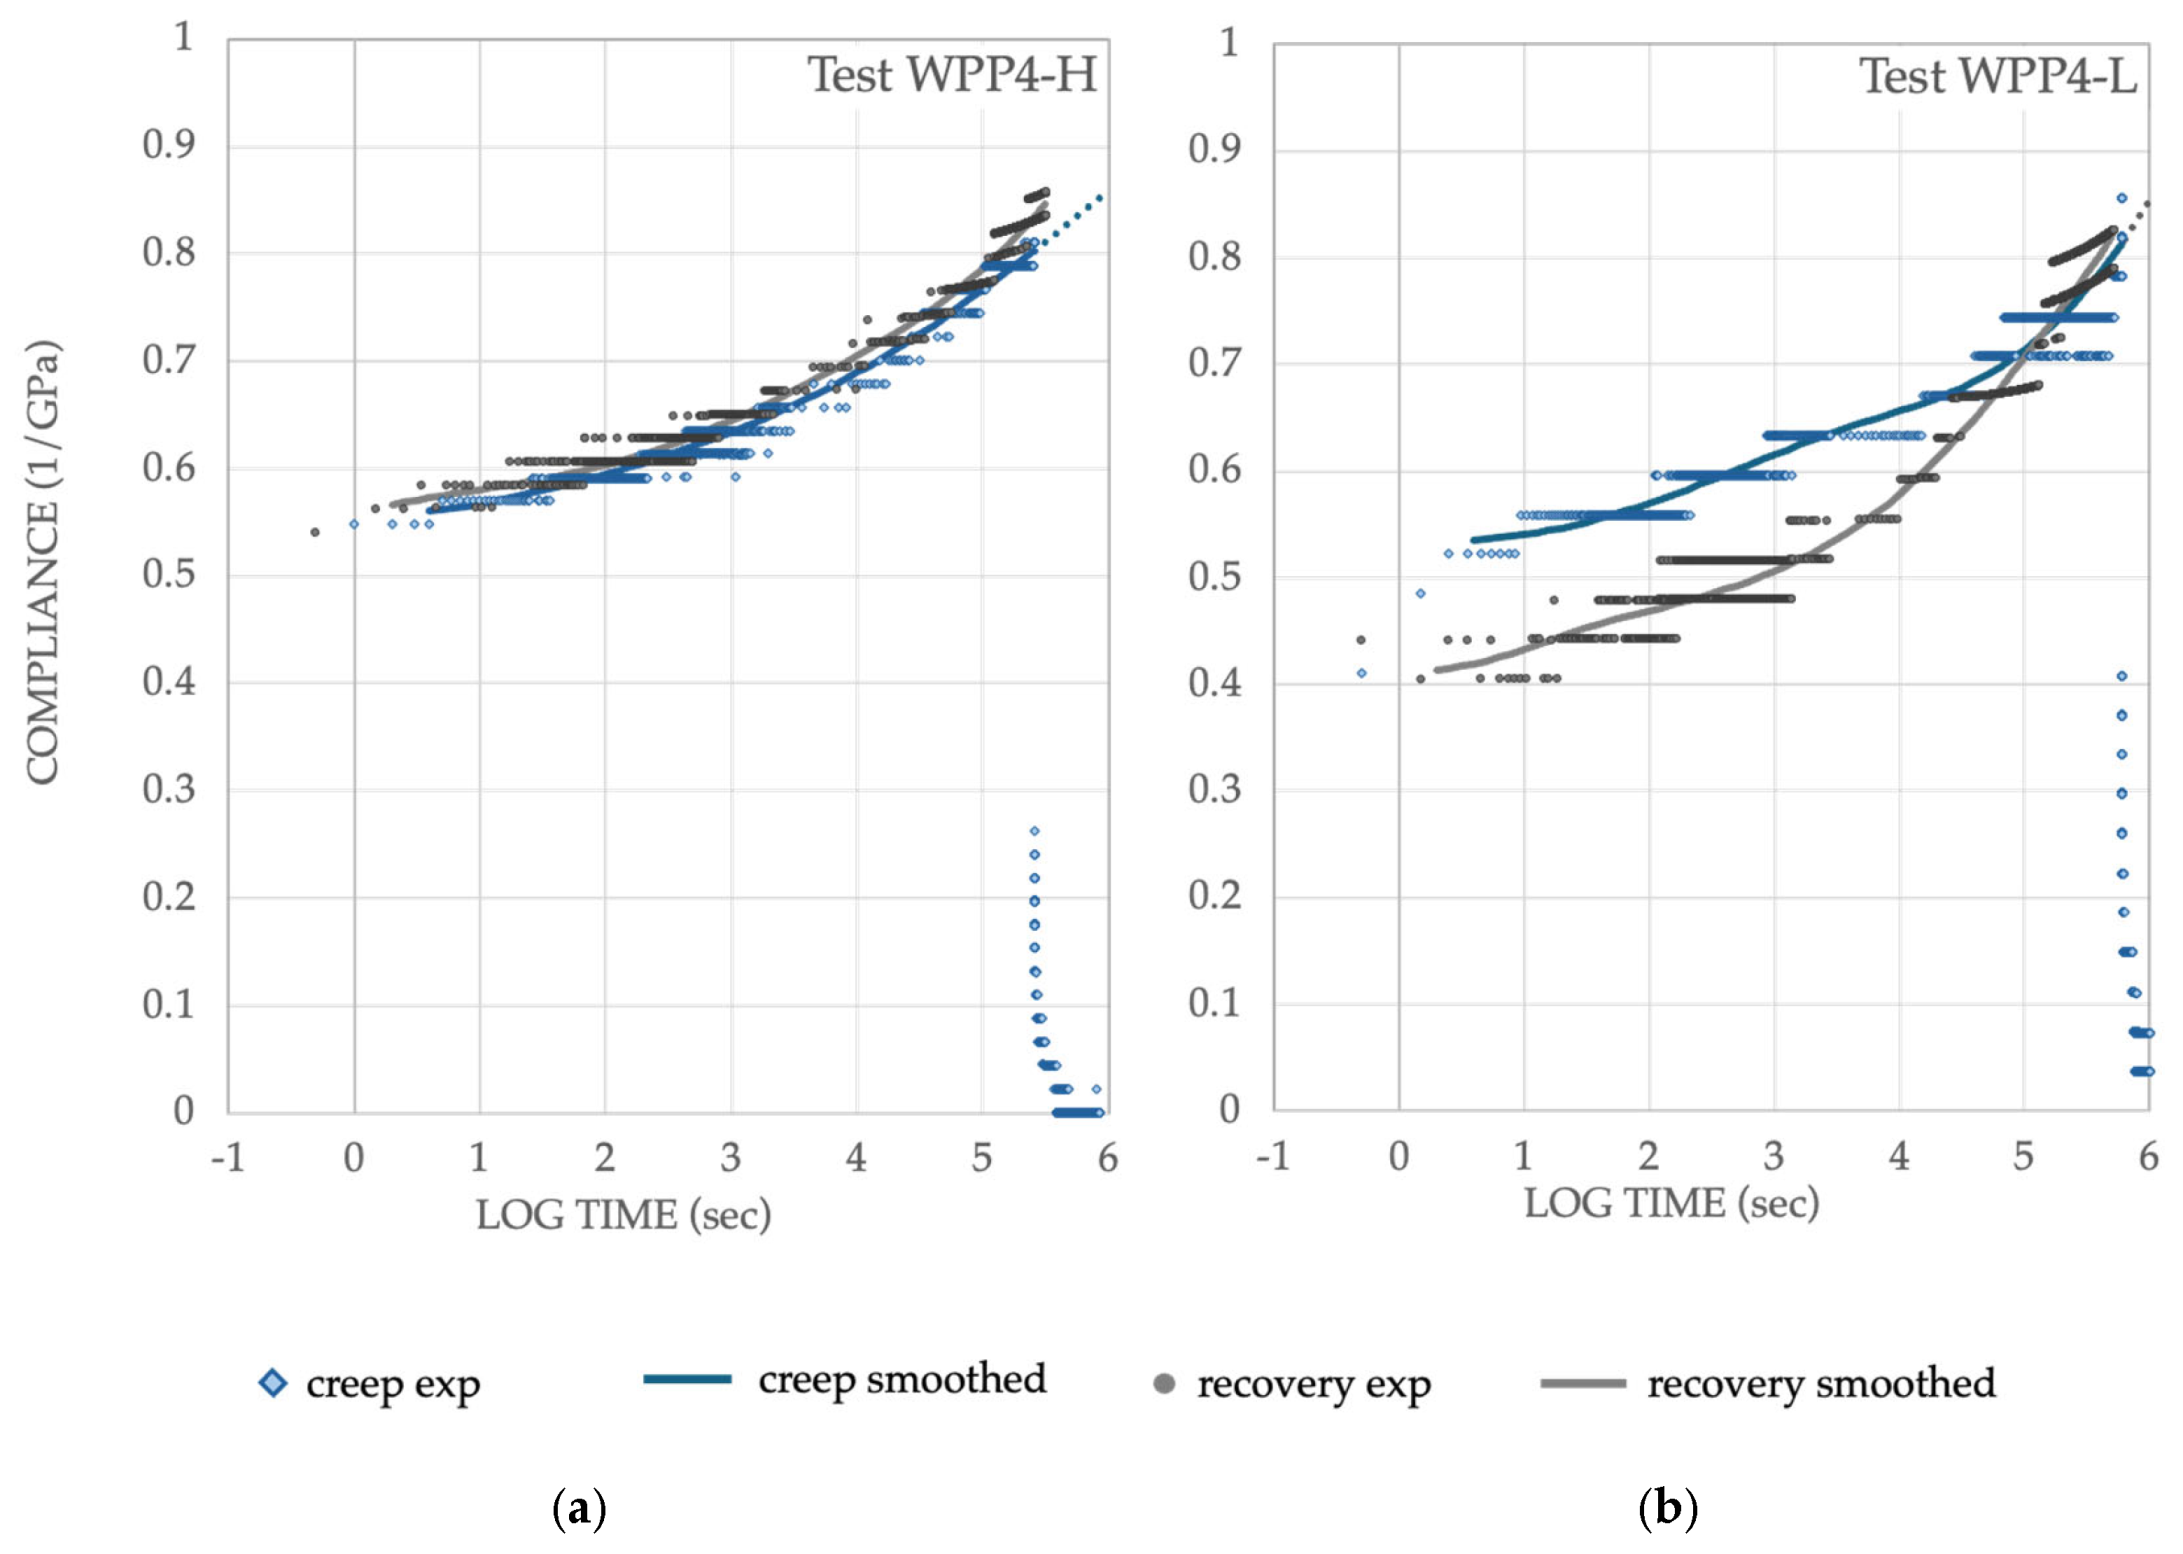
The resulting value of a 0 was taken as the smoothed value of compliance, interpolated at time t. The standard deviation s, which defines the range of the smoothing action, was s = 1.6. The blue lines in Figure 6 show the resulting smoothed curve for each test, which can be compared to the creep data indicated by the blue diamonds. The smoothing helped overcome the poor resolution of the measuring equipment. It was also used to extrapolate the creep data after unloading at time t r , as shown by the blue dotted lines. The parabola given by the values of a 0 , a 1 , a 2 obtained at the end of the creep test was used to estimate the creep that would have occurred if the load had been applied until the end of the test.
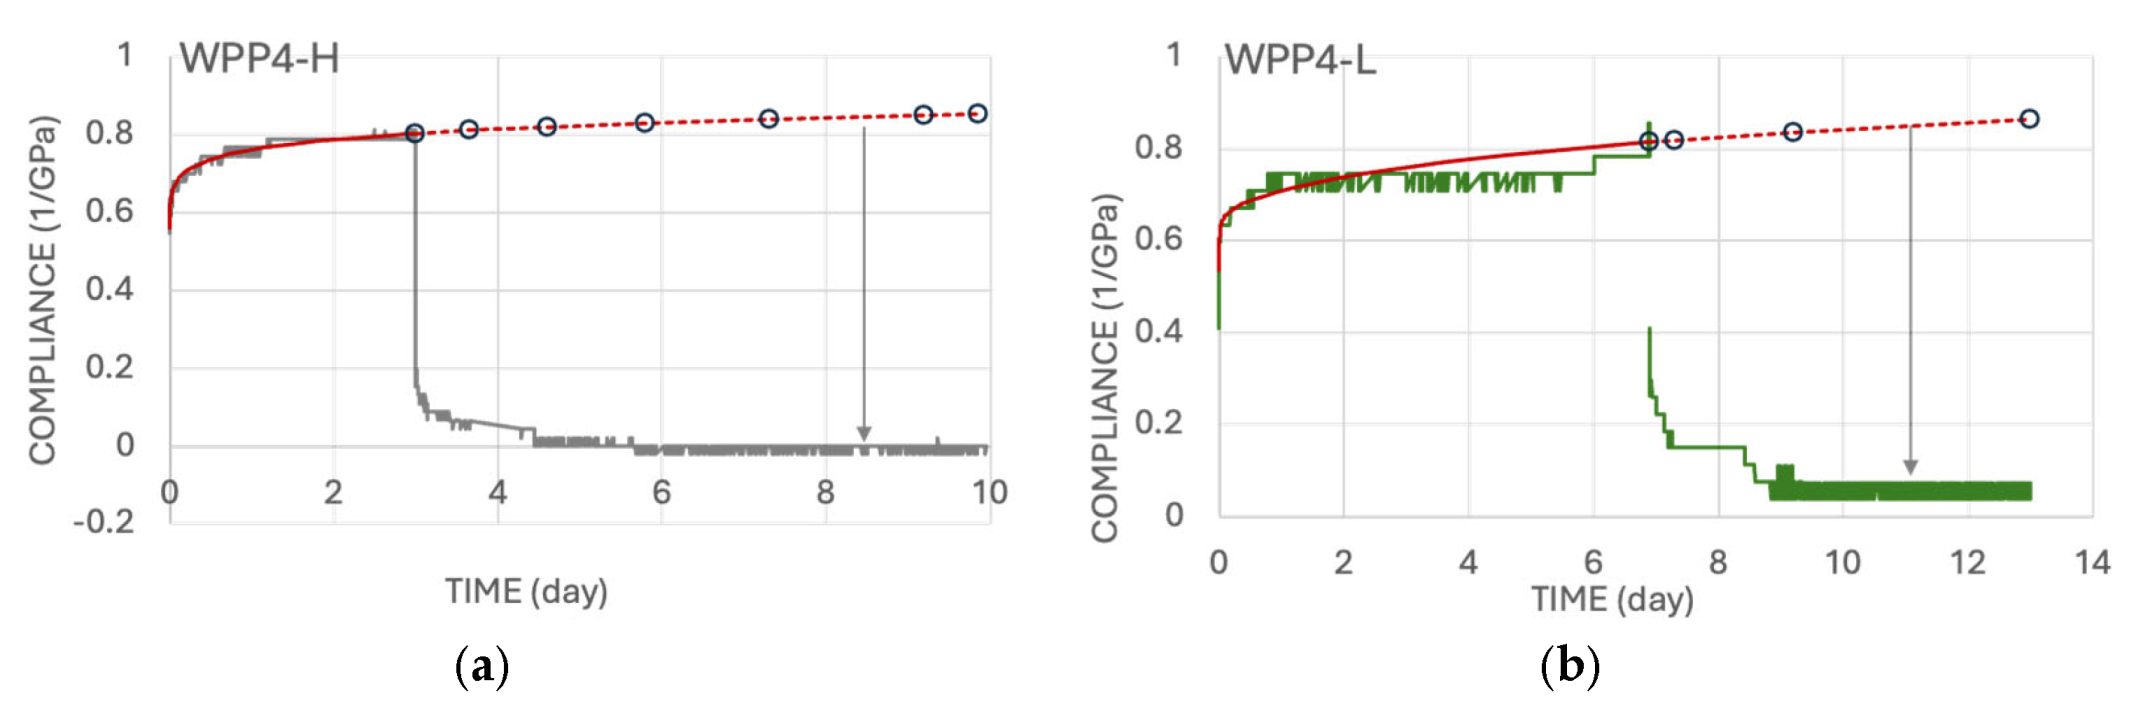
Figure 7 is a representation as a function of time: the difference between the extrapolated creep and the observed strain can be considered the effect of unloading alone. When the obtained values are plotted as a function of log ( t t r ) , they should coincide with the creep curves. Figure 6 shows that this is the case for the H test. However, for the L test, there is a slow start to the recovery that could be attributed to friction. A similar problem appeared at the beginning of the creep part, but was resolved rapidly.
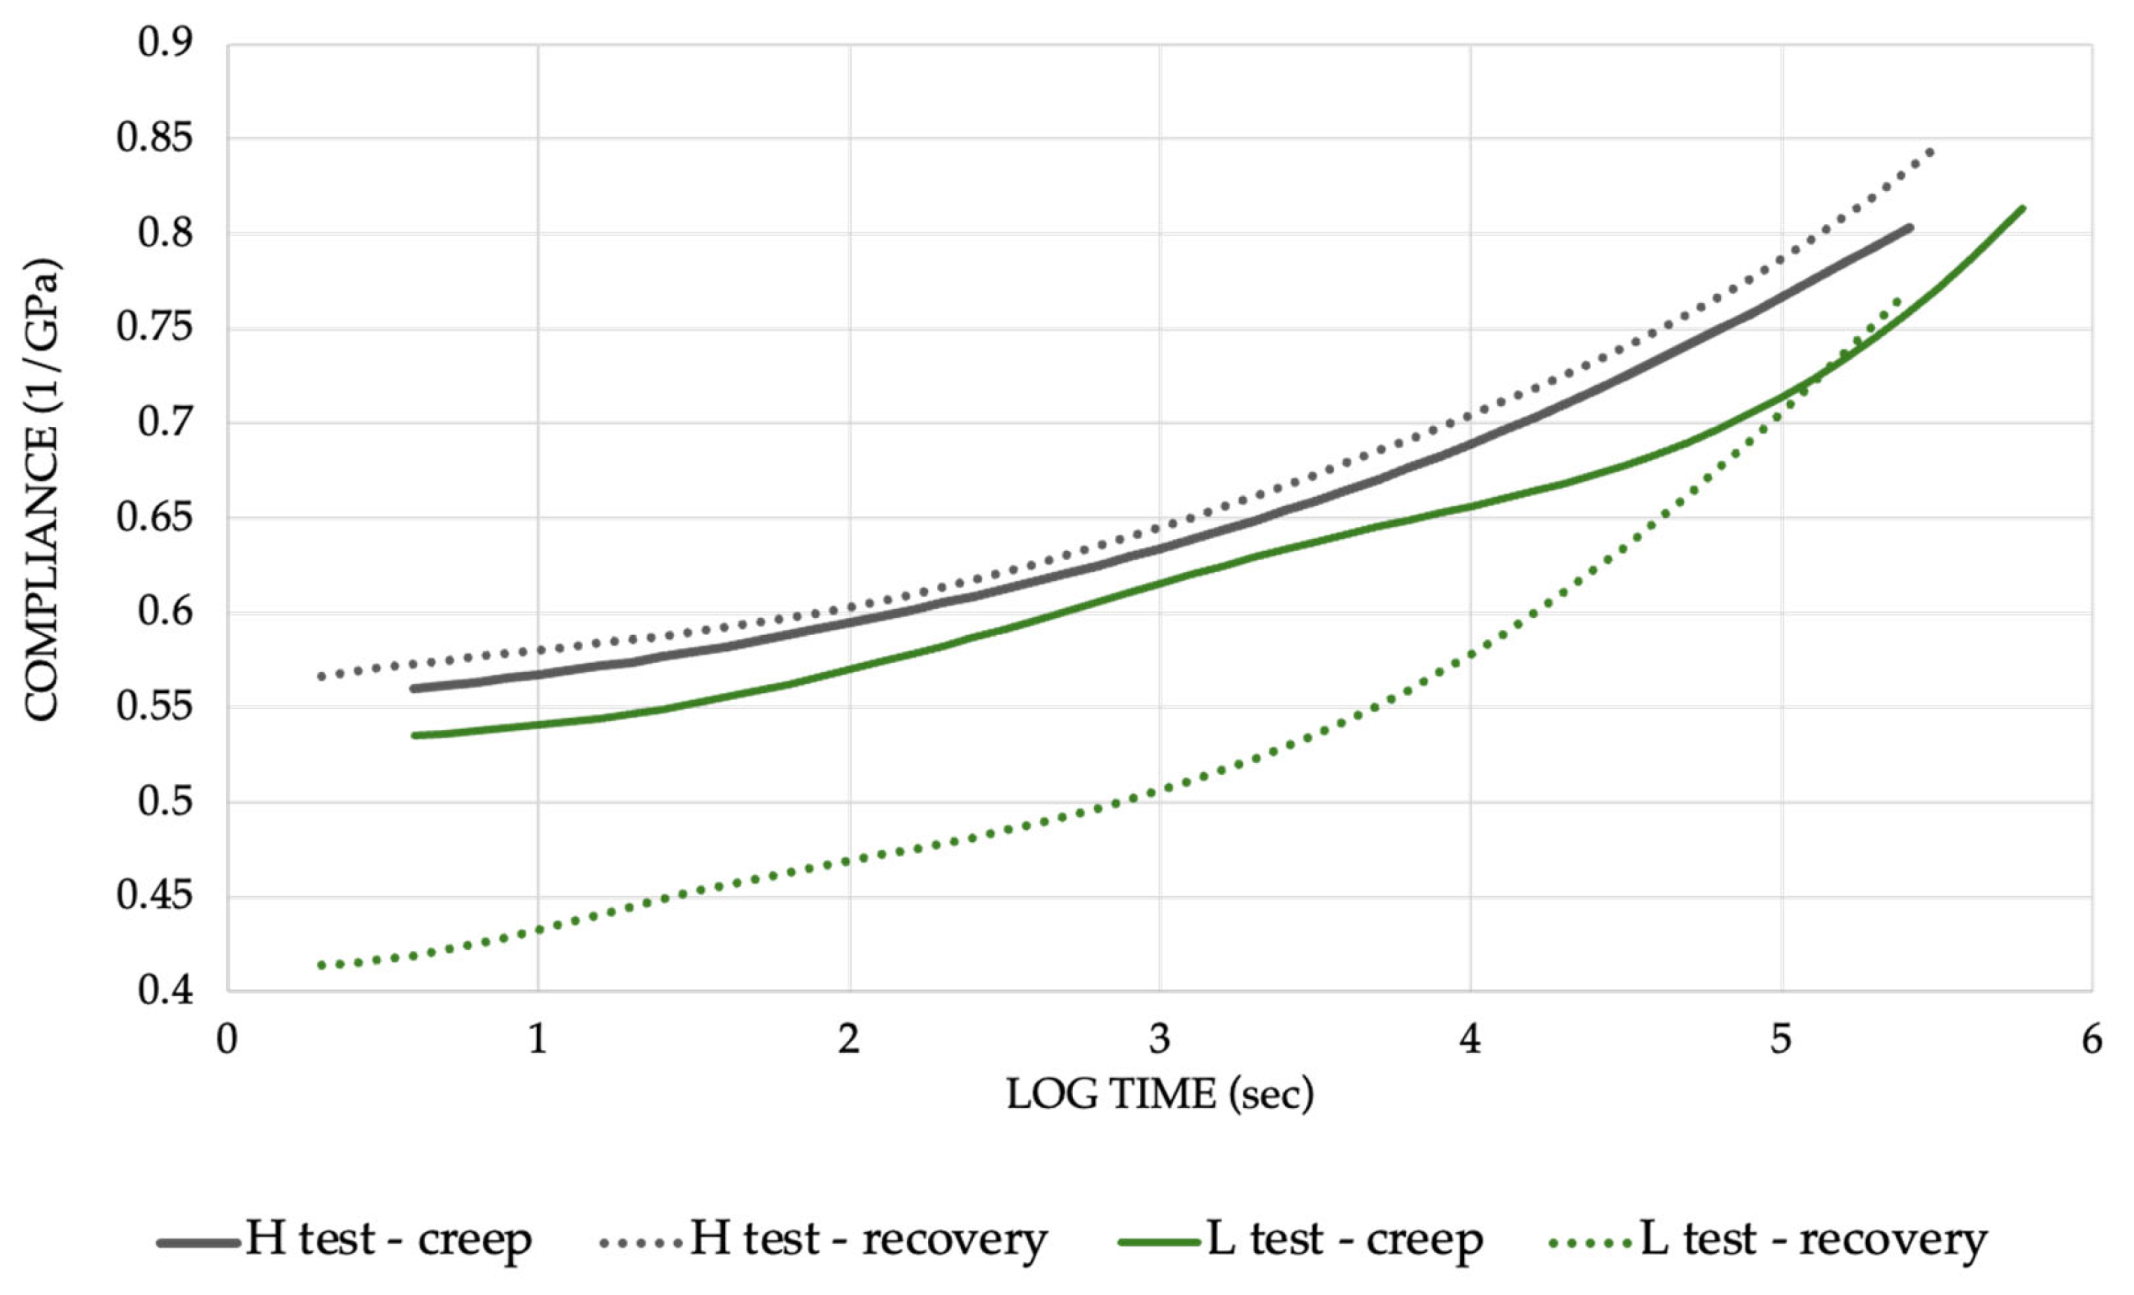
Figure 8 compares the four smoothed curves obtained in this process. The observed differences between the two stress levels are mostly due to the poor quality of the L test and do not question the principle of viscoelastic linearity. We subsequently focus on the analysis of the H test.

4.2. Fitting a Parabolic Creep Model for the Panel

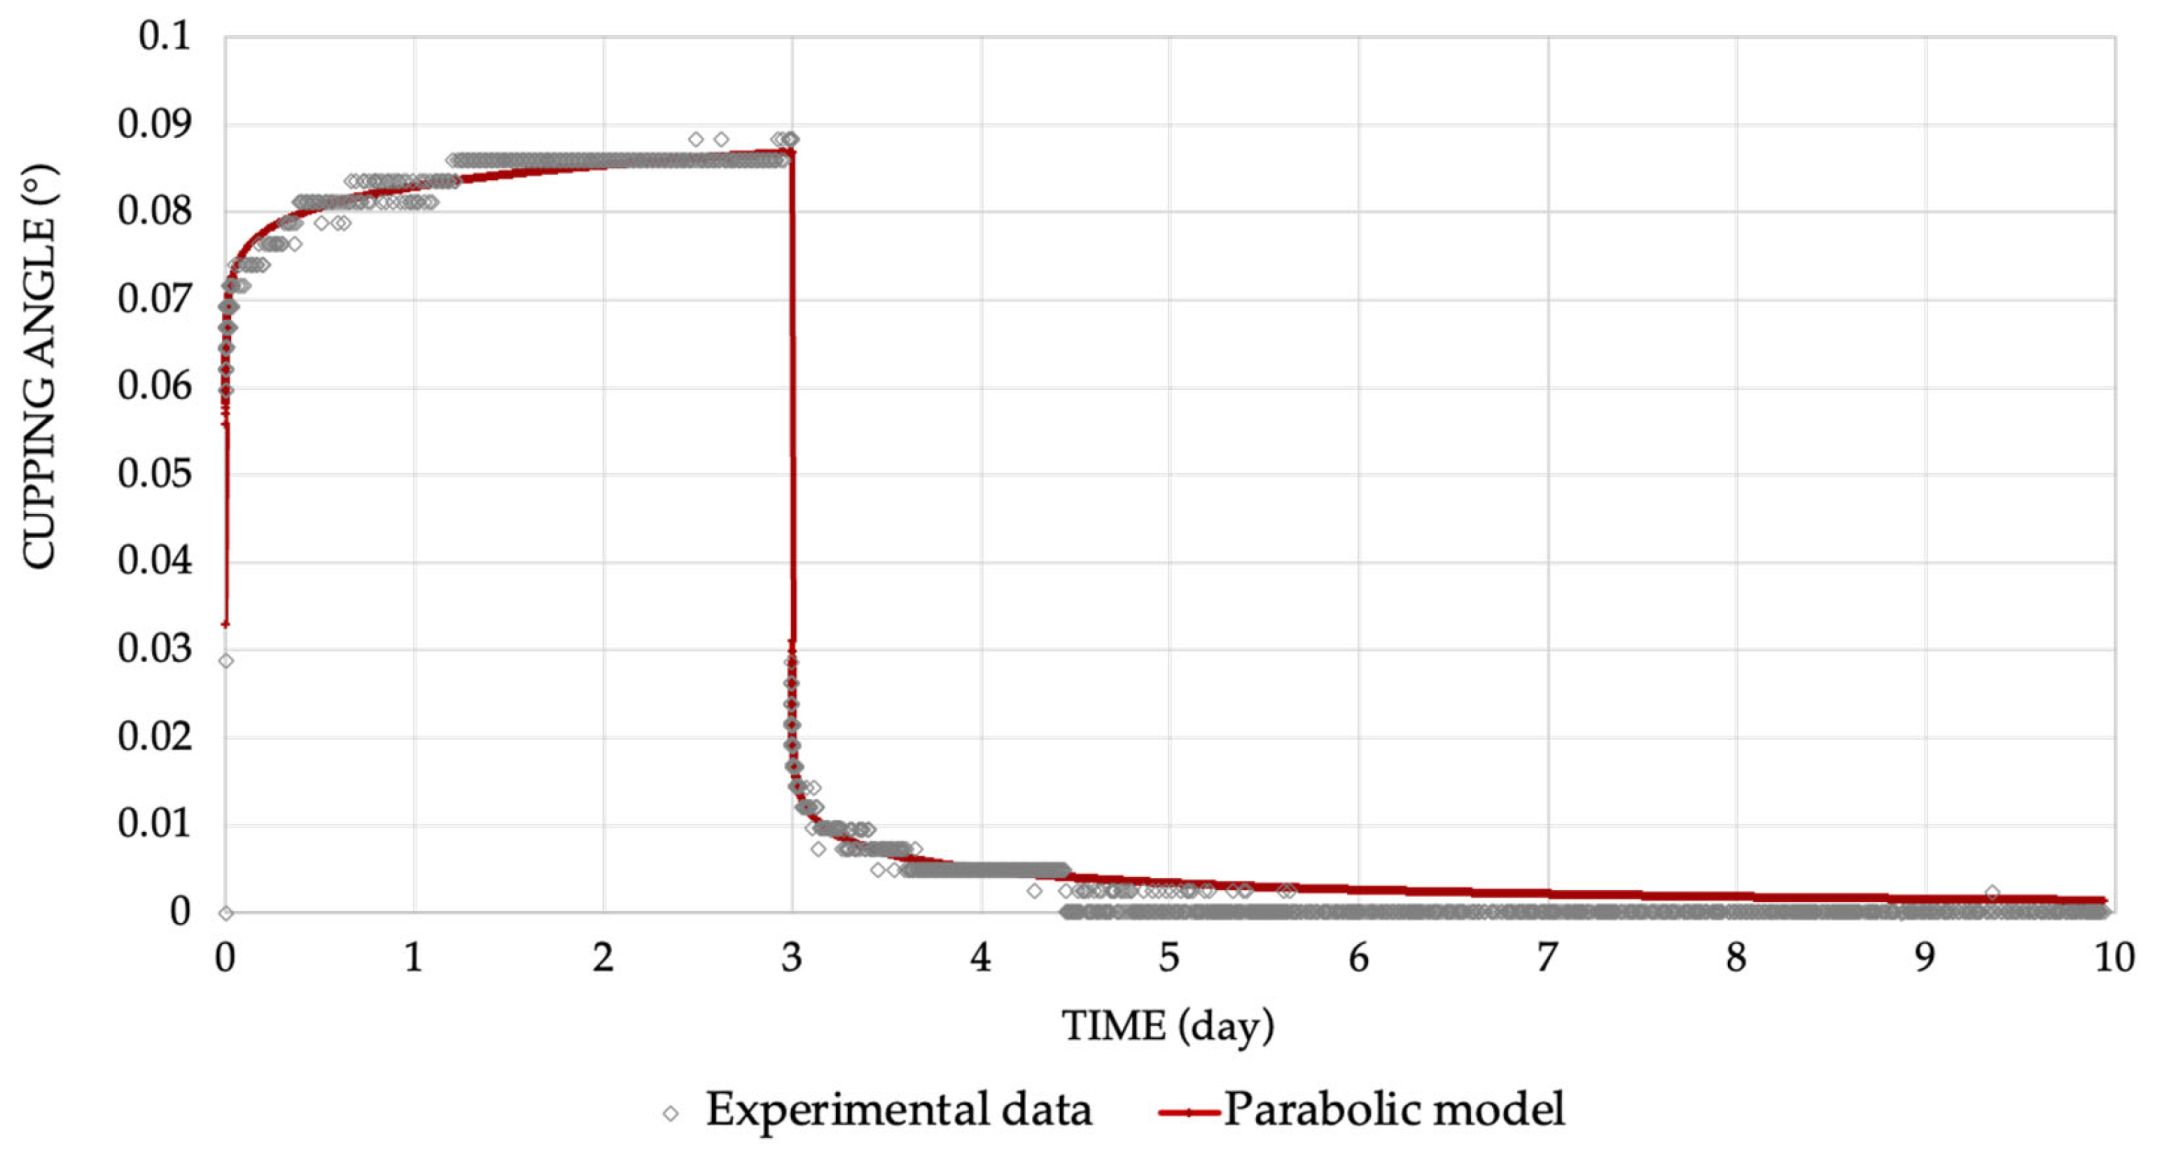
The shape of the curves in Figure 8 is typical of a parabolic creep, where the compliance is described by a power law [17]:
J ( t ) = J 0 [ 1 + ( t t d ) p ]  
Based on this model, the expected expression for the cupping angle φ becomes the following:
φ ( t ) = ( ϕ 0 [ 1 + ( t t d ) p ] d u r i n g   l o a d i n g   ( t c < t < t r ) ϕ 0 [ ( t t d ) p ( t t r t d ) p ] a f t e r   u n l o a d i n g   ( t t r ) )
where ϕ 0 is the instantaneous (elastic) cupping, t d the doubling time and p the parabolic parameter (0 < p < 1). To obtain the best-fitting parameters, the following error function was minimised:
Θ ( ϕ 0 , p , t d ) = t i > t c t i < t r l o g ( t i + 1 t i 1 ) { ϕ 0 [ 1 + ( t i t d ) p ] φ ( t i ) } 2 + t i > t r l o g ( t i + 1 t r t i 1 t r ) { ϕ 0 [ ( t i t d ) p ( t i t r t d ) p ] φ ( t i ) } 2
The weighting terms used in this expression provide a balanced contribution of all time scales. The quality of the fitting was excellent (Figure 9). The following parameter values were obtained: ϕ 0 = 0.0330°; p = 0.0688; t d = 209.4 s.

4.3. Extracting the Contribution of Wood Creep

The observed instantaneous compliance, between 0.53 and 0.57 GPa−1 depending on the test, indicates high stiffness, which is atypical of poplar wood, particularly in the transverse directions. Therefore, the contribution of the paint layers could be questioned, especially because the paint layers of WPP4 are characterised by high stiffness [10].
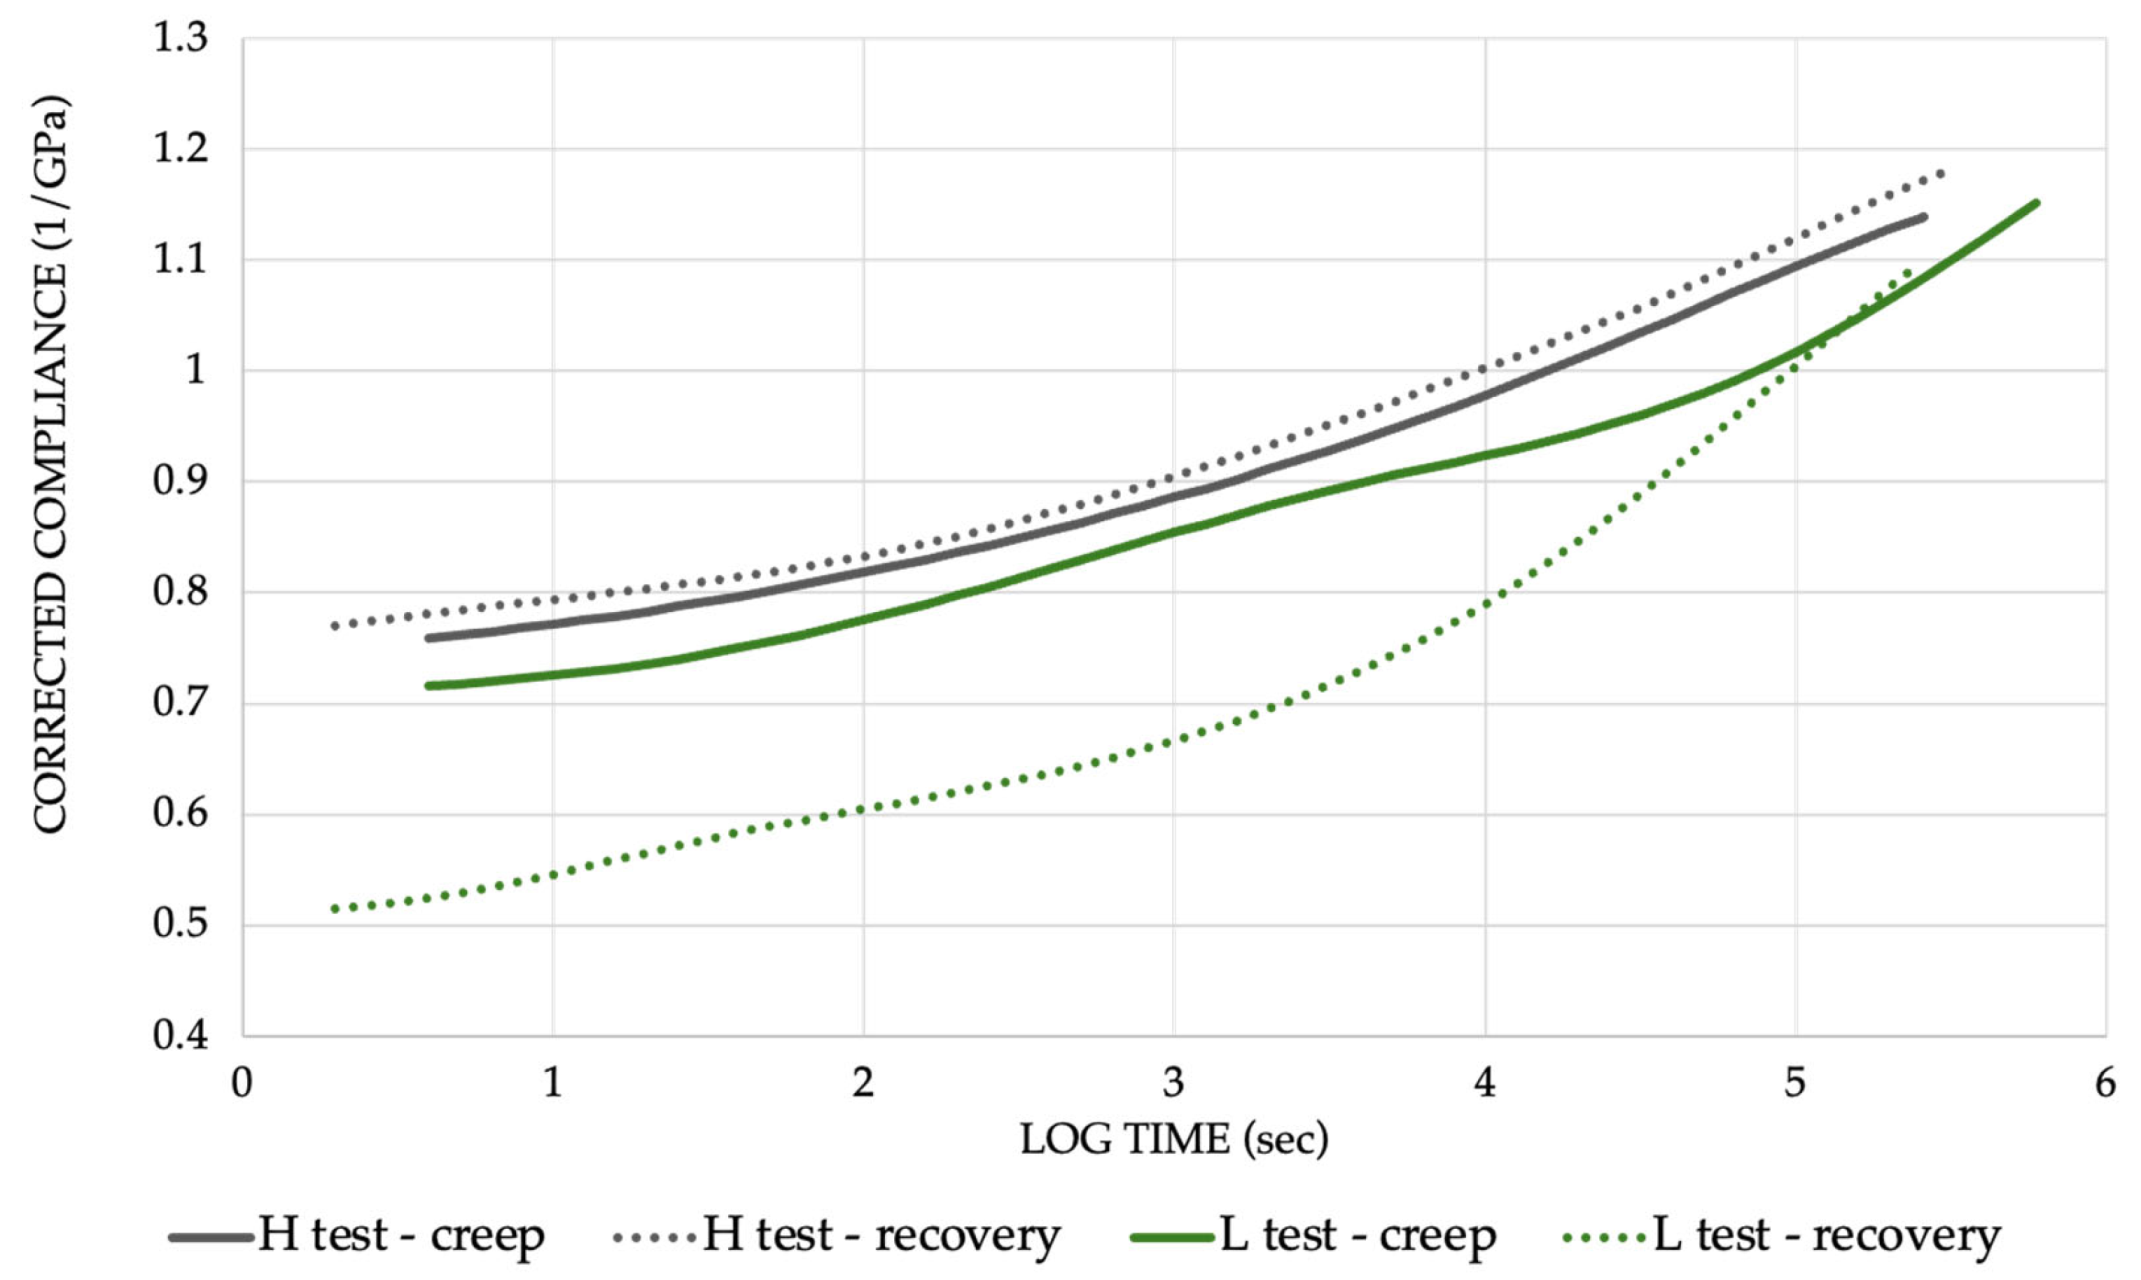
Figure 10 shows the corrected wood compliance calculated using Equation (14), assuming that the paint layer remains elastic, with E p and α set to the values obtained from [10]. The initial compliance ranges between 0.79 and 0.87 GPa−1, still low compared to the 1.05 GPa−1 reported in [10] for the radial direction, which is the dominant orientation in the zone measured by the DK. It is, however, much more acceptable than the uncorrected value. Regarding relative creep, a factor of approximately 1.5 is reached after 3 days, either for the panel compliance or the corrected wood compliance.
The marked difference between Figure 8 and Figure 10 demonstrates the substantial contribution of the paint layers to the stiffness of the PP, and possibly to the VE behaviour with their time-dependent response. However, the presence of animal glue in the ground layers could support the hypothesis of a VE behaviour in the paint layers.

5. Conclusions

Performing a viscoelastic test on an original panel painting (PP) was a challenge that was overcome in this study. The test did not harm the valuable object thanks to the precautions taken in the manipulation and the moderate level of loading. The preservation of the object was demonstrated by verifying the linearity of the viscoelastic (VE) response. However, the test was performed at the limit of the precision provided by the equipment, and difficulties related to friction emerged. The tests evidenced that the viscoelastic creep, while measurable and following a linear behaviour, showed a limited magnitude under safe service loads. Therefore, for this class of rigidity in PPs, the VE component may be considered of secondary importance compared to the deformations induced by hygroscopic variations. For the higher stress level of 10%, a simple parabolic model based on a power law and using three parameters could only be fitted to the whole creep recovery test.
In complex multilayered structures such as PPs, viscoelasticity can be attributed to any of the constituting components. Thus, we proposed a simplified approach by considering the system a thick wooden part covered by a thin paint layer. The average stiffness of the wood can be estimated when the global stiffness of the panel and that of the paint layer are known. The equation obtained was used to deduce the stiffness of the wooden part alone from the time-dependent stiffness of the panel, assuming that the paint layer behaved elastically.
Nonetheless, the actual elasticity of the paint layer is uncertain. Thus, the problems of friction and insufficient resolution will have to be overcome in future tests, so that a reliable estimate of the surface strain can be measured. This would allow the estimation of both wood and paint layer stiffness. Applying this approach to diverse PPs with contrasting sets of properties would allow us to achieve a better understanding of the contributions of the various materials that make up the artworks to the time-dependent behaviour of PPs.

Author Contributions

P.M.: Conceptualisation, Methodology, Validation, Formal Analysis, Investigation, Writing—Original Draft, Writing—Review and Editing. J.G.: Formal Analysis, Writing—Review and Editing, Visualisation. L.R. (Lorenzo Riparbelli): Conceptualisation, Methodology, Writing—Review and Editing. L.R. (Luciano Ricciardi): Resources, Writing—Review and Editing. S.R.: Resources, Writing—Review and Editing. M.F.: Conceptualisation, Methodology, Supervision, Writing—Review and Editing. All authors have read and agreed to the published version of the manuscript.

Funding

Progetto MUSEACT “Conservazione preventiva e riduzione dei costi energetici nelle collezioni MUSEali e negli Ambienti di Conservazione mediante l’applicazione di Tecnologie IoT e AI”—Finanziato da Regione Toscana (FSE+ 2020-2027) GiovaniSì.

Data Availability Statement

The data presented in this study are available on request from the corresponding author. The data are not publicly available due to privacy constraints.

Acknowledgments

The authors acknowledge Chiara Manfriani for her contribution to the experimental tests and basic processing.

Conflicts of Interest

The authors declare no conflicts of interest.

References

  1. Ross, R.J. Wood Handbook—Wood as an Engineering Material; U.S. Department of Agriculture, Forest Service, Forest Products Laboratory: Madison, WI, USA, 2010. [Google Scholar]
  2. Bodig, J.; Jayne, B.A. Mechanics of Wood and Wood Composites; Van Nostrand Reinhold: New York, NY, USA, 1982. [Google Scholar]
  3. Hunt, D. Present Knowledge of Mechano-Sorptive Creep of Wood, Creep in Timber Constructions (a State of the Art Report). Rilem Tech. Comm. 1992, 112, 75–104. [Google Scholar]
  4. Navi, P.; Stanzl-Tschegg, S. Micromechanics of Creep and Relaxation of Wood. A Review COST Action E35 2004–2008: Wood Machining—Micromechanics and Fracture. Holzforschung 2009, 63, 186–195. [Google Scholar] [CrossRef] [Scilit]
  5. Mazzanti, P.; Togni, M.; Uzielli, L. Drying Shrinkage and Mechanical Properties of Poplar Wood (Populus alba L.) across the Grain. J. Cult. Herit. 2012, 13, S85–S89. [Google Scholar] [CrossRef] [Scilit]
  6. Toratti, T.; Svensson, S. Mechano-Sorption Experiments Perpendicular to Grain under Tensile and Compressive Loads. Wood Sci. Technol. 2000, 34, 317–326. [Google Scholar] [CrossRef] [Scilit]
  7. Salmén, L. Viscoelastic Properties Ofin Situ Lignin under Water-Saturated Conditions. J. Mater. Sci. 1984, 19, 3090–3096. [Google Scholar] [CrossRef] [Scilit]
  8. Gebhardt, C.; Konopka, D.; Börner, A.; Mäder, M.; Kaliske, M. Hygro-Mechanical Numerical Investigations of a Wooden Panel Painting from “Katharinenaltar” by Lucas Cranach the Elder. J. Cult. Herit. 2018, 29, 1–9. [Google Scholar] [CrossRef] [Scilit]
  9. Riparbelli, L.; Mazzanti, P.; Helfer, T.; Manfriani, C.; Uzielli, L.; Castelli, C.; Santacesaria, A.; Ricciardi, L.; Rossi, S.; Gril, J.; et al. Modelling of Hygro-Mechanical Behaviour of Wooden Panel Paintings: Model Calibration and Artworks Characterisation. Herit. Sci. 2023, 11, 126. [Google Scholar] [CrossRef] [Scilit]
  10. Riparbelli, L.; Mazzanti, P.; Helfer, T.; Manfriani, C.; Uzielli, U.; Castelli, C.; Santacesaria, A.; Ricciardi, L.; Rossi, S.; Gril, J.; et al. Exploring the Inner Hygro-Mechanical Behaviour of Historical Panel Paintings: A Novel Approach Using Digital Twins. Herit. Sci. 2024, 12, 27. [Google Scholar] [CrossRef] [Scilit]
  11. Dureisseix, D.; Marcon, B. A Partitioning Strategy for the Coupled Hygromechanical Analysis with Application to Wood Structures of Cultural Heritage. Int. J. Numer. Methods Eng. 2011, 88, 228–256. [Google Scholar] [CrossRef] [Scilit]
  12. Froidevaux, J. Wood and Paint Layers Aging and Risk Analysis of Ancient Panel Painting. Ph.D. Thesis, Université Montpellier II, Montpellier, France, 2012. [Google Scholar]
  13. Riparbelli, L.; Mazzanti, P.; Manfriani, C.; Uzielli, L.; Castelli, C.; Gualdani, G.; Ricciardi, L.; Santacesaria, A.; Rossi, S.; Fioravanti, M. Hygromechanical Behaviour of Wooden Panel Paintings: Classification of Their Deformation Tendencies Based on Numerical Modelling and Experimental Results. Herit. Sci. 2023, 11, 25. [Google Scholar] [CrossRef] [Scilit]
  14. Riparbelli, L.; Dionisi-Vici, P.; Mazzanti, P.; Brémand, F.; Dupré, J.C.; Fioravanti, M.; Goli, G.; Helfer, T.; Hesser, F.; Jullien, D.; et al. Coupling Numerical and Experimental Methods to Characterise the Mechanical Behaviour of the Mona Lisa: A Method to Enhance the Conservation of Panel Paintings. J. Cult. Herit. 2023, 62, 376–386. [Google Scholar] [CrossRef] [Scilit]
  15. Uzielli, L.; Cocchi, L.; Mazzanti, P.; Togni, M.; Julien, D.; Dionisi-Vici, P. The Deformometric Kit: A Method and an Apparatus for Monitoring the Deformation of Wooden Panels. J. Cult. Herit. 2012, 13, 94–101. [Google Scholar] [CrossRef] [Scilit]
  16. Martin, E.; Sonoda, N.; Duval, A. Contribution a l’etude des preparations blanches des tableaux italiens sur bois. Stud. Conserv. 1992, 37, 82–92. [Google Scholar] [CrossRef] [Scilit]
  17. Schniewind, A.P.; Barrett, J.D. Wood as a linear orthotropic viscoelastic material. Wood Sci. Technol. 1972, 6, 43–57. [Google Scholar] [CrossRef] [Scilit]
Figure 1. Front and back views of the 16th-century panel painting Madonna with Child, Saint John, and a Monk, attributed to an anonymous artist. Photographs were taken before the tests.
Forests 17 00238 g001
Figure 2. Front view of WPP4 before (left) and after (right) the viscoelastic test. No additional damage to the paint layer was observed after the test.
Forests 17 00238 g002
Figure 3. The experimental setup is shown on the (left). The climatic box contains WPP4, with the back side visible. The deformometric kit can be seen mounted on the back to measure variations in the cupping angle (see ‘Time-Dependent Cupping Angle’ Section). The horizontal loading bar is visible, together with the two threaded rods used to apply the load. On the (right), the back of the artwork is displayed with the DK mounted on it.
Forests 17 00238 g003
Figure 4. The drawing shows the geometry of the test and the position of the measurement system for the panel painting (dimensions in mm). F is the force application point, located in the middle of the span, h represents the thickness and b stands for the width of WPP4. L is the half span, a represents the distance between the middle of the panel painting and the left column of the DK and a’ stands for the distance between the middle of the panel painting and the right column of the DK.
Forests 17 00238 g004
Figure 5. Cupping angle variation as a function of time for WPP4, according to the two tests conducted at different applied loads, indicated in the labels, and the stress applied, calculated as a percentage of the estimated bending strength. The determination of loading time (tc) and unloading time (tr) is explained in the boxes in the case of test WPP4-L.
Forests 17 00238 g005
Figure 6. Time-dependent compliance as a function of log time elapsed since loading or unloading: (a) test WPP4-H; (b) test WPP4-L. The markers indicate experimental points, the continuous lines are the result of the smoothing interpolation procedure, and the dotted line represents the extrapolation of the smoothed creep curve during the recovery test. The blue diamonds and blue line indicate the creep, and the grey diamonds and grey curve represent recovery.
Forests 17 00238 g006
Figure 7. Time-dependent compliance as a function of time: (a) higher-stress test WPP4-H; (b) lower-stress test WPP4-L. The grey and green lines show the compliance calculated using Equation (4), the red curve represents the smoothed-interpolated data and the arrow indicates the corrected recovery response.
Forests 17 00238 g007
Figure 8. Time-dependent smoothed compliance as a function of the logarithm of time elapsed since loading or unloading. Green: WPP4-L test; grey: WPP4-H test; continuous lines: creep; dotted lines: recovery.
Forests 17 00238 g008
Figure 9. Comparison of the measured and modelled cupping angle. Parameter values: ϕ 0 = 0.0330°; p = 0.0688; t d = 209.4 s.
Forests 17 00238 g009
Figure 10. Compliance of wood alone as a function of the logarithm of the time elapsed since loading or unloading, assuming an elastic paint layer set at E p = 10.5 GPa for α = 0.5 mm. Green: WPP4-L test; grey: WPP4-H test; continuous lines: creep; dotted lines: recovery.
Forests 17 00238 g010
Disclaimer/Publisher’s Note: The statements, opinions and data contained in all publications are solely those of the individual author(s) and contributor(s) and not of MDPI and/or the editor(s). MDPI and/or the editor(s) disclaim responsibility for any injury to people or property resulting from any ideas, methods, instructions or products referred to in the content.