Article

Long-Term Growth Trends of Robinia pseudoacacia in Relation to Climate Change and Industrial Pollution in the Urban Environment of Kraków, Poland

by
Sławomir Wilczyński
1,*,
Małgorzata Danek
2 and
Tomasz Danek
2
1
Department of Forest Ecosystem Protection, Faculty of Forestry, University of Agriculture in Kraków, Al. 29 Listopada 46, 31-425 Kraków, Poland
2
Department of Geoinformatics and Applied Computer Science, Faculty of Geology, Geophysics and Environmental Protection, AGH University of Kraków, Al. Mickiewicza 30, 30-059 Kraków, Poland
*
Author to whom correspondence should be addressed.
Forests 2026, 17(2), 236; https://doi.org/10.3390/f17020236
Submission received: 29 November 2025 / Revised: 24 January 2026 / Accepted: 6 February 2026 / Published: 10 February 2026

Abstract

The study investigated Robinia pseudoacacia L. planted in the early 20th century in the urban environment of Kraków (SW Poland). Growth responses for the 1920–2019 period were analyzed against changing climatic conditions and pollution levels. In the second half of the 20th century, atmospheric pollution rose sharply owing to local and regional industrial expansion. From the 1950s, the increase in emissions coincided with higher basal area increment (BAI), which can serve as a vitality index. Growth response homogeneity also increased, indicating similar reactions of individual trees to annual climatic variability, and the climate signal-to-noise ratio (SNR) in the BAI chronology rose. Only after peak emission periods did these indices decline abruptly. R. pseudoacacia, in general, enhanced growth when the previous year to the growth year fulfilled the following: July–September was cool and wet; December, February, and March were mild; November, February, and April–August were rainy; June–July was cool; and September–October was warm. These relationships changed over time. Recent climatic warming combined with stable precipitation and a strong reduction in emissions has promoted R. pseudoacacia growth over the past two decades. This species can therefore be considered in urban greening plans as a stable and resilient provider of cooling, carbon storage, rainwater regulation, and other ecosystem services.

1. Introduction

Urban green spaces provide numerous benefits to humans and offer refuge for wildlife, thereby enhancing biodiversity within cities [1]. They also reduce air and water pollution and noise, while affording protection against floods, droughts, and heat waves [2,3,4,5]. To restore nature to urban areas, the European Commission advises metropolitan regions to develop greening plans [6]. Such plans should include the establishment of biologically diverse and accessible forests, shelterbelts, parks, and gardens. The specific environmental conditions found in cities influence tree growth and development [7,8,9]. Poor air quality and soils containing construction rubble and elevated concentrations of calcium, chloride, and sodium ions often exert negative effects on the growth of urban trees [10]. Urban-area climates differ markedly from those prevailing in the surrounding countryside. Cities typically experience warmer and drier conditions and a shortage of water available to plants, even though they often receive greater total precipitation. This paradox arises because ground surfaces are sealed and rainfall is rapidly conveyed to rivers through stormwater sewers. Urban areas are also more heavily polluted. At the same time, urban water availability is highly dynamic and spatially heterogeneous, as it may be locally modified by human activities such as lawn and garden irrigation or other forms of water use in residential areas. However, such anthropogenic water inputs are largely absent or strongly limited in managed urban parks, where trees primarily rely on natural precipitation and soil water retention. The adverse trend in climate change observed during the 20th century [11], together with emissions of industrial pollutants, means that urban trees must constantly contend with restrictive growth conditions [12]. During drought years, which are usually accompanied by high air temperatures, trees can suffer severe stress [13,14]. Such stress leads to disturbances in numerous physiological processes [15,16], resulting, among others, in a decline in tree growth [17] and, in many cases, even mortality [18,19]. Species that tolerate these unfavorable factors may therefore play a crucial role in improving the urban environment [1] and can serve as bioindicators that record such changes [20,21].
Increasing pollution in urban areas has heightened interest in monitoring its effects on trees [22]. Dendrochronological analyses make it possible to retrospectively examine tree growth responses to pollution, e.g., Refs. [21,23,24,25,26,27,28,29]. These methods therefore help verify and expand our understanding of species ecology [30]. Investigations include trees that died due to pollution as well as those that survived, both of which now serve as valuable archives of past environmental conditions. Toxic chemicals disrupt plant physiological processes [25,31,32,33], resulting in reduced radial growth increments, e.g., Refs. [34,35,36,37], and a decline in the uniformity of trees’ growth responses [38,39]. This pattern reflects the trees’ diminished sensitivity to climate, a fundamental natural driver [39,40].
The application of dendrochronological techniques to the study of urban trees has become increasingly common in recent decades [21,30,41,42,43,44,45]. This trend also extends to black locust (Robinia pseudoacacia L.), one of the species most frequently planted in cities. Numerous studies have examined its growth responses to diverse local climatic conditions [46,47,48,49,50,51,52,53,54,55]. Basal area increment (BAI) is a particularly informative growth metric for detecting long-term growth reductions caused by persistent environmental stressors. Under natural conditions, BAI typically follows an asymptotic growth trajectory, characterized by a rapid increase during early ontogenetic stages and a subsequent stabilization with increasing tree age (see [56]). In healthy, mature trees, BAI is not expected to decline unless growth becomes constrained by external stress factors. Therefore, a sustained decrease in BAI followed by a recovery phase can be interpreted as a signal of prolonged growth limitation rather than an age-related effect. Deviations from expected asymptotic trajectories remain a robust indicator of long-term growth stress when properly accounted for [57].
Robinia pseudoaccacia is generally regarded as tolerant of a wide spectrum of climatic conditions. Within its native range in North America, it occupies sites with highly varied habitat characteristics [58]. Owing to deliberate plantings, the species now occurs across most of the United States and Canada and has also been introduced to Asia. In Europe, where it was first planted in the 17th century, it has since spread widely, particularly in the southern part of the continent [59,60]. Future climatic conditions are expected to further facilitate its spread into Central and Northeastern Europe [61]. The ecological plasticity of black locust is largely attributable to symbiotic associations between its roots and nitrogen-fixing Rhizobium, which enable the assimilation of atmospheric nitrogen [62,63]. The species is commonly established on wastelands, post-fire areas, industrially degraded sites, and in urban green spaces [64]. Given its resistance to air pollution [65], black locust can serve as a sensitive bioindicator of changes in climatic conditions.
The aim of the study was to assess how changing thermal and pluvial conditions, together with long-term shifts in air pollution levels, influenced the basal area increment (BAI) of R. pseudoacacia growing in the urban environment of Kraków during the 1920–2019 period. By analyzing BAI as an indicator of tree vitality, the study sought to determine how this species responded to periods of rapidly rising industrial emissions, prolonged exposure to pollution, and subsequent emission reductions, as well as to changes in seasonal temperature and precipitation patterns. The objective was also to identify whether the sensitivity of R. pseudoacacia to these factors changed over time and to evaluate its potential stability and resilience as an urban tree species under evolving environmental conditions.

2. Materials and Methods

2.1. Study Area

2.1.1. Air Pollution in Kraków

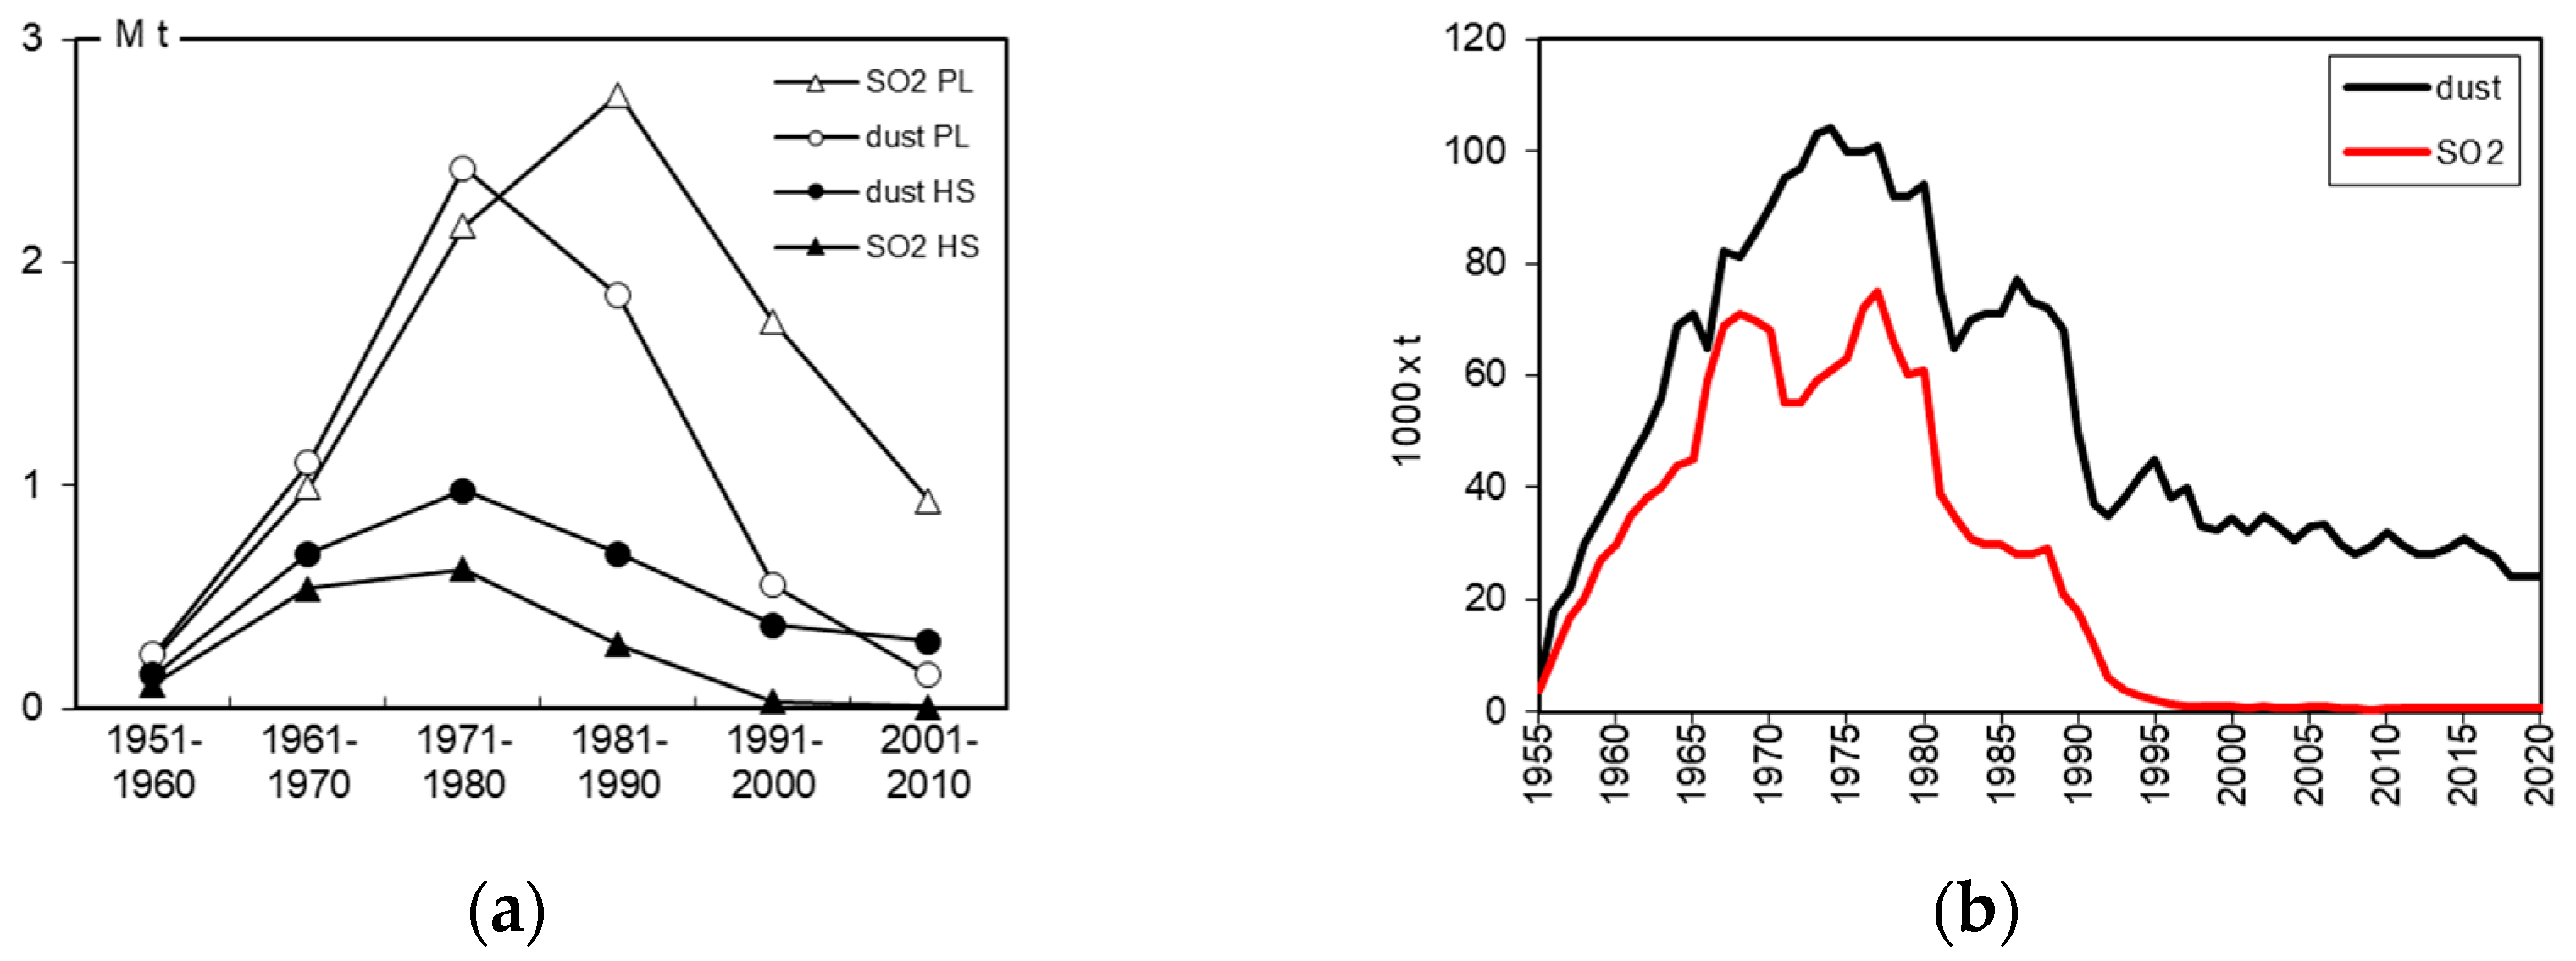
Kraków is located in an industrialized region of southern Poland. A period of rapid expansion of heavy industry and the energy sector occurred in Poland in the 1950s. This development was particularly pronounced in Silesia, situated west of Kraków, which formed a large industrial zone with numerous mines, processing plants, and steelworks (Figure 1). In the immediate vicinity of the city, to the east, Huta Sendzimira Metallurgical Plant (HS) was constructed in 1955. Further in this direction, chemical plants operated in the city of Tarnów. These industrial centers and facilities are positioned along the dominant west–east wind direction in the region, which places Kraków downwind of major emission sources. In addition, the city’s location in the Vistula River valley promotes frequent air stagnation, enhancing the accumulation of airborne pollutants. With industrial expansion in the second half of the 20th century, emissions and ambient concentrations of industrial pollutants increased substantially and continued to rise until the late 1980s, to which Kraków was particularly exposed. The highest level of air pollution in the city occurred in the 1970s and 1980s, when industrial production and emissions from the HS reached their peak (Figure 2). In the early 1990s, following systemic transformation, the closure of many industrial facilities, and the introduction of cleaner technologies, pollution levels began to decline and have continued to do so to the present day (Figure 2).

2.1.2. Climate Characteristics

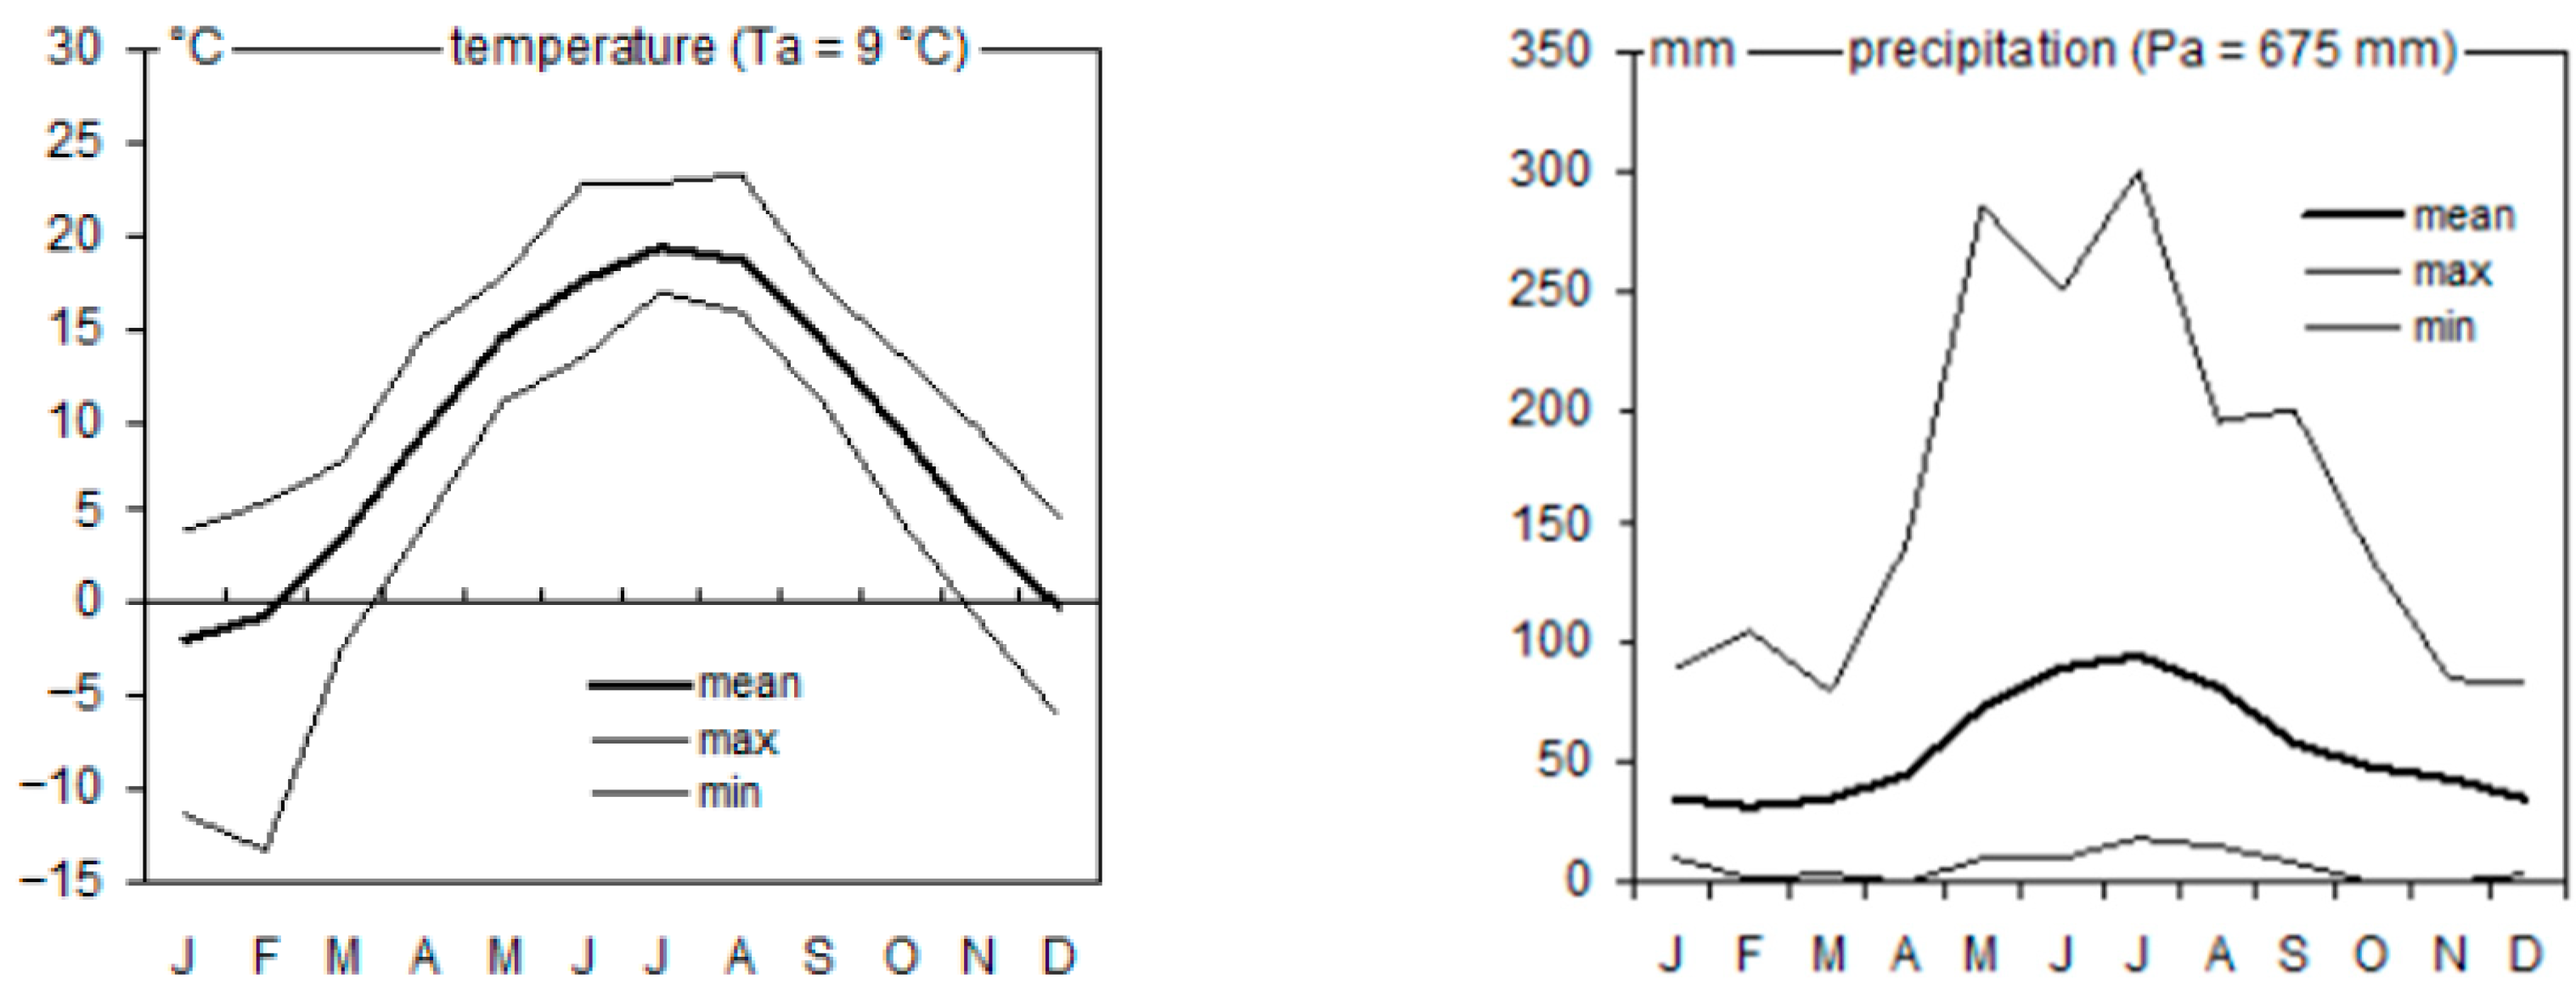
The annual precipitation total in Kraków is 675 mm, and the mean annual air temperature is 9.0 °C (1951–2020). The greatest year-to-year variability in monthly precipitation totals occurs during the summer months, whereas mean air temperature shows the greatest variability in winter (Figure 3). July is the warmest month and also the one with the highest precipitation. January is the coldest month, while the lowest precipitation totals are recorded in February. During the winter season (November–March), average monthly temperatures in Kraków often fall below 0 °C. Within the analyzed period, there are years in which monthly precipitation totals are very low or absent altogether (February, April, October, and November).
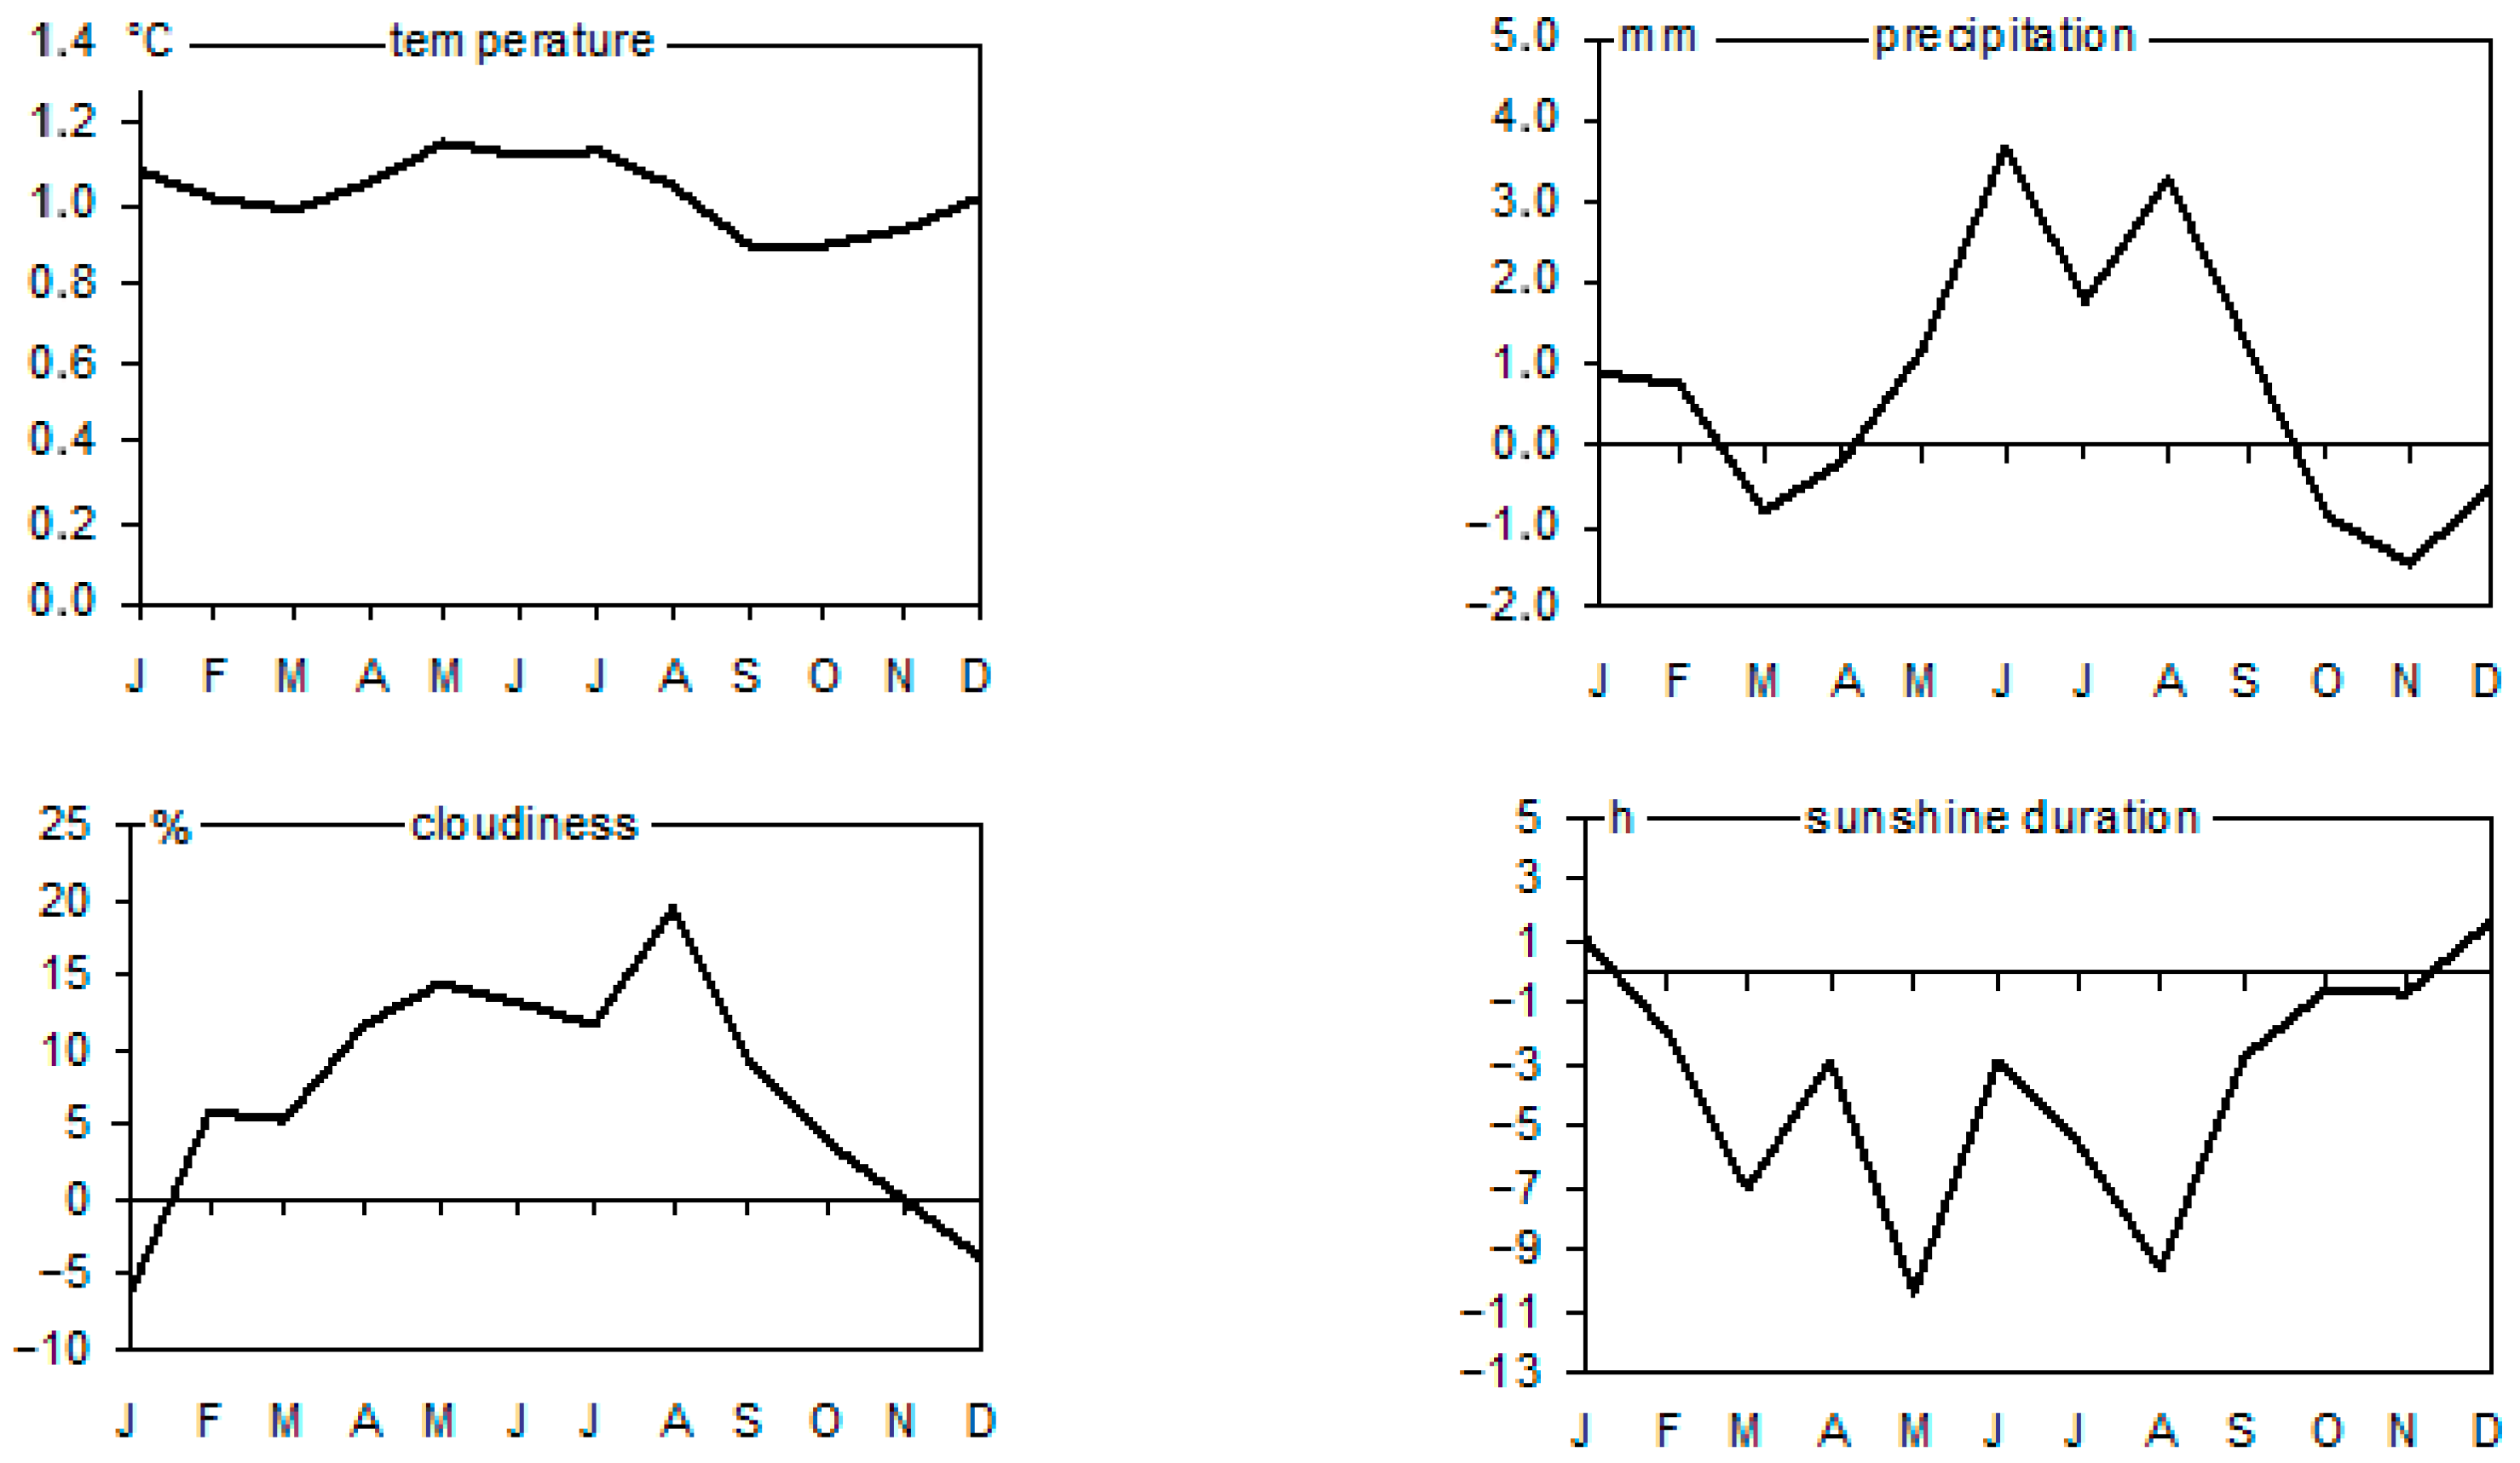
To compare meteorological conditions within the city and its surrounding non-urban areas, meteorological data from government-operated stations of the Institute of Meteorology and Water Management—National Research Institute (IMGW-PIB) were used. Differences in mean monthly air temperatures and monthly precipitation totals between the station located in the central part of Kraków (JU) and the one situated outside the city (Balice; Figure 4) indicate that Kraków’s climate is clearly warmer than that of its surroundings throughout the entire year, on average, by more than 1 °C. Precipitation during the growing season (May–September) is also higher within the city, by approximately 3 mm on average. This may result from increased cloudiness associated with elevated concentrations of air pollutants, which act as condensation nuclei. Consequently, sunshine duration in the urban area is markedly lower (Figure 4).
Over the past 100 years, Kraków has experienced an increase in mean air temperature for every month of the year (Table 1). The largest rise in mean temperature was recorded for February (3.2 °C), while the smallest occurred for September (0.3 °C). For most months, an increase in monthly precipitation totals was also observed (Table 1). The greatest increase in precipitation was recorded for May (26.4 mm), whereas the largest decrease occurred for August (−8.6 mm). Overall, Kraków has become progressively warmer over the last century, while precipitation has remained relatively stable, with a slight upward trend mainly in the winter–spring season (Table 1).

2.2. Dendrochronological Data

The studied black locust trees are located in Polish Airmen Park, an urban park in the eastern-central part of Kraków (Figure 1). The sampled trees were approximately 125 years old, dominant, and showed no visible symptoms of disease or decline. The trees were planted at the beginning of the 20th century on the slopes of the earthen embankments supporting the defensive walls of the fort that protected Kraków’s eastern flank at the time. Before planting, these embankments were overlaid with a layer of fertile alluvial soil taken from nearby river floodplains to enhance rooting and subsequent growth of trees.
Twenty trees were selected for the analysis. Two increment cores per tree were extracted from each tree at breast height (~1.30 m above the ground) with a Pressler increment borer. Ring widths were measured to the nearest 0.01 mm. The obtained tree-ring width series of each tree was verified and dated using the COFECHA program (6.06, Tree-Ring Lab (TRL)) [66]. Then, for each tree-ring width series, the annual basal area increments (BAI) were calculated as the difference in the cross-sectional area between two successive tree rings. BAI expresses how much new wood (basal area) was added by the tree in each year of its life. This measure serves as an effective metric for tracking growth dynamics at both the single-tree and stand scales [56,67].
A site BAI chronology was developed by averaging the individual-tree BAI series. In addition, an indexed BAI chronology (BAII) was produced from the BAI series after applying a two-step detrending procedure: (i) fitting either a negative exponential curve or a linear regression, and (ii) applying a spline equal to two-thirds of the series length with a 50% frequency cutoff. Autocorrelation was subsequently removed. All procedures were carried out using the ARSTAN program (ARS44h2 xp, Tree-Ring Lab (TRL)) [68].

2.3. Meteorological Data

Meteorological data used in the study were obtained from the Jagiellonian University meteorological station located in central Kraków (JU, Figure 1) and from the Balice station, located outside the city, about 10 km from the study site. The records cover the period 1920–2020 and include monthly mean air temperature, monthly precipitation totals, sunshine duration, and cloud cover. Data from JU station were used for the climate–growth relationship analysis, whereas data from the Balice station were used to assess differences in climatic conditions between the urban area and its surroundings. Additionally, in order to assess water availability conditions during the analyzed period, the SPEI index (Standardized Precipitation–Evapotranspiration Index; [69]) was used.

2.4. Data Analysis

Rbar (the mean inter-series correlation), SNR (signal-to-noise ratio), and EPS (expressed population signal), calculated in a 31-year running window, were used to assess tree-to-tree growth coherence and the quality of the resulting BAII chronology. Rbar was used to quantify the variance shared among the indexed BAI series [70]. SNR was calculated to express the ratio between the common growth signal and background noise, providing a measure of signal strength within the chronology. EPS, which measures how well the chronology represents the theoretical population chronology, was used as an overall indicator of chronology quality [70,71].
Pointer-year analysis was used to determine the key climatic drivers of black locust growth. For each year, the percentage of trees showing a particular growth response (an increase or decrease in the BAI index relative to the previous year) was calculated. A given year was classified as a pointer year (positive or negative) when at least 90% of the trees exhibited the same growth response [72,73]. Climatic conditions (monthly values of mean temperatures and precipitation totals, from July of the previous year to October of the current year) in positive and negative pointer years were then compared to identify which climatic factors exert the strongest influence on black locust growth.
The climate–growth relationship analysis was then carried out to examine the association between the identified significant climatic factors and tree-ring growth (BAII chronology), using bootstrapped correlations calculated in a 31-year moving window. The analysis was performed for the period 1920–2019, in DendroClim2002 [74].

3. Results

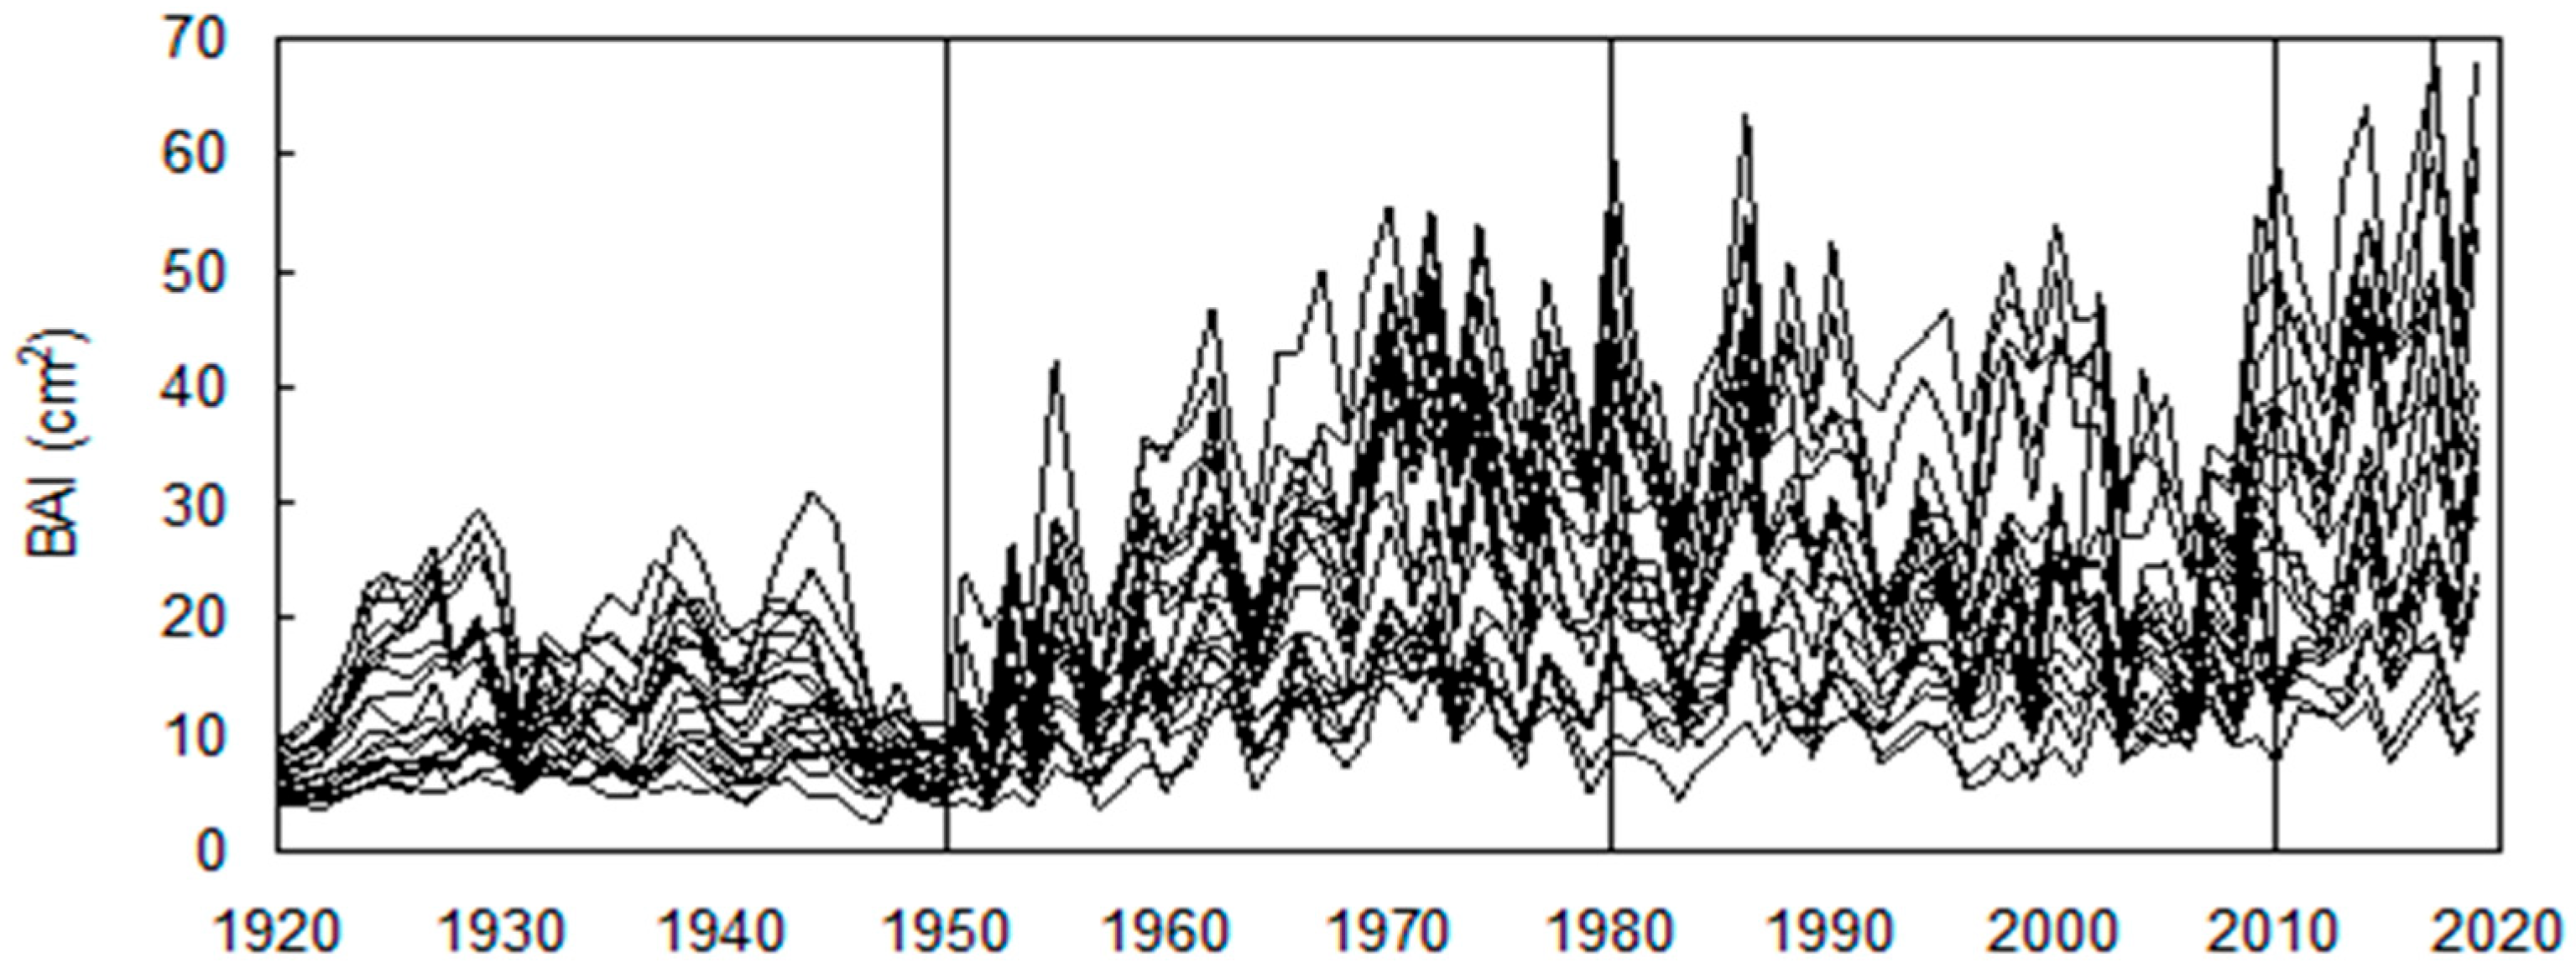
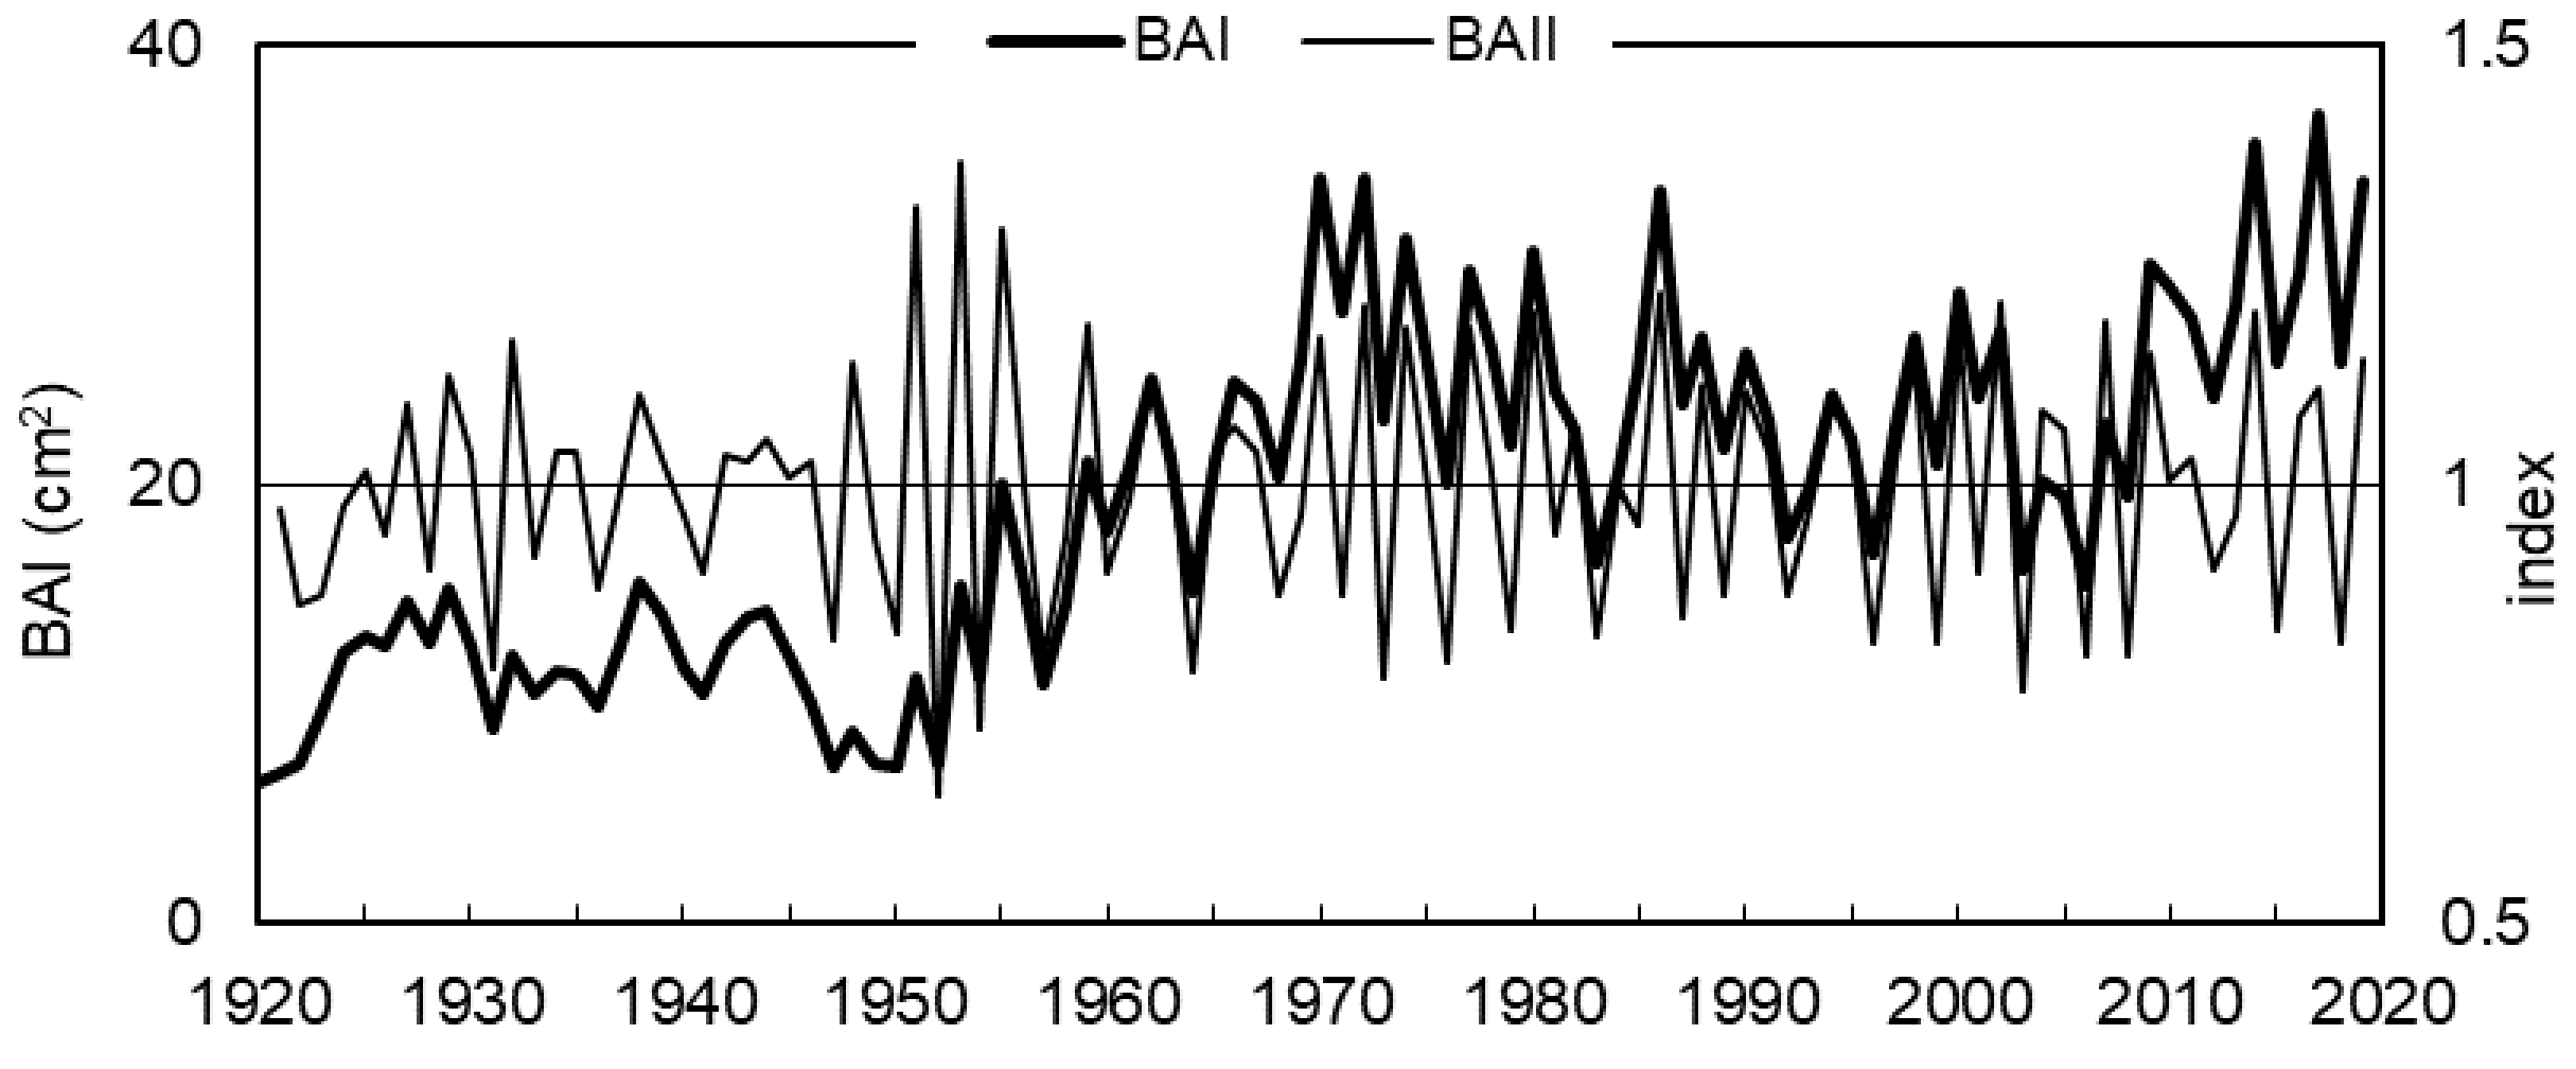
The studied black locust trees have grown in open space since their establishment, under loose stand conditions and full light availability. This is not a commercial stand, densely planted, where maintenance pruning can cause additional growth due to exposure of the stand (from thinning). Interestingly, their basal area increment (BAI) remained very low during the first 40 years of growth. A rapid increase in BAI began only in the early 1950s and continued until the late 1970s (Figure 5). This period coincided with a strong rise in industrial emissions and, consequently, ambient concentrations of pollutants (Figure 2). In the 1990s, industrial emissions declined; BAI values also decreased, and then stabilized at a steady level (Figure 5 and Figure 6). Superimposed on these long-term trends, a pronounced year-to-year variability in BAI is also evident, driven primarily by interannual fluctuations in weather conditions (Figure 5). The long- and short-term changes described above are similar across all trees (Figure 5) and are clearly reflected in the site BAI chronology (Figure 6).
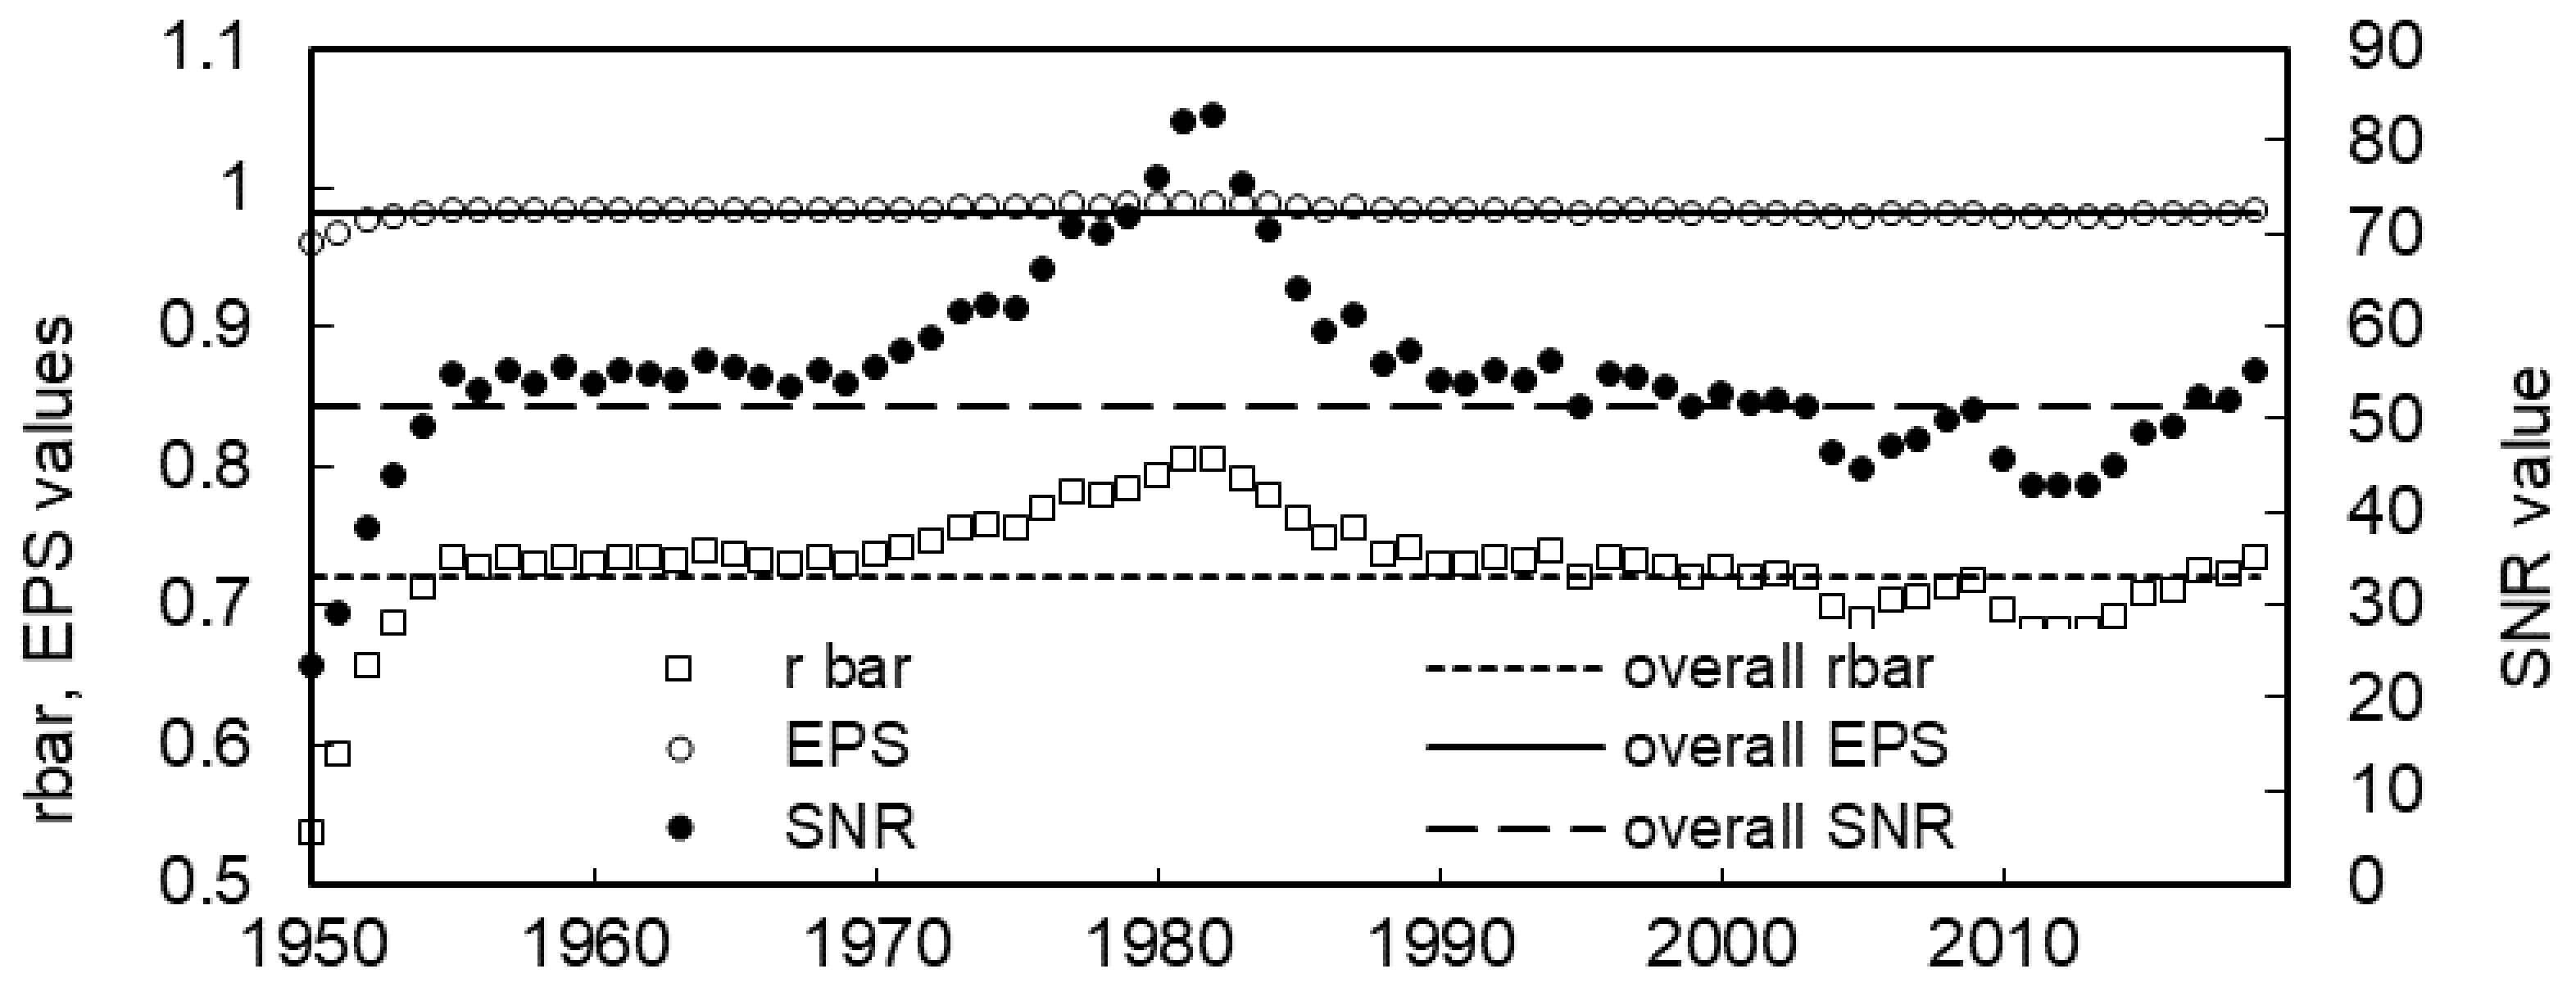
The first-order autocorrelation (AC1) of the site BAI chronology is 0.819, whereas for the indexed chronology (BAII), it is 0.026. Thus, indexing effectively reduced long-term variability that existed in the BAI chronology (Figure 6) as well as the influence of the previous year’s BAI on the current year’s growth. Calculated for the indexed BAI series values of the running mean inter-series correlation (rbar), the signal-to-noise ratio (SNR) and the expressed population signal (EPS) exhibited substantial variability throughout the analyzed period (Figure 7). During the period of rapidly increasing BAI, the homogeneity of the trees’ growth responses (rbar) and the strength of the climatic signal (SNR) increased (cf. Figure 2 and Figure 7). The rbar and SNR indices reached their highest values in the late 1970s and early 1980s, coinciding with the period of maximum industrial emissions (Figure 2 and Figure 7). From the early 1980s, a decline in rbar and SNR values is observed; however, they still remained at high levels until the end of the analyzed period (Figure 5, Figure 6 and Figure 7).
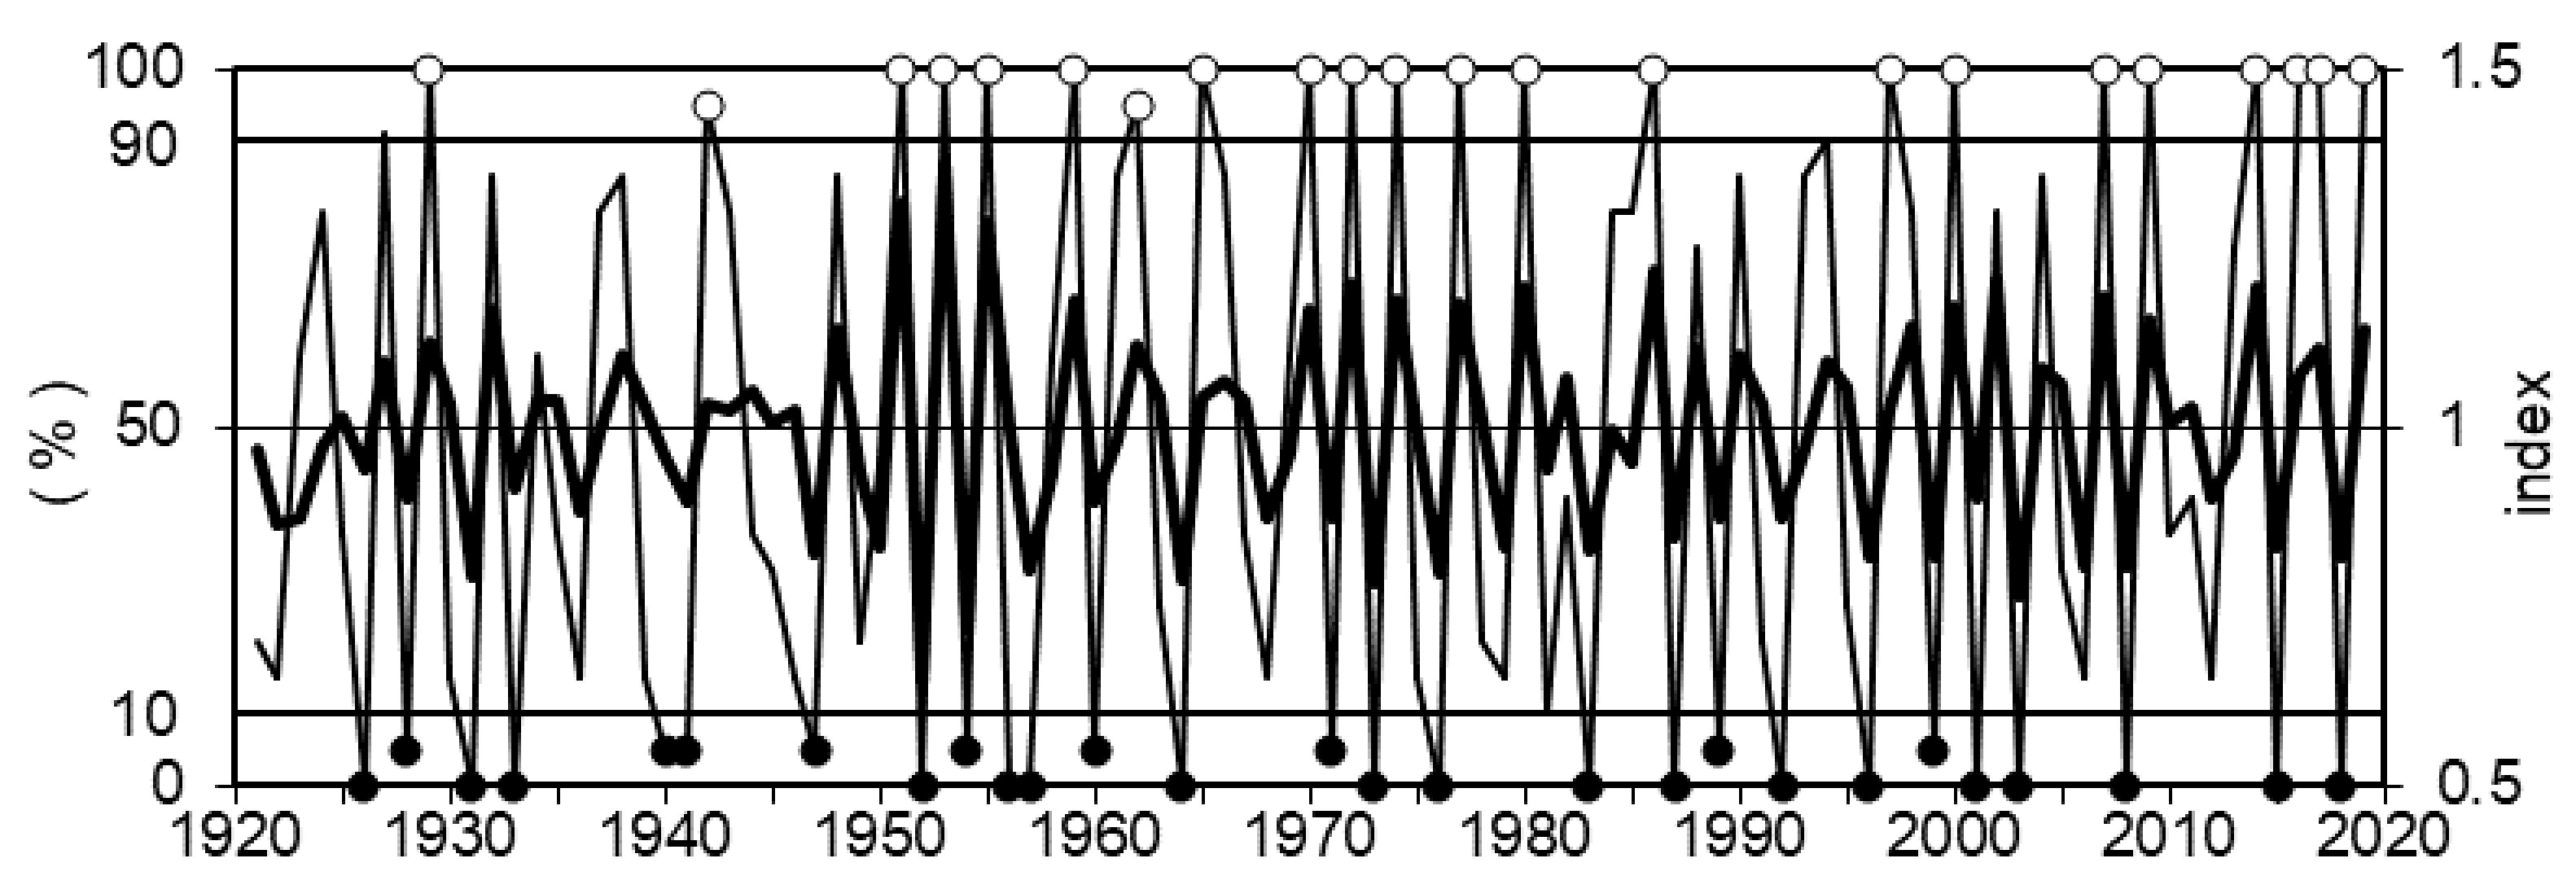
The pointer year analysis identified 22 positive and 27 negative years. The relatively high number of pointer years (49% of all analyzed years; Figure 8) indicates strong synchrony in the year-to-year variability of BAI within the studied tree population, consistent with the high rbar values reported earlier. A particularly large number of both positive and negative pointer years occurs between 1950 and 1990, which corresponds to the period of high industrial emissions. Moreover, in positive pointer years, nearly all trees exhibited a strong increase in BAI relative to the preceding year, whereas in negative years, almost all trees showed a marked reduction in BAI (Figure 8).
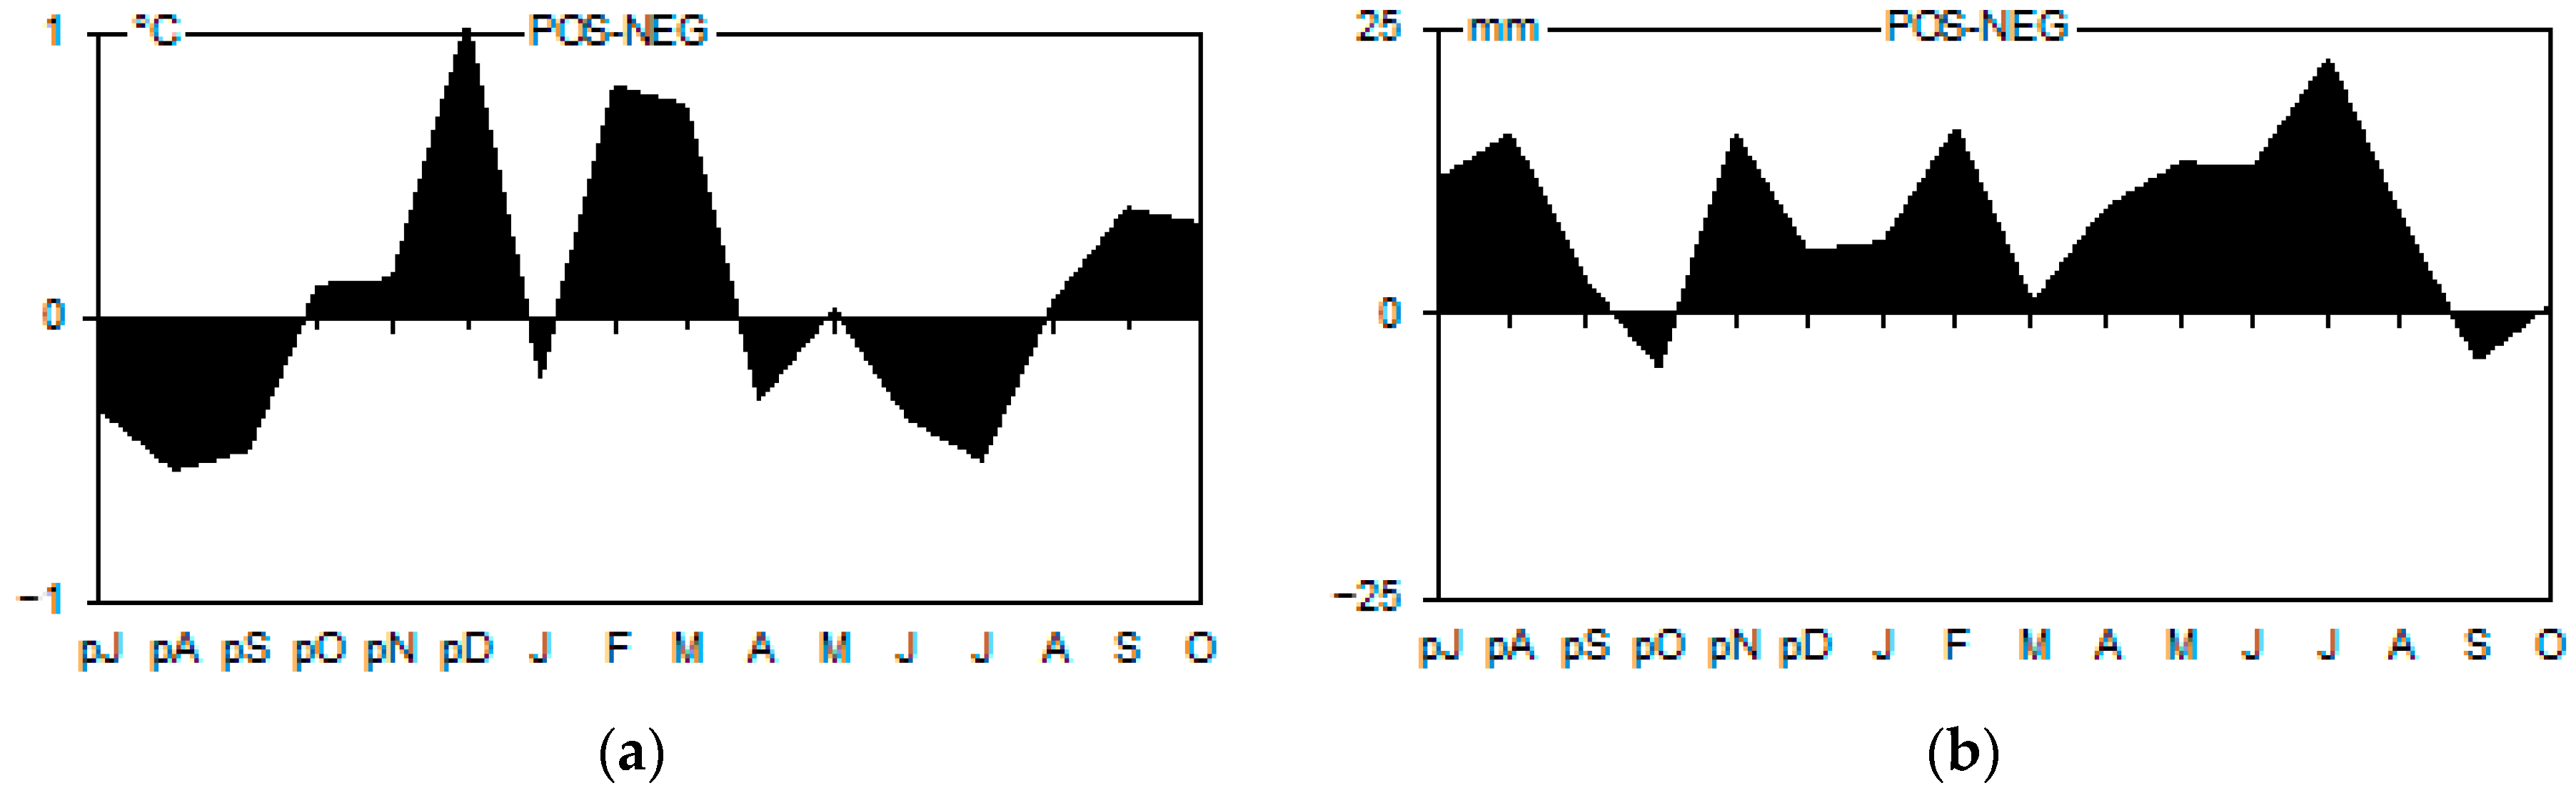
Positive pointer years, compared to negative ones, were characterized by high precipitation and low temperatures during the previous summer (July–September); high winter temperatures (December, February, March); high precipitation from November to February and from April to August; low summer temperatures (June–July) in the year of ring formation; and high temperatures at the transition from summer to autumn (September–October) (Figure 9).
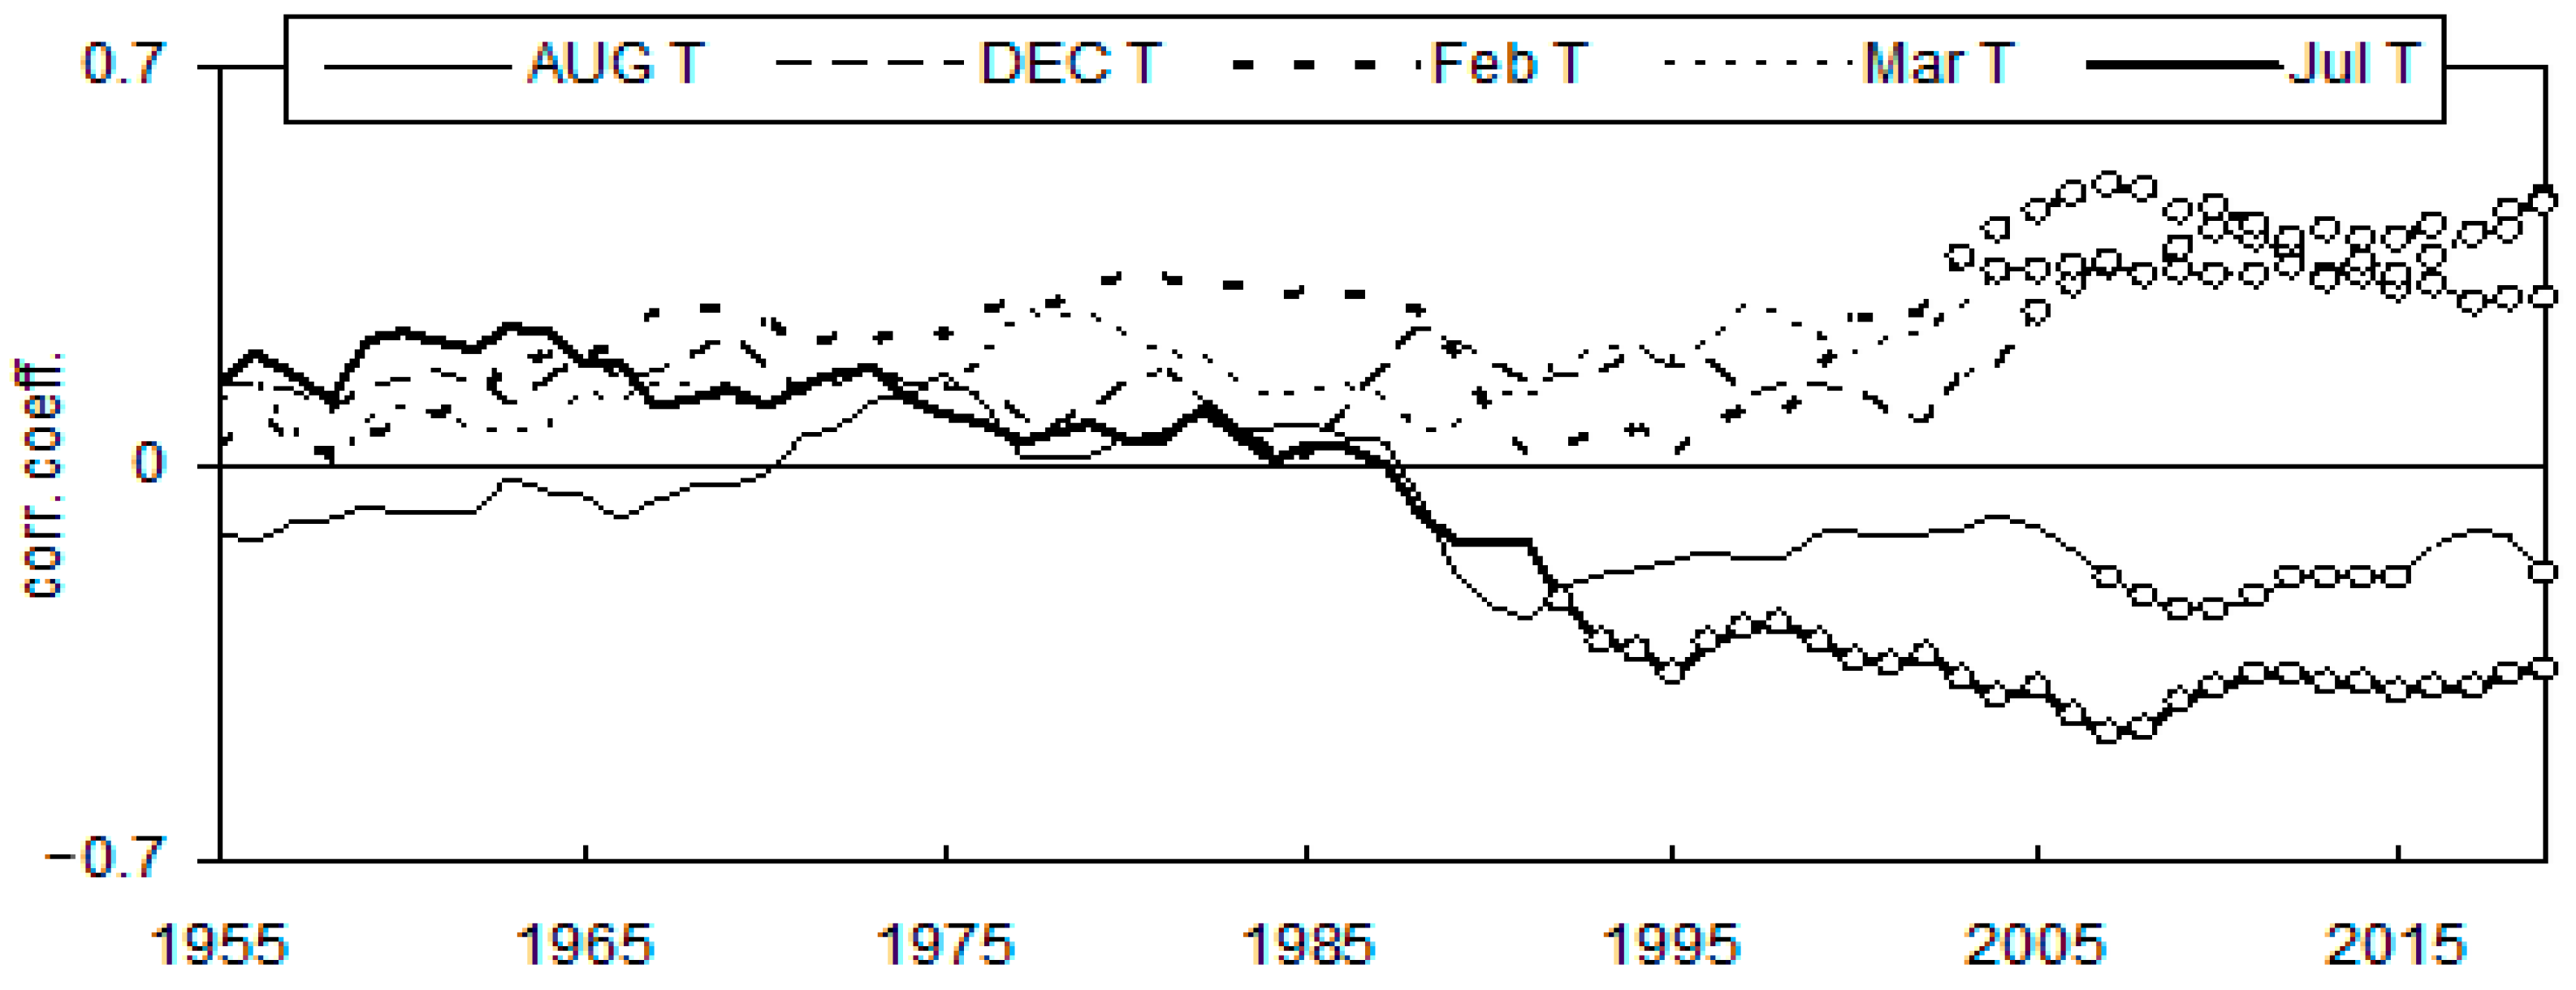
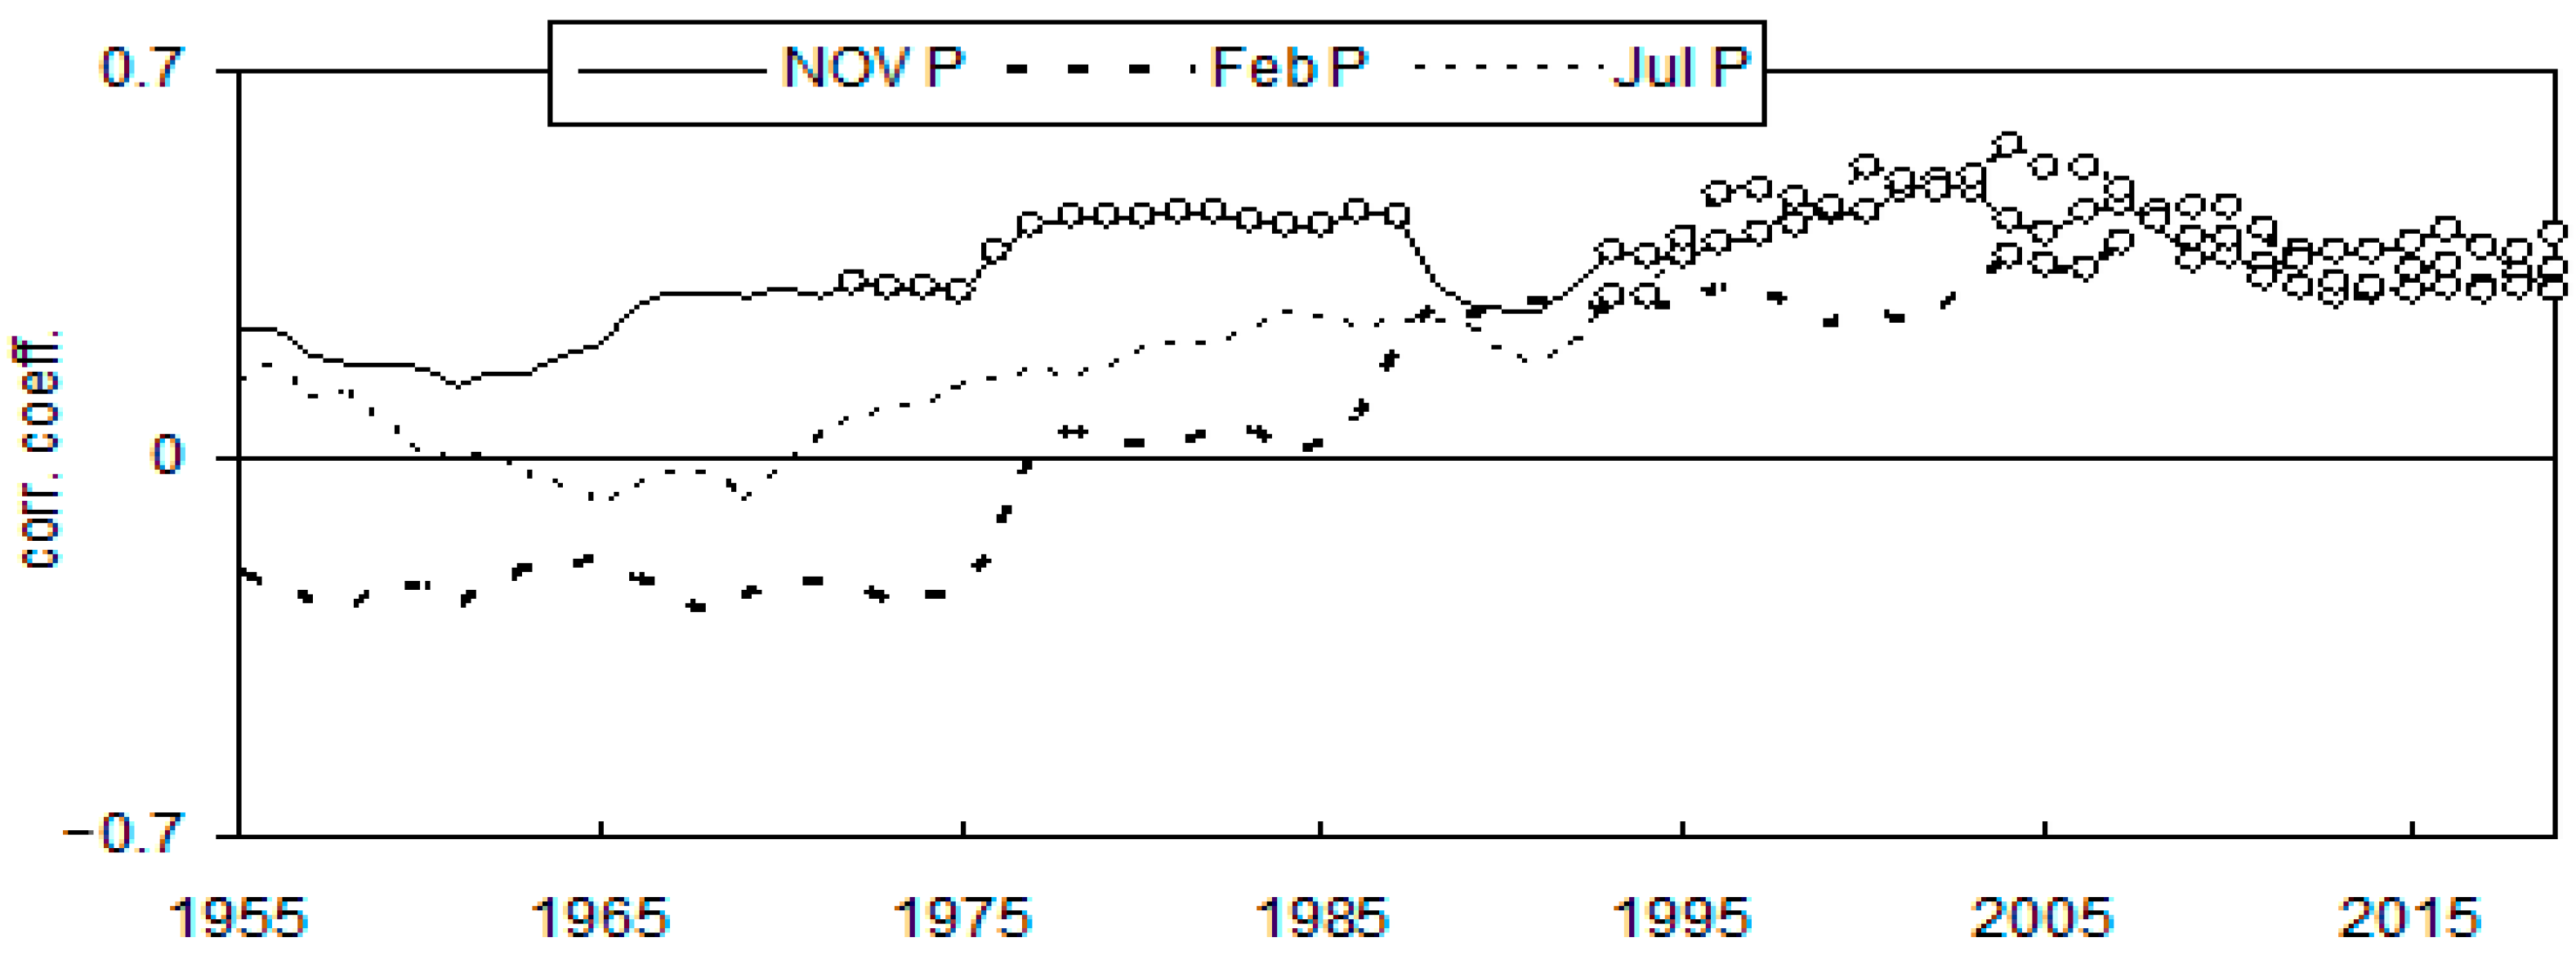
The analysis of climate–growth relationships was carried out for those climatic factors that showed the greatest differences between positive and negative pointer years (Figure 9). For air temperature, these factors included August and December of the year preceding tree-ring formation, and February, March, and July of the year in which the tree ring was formed. For precipitation, the key months were November of the previous year and February and July of the year of tree-ring formation (Figure 9). The analysis revealed clear temporal changes in both the strength and direction of the correlations between BAI and the climatic factors identified above. In recent decades, the positive correlation between BAI and temperatures for December of the preceding year, as well as for February and March of the year of tree-ring formation, has strengthened and become significant. In contrast, correlations with summer temperatures—namely for August of the previous year and for July of the year of tree-ring formation—have become negative and strong, particularly for July. All correlations with precipitation have become positive, significant, and relatively strong (Figure 10).

4. Discussion

4.1. R. pseudoacacia Growth Under Industrial Pollution and Urban Environmental Stress

Because of its observed tolerance to industrial pollution, R. pseudoacacia has often been planted on industrially degraded sites for reclamation purposes [65]. According to [75], the rapid growth of black locust resulting from the formation of juvenile wood occurs during the first 15 years of cambial activity. In analyzed trees, weak growth was observed during the first 40 years after planting. This may be related to the substrate on which they grew: as the roots developed, they encountered a layer of anthropogenic soils, which likely inhibited root system development [76]. As a result, the establishment of mycorrhizal associations and bacterial symbioses (Rhizobium), essential for the optimal growth of R. pseudoacacia, was substantially hindered. Similar findings have been reported from studies conducted in other urbanized locations [77,78], where the poor growth of black locust was primarily attributed to unfavorable soil conditions. An unpolluted rhizosphere promotes the development of root-nodule bacteria (Rhizobium) that fix atmospheric nitrogen and make it available to black locust [62,63]. However, Rhizobium does not develop in soils that are strongly acidified by sulfur-containing deposition. Industrial pollution also leads to the accumulation of heavy metals in the soil, which is likewise harmful to soil biota [65].
The presence of harmful substances in air and soil typically reduces tree vitality, leading to a decline not only in the divisional activity of the vascular cambium but also in the homogeneity of annual growth responses [29,38,40,69]. Moreover, trees that are sensitive to pollution tend to exhibit weaker responses to interannual climatic variability [40]. The increasing emissions from industrial facilities surrounding Kraków (including the nearby metallurgical plant), which had been rising since the mid-1950s, reached their peak in the late 1970s and early 1980s (Figure 2). Under such conditions, the growth of the black locust trees examined in our study should have been markedly reduced in the following decades.
However, from the 1950s to the 1970s, both the basal area increment of the black locust trees we examined and the homogeneity of their year-to-year growth responses increased (Figure 6 and Figure 7). The pollution-induced stress may potentially have been partly mitigated by the elevated atmospheric nitrogen input associated with industry and urban emissions. The industrialized region of southern Poland, including the area where Kraków is located, has historically been particularly susceptible to enhanced nitrogen deposition [79,80]. Such inputs could be converted into bioavailable forms through rhizobacterial activity and may then be taken up by black locust. Urban soils tend to become alkaline due to the weathering of incorporated construction debris [2,64]. This type of soil occurs at this location [81]. Although acidification resulting from the wet deposition of sulfur oxides can negatively affect rhizobacterial communities, the anthropogenic character of the deeper soil layers likely buffered acidic inputs, thereby creating more favorable conditions for soil microorganisms. Additionally, black locust sheds its leaves at the end of each growing season, thereby removing pollutants accumulated on the surface of the assimilation apparatus [82]. It is also noteworthy that the studied trees experienced no competition throughout their lifetime, ensuring unrestricted access to direct sunlight and water.
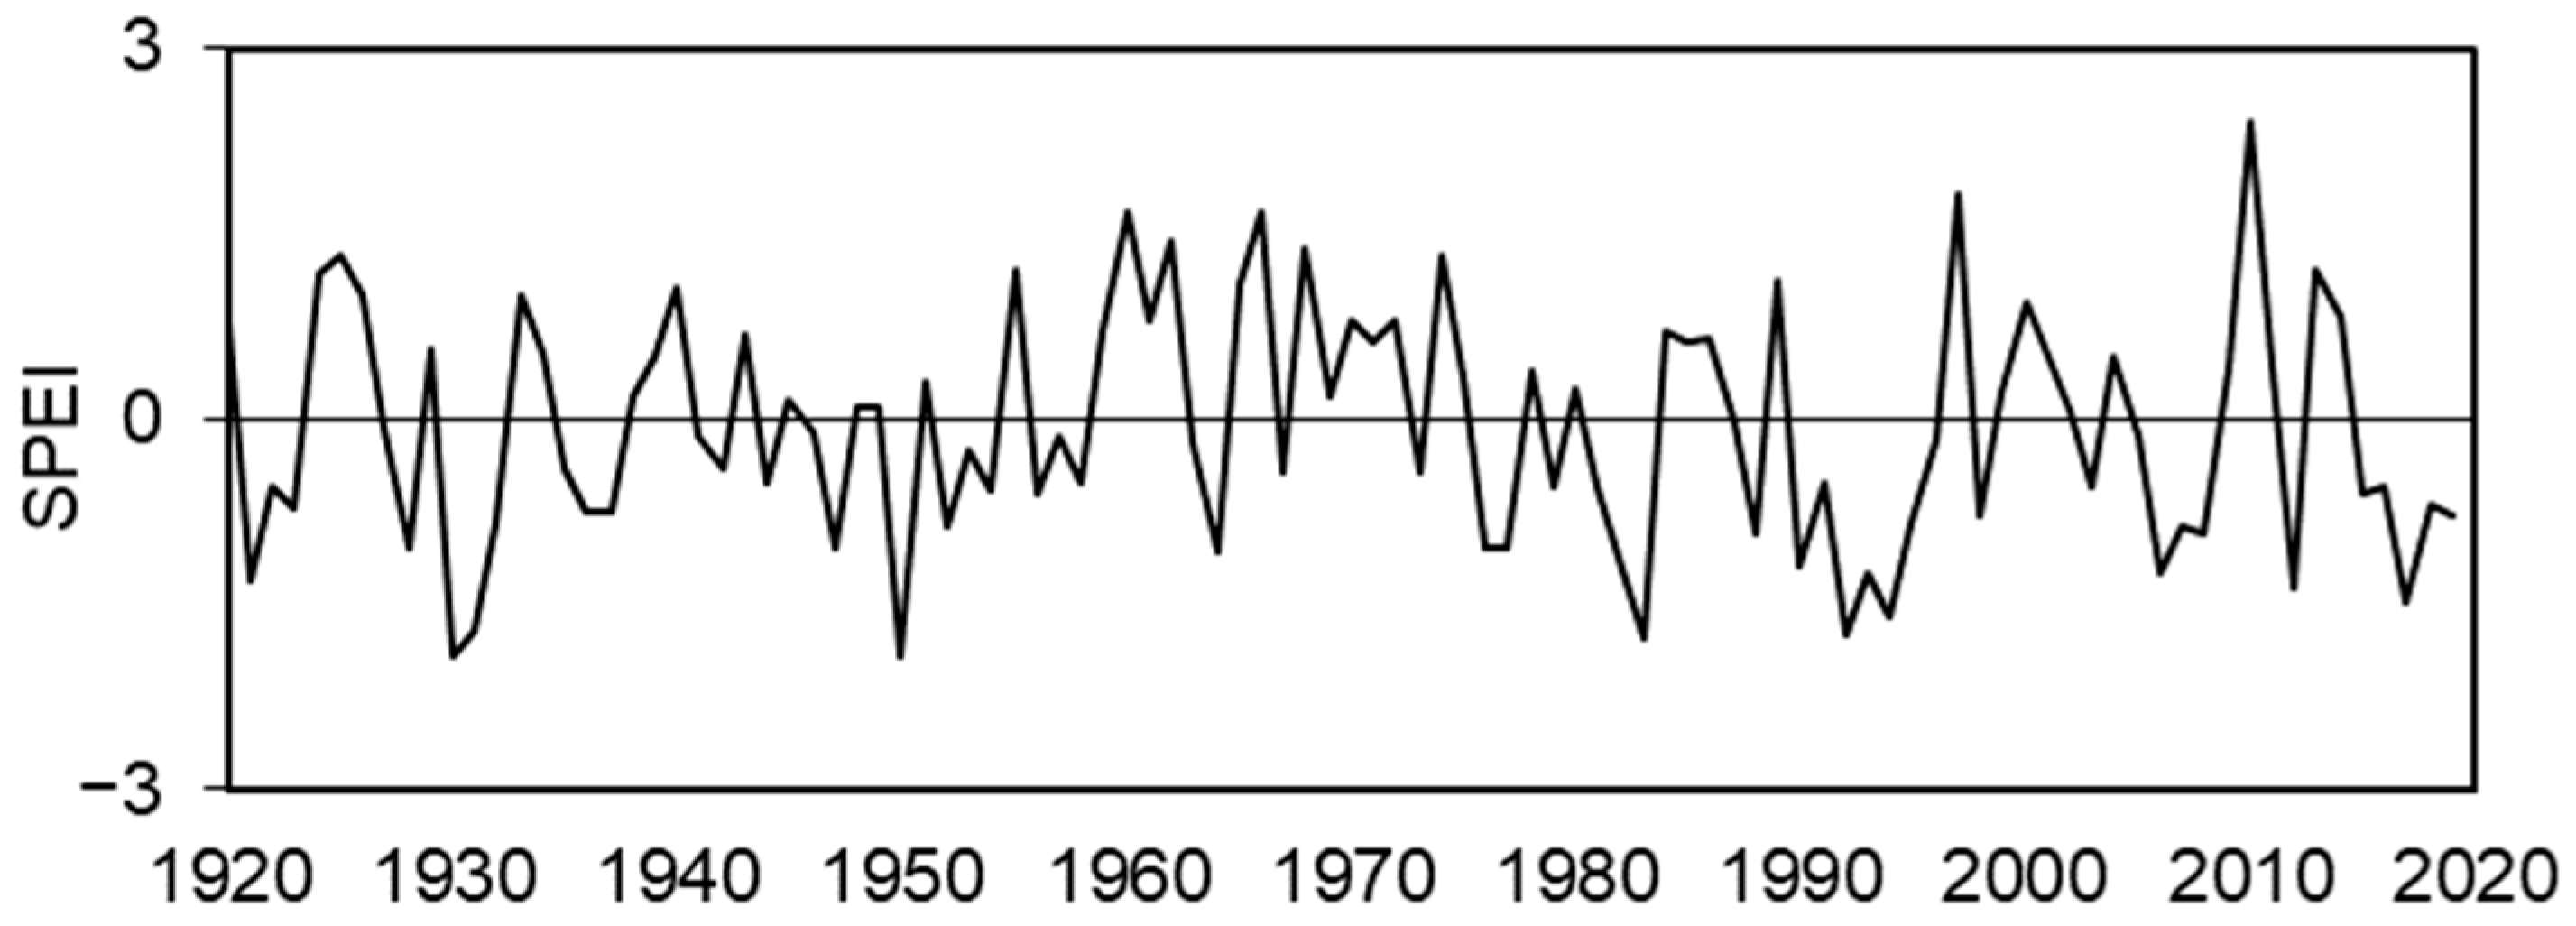
In the early 1980s, following the peak period of industrial emissions, the black locust trees began to reduce their wood increment (Figure 6), and both the homogeneity of their growth responses (rbar) and the strength of the climatic signal (SNR) in the BAII chronology declined (Figure 7). This may suggest that the trees responded to pollution pressure with a certain delay. However, a negative impact of drought on black locust growth cannot be excluded. Although the SPEI does not indicate a prolonged drought period during the early part of the study interval, this period is characterized by pronounced interannual variability in growth response. In 1983, an exceptionally severe drought occurred, which is reflected in a sharp decline in the BAI index. Prolonged drought conditions emerged later, mainly during the 1990s, and may have been associated with the observed strong decrease in BAI. After 2010, the growth and the above-mentioned chronology quality metrics again showed an increasing tendency (Figure 6 and Figure 7), suggesting a renewed improvement in tree vitality. Interestingly, this recovery phase coincides with a pronounced multi-year drought period in the late 2010s, as indicated by SPEI. This pattern suggests a generally limited impact of drought on black locust growth, which is consistent with the relative drought tolerance and adaptive water-use strategies of this species [83,84]. The improvement in tree vitality observed over the last decade may therefore be associated with reductions in emissions and increasingly favorable climatic conditions, including warmer and shorter winters (see section below). It is also possible that elevated atmospheric CO2 concentrations may have influenced tree growth. However, this interpretation is questioned by Chen et al. [85], who argue that the positive effect of elevated CO2 on tree growth clearly diminishes with increasing tree age (Figure 11).

4.2. Influence of Temperature and Precipitation on the Growth of R. pseudoaccacia

The dependence of tree wood production on climatic factors is not limited to the current season of cambial activity [20]. Zweifel et al. [86] argue that ring-porous tree species, including black locust, rely strongly on carbohydrate reserves accumulated during the previous year. The growth of the studied black locust trees was largely influenced by climatic conditions in the preceding year (Figure 9). The trees produced more wood when the second half of the previous summer was cool and wet. Similar findings were reported by Nola et al. [55] and Kalbarczyk and Ziemiańska [53,54]. Under such weather conditions, trees accumulate surplus sugars in parenchyma cells, which can be used during the subsequent winter and spring [87]. Precipitation, the associated cloudiness, and low air temperatures at the end of the growing season provide a signal for the cessation of vascular cambium activity. However, the photosynthetic apparatus continues to operate, allowing the accumulation of carbohydrate reserves to proceed, which in turn promotes the formation of large-diameter vessels at the beginning of the next growing season [88,89,90]. Moreover, Pérez-de-Lis et al. [91] indicate that low concentrations of sugars stored in parenchyma cells at the end of summer may limit vessel formation and delay budburst, thereby reducing the production of auxins that stimulate vascular cambium division at the onset of the next growing season. Our results show that high precipitation in the autumn of the year preceding tree-ring formation, as well as during winter, enhanced wood increment (Figure 9). These findings are consistent with previous studies on black locust [49,54].
Precipitation occurring in autumn and winter increases soil water availability, which facilitates the development of the root system [87]. The size of the active root system influences the growth potential of a tree in the following growing season. Trees growing in water-saturated soils are also more resistant to winter temperature drops. Reference [92] likewise indicates that trees actively utilize the soil water reserves accumulated during autumn and winter. Winter precipitation therefore increases soil water storage at the onset of the growing season. Water stored in the soil during winter enables trees to tolerate frequent precipitation deficits at the beginning of the growing season. This directly affects the rate and quality of biochemical processes in trees, as well as photosynthesis and the regulation of transpiration. This is particularly important for urban trees, whose root systems often do not reach groundwater levels. R. pseudoacacia typically produces a large number of vessels with relatively small diameters, which protects it from embolism caused by frost events and drought [55]. According to [93], black locust growing in the city area had markedly reduced growth during drought periods, but recovered rapidly after rainfall events, demonstrating high resilience to soil water deficits [49,54]. Vítková et al. [94] further indicate that R. pseudoacacia is sensitive to soil hypoxia. Consequently, vessel size may be limited by excessive winter precipitation, which can induce soil and root oxygen deficiency. This, in turn, constrains the allocation of carbohydrates to the vascular cambium due to increased root consumption [55,95]. In the studied black locust, the effect of late-winter precipitation (February) on annual growth shifted from negative at the beginning of the analysis period to positive and strong in the most recent decades (Figure 10). This may indicate increasing water deficits at the beginning of the growing season, which negatively impact tree growth.
The studied black locust trees showed reduced growth in years with precipitation deficits between April and August, particularly in July of the year of tree-ring formation (Figure 9 and Figure 10). Similar results were reported by [49,53,54,55,58,59]. Water shortage during the growing season disrupts the activity of the vascular cambium and the rate of xylem cell enlargement [96,97]. Under such conditions, cavitation in the xylem frequently occurred, leading to mechanical damage to cells through embolism [19]. These findings are also supported by studies of various temperate tree species [98,99,100]. Soil water availability enables trees to produce larger vessels, ultimately enhancing wood formation [101,102]. High precipitation during the growing season and increased air humidity intensify water flow into cells, raising turgor pressure on the cell wall, which promotes cell expansion and xylem production [103,104]. In black locust growing in the warm and humid climate of northern Italy, Nola et al. found no statistically significant effect of growing-season precipitation on tree-ring width [55]. Black locust is also suitable for relatively dry sites [94]. R. pseudoacacia shows considerable drought tolerance due to leaf and root traits that confer high ecophysiological performance and morphological plasticity, allowing effective adaptation to adverse drought conditions [105,106]. Nola et al. observed that heat and associated drought often did not affect vessel size in black locust because earlywood formation occurs earlier in the season [55]. However, high temperatures reduce transpiration, water uptake, and photosynthesis due to stomatal closure, which ultimately decreases wood production [55,107]. Nola et al. suggest that an expected increase in drought frequency may not have strongly negative effects on black locust [55]. In recent decades, an increased sensitivity of black locust to water availability in July has become apparent (Figure 10). This suggests that water availability in this hottest summer month may be becoming increasingly limiting for the species.
Sensitivity of black locust growing in Poland to winter temperatures was reported by Feliksik et al. [49] and Kalbarczyk and Ziemiańska [54]. Our results indicate that February and March temperatures were important factors for the growth of studied black locust (Figure 9). Temperatures during this time of the year determine the onset and duration of the growing season—higher values lead to earlier initiation of physiological and biochemical processes in trees and earlier reactivation of cambial division [108,109,110]. Air temperature from late winter to early spring affects physiological processes associated with the onset of cambial cell production and xylem cell differentiation [110]. Thus, increased late-winter temperatures may lead to earlier dormancy release and an extended growing season [111]. On the other hand, delayed onset of growth processes and the production of smaller vessels represent a strategy of black locust to minimize the risk of frost-induced embolism at the beginning of the growing season [112] and to reduce the risk of drought-induced cavitation later in the season [55]. Higher winter temperatures increase the sensitivity of cells to auxin, resulting in earlier and faster vessel differentiation [113]. Adverse effects of low temperatures may be related to frost damage to fine roots, which can limit nutrient uptake in the subsequent growing season [114]. Moreover, low soil temperatures and frozen soil water prevent water uptake by the root system, potentially leading to frost desiccation [115]. In light of the above, projected increases in winter air temperatures [116] and the ongoing extension of the growing season in Poland [117] may therefore enhance growth in many tree species, including black locust. This is supported by the observed strengthening of the positive effect of late-winter and early-spring temperatures in the studied trees (Figure 10). However, another aspect to consider is that higher winter temperatures increase respiration rates, leading to the consumption of stored reserves that are crucial for the early formation of large-diameter vessels [87,118].
Photosynthesis and cambial division may continue into September, and even into October in some species, provided that temperatures remain sufficiently high and soil water availability is adequate [119]. Cambial cells associated with the first vessel elements can also be formed toward the end of the growing season under favorable weather conditions [120]. In addition, photosynthates may continue to be used for the formation of the current tree ring [121]. These findings may partially explain the positive influence of higher September and October temperatures on wood increment observed in the black locust trees studied here.
The relationship between radial growth and climatic parameters is known to shift over time, e.g., Refs. [29,40,122]. In the black locust trees examined here, the influence of winter temperatures and the temperatures of the previous and current summer, as well as precipitation in the previous autumn and current winter and summer, showed pronounced temporal changes (Figure 10). In contrast, studies from northern Italy reported relatively stable responses to previous summer and autumn conditions, with major temporal shifts occurring primarily in the December–March period [55]. For the studied black locust trees, the relationships between growth and the key climatic factors have become particularly strong in recent decades. These relationships suggest that increasingly warmer summers and reduced precipitation in the previous autumn, late winter, and summer are likely to negatively affect the growth of black locust. On the other hand, winter warming may enhance the growth potential and competitive performance of R. pseudoacacia, consistent with findings from other regions [55,123,124]. The currently observed increase in growing season temperatures may be amplified by the urban heat island effect (Figure 4) and may additionally negatively affect tree growth by enhancing nighttime respiration and limiting photosynthesis during the day. It is also important to consider the indirect effects of climate change, as warming promotes the expansion and activity of pathogens and pests, potentially increasing the vulnerability of black locust in cities [125].
Urban environments are characterized by high spatial and environmental heterogeneity, which can lead to variability in tree growth responses. The studied population is unique in terms of age and size and represents a specific park setting in which, due to its biological and functional characteristics, this tree species is particularly suitable for planting. Therefore, the results obtained should be referred to with consideration of the conditions in which the studied population grew.

5. Conclusions

The sharp increase in industrial pollutant emissions in the years 1950–1970 did not reduce the wood growth of black locust. Moreover, in this period, the basal area increment (BAI) of trees even increased. The homogeneity of the annual growth responses of the trees and the strength of the climatic signal of the BAI chronology also rose. This indicates the resistance of black locust to pollution during the initial emission period. However, after the peak of pollution (at the beginning of the 1980s), there were declines in their growth, the homogeneity of their growth responses, and the strength of the climatic signal. This suggests a cumulative effect of long-term industrial pollution, including its accumulation in soil, which may negatively affect the growth of R. pseudoacacia, a species that is strongly related to mycorrhiza. After 2005, the BAI index and other growth indices increased markedly, potentially reflecting the combined positive effects of warmer and shorter winters and reduced pollution on R. pseudoacacia growth, despite a decline in water availability.
The observed Black locust’s resistance to pollution may be attributed to inherent species traits, annual leaf shedding that removes deposited pollutants, and the layer of fertile humus, which buffers against soil contamination.
It was found that following long, frosty winters and significant precipitation deficits in late autumn, winter, and summer, black locust experienced reduced growth. However, an improvement in climatic conditions during those seasons in the subsequent year led to a renewed increase in growth. Apart from the long-term changes in wood increment, black locust maintained a clear annual rhythm of growth linked to year-to-year weather variability in the above-mentioned seasons.
The decline in industrial emissions observed in recent decades, increasingly warmer and shorter winters, and continued relatively high precipitation levels provide favorable conditions for the further growth of black locust in the urban environment of Kraków. However, the progressively warmer summer season may pose some threat to their condition. Black locust appears to be a good bioindicator of climate change and its influence on tree growth. Studies indicate that, in the context of pollution, Robinia pseudoacacia exhibits specific and unusual growth patterns. Growth reductions typically linked to pollution do not appear to be immediate in this species and may occur with a certain delay. This species could be considered more frequently in urban greening programs. However, black locust is recognized as an invasive species in Europe, and its spread therefore requires careful control. In urban park settings, this species is typically maintained under strict management by municipal green services. Regular mowing of the undergrowth effectively limits regeneration by eliminating seedlings and root suckers, as was observed in the studied population.

Author Contributions

Conceptualization, S.W., M.D. and T.D.; methodology, S.W., M.D. and T.D.; software, S.W., M.D. and T.D.; validation, S.W., M.D. and T.D.; formal analysis, S.W., M.D. and T.D.; investigation, S.W., M.D. and T.D.; resources, S.W., M.D. and T.D.; data curation, S.W., M.D. and T.D.; writing—original draft preparation, S.W., M.D. and T.D.; writing—review and editing, S.W., M.D. and T.D.; visualization, S.W., M.D. and T.D.; supervision, S.W.; project administration, S.W., M.D. and T.D.; funding acquisition, S.W., M.D. and T.D. All authors have read and agreed to the published version of the manuscript.

Funding

The study was co-financed by: the University of Agriculture in Kraków, Faculty of Forestry, as a part of statutory project (SUB/040013/D019), the AGH University of Kraków, Faculty of Geology, Geophysics and Environmental Protection as part of the statutory project and the program “Excellence initiative—research university” for the AGH University of Kraków.

Data Availability Statement

Data will be made available on request.

Conflicts of Interest

The authors declare no conflicts of interest.

References

  1. Tyrväinen, L.; Pauleit, S.; Seeland, K.; de Vries, S. Benefits and Uses of Urban Forests and Trees. In Urban Forests and Trees; Konijnendijk, C., Nilsson, K., Randrup, T., Schipperijn, J., Eds.; Springer: Berlin/Heidelberg, Germany, 2005; pp. 82–114. [Google Scholar] [CrossRef] [Scilit]
  2. Szczepanowska, H.B. Drzewa w Mieście; Hortpress: Warszawa, Poland, 2001; p. 256. [Google Scholar]
  3. Cavanagh, J.A.E.; Zawar-Reza, P.; Wilson, J.G. Spatial attenuation of ambient particulate matter air pollution within an urbanised native forest patch. Urban For. Urban Green. 2009, 8, 21–30. [Google Scholar] [CrossRef] [Scilit]
  4. Berland, A.; Shiflett, S.A.; Shuster, W.D.; Garmestani, A.S.; Goddard, H.C.; Herrmann, D.L.; Hopton, M.E. The role of trees in urban stormwater management. Landsc. Urban Plan. 2017, 162, 167–177. [Google Scholar] [CrossRef] [Scilit]
  5. Schwaab, J.; Meier, R.; Mussetti, G.; Seneviratne, S.; Bürgi, C.; Davin, E.L. The role of urban trees in reducing land surface temperatures in European cities. Nat. Commun. 2021, 12, 6763. [Google Scholar] [CrossRef] [Scilit] [PubMed]
  6. European Commission. Communication from the Commission to the European Parliament, the European Council, the Council, the European Economic and Social Committee and the Committee of the Regions: The European Green Deal; COM(2019)640 Final; European Commission: Brussels, Belgium, 2019.
  7. Iakovoglou, V.; Thompson, J.; Burras, L.; Kipper, R. Factors related to tree growth across urban-rural gradients in the Midwest, USA. Urban Ecosyst. 2001, 5, 71–85. [Google Scholar] [CrossRef] [Scilit]
  8. Nowak, D.J.; Kuroda, M.; Crane, D.E. Tree mortality rates and tree population projections in Baltimore, Maryland, USA. Urban For. Urban Green. 2004, 2, 139–147. [Google Scholar] [CrossRef] [Scilit]
  9. Bigelow, L.M., Jr.; Fahey, R.T.; Grabosky, J.; Hallett, R.A.; Henning, J.G.; Johnson, M.L.; Roman, L.A. Predictors of street tree survival in Philadelphia: Tree traits, biophysical environment, and socioeconomic context. Urban For. Urban Green. 2024, 94, 128284. [Google Scholar] [CrossRef] [Scilit]
  10. Rahman, M.A.; Armsonb, D.; Ennos, A.R. Effect of urbanization and climate change in the rooting zone on the growth and physiology of Pyrus calleryana. Urban For. Urban Green. 2014, 13, 325–335. [Google Scholar] [CrossRef] [Scilit]
  11. IPCC. Climate Change 2021—The Physical Science Basis; Working Group I Contribution to the Sixth Assessment Report of the Intergovernmental Panel on Climate Change; Cambridge University: Cambridge, UK, 2023.
  12. Locosselli, G.M.; de Camargo, E.P.; Moreira, T.C.L.; Todesco, E.; de Fátima Andrade, M.; de André, C.D.S.; de André, P.A.; Singer, J.M.; Ferreira, L.S.; Saldiva, P.H.N.; et al. The role of air pollution and climate on the growth of urban trees. Sci. Total Environ. 2019, 666, 652–661. [Google Scholar] [CrossRef] [Scilit]
  13. Cregg, B.M.; Dix, M.E. Tree moisture stress and insect damage in urban areas in relation to heat island effects. Arboric. Urban For. 2001, 27, 8–17. [Google Scholar] [CrossRef] [Scilit]
  14. Haase, D.; Hellwig, R. Effects of heat and drought stress on the health status of six urban street tree species in Leipzig, Germany. Trees For. People 2022, 8, 100252. [Google Scholar] [CrossRef] [Scilit]
  15. Pretzsch, H.; Dieler, J.; Seifert, T.; Rötzer, T. Climate effects on productivity and resource-use efficiency of Norway spruce (Picea abies [L.] Karst.) and European beech (Fagus sylvatica [L.]) in stands with different spatial mixing patterns. Trees 2012, 26, 1343–1360. [Google Scholar] [CrossRef] [Scilit]
  16. Rötzer, T.; Seifert, T.; Gayler, S.; Priesack, E.; Pretzsch, H. Effects of stress and defence allocation on tree growth: Simulation results at the individual and stand level. In Growth and Defence in Plants: Resource Allocation at Multiple Scales; Springer: Berlin/Heidelberg, Germany, 2012; pp. 401–432. [Google Scholar]
  17. Pretzsch, H.; Dieler, J. The dependency of the size-growth relationship of Norway spruce (Picea abies [L.] Karst.) and European beech (Fagus sylvatica [L.]) in forest stands on long-term site conditions, drought events, and ozone stress. Trees 2011, 25, 355–369. [Google Scholar] [CrossRef] [Scilit]
  18. Pretzsch, H.; Schütze, G.; Uhl, E. Resistance of European tree species to drought stress in mixed versus pure forests: Evidence of stress release by inter-specific facilitation. Plant Biol. 2013, 15, 483–495. [Google Scholar] [CrossRef] [Scilit]
  19. McDowell, N.; Pockman, W.T.; Allen, C.D.; Breshears, D.D.; Cobb, N.; Kolb, T.; Plaut, J.; Sperry, J.; West, A.; Williams, D.G.; et al. Mechanisms of plant survival and mortality during drought: Why do some plants survive while others succumb to drought? New Phytol. 2008, 178, 719–739. [Google Scholar] [CrossRef] [Scilit]
  20. Fritts, H. Tree Rings and Climate; Academic Press: New York, NY, USA, 1976. [Google Scholar]
  21. Gillner, S.; Bräuning, A.; Roloff, A. Dendrochronological analysis of urban trees: Climatic response and impact of drought on frequently used tree species. Trees 2014, 28, 1079–1093. [Google Scholar] [CrossRef] [Scilit]
  22. Treshow, M.; Anderson, F.K. Plant Stress from Air Pollution; John Wiley: Chichester, UK, 1989. [Google Scholar]
  23. Evertsen, J.A.; Mac Siurtain, M.P.; Gardiner, J.J. The effect of industrial emission on wood quality in Norway spruce (Picea abies). IAWA J. 1986, 7, 399–404. [Google Scholar] [CrossRef] [Scilit]
  24. Innes, J.L.; Cook, E.R. Tree-ring analysis as an aid to evaluating the effects of pollution on tree growth. Can. J. For. Res. 1989, 19, 1174–1189. [Google Scholar] [CrossRef] [Scilit]
  25. Sutherland, E.K.; Martin, B. Growth response of Pseudotsuga menziesii to air pollution from copper smelting. Can. J. For. Res. 1990, 20, 1020–1030. [Google Scholar] [CrossRef] [Scilit]
  26. Juknys, R.; Vencloviene, J.; Stravinskiene, V.; Augustaitis, A.; Bartkevicius, E. Scots pine (Pinus sylvestris L.) growth and condition in a polluted environment: From decline to recovery. Environ. Pollut. 2003, 125, 205–212. [Google Scholar] [CrossRef] [Scilit]
  27. Danek, M. The influence of industry on Scots pine stands in the south-eastern part of the Silesia-Krakow Upland (Poland) on the basis of dendrochronological analysis. Water Air Soil Pollut. 2007, 185, 265–277. [Google Scholar] [CrossRef] [Scilit]
  28. Stravinskiene, V.; Bartkevicius, E.; Plausinyte, E. Dendrochronological research of Scots pine (Pinus sylvestris L.) radial growth in vicinity of industrial pollution. Dendrochronologia 2013, 31, 179–186. [Google Scholar] [CrossRef] [Scilit]
  29. Sensuła, B.; Opała, M.; Wilczyński, S.; Pawełczyk, S. Long- and short-term incremental response of Pinus sylvestris L. from industrial area nearby steelworks in Silesian Upland, Poland. Dendrochronologia 2015, 36, 1–12. [Google Scholar] [CrossRef] [Scilit]
  30. Bartens, J.; Grissino-Mayer, H.D.; Day, S.D.; Wiseman, P.E. Evaluating the potential for dendrochronological analysis of live oak (Quercus virginiana Mill.) from the urban and rural environment—An explorative study. Dendrochronologia 2012, 30, 15–21. [Google Scholar] [CrossRef] [Scilit]
  31. Nöjd, P.; Reams, G.A. Growth variation of Scots pine across a pollution gradient on the Kola Peninsula, Russia. Environ. Pollut. 1996, 93, 313–325. [Google Scholar] [CrossRef] [Scilit]
  32. McLaughlin, S.B.; Shortle, W.C.; Smith, K.T. Dendroecological applications in air pollution and environmental chemistry: Research needs. Dendrochronologia 2002, 20, 133–157. [Google Scholar] [CrossRef] [Scilit]
  33. Percy, K.E.; Ferretti, M. Air pollution and forest health: Toward new monitoring concepts. Environ. Pollut. 2004, 130, 113–126. [Google Scholar] [CrossRef] [Scilit] [PubMed]
  34. Ashby, W.C.; Fritts, H.C. Tree growth, air pollution, and climate near LaPorte, Indiana. Bull. Am. Meteorol. Soc. 1972, 53, 246–251. [Google Scholar] [CrossRef] [Scilit]
  35. Mielikäinen, K.; Sennov, S.N. Growth trends of forests in Finland and North-Western Russia. In Growth Trends in European Forests: Studies from 12 Countries; Springer: Berlin/Heidelberg, Germany, 1996; pp. 19–27. [Google Scholar]
  36. Hirano, T.; Morimoto, K. Growth reduction of the Japanese black pine corresponding to an air pollution episode. Environ. Pollut. 1999, 106, 5–12. [Google Scholar] [CrossRef] [Scilit]
  37. Elling, W.; Dittmar, C.; Pfaffelmoser, K.; Rötzer, T. Dendroecological assessment of the complex causes of decline and recovery of the growth of silver fir (Abies alba Mill.) in Southern Germany. For. Ecol. Manag. 2009, 257, 1175–1187. [Google Scholar] [CrossRef] [Scilit]
  38. Wilczyński, S. The variation of tree-ring widths of Scots pine (Pinus sylvestris L.) affected by air pollution. Eur. J. For. Res. 2006, 125, 213–219. [Google Scholar] [CrossRef] [Scilit]
  39. Kolář, T.; Čermák, P.; Oulehle, F.; Trnka, M.; Štěpánek, P.; Cudlín, P.; Hruška, J.; Büntgen, U.; Rybníček, M. Pollution control enhanced spruce growth in the “Black Triangle” near the Czech–Polish border. Sci. Total Environ. 2015, 538, 703–711. [Google Scholar] [CrossRef] [Scilit]
  40. Wilczyński, S. Zapis zmian zachodzących w środowisku przez sosnę zwyczajną oraz sosnę Banksa. Sylwan 2020, 164, 583–593. [Google Scholar] [CrossRef]
  41. Petersen, A.; Eckstein, D. Roadside trees in Hamburg—Their present situation of environmental stress and their future chance for recovery. Arboric. J. 1988, 12, 109–117. [Google Scholar] [CrossRef] [Scilit]
  42. He, X.; Chen, Z.; Chen, W.; Shao, X.; He, H.S.; Sun, Y. Solar activity, global surface air temperature anomaly and pacific decadal oscillation recorded in urban tree rings. Ann. For. Sci. 2007, 64, 743–756. [Google Scholar] [CrossRef] [Scilit]
  43. Cedro, A.; Nowak, G. Effects of climatic conditions on annual tree ring growth of the Platanus × hispanica “Acerifolia” under urban conditions of Szczecin. Dendrobiology 2006, 55, 11–17. [Google Scholar]
  44. Cedro, A.; Nowak, G.; Zielinski, J. The impact of climate conditions on the width of annual increments at the maidenhair tree (Ginkgo biloba L.) in urban conditions of Szczecin (NW Poland). Plant Divers. Evol. 2011, 129, 229. [Google Scholar] [CrossRef] [Scilit]
  45. Bialecki, M.B.; Fahey, R.T.; Scharenbroch, B. Variation in urban forest productivity and response to extreme drought across a large metropolitan region. Urban Ecosyst. 2018, 21, 157–169. [Google Scholar] [CrossRef] [Scilit]
  46. Farrar, J.J.; Evert, R.F. Seasonal changes in the ultrastructure of the vascular cambium of Robinia pseudoacacia. Trees 1997, 11, 191–202. [Google Scholar] [CrossRef] [Scilit]
  47. Walkovszky, A. Changes in phenology of the locust tree (Robinia pseudoacacia L.) in Hungary. Int. J. Biometeorol. 1998, 41, 155–160. [Google Scholar] [CrossRef] [Scilit]
  48. Feldhake, C.M. Microclimate of a natural pasture under planted Robinia pseudoacacia in central Appalachia, West Virginia. Agrofor. Syst. 2001, 53, 297–303. [Google Scholar] [CrossRef] [Scilit]
  49. Feliksik, E.; Orzeł, S.; Wilczyński, S. Dendrometric and dendroclimatological analyses of Black Locust. Electron. J. Pol. Agric. Univ. 2007, 10, 07. [Google Scholar]
  50. Ghorbanli, M.; Bakhshi Khaniki, G.; Bakand, Z. Air pollution effects on fresh and dry weight, amount of proline, number of stomata, trichome and epidermal cells in Nerium oleander and Robinia pseudoacacia in Tehran city. Pajouhesh Sazandegi 2008, 77, 28–34, (In Farsi with English Abstract). [Google Scholar]
  51. Rashidi, F.; Jalili, A.; Kafaki, S.B.; Sagheb-Talebi, K.; Hodgson, J. Anatomical responses of leaves of Black Locust (Robinia pseudoacacia L.) to urban pollutant gases and climatic factors. Trees 2012, 26, 363–375. [Google Scholar] [CrossRef] [Scilit]
  52. Kalbarczyk, R.; Ziemiańska, M.; Machowska, A. Effect of Climatic Conditions on Tree-Ring Widths in Black Locust (Robinia pseudoacacia L.) in the city of Wrocław. Drvna Ind. 2016, 67, 33–41. [Google Scholar] [CrossRef] [Scilit]
  53. Kalbarczyk, R.; Ziemiańska, M. The effect of air temperature, precipitation and humidity on ring widths in the black locust (Robinia pseudoacacia L.) growing in urban conditions. Wood Res. 2016, 61, 351–362. [Google Scholar]
  54. Kalbarczyk, R.; Ziemiańska, M. Identification of meteorological conditions in the growth of Robinia pseudoacacia on the basis of pointer years in urban conditions. Dendrobiology 2017, 77, 33–43. [Google Scholar] [CrossRef] [Scilit]
  55. Nola, P.; Bracco, F.; Assini, S.; von Arx, G.; Castagneri, D. Xylem anatomy of Robinia pseudoacacia L. and Quercus robur L. is differently affected by climate in a temperate alluvial forest. Ann. For. Sci. 2020, 77, 8. [Google Scholar] [CrossRef] [Scilit]
  56. Biondi, F.; Qeadan, F. A theory-driven approach to tree-ring standardization: Defining the biological trend from expected basal area increment. Tree-Ring Res. 2008, 64, 81–96. [Google Scholar] [CrossRef] [Scilit]
  57. Klesse, S.; Bigler, C. Growth trends in basal area increments: The underlying problem, consequences for research and best practices. Dendrochronologia 2025, 90, 126296. [Google Scholar] [CrossRef] [Scilit]
  58. Huntley, J.C. Robinia pseudoacacia L. black locust. In Silvics of North America, 2nd ed.; USDA Forest Service: Washingtom, DC, USA, 1990; pp. 755–761. [Google Scholar]
  59. Sitzia, T.; Cierjacks, A.; de Rigo, D.; Caudullo, G. Robinia pseudoacacia in Europe: Distribution, habitat, usage and threats. In European Atlas of Forest Tree Species; European Commision: Brussels, Belgium, 2016; pp. 166–167. [Google Scholar]
  60. Kato-Noguchi, H.; Kato, M. Invasive Characteristics of Robinia pseudoacacia and Its Impacts on Species Diversity. Diversity 2024, 16, 773. [Google Scholar] [CrossRef] [Scilit]
  61. Puchałka, R.; Dyderski, M.K.; Vítková, M.; Sádlo, J.; Klisz, M.; Netsvetov, M.; Jagodziński, A.M. Black locust (Robinia pseudoacacia L.) range contraction and expansion in Europe under changing climate. Glob. Change Biol. 2021, 27, 1587–1600. [Google Scholar] [CrossRef] [Scilit]
  62. Boring, L.R.; Swank, W.T. The role of black locust (Robinia pseudoacacia) in forest succession. J. Ecol. 1984, 72, 749–766. [Google Scholar] [CrossRef] [Scilit]
  63. Danso, S.; Zapata, F.; Awonaike, K. Measurement of biological N2 fixation in field-grown Robinia pseudoacacia L. Soil Biol. Biochem. 1995, 27, 415–419. [Google Scholar] [CrossRef] [Scilit]
  64. Nicolescu, V.N.; Rédei, K.; Mason, W.L.; Vor, T.; Pöetzelsberger, E.; Bastien, J.C.; Brus, R.; Benčať, T.; Đodan, M.; Cvjetkovic, B.; et al. Ecology, growth and management of black locust (Robinia pseudoacacia L.), a non-native species integrated into European forests. J. For. Res. 2020, 31, 1081–1101. [Google Scholar] [CrossRef] [Scilit]
  65. Bach, A.; Frazik-Adamczyk, M. Charakterystyka Zagrożeń Zieleni Miejskiej ze Szczególnym Uwzględnieniem Zieleni w Ciągach Komunikacyjnych; UMK, Wydział Gospodarki Komunalnej i Ochrony Środowiska: Kraków, Poland, 2006. [Google Scholar]
  66. Holmes, R. Computer-assisted quality control in tree-ring dating and measurement. Tree-Ring Bull. 1983, 43, 69–78. [Google Scholar]
  67. Pretzsch, H. The Course of Tree Growth: Theory and Reality. For. Ecol. Manag. 2020, 478, 118508. [Google Scholar] [CrossRef] [Scilit]
  68. Cook, E.R.; Holmes, R.L. User Manual for Program ARSTAN; Laboratory of Tree-Ring Research, University of Arizona: Tucson, AZ, USA, 1999. [Google Scholar]
  69. Vicente-Serrano, S.M.; Beguería, S.; López-Moreno, J.I. A multiscalar drought index sensitive to global warming: The standardized precipitation evapotranspiration index. J. Clim. 2010, 23, 1696–1718. [Google Scholar] [CrossRef] [Scilit]
  70. Wigley, T.M.L.; Briffa, K.R.; Jones, P.D. On the average value of correlated time series, with applications in dendroclimatology and hydrometeorology. J. Clim. Appl. Meteorol. 1984, 23, 201–213. [Google Scholar] [CrossRef] [Scilit]
  71. Briffa, K.R.; Jones, P.D. Basic chronology statistics and assessment. In Methods of Dendrochronology: Applications in the Environmental Sciences; Cook, E.R., Kairiukstis, L.A., Eds.; Kluwer Academic Publishers: Dordrecht, The Netherlands, 1990; pp. 137–152. [Google Scholar]
  72. Kelly, P.M.; Murno, M.A.R.; Hughes, M.K.; Goodess, C.M. Climate and signature years in west European oaks. Nature 1989, 340, 57–60. [Google Scholar] [CrossRef] [Scilit]
  73. Spain, J.; Pilcher, J.R. Signature years in European oak chronologies A.D. 1600–1750 and possible climatic causes. In Climatic Trends and Anomalies in Europe; Frenzel, B., Ed.; Paleoclimate Research: Stuttgart, Germany, 1994; Volume 13, pp. 123–131. [Google Scholar]
  74. Biondi, F.; Waikul, K. DENDROCLIM2002: A C++ program for statistical calibration of climate signals in tree-ring chronologies. Comput. Geosci. 2004, 30, 303–311. [Google Scholar] [CrossRef] [Scilit]
  75. Latorraca, J.V.; Dünisch, O.; Koch, G. Chemical composition and natural durability of juvenile and mature heartwood of Robinia pseudoacacia L. Anais Acad. Bras. Ciênc. 2011, 83, 1059–1068. [Google Scholar] [CrossRef] [Scilit]
  76. Day, S.D.; Wiseman, P.E.; Dickinson, S.B.; Harris, J.R. Tree Root Ecology in the Urban Environment and Implications for a Sustainable Rhizosphere. Arboric. Urban For. 2010, 36, 193–205. [Google Scholar] [CrossRef] [Scilit]
  77. Sjöman, H.; Nielsen, A.B. Selecting trees for urban paved sites in Scandinavia–A review of information on stress tolerance and its relation to the requirements of tree planners. Urban For. Urban Green. 2010, 9, 281–293. [Google Scholar] [CrossRef] [Scilit]
  78. Nowak, D.J.; Greenfield, E.J. Tree and impervious cover in the United States. Landsc. Urban Plan. 2012, 107, 21–30. [Google Scholar] [CrossRef] [Scilit]
  79. Kapusta, P.; Szarek-Łukaszewska, G.; Godzik, B.; Łopata, B. Recent nitrogen deposition in Poland monitored with the moss Pleurozium schreberi. Pol. Bot. J. 2014, 59, 131–135. [Google Scholar] [CrossRef] [Scilit]
  80. Godzik, B. Use of Bioindication Methods in National, Regional and Local Monitoring in Poland—Changes in the Air Pollution Level over Several Decades. Atmosphere 2020, 11, 143. [Google Scholar] [CrossRef] [Scilit]
  81. Pawlik, Ł.; Pietrzykowski, M. Wpływ dodatków próchnicznych na właściwości gleb parków miejskich w Krakowie. Acta Sci. Pol. Form. Circumiectus 2025, 24, 3–19. [Google Scholar] [CrossRef] [Scilit] [PubMed]
  82. Sachanidis, C.; Fotelli, M.N.; Markos, N.; Fyllas, N.M.; Radoglou, K. Drivers of PM10 Retention by Black Locust Post-Mining Restoration Plantations. Atmosphere 2025, 16, 555. [Google Scholar] [CrossRef] [Scilit]
  83. Yan, X.; Zhang, Z.; Wu, X.; Huang, M. Radial growth–climate correlations and resilience of Robinia pseudoacacia plantations to drought on the Chinese Loess Plateau. Front. For. Glob. Change 2025, 8, 1608397. [Google Scholar] [CrossRef] [Scilit]
  84. Hu, Z.; Zhao, C.; Ji, W.; Ying, R.; Zhang, X.; Jin, S. Robinia pseudoacacia Quickly Adjusts Its Water Uptake After Rainfall in Seasonally Dry Regions. Forests 2024, 15, 1854. [Google Scholar] [CrossRef] [Scilit]
  85. Chen, Y.; Wang, B.; Li, M.; Kong, X.; Bian, S. Trends in Atmospheric CO2 Fertilization Effects with Stand Age Based on Tree Rings. Forests 2023, 14, 2441. [Google Scholar] [CrossRef] [Scilit]
  86. Zweifel, R.; Zimmermann, L.; Zeugin, F.; Newbery, D.M. Intra-annual radial growth and water relations of trees: Implications towards a growth mechanism. J. Exp. Bot. 2006, 57, 1445–1459. [Google Scholar] [CrossRef] [Scilit] [PubMed]
  87. Von Hoffmann, G.; Lyr, H. Charakterisierung des Wachstumsverhaltens von Pflanzen durch Wachstumsschemata. Flora 1973, 162, 81–98. [Google Scholar] [CrossRef] [Scilit]
  88. García-González, I.; Fonti, P. Ensuring a representative sample of earlywood vessels for dendroecological studies: An example from two ring-porous species. Trees 2008, 22, 237–244. [Google Scholar] [CrossRef] [Scilit]
  89. Michelot, A.; Simard, S.; Rathgeber, C.; Dufrêne, E.; Damesin, C. Comparing the intra-annual wood formation of three European species (Fagus sylvatica, Quercus petraea and Pinus sylvestris) as related to leaf phenology and non-structural carbohydrate dynamics. Tree Physiol. 2012, 32, 1033–1045. [Google Scholar] [CrossRef] [Scilit]
  90. González-González, B.D.; Rozas, V.; García-González, I. Earlywood vessels of the sub-Mediterranean oak Quercus pyrenaica have greater plasticity and sensitivity than those of the temperate Q. petraea at the Atlantic–Mediterranean boundary. Trees 2014, 28, 237–252. [Google Scholar] [CrossRef] [Scilit]
  91. Pérez-de-Lis, G.; García-González, I.; Rozas, V.; Olano, J.M. Feedbacks between earlywood anatomy and non-structural carbohydrates affect spring phenology and wood production in ring-porous oaks. Biogeosciences 2016, 13, 5499–5510. [Google Scholar] [CrossRef] [Scilit]
  92. Lévesque, M.; Saurer, M.; Siegwolf, R.; Eilmann, B.; Brang, P.; Bugmann, H.; Rigling, A. Drought response of five conifer species under contrasting water availability suggests high vulnerability of Norway spruce and European larch. Glob. Change Biol. 2013, 19, 3184–3199. [Google Scholar] [CrossRef] [Scilit]
  93. Moser, A.; Rötzer, T.; Pauleit, S.; Pretzsch, H. The urban environment can modify drought stress of small-leaved lime (Tilia cordata Mill.) and black locust (Robinia pseudoacacia L.). Forests 2016, 7, 71. [Google Scholar] [CrossRef] [Scilit]
  94. Vítková, M.; Müllerová, J.; Sádlo, J.; Pergl, J.; Pyšek, P. Black locust (Robinia pseudoacacia) beloved and despised: A story of an invasive tree in Central Europe. For. Ecol. Manag. 2017, 384, 287–302. [Google Scholar] [CrossRef] [Scilit]
  95. Gonzalez-Gonzalez, B.D.; Vázquez-Ruiz, R.A.; Garcia-Gonzalez, I. Effects of climate on earlywood vessel formation of Quercus robur and Q. pyrenaica at a site in the northwestern Iberian Peninsula. Can. J. For. Res. 2015, 45, 698–709. [Google Scholar] [CrossRef] [Scilit]
  96. Eilmann, B.; Rigling, A. Tree-growth analyses to estimate tree species’ drought tolerance. Tree Physiol. 2012, 32, 178–187. [Google Scholar] [CrossRef] [Scilit] [PubMed]
  97. Gričar, J.; Prislan, P.; De Luis, M.; Gryc, V.; Hacurová, J.; Vavrčík, H.; Čufar, K. Plasticity in variation of xylem and phloem cell characteristics of Norway spruce under different local conditions. Front. Plant Sci. 2015, 6, 730. [Google Scholar] [CrossRef] [Scilit]
  98. Zang, C.; Pretzsch, H.; Rothe, A. Size-dependent responses to summer drought in Scots pine, Norway spruce and common oak. Trees 2012, 26, 557–569. [Google Scholar] [CrossRef] [Scilit]
  99. Matisons, R.; Krišāns, O.; Kārkliņa, A.; Adamovičs, A.; Jansons, Ā.; Gärtner, H. Plasticity and climatic sensitivity of wood anatomy contribute to performance of eastern Baltic provenances of Scots pine. For. Ecol. Manag. 2019, 452, 117568. [Google Scholar] [CrossRef] [Scilit]
  100. Steckel, M.; Moser, W.K.; del Río, M.; Pretzsch, H. Implications of reduced stand density on tree growth and drought susceptibility: A study of three species under varying climate. Forests 2020, 11, 627. [Google Scholar] [CrossRef] [Scilit]
  101. Buttò, V.; Rossi, S.; Deslauriers, A.; Morin, H. Is size an issue of time? Relationship between the duration of xylem development and cell traits. Ann. Bot. 2019, 123, 1257–1265. [Google Scholar] [CrossRef] [Scilit] [PubMed]
  102. De Micco, V.; Carrer, M.; Rathgeber, C.B.; Camarero, J.J.; Voltas, J.; Cherubini, P.; Battipaglia, G. From xylogenesis to tree rings: Wood traits to investigate tree response to environmental changes. IAWA J. 2019, 40, 155–182. [Google Scholar] [CrossRef] [Scilit]
  103. Major, J.E.; Johnsen, K.H. Shoot water relations of mature black spruce families displaying a genotype × environment interaction in growth rate. III. Diurnal patterns as influenced by vapor pressure deficit and internal water status. Tree Physiol. 2001, 21, 579–587. [Google Scholar] [CrossRef] [Scilit]
  104. Pichler, P.; Oberhuber, W. Radial growth response of coniferous forest trees in an inner Alpine environment to heat-wave in 2003. For. Ecol. Manag. 2007, 242, 688–699. [Google Scholar] [CrossRef] [Scilit]
  105. Mantovani, D.; Veste, M.; Freese, D. Black locust (Robinia pseudoacacia L.) ecophysiological and morphological adaptations to drought and their consequence on biomass production and water-use efficiency. N. Z. J. For. Sci. 2014, 44, 29. [Google Scholar] [CrossRef] [Scilit]
  106. Mantovani, D.; Veste, M.; Böhm, C.; Vignudelli, M.; Freese, D. Spatial and temporal variation of drought impact on black locust (Robinia pseudoacacia L.) water status and growth. iForest-Biogeosci. For. 2015, 8, 743. [Google Scholar] [CrossRef] [Scilit]
  107. Granier, A.; Reichstein, M.; Bréda, N.; Janssens, I.A.; Falge, E.; Ciais, P.; Grünwald, T.; Aubinet, M.; Berbigier, P.; Bernhofer, C.; et al. Evidence for soil water control on carbon and water dynamics in European forests during the extremely dry year: 2003. Agric. For. Meteorol. 2007, 143, 123–145. [Google Scholar] [CrossRef] [Scilit]
  108. Rötzer, T.; Grote, R.; Pretzsch, H. The timing of bud burst and its effect on tree growth. Int. J. Biometeorol. 2004, 48, 109–118. [Google Scholar] [CrossRef] [Scilit]
  109. Rossi, S.; Deslauriers, A.; Griçar, J.; Seo, J.W.; Rathgeber, C.B.; Anfodillo, T.; Morin, H.; Levanic, T.; Oven, P.; Jalkanen, R. Critical temperatures for xylogenesis in conifers of cold climates. Glob. Ecol. Biogeogr. 2008, 17, 696–707. [Google Scholar] [CrossRef] [Scilit]
  110. Begum, S.; Nakaba, S.; Yamagishi, Y.; Oribe, Y.; Funada, R. Regulation of cambial activity in relation to environmental conditions: Understanding the role of temperature in wood formation of trees. Physiol. Plant. 2013, 147, 46–54. [Google Scholar] [CrossRef] [Scilit]
  111. Lebourgeois, F. Climatic signals in earlywood, latewood and total ring width of Corsican pine from western France. Ann. For. Sci. 2000, 57, 155–164. [Google Scholar] [CrossRef] [Scilit]
  112. Guada, G.; Vázquez-Ruiz, R.A.; García-González, I. Response patterns of xylem and leaf phenology to temperature at the southwestern distribution boundary of Quercus robur: A multi-spatial study. Agric. For. Meteorol. 2019, 269, 46–56. [Google Scholar] [CrossRef] [Scilit]
  113. Aloni, R.; Zimmermann, M.H. The control of vessel size and density along the plant axis: A new hypothesis. Differentiation 1983, 24, 203–208. [Google Scholar] [CrossRef] [Scilit]
  114. Weigel, R.; Henry, H.A.; Beil, I.; Gebauer, G.; Jurasinski, G.; Klisz, M.; van der Maaten, E.; Muffler, L.; Kreyling, J. Ecosystem processes show uniform sensitivity to winter soil temperature change across a gradient from central to cold marginal stands of a major temperate forest tree. Ecosystems 2021, 24, 1545–1560. [Google Scholar] [CrossRef] [Scilit]
  115. Larcher, W. Physiological Plant Ecology: Ecophysiology and Stress Physiology of Functional Groups; Springer Science & Business Media: Berlin/Heidelberg, Germany, 2003. [Google Scholar]
  116. Mezghani, A.; Dobler, A.; Haugen, J.E.; Benestad, R.E.; Parding, K.M.; Piniewski, M.; Kardel, I.; Kundzewicz, Z.W. CHASE-PL Climate Projection dataset over Poland–bias adjustment of EURO-CORDEX simulations. Earth Syst. Sci. Data 2017, 9, 905–925. [Google Scholar] [CrossRef] [Scilit]
  117. Dragańska, E.; Szwejkowski, Z.; Cymes, I.; Panfil, M. Charakterystyka leśnego okresu wegetacyjnego w Polsce na podstawie wybranego scenariusza zmian klimatu. Sylwan 2017, 161, 303–311. [Google Scholar]
  118. Perez-de-Lis, G.; Rozas, V.; Vázquez-Ruiz, R.A.; Garcia-Gonzalez, I. Do ring-porous oaks prioritize earlywood vessel efficiency over safety? Environmental effects on vessel diameter and tyloses formation. Agric. For. Meteorol. 2018, 248, 205–214. [Google Scholar] [CrossRef] [Scilit]
  119. Moser, L.; Fonti, P.; Büntgen, U.; Esper, J.; Luterbacher, J.; Franzen, J.; Frank, D. Timing and duration of European larch growing season along altitudinal gradients in the Swiss Alps. Tree Physiol. 2010, 30, 225–233. [Google Scholar] [CrossRef] [Scilit]
  120. Kitin, P.; Funada, R. Earlywood vessels in ring-porous trees become functional for water transport after bud burst and before the maturation of the current-year leaves. IAWA J. 2016, 37, 315–331. [Google Scholar] [CrossRef] [Scilit]
  121. Rossi, S.; Deslauriers, A.; Anfodillo, T.; Carraro, V. Evidence of threshold temperatures for xylogenesis in conifers at high altitudes. Oecologia 2007, 152, 1–12. [Google Scholar] [CrossRef] [Scilit]
  122. Carrer, M.; Nola, P.; Motta, R.; Urbinati, C. Contrasting tree-ring growth to climate responses of Abies alba toward the southern limit of its distribution area. Oikos 2010, 119, 1515–1525. [Google Scholar] [CrossRef] [Scilit]
  123. Dyderski, M.K.; Paz, S.; Frelich, L.E.; Jagodzinski, A.M. How much does climate change threaten European forest tree species distributions? Glob. Change Biol. 2018, 24, 1150–1163. [Google Scholar] [CrossRef] [Scilit]
  124. Nadal-Sala, D.; Sabaté, S.; Sánchez-Costa, E.; Poblador, S.; Sabater, F.; Gracia, C. Growth and water use performance of four co-occurring riparian tree species in a Mediterranean riparian forest. For. Ecol. Manag. 2017, 396, 132–142. [Google Scholar] [CrossRef] [Scilit]
  125. Wilkaniec, A.; Borowiak-Sobkowiak, B.; Irzykowska, L.; Breś, W.; Świerk, D.; Pardela, Ł.; Durak, R.; Środulska-Wielgus, J.; Wielgus, K. Biotic and abiotic factors causing the collapse of Robinia pseudoacacia L. veteran trees in urban environments. PLoS ONE 2021, 16, e0245398. [Google Scholar] [CrossRef] [Scilit]
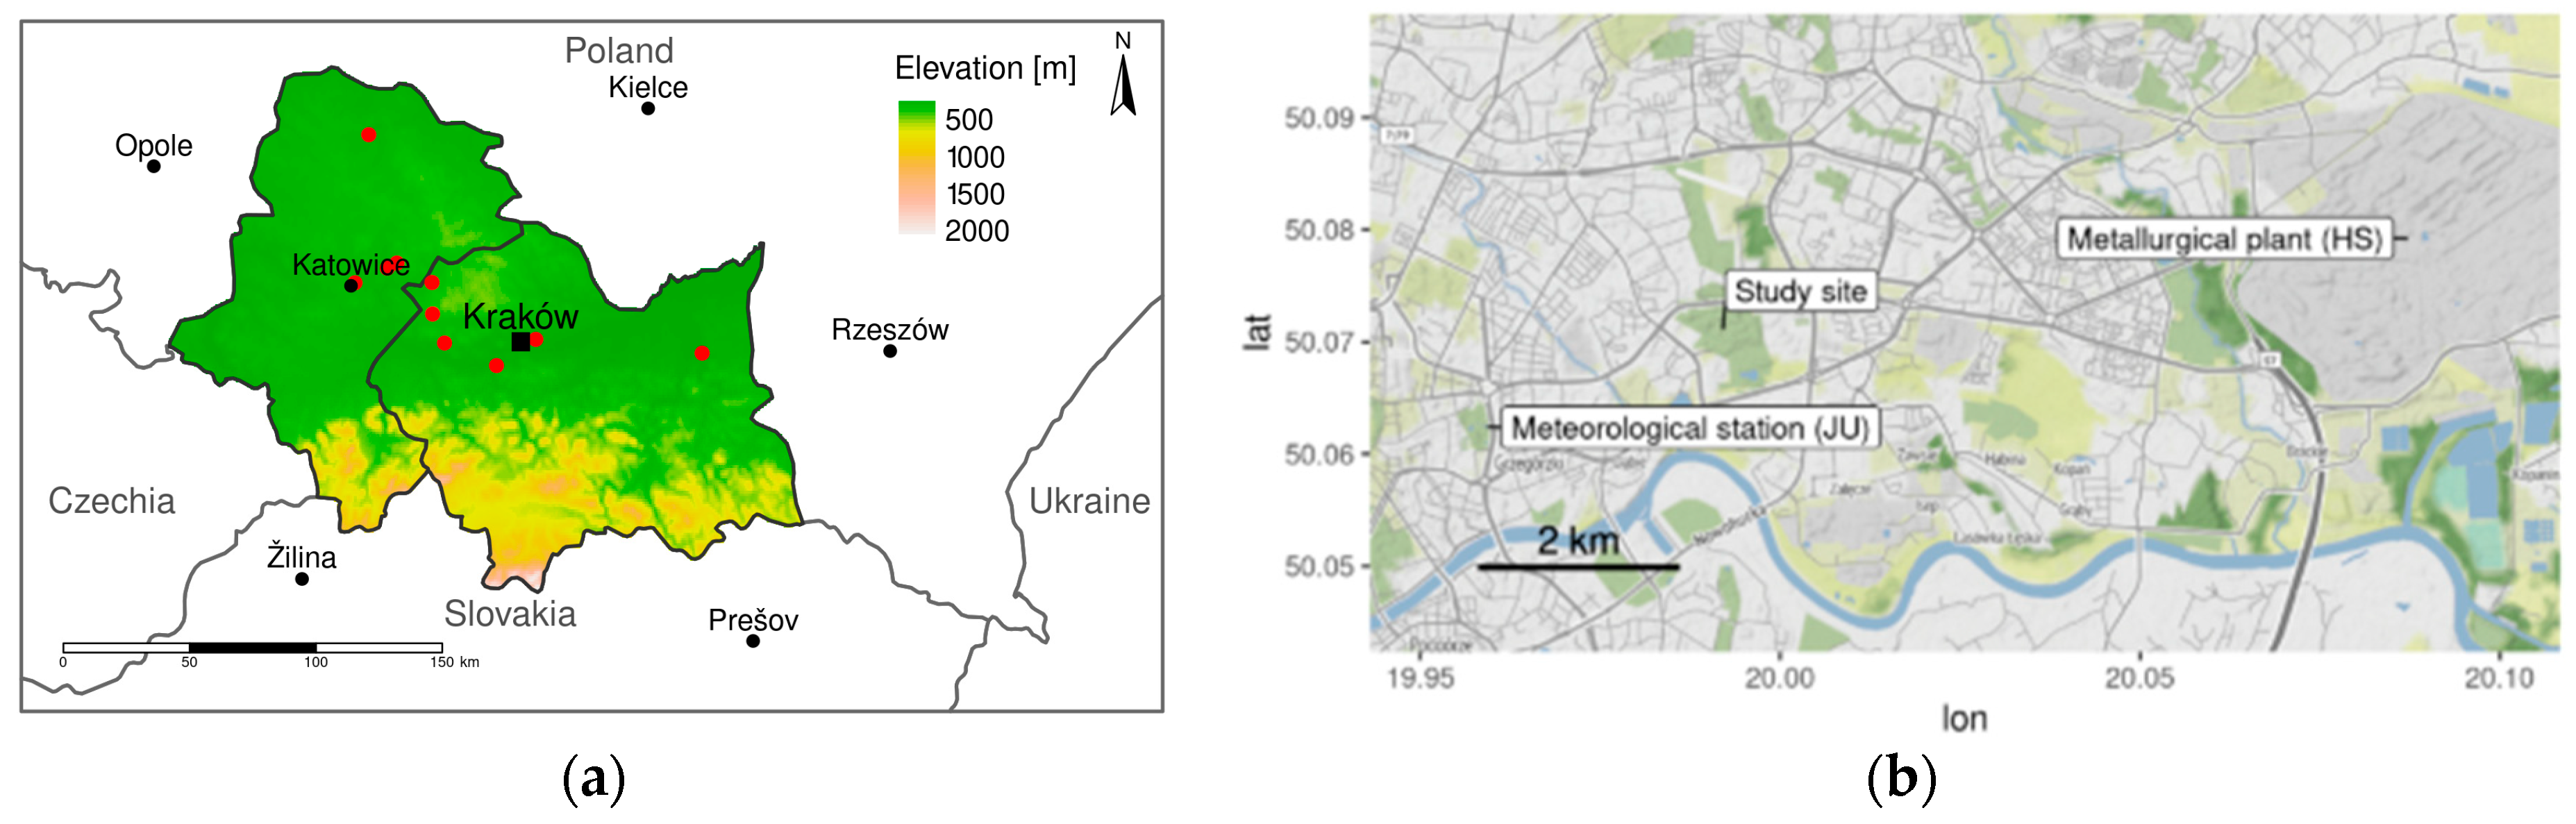
Figure 1. Study location: (a) Kraków (black square) and main industrial pollution sources (red circles) in its vicinity, (b) east part of the Kraków study site, meteorological station and metallurgical plant marked.
Forests 17 00236 g001
Figure 2. Trends in industrial emissions (SO2 and dust) from the Huta Sendzimira Metallurgical Plant (HS): (a) in relation to total emissions in Poland (PL) across consecutive decades (Mt—megatonnes; data source: Statistical Yearbook the Republic of Poland (GUS)); (b) annual emissions over the years (Y-axis unit: t = tonnes; data source: Huta Sendzimira).
Forests 17 00236 g002
Figure 3. Climatic diagrams for the meteorological station JU (for the period 1920–2020). Annual sum of precipitation—Pa, average annual air temperature—Ta. The highest monthly values—max; the lowest—min.
Forests 17 00236 g003
Figure 4. Differences in monthly values of mean air temperature, precipitation totals, cloudiness and sunshine duration for the period 1951–2020 between the meteorological station of Jagiellonian University (center of Kraków) and outside the city (Balice).
Forests 17 00236 g004
Figure 5. Temporal variation in basal area increment (BAI) for the sampled black locust trees.
Forests 17 00236 g005
Figure 6. Site BAI chronology (thick line) and indexed chronology (BAII; thin line).
Forests 17 00236 g006
Figure 7. Thirty-one-year running values of rbar, EPS, and SNR for indexed BAI series, for the analyzed period (1920–2019). Each value is assigned to the final year of its corresponding 31-year window (e.g., the first value, shown for 1950, represents the 1920–1950 window).
Forests 17 00236 g007
Figure 8. Results of the pointer-year analysis: percentage of trees increasing or decreasing BAI, with positive (white dots) and negative pointer years (black dots), and the site BAII chronology (thick line).
Forests 17 00236 g008
Figure 9. Differences (black area) in mean monthly values of temperature (a) and precipitation totals (b) between positive (POS) and negative (NEG) pointer years for the entire analyzed period (see Figure 8); the prefix “p” indicates months of the previous year.
Forests 17 00236 g009
Figure 10. Moving bootstrap correlations between the indexed chronology (BAII) and selected climatic variables. Window length: 31 years; overlap: 1 year; analysis period: 1920–2019. Each correlation value is assigned to the final year of its corresponding window (e.g., the first value, shown for 1950, represents the 1920–1950 window). T—temperature; P—precipitation. Significant coefficients at the 95% level are marked with white dots.
Forests 17 00236 g010aForests 17 00236 g010b
Figure 11. Changes in the values of the 3-month SPEI for July (for meteorological station UJ) over the study period.
Forests 17 00236 g011
Table 1. Trend values (Tv) for mean monthly air temperature and total monthly precipitation in Kraków, 1921–2020.
Month Tv
[°C/100 Years]
Tv
[mm/100 Years]
January 2.5 4.4
February 3.2 0.4
March 1.9 5.3
April 2.2 8.1
May 1.1 26.4
June 2.2 0.4
July 1.3 0.5
August 2.1 −8.6
September 0.3 13.4
October 1.1 −4.0
November 1.5 −5.2
December 2.3 5.9
Disclaimer/Publisher’s Note: The statements, opinions and data contained in all publications are solely those of the individual author(s) and contributor(s) and not of MDPI and/or the editor(s). MDPI and/or the editor(s) disclaim responsibility for any injury to people or property resulting from any ideas, methods, instructions or products referred to in the content.