Article

Diversity, Growth Parameters, and Ecosystem Services of Urban Trees Under Climate-Change Conditions: A Case Study of Topčider Park

1
Faculty of Forestry, University of Belgrade, Kneza Viseslava 1, 11030 Belgrade, Serbia
2
Faculty of Agriculture, University of Novi Sad, Trg Dositeja Obradovića 8, 21000 Novi Sad, Serbia
*
Author to whom correspondence should be addressed.
Forests 2026, 17(1), 114; https://doi.org/10.3390/f17010114
Submission received: 21 November 2025 / Revised: 23 December 2025 / Accepted: 10 January 2026 / Published: 14 January 2026

Abstract

Urban tree planting is widely promoted for its benefits, but the long-term condition of trees is poorly documented, especially as changing and often incompatible conditions, intensified by climate change, affect their ability to deliver those benefits. A case study in Topčider Park (since 1836) was conducted during 2025 through the evaluation of diversity, growth parameters, ornamental value, vitality, and total fresh biomass and the identification of tree taxa with high carbon-sequestration potential in Belgrade (Serbia). The data were statistically processed using descriptive statistics, the Shannon diversity and the Pielou evenness index, PCA, Spearman rank and Chi-square tests. The results indicated a wide distribution and high homogeneity of taxa, greater stability within Angiospermae and moderate stability within Gymnospermae, with PCA showing no correlations between growth parameters, vitality, and ornamental value, confirming the close proximity of all taxa. At the taxon level, London plane, English oak, Ginkgo and Bald cypress stood out in growth parameters, while the assessment of total fresh biomass for all 51 taxa highlighted London plane, Scots pine and Bald cypress as particularly productive and adaptive. Carbon sequestration and CO2 reduction varied with total fresh biomass. The study offers evidence-based recommendations for selecting urban tree taxa to enhance ecosystem services and support climate-adaptation efforts in urban planning.

1. Introduction

Green infrastructure in cities essentially encompasses vegetation systems, including parks, which are responsible for and capable of providing ecosystem services that extend beyond the urban area itself. Nevertheless, many urban residents are unaware of their ecological footprint, and reconnecting cities with nature and the biosphere can contribute to raising awareness and changing behaviour [1]. In ecosystems such as urban areas, where natural and artificial elements coexist, new relationships are established between plants, between plants and human populations, animals or other organisms, and between plants and artefacts. The fragile balance regulating the interactions between plants and the urban environment, shaped by centuries of urbanisation across much of the inhabited part of the planet, is now further threatened by climate change [2,3,4,5,6]. In this context, it is important to recognise and document the diversity, growth parameters, and ecosystem service values of urban trees.
Predictions regarding human population growth and sociological behaviour require a continuous increase in global urbanisation processes [7]. As urban areas expand, natural environments become increasingly fragmented, as cities disrupt habitats and connectivity, forming complex mosaics of built-up and vegetated surfaces [8]. Elements of green infrastructure may consist of remnants of native vegetation or transformed areas that do not necessarily represent the local flora, encompassing natural, semi-natural, and artificial ecological systems in and around cities [9,10,11]. However, only precise land-cover classification can adequately describe landscape heterogeneity [12].
United Nations [7] highlights that the global urban population will increase to 68% by 2050, inevitably leading to urban expansion and the loss and degradation of local vegetation. Sjöman and Östberg [13] further emphasise, on the one hand, the pressure on natural resources and the reduction in space available for flora and fauna, and, on the other hand, the necessity of ensuring quality-of-life standards in urban environments for a sustainable future, which in turn alters the composition and structure of terrestrial ecosystems. In an already complex situation, climate change at the planetary level presents an increasing challenge, and plants are among the most sensitive organisms to climatic variations. In temperate regions of the world, trends towards higher air temperatures, precipitation deficits, and more frequent extreme events are major factors that can limit vegetation growth, productivity, and ecosystem services [14]. In the most vulnerable areas, climate-change factors may lead to biodiversity loss, migration, desertification, and the invasion of alien species [15]. Urban plants are crucial for mitigating climate change, yet negative anthropogenic factors, pollution, the urban heat-island effect, insufficient soil substrate, reduced water availability, and others are clearly evident in cities and pose threats to plant life [16]. Therefore, urban plants must be carefully selected to withstand the combination of stressors they face today, as well as those expected under future conditions. The selection of urban tree species with the highest adaptive potential is essential for fulfilling the full range of ecosystem services [17].
Urban trees, particularly older taxa, have been shown to possess the capacity to sequester significant amounts of carbon [18]. However, Liu et al. [19] emphasise that their contribution is underestimated at national and global scales in terms of CO2 reduction. Therefore, understanding the biomass and carbon-sequestration potential of urban trees is essential for improving the accuracy of carbon stock assessments and for selecting taxa for sustainable urban planning and climate-resilient design [20]. Nevertheless, there is a lack of region-specific data to draw relevant conclusions about the extent to which urban trees sequester carbon [21,22,23,24]. This knowledge gap hinders the development of planning and design strategies aimed at maximising the benefits of urban trees, especially considering that previous studies have largely relied on national tree inventories and remote-sensing data [25,26].
Moreover, previous research has predominantly focused on the restoration of biodiversity, ecosystems, and their services, prioritising native plant species as essential for sustainable urban living [10,27,28,29]. Complementary actions have also been noted, relating to the broader framework for the protection of land, oceans, coastal areas, and inland waters [30,31], as well as activities aligned with the vision of ecological restoration [32,33]. In this context, Europe has also adopted regulations [34] aimed at restoring degraded ecosystems and reintroducing key natural elements into cities, with the goal of reducing greenhouse gas emissions and achieving climate neutrality by 2050 [35].
Nevertheless, the potential benefits of non-native plant species remain a subject of debate, particularly regarding the provision of ecosystem services and their benefits in urban environments [36,37,38]. This study examines the impact of urbanisation on the patterns and richness of urban trees, as well as how landscape design influences biodiversity in urban parks. By taking into account multiple parameters and applying new statistical tools, the role of non-native tree species in urban landscapes and their development in cities is investigated. Specifically, the patterns and assemblages of taxa presented in this study indicate that social and ecological systems within urban landscapes are interconnected and together shape biodiversity patterns. Changes in the social context of urban landscapes often lead to changes in ecological structure and function and, ultimately, in urban biodiversity. Although generalisations are frequently made about the effects of urbanisation on biodiversity, actual patterns may vary depending on region, biome, and the historical development of a city. Similarly, the presence of taxa may vary among cities within the same biome due to habitat availability and quality, taxon availability and adaptability, as well as site history. Urbanisation indeed leads to biodiversity loss, increasing human vulnerability to natural disasters and reducing resilience to such events. Although biodiversity is known to be essential for human health and well-being, vital ecosystems are being lost or destroyed, and urban trees are disappearing as cities expand and the human population grows. This study contributes to the prevention of unnecessary losses by providing insights into ecosystem patterns and processes that will enable not only planners and managers but also individuals to create sustainable landscapes for people, flora, and fauna. Within this framework, the study explores the contribution of non-native species in conjunction with native plants in green urban areas, specifically in long-established city parks.
In this context, the present study examines how urban trees within a fragile urban ecosystem can perform multiple ecological functions while providing benefits to human well-being under current and potential climatic threats. In doing so, the research supports and highlights the relationship between human populations and nature, raises awareness, and sets priorities in urban design in line with TEEB [39] recommendations.
Therefore, the objectives of this study are to evaluate the diversity, growth parameters, ornamental value, and vitality of urban trees in order to inform urban design strategies in cities with a temperate-continental climate. Additionally, the study aims to assess fresh biomass (aboveground and belowground) and identify tree taxa with high carbon-sequestration potential in Belgrade and other cities with similar ecological conditions, based on a real case study in Topčider Park. This approach allows for a complementary perspective and regional calibration in the assessment of ecosystem services under conditions where minimum, mean, and maximum air temperatures are continuous variables, and precipitation is a discrete variable.

2. Materials and Methods

2.1. Study Area

The study was conducted in the natural monument Topčider Park in Belgrade (Serbia), one of 52 parks (total area 327.8 ha) maintained by JKP Zelenilo Beograd [40]. The park is located within the Savski Venac municipality (one of 17 municipalities) [41], which contains the highest number of parks (10). Topčider Park is the oldest park in Belgrade (since 1836), deliberately planned and designed as a structural component of the Obrenović dynasty’s residential complex, and today forms part of the spatial, cultural, and historical entity of Topčider [42].
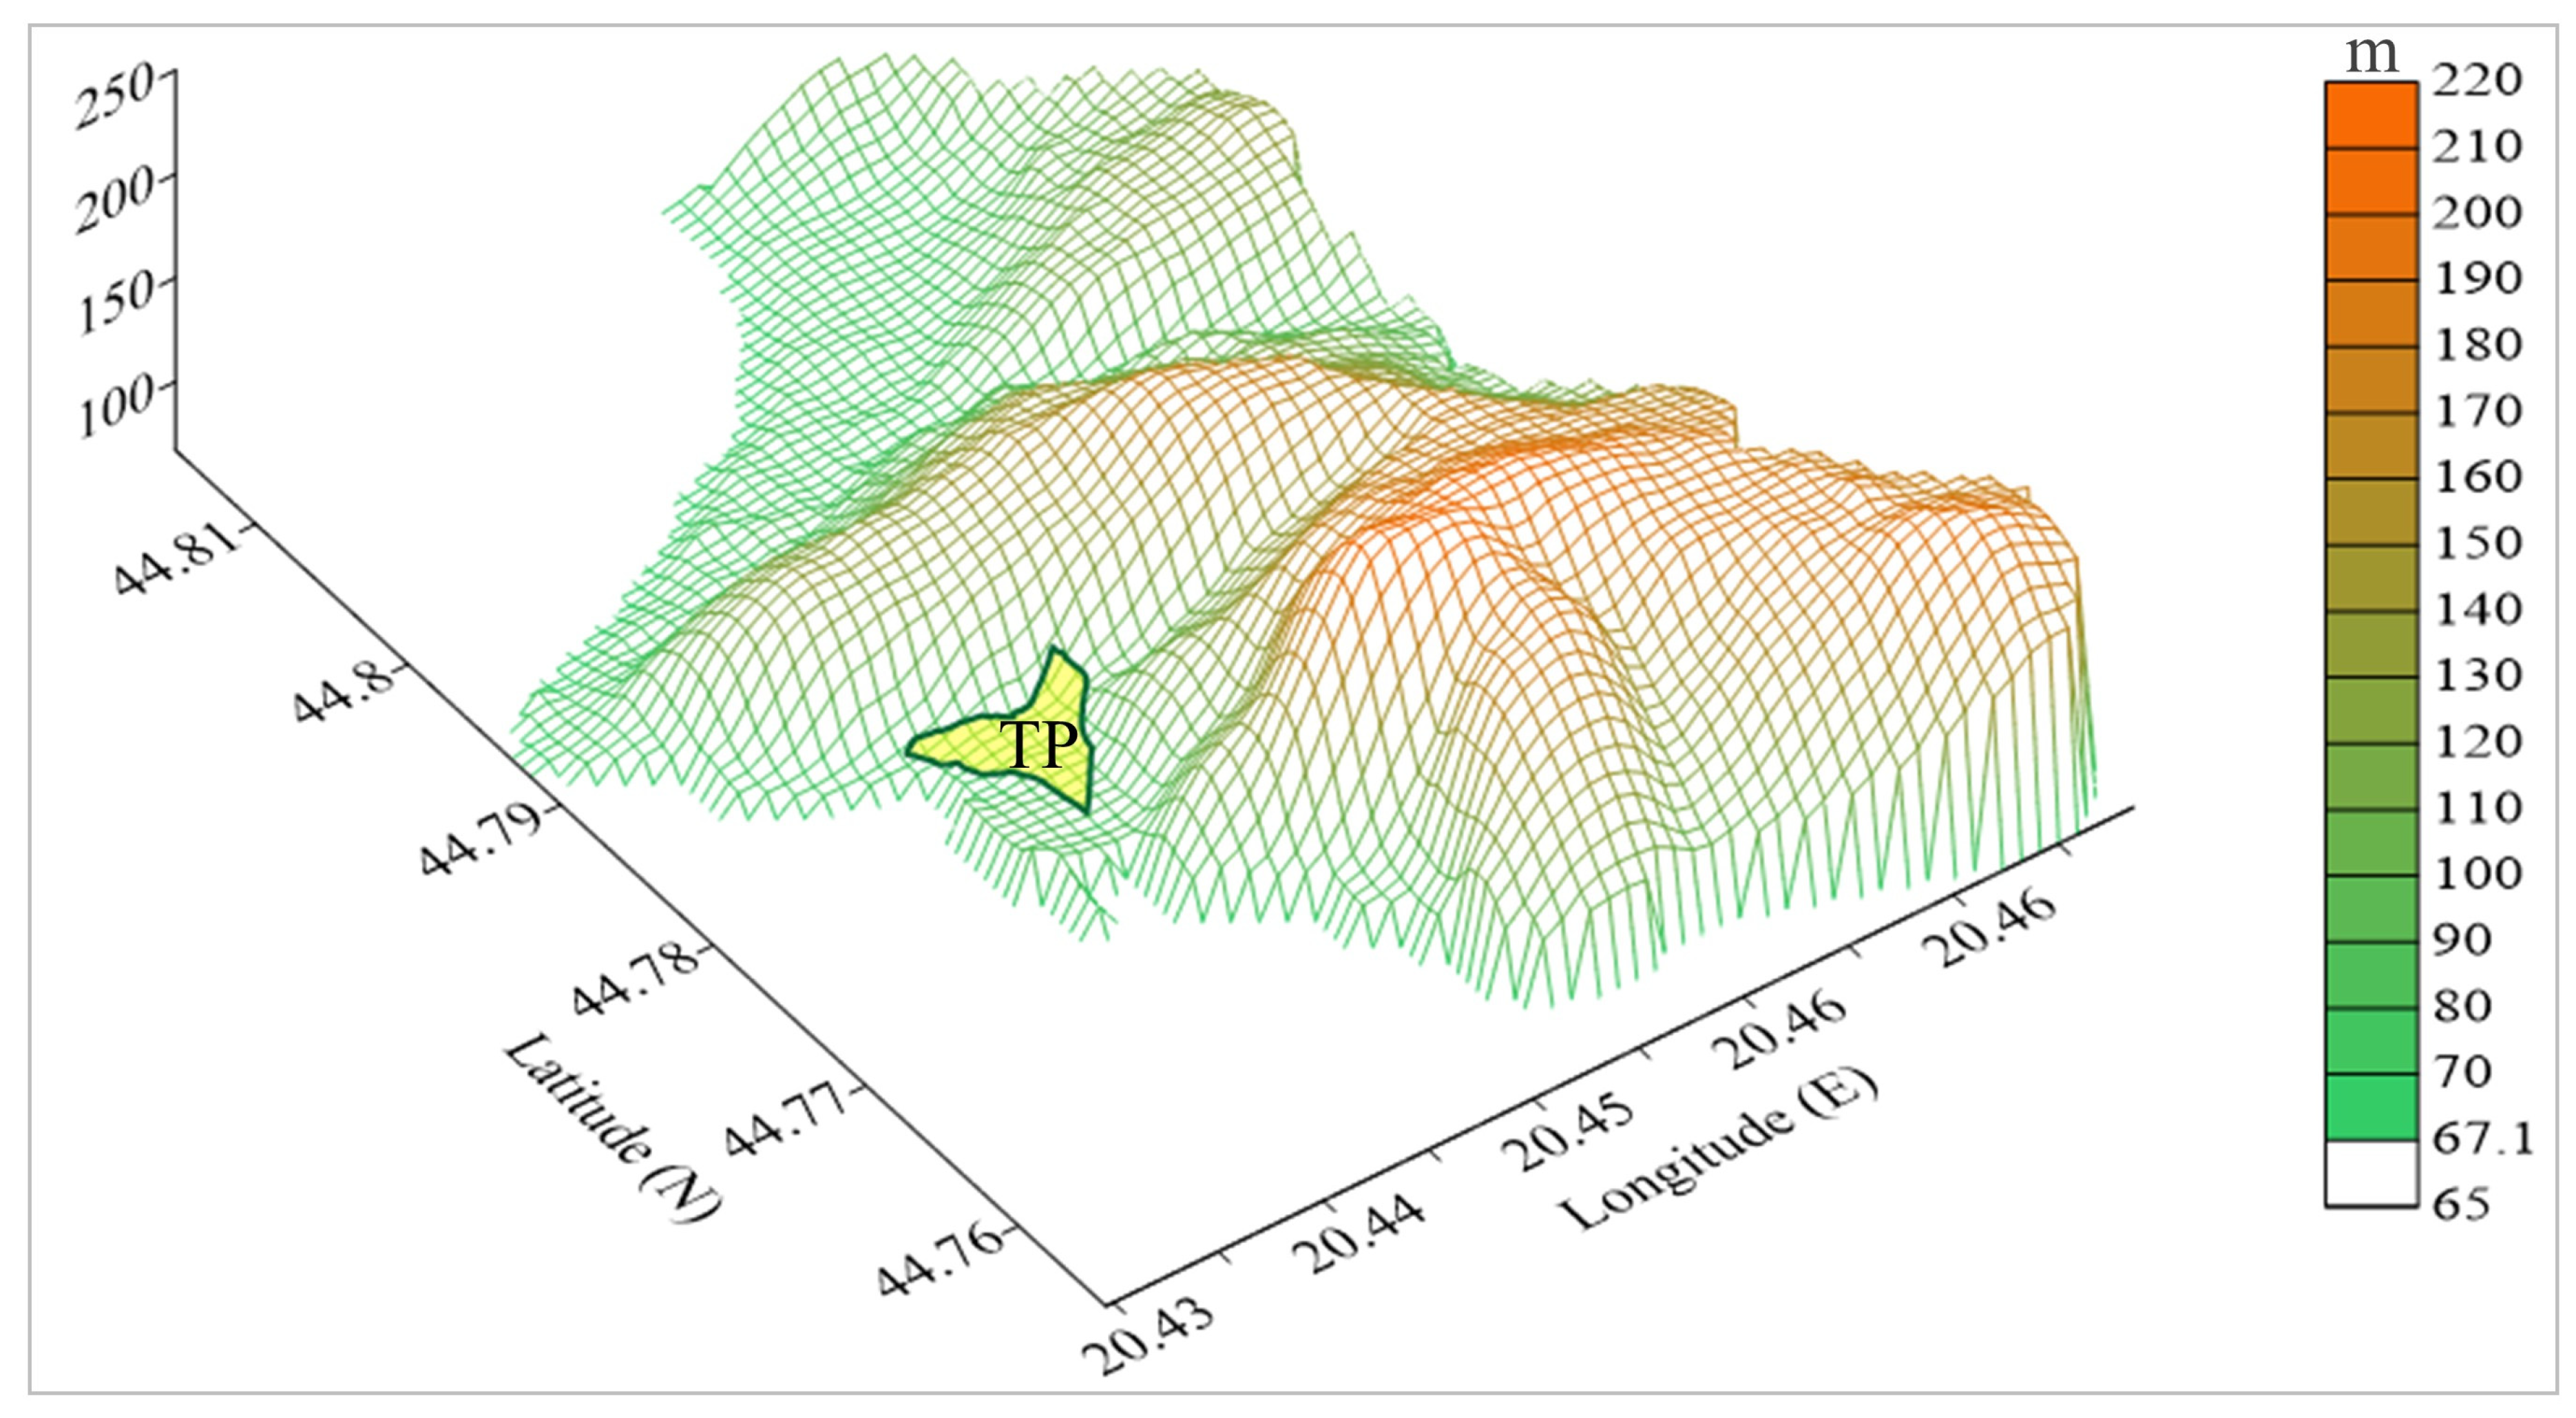
The protected area lies on the alluvial terrace of the Topčiderska River and partially borders the Košutnjak urban forest. To the north is the Sava River, to the west are Banovo Brdo and Petlovo Brdo, and to the east are the ridges of Dedinje and Banjički Vis in the Avala hills. The total analysed area covers 194,014 m2 at elevations ranging from 74.9 m to 105.9 m (Figure 1), on undeveloped alluvial silty soils—Fluvisols [43] or Haplic Fluvisol (Siltic) according to Knežević et al. [44].
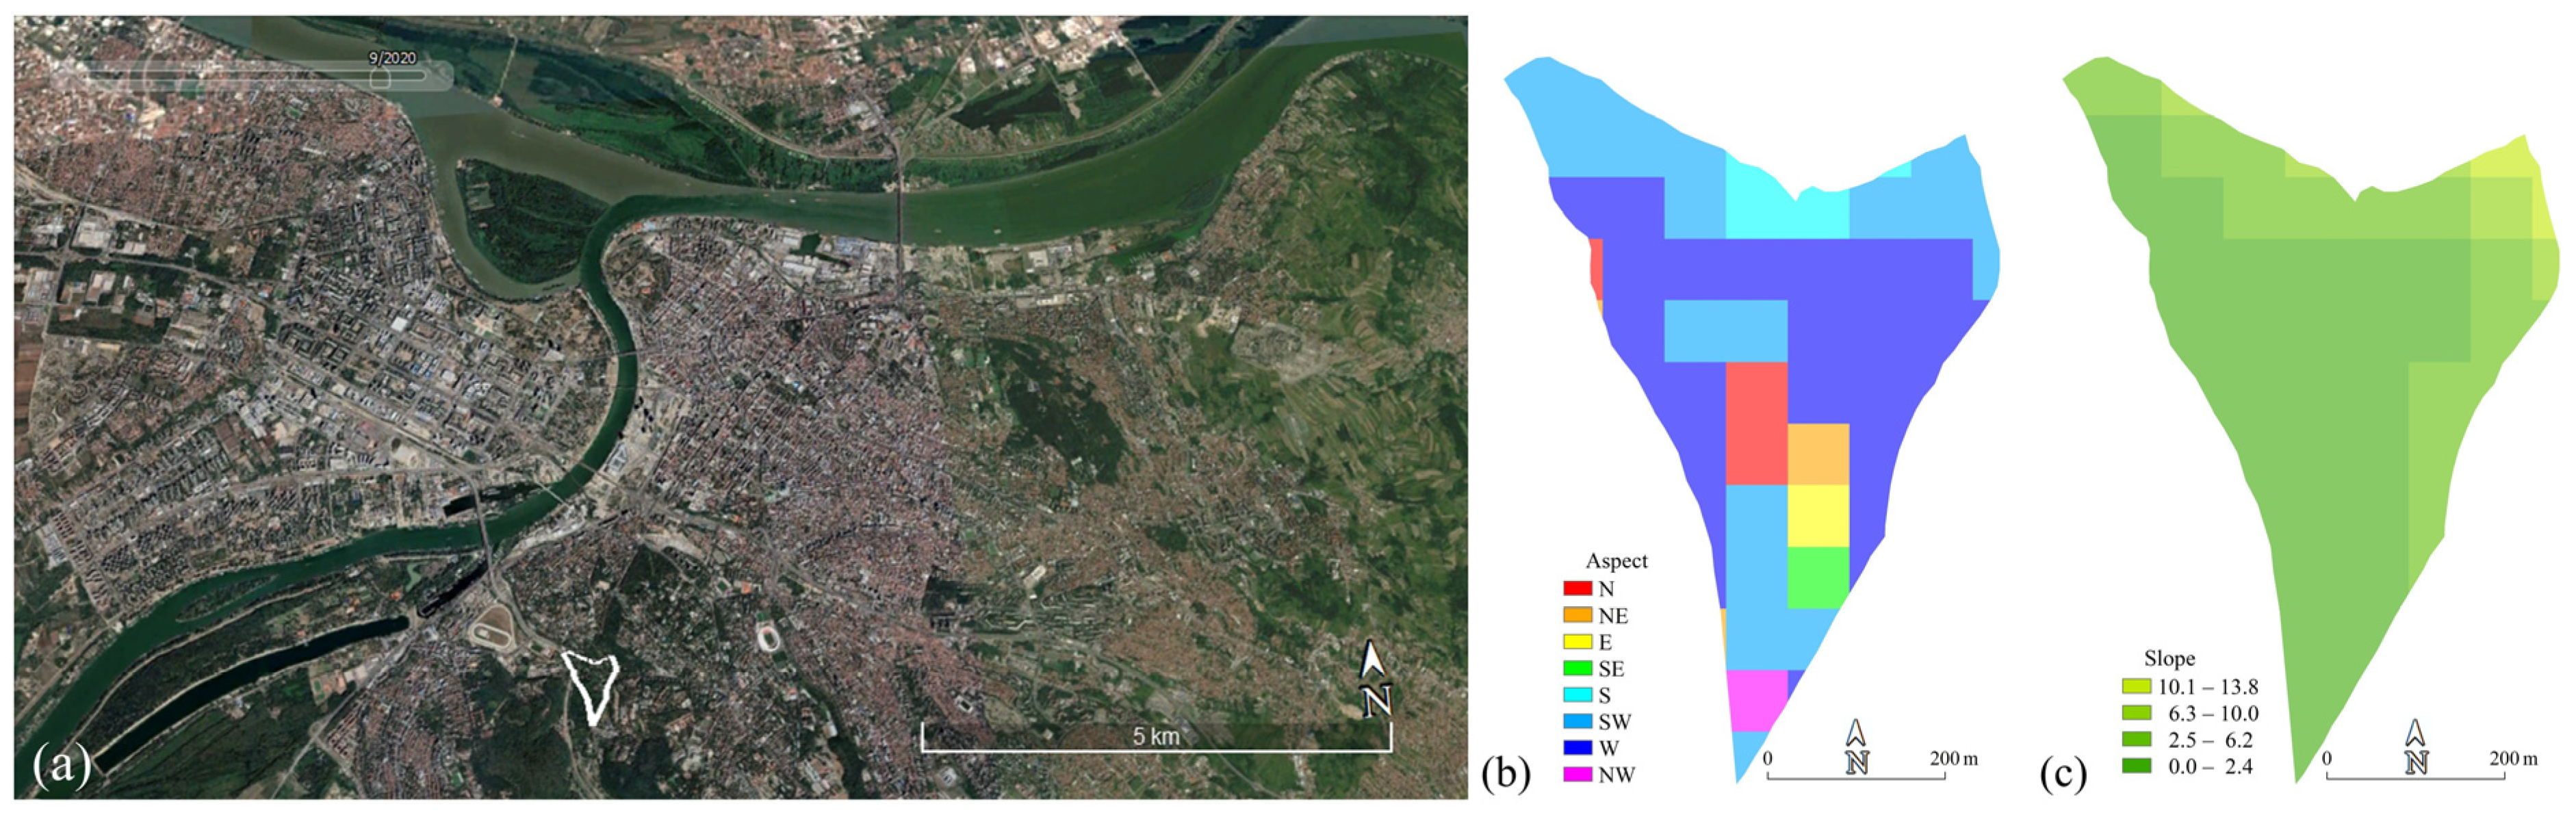
The park is not fenced and is surrounded by roads that connect different parts of the city. Topčiderski put runs alongside the park, while a new four-lane road, currently under construction, forms part of Belgrade’s Inner Main Semi-Ring Road, which links the municipalities of New Belgrade and Zvezdara via both the road and rail bridge at Ada. Consequently, the park lies within a zone of heavy traffic (Figure 2a). Additional information on the location is presented in Figure 2b,c.
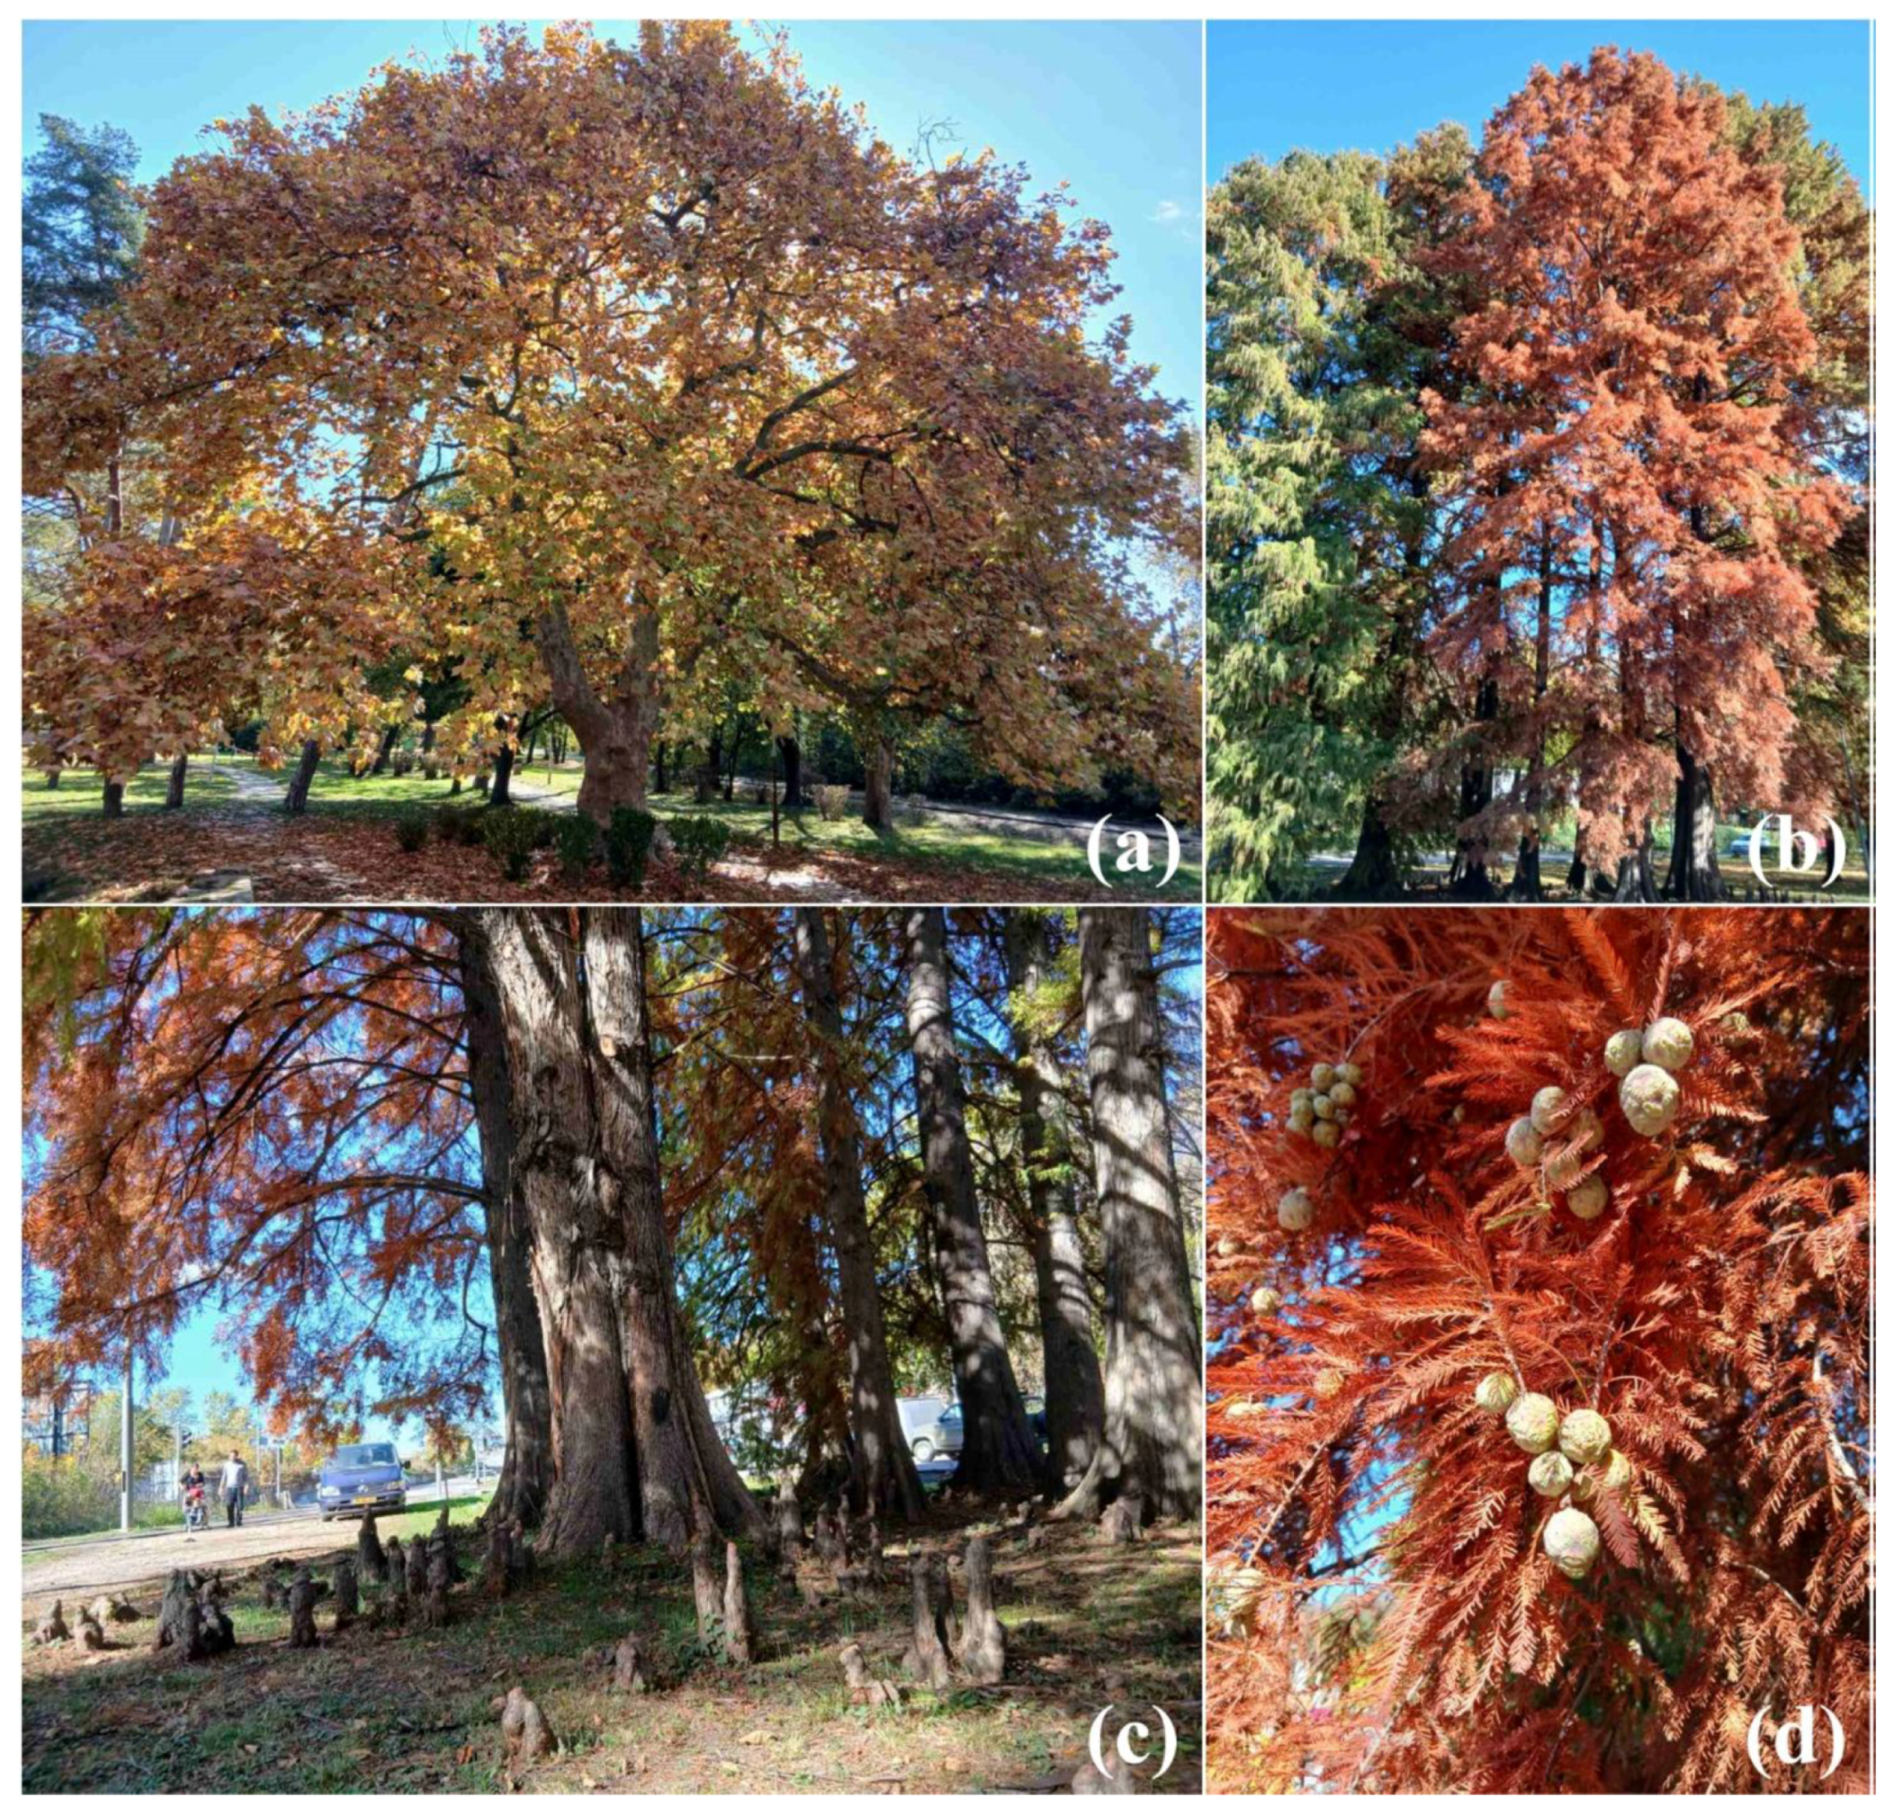
In the park, the potential of Platanus × hispanica Mill. ex Münchh, Pinus sylvestris L., and Taxodium distichum (L.) Rich. (Figure 3) to optimise carbon sequestration in Topčider Park stands out, while also highlighting taxon-specific variations and their biomass abundance (Table S3) as an effective strategy for carbon sequestration and greenhouse gas mitigation under climate change conditions. Taxa with lower values of the analysed parameters contribute relatively less individually, but their cumulative effect remains important for the overall potential of ecosystem services.
Taking the above into account, as well as the impacts of climate change such as floods and heatwaves [14], Topčider Park—with several trees approaching 200 years of age—represents a suitable site for researching the diversity, growth parameters, biomass, and carbon-sequestration potential of urban trees. Belgrade is characterised by local specificities: an increase in continentality towards the northeast and the “Košava” wind zone, whose features are determined by the influence of Serbia’s mountain ranges, the Carpathians, and the Pannonian Plain [45]. According to the Köppen system for the period 1991–2020, the climate is classified as C (f) wa [45], where Cfa denotes a warm temperate climate with a hot summer: a warm temperate, fully humid climate with a hot summer (a), without a pronounced dry season (f), and with the least precipitation occurring in the coldest part of the year (w). The study used climate parameter data from the Republic Hydrometeorological Service of Serbia (RHMZ) [45] for the periods 1888–1990, the current reference period (1991–2020), and the years 2021, 2022, 2023, 2024, and January–September 2025 [46], obtained from the main meteorological station in Belgrade (φ 44°47′54.44″ N; λ 20°27′53.35″ E).

2.2. Data Analysis

2.2.1. Taxa Diversity Data

Field research was carried out in the study area during 2025 with the aim of inventorying the trees and collecting dendrometric data. For each individual tree, the following were determined: TH—tree height (using a Blume–Leiss hypsometer, Model BL6, ALTIMeter), TD—trunk diameter at 1.37 m height (using a digital calliper, DPII/REB, Haglöf), and CW—crown projection width (using a digital tape, DigiTech DPII/REB, Haglöf). In addition, Ornamentality (O) was assessed using a scoring system based on characteristic features such as crown shape and density, leaf and bark colour, crown texture, and similar traits. According to Shlapak et al. [47], on a five-point scale, 1—an individual with no aesthetic value, 2—low, 3—good, 4—very good, and 5—an individual with exceptional ornamental qualities. Vitality (V) was evaluated on the basis of symptoms or changes in the morphological appearance of the entire plant or individual organs, including colour changes, partial discolouration or spotting, growth suppression and stunting, or destructive changes manifested through decay, exudates, coatings or resin flow. According to Golubović Ćurguz and Milenković [48], on a five-point scale, 1—an individual with no possibility of revitalisation, 2—a severely damaged tree with potential for recovery, 3—a tree of moderate vitality, 4—a tree with minor deficiencies that may be corrected through maintenance measures, and 5—an individual of exceptional vitality adapted to the environmental conditions.
To quantify diversity, the Shannon diversity index (H’) and the Pielou evenness index (J’) were used. By applying Equation (1) according to Shannon [49], which incorporates both the richness and evenness of tree taxa, the alpha diversity (α-diversity) characteristic of Topčider Park was determined:
H = i = 1 n ( p i × ln p i )
where n represents the total number of tree taxa, pi (relative abundance) = n/N, and N = total number of individuals. The value of H’ may range from 0 (absence of diversity) to maximum diversity (an equal number of individuals of each taxon), corresponding to a value of ln (n). The following criteria for interpreting the Shannon biodiversity index were used, according to Ludwig and Reynolds [50]: ˃3 (high diversity, high distribution of individual numbers among taxa, and increased community stability), 1–3 (medium diversity, moderate distribution of individuals among taxa, and moderate community strength), and <1 (low diversity, low distribution of individuals among taxa, and low community stability).
The Pielou evenness index (J’) was determined by applying Equation (2) according to Pielou [51]:
J = H H max
The value of J’ ranges from 0 (no homogeneity) to 1 (complete homogeneity). The Pielou evenness index (J’) was used as a measure of taxon dominance (the opposite of diversity), where a low value indicates dominance by one or a few taxa. Subsequently, a principal component analysis (PCA) was conducted to determine the variation in TH, TD, CW, O and V.

2.2.2. Estimation of Biomass, Carbon Sequestration and CO2 Reduction

The biomass of individual trees was estimated using a non-destructive approach based on measured tree height (TH), trunk diameter (TD), and the natural logarithm (ln e). Aboveground biomass for each tree was estimated using adjusted allometric models according to Miah et al. [52]. In that study, the best allometric models were identified through testing eight linear models with 64 regression equations combining TD and TH, based on the coefficient of determination, separately for deciduous and evergreen species. For deciduous, the following formula was used:
Exp (−5.7225 + 2.0365 × ln (TD × TH))
And for evergreen, the formula:
Exp (−2.2702 + 2.5850 × ln (TD) − 0.0093 × ln (TH))
The formulas adopted from the scientific literature [52] were adjusted for logarithmic bias, excluding leaf values, respectively. According to Kim et al. [53], wood density is used for converting volume to biomass; however, to ensure consistency with non-destructive volume measurements, the aforementioned formulas were applied, and the methodology involved measuring the external bark diameter of tree stems.
Subsequently, belowground biomass for each tree was estimated as 28% of the aboveground biomass, following Montes et al. [54]. The method for determining carbon sequestration was established following a detailed analysis by Thomas and Martin [55], who examined the assumption applied in most local, regional, and global assessments that carbon content equals 50% of fresh tree biomass. They conducted a comprehensive literature review to synthesise carbon content in the tissues of living trees. They compared wood carbon content for 253 tree species across three biomes (tropical, subtropical/Mediterranean, temperate/boreal) and two tree types (angiosperms and conifers). Based on a comparison between the taxa analysed by Thomas and Martin [55] and those included in the present study, and adopting the model of Picard et al. [56], carbon sequestration was defined as 48% of the total fresh biomass per tree by applying a factor of 3.663 [57]. The values were then summed to obtain parameters at the level of individual taxa, Angiospermae, Gymnospermae, and for all trees combined (total carbon sequestration and CO2 reduction) in Topčider Park.

2.3. Statistical Analysis

Quantitative data were statistically analysed using descriptive statistics, the Shannon diversity index (H’), the Pielou evenness index (J’), principal component analysis (PCA), and Spearman rank and Chi-square tests, implemented with the software packages XLSTAT 2022 and Past 4.11. The strength of Spearman rank correlations was interpreted according to Horvat and Mijoč [58]: 0 (no correlation), 0–0.24 (very weak), 0.25–0.49 (weak), 0.50–0.74 (moderate), 0.75–0.99 (strong to very strong), and 1 (perfect correlation).
The study map, including the geographic coordinates of the surveyed location, aspect, slope, and elevation, was created using Google Earth Pro 7.3 and ArcGIS/ArcMap 10.8 (ESRI, Redlands, CA, USA). Data visualisation, including graphs, was generated through data processing in XLSTAT 2022.1 (Lumivero, New York, NY, USA) and Past 4.11 (LRI, London, UK). The author’s personal photographs were used.

3. Results

3.1. Local Climatological Data (1888–2025)

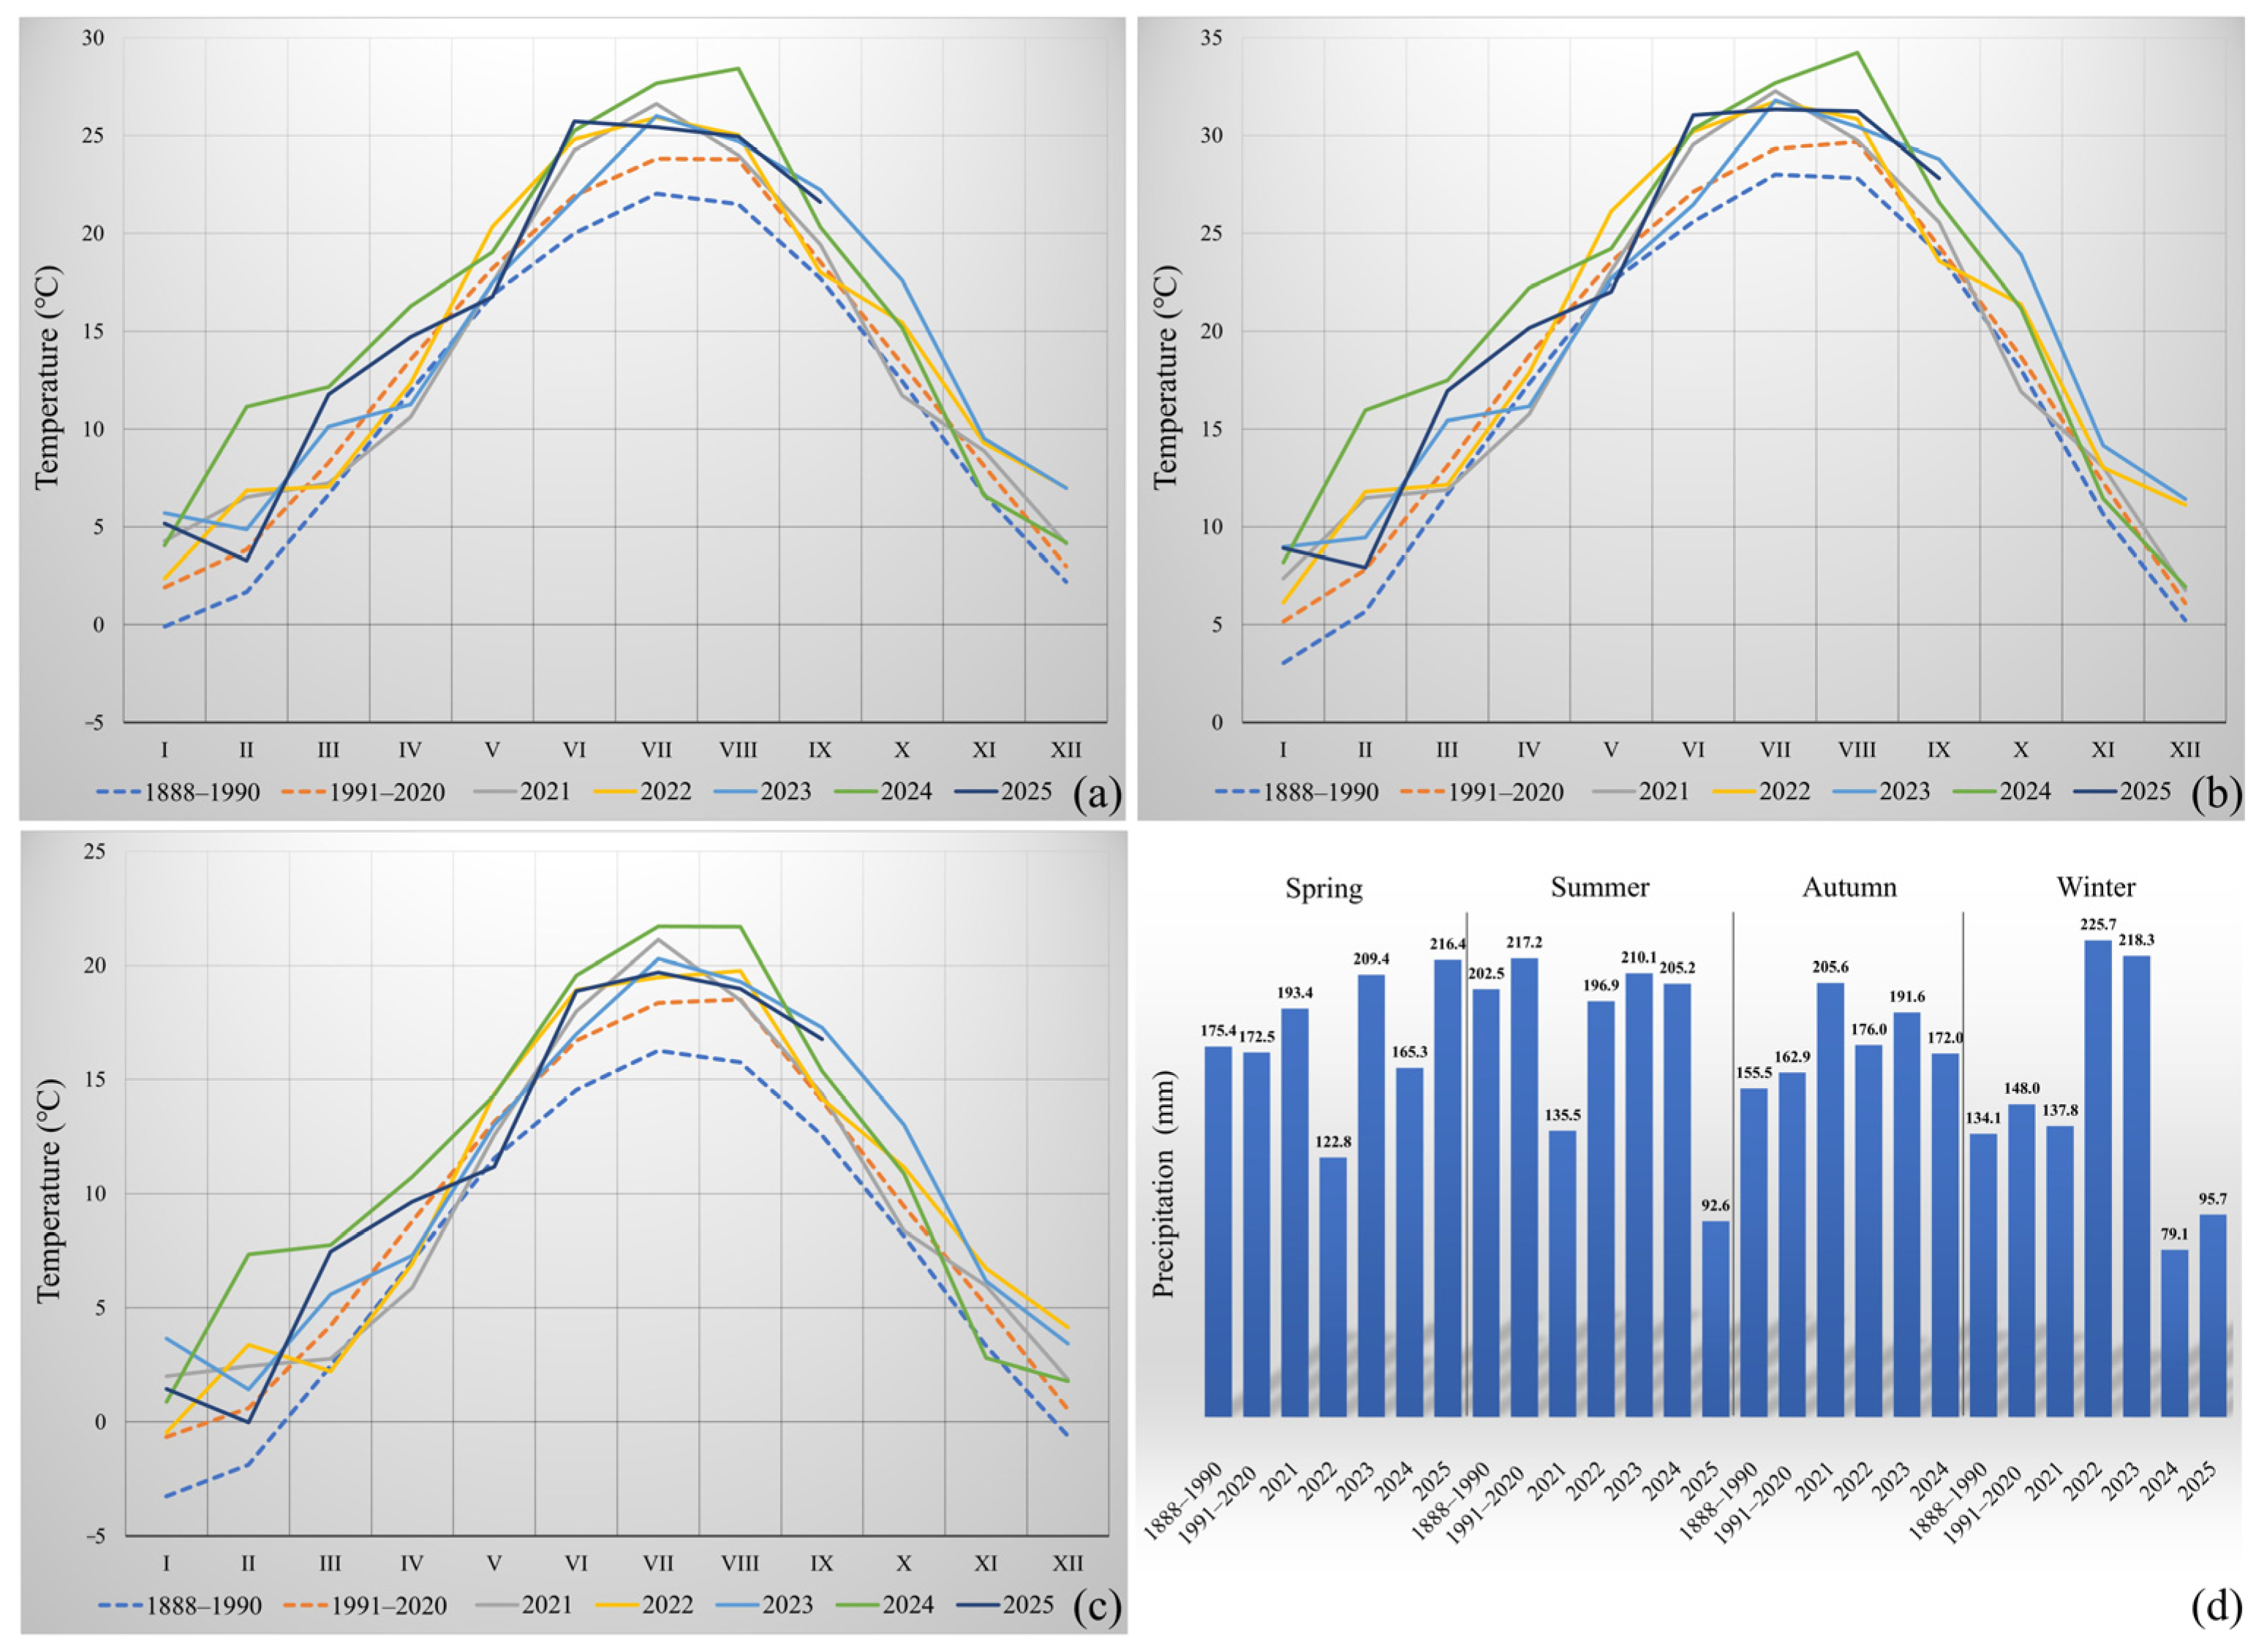
The mean annual air temperature for the period 1991–2020 was 13.2 °C, which is 1.6 °C higher than in 1888–1990 (Table S1a). The warmest months during the reference period were July and August, both with an identical value of 23.8 °C, which is 1.8 °C higher than the warmest July in 1888–1990. The coldest month in the reference period was January (1.9 °C), but it was 2.0 °C warmer compared to the same month in 1888–1990. In 2025, the warmest month was June, with temperatures 3.8 °C higher than in 1991–2020 and 5.7 °C higher than in 1888–1990, while the coldest month was January, with temperatures 3.3 °C higher than in 1991–2020 and 5.3 °C higher than in 1888–1990. Comparative analysis shows that May was colder, with temperatures 1.4 °C lower than in 1991–2020 and 0.1 °C lower than in 1888–2020. The year 2024 stands out as particularly warm, both globally and in Belgrade, with a mean annual temperature of 15.9 °C (the warmest month was August at 28.4 °C, and the coldest was January at 4.1 °C). The mean annual maximum air temperature for 1991–2020 was 18.0 °C, which is 1.4 °C higher than in 1888–1990 (Table S1c). August had the highest mean maximum temperatures in the reference period (29.7 °C), 1.7 °C higher than the warmest July in 1888–1990. The lowest mean maximum monthly temperatures occurred in January (5.2 °C), but were 2.2 °C higher than in the same month in 1888–1990. In 2025, the highest mean maximum temperature occurred in July, 2.0 °C higher than in 1991–2020 and 3.3 °C higher than in 1888–1990, while the lowest occurred in February, 0.1 °C higher than in 1991–2020 and 2.2 °C higher than in 1888–1990. In the coldest May 2025, maximum temperatures were 1.6 °C lower than in 1991–2020 and 0.5 °C lower than in 1888–2020. In 2024, the mean annual maximum temperature was 20.9 °C, with the highest mean maximum in August (29.7 °C) and the lowest in January (5.21 °C). The mean annual minimum air temperature for 1991–2020 was 9.1 °C, which is 1.9 °C higher than in 1888–1990 (Table S1d). August had the highest mean minimum temperatures during the reference period (18.5 °C), 2.1 °C higher than July in 1888–1990. The lowest mean minimum monthly temperatures occurred in January (−0.7 °C), but were 2.6 °C higher than in the same month in 1888–1990. In 2025, the highest mean minimum temperature occurred in July, 1.3 °C higher than in 1991–2020 and 3.4 °C higher than in 1888–1990, while the lowest occurred in February, 0.6 °C higher than in 1991–2020 and 1.9 °C higher than in 1888–1990. In the coldest May 2025, minimum temperatures were 2.0 °C lower than in 1991–2020 and 0.4 °C lower than in 1888–2020. In 2024, the mean annual minimum temperature was 11.2 °C, close to the mean annual air temperature for 1888–1990 (11.6 °C) and 1961–1990 (11.9 °C). Analysis of these data clearly shows an increase in mean, maximum, and minimum monthly and annual air temperatures compared to earlier time series.
The mean annual precipitation (Table S1b) for the reference period (698.8 mm) was 31.3 mm lower than in 1888–1990. However, for plants, the number of days with precipitation ≥ 0.1 mm (Table S1g) is more significant, which decreased by 0.1 days compared to 1888–1990. A larger decrease in the number of days (Table S1h) was observed for days with precipitation ≥ 1.0 mm (2.8 days). The total annual number of sunshine hours (Table S1f) increased by 82.4 h in the reference period compared to 1888–1990. July recorded the highest number of sunshine hours in the reference period (298.7 h), very close to the value for 1888–1990 (290.0 h), while December had the fewest sunshine hours (67.0 h), although this was 3.3 h higher than in December 1888–1990. The mean annual relative humidity (Table S1e) decreased by 2.1% in the reference period compared to 1888–1990. December had the highest mean relative humidity in the reference period (79.9%), 0.3% lower than in January 1888–1990, while August had the lowest (59.9%), 2.4% lower than in July 1888–1990. These results are consistent with predictions that global warming will reach 1.5 °C between 2030 and 2052 [15]. A review of the data indicates that this threshold has already been exceeded. Particularly notable is the increase in the number of days (Table S1i,j,l,n) with daytime Tmax ≥ 25 °C, Tmax ≥ 30 °C, and Tmax ≥ 35 °C, as well as nights with Tmin ≥ 20 °C. At the same time, a decrease is observed in the number of days (Table S1k,m) with Tmin < 0 °C (frost days) and Tmax < 0 °C (ice days). These data align with observations of greater warming than the global average in many regions and during different seasons, with higher increases over land [15].
Comparative analysis of the data shows an increase in mean seasonal air temperatures in the reference period compared to earlier time series (Table S1a,c,d), with rises relative to 1888–1990 of 1.3 °C (spring), 1.6 °C (summer), 0.9 °C (autumn), and 1.7 °C (winter). Mean seasonal maximum air temperatures were higher than in 1888–1990 by 1.6 °C (spring), 2.0 °C (summer), 1.0 °C (autumn), and 1.6 °C (winter), while mean seasonal minimum air temperatures were higher by 1.7 °C (spring), 2.4 °C (summer), 1.5 °C (autumn), and 2.0 °C (winter). In the globally warmest year, 2024, the highest mean seasonal temperatures were recorded across all seasons (Figure 4b), showing increases relative to the reference period of 2.4 °C (spring), 3.9 °C (summer), 0.7 °C (autumn), and 4.5 °C (winter). Mean seasonal maximum air temperatures (Figure 4a) were higher than the reference period by 2.8 °C (spring), 3.7 °C (summer), 1.3 °C (autumn), and 5.5 °C (winter), while mean seasonal minimum air temperatures (Figure 4c) were higher than in 1991–2020 by 2.2 °C (spring), 3.1 °C (summer), 0.2 °C (autumn), and 3.8 °C (winter).
Seasonal air temperatures were variable (Table S1b) depending on the time of year but were significantly higher across all seasons, particularly during 2024, compared to the reference period. Seasonal precipitation during the reference period was lower than in 1888–1990 only in spring (by 2.9 mm), but higher in summer (by 14.7 mm), autumn (by 7.4 mm), and winter (by 13.9 mm). During 2024, lower precipitation totals were observed (Figure 4d) in spring (by 7.2 mm), summer (by 12.0 mm), and winter (by 68.9 mm), and higher in autumn (by 9.1 mm) compared to the reference period. The number of days with precipitation ≥ 0.1 mm (Table S1g) was lower by 0.3 days (spring), 1.4 days (summer), and 0.2 days (autumn), but higher by 2.1 days (winter) in the reference period compared to 1888–1990. A decrease was also observed in the number of days with precipitation ≥ 1.0 mm (Table S1h) across all seasons: 1.1 days (spring), 1.0 day (summer), 0.5 days (autumn), and 0.2 days (winter) in the reference period relative to 1888–1990. The year 2024 stands out with a significant reduction in days with precipitation ≥ 1.0 mm compared to the reference period: 0.8 days (spring), 7.3 days (summer), 3.6 days (autumn), and 5.4 days (winter). The total annual sunshine hours (Table S1f) increased by 40.4 h (spring), 16.3 h (summer), 3.8 h (autumn), and 24.9 h (winter) in the reference period relative to 1925–1990 (according to RHMZ, sunshine duration has been recorded since 1925). Comparing 2024 to the reference period, sunshine duration increased by 57.4 h (spring), 98.5 h (summer), 46.1 h (autumn), and 87.3 h (winter). Mean seasonal relative humidity (Table S1e) decreased in the reference period compared to 1888–1990 by 2.7% (spring and summer), 0.7% (autumn), and 2.4% (winter). In 2024, relative to the reference period, the decreases were 3.9% (spring), 12.4% (summer), 6.0% (autumn), and 8.3% (winter). An increase was observed in the number of days (Table S1i,j,l,n) with daytime Tmax ≥ 25 °C: 3.8 days (spring), 9.4 days (summer), and 1.6 days (autumn); Tmax ≥ 30 °C: 1.1 days (spring) and 12.2 days (summer); Tmax ≥ 35 °C: 3.9 days (summer) and 0.1 days (autumn); and nights with Tmin ≥ 20 °C: 0.3 days (spring), 17.5 days (summer), and 1.0 day (autumn) in the reference period relative to 1888–1990. At the same time, a decrease was noted in the number of days (Table S1k,m) with Tmin < 0 °C: 4.0 days (spring), 3.0 days (autumn), and 11.8 days (winter), and Tmax < 0 °C: 0.5 days (spring), 0.3 days (autumn), and 6.3 days (winter) in the reference period compared to 1888–1990.

3.2. Diversity, Growth Parameters, Ornamentality, and Vitality of Tree Taxa

In Topčider Park, 71 taxa were recorded (Aesculus hippocastanum L., Aesculus flava Sol., Acer campestre L., Acer negundo L., Acer platanoides L., Acer platanoides ‘Schwdlerii’, Acer pseudoplatanus ‘Atropurpureum’, Acer pseudoplatanus L., Alnus glutinosa (L.) Gaertn., Alnus incana (L.) Moench, Betula pendula Roth, Betula pendula ‘Fastigiata’, Cercis siliquastrum L., Carpinus betulus L., Catalpa bignonioides Walter, Corylus colurna L., Crataegus monogyna Jacq., Celtis australis L., Cornus mas L., Fraxinus ornus L., Fraxinus excelsior L., Fraxinus excelsior ‘Monophylla’, Fraxinus angustifolia Vahl, Fraxinus pennsylvanica Marshall, Fagus sylvatica L., Gleditsia triacanthos f. inermis (Castigl.) Zabel, Juglans regia L., Liriodendron tulipifera L., Liquidambar styraciflua L., Morus alba L., Morus alba ‘Pendula’, Malus sylvestris (L.) Mill., Maclura pomifera (Raf.) C.K.Schneid., Platanus × hispanica Mill. ex Münchh., Pyrus communis subsp. communis (Pyrus pyraster (L.) Burgsd.), Populus alba L., Populus nigra L., Prunus avium (L.) L., Prunus cerasifera Ehrh., Robinia pseudoacacia L., Rhus typhina L., Quercus robur L., Quercus robur ‘Fastigiata’, Quercus rubra L., Quercus palustris Münchh., Quercus pubescens subsp. pubescens (Quercus virgiliana (Ten.) Ten.), Quercus petraea (Matt.) Liebl., Salix babylonica f. babylonica (Salix matsudana Koidz.), Salix babylonica var. pekinensis ‘Tortuosa’ (Salix matsudana ‘Tortuosa’), Salix alba L., Tilia tomentosa Moench, Tilia platyphyllos Scop., Tilia cordata Mill., Tilia × europaea L., Ulmus glabra Huds., Ulmus minor Mill., Ginkgo biloba L., Abies alba Mill., Abies nordmanniana (Steven) Spach, Cedrus atlantica (Endl.) Manetti ex Carrière, Cryptomeria japonica (Thunb. ex L.f.) D.Don, Picea abies (L.) H.Karst., Picea pungens Engelm., Pinus nigra J.F.Arnold, Pinus sylvestris L., Pinus wallichiana A.B.Jacks., Pinus strobus L., Platycladus orientalis (L.) Franco, Thuja occidentalis L., Taxodium distichum (L.) Rich. and Taxus baccata L.) with a total of 760 trees. The taxonomic classification of the recorded taxa, their origin, and potential invasiveness are presented in Table 1.
Considering the context of the study and the specific characteristics of the investigated area, the diversity of tree taxa (Table 2) in Topčider Park (3.57) and among Angiospermae (3.29) is high, as H’ values > 3 indicate a highly diverse ecosystem, with a broad distribution of individuals across each taxon and increased community stability (Table 2).
Gymnospermae showed lower–moderate diversity (2.18), indicating a moderate distribution of individuals across each taxon as well as moderate community strength. On the other hand, the Pielou evenness index (J’) for all trees in the park (0.84) indicates a high uniformity of taxa by number, although Gymnospermae exhibited slightly lower evenness (0.81) compared to Angiospermae (0.82).
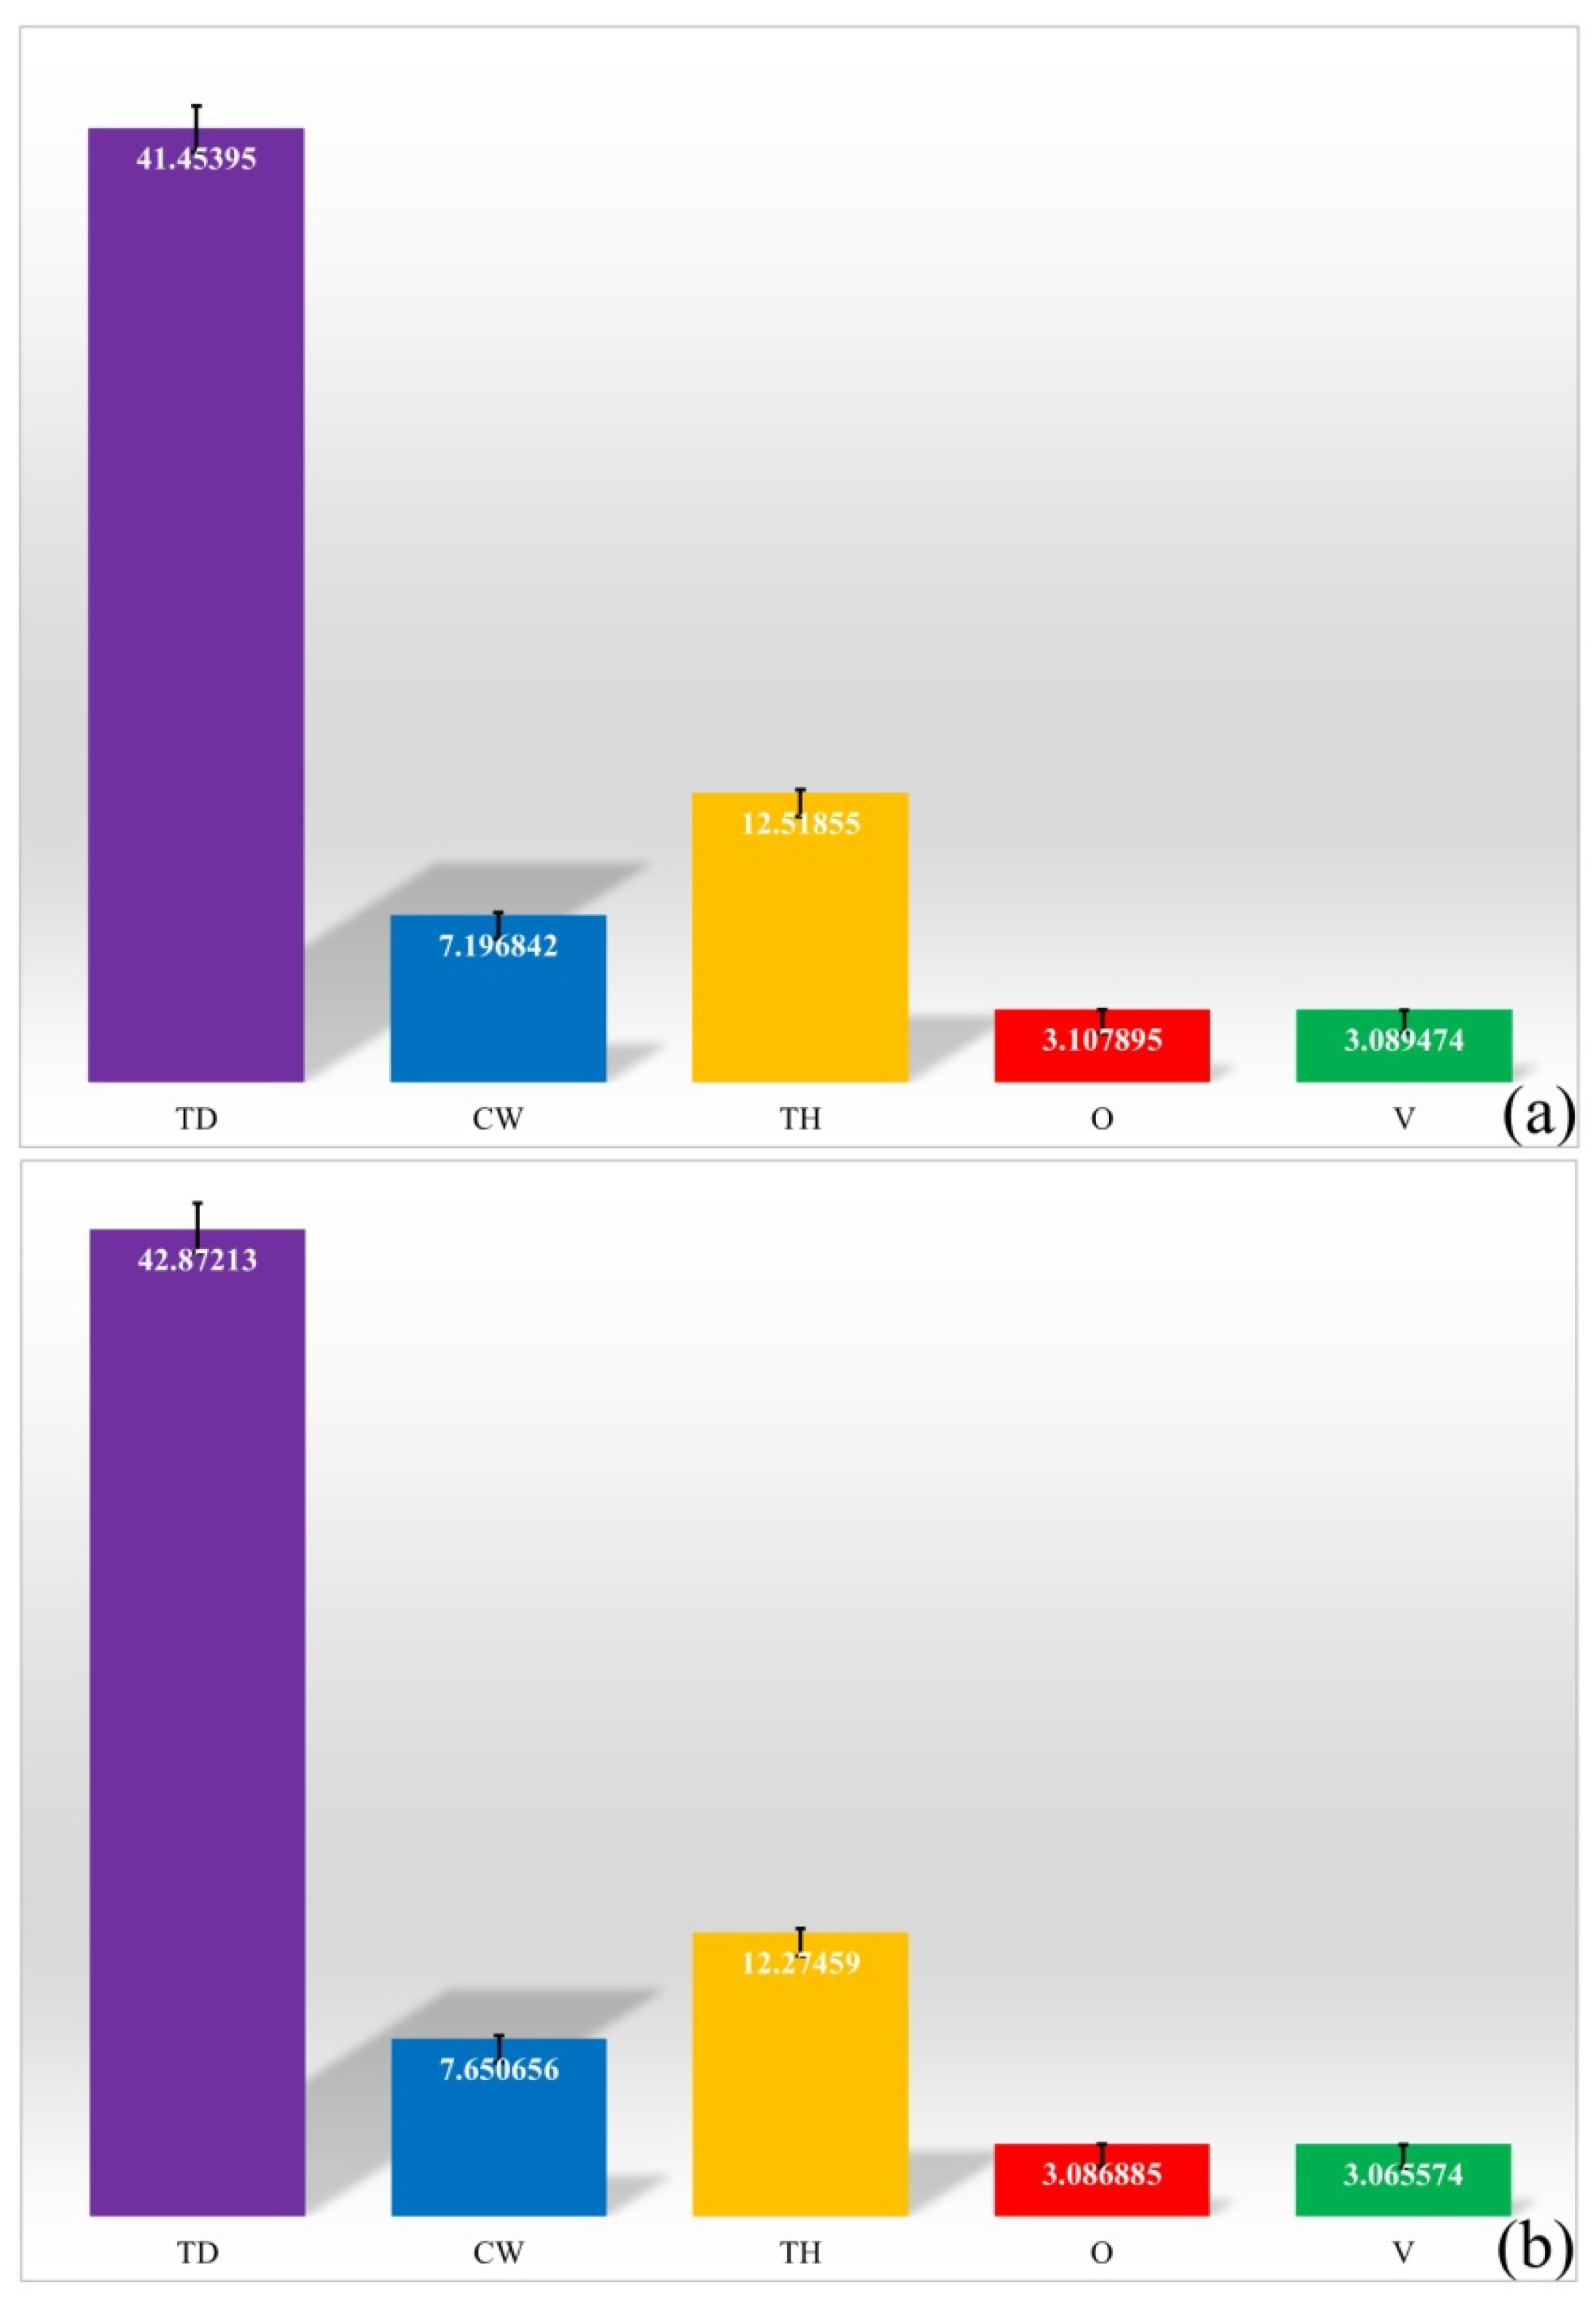
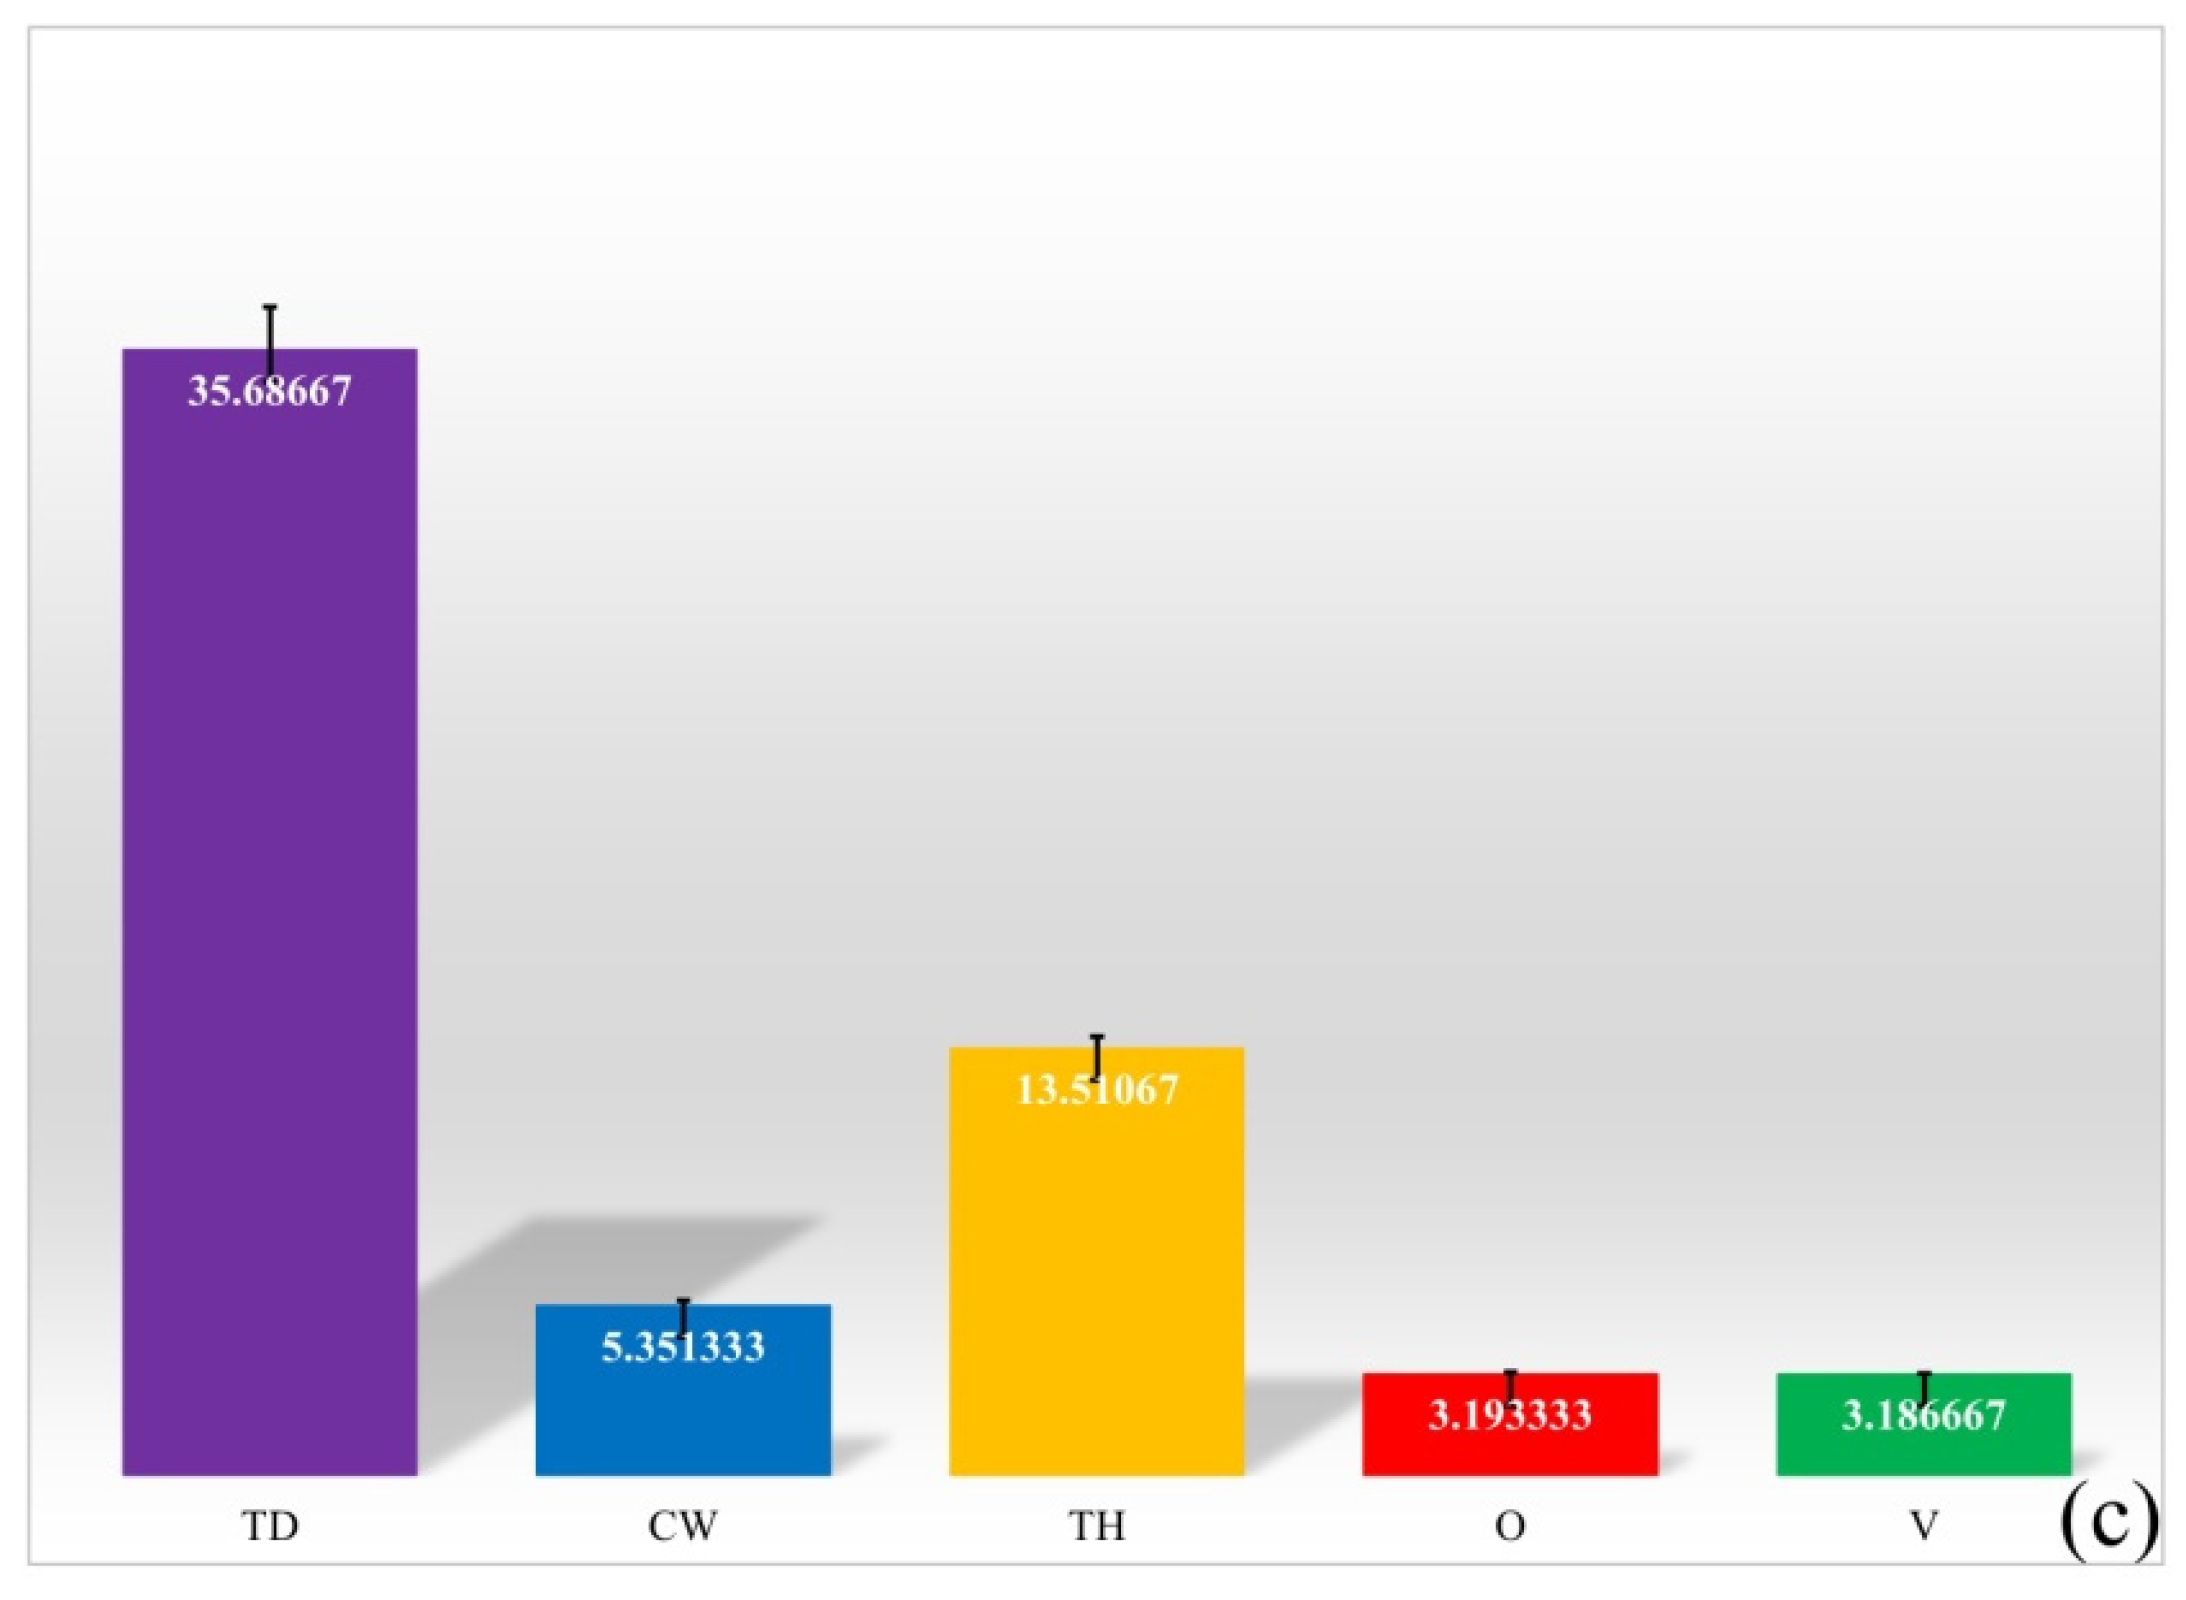
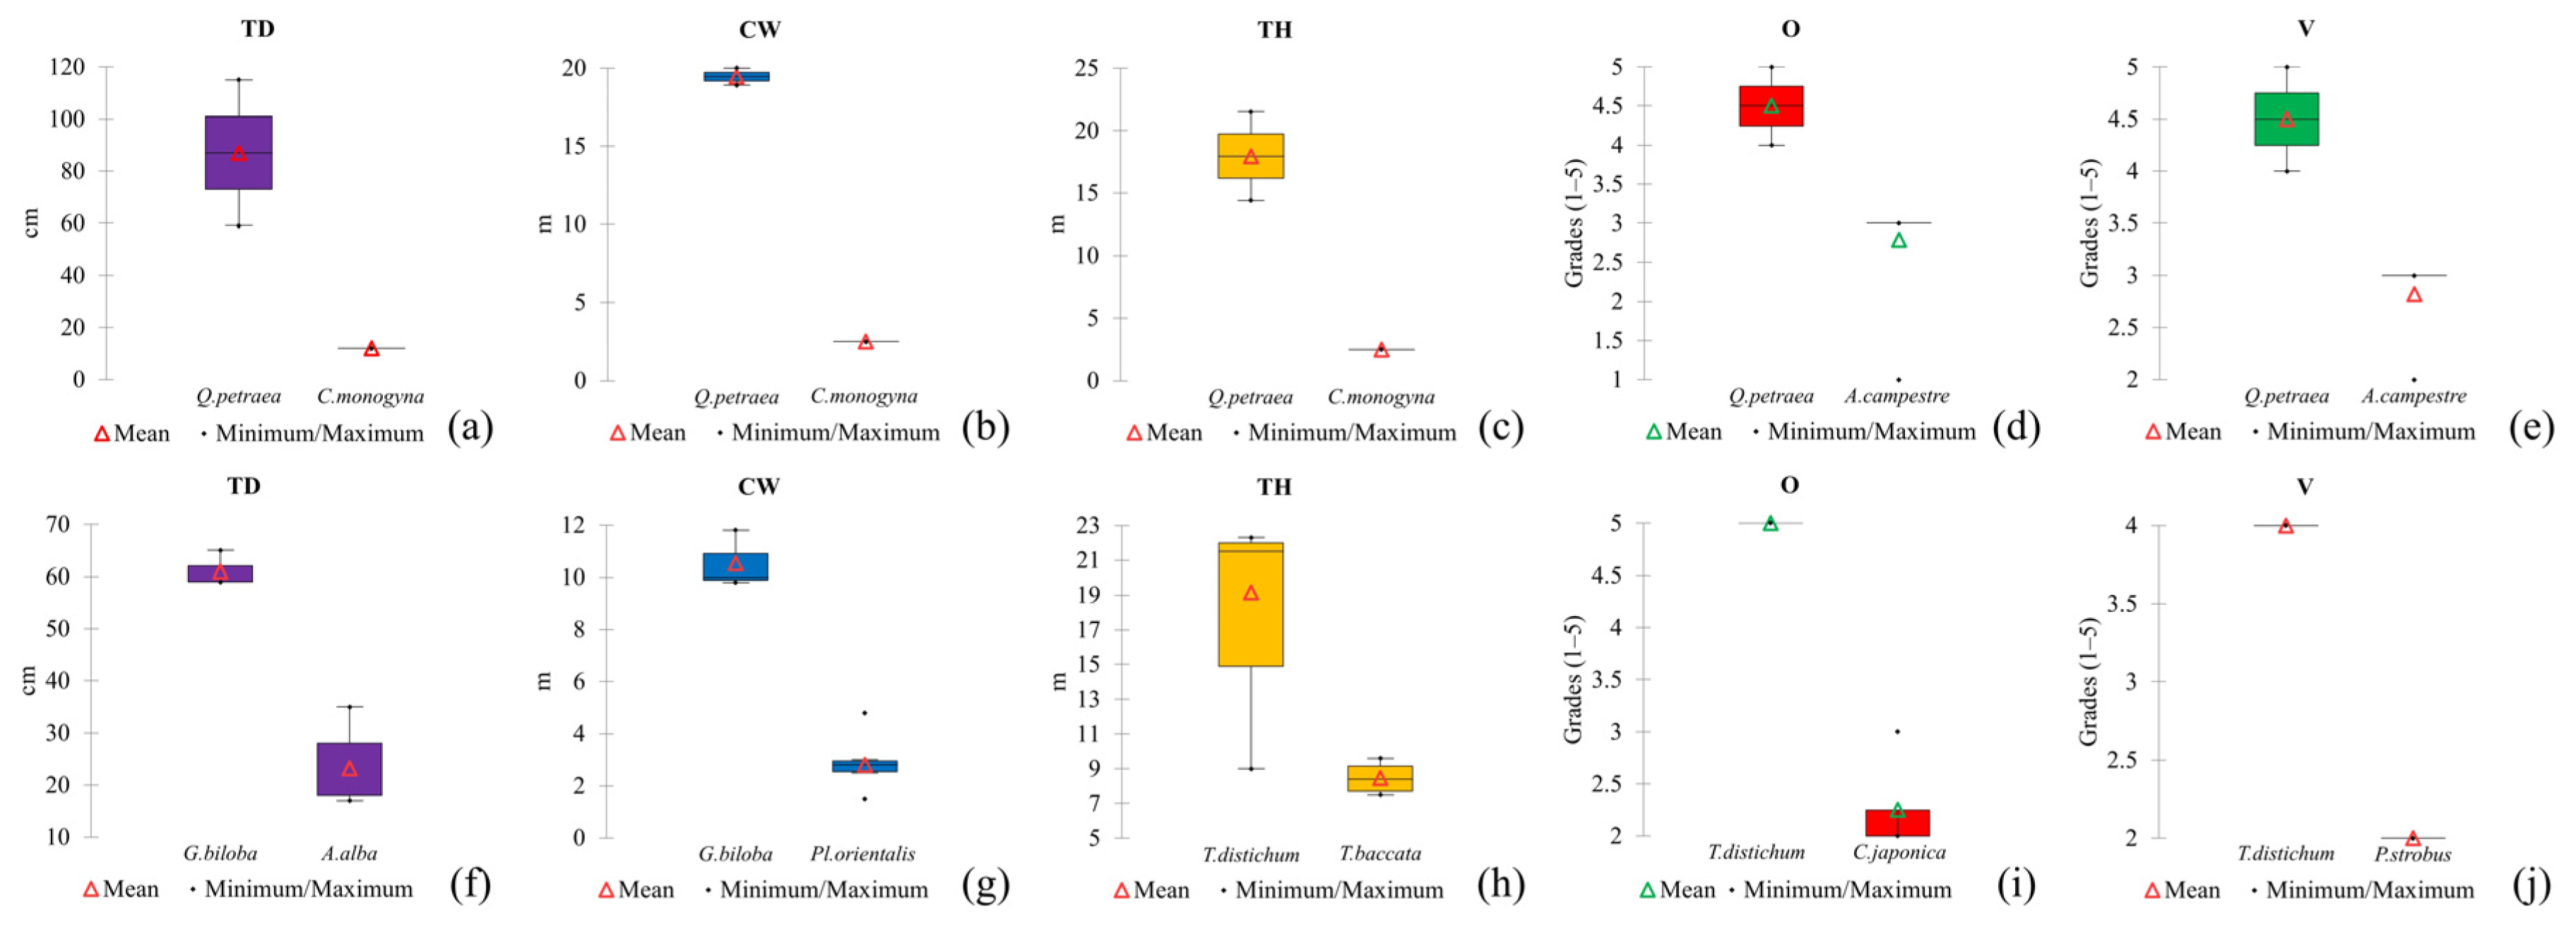
Descriptive statistics at the taxon level for the investigated parameters are presented in Table S2. Variations in the investigated parameters (Figure 5) demonstrate the specific effects of location on Angiospermae and Gymnospermae taxa in Topčider Park. Angiospermae are represented by 56 taxa comprising a total of 610 trees, while Gymnospermae include 15 taxa with a total of 150 trees. Among Angiospermae, the taxa with the highest and lowest values of the analysed parameters are Q. petraea, C. monogyna, and A. campestre, whereas among Gymnospermae, they are T. distichum and G. biloba, as well as T. baccata, A. alba, Pl. orientalis, C. japonica, and P. strobus (Figure 6). At the individual level, a P. × hispanica tree in Topčider Park stands out, with a height of 34 m, a trunk diameter of 41.45 cm, and a crown diameter of 49 m. This tree, nearly 200 years old (since 1836), is located near Milošev Konak.
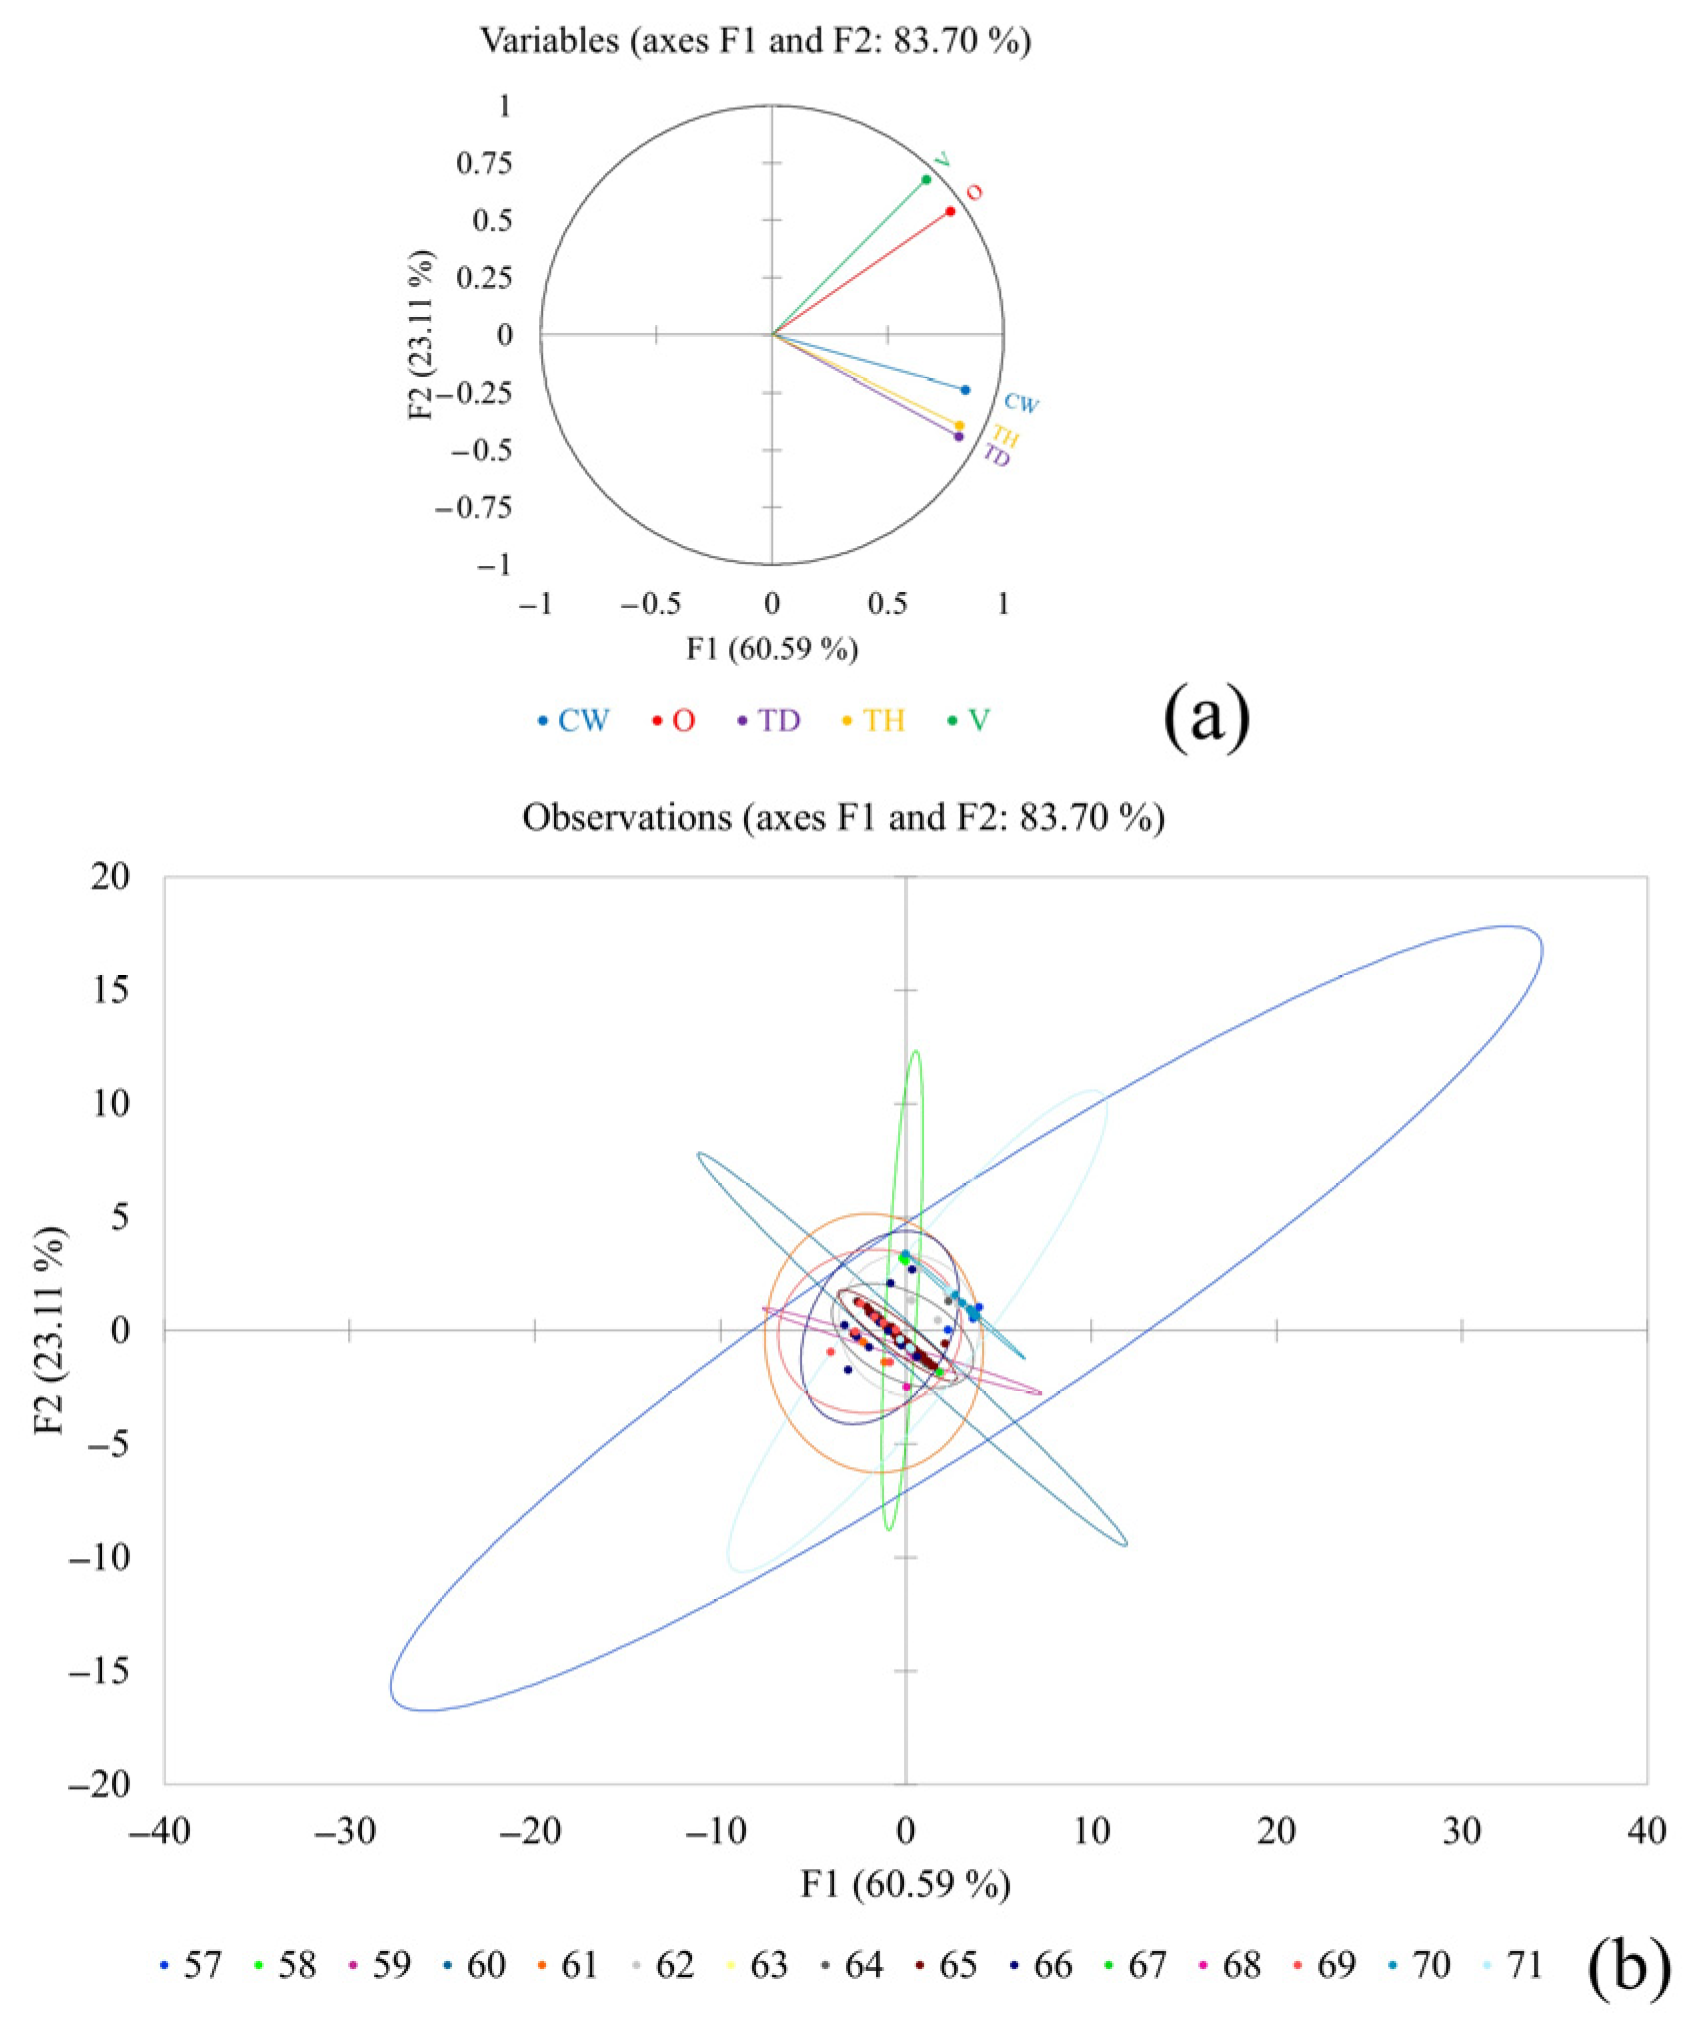
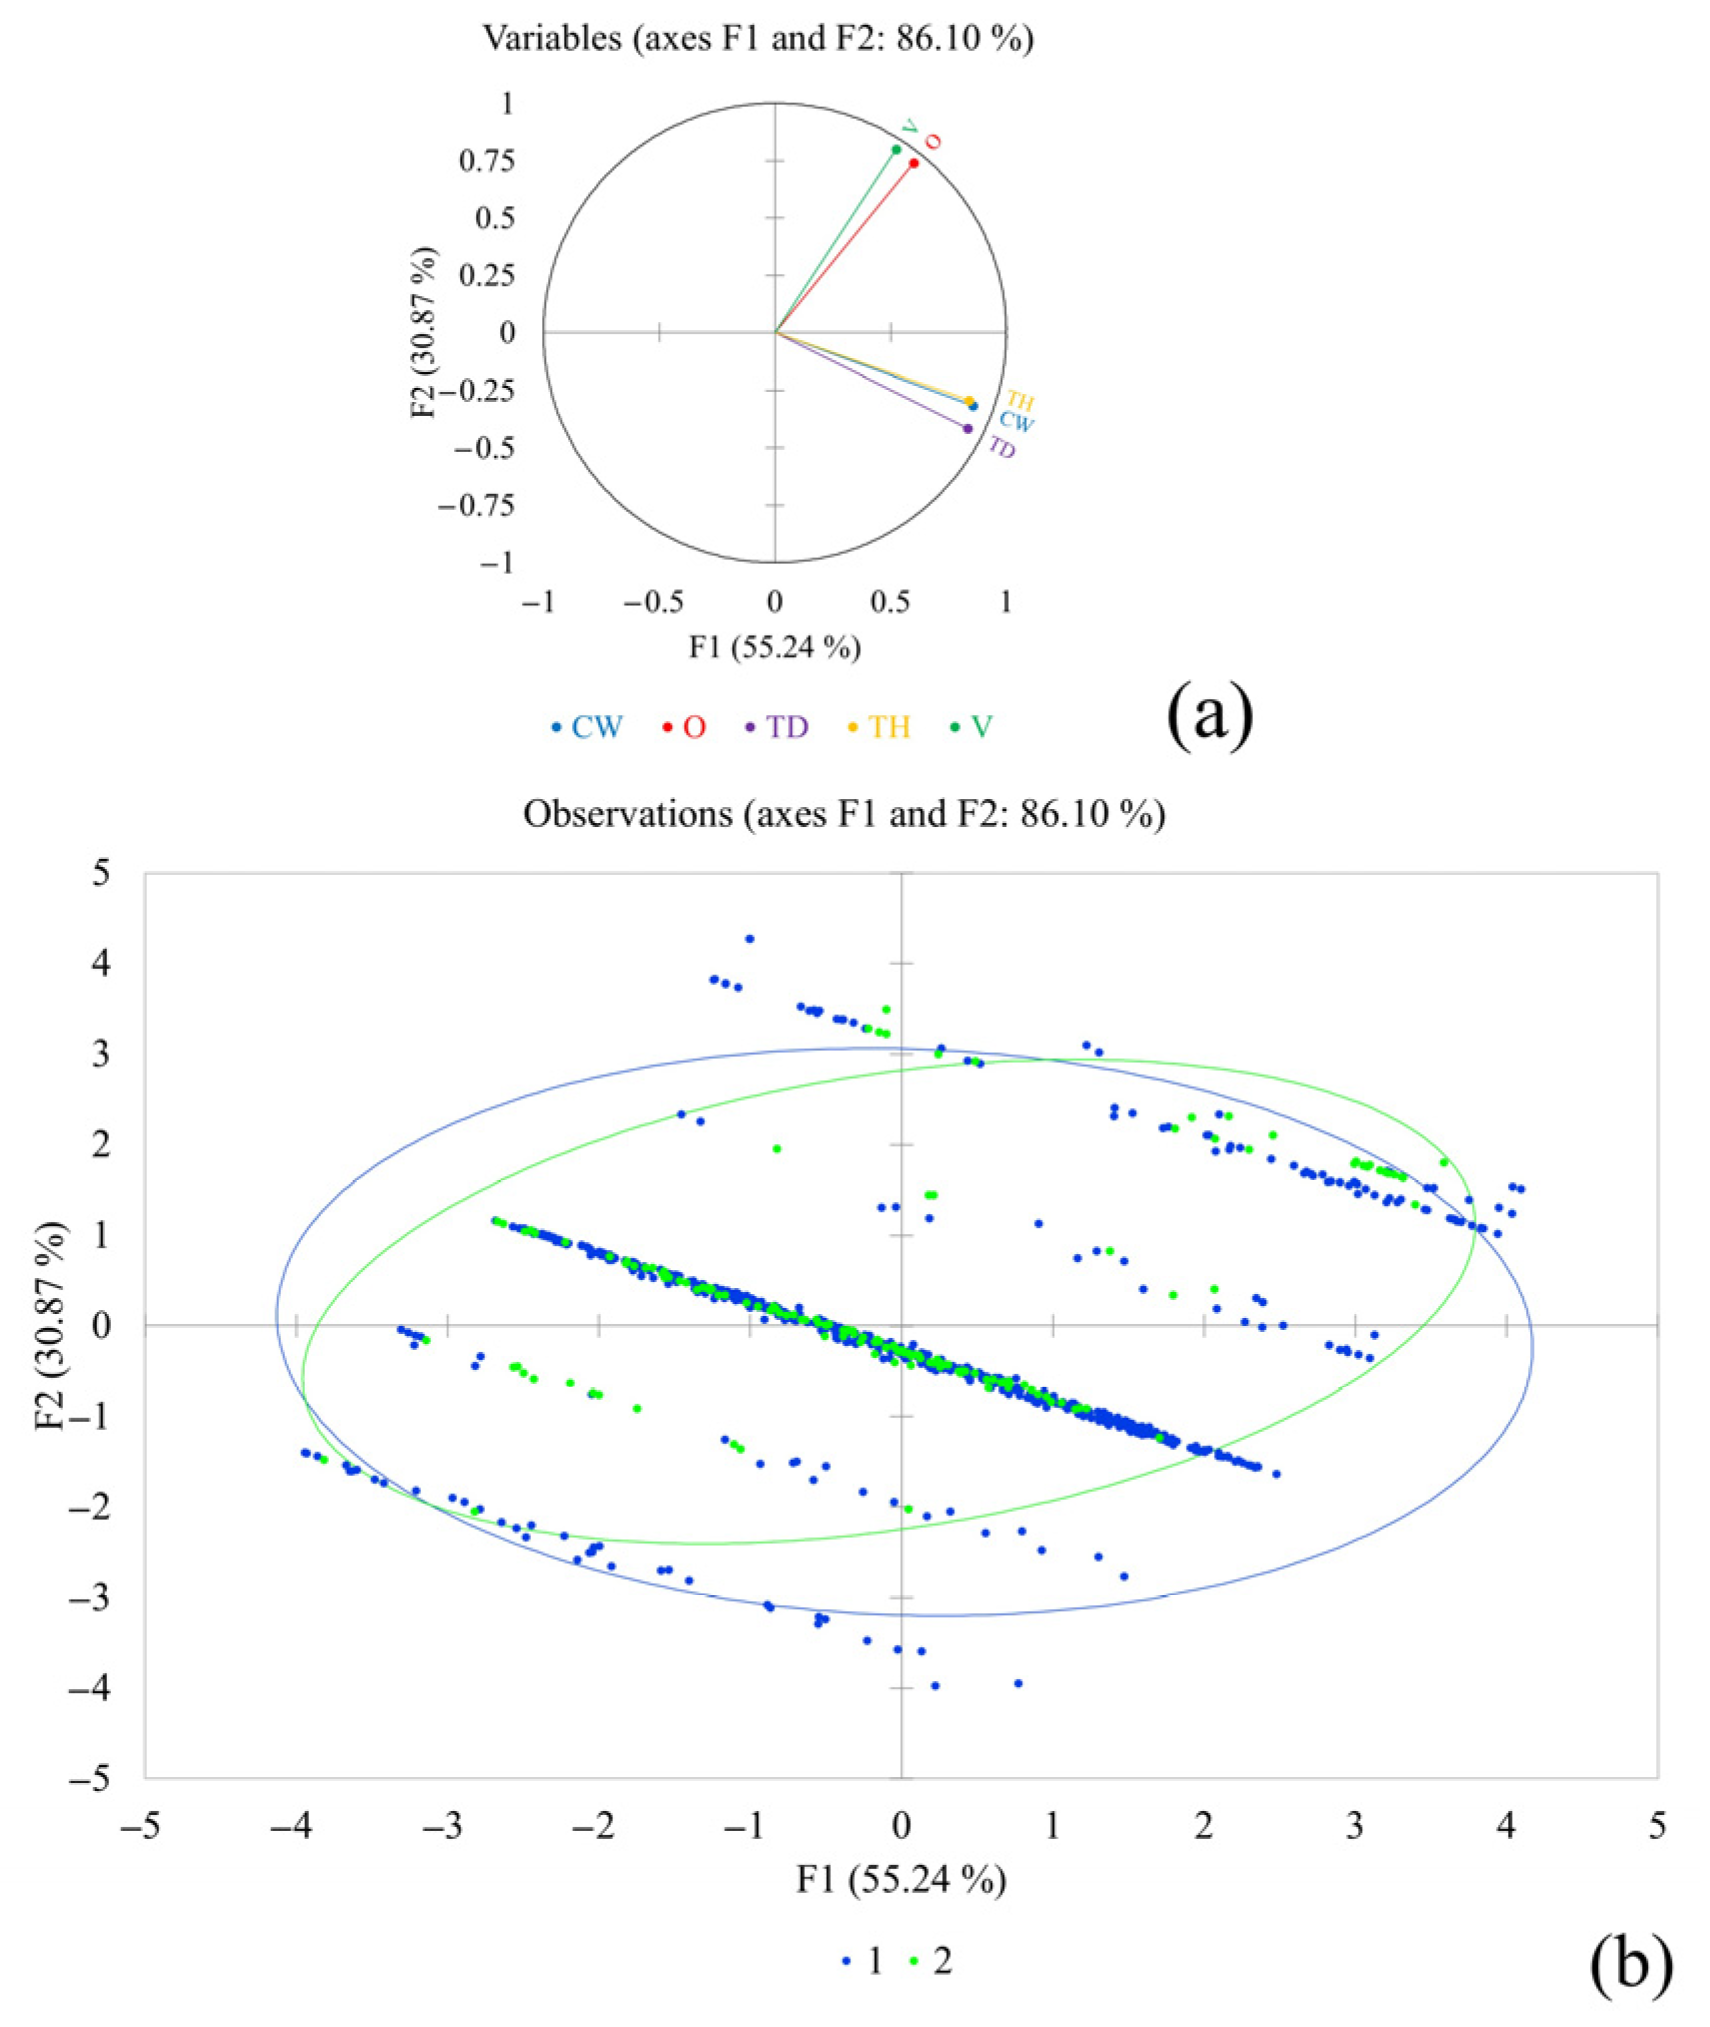
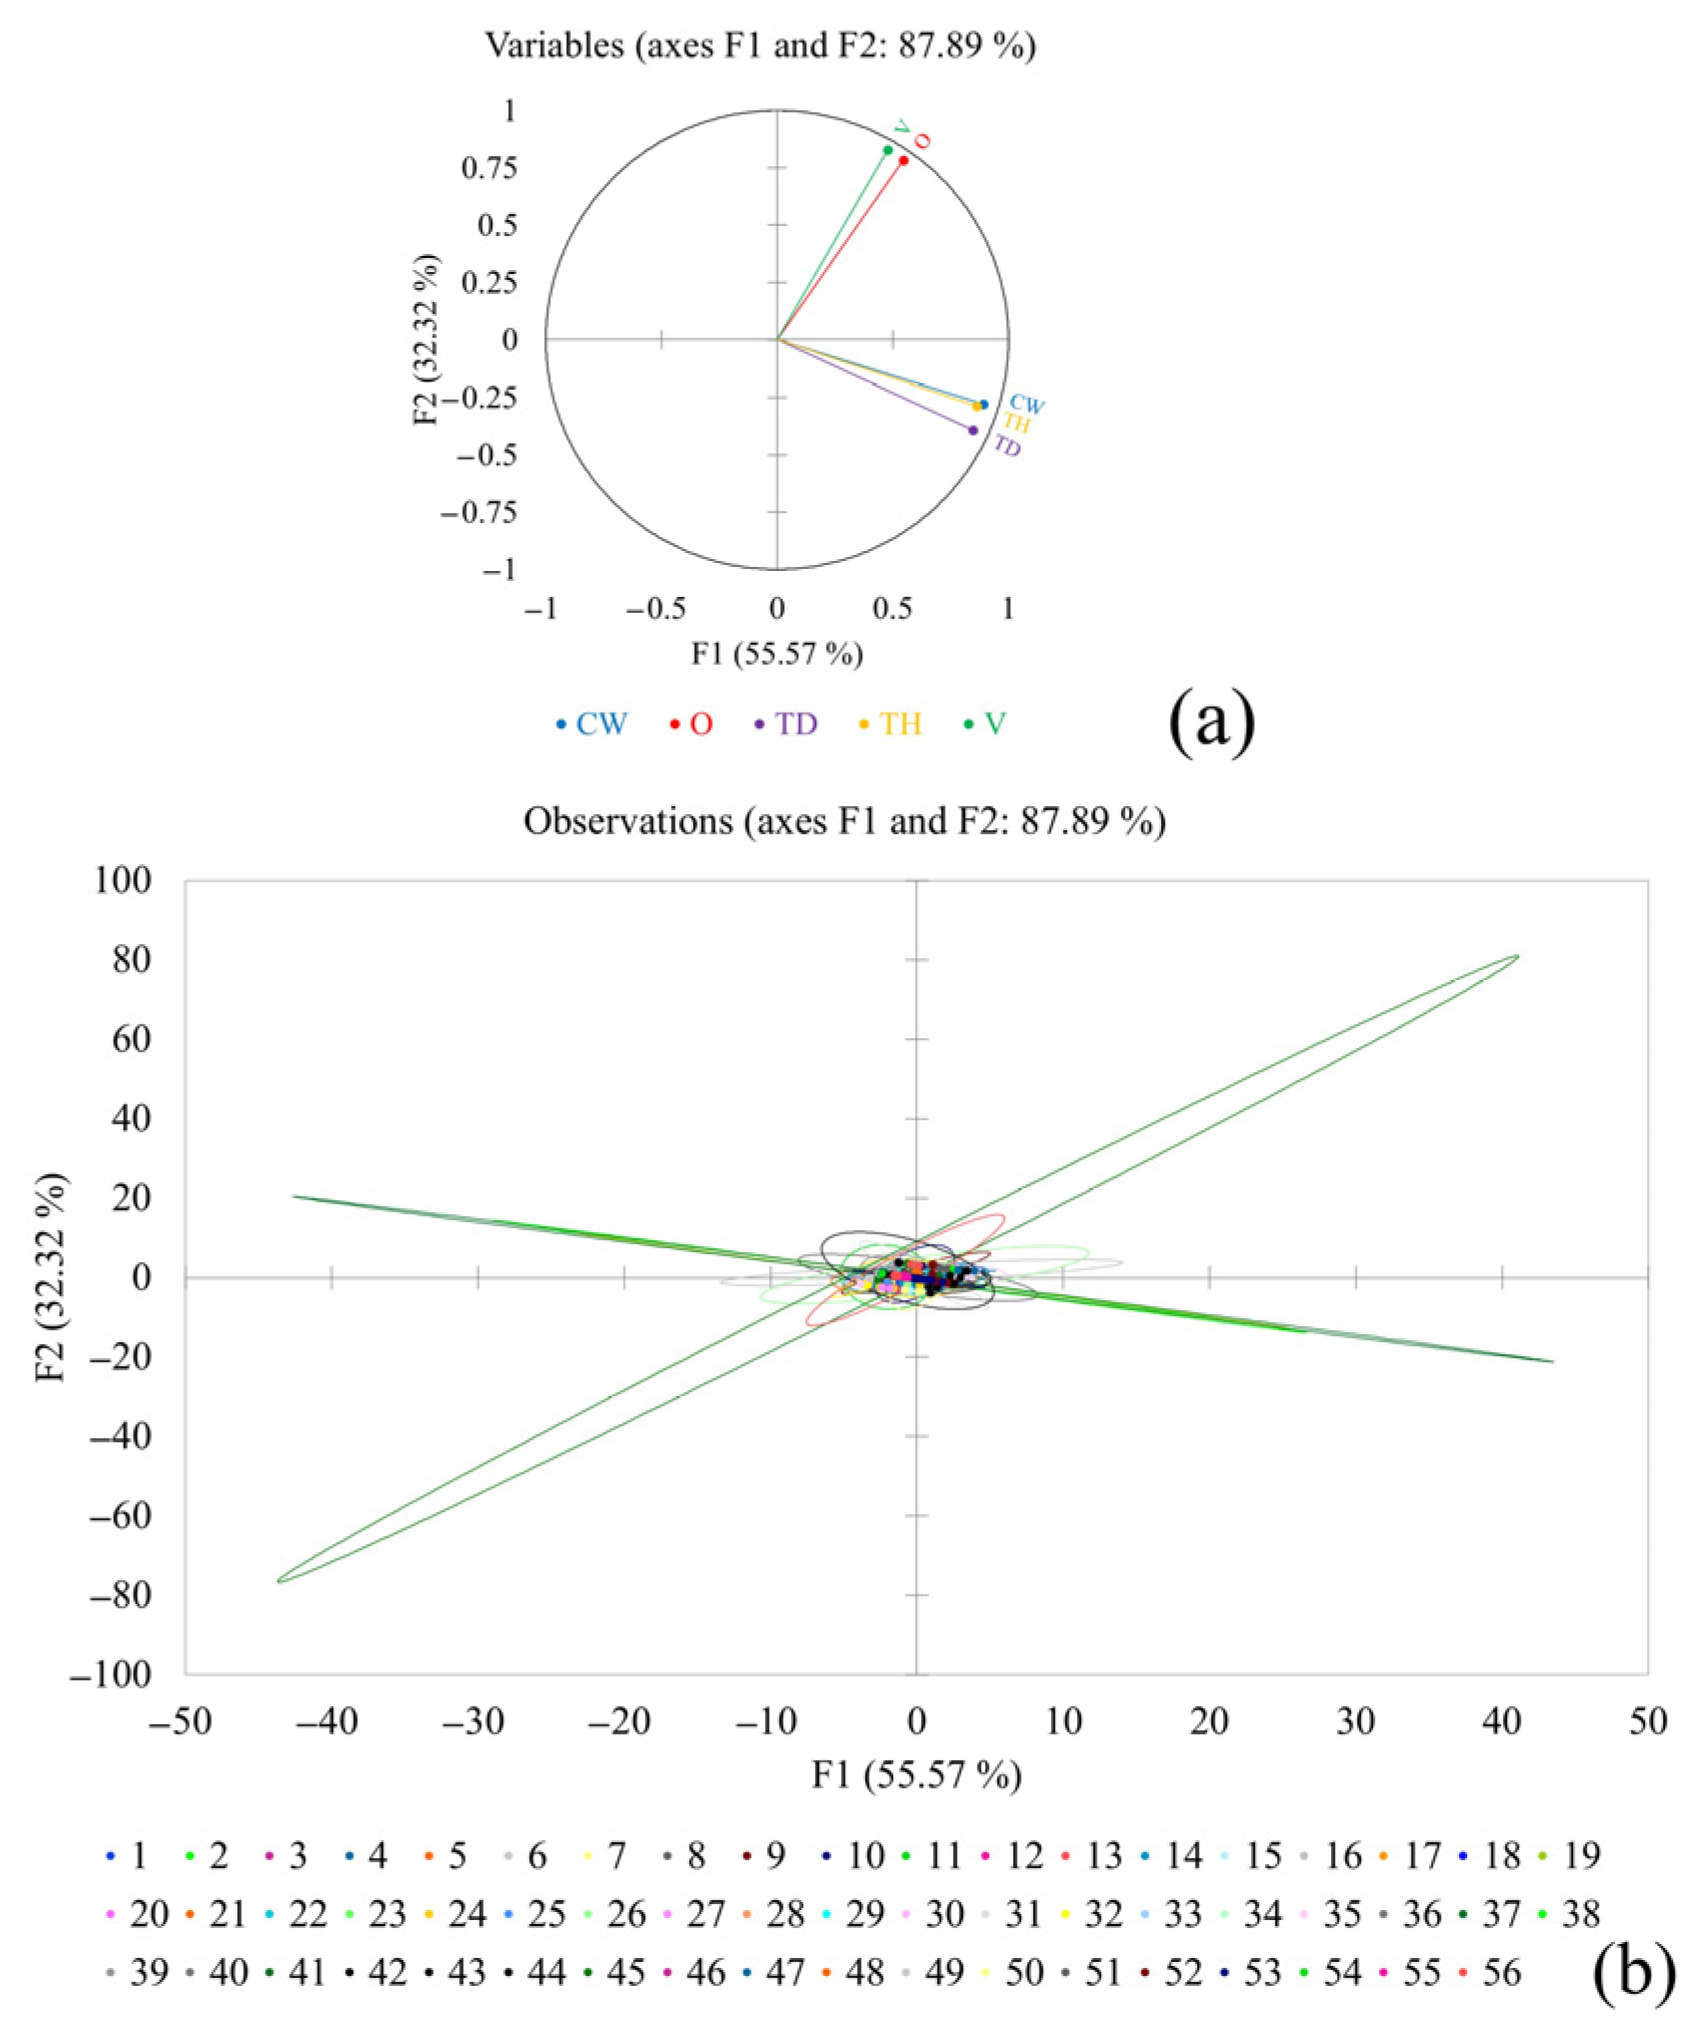
To determine the interrelationships among tree height, trunk diameter, crown width, ornamentality, and vitality, a principal component analysis (PCA) was conducted, with the results visually presented across six separate plots (Figure 7, Figure 8 and Figure 9). In plots a the components (variables) are shown, while plots b display the observations. The first axis explained 55.24% of the variability, and the first two axes together accounted for 86.10% of the variability for all trees at the park level (Figure 7). For Angiospermae, these values were 55.57% and 87.89% (Figure 8), and for Gymnospermae, 60.59% and 83.70% (Figure 9).
Specifically, all parameters were positively associated with F1, while vitality and ornamentality were positively, and tree height, trunk diameter, and crown width were negatively associated with F2. As shown in diagrams a, b, and c, the vectors of all variables lie close to the circle, indicating that all variables contributed to the corresponding PCA axes. Notably, the proximity of the vectors (acute angles) of vitality and ornamentality, and, on the other hand, tree height, trunk diameter, and crown width, confirms their positive correlations. Angles close to 90° indicate a lack of correlation between growth parameters and vitality or ornamentality for trees at the park level and for Angiospermae (Figure 7 and Figure 8), whereas for Gymnospermae, the angle suggests a moderate correlation between ornamentality and growth parameters (Figure 9). PCA ordination diagrams based on variable observations under joint consideration showed minor differences between Angiospermae and Gymnospermae (Figure 7), while P. × hispanica and Q. robur were clearly distinct among Angiospermae (Figure 8). Among Gymnospermae, G. biloba and T. distichum were distinct, although A. nordmanniana, P. wallichiana, and P. sylvestris were close in terms of the analysed parameters (Figure 9). Confirmation of the above is the fact that the PCA included a set of data containing more than two variables, so it was considered as a multiple linear regression analysis along the main axes. Namely, in the sense of the ellipsoid models shown, the eigenvectors represent the orientations of the main and various minor axes, oriented so that they are aligned with the main directions of variation in the sample and are uncorrelated [59].

3.3. Fresh Biomass, Carbon Sequestration, and CO2 Reduction

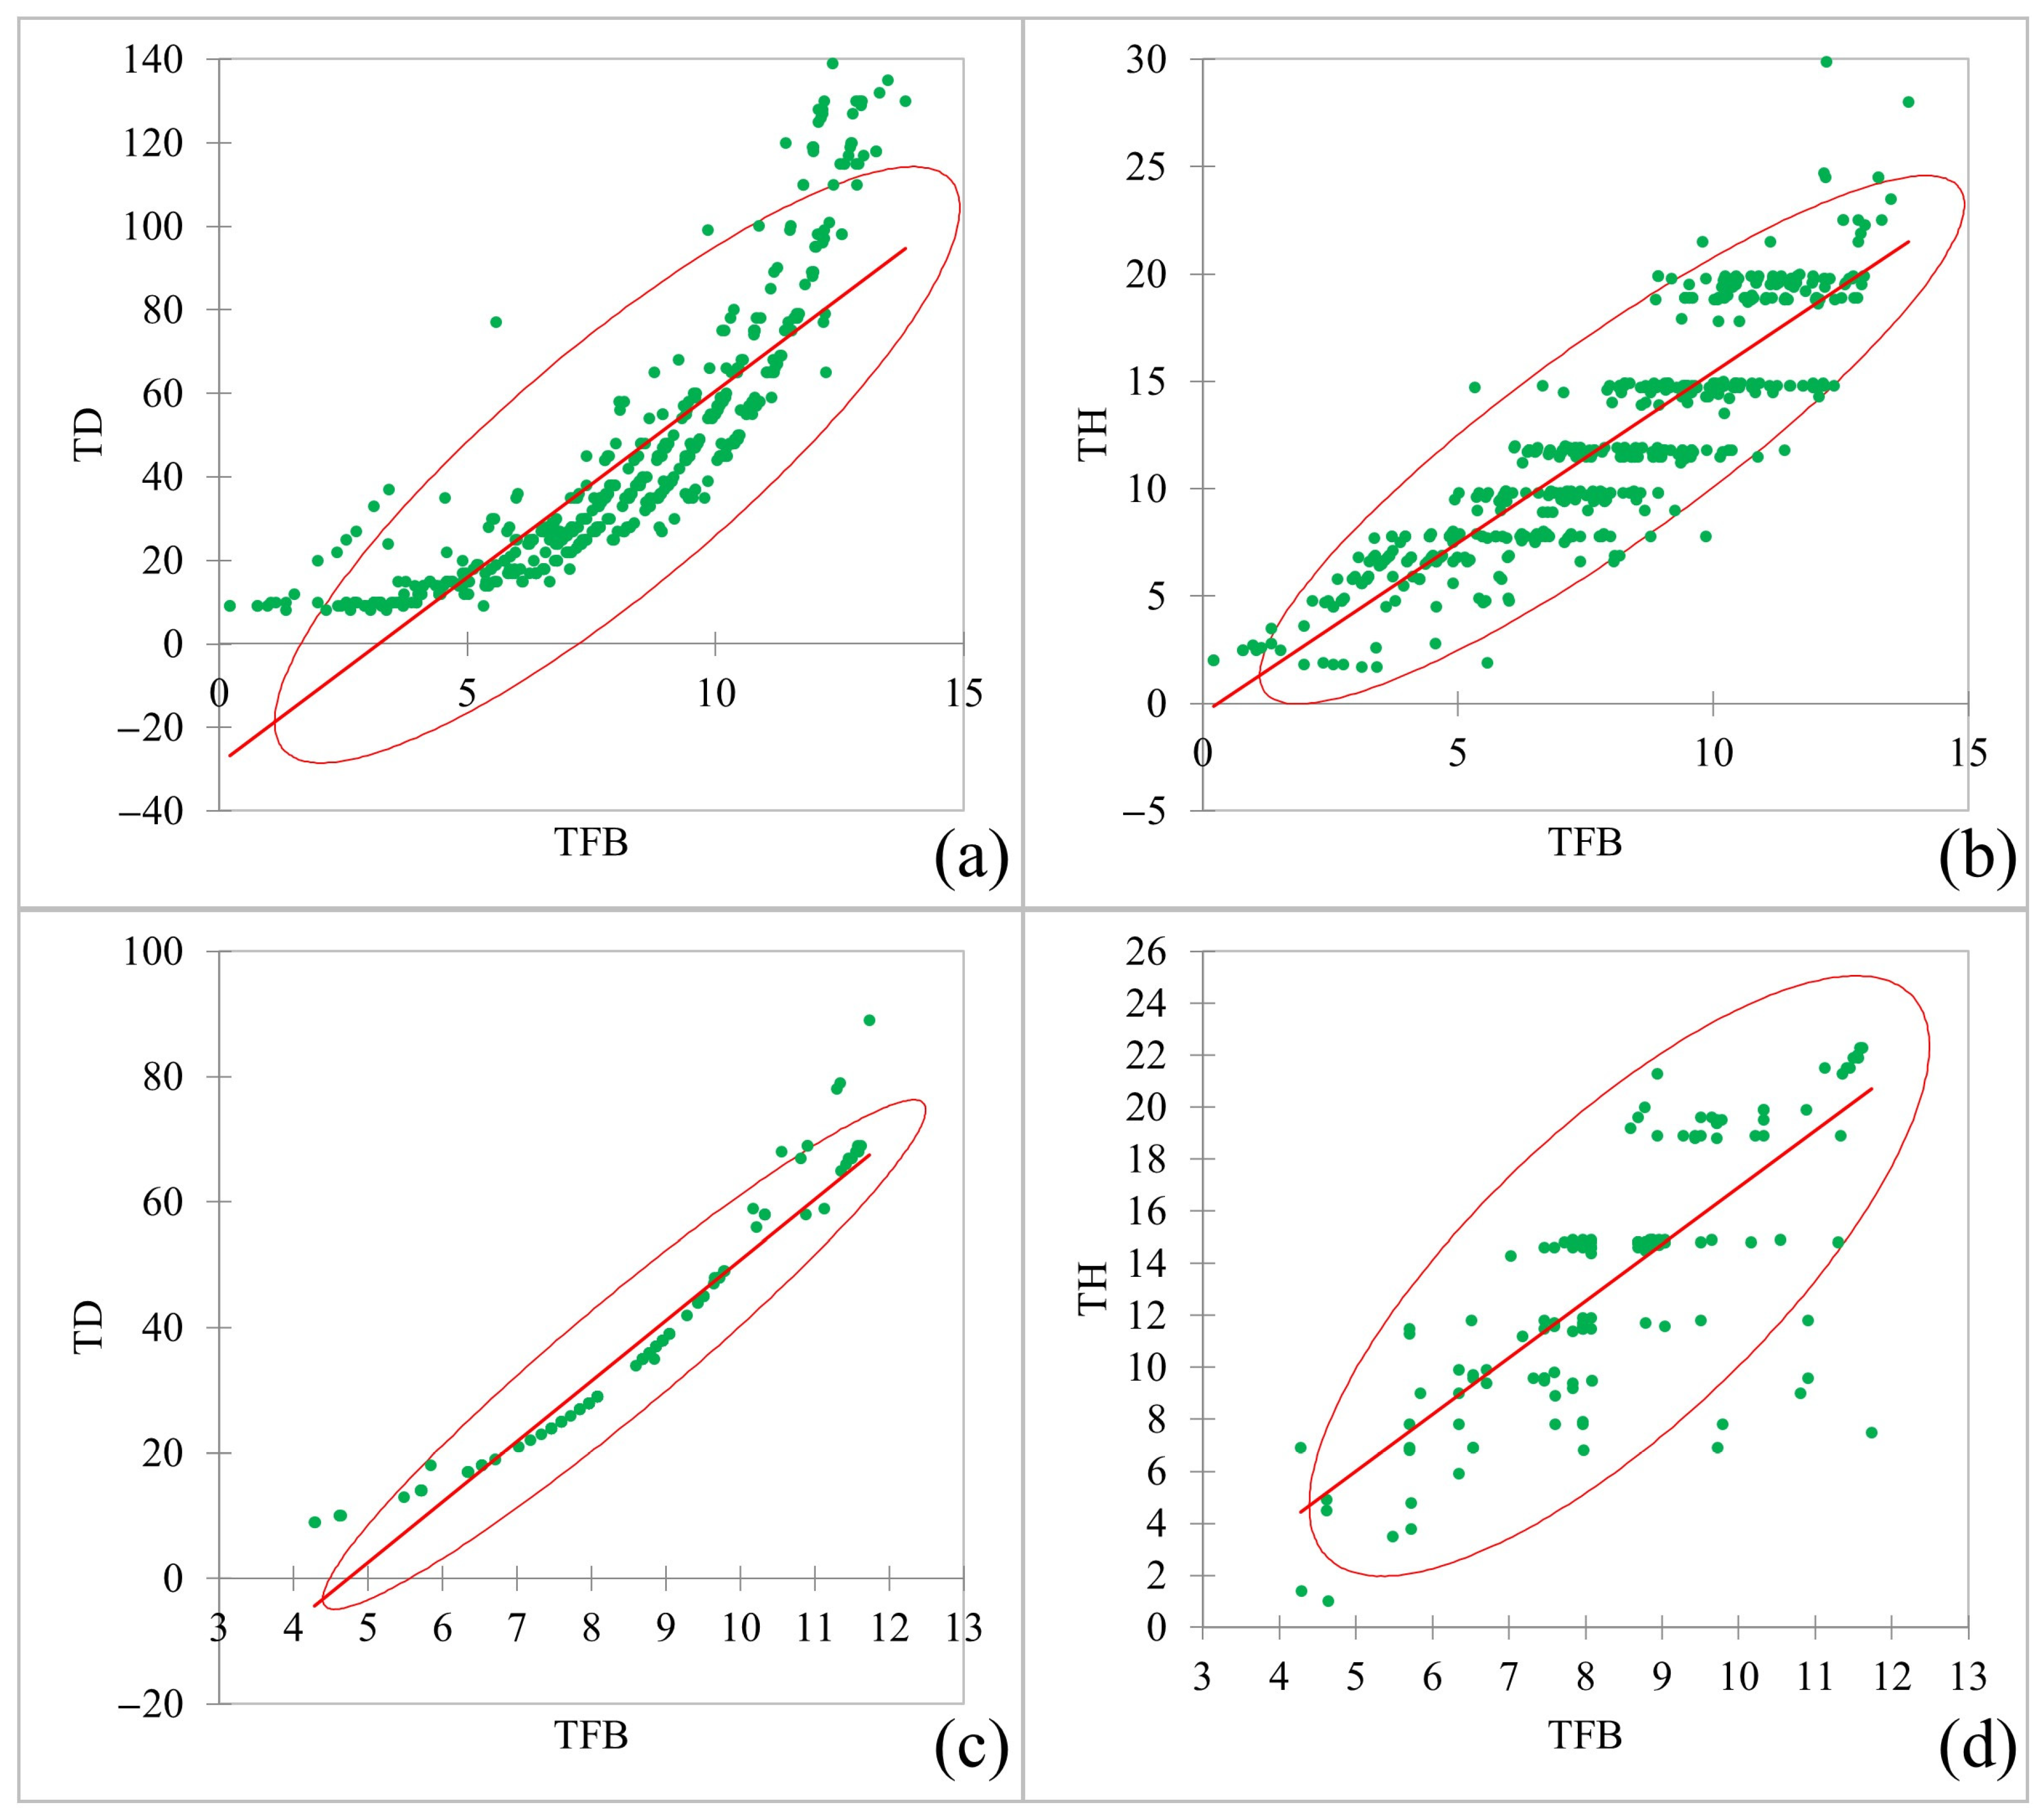
In the study, fresh aboveground biomass (TAGFB) and fresh belowground biomass (TBGFB) were considered dependent variables. Trunk diameter and total tree height, along with their various combinations, were used as independent variables. Table 3 summarises the range of parameters for 760 (all trees), 610 (Angiospermae), and 150 (Gymnospermae) trees representing 71 taxa in Topčider Park. Close values were observed for both the minimum and maximum of the independent variable TD across all trees and Angiospermae, for minimum TH in Gymnospermae, and for maximum TH in Angiospermae. Visualisation of the regression analysis indicates a stronger influence of the independent variable TD, although the effect of TH on total fresh biomass (TFB) cannot be neglected (Figure 10).
The Chi-square results, presented in Table 4, indicate rejection of the null hypothesis for both Angiospermae and Gymnospermae, suggesting that total fresh biomass is not independent of tree height and trunk diameter, as evidenced by the p-values. Practically, this confirms the alternative hypothesis that total fresh biomass depends on growth parameters, or that at least one of the growth parameters affects total fresh biomass, which is consistent with the regression analysis.
Spearman Rank correlation coefficients indicate varying relationships between trunk diameter (TD), tree height (TH), total fresh biomass (TFB), carbon sequestration (C), and CO2 reduction (CO2) for Angiospermae and Gymnospermae (Table 5). A perfect positive correlation was observed for both plant groups between total fresh biomass, carbon stock, and CO2 reduction; a very strong positive correlation was found between trunk diameter and tree height and TFB, C, and CO2 (Angiospermae), and between trunk diameter and TFB, C, and CO2 (Gymnospermae); a moderate positive correlation was noted between trunk diameter and tree height in Angiospermae, whereas in Gymnospermae a moderate positive correlation was observed both between trunk diameter and tree height, and between tree height and TFB, C, and CO2.
Correlations of the same parameters varied at the taxon level (Figure S1). It was confirmed that for the Angiosperms A. flava, A. pseudoplatanus, C. colurna, and R. typhina and the Gymnosperms A. nordmanniana, C. atlantica, C. japonica, T. occidentalis, T. baccata, and G. biloba, correlations of tree height (TH) with other parameters were not statistically significant. For Angiosperms A. incana, C. australis, S. alba, U. minor, and U. glabra, correlations of both tree height (TH) and trunk diameter (TD) with other parameters were not statistically significant. In C. bignonioides, F. pennsylvanica, M. alba, T. tomentosa, and T. platyphyllos, the correlations were statistically non-significant only between tree height (TH) and trunk diameter (TD). All negative correlations in the angiosperms B. pendula, M. pomifera, Po. alba, P. cerasifera, Q. palustris, U. minor, and U. glabra, as well as in T. baccata, were not statistically significant (Figure S1).
The overall mean biomass (Table 6) varied and was significantly different at p < 0.05 between Angiospermae (4890 kg) and Gymnospermae (1266 kg). Among Angiospermae, the highest total fresh biomass was recorded for P. × hispanica (899.817 kg), and the lowest for C. monogyna (1.517 kg), whereas among Gymnospermae, the highest value was observed in P. sylvestris (335.074 kg) and the lowest in P. pungens (9.507 kg). The significance of the hybrid plane is particularly evident given that the majority of the currently existing trees were planted in 1868, as confirmed by records of the purchase of hybrid plane seedlings in Vienna preserved in the Archives of the Museum of the City of Belgrade [60]. However, among Gymnospermae, T. distichum is also noteworthy, with 13 individuals (compared to 42 for P. sylvestris) and a total fresh biomass of 138.013 kg, representing 41.19% of the total biomass of P. sylvestris (Table S2). Similar to tree biomass, substantial variations were observed in carbon sequestration in fresh biomass and CO2 reduction among tree taxa (Table S2). Among Angiospermae, the highest total carbon content (2347 mg/kg fresh weight) was recorded for the hybrid plane (P. × hispanica, 431.912 mg/kg fresh weight), and the lowest for the single-seeded hawthorn (C. monogyna, 0.728 mg/kg fresh weight). Among Gymnospermae (608 mg/kg fresh weight), the highest value was observed in P. sylvestris (160.836 mg/kg fresh weight) and the lowest in P. pungens (4.563 mg/kg fresh weight).
Furthermore, carbon sequestration and CO2 reduction showed significant variations among tree taxa in Topčider Park. For Angiospermae, maximum sequestration was recorded in P. × hispanica (1582.094 mg/kg fresh weight) and minimum in single-seeded hawthorn (C. monogyna, 2.667 mg/kg fresh weight), whereas for Gymnospermae, maximum was observed in P. sylvestris (589.141 mg/kg fresh weight) and minimum in P. pungens (16.715 mg/kg fresh weight).

4. Discussion

Research on urban tree diversity is important due to the growing recognition of urban areas as hosts for innovative approaches to biodiversity conservation and promotion [4]. Accordingly, Vujičić et al. [8] conducted surveys, interviews, and workshops with professionals, highlighting that urban parks, due to their often high levels of habitat diversity and microhabitat heterogeneity, can represent particularly important biodiversity hotspots within the urban landscape, even though this is not their primary function. Indeed, parks often exhibit greater taxonomic richness than other urban green spaces, including urban and peri-urban forests, gardens, green roofs, roadside plantings, and residential zones, which aligns with the case study of Topčider Park. In comparison with other studies, the 71 taxa recorded in Topčider Park exceed the 66 reported by Kozera et al. [61], as well as the 51 and 57 identified by Mielke et al. [62] and the 65 recorded by Eisfeld et al. [63]. Conversely, higher numbers have also been reported, such as 88 species by Geraldi et al. [64] and 77 species by Neto et al. [65]. Our results contrast with those of Jovanović et al. [66] in Niš (Serbia), who noted that the urban matrix favours a small set of stress-tolerant species and that homogenisation has been reinforced by historical planting practices prioritising aesthetic uniformity and maintenance efficiency over biodiversity. Our findings emphasise the significance of Topčider Park and its management approach in Belgrade: selective removal and planting of tree taxa that support the conservation of biodiversity and ecosystem services. This contrast at the national level underscores the importance of monitoring local urban tree diversity as an indicator of ecological health in cities and as a measure of resilience to climate change, which drives biodiversity loss. Collecting values of key benefits within economic and management frameworks encourages the retention of urban trees in scenarios where market forces are dominant and social attitudes provide limited environmental support [67].
The analysis of tree biodiversity using the Shannon diversity index (H’) in Topčider Park (3.57) and within the group Angiospermae (3.29) places them in the high-diversity class, whereas Gymnospermae (2.18) falls into the medium (moderate) diversity class. These results are consistent with the findings of Adelia and Kaswanto [68] for Bogor, Indonesia, who analysed six parks and classified 17% as high-diversity and 83% as medium-diversity parks. Topčider Park, as part of the central spatial unit of Topčider within the Sava and Topčider river catchments, possesses a landscape structure that functions as a habitat for various terrestrial and aquatic species, as noted by Stevaux et al. [69]. It is also important to consider the Pielou evenness index (J’), as taxon richness and evenness are regarded as two independent characteristics of biological communities that together define their overall diversity [70]. In this context, our results highlight Topčider Park as exhibiting high taxonomic evenness by number (0.84), supporting ecosystem services and bird diversity, in contrast to urban parks reported by Zhang et al. [71] and Xie et al. [72], which are limited by lower diversity and homogeneity. Given that Topčider Park is the fifth most visited tourist destination in Belgrade [73] and serves as a habitat for 96 bird species [74], it ranks highly for birdwatching. This is further supported by Liao et al. [75], who found that in Chengdu, China, increasing diversity and evenness in urban parks played a key role in enhancing avian biodiversity. These findings are also in agreement with Evans et al. [76], who, based on 72 studies on habitat effects on urban ornithofauna, concluded that larger habitat patches support larger and more stable populations of birds, amphibians [77], and mammals [78]. High taxonomic diversity of trees provides ecological complementarity, ensuring alternative food resources and dispersal pathways for bird and animal communities should some species disappear over time. The diversity and evenness indices observed in Topčider Park align with the findings of Yao et al. [79], who showed in Changchun City that diversity, including age-structure diversity, is highest in parks established before 1940. Since JKP Zelenilo Beograd manages Topčider Park according to principles of seasonal diversity, tree replacement aligns with Yao et al. [79], who noted that parks built between 2001 and 2020 were strategically designed with rational selection of taxa and tree placement for replacement and supplementation, ensuring that flowering, fruiting, and seasonal colour provide ecosystem services throughout the year. Moreover, to support high levels of animal species richness, it is essential to promote a wide diversity of tree taxa in urban vegetation and biocenoses [80].
Belgrade, according to the results, is characterised by temperature as a continuous variable and precipitation as a discrete variable, with an increase in the number of tropical days and nights and a decrease in frosty and icy days, alongside the occurrence of sudden heavy rainfall after prolonged periods without precipitation. This observed trend has also been noted in other European cities. For example, in Warsaw (Poland), which is located further north than Belgrade and geographically belongs to Central Europe, Kuchcik [81] already noted in 2013 that the city would be negatively affected by climate change, particularly through the increase in both the number and intensity of hot days and the frequency of rainfall, causing localised flooding. Therefore, it is important to identify urban tree taxa that contribute significantly to ecosystem services, as highlighted by Pataki et al. [82], and to urban climate modification [83,84,85]. Psychological comfort also interacts with thermal comfort: parks, alongside their ecological functions, encourage outdoor activities and social interactions [86,87]. Thus, the expansion of tree canopies simultaneously supports public health and biodiversity while mitigating climate change.
Previous research has emphasised the benefits of trees in urban forests, often focusing on specific taxa. The results of this study provide a foundation for further research into the relationships between urban tree structure and ecosystem services in parks under a temperate-continental climate with extreme weather events. The efficiency of growth elements of 760 urban trees and their acclimatisation capacity, particularly of non-native taxa, is highlighted. Specifically, the potential of structural variables of urban trees to contribute to ecosystem services, such as carbon storage in aboveground biomass, as noted by He et al. [88], and in belowground biomass, as confirmed by our study, has been observed. Consequently, this study emphasises the role of urban trees in providing ecosystem services that are crucial for urban planners and managers when selecting species and designing sustainable urban ecosystems in parks.
Furthermore, carbon storage in total fresh biomass and carbon dioxide accumulation were assessed. The results confirmed that tree height and trunk diameter are strongly correlated with carbon storage in fresh biomass across 71 tree taxa in Topčider Park, consistent with previous research [89,90,91,92]. However, our study is one of the few, and the first in Southeast Europe, to clearly and precisely define contributions at the level of individual trees, taxa, tree populations from the Angiospermae and Gymnospermae groups, and at the park level. Positive correlations of varying strengths, depending on the taxa, were observed between trunk diameter and tree height with total fresh biomass and carbon sequestration. Notably, a hybrid plane tree (a natural monument) achieved the largest dimensions and highest total fresh biomass. Close values were also recorded for 112 other trees of the same species dating from 1868, as well as for indigenous pedunculate oaks dating from 1836.
Another important ecosystem service of urban trees is the mitigation of the urban heat island effect [93], which reduces energy demand for air conditioning during summer months and, consequently, contributes to lower carbon dioxide emissions [94]. Given these factors, the study demonstrates that the urban heat island effect can be used to analyse the impacts of climate change on biodiversity, based on assessments of effects in cities generated by current climate change on both local and global scales [14]. In the context of climate change, 15 years ago, Davies et al. [25], Kordowski and Kuttler [95], and Paoletti et al. [96] defined urban parks as “carbon sinks” due to urban trees’ carbon sequestration and CO2 removal.
In conclusion, the results of this study contrast with research by Blasi et al. [10], which promotes forest restoration in Italian cities rather than the maintenance and creation of urban parks or gardens that can support indigenous biodiversity in the medium to long term, with necessary management activities. By contrast, our study confirms the importance of preserving parks, particularly long-lived ones, as the expected benefits of urban trees in 2025 have been realised and exceeded. Notably, the study demonstrates the positive ecological value of the integrated long-term implementation of non-native and native urban trees over a period of 190 years.

5. Conclusions

The contribution of urban parks as nature-based solutions for city residents is considerable, as they not only provide everyday contact with nature but also improve physical and mental health and enhance social and cultural life within cities. Moreover, they play an important role in ecological systems connected with other natural areas, creating green networks, corridors, or infrastructure that extend beyond the scale of the site itself. In this study, through a comprehensive approach integrating diversity, growth parameters, ornamental value, vitality, carbon sequestration, and the reduction of CO2 by trees under climate change conditions, a framework of natural elements and their structure has been defined in the function of ecological balance. Taxa were selected for regenerative and sustainable design grounded in ecology, aimed at fostering a positive outlook for urban areas as components of natural ecosystems: A. hippocastanum, A. flava, A. pseudoplatanus ‘Atropurpureum’, A. pseudoplatanus, A. glutinosa, A. incana, C. siliquastrum, C. colurna, P. avium, F. excelsior, F. excelsior ‘Monophylla’, F. pennsylvanica, F. sylvatica, J. regia, L. tulipifera, M. alba, M. sylvestris, M. pomifera, P. × hispanica, P. communis, Po. alba, Po. nigra, Q. robur, Q. robur ‘Fastigiata’, Q. rubra, Q. palustris, Q. pubescens subsp. pubescens, Q. petraea, S. babylonica f. babylonica, S. babylonica var. pekinensis ‘Tortuosa’, T. tomentosa, U. glabra, G. biloba, C. atlantica, P. nigra, Pl. orientalis, T. distichum and T. baccata.
The taxa listed can be used to inform decisions on where to plant new trees or to prioritise management actions, such as increasing canopy cover in areas with high temperatures or poor air quality. To implement these taxa for sustainable ecosystems, the following actions are necessary: planting trees adapted to local climate and soil conditions; enhancing functional diversity while respecting community patterns (selecting taxa with positive mutual influences and minimal competition, while maintaining the highest possible biodiversity); establishing tools for funding biodiversity and green infrastructure (including raising public ecological awareness, fostering regional cooperation to maximise network benefits, and attracting additional funding from non-traditional sources); introducing regulations to protect mature trees (conservation and enhancement within the legal framework, along with professional care); involving citizens in maintenance; prioritising the multifunctionality of urban parks (serving as habitats for numerous plant and animal species as well as cultural and historical heritage); and designing spaces according to universal design principles (ensuring access for priority groups such as people with disabilities, older adults, children, and those with chronic illnesses).
The use of trees in urban parks, when managed appropriately, contributes to the planning, design, and management of sustainable, resilient landscapes. It helps make cities safer, more pleasant, healthier, more diverse, and more attractive.
It is recommended that the results obtained be integrated into networks such as EFUF (www.efuf.org) to encourage idea exchange and learning from experience, enabling the application of study findings in other areas. Species selection should consider future patterns and ensure that macro- and microbiomes can adapt over time.
To properly advocate the established benefits of using non-native taxa in conjunction with native species, realistic case studies are necessary, not just assessments and modelling. This study supports both research and collaboration with local authorities, with the aim of monitoring growth elements and adaptability of urban trees and providing a concrete taxon database for species selection and planting models.
The results of this study represent an important contribution to incorporating natural capital into urban adaptation efforts, as climate change is inevitable in the twenty-first century. Urban trees, as well as remaining natural areas and urban open spaces integrated with the grey infrastructure of cities, must be included in climate adaptation programmes in order to reduce vulnerability and increase resilience to rapidly changing climatic conditions. Urban biodiversity is becoming increasingly important at the global level, and natural assets provide numerous ecological benefits and climate-adaptation services. However, there is no guarantee that urban trees and the ecosystem services they provide will persist in urbanised landscapes under fast-shifting climate regimes.
Future research should be expanded by integrating real-world data with remote sensing tools and tree inventories, enabling continuous monitoring based on urban tree management for sustainable city development. Additionally, subsequent studies on tree and fauna regeneration will help highlight the interdependence of populations and tree survival in urban parks. This approach facilitates the flow of plant material as well as wildlife, particularly given that Topčider Park is connected to the Košutnjak urban forest. Special emphasis should be placed on embracing responsibility for a culture of ecological balance, which will guide strategies towards ecological regeneration.

Supplementary Materials

The following supporting information can be downloaded at https://www.mdpi.com/article/10.3390/f17010114/s1, Figure S1: Correlation matrices for trunk diameter (TD), tree height (TH), total fresh biomass (TFB), amount of carbon (C) and sequestration of carbon dioxide (CO2) for taxa in Topčider Park (significance level: p-value < 0.05). Taxa with fewer than three individuals were omitted because the Spearman Rank Test was not applicable for them; Table S1: Climate variables for 2021, 2022, 2023, 2024, and 2025; the reference period (1991–2020); the 1888–1990 period; and previous time series (1981–2010, 1971–2000, 1961–1990), as well as deviations in 2025 in relation to the reference and 1888–1990 periods, according to MMS Belgrade data: (a) Mean monthly, seasonal and annual air temperatures for the analysed periods (°C), (b) Sums and mean values of precipitation (mm), (c) Mean maximum monthly, seasonal and annual air temperatures for the analysed periods (°C), (d) Mean minimum monthly, seasonal and annual air temperatures for the analysed periods (°C), (e) Mean monthly and annual values of relative air humidity (%), (f) Sums of monthly and annual sunshine hours (hours), (g) Number and sums of days with precipitation ≥ 0.1 mm, (h) Number and sums of days with precipitation ≥1.0 mm, (i) Number of summer days (Tmax ≥ 25 °C), (j) Number of tropical days (Tmax ≥ 30 °C), (k) Number of ice days (Tmax < 0 °C), (l) Number of tropical nights (Tmin ≥ 20 °C), (m) Number of frost days (Tmin < 0 °C), (n) Number of days with Tmax ≥ 35 °C; Table S2: Analysed growth parameters (TH—tree height (m), TD—trunk diameter (cm), CW—crown diameter (m)), O—ornamental value (1–5) and V—vitality value (1–5) of all tree taxa in Topčider Park in Belgrade. Mean values ± Std. error; Table S3: Number of individuals, TFB (total fresh biomass), C (amount of carbon) and CO2 (sequestration of carbon dioxide) at the taxa level in Topčider Park 2025.

Author Contributions

N.G.—Conceptualisation, Methodology, Investigation, Resources, Visualisation, D.P.—Conceptualisation, Methodology, Formal analysis, Investigation, Resources, Data curation, Writing—review and editing, D.S.—Conceptualisation, Methodology, Investigation, Resources, Visualisation, J.Č.—Conceptualisation, Methodology, Formal analysis, Investigation, Resources, Data curation. R.K.—Formal analysis, Investigation, Resources. S.Đ.—Investigation, Resources, Visualisation. M.O.—Conceptualisation, Methodology, Formal analysis, Investigation, Resources, Visualisation, Data curation, Writing—original draft preparation, Writing—review and editing, Supervision. All authors have read and agreed to the published version of the manuscript.

Funding

This research was supported by the Ministry of Science, Technological Development and Innovation of the Republic of Serbia, contract no. 451-03-137/2025-03/ 200117, 451-03-136/2025-03/ 200117 and 451-03-137/2025-03/200169. In addition, this manuscript covers one of the research topics conducted by researchers at the Centre of Excellence Agro-Ur-For, Faculty of Agriculture, Novi Sad, supported by the Ministry of Science, Tec nological Development and Innovations, contract no. 451-03-4551/2024-04/17.

Data Availability Statement

Data Availability Statement: The climatology data are freely available at https://www.hidmet.gov.rs/eng/meteorologija/klimatologija_produkti.php (accessed on 10 September 2025). The data from the Republic Hydrometeorolgical Service of Serbia, which cannot be pub lished, was accessed multiple times.

Conflicts of Interest

The authors declare no conflicts of interest.

References

  1. Gomez-Baggethun, E.; de Groot, R.; Lomas, P.L.; Montes, C. The history of ecosystem services in economic theory and practice: From early notions to markets and payment schemes. Ecol. Econ. 2010, 69, 1209–1218. [Google Scholar] [CrossRef] [Scilit]
  2. da Silva Santos, A.; de Souza, I.; de Souza, J.M.T.; Schaffrath, V.R.; Galvão, F.; Bohn Reckziegel, R. Urban Parks in Curitiba as Biodiversity Refuges of Montane Mixed Ombrophilous Forests. Sustainability 2023, 15, 968. [Google Scholar] [CrossRef] [Scilit]
  3. Rötzer, T.; Moser-Reischl, A.; Rahman, M.A.; Pauleit, S. Urban Forest and Urban Microclimate. Forests 2023, 14, 2391. [Google Scholar] [CrossRef] [Scilit]
  4. UNEP. Global Partnership on Cities and Biodiversity. Available online: https://www.cbd.int/doc/health/cbo-action-policy-en.pdf (accessed on 12 December 2025).
  5. Woodward, A.; Hinwood, A.; Bennett, D.; Grear, B.; Vardoulakis, S.; Lalchandani, N.; Lyne, K.; Williams, C. Trees, Climate Change, and Health: An Urban Planning, Greening and Implementation Perspective. Int. J. Environ. Res. Public Health 2023, 20, 6798. [Google Scholar] [CrossRef] [Scilit]
  6. Király, É.; Illés, G.; Borovics, A. Green Infrastructure for Climate Change Mitigation: Assessment of Carbon Sequestration and Storage in the Urban Forests of Budapest, Hungary. Urban Sci. 2025, 9, 137. [Google Scholar] [CrossRef] [Scilit]
  7. United Nations. Department of Economic and Social Affairs, Population Division. In World Urbanisation Prospects: The 2018 Revision (ST/ESA/SER.A/420); United Nations: New York, NY, USA, 2019; ISBN 978-92-1-148319-2. Available online: https://population.un.org/wup/assets/WUP2018-Report.pdf (accessed on 12 September 2025).
  8. Vujičić, D.; Vasiljević, N.; Radić, B.; Tutundžić, A.; Galečić, N.; Skočajić, D.; Ocokoljić, M. Conceptualisation of the Regulatory Framework of Green Infrastructure for Urban Development: Identifying Barriers and Drivers. Land 2024, 13, 692. [Google Scholar] [CrossRef] [Scilit]
  9. Petrov, D.; Ocokoljić, M.; Galečić, N.; Skočajić, D.; Simović, I. Adaptability of Prunus cerasifera Ehrh. to Climate Changes in Multifunctional Landscape. Atmosphere 2024, 15, 335. [Google Scholar] [CrossRef] [Scilit]
  10. Blasi, C.; Capotorti, G.; Del Vico, E.; Bonacquisti, S.; Zavattero, L. Native Flora and Potential Natural Vegetation References for Effective Forest Restoration in Italian Urban Systems. Plants 2025, 14, 2396. [Google Scholar] [CrossRef] [Scilit]
  11. Sargolini, M.; Sopina, A.; Polci, V.; Mariani, D.; Paolini, C.; Mariani, M. Integrating Urban Design, Healthy Habits, and Socio-Ecological Networks: A One Health and Well-Being Framework for Sustainable Cities. Sustainability 2025, 17, 10014. [Google Scholar] [CrossRef] [Scilit]
  12. Groom, G.; Mucher, C.U.; Ihse, M.; Wrbka, T. Remote sensing in landscape ecology: Experiences and perspectives in a European context. Landsc. Ecol. 2006, 21, 391–408. [Google Scholar] [CrossRef] [Scilit]
  13. Sjöman, H.; Östberg, J. Vulnerability of ten major Nordic cities to potential tree losses caused by longhorned beetles. Urban Ecosyst. 2019, 22, 385–395. [Google Scholar] [CrossRef] [Scilit]
  14. WMO. State of the Global Climate 2024. Available online: https://wmo.int/publication-series/state-of-global-climate-2024 (accessed on 18 July 2025).
  15. WMO. State of the Global Climate 2021: WMO Provisional Report; World Meteorological Organization (WMO): Geneva, Switzerland, 2021; p. 47. Available online: https://library.wmo.int/records/item/56300-state-of-the-global-climate-2021 (accessed on 10 September 2025).
  16. Ocokoljić, M.; Petrov, D.; Galečić, N.; Skočajić, D.; Košanin, O.; Simović, I. Phenological Flowering Patterns of Woody Plants in the Function of Landscape Design: Case Study Belgrade. Land 2023, 12, 706. [Google Scholar] [CrossRef] [Scilit]
  17. Čukanović, J.; Ljubojević, M.; Djordjević, S.; Narandžić, T.; Petrov, D.; Ocokoljić, M. The Impact of Climate Variability on the Blooming of Fraxinus ornus ‘Globosa’ as a Component of Novi Sad’s (Serbia) Green Infrastructure. Sustainability 2024, 16, 8404. [Google Scholar] [CrossRef] [Scilit]
  18. Fang, J.Y.; Wang, M.Z. Forest biomass estimation at regional and global levels, with special reference to China’s forest biomass. Ecol. Res. 2001, 16, 587–592. [Google Scholar] [CrossRef] [Scilit]
  19. Liu, K.; Cao, L.; Wang, G.B.; Cao, F.-L. Biomass allocation patterns and allometric models of Ginkgo biloba L. J. Beijing For. Univ. 2017, 39, 12–20. [Google Scholar]
  20. Redzinska, K.; Piotrkowska, M. Urban Planning and Design for Building Neighborhood Resilience to Climate Change. Land 2020, 9, 387. [Google Scholar] [CrossRef] [Scilit]
  21. World Bank. World Development Report 2021: Data for Better Lives; World Bank: Washington, DC, USA, 2021. [Google Scholar]
  22. IPCC. Climate Change 2022: Impacts, Adaptation, and Vulnerability. In Contribution of Working Group II to the Sixth Assessment Report of the Intergovernmental Panel on Climate Change; Pörtner, H.-O., Roberts, D.C., Tignor, M., Poloczanska, E.S., Mintenbeck, K., Alegría, A., Craig, M., Langsdorf, S., Löschke, S., Möller, V., et al., Eds.; Cambridge University Press: Cambridge, UK; New York, NY, USA, 2022; 3056p. [Google Scholar]
  23. UN-Habitat; UNESCO Chair on Urban Resilience (University of Southern Denmark); Global Covenant of Mayors for Climate & Energy. Urban Climate Action—The Urban Content of the NDCs: Global Review 2022; United Nations Human Settlements Programme (UN-Habitat): Nairobi, Kenya, 2023; Available online: https://unhabitat.org/urban-climate-action-the-urban-content-of-the-ndcs-global-review-2022 (accessed on 5 November 2025).
  24. European Commission; Directorate-General for Research and Innovation. EU Missions, 100 Climate-Neutral and Smart Cities; (Publication No. KI-02-24-237-EN-N); Publications Office of the European Union: Luxembourg, 2024. [Google Scholar]
  25. Davies, Z.G.; Edmondson, J.L.; Heinemeyer, A.; Leake, J.R.; Gaston, K.J. Mapping an urban ecosystem service: Quantifying above-ground carbon storage at a city-wide scale. J. Appl. Ecol. 2011, 48, 1125–1134. [Google Scholar] [CrossRef] [Scilit]
  26. Ali, Y.; Rahman, M.M. Quantifying forest stocking changes in Sundarbans mangrove using remote sensing data. Sci. Remote Sens. 2025, 11, 100181. [Google Scholar] [CrossRef] [Scilit]
  27. Capotorti, G.; Orti, M.M.A.; Copiz, R.; Fusaro, L.; Mollo, B.; Salvatori, E.; Zavattero, L. Biodiversity and ecosystem services in urban green infrastructure planning: A case study from the metropolitan area of Rome (Italy). Urban For. Urban Green. 2019, 37, 87–96. [Google Scholar] [CrossRef] [Scilit]
  28. Hua, F.; Bruijnzeel, L.A.; Meli, P.; Martin, P.A.; Zhang, J.; Nakagawa, S.; Miao, X.; Wang, W.; Mcevoy, C.; Pena-Arancibia, J.L.; et al. The biodiversity and ecosystem service contributions and trade-offs of forest restoration approaches. Science 2022, 376, 839–844. [Google Scholar] [CrossRef] [Scilit]
  29. Montaldi, A.; Iamonico, D.; Del Vico, E.; Valeri, S.; Lasinio, G.J.; Capotorti, G. Green infrastructure design for the containment of biological invasions. Insights from a peri-urban case study in Rome, Italy. J. Environ. Manag. 2024, 365, 121555. [Google Scholar] [CrossRef] [Scilit] [PubMed]
  30. Convention on Biological Diversity. Report of the Conference of the Parties to the Convention on Biological Diversity on the Second Part of Its Fifteenth Meeting. 2023. Available online: https://www.cbd.int/doc/c/f98d/390c/d25842dd39bd8dc3d7d2ae14/cop-15-17-en.pdf (accessed on 13 December 2025).
  31. Convention on Biological Diversity. Progress of the United Nations Decade on Ecosystem Restoration 2021–2030. 2024. Available online: https://www.cbd.int/doc/c/8097/1f19/e37995d6157e799d83afa77a/cop-16-inf-13-en.pdf (accessed on 13 December 2025).
  32. Gann, G.D.; McDonald, T.; Walder, B.; Aronson, J.; Nelson, C.R.; Jonson, J.; Hallett, J.G.; Eisenberg, C.; Guariguata, M.R.; Liu, J.; et al. International principles and standards for the practice of ecological restoration. Restor. Ecol. 2019, 27, S1–S46. [Google Scholar] [CrossRef] [Scilit]
  33. Department of Economic and Social Affairs, United Nations. Population Division World Urbanization Prospects. In The 2018 Revision (ST/ESA/SER.A/420); United Nations: New York, NY, USA, 2019. [Google Scholar]
  34. EU Regulation 2021/1119 of the European Parliament and of the Council of 30 June 2021 Establishing the Framework for Achieving Climate Neutrality and Amending. Regulations (EC) No 401/2009 and (EU) 2018/1999. 2021. Available online: https://eur-lex.europa.eu/eli/reg/2021/1119/oj/eng (accessed on 13 December 2025).
  35. Szyrski, M. Climate law in Europaean union legislation does it alredy exist? Ruch Praw. Ekon. I Socjol. 2023, 85, 43–54. [Google Scholar] [CrossRef] [Scilit]
  36. Escobedo, F.J.; Kroeger, T.; Wagner, J.E. Urban forests and pollution mitigation: Analyzing ecosystem services and disservices. Environ. Pollut. 2011, 159, 2078–2087. [Google Scholar] [CrossRef] [Scilit]
  37. Teixeira, C.P.; Fernandes, C.O. Novel ecosystems: A review of the concept in non-urban and urban contexts. Landsc. Ecol. 2020, 35, 23–39. [Google Scholar] [CrossRef] [Scilit]
  38. Roman, L.A.; Conway, T.M.; Eisenman, T.S.; Koeser, A.K.; Ordonez Barona, C.; Locke, D.H.; Jenerette, G.D.; Ostberg, J.; Vogt, J. Beyond ‘trees are good’: Disservices, management costs, and tradeoffs in urban forestry. Ambio 2021, 50, 615–630. [Google Scholar] [CrossRef] [Scilit]
  39. TEEB. The Economics of Ecosystems and Biodiversity. TEEB Manual for Cities: Ecosystem Services in Urban Management. 2011. Available online: https://www.ebi.gov.et/wp-content/uploads/2021/10/Ecosystem-Services-in-Urban-Management.pdf (accessed on 12 September 2025).
  40. JKP Zelenilo Beograd [Belgrade Greenery]. Available online: https://www.zelenilo.rs/ (accessed on 15 July 2025).
  41. Grad Beograd—Beogradske Opštine [City of Belgrade—Belgrade Municipalities]. Available online: https://www.beograd.rs/cir/gradska-vlast/a87949/Gradske-opstine.html (accessed on 15 July 2025).
  42. Službeni List Grada Beogarada [Belgrade City Official Gazette]. 2016, 88. Available online: https://www.sllistbeograd.rs/pdf/2016/20-2016.pdf (accessed on 15 July 2025).
  43. Škorić, A.; Filipovski, G.; Ćirić, M. Klasifikacija Zemljišta Jugoslavije [Classification of Land of Yugoslavia]. Posebno Izdanje, Knjiga LXXVIII. Odeljenje Prirodnih i Matematičkih Nauka, Book 13. ANUBIH: Sarajevo, BIH, 1985; COBISS-ID: 84018956, p. 72. Available online: https://bastina.anubih.ba/items/1621f36c-3d2c-47eb-b422-e62ad85158e5/full (accessed on 15 July 2025).
  44. Knežević, M.; Košanin, O.; Perović, M.; Ljubičić, J. Ekološko-florističke karakteristike park-šume u okviru spomenika prirode “Topčiderski park”. Šumarstvo 2018, 1–2, 129–142. [Google Scholar]
  45. RHMZ. Republic Hydrometeorological Institute of Serbia. Available online: https://www.hidmet.gov.rs/index_eng.php (accessed on 18 July 2025).
  46. RHMZ. Meteorological Yearbooks of Republic Hydrometeorological Institute of Serbia. Available online: https://www.hidmet.gov.rs/ciril/meteorologija/klimatologija_godisnjaci.php (accessed on 10 September 2025).
  47. Shlapak, V.P.; Zaplyvana, Y.A.; Kurka, S.S.; Ishchuk, G.P.; Kulbitsky, V.L. Arrangement of an alpine hill (alpinarium) on a garden site. Sci. Bull. NLTU Ukr. 2014, 24, 19–26. [Google Scholar]
  48. Golubović Ćurguz, V.; Milenković, I. Bolesti Ukrasnih Biljaka [Diseases of Ornamental Plants]; Univerzitet u Beogradu—Šumarski fakultet: Belgrade, Serbia, 2016. [Google Scholar]
  49. Shannon, C.E. A mathematical theory of communication. Bell Syst. Tech. J. 1948, 27, 379–423. [Google Scholar] [CrossRef] [Scilit]
  50. Ludwig, J.A.; Reynolds, J.F. Statistic Ecology a Primer on Methods and Computing; John Wiley & Sons: New York, NY, USA, 1988. [Google Scholar]
  51. Pielou, E.C. The measurement of diversity in different types of biological collections. J. Theor. Biol. 1966, 13, 131–144. [Google Scholar] [CrossRef] [Scilit]
  52. Miah, M.D.; Islam, K.N.; Kabir, M.H.; Koike, M. Allometric models for estimating aboveground biomass of selected homestead tree species in the plain land Narsingdi district of Bangladesh. Trees For. People 2020, 2, 100035. [Google Scholar] [CrossRef] [Scilit]
  53. Kim, H.; Baek, G.; Choi, B.; Lee, J.; Lee, J.; Son, Y.; Kim, C. Allometric equations for estimating the carbon storage of Maple trees in an urban settlement Area. J. Korean Soc. For. Sci. 2023, 112, 32–39. [Google Scholar]
  54. Montes, N.; Gauquelin, T.; Badri, W.; Bertaudiere, V.; Zaoui, E.H. A non-destructive method for estimating above-ground forest biomass in threatened woodlands. Forest Ecol. Manag. 2000, 130, 37–46. [Google Scholar] [CrossRef] [Scilit]
  55. Thomas, S.C.; Martin, A.R. Carbon Content of Tree Tissues: A Synthesis. Forests 2012, 3, 332–352. [Google Scholar] [CrossRef] [Scilit]
  56. Picard, N.; Saint-Andre, L.; Henry, M. Manual for Building Tree Volume and Biomass Allometric Equations: From Field Measurement to Prediction; FAO/CIRAD: Rome, Italy, 2012. [Google Scholar]
  57. Yasin, G.; Nawaz, M.F.; Zubair, M.; Azhar, M.F.; Mohsin Gilani, M.; Ashraf, M.N.; Qin, A.; Ur Rahman, S. Role of traditional agroforestry systems in climate change mitigation through carbon sequestration: An investigation from the semi-arid region of Pakistan. Land 2023, 12, 513. [Google Scholar] [CrossRef] [Scilit]
  58. Horvat, J.; Mijoč, J. Osnove Statistike [Basics of statistics]; Naklada Ljevak: Zagreb, Croatia, 2012; p. 482. [Google Scholar]
  59. Kassambara, A. Multivariate Analysis I, Practical Guide to Cluster Analysis in R, Unsupervised Machine Learning; STHDA: Bad Vilbel, Germany, 2017. [Google Scholar]
  60. Deroko, A. A Ondak je Letijo Jeroplan nad Beogradom; Dereta, Biblioteka grifon: Belgrade, Serbia, 1987; ISBN 86-331-0170-X. Available online: https://www.scribd.com/document/446318233/Aleksandar-Deroko-A-ondak-je-letijo-jeroplan-nad-Beogradom (accessed on 29 October 2025).
  61. Kozera, C.; Dittrich, A.D.O.; Silva, S.M. Fitossociologia do componente arbóreo de um fragmento de Floresta Ombrófila Mista Montana, Curitiba, PR, BR. Floresta 2006, 36, 225–237. [Google Scholar] [CrossRef] [Scilit]
  62. Mielke, E.C.; Negrelle, R.R.B.; Cuquel, F.L.; Lima, W.P. Espécies exóticas invasoras arbóreas no Parque da Barreirinha em Curitiba: Registro e implicações. Cienc Florest. 2015, 25, 327–336. [Google Scholar] [CrossRef] [Scilit]
  63. Eisfeld, R.L.; Socher, L.G.; Zachow, R.; de Portes, M.C.G.O.; Garcia, T. Floristic composition and phytosociologic structure of arboreous species in Açungui National Forest, Campo Largo, PR. Ambiência 2014, 10, 429–448. [Google Scholar] [CrossRef] [Scilit]
  64. Geraldi, S.E.; Koehler, A.B.; Kauano, E.E. Levantamento fitossociológico de dois fragmentos da floresta ombrófila mista, em Tijucas do Sul, PR. Ciencia Anim. 2005, 3, 27–36. [Google Scholar]
  65. Neto, R.M.R.; Kozera, C.; do Andrade, R.R.; Cecy, A.T.; Hummes, A.P.; Fritzsons, E.; Caldeira, M.V.W.; de Maciel, M.N.M.; Souza, M.K.F. Caracterização florística e estrutural de um fragmento de Floresta Ombrófila Mista, em Curitiba, PR–Brazil. Floresta 2002, 32, 3–16. [Google Scholar]
  66. Jovanović, S.; Janković-Milić, V.; Stanković, J.J.; Stanojević, M. The Role of Urban Tree Areas for Biodiversity Conservation in Degraded Urban Landscapes. Land 2025, 14, 1815. [Google Scholar] [CrossRef] [Scilit]
  67. James, P.; Tzoulas, K.; Adams, M.; Barber, A.; Box, J.; Breuste, J.; Elmqvist, T.; Frith, M.; Gordon, C.; Greening, K. Towards an integrated understanding of green space in the European built environment. Urban For. Urban Green. 2009, 8, 65–75. [Google Scholar] [CrossRef] [Scilit]
  68. Adelia, D.; Kaswanto, R.L. Analysis of vegetation biodiversity and urban park connectivity as landscape services provider in Bogor city. In IOP Conference Series: Earth and Environmental Science; IOP Publishing: Bristol, UK, 2021; Volume 694, p. 012020. [Google Scholar] [CrossRef] [Scilit]
  69. Stevaux, J.C.; Corradini, F.A.; Aquino, S. Connectivity processes and riparian vegetation of the upper Paraná River, Brazil. J. South Am. Earth Sci. 2013, 46, 113–121. [Google Scholar] [CrossRef] [Scilit]
  70. Heip, C.; Engels, P. Comparing species diversity and evenness indices. J. Mar. Biol. Assoc. 1974, 54, 559–563. [Google Scholar] [CrossRef] [Scilit]
  71. Zhang, Q.; Lan, S.S.; Huang, Q.; Chen, S.H. Urbanization effects on birds: From community to individual. Chin. J. Zool. 2013, 48, 808–816. [Google Scholar]
  72. Xie, S.L.; Cao, L.; Lu, F.; Ouyang, Z.Y. Adaptation of birds to urbanization. Acta Ecol. Sin. 2016, 36, 6696–6707. [Google Scholar] [CrossRef] [Scilit]
  73. Lakićević, M.; Srđević, B. Turistička valorizacija Topčiderskog parka u Beogradu. Ann. Agron. [Letop. Naučnih Rad. Poljopr. Fak.] 2011, 35, 127–135. [Google Scholar]
  74. eBird. Illustrated Checklist. Available online: https://ebird.org/hotspot/L2680365/illustrated-checklist (accessed on 30 October 2025).
  75. Liao, C.; Jiang, Y.; Yang, M.; Feng, K.; Zhang, J. Investigating the Impact of Urban Parks on Bird Habitats and Diversity Through Remote Sensing: A Case Study of Chengdu City (China). Land 2025, 14, 2086. [Google Scholar] [CrossRef] [Scilit]
  76. Evans, K.L.; Newson, S.E.; Gaston, K.J. Habitat influences on urban avian assemblages. Ibis 2009, 151, 19–39. [Google Scholar] [CrossRef] [Scilit]
  77. Parris, K.M. Urban amphibian assemblages as metacommunities. J. Anim. Ecol. 2006, 75, 757–764. [Google Scholar] [CrossRef] [Scilit]
  78. Sadler, J.P.; Small, E.C.; Fiszpan, H.; Telfer, M.G.; Niemelä, J. Investigating environmental variation and landscape characteristics of an urban–rural gradient using woodland carabid assemblages. J. Biogeogr. 2006, 33, 1126–1138. [Google Scholar] [CrossRef] [Scilit]
  79. Yao, X.; Zhang, D.; Song, Y.; Zhang, H.; Zhang, X.; Chang, Y.; Ma, X.; Lu, Z.; Wang, Y. Effects of Urban Park Construction Period on Plant Multidimensional Diversities, Landscape Patterns of Green Spaces, and Their Associations in Changchun City, Northeast China. Land 2025, 14, 675. [Google Scholar] [CrossRef] [Scilit]
  80. Garcia, D.A. Green areas management and bioengineering techniques for improving urban ecological sustainability. Sustain. Cities Soc. 2017, 30, 108–117. [Google Scholar] [CrossRef] [Scilit]
  81. Kuchcik, M. The attempt to validate the applicability of two climate models for the evaluation of heat wave related mortality in Warsaw in the 21st century. Geogr. Pol. 2013, 86, 295–311. [Google Scholar] [CrossRef] [Scilit]
  82. Pataki, D.E.; Alberti, M.; Cadenasso, M.L.; Felson, A.J.; McDonnell, M.J.; Pincetl, S.; Pouyat, R.V.; Setälä, H.; Whitlow, T.H. The Benefits and Limits of Urban Tree Planting for Environmental and Human Health. Front. Ecol. Evol. 2021, 9, 603757. [Google Scholar] [CrossRef] [Scilit]
  83. Esperon-Rodriguez, M.; Tjoelker, M.G.; Lenoir, J.; Baumgartner, J.B.; Beaumont, L.J.; Nipperess, D.A.; Power, S.A.; Richard, B.; Rymer, P.D.; Gallagher, R.V. Climate Change Increases Global Risk to Urban Forests. Nat. Clim. Change 2022, 12, 950–955. [Google Scholar] [CrossRef] [Scilit]
  84. Hussain, S.B.; Khan, S.; Zubair, M. Carbon Sequestration Potential of Roadside Trees in Southern Punjab, Pakistan. Asian J. Res. Agric. For. 2022, 8, 155–161. [Google Scholar] [CrossRef] [Scilit]
  85. Zubair, M.; Yasin, G.; Qazlbash, S.K.; Ul Haq, A.; Jamil, A.; Yaseen, M.; Rahman, S.U.; Guo, W. Carbon Sequestration by Native Tree Species around the Industrial Areas of Southern Punjab, Pakistan. Land 2022, 11, 1577. [Google Scholar] [CrossRef] [Scilit]
  86. UNECE. Advancing Sustainable Urban and Peri-Urban Forestry—A Green Approach to Resilience, Health, and Green Recovery; Policy Brief; United Nations Economic Commission for Europe: Geneva, Switzerland, 2022; Available online: https://unece.org/forests/policy-briefs-forestry-and-timber-section (accessed on 13 December 2025).
  87. Jarvis, I.; Sbihi, H.; Davis, Z.; Brauer, M.; Czekajlo, A.; Davies, H.W.; Gergel, S.E.; Guhn, M.; Jerrett, M.; Koehoorn, M.; et al. The influence of early-life residential exposure to different vegetation types and paved surfaces on early childhood development: A population-based birth cohort study. Environ. Int. 2022, 163, 107196. [Google Scholar] [CrossRef] [Scilit]
  88. He, J.; Ding, Q.; Yuan, Q.; Jin, S.; Yan, D.; Li, Z. Investigation of Biomass and Carbon Storage of Tree Species in Zhengzhou, a Megacity in China. Horticulturae 2025, 11, 500. [Google Scholar] [CrossRef] [Scilit]
  89. Stephenson, N.L.; Das, A.; Condit, R.; Russo, S.; Baker, P.; Beckman, N.G.; Coomes, D.; Lines, E.; Morris, W.; Ruger, N. Rate of tree carbon accumulation increases continuously with tree size. Nature 2014, 507, 90–93. [Google Scholar] [CrossRef] [Scilit]
  90. Jha, K.K. Root carbon sequestration and its efficacy in forestry and agroforestry systems: A case of Populus euramericana I-214 cultivated in Mediterranean condition. Not. Sci. Biol. 2018, 10, 68–78. [Google Scholar] [CrossRef] [Scilit]
  91. Zhou, G.Y.; Yin, G.C.; Tang, X.L.; Wen, D.Z.; Liu, C.P.; Kuang, Y.W.; Wang, W.T. Carbon Storage of Forest Ecosystems in China—Biomass Equation; Science Press: Beijing, China, 2018; pp. 70–73. [Google Scholar]
  92. Zhao, H.B.; Zhou, G.Y.; Li, Z.J.; Qiu, Z.-J.; Wu, Z.-M.; Wang, X. Biomass Allocation and Allometric Growth Models of Four Common Tree Species in Southern Subtropical Evergreen Broad-Leaved Forest. Sci. Silvae Sin. 2022, 58, 23–31. [Google Scholar]
  93. Tsilini, V.; Papantoniou, S.; Kolokotsa, D.; Maria, E. Urban gardens as a solution to energy poverty and urban heat island? Sustain. Cities Soc. 2015, 14, 323–333. [Google Scholar] [CrossRef] [Scilit]
  94. Akbari, H. Shade trees reduce building energy use and CO2 emissions from power plants. Environ Pollut. 2002, 116, 119–126. [Google Scholar] [CrossRef] [Scilit]
  95. Kordowski, K.; Kuttler, W. Carbon dioxide fluxes over an urban park area. Atmos. Environ. 2010, 44, 2722–2730. [Google Scholar] [CrossRef] [Scilit]
  96. Paoletti, E.; Bardelli, T.; Giovannini, G.; Pecchioli, L. Air quality impact of an urban park over time. Procedia Environ. Sci. 2011, 4, 10–16. [Google Scholar] [CrossRef] [Scilit]
Figure 1. Three-dimensional surface plot of relative relief values across the territory of the Savski Venac municipality of Belgrade, showing the location of Topčider Park (TP).
Forests 17 00114 g001
Figure 2. The study area in Belgrade (a), aspect (b) and slope (c).
Forests 17 00114 g002
Figure 3. Platanus × hispanica Mill. ex Münchh since 1868 (a); habitus of Taxodium distichum (L.) Rich. (b); view of trunks and root excrescences of T. distichum (c); and detail of needles and cones of T. distichum (d), early autumn, October 2025, in Topčider Park.
Forests 17 00114 g003
Figure 4. Graphical representation of (a) mean maximum, (b) mean, and (c) mean minimum monthly air temperatures (°C), and (d) mean seasonal values for the periods 1888–1990 and 1991–2020 (reference), as well as total precipitation (mm) for 2021, 2022, 2023, 2024, and 2025 (winter, spring, and summer), based on data from the Belgrade Meteorological Station (MMS Belgrade).
Forests 17 00114 g004
Figure 5. Representation of the investigated growth parameters (TH—tree height (m), TD—trunk diameter (cm), CW—crown width (m)), ornamentality (scores 1–5, O), and vitality (scores 1–5, V) for all tree taxa (a), Angiospermae (b), and Gymnospermae (c) in Topčider Park, Belgrade. Values are presented as mean ± standard error.
Forests 17 00114 g005aForests 17 00114 g005b
Figure 6. Graphical representation of the investigated growth parameters (TH (orange)—tree height (m), TD (purple)—trunk diameter (cm), CW (blue)—crown width (m)), ornamentality (red, scores 1–5, O), and vitality (green, scores 1–5, V) for taxa with the highest and lowest values among Angiospermae (ae) and Gymnospermae (fj).
Forests 17 00114 g006
Figure 7. PCA diagrams based on TH (tree height), TD (trunk diameter), CW (crown width), O (ornamentality), and V (vitality): (a,b) all trees in Topčider Park (1—Angiospermae and 2—Gymnospermae).
Forests 17 00114 g007
Figure 8. PCA diagrams based on TH (tree height), TD (trunk diameter), CW (crown width), O (ornamentality), and V (vitality) (a,b) Angiospermae trees (1—Aesculus hippocastanum L., 2—Aesculus flava Sol., 3—Acer campestre L., 4—Acer negundo L., 5—Acer platanoides L., 6—Acer platanoides ‘Schwdlerii’, 7—Acer pseudoplatanus ‘Atropurpureum’, 8—Acer pseudoplatanus L., 9—Alnus glutinosa (L.) Gaertn., 10—Alnus incana (L.) Moench, 11—Betula pendula Roth, 12—Betula pendula ‘Fastigiata’, 13—Cercis siliquastrum L., 14—Carpinus betulus L., 15—Catalpa bignonioides Walter, 16—Corylus colurna L., 17—Crataegus monogyna Jacq., 18—Celtis australis L., 19—Cornus mas L., 20—Fraxinus ornus L., 21—Fraxinus excelsior L., 22—Fraxinus excelsior ‘Monophylla’, 23—Fraxinus angustifolia Vahl, 24—Fraxinus pennsylvanica Marshall, 25—Fagus sylvatica L., 26—Gleditsia triacanthos f. inermis (Castigl.) Zabel, 27—Juglans regia L., 28—Liriodendron tulipifera L., 29—Liquidambar styraciflua L., 30—Morus alba L., 31—Morus alba ‘Pendula’, 32—Malus sylvestris (L.) Mill., 33—Maclura pomifera (Raf.) C.K.Schneid., 34—Platanus × hispanica Mill. ex Münchh., 35—Pyrus communis subsp. communis (Pyrus pyraster (L.) Burgsd.), 36—Populus alba L., 37—Populus nigra L., 38—Prunus avium (L.) L., 39—Prunus cerasifera Ehrh., 40—Robinia pseudoacacia L., 41—Rhus typhina L., 42—Quercus robur L., 43—Quercus robur ‘Fastigiata’, 44—Quercus rubra L., 45—Quercus palustris Münchh., 46—Quercus pubescens subsp. pubescens (Quercus virgiliana (Ten.) Ten.), 47—Quercus petraea (Matt.) Liebl., 48—Salix babylonica f. babylonica (Salix matsudana Koidz.), 49—Salix babylonica var. pekinensis ‘Tortuosa’ (Salix matsudana ‘Tortuosa’), 50—Salix alba L., 51—Tilia tomentosa Moench, 52—Tilia platyphyllos Scop., 53—Tilia cordata Mill., 54—Tilia × europaea L., 55—Ulmus glabra Huds., and 56—Ulmus minor Mill.).
Forests 17 00114 g008
Figure 9. PCA diagrams based on TH (tree height), TD (trunk diameter), CW (crown width), O (ornamentality), and V (vitality) (a,b) Gymnospermae trees (57—Ginkgo biloba L., 58—Abies alba Mill., 59—Abies nordmanniana (Steven) Spach, 60—Cedrus atlantica (Endl.) Manetti ex Carrière, 61—Cryptomeria japonica (Thunb. ex L.f.) D.Don, 62—Picea abies (L.) H.Karst., 63—Picea pungens Engelm., 64—Pinus nigra J.F.Arnold, 65—Pinus sylvestris L., 66—Pinus wallichiana A.B.Jacks., 67—Pinus strobus L., 68—Platycladus orientalis (L.) Franco, 69—Thuja occidentalis L., 70—Taxodium distichum (L.) Rich., and 71—Taxus baccata L.).
Forests 17 00114 g009
Figure 10. Regression analysis of the effect of trunk diameter (TD) on total fresh biomass (TFB) for Angiospermae (a) and Gymnospermae (c), and the effect of tree height (TH) on total fresh biomass (TFB) for Angiospermae (b) and Gymnospermae (d) in Topčider Park. Confidence ellipses represent the 95% confidence interval.
Forests 17 00114 g010
Table 1. Taxonomic classification, origin, and potential invasiveness of urban trees in Topčider Park.
FamilyAutochthonous (Number of Taxa)Allochthonous (Number of Taxa)Hybrid (Number of Taxa)Lower Taxa (Number of Taxa)Invasive Alien Species
Altingiaceae Horan.-1---
Anacardiaceae R.Br.-1---
Betulaceae Gray5--1-
Bignoniaceae Juss.-1---
Cannabaceae Martinov1----
Cornaceae Bercht. & J.Presl1----
Cupressaceae Gray-4---
Fabaceae Lindl.-2-1R. pseudoacacia
Fagaceae Dumort.23-2-
Ginkgoaceae Engl.-1---
Juglandaceae DC.ex Perleb1----
Magnoliaceae Juss.-1---
Malvaceae Juss.3-1--
Moraceae Gaudich.-2-1-
Oleaceae Hoffmanns. & Link31-1F. pennsylvanica
Pinaceae Spreng. ex F.Rudolphi45---
Platanaceae T.Lestib.--1--
Rosaceae Juss.41---
Salicaceae Mirb.3--2-
Sapindaceae Juss.33-2A. negundo
Taxaceae Gray1----
Ulmaceae Mirb.2----
Σ
22
33262103
Table 2. Shannon diversity index (H’) and the Pielou evenness index (J’) in Topčider’s park.
Variable/TreesTopčider’s Park
(All Trees)
AngiospermaeGymnospermae
Diversity index (H’)3.573.292.18
Max H’4.264.022.71
Homogeneity (J’)0.840.820.81
Table 3. Minimum and maximum values of trunk diameter at 1.37 m height (TD), tree height (TH), total fresh aboveground biomass (TAGFB), and total fresh belowground biomass (TBGFB).
TreesNumber of TreesRange of the Parameters
TD (cm)TH (m)TAGFB (kg)TBGFB (kg)
All trees7608–1391–343.242–714.1400.843–185.676
Angiospermae6108–1391.5–343.242–714.1400.843–185.676
Gymnospermae1509–891–22.37.545–265.9321.962–69.142
Table 4. Chi-square test results (test of independence between rows and columns) at a significance level of p < 0.05, showing the effect of tree height (TH) and trunk diameter (TD) on total fresh biomass (TFB) of Angiospermae and Gymnospermae in Topčider Park.
Variable/TreesAngiospermaeGymnospermae
Chi-square (Observed value)108.76353.625
Chi-square (Critical value)667.519178.485
DF609149
p-value1.0001.000
alpha0.050.05
Table 5. Spearman’s correlation coefficients and p-values for trunk diameter (TD), tree height (TH), total fresh biomass (TFB), carbon sequestration (C), and CO2 reduction (CO2) for Angiospermae and Gymnospermae (significance level: p < 0.05).
VariablesTD (cm)TH (m) TFB (lg)C (mg/kg Fresh Biomass)CO2 (mg/kg Fresh Biomass)
Angiospermae
TD (cm) <0.0001<0.0001<0.0001<0.0001
TH (m)0.749 <0.0001<0.0001<0.0001
TFB (kg)0.9530.902 <0.0001<0.0001
Gymnospermae
TD (cm) <0.0001<0.0001<0.0001<0.0001
TH (m)0.740 <0.0001<0.0001<0.0001
TFB (kg)0.9970.733 <0.0001<0.0001
Bold values are statistically significant (p < 0.05); other values represent p-values.
Table 6. Total fresh biomass (TFB), carbon sequestration (C), and CO2 reduction (CO2) for all trees in Topčider Park, Angiospermae, and Gymnospermae.
TreesRange of the Parameters
TFB
(kg)
C
(mg/kg Fresh Biomass)
CO2
(mg/kg Fresh Biomass)
All trees6.1562954.9310,823.91
Angiospermae489023478598
Gymnospermae12666082226
Disclaimer/Publisher’s Note: The statements, opinions and data contained in all publications are solely those of the individual author(s) and contributor(s) and not of MDPI and/or the editor(s). MDPI and/or the editor(s) disclaim responsibility for any injury to people or property resulting from any ideas, methods, instructions or products referred to in the content.