Article

Trees by Resident Request: Who Wants More Trees and What Are the Consequences?

1
School of Computer and Information Engineering, Xiamen University of Technology, Xiamen 361024, China
2
School of Natural Resources, Faculty of Geographical Science, Beijing Normal University, Beijing 100875, China
*
Author to whom correspondence should be addressed.
Forests 2026, 17(2), 193; https://doi.org/10.3390/f17020193
Submission received: 17 November 2025 / Revised: 16 January 2026 / Accepted: 24 January 2026 / Published: 1 February 2026
(This article belongs to the Section Forest Ecology and Management)

Abstract

Citizens’ interest in improving neighborhood greenspace is an important component of addressing the distributional inequity of urban trees and greenspace, which brings a variety of benefits to urban dwellers. With proper support, such interest may transform into real land cover change, enlarging or reducing the current discrepancy of greenspace supply across groups of urban populations. This study examined how citizens’ interest in growing street trees was influenced by socioeconomic status (race and income), residential situation (rent/own, occupied/vacant), and land cover in New Haven, CT. Furthermore, we investigated the current greenspace distribution and its association with residents’ characteristics to discuss the impact of an interest-based tree-planting program. Regression analysis showed that income and street tree density significantly contributed to the number of tree requests during 2016–2019. An increase of USD 1000 in median household income or one additional street tree per kilometer would increase the number of tree requests by 5.9 or 2.5 within a block group, respectively. There were differences in the distribution of greenspace in terms of race/class and residential situation, and such disparities were further enlarged by the fact that better-off neighborhoods requested more trees. These findings indicated that income and land cover may promote citizens’ interest in improving neighborhood greenspace. Simply relying on citizens’ interest in improving neighborhood environments may polarize the existing discrepancy in greenspace supply. Approaches targeting certain areas are needed in order to reduce the gap between greenspace supply and access across different socioeconomic groups. The community greenspace program, which supports residents in building neighborhood gardens on vacant lots, is an example of this kind.

1. Introduction

According to UN statistics, about 70% of the world’s population will live in cities by 2050 [1]. Rapid urbanization brings drastic changes to land cover [2]. Urban roads and other impervious surfaces have replaced natural land, causing environmental problems such as flooding, the heat island effect, air pollution, and natural landscape degradation [3,4,5,6]. As an important part of the urban landscape, urban greenspace delivers many key ecosystem services to residents, including shading, cooling, noise reduction, and dust retention [7,8,9,10].
However, urban greenspace is often unevenly distributed. Some studies found that the distribution of urban greenspace is associated with residents’ socioeconomic characteristics, such as race and income [11,12,13]. Neighborhoods with people of color and low-income residents tend to have less greenspace [14,15,16,17]. Such distributional inequity has been recognized as a form of environmental injustice since more trees or greenspace in neighborhoods usually bring more benefits to residents [18,19]. Based on these case studies that characterize the distributional inequity of trees and greenspace in many cities worldwide, researchers have called for attention from urban planners and practitioners and hope to alleviate such environmental injustice through future urban greening programs.
In addition to the spatial distribution of urban trees, the environmental justice of urban trees was also reflected in various vegetation parameters. A study in Baltimore, Maryland, in the United States, found positive correlations between local household income and the species richness, abundance, and biomass of street trees, indicating that neighborhoods with higher socioeconomic status tended to exhibit superior street tree conditions [20]. In Sydney, Australia, areas with higher socioeconomic status were more actively involved in tree maintenance (such as watering, fertilizing, mulching), and therefore, the trees in these areas were also healthier [21]. Similarly, there was a significant negative correlation between the median household income of urban neighborhoods and the proportion of stressed street trees in Washington, D.C., the United States. Specifically, neighborhoods with higher socioeconomic status had lower proportions of stressed street trees and superior overall street tree quality [22]. These studies suggested a relatively consistent pattern globally: affluent urban areas tended to possess a greater quantity, diversity, and quality of urban trees. Some studies further indicated that municipal management practices favored the increased greening in wealthier neighborhoods, potentially exacerbating existing inequalities in urban tree canopy distribution and the associated ecological benefits [20,23].
The environmental justice framework emphasizes distributive justice [24], such as who can access high-quality urban forests and their benefits, and also emphasizes recognition justice [25,26], such as whose preferences, cultural values, and demands are reflected in the urban greening. Equally important but often less discussed is citizens’ interest in improving the neighborhood environment. Who is more interested in having more trees? A previous study in New Haven, CT found that neighborhoods with high education and more renters showed more interest in planting street trees, while race and income were not significant factors [27]. This study only analyzed the influence of the socioeconomic characteristics of citizens on their preferences and behaviors towards urban greening, without considering the potential influence of current greenspace or tree cover. People who currently lack greenspace or trees might be interested in having more because their greenspace or tree provision is relatively low. Alternatively, people who have relatively more greenspace or trees may also be interested if they have higher preferences. Interest in having more greenspace or trees may translate into actual land cover change in neighborhoods with external support. It remains unknown how citizens’ interest in improving the urban environment is influenced by their own socioeconomic and external environmental characteristics. Therefore, it is key to understand citizens’ interest in improving neighborhood greenspace or tree cover and how it is related to socioeconomic status as well as current greenspace or tree provision.
Based on the environmental justice framework, this paper further focuses on whether there is inequality in access to new greening resources among blocks with different socioeconomic characteristics and land cover conditions. We conducted a case study in New Haven, CT to examine how socioeconomic status (race and income), residential situation (rent/own, occupied/vacant), and current land cover may influence citizens’ interest in growing street trees. In addition, we investigated the association between greenspace distribution and socioeconomic status, and estimated its possible change resulting from the tree request program. Specifically, we asked the following questions: (1) What is the relationship between the distribution of urban greenspace and the socioeconomic status of residents? (2) What kind of neighborhoods sent out more requests to grow trees in terms of socioeconomic, residential, and land cover characteristics? (3) What are the main factors explaining the variation in tree requests across neighborhoods? Answers to these questions will not only help us better understand citizens’ preferences and motivations, but also shed light on potential future changes in distributional inequity when interest in making changes is supported.

2. Method

2.1. Study Area

New Haven is located between Boston and New York City. It is a coastal city in the northeastern United States. It covers an area of 50 km2 with a population of 130,000. People of color make up 70% of the population. The median household income of block groups ranged from USD 11,000 to USD 127,000 [28].
The city of New Haven, in partnership with the local nonprofit organization Urban Resources Initiative (URI), has run a street tree planting program since 2007. Trees are planted free of charge upon request. Requests can be submitted via an online form or postcard. Requesters can choose tree species from a catalog and the location where they would like a tree planted. The only requirement is their commitment to water the tree once a week during the growing season for the first 3 years. Through this program, URI has planted over 5000 street trees in New Haven [27]. Additional information about the tree-planting program can be found on URI’s website [29].

2.2. Data and Analyses

This study employed tree request data, land cover dataset, and census data. We carried out all analyses at the block group level. There are 106 block groups in New Haven, among which four were missing data on income, and another five were missing data on White population. The 9 block groups were distributed in both the central and peripheral areas of the city, and they were not areas with very low population density, either. Therefore, these 9 block groups were excluded, and 97 block groups were included for analysis.
We obtained tree request data from January 2016 to April 2019 from URI. These data were directly provided by URI, including information such as the requester’s address, requested tree species, and quantity. There were 1339 tree requests in total. Each record contains the requester’s address. According to the address locator provided by Yale University, we successfully geocoded 1286 addresses (96.04%) in ArcGISTM 10.7. The remaining 53 addresses were primarily located in park areas and could not be successfully geocoded, because the address locator lacked corresponding address information for these parks. Finally, 1216 tree requests within the 97 block groups were used for analysis. Combined with the block group boundaries, we calculated the total number of requests for each block group, which was used in the following analyses.
We considered the socioeconomic status of each block group based on race and income, and its residential situation based on the presence of vacant lots and proportion of renters. Race and income are often found to be associated with access to trees and greenspace [30,31,32]. Researchers also suggested that race and income may be associated with demand for and preference for trees and greenspace [33,34]. We used the median household income and the proportion of non-Hispanic Whites in each block group to characterize its socioeconomic status. We used the proportion of vacant housing and the proportion of renter-occupied housing in each block group to characterize its residential situation. Therefore, we decided to investigate how these four variables may be associated with the number of tree requests. All these variables were extracted from the 5-year estimated American Community Survey (ACS) for each block group (2013–2017) [28]. In addition, we also used the number of households in each block group to control for the impact of population size on tree requests in regression analysis.
We employed the percentage of tree canopy and grass in each block group to investigate the association between existing land cover and the number of tree requests. Here, we assumed that the tree requests submitted by residents from 2016 to 2019 were based on the land cover prior to 2016. Therefore, we selected the 2016 land cover data. The land cover dataset has a resolution of 3 m, which was provided by the Spatial Analysis Laboratory at the University of Vermont. It was derived from 2016 LiDAR data and 2016 National Agricultural Imagery Program (NAIP) data (1 m resolution, 4 bands) via object-based image analysis techniques, with detailed manual validation conducted at a scale of 1:3000. The dataset included seven land cover classes: tree canopy, grass/shrub, bare earth, water, buildings, roads, and other paved surfaces. It should be noted that residents’ perception of surrounding vegetation may include various vegetation types such as those in parks, nature reserves, and residential courtyards. Therefore, we did not distinguish between vegetation types in different areas.
In addition, we obtained locations of existing street trees from New Haven’s Natural Assets and Activities Field Map [35], which recorded location, species, and planting time for each tree. Street trees are dependent on the presence of public streets [36]. Therefore, we removed trees planted after 2016, converted the road raster layer of the land cover data into a vector layer, calculated the length of streets for each block group, and divided the number of trees by the length of streets to calculate the street tree density for each block group prior to the submission of tree requests (2016–2019). Since the requested trees have to be planted along streets, street tree density reflects the potential spots available for tree planting. The higher the street tree density, the less space is available for future tree requests.
We conducted correlation analyses to investigate the association between land cover and socioeconomic status, as well as the relationship between the number of tree requests and socioeconomic status, residential situation, and land cover. Furthermore, we employed multiple regression analysis to examine the extent to which the interest in requesting trees may be explained by these variables. To reduce the influence of extreme values on model fitting, we performed logarithmic transformation on the dependent variable (log10(tree requests/total households)). However, the number of tree requests in 3 block groups was 0, so they were excluded from the multiple regression analysis. Before the model fitting, we did not standardize each independent variable. Instead, we analyzed the standardized coefficients of each independent variable to determine the influence of each independent variable on tree requests after the model fitting. All analyses were carried out in SPSSTM 20.0. Maps were produced in ArcGISTM 10.7.

3. Results

3.1. Associations Between Tree Requests and Socioeconomic Status, Residential Situation, and Land Cover

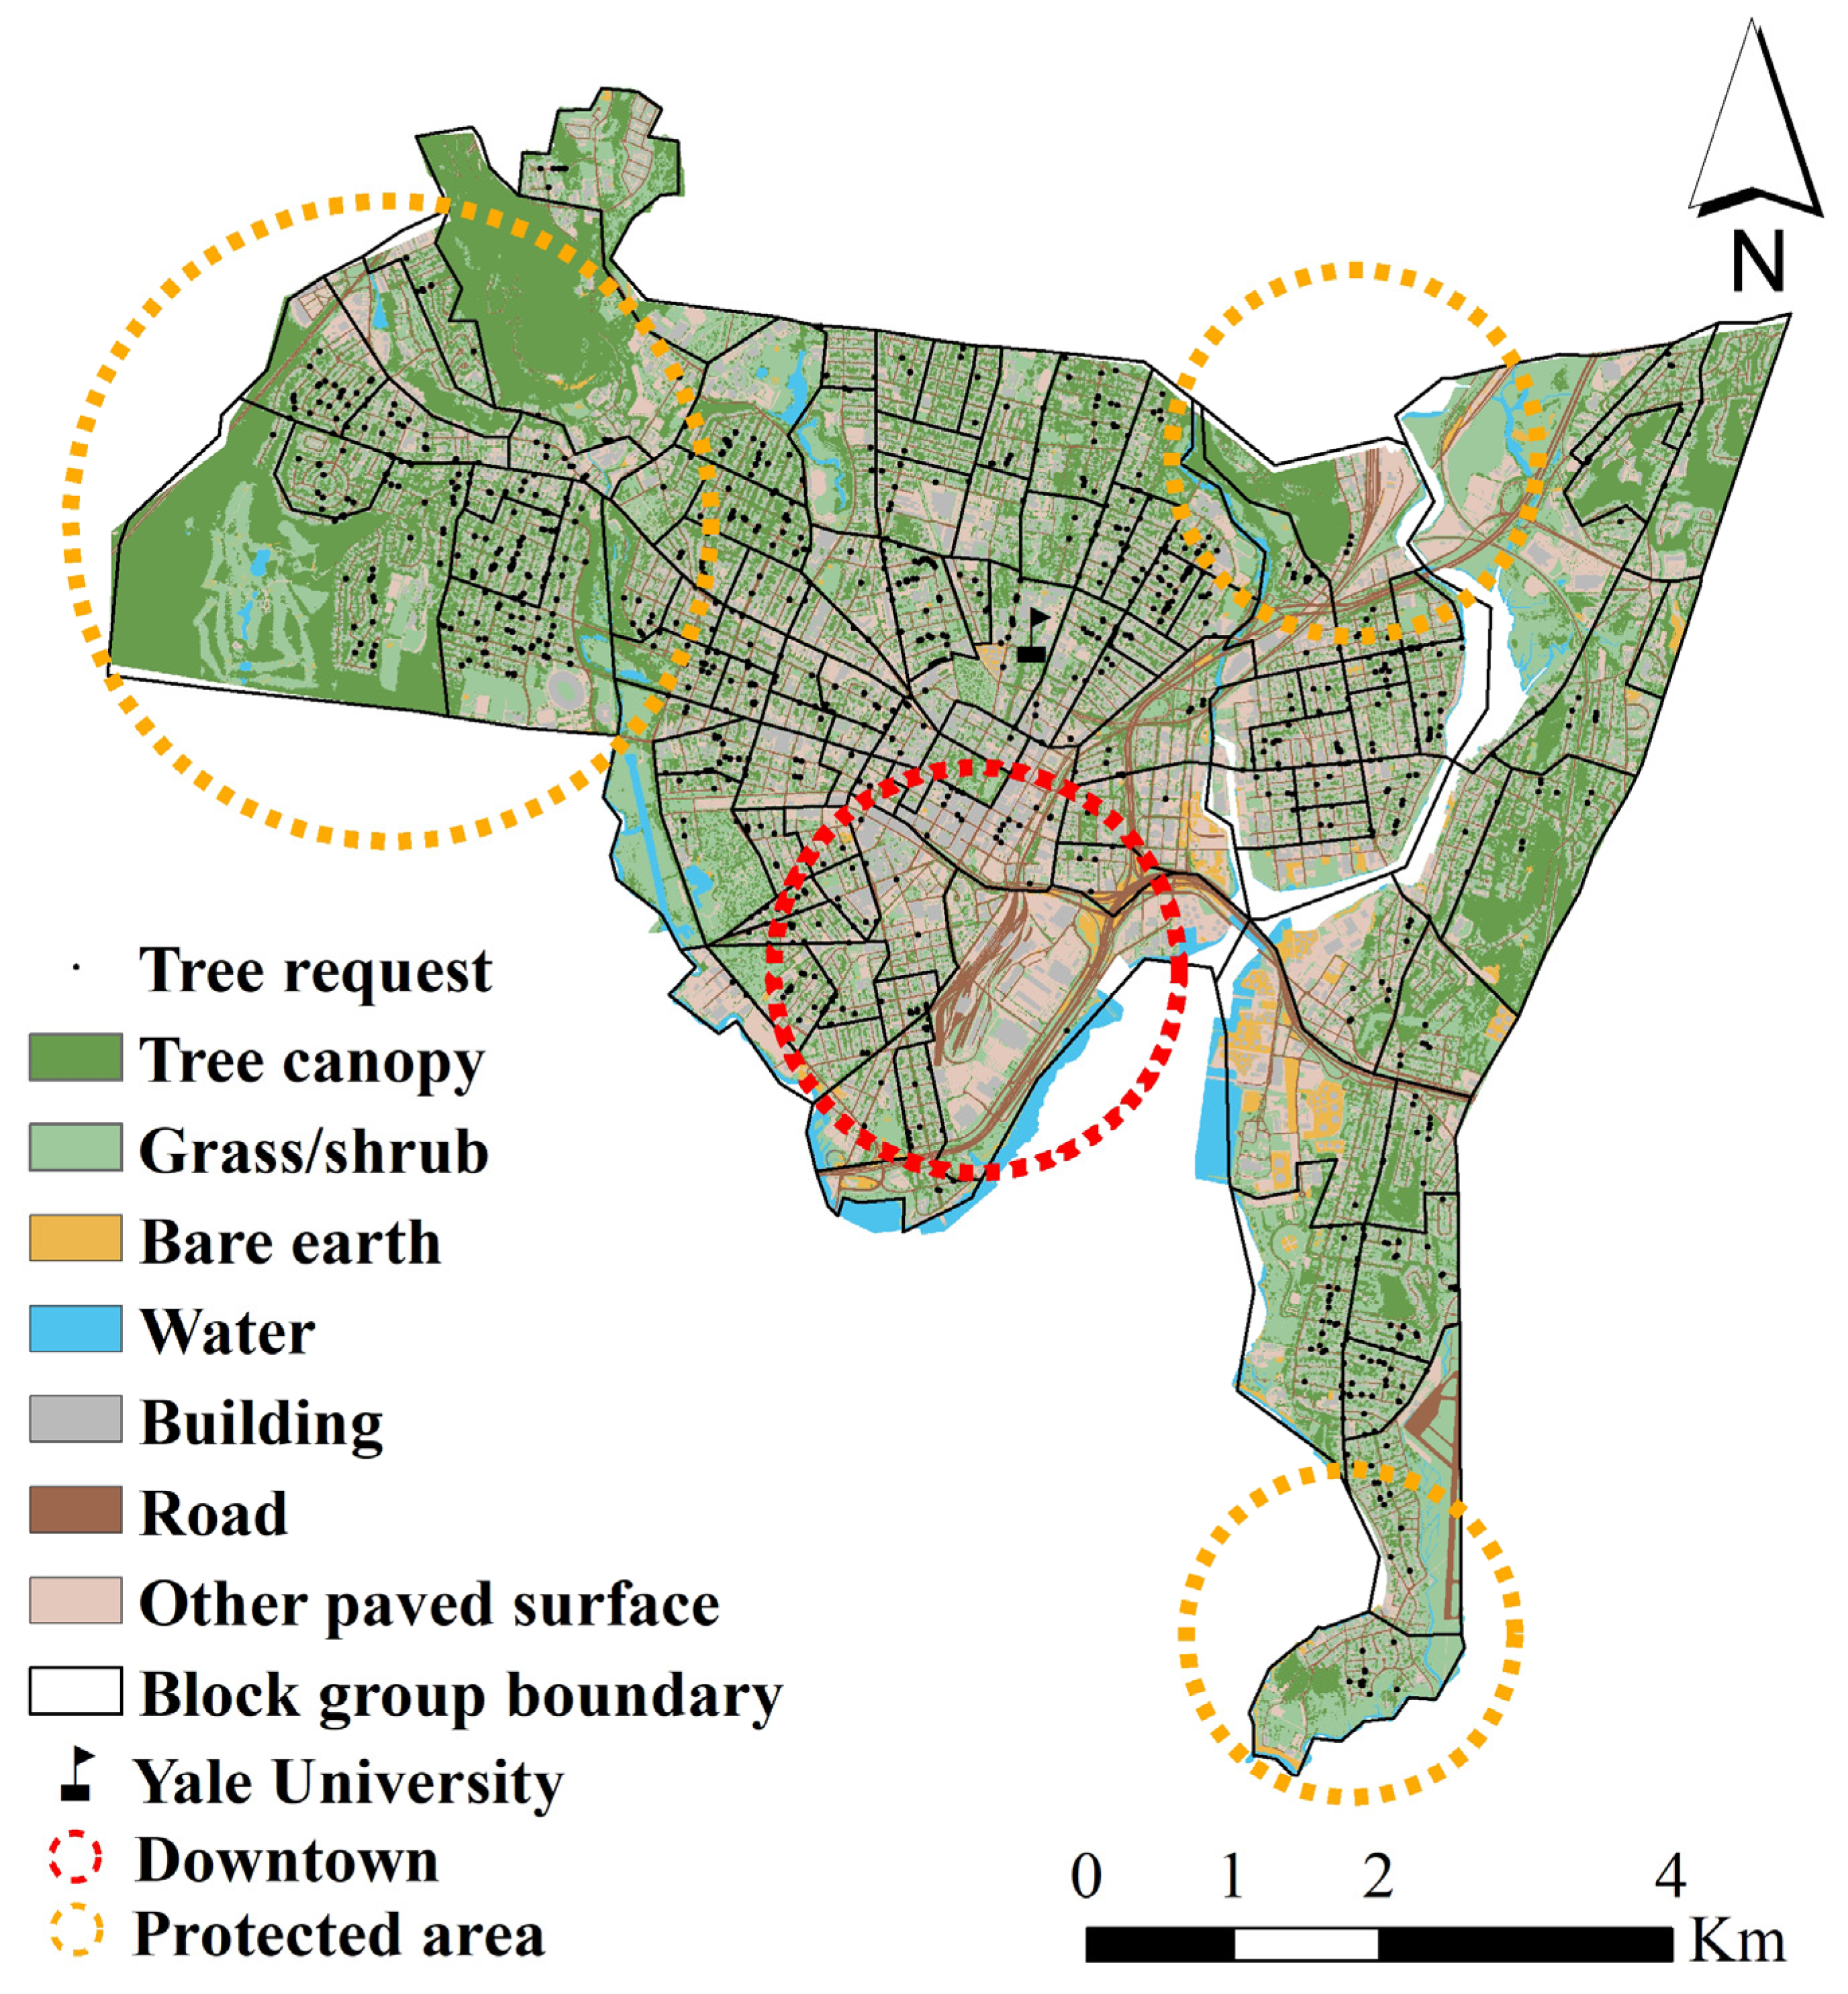
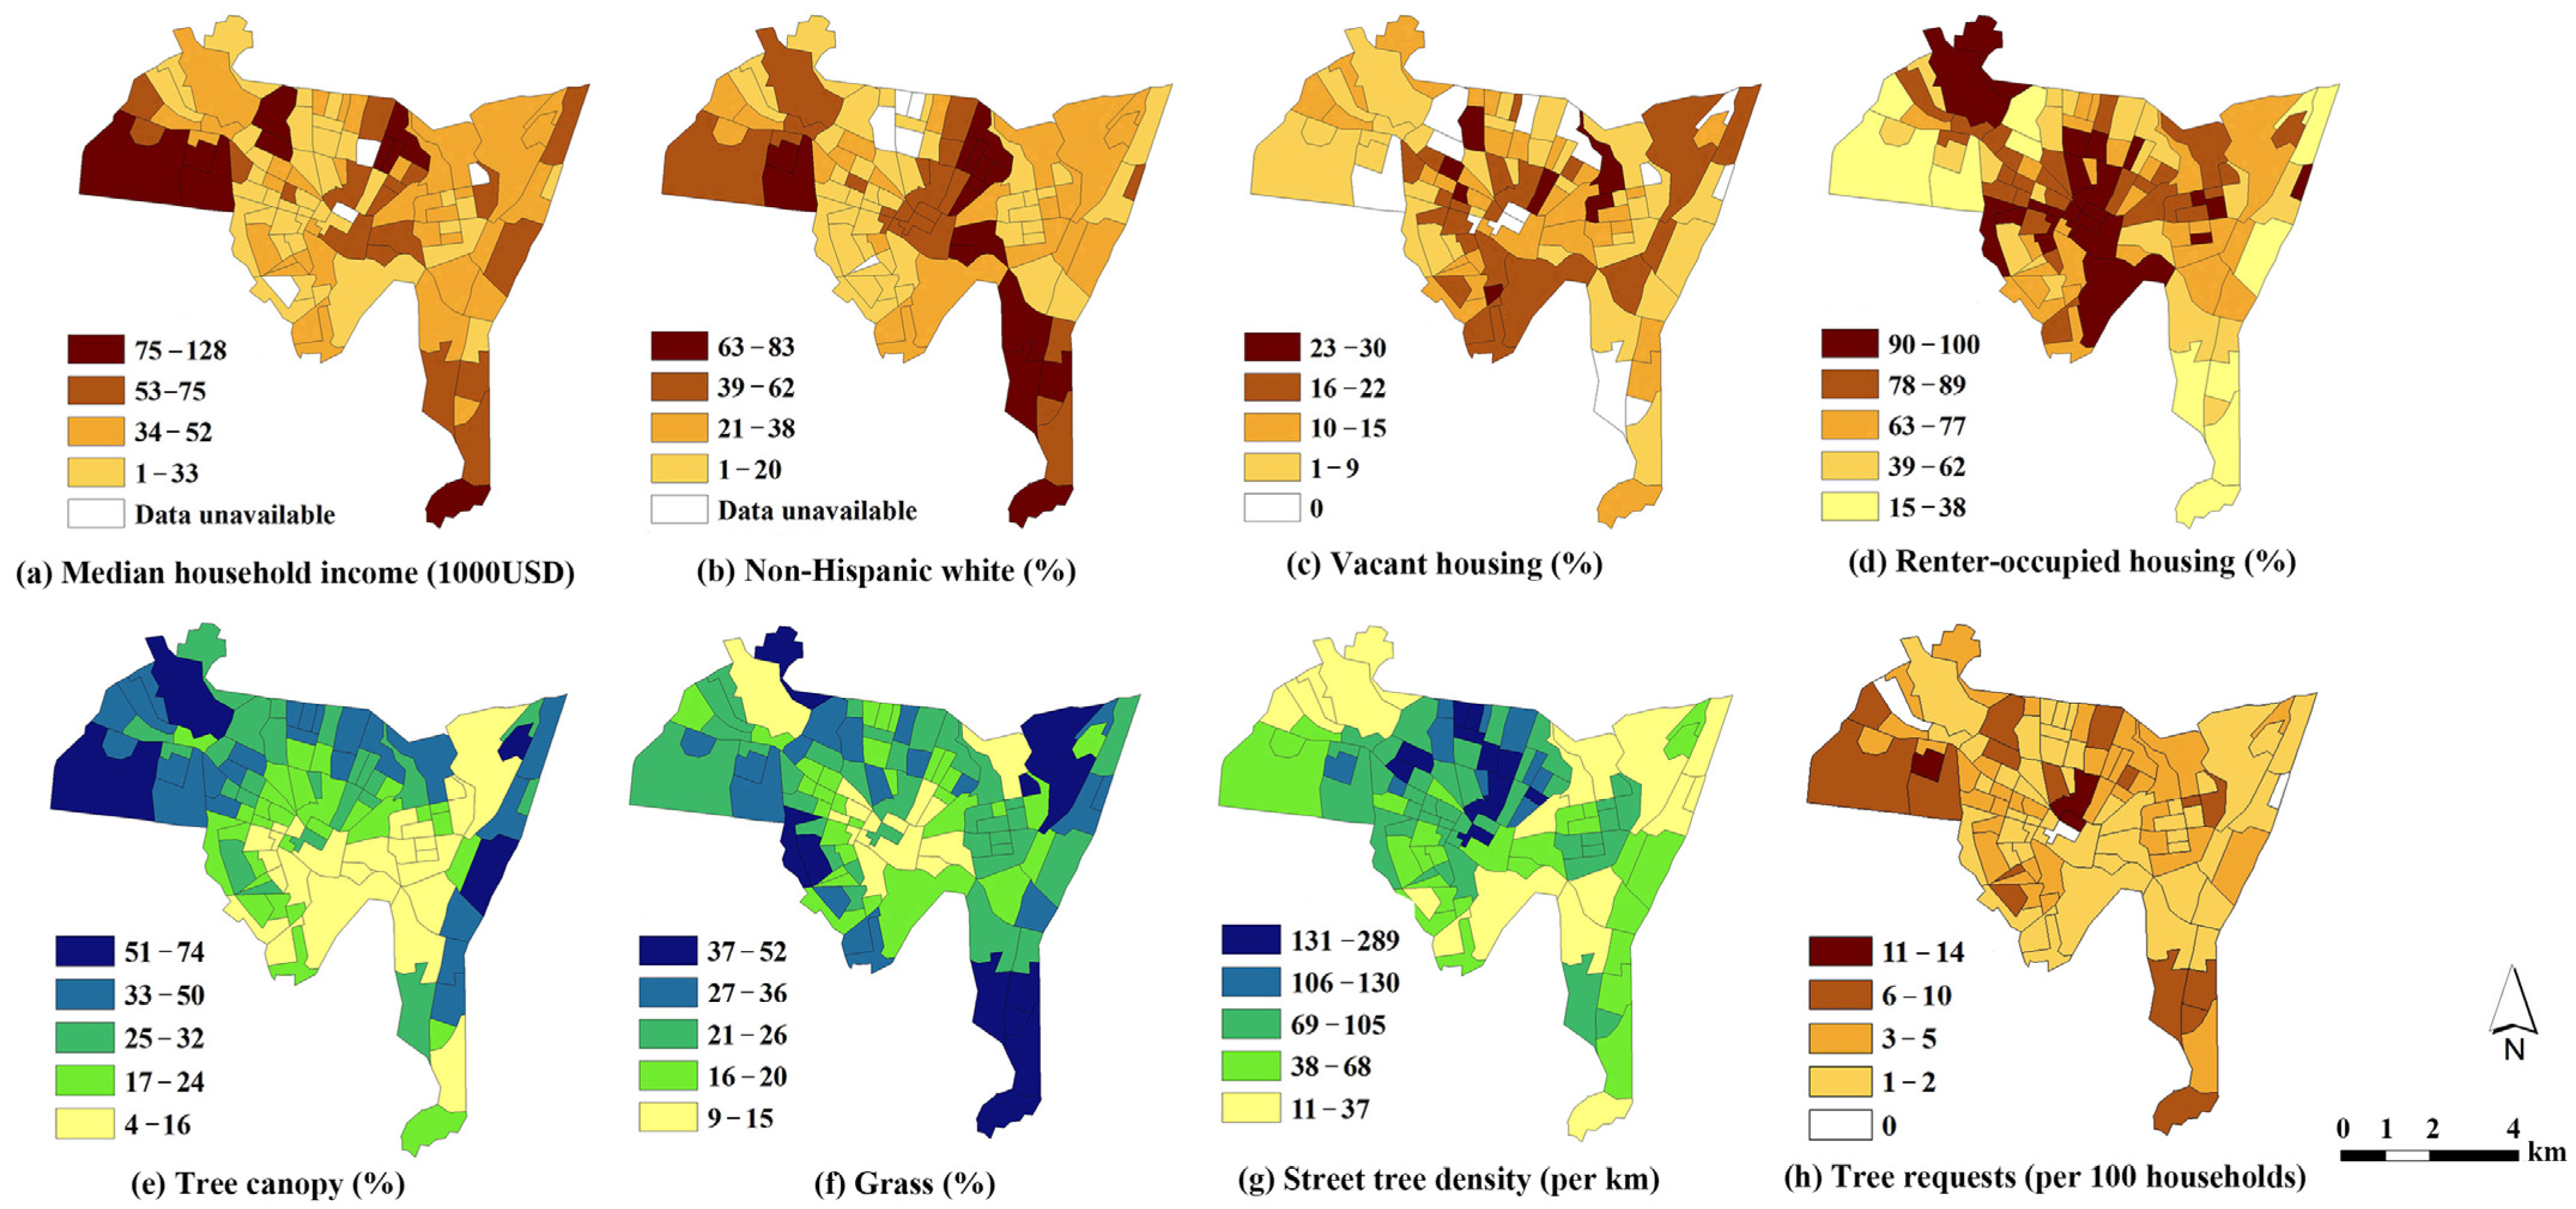
The number of tree requests, as well as indicators of socioeconomic status, residential situation, and land cover, displayed considerable spatial heterogeneity (Figure 1). Tree canopy, grass cover, and street tree density were relatively high in the three clusters around parks and protected areas located at the corners as indicated by the orange circles (Figure 2). Unsurprisingly, neighborhoods there have high incomes, a high proportion of White residents, few vacant lots, and few renters. In contrast, the downtown area at the lower center is characterized by low income, few White residents, moderate to high presence of vacant housing, and a high proportion of renters. Tree canopy coverage and grass coverage were significantly associated with income (r = 0.306, p < 0.01; r = 0.200, p < 0.05; respectively), as well as the proportion of renters (r = −0.328, p < 0.01; r = −0.402, p < 0.01; respectively) and the proportion of vacant housing (r = −0.272, p < 0.01; r = −0.260, p < 0.05; respectively) across the 97 block groups (Table 1). Race, while usually found to be related to vegetation coverage, had no significant association with tree canopy (r = 0.116, p = 0.258) or grass cover (r = 0.012, p = 0.908) in this study (Table 1).
Results showed that the number of tree requests was significantly associated with socioeconomic status, residential situation, and land cover. Block groups with more White residents (r = 0.304, p < 0.01), higher income (r = 0.585, p < 0.01), fewer renters (r = −0.522, p < 0.01), and more tree canopy (r = 0.224, p < 0.05) or grass cover (r = 0.274, p < 0.01) tended to have more requests for trees. The total number of households (r = 0.147, p = 0.152), the length of streets (r = 0.157, p = 0.124), the proportion of vacant housing (r = −0.180, p = 0.078), and existing street tree density (r = 0.098, p = 0.340) were not significantly related to the number of tree requests (Table 1).

3.2. Factors Influencing the Number of Tree Requests

Results showed that median household income had the strongest effect on the number of tree requests (β = 0.305), followed by street tree density (β = 0.237). In addition, grass coverage had a marginally non-significant effect (β = 0.199, p = 0.052). In the model, the VIFs of the independent variables were relatively low, which had little effect on the coefficient estimates. Moreover, there was no spatial autocorrelation in the residuals of the fitted model (Moran’s I = 0.019; z = 0.677; p = 0.498). On average, a block group had 490 households in our study area. The number of tree requests for an average-sized block group increased by 5.9 with every USD 1000 increase in median household income (Table 2). Similarly, one additional street tree per kilometer would increase the number of tree requests by 2.5 (Table 2). A 1% increase in grass coverage would increase the number of tree requests by 9.8. Race, residential situation (vacant housing/renter), and tree canopy coverage were not found to provide a significant contribution to explaining variation in the number of tree requests. In particular, the proportion of renter-occupied housing showed a strong negative correlation with the number of tree requests (r = −0.522, p < 0.01) (Table 1). However, under the influence of various socioeconomic factors and land cover types, it did not have a significant impact on residents’ tree requests (β = −0.249, p = 0.06).

4. Discussion

The association between tree requests and tree/grass coverage indicated that block groups with more trees and grass were requesting more trees, which will polarize the existing vegetation coverage gap. This result is consistent with the previous studies that found that areas with more street trees would have an increase in the number of trees [23]. However, the difference was that the polarization in the distribution of street trees in previous studies was mainly led by municipal urban greening initiatives, rather than citizens’ tree requests. Furthermore, we found that additional trees were planted in areas with more White residents, higher income, and more homeowners. Similarly to the previous studies that found that socioeconomically advantaged groups had more street trees [37,38], the results of our study further reveal that these groups had a stronger preference for urban greening and took corresponding actions, which would exacerbate the spatial inequality in the distribution of greenspace [39,40,41].
When considering the joint effects of socioeconomic characteristics and the external environment, we found that citizens’ income and street tree density were the main factors influencing their tree requests. This finding indicated that higher income and street tree coverage tend to prompt more interest in making neighborhoods even greener. It is consistent with previous studies that found that higher socioeconomic status and greener environments promoted stronger preferences for greenspace [34,42], as well as higher demand for ecosystem services [43]. One reason for such an undesirable situation is that the block groups with higher average income and more street trees submitted more tree requests in the past 3 years. Since URI planted trees for free with a minimum commitment required, a tree request can be interpreted as an interest in improving the neighborhood environment.
Our results from the regression analysis model revealed that tree canopy and grass coverage did not have a significant impact on tree requests, but street tree density played a major role. Block groups with higher street tree density actually have fewer spots available for additional trees. Nevertheless, they still submitted more requests. Rather than feeling contented with the current environment, residents in areas with more street trees preferred to have even more trees in their neighborhoods. This would ultimately constitute a positive feedback loop and polarize tree coverage in neighborhoods. Our findings indicated that in order to address the unbalanced greenspace distribution, additional greening approaches targeting areas in need of trees are needed. Another approach by URI, called the Community Greenspace Program, provided material supplies and technical support to build neighborhood greenspace on vacant lots and therefore constituted an essential supplement to the tree request program. It is also important to make sure that information about the tree request program reaches residents in places that need the program.
According to the results from the regression analysis, race, the proportion of renters, and the presence of vacant lots did not impact the interest in requesting a tree when other conditions were equal. This finding contradicted a previous study in New Haven, which found that the percentage of renter-occupied housing positively contributed to tree request density [27]. The main difference is that land cover was considered in our model, while the previous study only included socioeconomic factors as independent variables (namely population density, the percentage of White population, median household income, education, and the percentage of renter-occupied housing). The percentage of renter-occupied housing is significantly associated with grass and tree coverage (Table 1), and may act as a proxy factor when either grass or tree coverage is not included in the model. It is also worth noting that renting or owning a home was not found to be a significant factor contributing to residents’ interest in improving the neighborhood environment. While increasing property value is usually found to be a major motivation for homeowners to improve the surrounding environment [44,45], renters who requested trees were probably more concerned with the aesthetic and recreational benefits provided by trees.
Our study has several limitations. First, we considered all types of tree canopy and grass as the same when describing the current land cover composition of a block group and did not differentiate between residential greenspace, recreational parks, playgrounds, and protected areas. The benefits residents received from these types of greenspaces vary substantially. For example, some block groups contain bird sanctuary areas and therefore have relatively high proportions of tree and grass coverage, which may not directly benefit residents as much as trees and lawns near homes. Future studies should compare the impact of the immediate environment around homes and that of the environment at a larger scale, and analyze their influence on residents’ interest in improving greenspace.
Second, we considered all tree requests as future trees in this study, without taking the survival rate into account. Newly planted trees are young with a minimal canopy. It takes years for them to grow before they can provide considerable aesthetic or ecological benefits to residents. Some trees may die and be removed before then, especially during the first 3 years. For ease of discussion, we did not consider such situations in this study.
Third, bias may exist in the relationship between individual tree requests and block group-level land cover and socioeconomic characteristics. However, our study took block groups as the research unit, counted the number of residents’ tree requests within these units, and considered the total land cover and the average levels of socioeconomic characteristics within the units to eliminate such bias. Future research can focus on individual preferences, analyzing citizens’ preferences for tree requests by examining the relationships between individuals who make tree requests and their surrounding environments and socioeconomic characteristics.

5. Conclusions

This study examined how residents’ interest in improving the neighborhood environment may be influenced by their socioeconomic status, residential situation, and land cover. Our results indicated that income and current street tree density of a block group promoted interest in having more street trees. On average, a USD 1000 increase in median household income would bring 5.9 additional tree requests for a block group. One additional street tree per kilometer would increase tree requests by 2.5, and a 1% increase in grass coverage would increase tree request by 9.8. Such connections between income and current land cover signal a warning. That is, simply relying on people’s interest in improving the neighborhood environment may polarize existing disparities in greenspace provision.
As we also found in this study, over the past 3 years, neighborhoods with more White residents, higher income, and fewer renters tended to submit more requests for additional street trees in places that already had higher coverage of trees and grass. This finding indicates that approaches targeting certain areas are needed in order to reduce the gap between greenspace provision and access across different socioeconomic groups. The Community Greenspace Program, which supports residents in building neighborhood gardens on vacant lots, is an example of this kind.

Author Contributions

Conceptualization and methodology, Z.C. and G.H.; investigation, software, validation and visualization, Z.C.; writing—original draft preparation, Z.C.; writing—review and editing, Z.C. and G.H. All authors have read and agreed to the published version of the manuscript.

Funding

This research was funded by the 2019 Special Funding for Students’ International Education, Office of International Exchange and Cooperation of Beijing Normal University; and was funded by the High-level Talent Program of Xiamen University of Technology (No. YKJ25048R).

Data Availability Statement

The data that support this study are available from the Urban Resources Initiative (URI). Restrictions apply to the availability of these data, which were used under license for this study. Data are available upon the permission of URI.

Acknowledgments

We thank Colleen Murphy-Dunning from Urban Resources Initiative at Yale University for her hospitality and support with the tree request dataset. We also thank Morgan Grove for his inspiration, and Dexter H. Locke for helpful discussion.

Conflicts of Interest

The authors declare no conflicts of interest.

References

  1. United Nations, Department of Economic and Social Affairs, Population Division. World Urbanization Prospects: The 2014 Revision, Highlights, 1st ed.; United Nations: New York, NY, USA, 2014; p. 1. [Google Scholar]
  2. UN-Habitat. Cities and Climate Change: Global Report on Human Settlements 2011, United Nations Human Settlements Programme, 1st ed.; Earthscan: London, UK, 2011; pp. 54–55. [Google Scholar]
  3. Guo, G.; Wu, Z.; Chen, Y. Complex mechanisms linking land surface temperature to greenspace spatial patterns: Evidence from four southeastern Chinese cities. Sci. Total Environ. 2019, 674, 77–87. [Google Scholar] [CrossRef] [Scilit] [PubMed]
  4. Wu, Z.; Zhang, S.; Liu, M.; Wu, Z.; Hu, X.; Lin, S. Impact of Forest Landscape Patterns on Ecological Quality in Coastal Cities of Fujian, China, from 2000 to 2020. Forests 2024, 15, 1925. [Google Scholar] [CrossRef] [Scilit]
  5. Zhang, W.; Villarini, G.; Vecchi, G.A.; Smith, J.A. Urbanization exacerbated the rainfall and flooding caused by hurricane Harvey in Houston. Nature 2018, 563, 384–388. [Google Scholar] [CrossRef] [Scilit] [PubMed]
  6. Zhong, C.; Chen, C.; Liu, Y.; Gao, P.; Li, H. A specific study on the impacts of PM2.5 on urban heat islands with detailed in situ data and satellite images. Sustainability 2019, 11, 7075. [Google Scholar] [CrossRef] [Scilit]
  7. Hong, H.L.; Chang, Q.; Cheng, K.J.; Xie, X.H. Health benefit contributions and differences of urban green spaces in the neighborhood, a case study of Beijing, China. J. Environ. Manag. 2025, 392, 126538. [Google Scholar] [CrossRef] [Scilit]
  8. Jayasooriya, V.M.; Ng, A.W.M.; Muthukumaran, S.; Perera, B.J.C. Green infrastructure practices for improvement of urban air quality. Urban For. Urban Green. 2017, 21, 34–47. [Google Scholar] [CrossRef] [Scilit]
  9. Nowak, D.J.; Crane, D.E.; Stevens, J.C. Air pollution removal by urban trees and shrubs in the United States. Urban For. Urban Green. 2006, 4, 115–123. [Google Scholar] [CrossRef] [Scilit]
  10. Shackleton, S.; Chinyimba, A.; Hebinck, P.; Shackleton, C.; Kaoma, H. Multiple benefits and values of trees in urban landscapes in two towns in northern South Africa. Landsc. Urban Plan. 2015, 136, 76–86. [Google Scholar] [CrossRef] [Scilit]
  11. Liu, M.; Li, J.; Song, D.; Dong, J.; Ren, D.; Wei, X. Spatiotemporal Dynamics Effects of Green Space and Socioeconomic Factors on Urban Agglomeration in Central Yunnan. Forests 2024, 15, 1598. [Google Scholar] [CrossRef] [Scilit]
  12. Zwierzchowska, I.; Hof, A.; Iojă, I.C.; Mueller, C.; Poniży, L.; Breuste, J.; Mizgajski, A. Multi-scale assessment of cultural ecosystem services of parks in Central European cities. Urban For. Urban Green. 2018, 30, 84–97. [Google Scholar] [CrossRef] [Scilit]
  13. Uchiyama, Y.; Kohsaka, R. Examining who benefited from green infrastructure during the coronavirus pandemic in 2020: Considering the issues of access to green areas from socioeconomic and environmental perspectives. J. Environ. Manag. 2022, 322, 116044. [Google Scholar] [CrossRef] [Scilit]
  14. Boone, C.G.; Buckley, G.L.; Grove, J.M.; Sister, C. Parks and people: An environmental justice inquiry in Baltimore, Maryland. Ann. Assoc. Am. Geogr. 2009, 99, 767–787. [Google Scholar] [CrossRef] [Scilit]
  15. Dai, D. Racial/ethnic and socioeconomic disparities in urban greenspace accessibility: Where to intervene? Landsc. Urban Plan. 2011, 102, 234–244. [Google Scholar] [CrossRef] [Scilit]
  16. Macedo, J.; Haddad, M.A. Equitable distribution of open space: Using spatial analysis to evaluate urban parks in Curitiba, Brazil. Environ. Plan. B Plan. Des. 2016, 43, 1096–1117. [Google Scholar] [CrossRef] [Scilit]
  17. Nesbitt, L.; Meitner, M. Exploring Relationships between Socioeconomic Background and Urban Greenery in Portland, OR. Forests 2016, 7, 162. [Google Scholar] [CrossRef] [Scilit]
  18. Kim, J.; Park, D.-B.; Seo, J.I. Exploring the Relationship between Forest Structure and Health. Forests 2020, 11, 1264. [Google Scholar] [CrossRef] [Scilit]
  19. Wüstemann, H.; Kalisch, D.; Kolbe, J. Access to urban greenspace and environmental inequalities in Germany. Landsc. Urban Plan. 2017, 164, 124–131. [Google Scholar] [CrossRef] [Scilit]
  20. Anderson, E.C.; Locke, D.H.; Pickett, S.T.A.; LaDeau, S.L. Just street trees? Street trees increase local biodiversity and biomass in higher income, denser neighborhoods. Ecosphere 2023, 14, e4389. [Google Scholar] [CrossRef] [Scilit]
  21. Esperon-Rodriguez, M.; Sharmin, M.; Rodriguez, D.E.; Messier, C.; Svenning, J.C.; Moore, S.; Tjoelker, M.G. Socio-economic factors, climate, and people’s behaviours determine urban tree health. Urban For. Urban Green. 2025, 107, 128801. [Google Scholar] [CrossRef] [Scilit]
  22. Fang, F.; Greenlee, A.J.; He, Y.Q.; Eutsler, E. Evaluating the quality of street trees in Washington, DC: Implications for environmental justice. Urban For. Urban Green. 2023, 85, 127947. [Google Scholar] [CrossRef] [Scilit]
  23. Gerow, A.; Kathambi, V.; Locke, D.; Ashton, M.; Brodersen, C. Street tree communities reflect socioeconomic inequalities and legacy effects of colonial planning in Nairobi, Kenya. Urban For. Urban Green. 2024, 101, 128530. [Google Scholar] [CrossRef] [Scilit]
  24. Zhang, K.; Shang, W.-L.; De Vos, J.; Zhang, Y.; Cao, M. Illuminating the Path to More Equitable Access to Urban Parks. Sci. Rep. 2025, 15, 9646. [Google Scholar] [CrossRef] [Scilit] [PubMed]
  25. El Kenawy, A.M.; Abdelaal, M.M.; Aboelkhair, H.; Mohamed, E.K. Urban Comfort Dynamics in Major Megacities in the Middle East: A Spatiotemporal Assessment and Linkage to Weather Types. Urban Clim. 2025, 59, 102309. [Google Scholar] [CrossRef] [Scilit]
  26. Nasrabadi, M.T.; Morassafar, S.; Pourzakarya, M.; Dunning, R. Investigating the Impacts of Green Spaces Planning on Social Sustainability Improvement in Tehran, Iran: A SWOT-AHP Analysis. Local Environ. 2023, 28, 681–697. [Google Scholar] [CrossRef] [Scilit]
  27. Locke, D.H.; Baine, G. The good, the bad, and the interested: How historical demographics explain present-day tree canopy, vacant lot and tree request spatial variability in New Haven, CT. Urban Ecosyst. 2014, 18, 391–409. [Google Scholar] [CrossRef] [Scilit]
  28. United States Census Bureau: 2013–2017 American Community Survey (ACS) 5-Year Estimates in New Haven. Available online: https://data.census.gov/table (accessed on 7 September 2019).
  29. Urban Resources Initiative: GreenSkills. Available online: https://uri.yale.edu/programs/greenskills (accessed on 15 September 2019).
  30. Ferguson, M.; Roberts, H.E.; McEachan, R.R.C.; Dallimer, M. Contrasting distributions of urban green infrastructure across social and ethno-racial groups. Landsc. Urban Plan. 2018, 175, 136–148. [Google Scholar] [CrossRef] [Scilit]
  31. Jimenez, M.P.; Oken, E.; Gold, D.R.; Luttmann-Gibson, H.; Requia, W.J.; Rifas-Shiman, S.L.; Gingras, V.; Hivert, M.F.; Rimm, E.B.; James, P. Early life exposure to greenspace and insulin resistance: An assessment from infancy to early adolescence. Environ. Int. 2020, 142, 105849. [Google Scholar] [CrossRef] [Scilit]
  32. Wolch, J.; Wilson, J.P.; Fehrenbach, J. Parks and park funding in Los Angeles: An equity-mapping analysis. Urban Geogr. 2013, 26, 4–35. [Google Scholar] [CrossRef] [Scilit]
  33. Marquet, O.; Aaron Hipp, J.; Alberico, C.; Huang, J.H.; Fry, D.; Mazak, E.; Lovasi, G.S.; Floyd, M.F. Park use preferences and physical activity among ethnic minority children in low-income neighborhoods in New York City. Urban For. Urban Green. 2019, 38, 346–353. [Google Scholar] [CrossRef] [Scilit]
  34. Schindler, M.; Le Texier, M.; Caruso, G. Spatial sorting, attitudes and the use of greenspace in Brussels. Urban For. Urban Green. 2018, 31, 169–184. [Google Scholar] [CrossRef] [Scilit]
  35. Yale University ArcGIS: New Haven’s Natural Assets and Activities Field Map. Available online: https://yalemaps.maps.arcgis.com/ (accessed on 7 September 2019).
  36. Marselle, M.R.; Bowler, D.E.; Watzema, J.; Eichenberg, D.; Kirsten, T.; Bonn, A. Urban street tree biodiversity and antidepressant prescriptions. Sci. Rep. 2020, 10, 22445. [Google Scholar] [CrossRef] [Scilit]
  37. Li, W.C.; Li, C.S. Racial inequalities in urban tree canopy exposure across major cities in the United States. Urban For. Urban Green. 2025, 112, 128974. [Google Scholar] [CrossRef] [Scilit]
  38. Zhong, Z.; Ma, Q.; Fang, X.N.; Kong, L.Q.; Cao, Q.; Liu, L.M.; Zhou, R.; Du, S.Q. Who are marginalized? Unequal distribution of urban street shading in Shanghai. Build Environ. 2025, 283, 113361. [Google Scholar] [CrossRef] [Scilit]
  39. Garrison, J.D. Seeing the park for the trees: New York’s “Million Trees” campaign vs. the deep roots of environmental inequality. Environ. Plan. B-Urban 2017, 46, 914–930. [Google Scholar] [CrossRef] [Scilit]
  40. Saporito, S.; Casey, D. Are there relationships among racial segregation, economic isolation, and proximity to greenspace? Hum. Ecol. Rev. 2015, 21, 113–131. [Google Scholar]
  41. Yu, S.; Zhu, X.; He, Q. An assessment of urban park access using house-level data in urban China: Through the lens of social equity. Int. J. Environ. Res. Public Health 2020, 17, 2349. [Google Scholar] [CrossRef] [Scilit] [PubMed]
  42. Tian, Y.; Wu, H.; Zhang, G.; Wang, L.; Zheng, D.; Li, S. Perceptions of ecosystem services, disservices and willingness-to-pay for urban greenspace conservation. J. Environ. Manag. 2020, 260, 110140. [Google Scholar] [CrossRef] [Scilit] [PubMed]
  43. Wilkerson, M.L.; Mitchell, M.G.E.; Shanahan, D.; Wilson, K.A.; Ives, C.D.; Lovelock, C.E.; Rhodes, J.R. The role of socio-economic factors in planning and managing urban ecosystem services. Ecosyst. Serv. 2018, 31, 102–110. [Google Scholar] [CrossRef] [Scilit]
  44. Plant, L.; Rambaldi, A.; Sipe, N. Evaluating revealed preferences for street tree cover targets: A business case for collaborative investment in leafier streetscapes in Brisbane, Australia. Ecol. Econ. 2017, 134, 238–249. [Google Scholar] [CrossRef] [Scilit]
  45. Saphores, J.D.; Li, W. Estimating the value of urban green areas: A hedonic pricing analysis of the single family housing market in Los Angeles, CA. Landsc. Urban Plan. 2012, 104, 373–387. [Google Scholar] [CrossRef] [Scilit]
Figure 1. Spatial patterns of socioeconomic status, residential situation, and land cover. (a) represents the median household income of the block groups; (b) represents the proportion of Non-Hispanic White residents for the block groups; (c) represents the vacant housing rate for the block groups; (d) represents the renter-occupied housing rate for the block groups; (e) represents the proportion of tree canopy cover within the block groups; (f) represents the proportion of grass cover within the block groups; (g) represents street tree density within the block groups; and (h) represents the number of tree requests in the block groups.
Forests 17 00193 g001
Figure 2. Distribution of tree requests and land cover in New Haven.
Forests 17 00193 g002
Table 1. Correlations between tree requests and socioeconomic status, residential situation, and land cover.
Number of Tree RequestsMedian Household Income (USD 1000)White Residents (%)Vacant Housing (%)Renter-occupied Housing (%)Tree Canopy (%)Grass (%)Street Tree Density (per km)Length of Streets (km)Total Number of Households
Number of tree requests1---------
Median household income (USD 1000)0.585 **1--------
White residents (%)0.304 **0.546 **1-------
Vacant housing (%)−0.180−0.250 *−0.278 **1------
Renter-occupied housing (%)−0.522 **−0.632 **−0.1970.202 *1-----
Tree canopy (%)0.224 *0.306 **0.116−0.272 **−0.328 **1----
Grass (%)0.274 **0.200 *0.012−0.260 *−0.402 **0.0201---
Street tree density (per km)0.0980.0820.146−0.0310.1760.038−0.1451--
Length of streets (km)0.1570.1450.0770.073−0.193−0.0820.140−0.476 **1-
Total number of households0.1470.0450.125−0.1530.088−0.024−0.109−0.244 *0.268 **1
Note: * and ** indicate significance at a 0.05 and 0.01 level, respectively.
Table 2. Results of multiple regression model.
Explanatory VariableUnstandardized CoefficientsStandard ErrorStandardized Coefficientsp-ValueVIF a
(Constant)−2.0270.301-<0.001-
Median household income
(1000 USD)
0.005 *0.0020.305 *0.0322.518
White residents (%)−0.0010.002−0.0360.7471.615
Vacant housing (%)0.0060.0050.1210.2221.247
Renter-occupied housing (%)−0.0040.002−0.2490.0602.205
Tree canopy (%)0.0000.0030.0110.9101.258
Grass (%)0.0080.0040.1990.0521.318
Street tree density (per km)0.002 *0.0010.237 *0.0131.120
Dependent variableLog10(tree request/total household)Residual c
Model bR2Adjust R2FMoran’ I z-valuep-value
-0.3340.2806.160 ***0.0190.6770.498
Note: a is the variance inflation factor; b is the number of observations in the model (n = 94); c is the spatial autocorrelation of the regression residuals; * indicates significance at the 0.05 level; *** indicates that the F-statistic of the model is significant at the 0.001 level.
Disclaimer/Publisher’s Note: The statements, opinions and data contained in all publications are solely those of the individual author(s) and contributor(s) and not of MDPI and/or the editor(s). MDPI and/or the editor(s) disclaim responsibility for any injury to people or property resulting from any ideas, methods, instructions or products referred to in the content.