Article

Impact of Forest Restoration on Reducing Soil and Water Loss in a Bare Catchment of the Purple Soil Region, Southwestern China


1
Department of Geography, Handan University, Handan 056005, China
2
Sichuan Forestry and Grassland Survey and Planning Institute, Sichuan Forestry and Grassland Ecological Environment Monitoring Center, Chengdu 610081, China
3
Forest Ecology and Conservation in the Upper Reaches of the Yangtze River Key Laboratory of Sichuan Province, College of Forestry, Sichuan Agricultural University, Chengdu 611130, China
4
Suining Soil and Water Conservation Experimental Station, Suining 629006, China
*
Author to whom correspondence should be addressed.
These authors contributed equally to this work.
Forests 2026, 17(1), 29; https://doi.org/10.3390/f17010029
Submission received: 12 October 2025 / Revised: 17 December 2025 / Accepted: 19 December 2025 / Published: 25 December 2025
(This article belongs to the Special Issue Soil and Water Conservation in Forestry)

Abstract

Soil erosion in the purple soil region presents severe challenges with complex driving mechanisms. At the same time, evaluation and prediction of runoff and sediment dynamics are lacking for natural vegetation restoration in bare areas. The Mann–Kendall and Pettitt tests were employed to identify abrupt shift points in runoff and sediment dynamics, utilizing monitoring data from the Suining Soil and Water Conservation Experimental Station over the period from 1984 to 2018. Therefore, the research periods were divided into a baseline period (1984–1992) and an evaluation period (1993–2018). Subsequently, encompassing rainfall, runoff, sediment, topography, soil properties, and vegetation parameters, a Water Erosion Prediction Project (WEPP) model was established to quantify the reduction benefits of runoff and sediment during the period of forest restoration. We found that the calibrated WEPP model demonstrated satisfactory performance based on Nash–Sutcliffe efficiency coefficients (NSE > 0.5) and determination coefficients (R2 > 0.5) for runoff and sediment simulations. The WEPP model and double-mass curve analysis method revealed that forest restoration reduced runoff and sediment by more than 80%. It is recommended to implement artificial vegetation restoration before reaching the threshold for natural vegetation restoration to achieve soil and water conservation goals.

1. Introduction

With global climate change and excessive human exploitation of natural resources, soil erosion has become one of the most significant environmental issues globally. China’s Ministry of Water Resources reveals a national soil erosion area of 2.6276 million km2, which constitutes 27.37% of the total land area in 2023. Purple soils, a distinct class of lithologic soils formed from purple sedimentary rock, are not confined to China but exhibit a broad global distribution. Characterized by relatively short pedogenetic cycles, these soils typically display purple, reddish, and brownish hues. Renowned for their inherent high fertility, purple soils constitute a valuable agricultural resource capable of sustaining diverse crop cultivation [1]. Notably, hydraulic erosion accounted for 131,600 km2 of the purple soil area [2,3,4,5,6].
Water Erosion Prediction Project (WEPP) model, a multifactorial tool for predicting water erosion [7], serves as a critical tool for simulating soil erosion. It enables scientific prediction and evaluation of soil erosion through the establishment of multi-factor databases for specific regions [8,9]. Meteorological factors, particularly rainfall, are primary catalysts of soil erosion. Precise simulation and forecasting of these factors are essential for efficient erosion management, with climate generators such as BPCDG (Breakpoint Climate Data Generator) and CLIGEN (Climate Generator) serving crucial functions. These tools generate synthetic climate data based on long-term statistical parameters, enhancing input reliability. CLIGEN grid parameterization complements efforts in many countries [10,11,12], advancing global applications of CLIGEN and supporting data-scarce regions, thereby expanding the utility of the WEPP model. Underlying surface factors, including soil properties, slope gradients, and land management practices, are essential to the dynamics of soil erosion. Ascough et al. [13] systematically analyzed the sensitivity of key parameters in the WEPP model, such as initial saturation and effective hydraulic conductivity. Furthermore, the authors employed the Monte Carlo method to evaluate the uncertainty of the model. Tekwa et al. found that the WEPP model slightly over-predicted soil loss when compared to either the empirical model or EGEM (Ephemeral Gully Erosion Model) [14]. Although the WEPP model was applied to simulate soil erosion at the slope scale, the simulation accuracy was limited [15]. The simulation of WEPP in forest land is superior to that of bare land, indicating that the simulation effectiveness of WEPP in a better ecological environment will be better [16].
In all, the WEPP model holds significant potential for wider application. Current research indicates its suitability for regions with comprehensive soil information, gentle slopes, and stable ecosystems. However, there is limited research on its applicability and effectiveness in modelling natural restoration processes that begin with bare purple soil, which limits its broader adoption. Investigating runoff and soil erosion modulus characteristics during natural restoration period, as well as developing a region-specific WEPP model are essential for enhancing soil erosion prediction in these regions.
This study utilized the WEPP model to systematically evaluate the soil and water conservation effects of vegetation restoration in a bare catchment located in the purple soil region.

2. Materials and Methods

2.1. Overview of the Study Area

Suining Soil and Water Conservation Experimental Station is located in Anju District, Suining City, Sichuan Province (30°21′51″–30°21′53″ N, 105°28′51″–105°28′53″ E), with altitude range of 288–331 m (Figure 1). The study area is characterized by a subtropical humid monsoon climate, with mild temperatures, abundant rainfall, and slightly insufficient sunshine. The average annual temperature is 18.2 °C, and the average annual rainfall is 933.3 mm. The rainfall from May to September accounts for 72.6% of the total annual rainfall. Furthermore, the average frost-free period is 296 days. The soil type in the study area is purple soil, which is derived from the weathered and developed rock layers of Jurassic Suining Formation. This type of soil has a relatively weak structure. The soil is slightly alkaline and susceptible to erosion. The dominant tree species in the study region is Cupressus funebris Endl. The shrub species are dominated by Vitex negundo L. and Coriaria nepalensis Wall. In addition, the main herb species are Eulaliopsis binata (Retz.) C. E. Hubb., Iris graminea L., Imperata cylindrica (L.) P. Beauv., and Arthraxon hispidus (Thunb.) Makino [17,18,19,20,21].
In 1984, a measuring weir was installed at the outlet of catchment. Drainage ditches were excavated along the boundary of the catchment to prevent water and sediment exchange with the surrounding area. The catchment covers an area of 569 m2, with an average slope of 27.67°. In 1984, the vegetation coverage rate was 6.5%, with scattered grasses including Heteropogon contortus (L.) P.Beauv., Saccharum arundinaceum Retz., and Coriaria nepalensis (Table 1). Since 1984, the catchment has strictly prohibited any interference activities, including planting, mowing, and litter collection. According to the field observation records, the existing trees, shrubs, and herbs in the field all grew naturally after abandonment. Therefore, the catchment area belongs to the category of natural restoration. Following natural vegetation restoration, the vegetation coverage rate had reached 59.5% by 1998 and 76.8% by 2018 (Table 1). After 2018, monitoring work was not carried out due to damage to automatic monitoring equipment. The plant species data in Table 1 comes from the Suining Soil and Water Conservation Experimental Station records, except for 2018, which is based on a field survey conducted by the authors that year. In our 2018 field survey, we recorded 42 plant species in the catchment area (Table S1).

2.2. Dataset Acquisition, Soil Sampling, and Analysis

We used Leica RTC360 3D laser scanner to conduct 3D laser scans of the entire catchment. The laser scan images were then processed using Cyclone 3DR to obtain terrain data, including slope, elevation, coordinate system [22].
Meteorological data, including air temperature, air humidity, precipitation, wind speed and direction, atmospheric pressure, and sunshine duration, are all collected from the meteorological station [23]. Meteorological station data provides half-hour rainfall and temperature data.
Surface runoff data were collected using SW40 log water gauge set up indoors and triangular weir flow measurements. The total soil erosion modulus includes both the suspended and bed loads. To calculate suspended load, water samples were repeatedly collected three times and then dried in aluminum boxes. For bed load, all sediment in the weir pond is collected, dried, and weighed after each rainfall event [24,25].
Throughout the catchment, 20 sites were selected using a grid system for soil sampling. At each site, soil samples were collected at five soil depths: 0–20 cm, 20–40 cm, 40–60 cm, 60–80 cm, and 80–100 cm (Table S2). Each soil depth was sampled three times repeatedly, and the samples were sealed in self-sealing bags and brought back to the laboratory for the determination of soil physical and chemical properties. Soil pH was measured potentiometrically, bulk density was determined by the cutting ring method, and soil organic matter was quantified by K2Cr2O7 oxidation. Particle-size distribution and cation exchange capacity (CEC) were analyzed according to national standard LY/T 1225-1999 [26,27].

2.3. Methods

2.3.1. Mann–Kendall

The Mann–Kendall method offers the advantage of being non-parametric, meaning it does not require the data to conform to a specific distribution and is robust against outliers. This makes it particularly suitable for analyzing categorical and ordinal variables [28]. Owing to its computational simplicity, the method has been widely adopted in trend analysis and significance testing of hydro-meteorological time series, such as precipitation, temperature, and hydrological data [29,30].
The procedure for the trend analysis is described as follows:
Consider a hydro-meteorological time series X = (x1, x2, …, xn) of length n. The test statistic S is defined as:
S = i = 1 n 1 j = i + 1 n s g n ( x j x i )
The definition of the sgn() function is as follows:
i f ( x j x i ) 0 s g n ( x j x i ) = 1 i f ( x j x i ) < 0 s g n ( x j x i ) = 1
When the sample size n ≥ 8, the statistic S approximately follows a normal distribution [31]. Its variance is calculated as:
V a r ( S ) = n ( n 1 ) ( 2 n + 5 ) 18
The standardized test statistic Z is then computed as follows:
Z = ( S 1 ) / V a r ( S ) S > 0 0 S = 0 ( S + 1 ) / V a r ( S ) S < 0
A two-sided significance test is performed at significance level α. The null hypothesis of no trend is rejected if Z = Z ( 1 α / 2 ) , indicating a statistically significant trend in the time series. The sign of the Z statistic denotes the direction of the trend. A positive Z suggests an increasing trend, while a negative Z suggests a decreasing trend. Specifically, if the absolute value of Z exceeds 1.65, 1.96, or 2.58, the trend is significant at the 90% (α = 0.1), 95% (α = 0.05), or 99% (α = 0.01) confidence level, respectively [32,33].
For the purpose of change-point detection, the Mann–Kendall test is implemented sequentially as follows:
For a time series x of length n, a rank-based sequential series Sk is constructed:
S k = i = 1 k r i ( k = 2 , 3 , , n )
where
r i = j = 1 i s g n ( x i x j )
Under the null hypothesis that the time series is random and independent, the statistic Sk is normalized to define the forward sequence UFk:
U F k = S k E ( S k ) V a r ( S k )
Here, E(Sk) and Var(Sk) are the expected value and variance of Sk, respectively, with UF1 = 0. These moments are given by:
E ( S k ) = k ( k 1 ) 4
V a r ( S k ) = k ( k 1 ) ( 2 k + 5 ) 72
A corresponding backward sequence UBk is obtained by applying the same procedure to the reversed time series, with UBk = −UFk, and UB1 = 0.
This method was applied to analyze the trends and significance of changes in runoff and sediment transport within the catchment, thereby enhancing the robustness of the findings.

2.3.2. Pettitt’s Test

Pettitt’s test is a non-parametric method widely used to identify the occurrence of a single, abrupt change-point in a hydro-meteorological time series [34]. Its advantage lies in being distribution-free and robust against outliers. The test statistic, which is based on the Mann–Whitney two-sample test, is constructed as follows. For a time series of length n, the statistic Ut,n is defined for each time t (1 < t < n):
U t , n = i = 1 t j = t + 1 n s g n ( x i x j )
where the sgn() function is identical to that used in the Mann–Kendall test. The most probable change-point Kn is located at the time t where the absolute value of Ut,n reaches its maximum:
K n = max 1 < t < n U t , n
The corresponding year is then identified as the potential mutation point. The significance of this change-point can be assessed against critical values provided by Pettitt [34].

2.3.3. Double Accumulation Curve

The dual cumulative curve method quantitatively reflects the calculation formula as follows [35,36]:
η 1 = H 2 H c H 2 H 1 × 100 %
η 2 = H c H 1 H 2 H 1 × 100 %
In the formula, η 1 and η 2 represent the contribution rates of precipitation changes and vegetation restoration changes to hydrological value changes, respectively. Hc is the hydrological value in the evaluation period calculated by the double cumulative linear correlation equation in the base period; H 1 and H 2 are actual hydrological values during the base period and valuation period, respectively.

2.3.4. WEPP Model and Sensitivity Analysis

WEPP2012.8 was used to integrate long-term observed climate data, topographic and management data collected from field surveys, and soil data. These data were parameterized and entered into the WEPP model, relevant databases were established, and the model was run to obtain predicted runoff depth and soil erosion modulus, among other data [7]. The WEPP model database was established by compiling and processing input data for climate, topography, soil, and land management.
Climate Database: Daily meteorological data from 1984 to 2018, obtained from the Suining Experimental Station, were used to drive the CLIGEN weather generator which is a modal of the WEPP. Due to the unavailability of secondary parameters (e.g., solar radiation, wind speed) at the study site, and given their limited impact on slope erosion simulation in the absence of snowmelt, default parameters from the built-in Centerville (Texas, USA) station in CLIGEN were adopted. This approach enhances simulation efficiency without significantly compromising accuracy [12]. A station database named “SCSN” was thus created. Additionally, a separate single-storm event database was established, containing total rainfall (mm), rainfall duration (h), and maximum rainfall intensity (mm/h).
Topography Database: High-resolution topographic data were acquired through a comprehensive 3D laser scan of the catchment using a Leica RTC360 scanner (Manufacturer: Leica Measurement System, Origin: Heerbrugg, Switzerland). The derived parameters of slope length and steepness were input into the model.
Soil Database: Soil parameters critical for erosion modeling were defined, including albedo, initial and effective hydraulic conductivity, interrill and rill erodibility, and critical shear stress. These parameters were estimated using the model’s internal calculation procedures based on soil properties.
Management Database: Land management scenarios were defined according to the two distinct periods identified by the breakpoint analysis. Vegetation coverage parameters of the reference period and the evaluation period were determined based on field surveys. To isolate and quantify the effect of forest restoration, a scenario analysis was performed using the validated WEPP model. The simulation involved applying the land management parameters from the reference period to the evaluation period. All other model inputs, including climate, soil, and topographic parameters, were held constant.
A sensitivity analysis was performed to identify parameters that most significantly influence runoff and soil erosion modulus simulations. Six key soil parameters were tested, including soil albedo, initial saturation, interrill erodibility, rill erodibility, critical shear stress, and effective hydraulic conductivity. The single parameter sensitivity analysis was used to set the variation range of a single parameter to ±20%, ±40%, ±60%, ±80%, and ±100%. Furthermore, the other parameters or indicators in the WEPP model are fixed at reference values. After each adjustment, the model was run to record changes in runoff depth and soil erosion modulus. The sensitivity was quantified as the ratio of the output change to the parameter change relative to the reference simulation [37].
S = 1 n i = 1 n δ P / δ a i
In the formula, S is the sensitivity of the parameter ai, n is the number of systems P after changing the i-th parameter, i is the relative error deviation from the reference state of the corresponding single parameter δP, and δa is the relative error of the i-th parameter a.
The sensitivity levels are as follows [38]:
S = 0 S 0.05 i n s e n s i t i v e 0.05 < S 0.2 l o w s e n s i t i v e 0.2 < S 1 moderately   sensitive S > 1 highly   sensitive

2.3.5. Model Evaluation

This study uses evaluation indicators such as Nash Efficiency Coefficient (NES) and Determination Coefficient (R2) to accurately assess the fitness between the simulation values produced by the WEPP model and the measured values of the experimental station. This approach ensures the accuracy and reliability of the model.
The Nash Efficiency Score (NES) is an effective method for evaluating the applicability of a model, and the specific calculation formula is as follows [39]:
N E S = 1 i n ( O i P i ) 2 i n ( O i O ¯ ) 2
In the formula, Oi is the measured value, Pi is the simulated value; and O ¯ is the average of the measured values. The range of NES is −∞ to 1. The closer NES is to 1, the higher the simulation accuracy. Generally, it is believed that when NES > 0.5, the model is suitable for application [39].
The determination coefficient (R2) is derived using linear regression analysis. It indicates how well the simulated values fit with the measured values. When the determination coefficient is close to 1, it indicates that the simulated values are very consistent with the measured values [40].

3. Results

3.1. Variation Characteristics of Runoff and Sediment in the Catchment

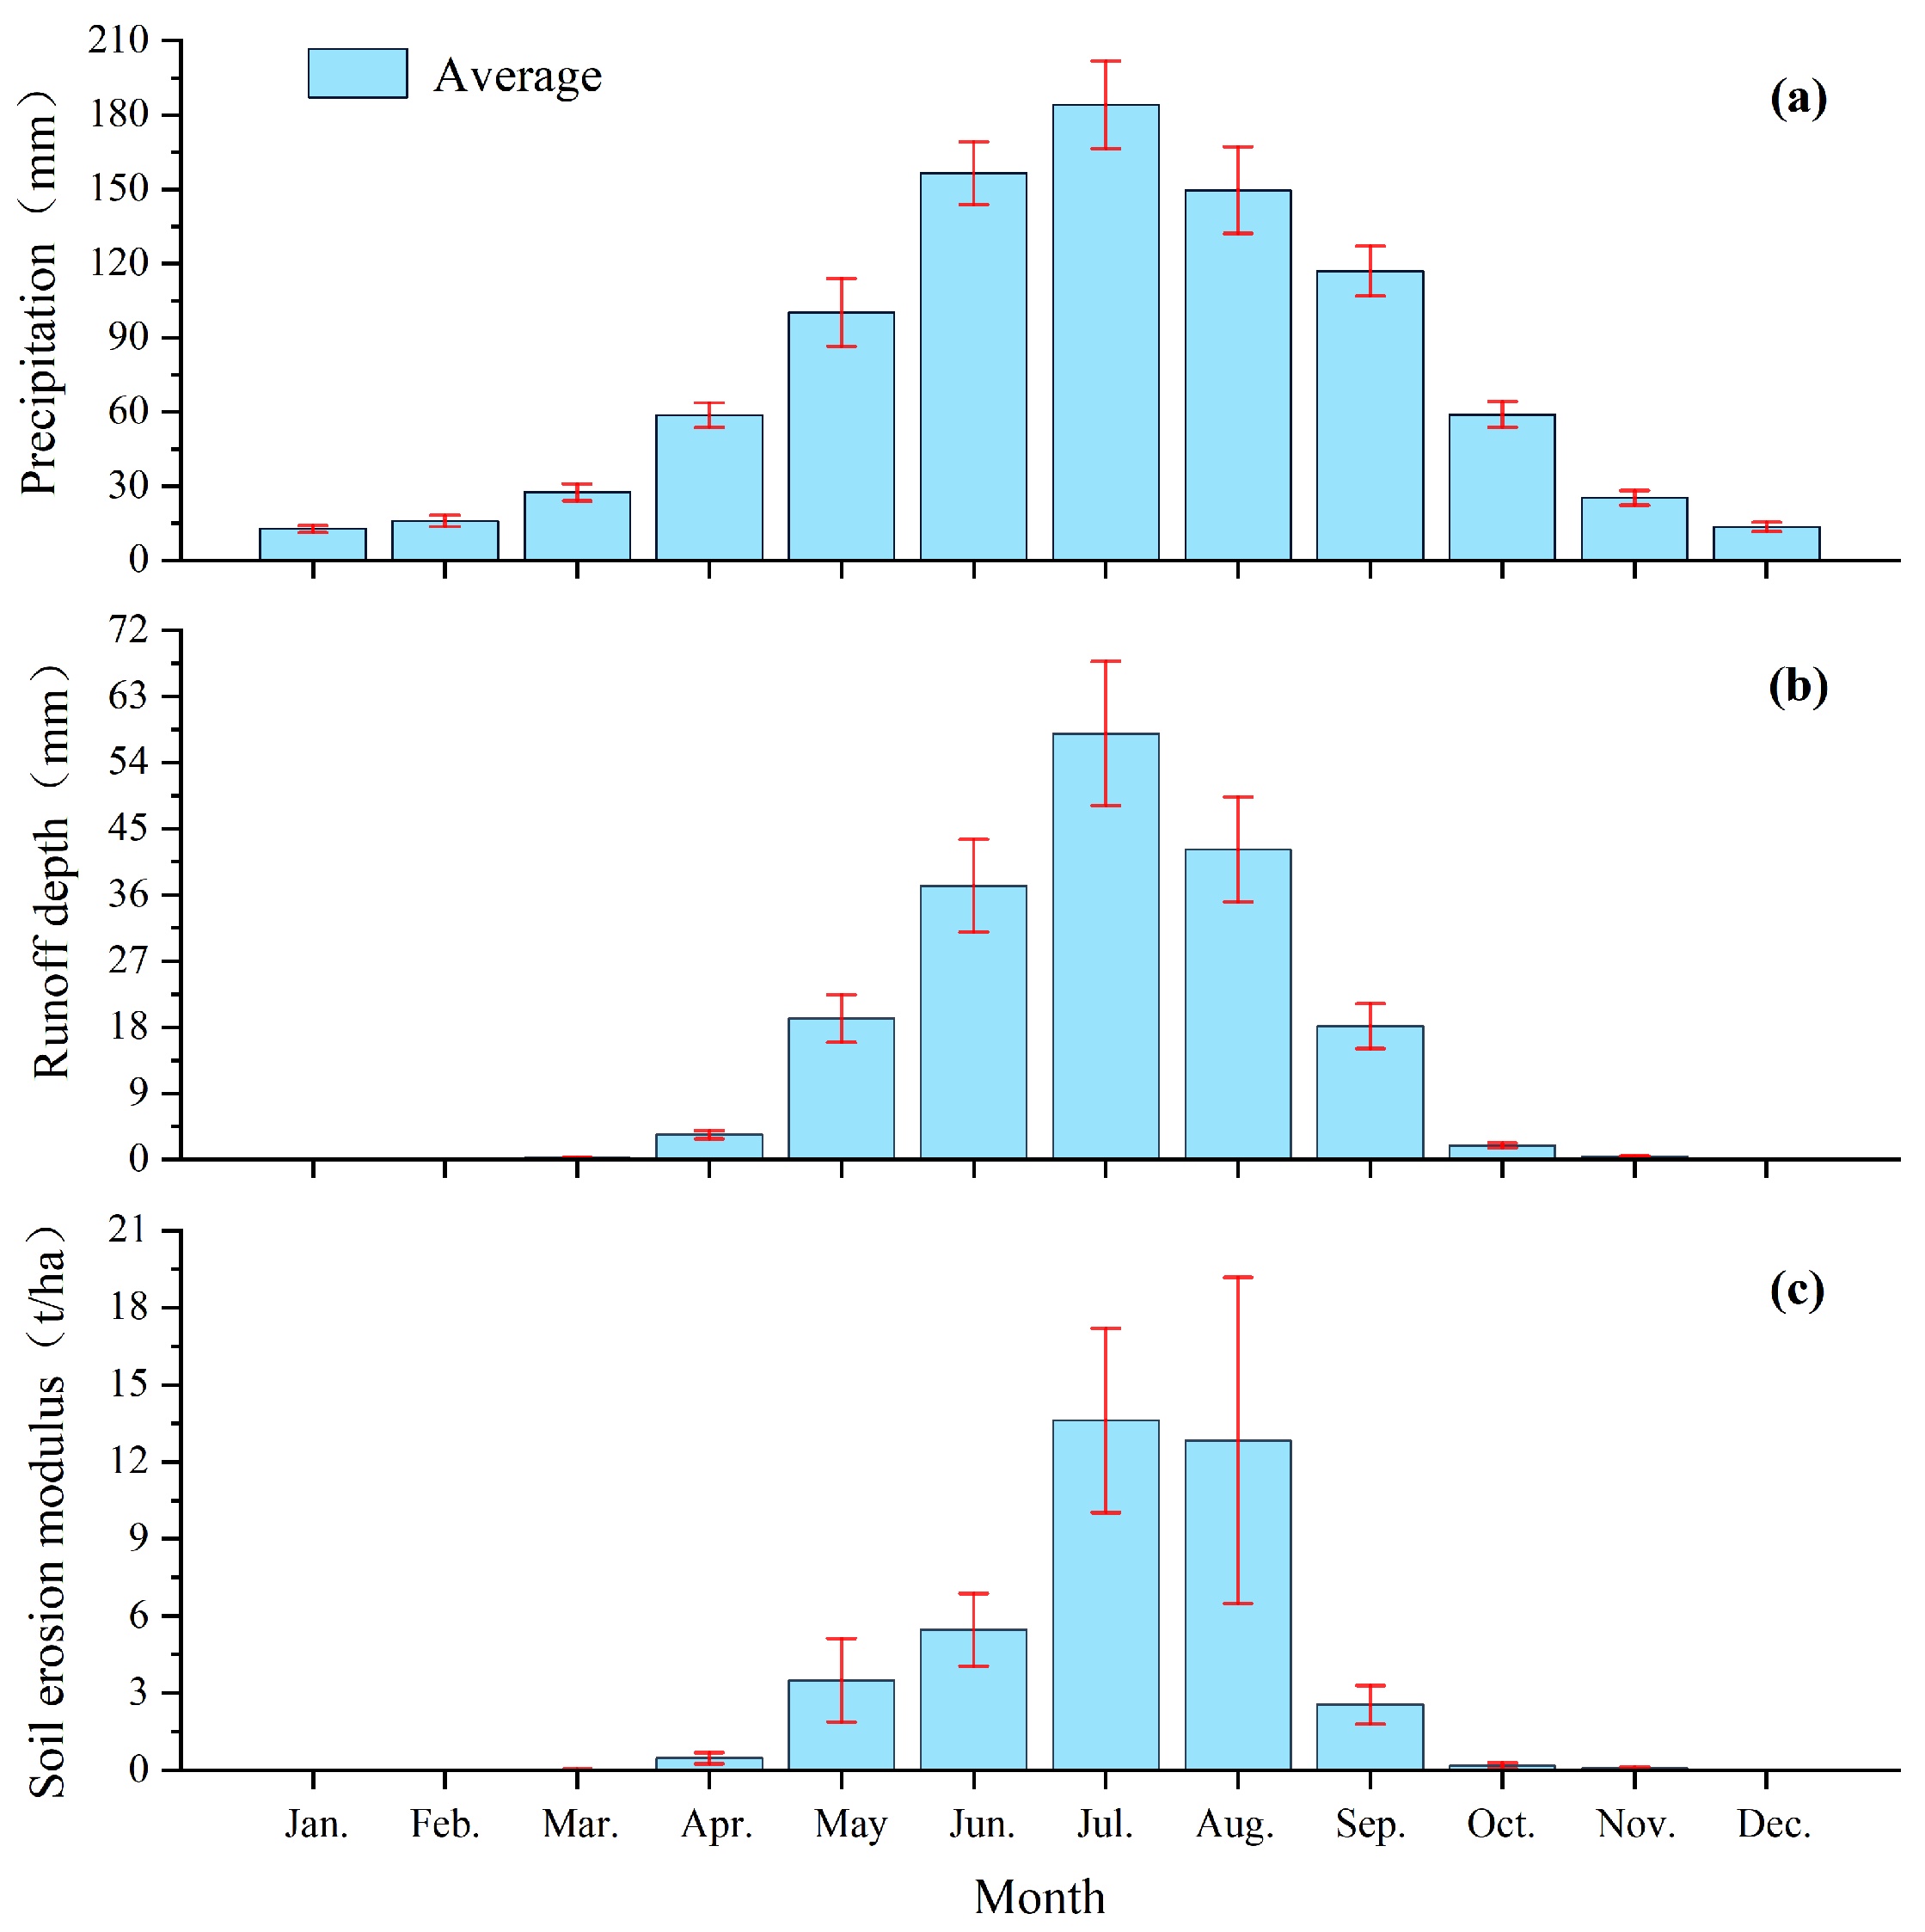
The hydrological regime is characterized by a distinct single-peak pattern aligned with the subtropical humid monsoon climate (Figure 2). Monthly precipitation distribution was highly uneven, with over 66% concentrated in June–September (Figure 2a). Precipitation was minimal in winter (December–February), accounting for 4.75% of the annual total precipitation. It increased from March, peaked in July, and then declined. The error range also showed a single-peak trend, with the largest value in July and the smallest value in January, confirming the strong monthly disparities. Driven by precipitation, runoff depth exhibited a similar pronounced seasonal irregularity. June–August runoff accounted for 78.16% of the annual total, underscoring the dominance of summer precipitation (Figure 2b). The runoff error range peaked in August, indicating the greatest variability. Soil erosion modulus displayed a consistent single-peak monthly distribution (Figure 2c). Approximately 68.25% of the soil erosion modulus occurred in July and August. The error range for soil erosion modulus was the largest in July. No soil erosion modulus was recorded in winter.

3.2. Breakpoint Detection of Runoff and Sediment

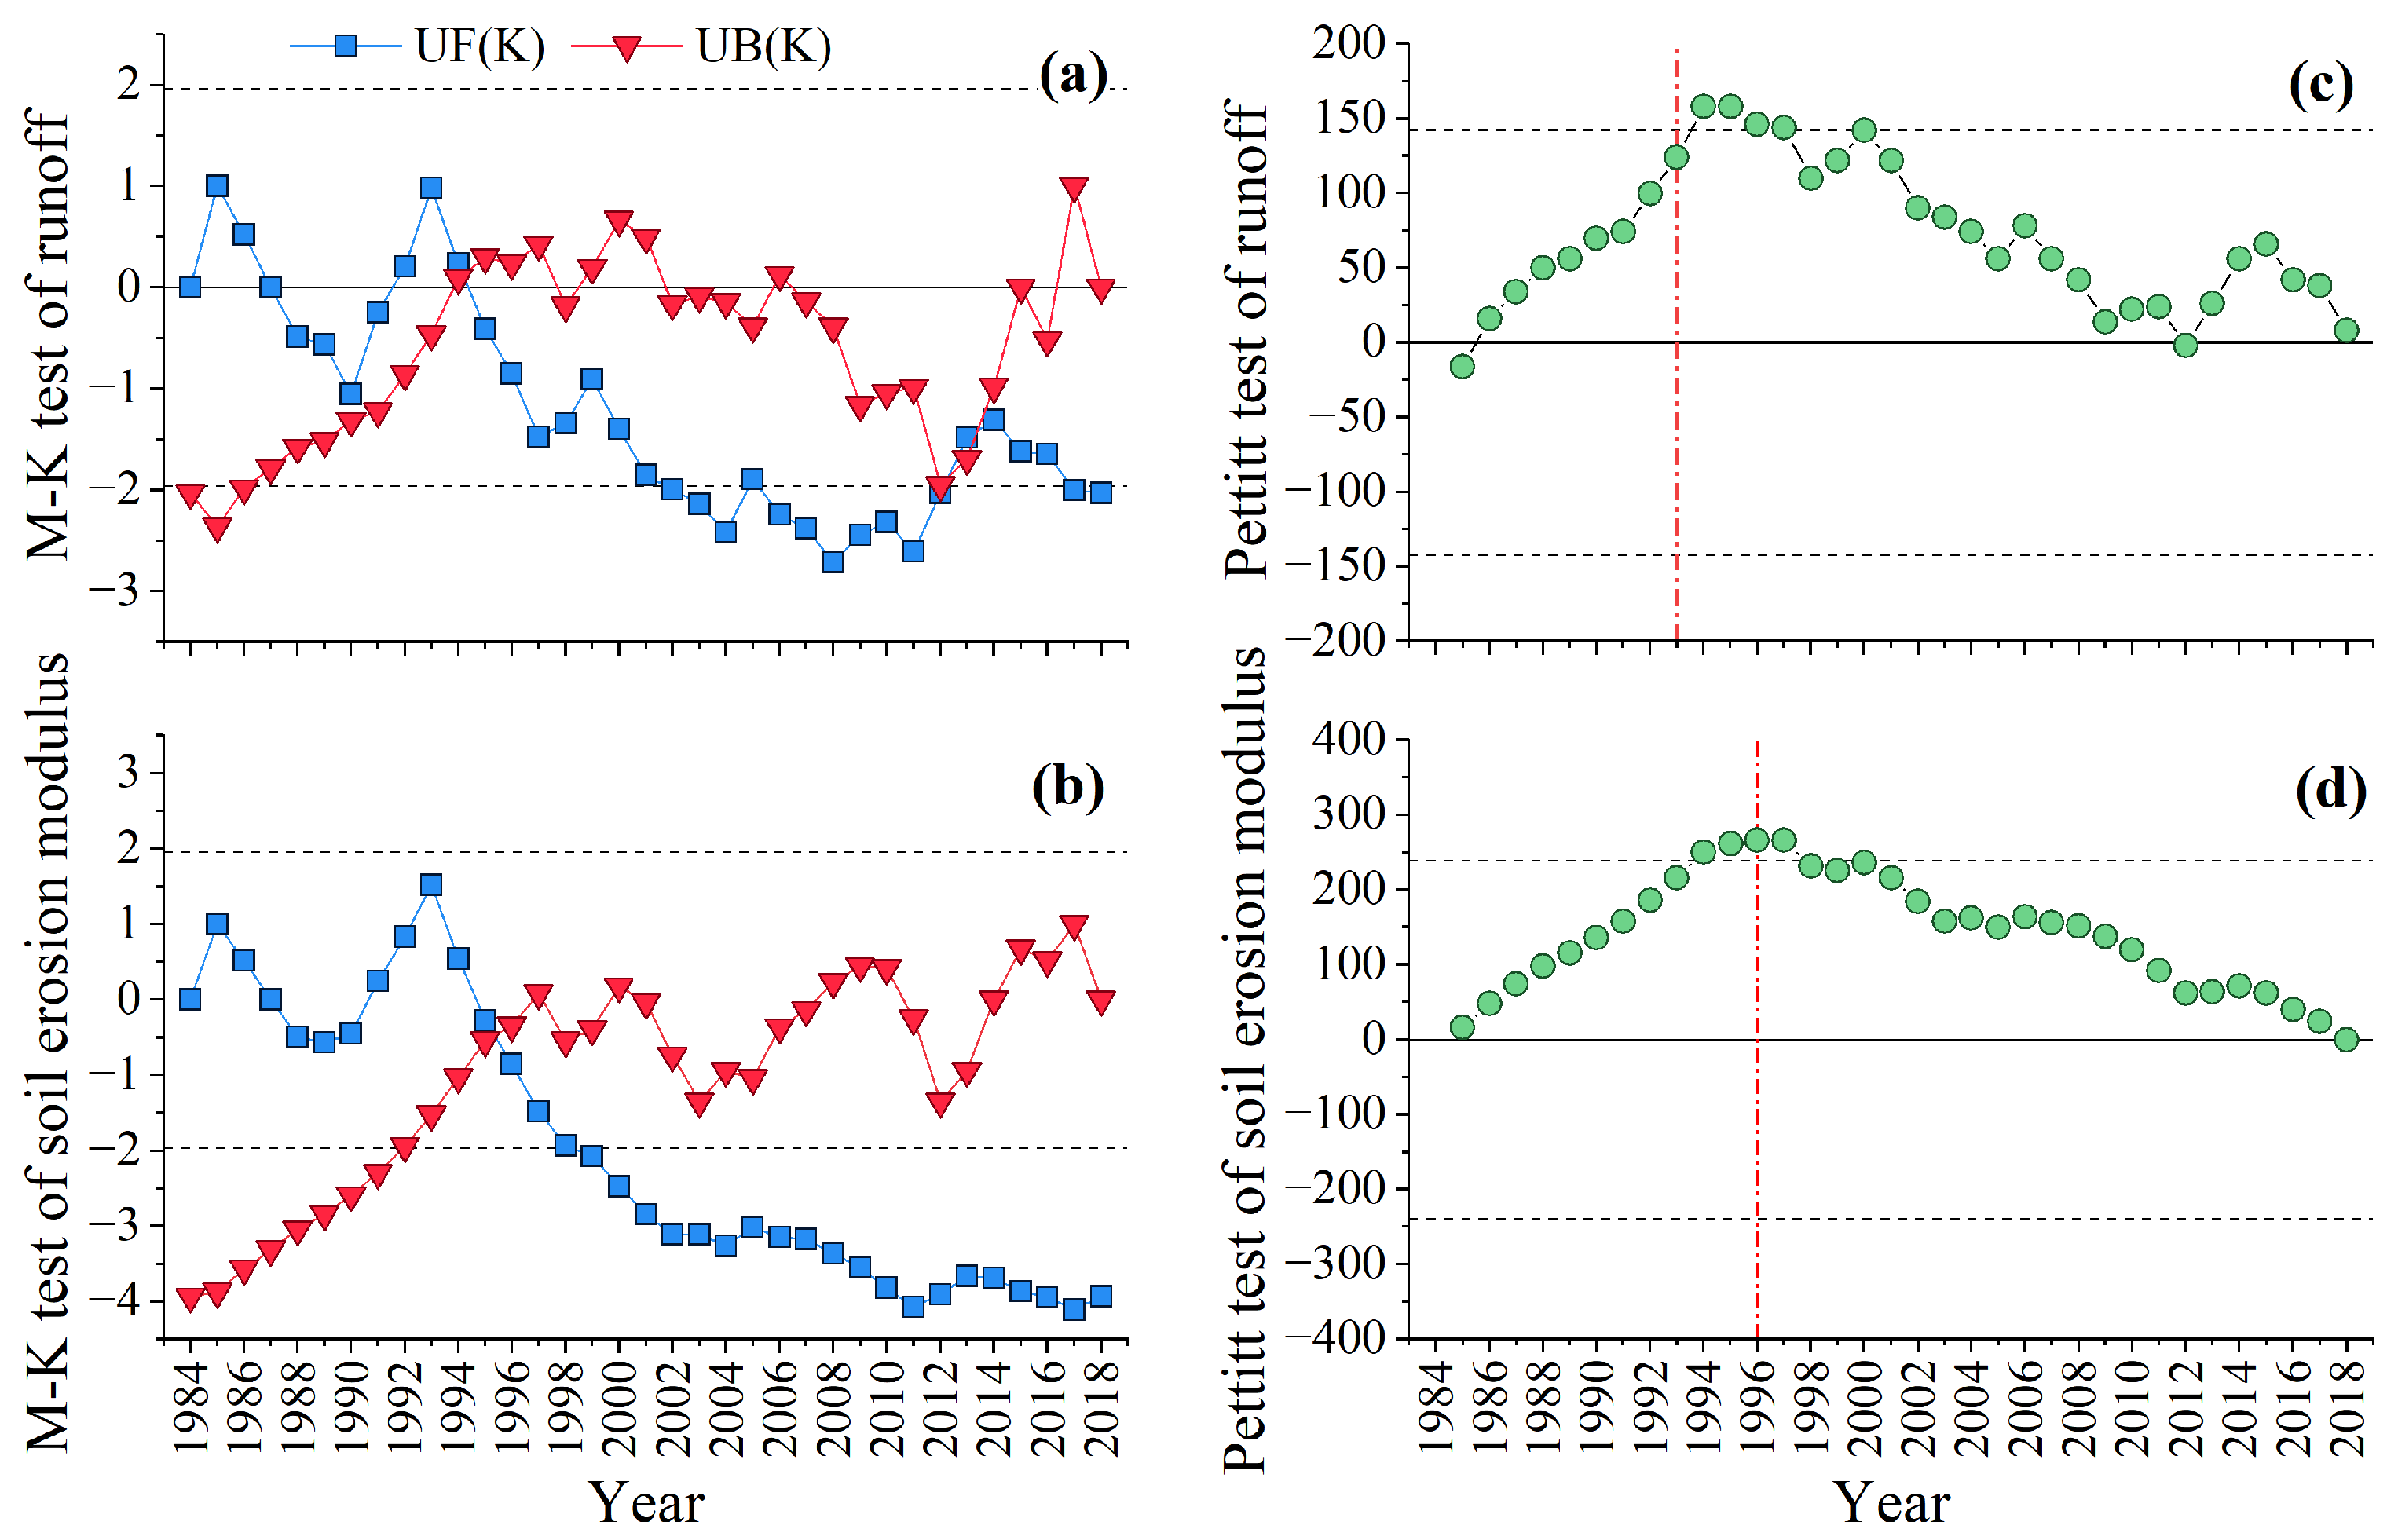
To identify a significant breakpoint in the hydrological time series, the Mann–Kendall (M-K) trend test and Pettitt’s test were applied. Both the M-K and Pettitt tests of runoff revealed a significant decreasing trend (Z = −2.02, α = 0.05) with breakpoint in 1993 (Figure 3a,c). For soil erosion modulus, the M-K and the Pettitt tests showed breakpoints in 1995 and 1996, respectively (Figure 3b,d). Above all, we identified 1993 as the representative breakpoint for the catchment’s hydrological time series. Consequently, the study period was divided into a reference period (Q1: 1984–1992) and an evaluation period (Q2: 1993–2018).
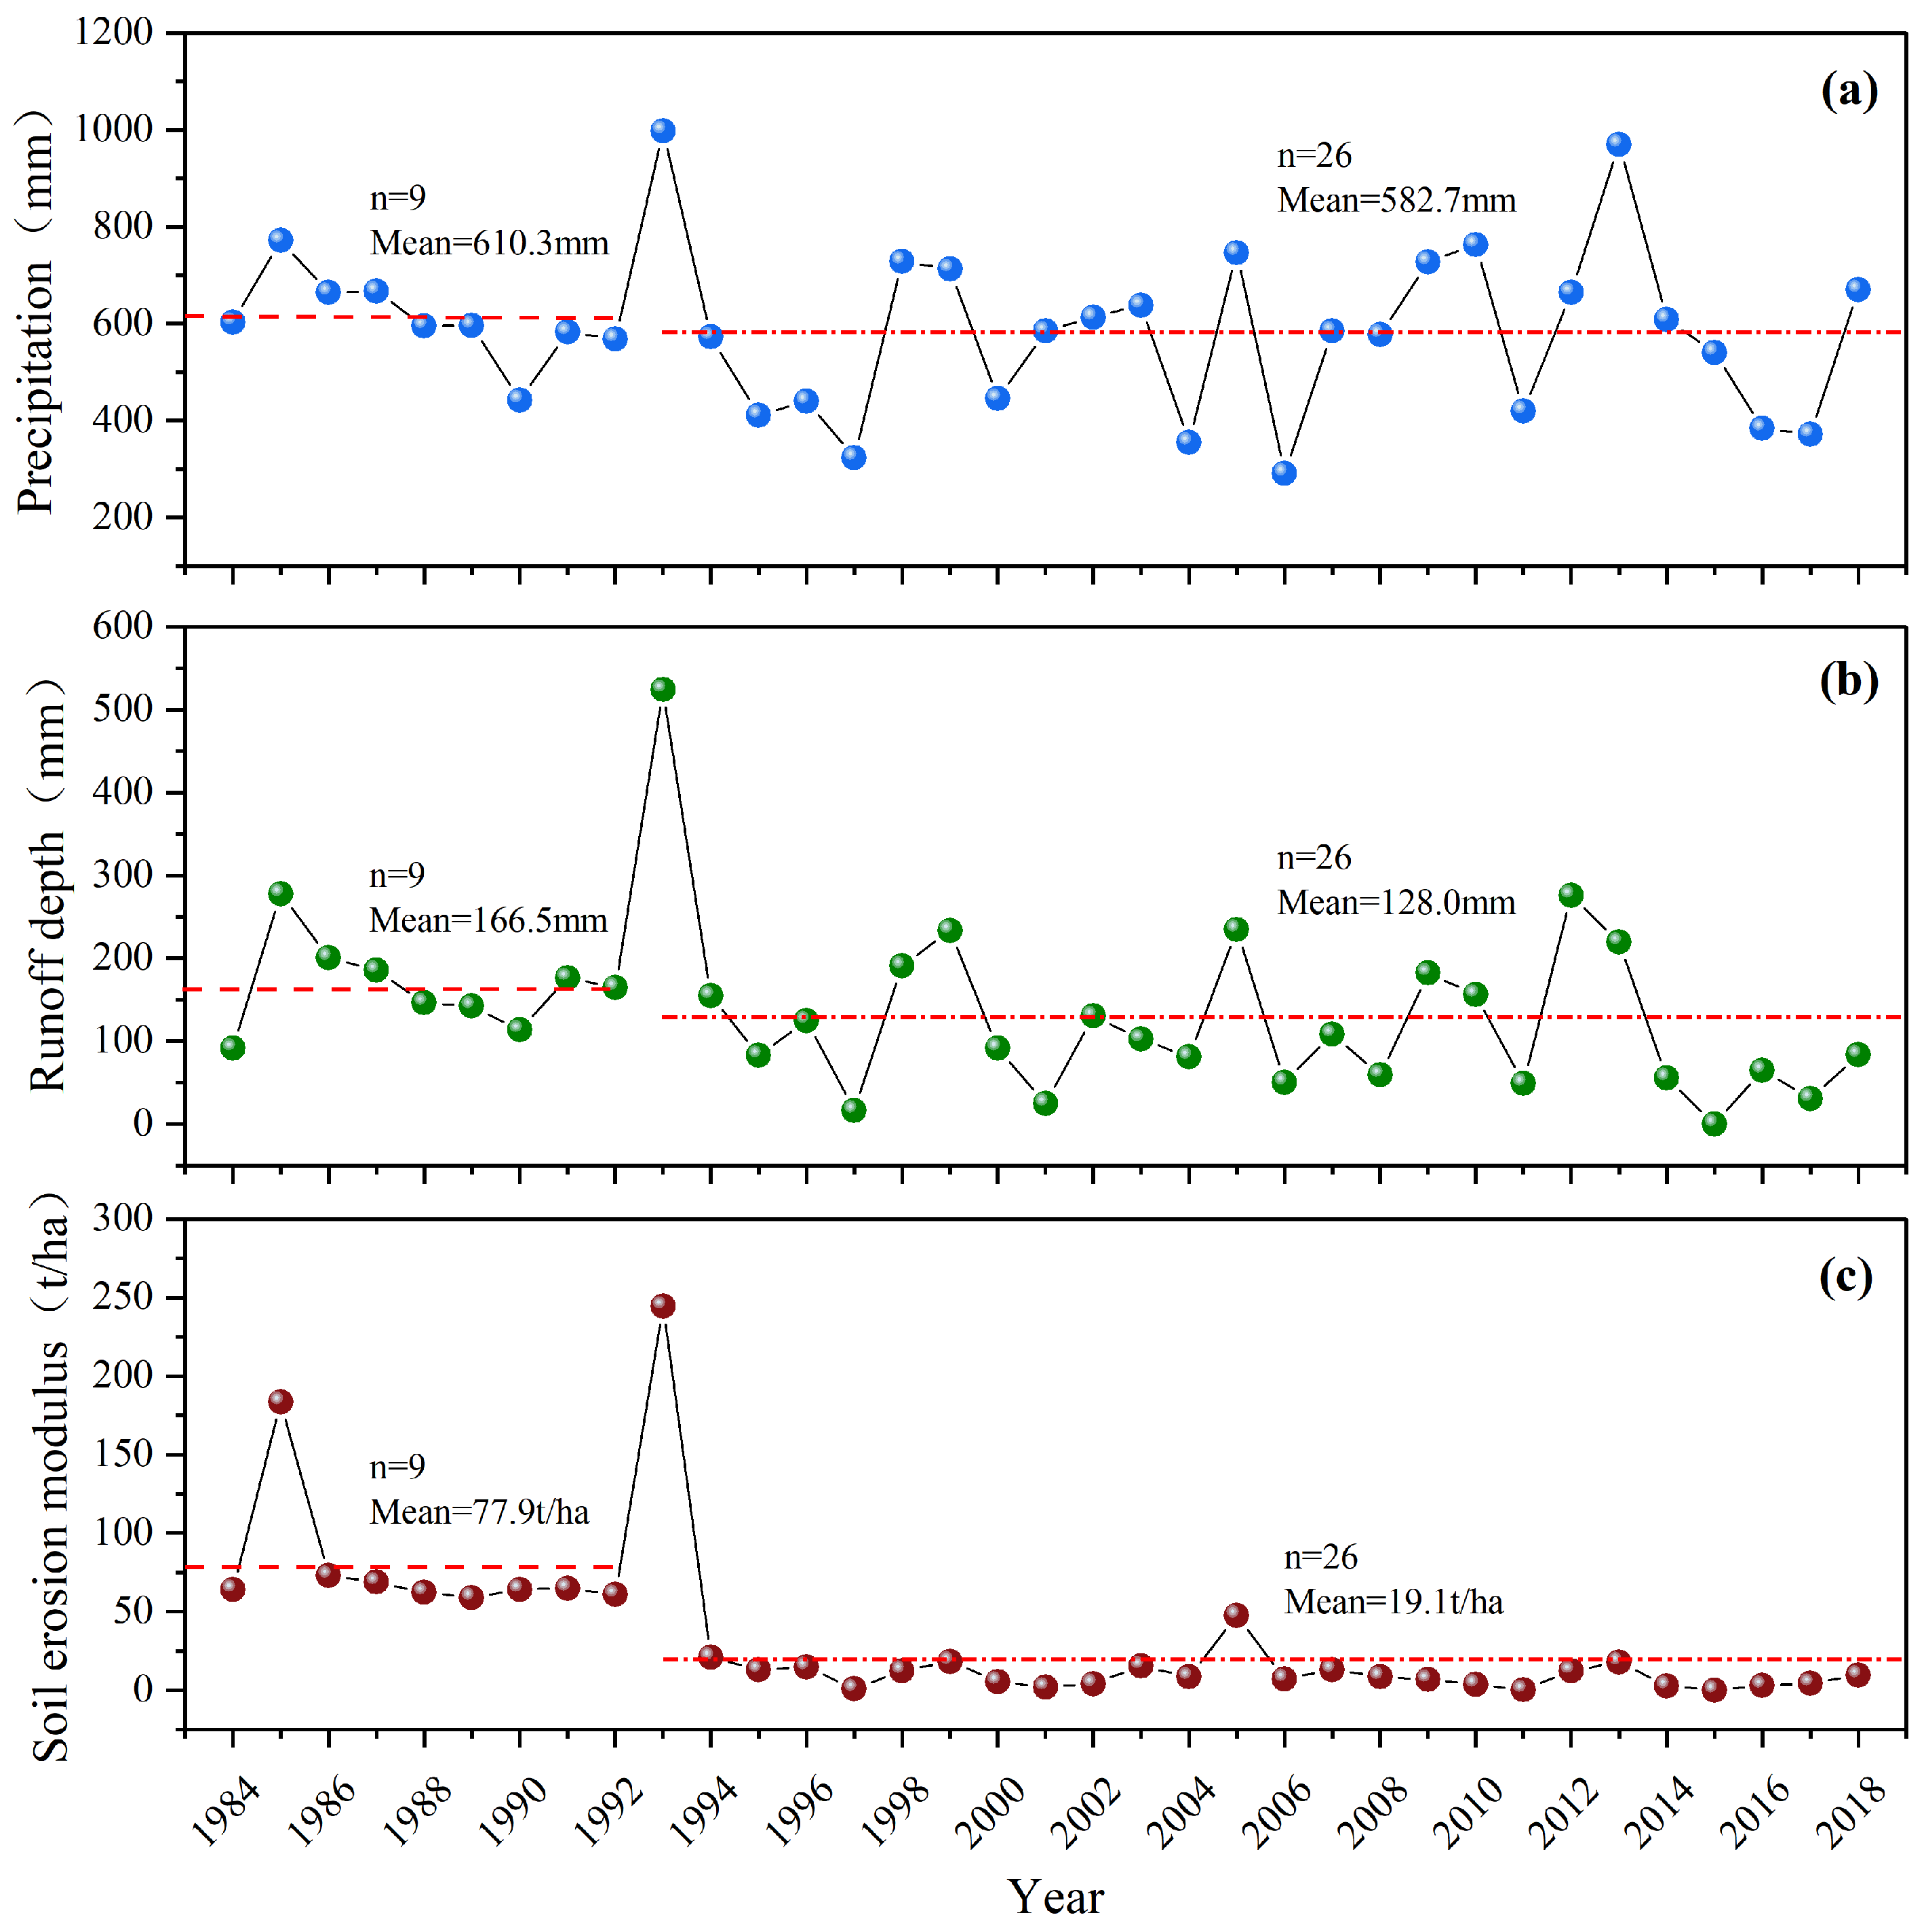
As shown in Figure 4a, annual precipitation was highest (998.1 mm) in 1993 and lowest (291.9 mm) in 2006. Mean values in reference period and evaluation period were 610.3 mm and 582.7 mm, respectively. Furthermore, the mean values of runoff depth and soil erosion modulus during the evaluation period were 128.0 mm and 19.1 t/ha, respectively, which are significantly lower than the 166.5 mm and 77.9 t/ha recorded in the reference period (Figure 4b,c).

3.3. WEPP Model Establishment

At the annual scale, effective hydraulic conductivity was the most influential parameter for runoff simulation (sensitivity = 2.38). Furthermore, the soil erosion modulus was primarily influenced by rill erodibility (sensitivity = 65.15) and critical shear stress (sensitivity = 1.75), and effective hydraulic conductivity (sensitivity = 2.35). Under single rainfall events, initial saturation emerged as the new dominant sensitive parameter for runoff and soil erosion modulus (Table 2).
Based on the sensitivity analysis, calibration was performed manually against 58 observed rainfall-runoff-erosion events recorded from June to September during 1985–1988. The optimal values of effective hydraulic conductivity, rill erodibility, and critical shear stress were 1.679 mm/h, 0.0383 s/m, and 29.500 Pa, respectively.
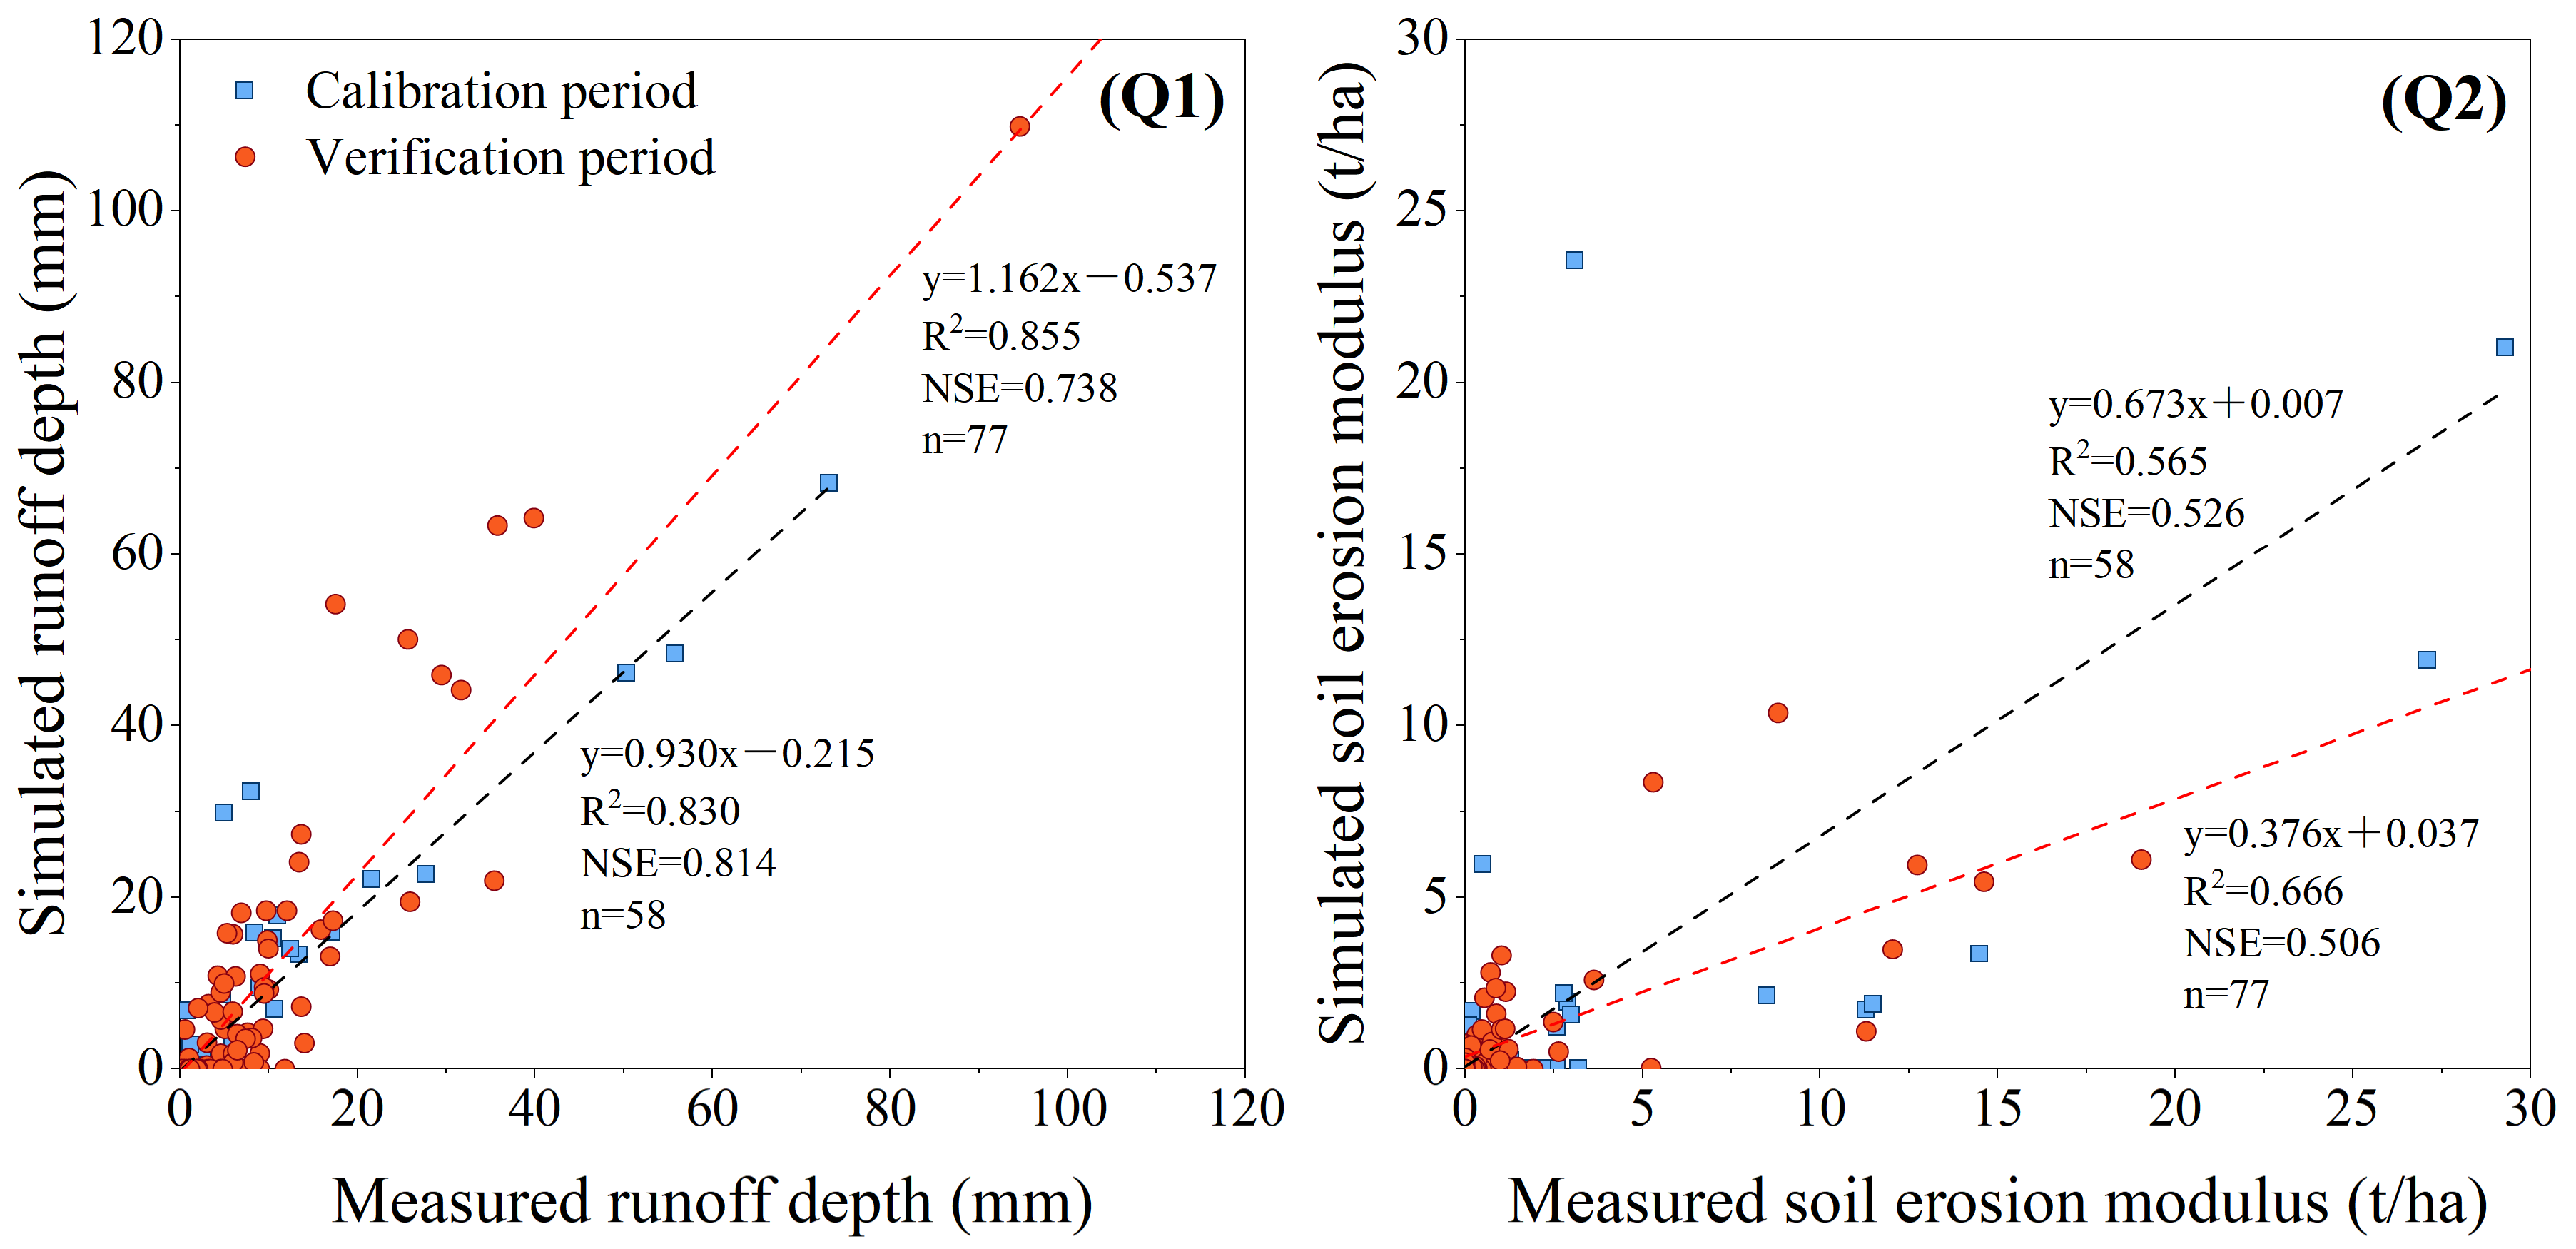
Fifty-eight rainfall-runoff-sediment events were determined as the calibration period (June–September, 1984–1992), while 77 rainfall-runoff-sediment events were determined as the validation period (June–September, 1993–2018). For runoff simulation, both the calibration period (R2 = 0.830, NSE = 0.814) and validation period (R2 = 0.855, NSE = 0.738) showed excellent performance, indicating a strong predictive capability and a high correlation between simulated values and observed values. For soil erosion modulus simulation, the model’s accuracy was slightly lower but still satisfactory. The calibration period (R2 = 0.565 and NSE = 0.526) and the validation period (R2 = 0.665 and NSE = 0.506) confirm the model’s reliability in predicting soil erosion (Figure 5).

3.4. Contribution of Forest Restoration to Changes in Runoff and Soil Erosion Modulus

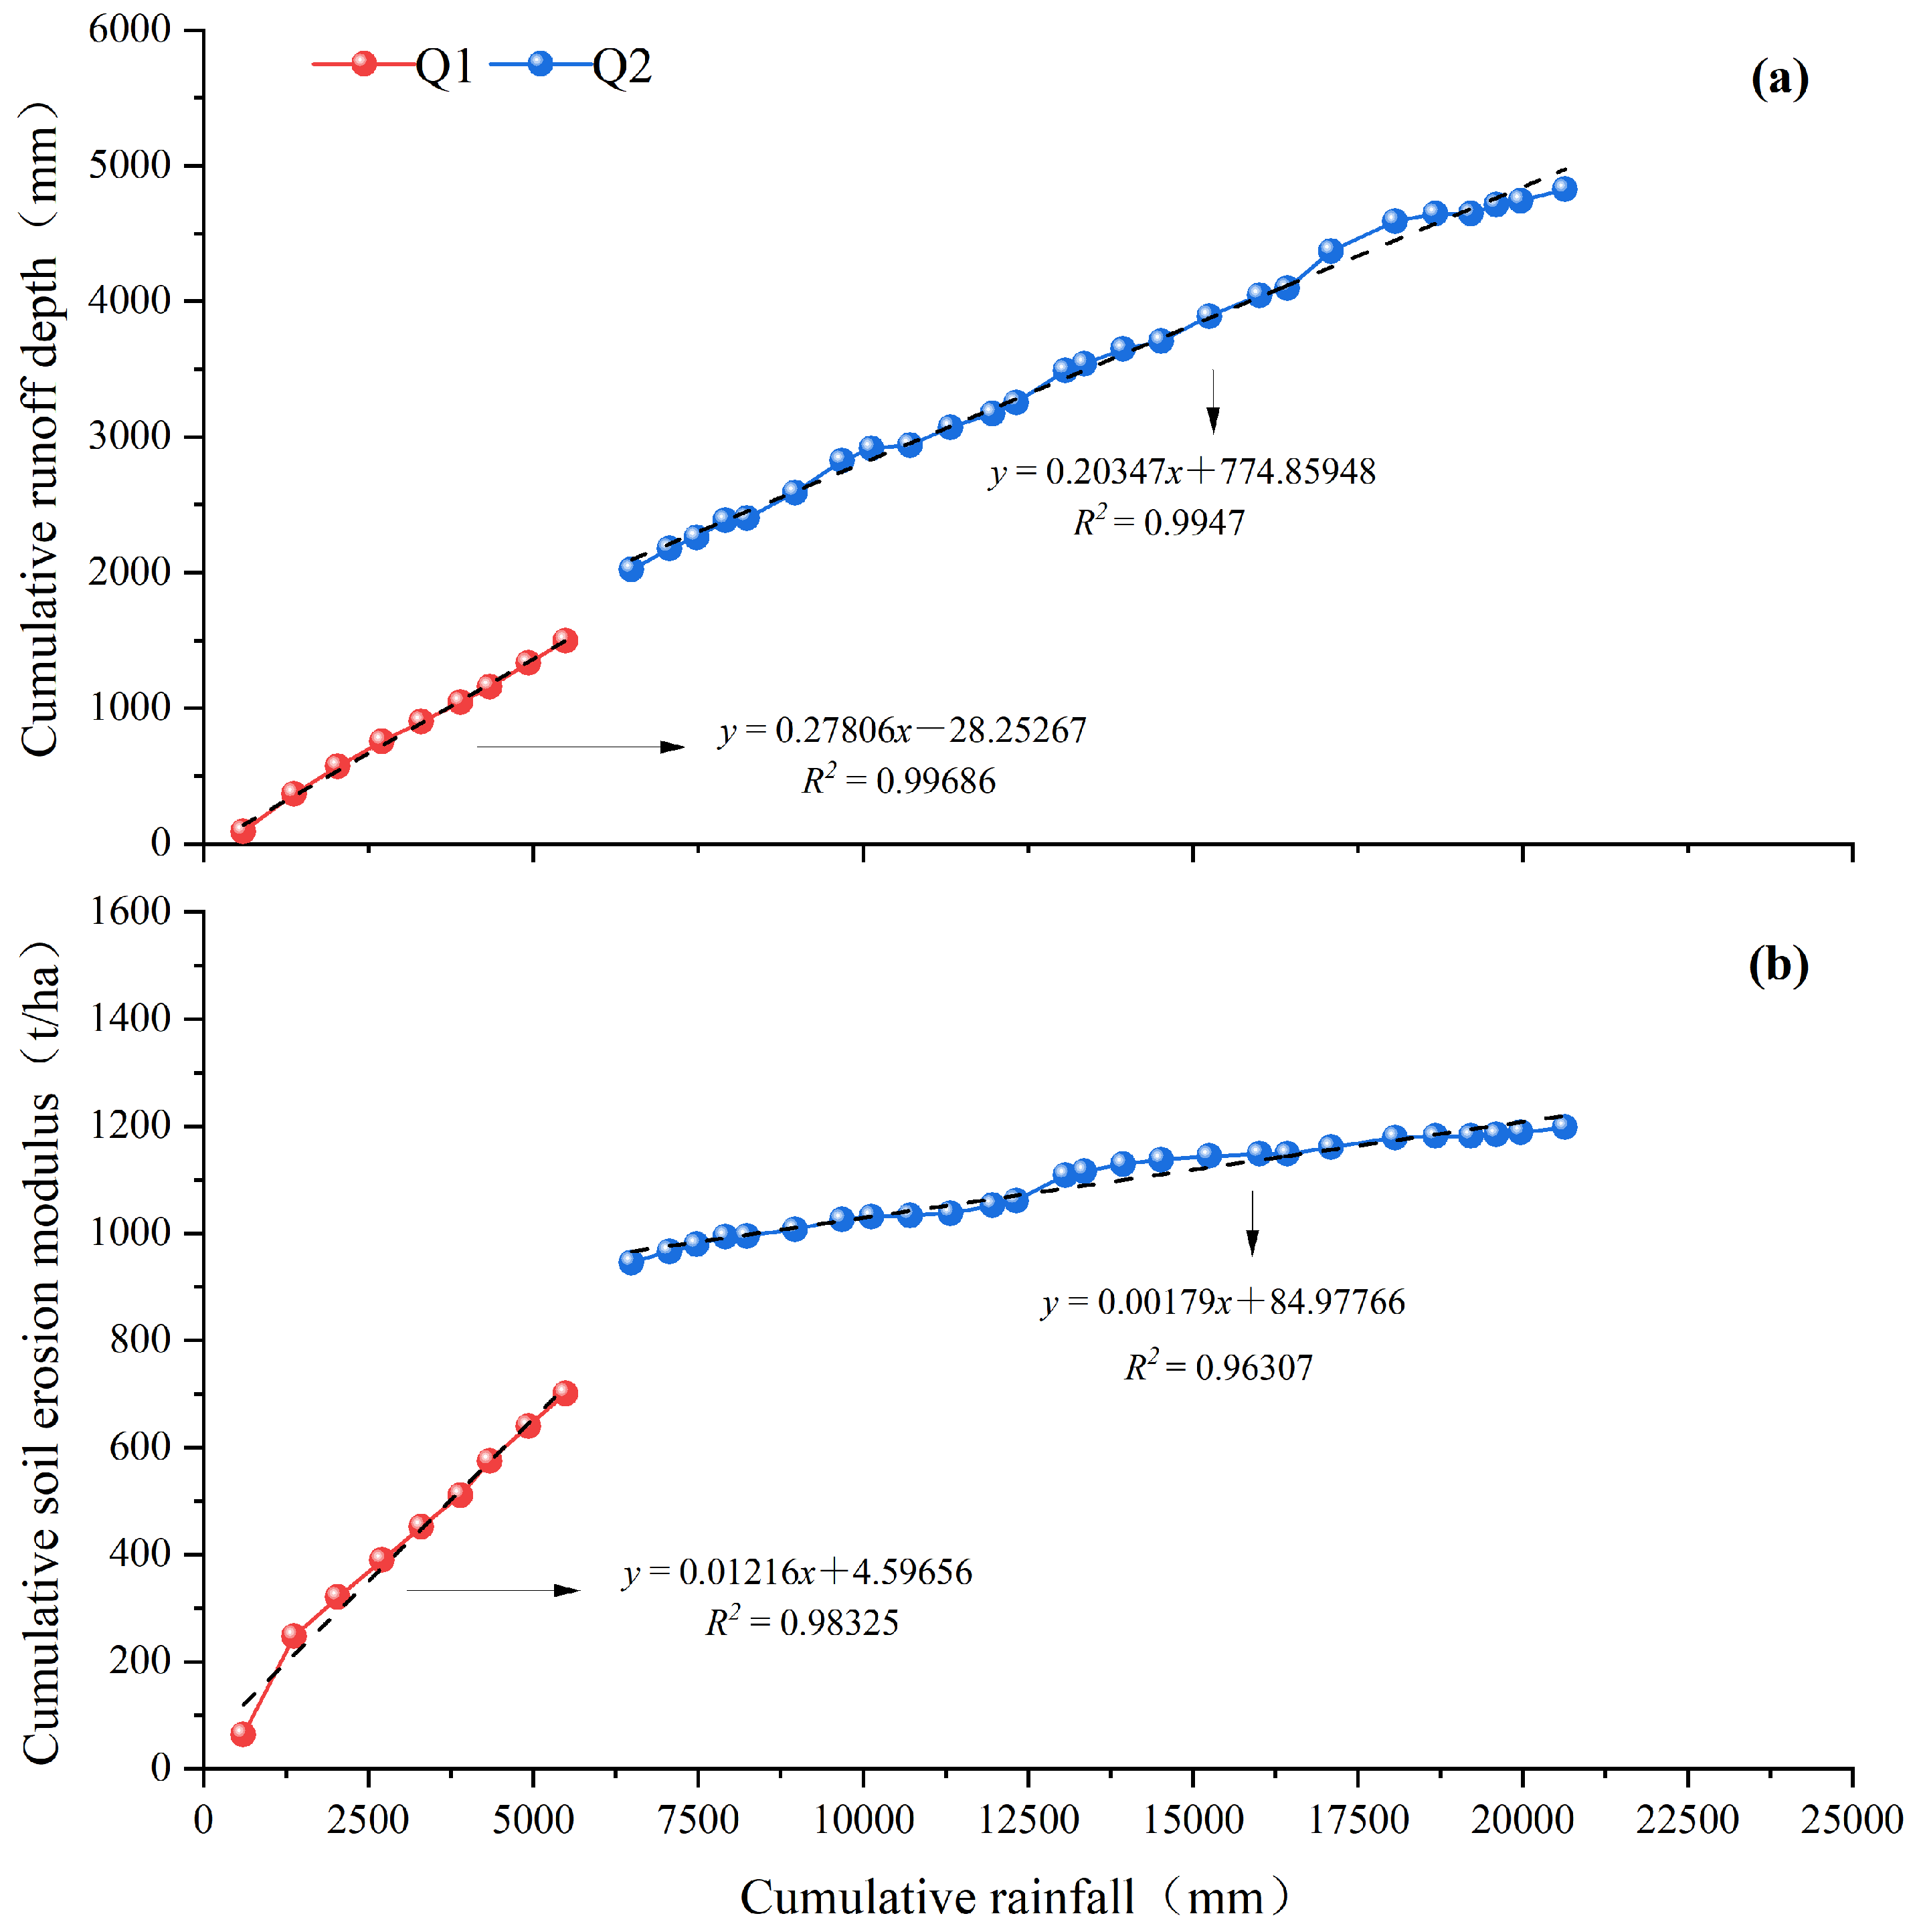
Based on WEPP model, the reduction in runoff depth attributable to forest restoration during Q2 period was 29.3 mm, accompanied by a reduction in the soil erosion modulus of 49.1 t/ha. WEPP model scenario analysis yielded contribution rates of 76.1% for runoff reduction and 83.5% for sediment reduction. Double cumulative curves of annual rainfall-runoff-sediment modulus were plotted (Figure 6). Forest restoration had led to a reduction of 34.1 mm in runoff depth and 52.6 t/ha in soil erosion modulus, with corresponding contribution rates of 88.5% and 89.4%, respectively (Figure 6, Table 3).
In conclusion, the two methods consistently demonstrate that forest restoration is the predominant driver of reductions in runoff and sediment within the catchment.

4. Discussion

4.1. WEPP Model Applicability

The calibrated WEPP model demonstrated satisfactory performance in simulating hydrological processes within the purple soil catchment. This confirms its applicability for investigating the impacts of vegetation restoration on water and sediment dynamics in this region [41]. The model’s robust runoff simulation can be attributed to the accurate parameterization of key soil properties. Sensitivity analysis identified effective hydraulic conductivity as the most influential parameter for runoff, which aligns with its fundamental role in controlling infiltration processes [42]. The higher simulation accuracy for runoff compared to soil erosion modulus is a common characteristic of hydrological models [43,44]. This discrepancy may stem from several factors: (1) the challenge of comprehensively measuring soil erosion modulus in the field, potentially leading to underestimation of observed values; (2) the WEPP model’s focus on water erosion, with gravity erosion processes, which may occur in the catchment, not being considered [45]; and (3) the inherent complexity of sediment transport mechanisms, which are more non-linear and difficult to capture than runoff generation. Notably, the sensitivity of parameters varied with temporal scale [46]. Soil initial saturation had a significant influence on runoff at the single-event scale but not at the annual scale, a finding consistent with other studies [47,48]. This is logical because the antecedent moisture condition critically affects infiltration for individual storms, whereas its effect is averaged out over longer periods. In conclusion, the WEPP can simulate runoff and sediment forecasting in purple soil areas to a certain extent, and can be applied to explore the impact of natural vegetation restoration on runoff and sediment changes.

4.2. Hydrological Responses to Vegetation Restoration

Analysis of data from 1984 to 2018 revealed a significant decreasing trend in runoff and soil erosion modulus in the purple soil catchment, despite a general increase in annual precipitation [49,50]. This finding contrasts with the positive correlation typically observed between rainfall and soil erosion modulus in simulated experiments, underscoring the dominant role of changes in the underlying surface condition—specifically, natural vegetation restoration—over climatic forcing in this catchment [51,52].
Over the 35-year period, enclosure measures facilitated a substantial increase in vegetation coverage and a successional shift in community structure from shrub to forest. This transformation is identified as the primary driver for the observed hydrological changes. Furthermore, this relatively low threshold for significant hydrological effect may be attributed to the inherent stability of the purple soil, as indicated by the high critical shear stress (29.5 Pa) calibrated in the WEPP model. Higher soil stability likely enables effective erosion control to be achieved at a lower vegetation coverage [53,54].
In summary, forest restoration is the principal factor mitigating soil and water loss in this catchment. To enhance conservation efforts before the establishment of a stable plant community, active measures such as promoting artificial vegetation and strictly prohibiting detrimental human activities are recommended.

4.3. Limitations of This Study

Several limitations should be considered when interpreting the findings. First, the experimental area has a relatively small catchment (less than 600 m2). Extrapolating runoff depth and sediment yield patterns observed at this small scale to larger regional contexts may introduce uncertainties. Second, the measured sediment yield only uses three bottles of water samples from the surface layer of water flow, which could lead to an underestimation of total sediment transport. Third, during rainfall events, the WEEP model was unable to fully simulate sediments generated by localized collapses and slumping within the catchment, which results in variability in sediment yield estimates. Fourth, WEPP model simulations relied on default parameters from the CLIGEN weather generator. These parameters were not specifically calibrated against observed local climatic conditions for the study area, potentially affecting the model’s accuracy in representing site-specific hydrological and erosion processes. Finally, the baseline period used for model calibration and analysis spans only nine years. This relatively short duration may limit the robustness of the long-term evaluation and affect the statistical reliability of the trend assessments for subsequent periods.

5. Conclusions

This 35-year study (1984–2018) conducted in a purple soil catchment in Sichuan reveals a significant long-term decline in both runoff and soil erosion modulus. A pivotal shift was identified in 1993, after which the downward trends became markedly more pronounced. This trajectory is primarily attributed to the extensive forest restoration efforts implemented in the region, which have enhanced surface cover, improved soil structure, and thereby fundamentally altered the catchment’s hydrological response and sediment yield capacity.
The application of the WEPP model successfully captured the observed trends, validating its utility for long-term erosion assessment in this context. However, the model’s higher accuracy in simulating runoff compared to soil erosion modulus underscores a persistent challenge in fully parameterizing sediment detachment and transport processes. This discrepancy highlights a critical avenue for future model development, particularly in integrating the effects of vegetation dynamics on soil erodibility and sediment connectivity.
Our findings have clear practical implications beyond modeling. They provide empirical and quantitative evidence that large-scale vegetation recovery is an effective strategy for achieving sustained hydrological regulation and soil conservation. The current study emphasizes that the critical early stages of restoration, particularly before a threshold canopy closes, are the most crucial for intervention to maximize the benefits of soil and water retention. Future research should focus on optimizing strategies for these early stages and improving process-based models to better account for the complex interactions between ecological succession and erosion mechanics at various scales.

Supplementary Materials

The following supporting information can be downloaded at: https://www.mdpi.com/article/10.3390/f17010029/s1, Table S1: Species composition in the catchment; Table S2: Soil physicochemical parameters at different depths in the catchment.

Author Contributions

Conceptualization, J.Z. and J.Y.; methodology, Z.L. and X.C.; writing—original draft preparation, J.Y., Z.L., J.Z., X.X., X.C., Y.C. and Z.G.; writing—review and editing, J.Z. and J.Y.; supervision, J.Z. All authors have read and agreed to the published version of the manuscript.

Funding

This research was funded by National Natural Science Foundation of China (No. 41601028), and Science and Technology Planning Project of Sichuan Province (No. 24KJPX0226).

Institutional Review Board Statement

Not applicable.

Informed Consent Statement

Not applicable.

Data Availability Statement

The data used to support the findings of this study are included within the article.

Conflicts of Interest

The authors declare that there are no conflicts of interest regarding the publication of this paper.

References

  1. Meng, Q.; Li, S.; Liu, B.; Hu, J.; Liu, J.; Chen, Y.; Ci, E. Appraisal of Soil Taxonomy and the World Reference Base for Soil Resources Applied to Classify Purple Soils from the Eastern Sichuan Basin, China. Agronomy 2023, 13, 1837. [Google Scholar] [CrossRef]
  2. Editorial Committee of China Soil and Water Conservation Bulletin. China Soil and Water Conservation Bulletin 2023; Editorial Department of China Soil and Water Conservation Bulletin: Beijing, China, 2024. [Google Scholar]
  3. Zhong, S.; Han, Z.; Du, J.; Ci, E.; Ni, J.; Xie, D.; Wei, C. Relationships between the Lithology of Purple Rocks and the Pedogenesis of Purple Soils in the Sichuan Basin, China. Sci. Rep. 2019, 9, 13272. [Google Scholar] [CrossRef]
  4. Xiao, Y.; Tang, J.; Kuang Wang, M. Physicochemical Properties of Three Typical Purple Soils with Different Parent Materials and Land Uses in Sichuan Basin, China. Nat. Resour. Eng. 2016, 1, 59–68. [Google Scholar] [CrossRef]
  5. Peng, Y.; Yu, G.I. Purple Soil Inheritance and Source of Parent Rock Material and Tectonic Background in the Sichuan Basin, China. Geol. Ecol. Landsc. 2025, 9, 718–731. [Google Scholar] [CrossRef]
  6. Wei, C.; Ni, J.; Gao, M.; Xie, D.; Hasegawa, S. Anthropic Pedogenesis of Purple Rock Fragments in Sichuan Basin, China. Catena 2006, 68, 51–58. [Google Scholar] [CrossRef]
  7. Al-Hamdan, O.Z.; Pierson, F.B.; Robichaud, P.; Elliot, W.J.; Williams, C.J. New Erodibility Parameterization for Applying WEPP on Rangelands Using ERMiT. J. ASABE 2022, 65, 251–264. [Google Scholar] [CrossRef]
  8. Liu, L.; Zhang, K.; Wang, P.; Shi, W.; Liu, J.; Li, Y. Effects of Root Traits on Soil Detachment Capacity Driven by Farmland Abandonment. Catena 2024, 239, 107951. [Google Scholar] [CrossRef]
  9. Kou, P.; Xu, Q.; Jin, Z.; Yunus, A.P.; Tao, Y.; Xia, Y.; Pu, C.; Yuan, S.; Cao, G. Assessment of Loess Terraced Slope Erosion Using Unmanned Aerial Vehicle Photogrammetry: Topographic and Hydrological Effects. Land Degrad. Dev. 2024, 35, 2462–2475. [Google Scholar] [CrossRef]
  10. Fullhart, A.T.; Nearing, M.A.; Armendariz, G.; Weltz, M.A. Climate Benchmarks and Input Parameters Representing Locations in 68 Countries for a Stochastic Weather Generator, CLIGEN. Earth Syst. Sci. Data 2021, 13, 435–446. [Google Scholar] [CrossRef]
  11. Fullhart, A.; Goodrich, D.C.; Meles, M.B.; Oliveira, P.T.S.; Almeida, C.D.N.; De Araújo, J.C.; Burns, S. Atlas of Precipitation Extremes for South America and Africa Based on Depth-Duration-Frequency Relationships in a Stochastic Weather Generator Dataset. Int. Soil Water Conserv. Res. 2023, 11, 726–742. [Google Scholar] [CrossRef]
  12. Fullhart, A.T.; Ponce-Campos, G.E.; Meles, M.B.; McGehee, R.P.; Wei, H.; Armendariz, G.; Burns, S.; Goodrich, D.C. Towards Global Coverage of Gridded Parameterization for CLImate GENerator (CLIGEN). Big Earth Data 2024, 8, 142–165. [Google Scholar] [CrossRef]
  13. Ascough, J.C., II; Flanagan, D.C.; Nearing, M.A.; Bernard, A. Engel Sensitivity and First-Order/Monte Carlo Uncertainty Analysis of the WEPP Hillslope Erosion Model. Trans. ASABE 2013, 56, 437–452. [Google Scholar] [CrossRef]
  14. Tekwa, I.J.; Laflen, J.M.; Kundiri, A.M.; Alhassan, A.B. Evaluation of WEPP versus EGEM and Empirical Model Efficiencies in Predicting Ephemeral Gully Erosion around Mubi Area, Northeast Nigeria. Int. Soil Water Conserv. Res. 2021, 9, 11–25. [Google Scholar] [CrossRef]
  15. Han, F.; Ren, L.; Zhang, X.; Li, Z. The WEPP Model Application in a Small Watershed in the Loess Plateau. PLoS ONE 2016, 11, e0148445. [Google Scholar] [CrossRef]
  16. Ame, M.A.; Wei, W.; Zhang, S.; Liu, W.; Chen, L. The Effects of Rainfall and Terracing–Mulch Combinations on Soil Erosion in a Loess Hilly Area, China: Insights from Plot Simulations and WEPP Modeling. Land 2025, 14, 432. [Google Scholar] [CrossRef]
  17. Chaowen, L.; Shihua, T.; Jingjing, H.; Yibing, C. Effects of Plant Hedgerows on Soil Erosion and Soil Fertility on Sloping Farmland in the Purple Soil Area. Acta Ecol. Sin. 2007, 27, 2191–2198. [Google Scholar] [CrossRef]
  18. Lin, C.; Tu, S.; Huang, J.; Chen, Y. The Effect of Plant Hedgerows on the Spatial Distribution of Soil Erosion and Soil Fertility on Sloping Farmland in the Purple-Soil Area of China. Soil Tillage Res. 2009, 105, 307–312. [Google Scholar] [CrossRef]
  19. Xiao, H.; Xiang, R.; Yan, R.; Xia, Z.; Guo, P.; Gao, F.; Zhang, W.; Zhu, Z.; Dong, X.; Zhang, L.; et al. Evaluating the Influences Hedgerow on Soil Erosion and Nitrogen Loss of Purple Soil Sloping Farmland under Simulated Rainfall. Ecol. Indic. 2024, 158, 111438. [Google Scholar] [CrossRef]
  20. Lei, P.; Ni, C.; Chen, F.; Wang, S.; Zhong, S.; Tan, S.; Ni, J.; Xie, D. Effects of Crop–Hedgerow Intercropping on the Soil Physicochemical Properties and Crop Yield on Sloping Cultivated Lands in a Purple Soil of Southwestern China. Forests 2021, 12, 962. [Google Scholar] [CrossRef]
  21. Jiang, M.; Nie, W.; Pan, X.; Wang, Y.; Xu, W. Influence Rules of Typical Plant Hedge in Purple Soil Areas on Soil Erodibility K-Factor. In Proceedings of the 2016 5th International Conference on Advanced Materials and Computer Science, Qingdao, China, 26–27 March 2016; Atlantis Press: Qingdao, China, 2016. [Google Scholar] [CrossRef][Green Version]
  22. Panasenko, N.N.; Anishchenko, L.N. Influence of Invasive Plants Parthenocissus Vitacea and Vinca Minor on Biodiversity Indices of Forest Communities. Contemp. Probl. Ecol. 2018, 11, 614–623. [Google Scholar] [CrossRef]
  23. Yamasaki, T.; Hamamoto, S.; Nishimura, T. Base Flow Separation for Soil Erosion Simulation in a Granitic Forested Headwater Catchment Using a Process-Based Model, GeoWEPP. Int. J. Sediment Res. 2023, 38, 494–502. [Google Scholar] [CrossRef]
  24. Hu, F.N.; Wei, C.F.; Du, J. Comparison of Surface Electrochemical Properties between Purple Rocks and Their Derived Soils as Related to Pedogenesis. Adv. Mater. Res. 2012, 476–478, 958–964. [Google Scholar] [CrossRef]
  25. Dong, L.; Wang, G.; Liu, H.; Wu, X.; Yang, T.; Zheng, C.; Lu, Z.; Zhang, Z.; Zhou, J. Parent Materials Regulate the Effects of Rainfall Intensity and Slope Gradient on Interrill Erosion Processes in the Mountainous Canyon Regions of Southwest China. Catena 2025, 256, 109092. [Google Scholar] [CrossRef]
  26. Tan, H.; Tuo, Y.F.; Chang, X.; He, X.H. Distribution and Stoichiometric Characteristics of Soil Carbon and Nitrogen Stocks in Forest Soils at Different Elevations in Liziping, Sichuan, China. Eurasian Soil Sci. 2025, 58, 35. [Google Scholar] [CrossRef]
  27. Tang, Y.; Zhao, Y.; Li, Z.; He, M.; Sun, Y.; Hong, Z.; Ren, H. A Comprehensive Evaluation of Land Reclamation Effectiveness in Mining Areas: An Integrated Assessment of Soil, Vegetation, and Ecological Conditions. Remote Sens. 2025, 17, 1744. [Google Scholar] [CrossRef]
  28. Tali, P.; Bhat, M.; Lone, F. Seasonal Spatio-Temporal Variability in Temperature over North Kashmir Himalayas Using Sen Slope and Mann-Kendall Test. J. Clim. Weather Forecast 2021, 9, 288. [Google Scholar]
  29. Al Mashoudi, A.; Saber, E.-R.; Chrif El Idrissi, M. Trend Analysis of Heavy Rainfall in the Western Rif: A Statistical Approach Using the Mann–Kendall Test. Acta Geophys. 2025, 73, 6127–6146. [Google Scholar] [CrossRef]
  30. Güçlü, Y.S.; Acar, R.; Saplıoğlu, K. Seasonally Adjusted Periodic Time Series for Mann-Kendall Trend Test. Phys. Chem. Earth Parts A/B/C 2025, 138, 103848. [Google Scholar] [CrossRef]
  31. Chen, Y.; Shen, H.; Wang, X.H.; Zhao, W.K.; Pan, Z.J.; Wang, J.Y.; Li, S.Y.; Han, D. An Urban Energy Carbon Peak Assessment Method Based on Mann-Kendall Trend Test. J. Shanghai Jiaotong Univ. 2023, 57, 928–938. [Google Scholar]
  32. Kakavand, M.; Haghizadeh, A.; Soleimani-Motlagh, M. Spatio-Temporal Analysis of Trend the Hydro-Climatic Time Series and Identify Factors Affecting Flood Hazard. Earth Sci. Inf. 2025, 18, 177. [Google Scholar] [CrossRef]
  33. Jian, Z.; Yang, Q.; Shao, J.; Wang, G.; Pandey, V.P. Spatiotemporal Variation in NDVI in the Sunkoshi River Watershed During 2000–2021 and Its Response to Climate Factors and Soil Moisture. Water 2025, 17, 2232. [Google Scholar] [CrossRef]
  34. Pettitt, A.N. A Non-Parametric Approach to the Change-Point Problem. Appl. Stat. 1979, 28, 126. [Google Scholar] [CrossRef]
  35. Pirnia, A.; Golshan, M.; Darabi, H.; Adamowski, J.; Rozbeh, S. Using the Mann–Kendall Test and Double Mass Curve Method to Explore Stream Flow Changes in Response to Climate and Human Activities. J. Water Clim. Change 2019, 10, 725–742. [Google Scholar] [CrossRef]
  36. Guoshuai, Z.; Anjun, D.; Jianguo, C.; Dangwei, W.; Qin, L.; Yiqin, X. Improving the Double Mass Curve Method to Analyse the Variation Trend of Runoff and Sediment Load in Watersheds. LHB 2023, 109, 2236971. [Google Scholar] [CrossRef]
  37. Mohammed, S. Modeling Current and Future Run-off and Soil Erosion Dynamics in Eastern Mediterranean Ecosystems Using the WEPP Model. Energy Nexus 2025, 17, 100375. [Google Scholar] [CrossRef]
  38. Li, H.; Jin, S.; Lei, X.Y.; Zhu, L.Y.; Zhang, X. Study on the importance of sensitivity analysis and auto-calibration of SWAT model: Taking the case study of Manasi Watershed. J. Water Resour. Water Eng. 2010, 21, 79–82. [Google Scholar]
  39. Zhang, X.C. Calibration, Refinement, and Application of the WEPP Model for Simulating Climatic Impact on Wheat Production. Trans. ASAE 2004, 47, 1075–1085. [Google Scholar] [CrossRef]
  40. Lu, X.; Chen, J.; Guo, J.; Qi, S. Variation Characteristics of Rainfall Erosivity in Tropical China and Its Impact on River Sediment Load. Front. Environ. Sci. 2023, 11, 1084503. [Google Scholar] [CrossRef]
  41. Worku, Y.A.; Moges, A.; Kendie, H. Comparison of SWAT and WEPP for Modeling Annual Runoff and Sediment Yield in Agewu—Mariyam Watershed, Northern Ethiopia. Int. J. Food Agric. Nat. Resour. 2024, 5, 104–113. [Google Scholar] [CrossRef]
  42. Pieri, L.; Bittelli, M.; Wu, J.Q.; Dun, S.; Flanagan, D.C.; Pisa, P.R.; Ventura, F.; Salvatorelli, F. Using the Water Erosion Prediction Project (WEPP) Model to Simulate Field-Observed Runoff and Erosion in the Apennines Mountain Range, Italy. J. Hydrol. 2007, 336, 84–97. [Google Scholar] [CrossRef]
  43. Lee, S.; Chu, M.L.; Guzman, J.A.; Botero-Acosta, A. A Comprehensive Modeling Framework to Evaluate Soil Erosion by Water and Tillage. J. Environ. Manag. 2021, 279, 111631. [Google Scholar] [CrossRef]
  44. Zheng, F.; Zhang, X.-C.; Wang, J.; Flanagan, D.C. Assessing Applicability of the WEPP Hillslope Model to Steep Landscapes in the Northern Loess Plateau of China. Soil Tillage Res. 2020, 197, 104492. [Google Scholar] [CrossRef]
  45. Rhee, H.; Fridley, J.L.; Foltz, R.B. Modeling Erosion from Unpaved Forest Roads at Various Levels of Geometric Detail Using the WEPP Model. Trans. ASAE 2004, 47, 961–968. [Google Scholar] [CrossRef]
  46. Singh, R.K.; Panda, R.K.; Satapathy, K.K.; Ngachan, S.V. Simulation of Runoff and Sediment Yield from a Hilly Watershed in the Eastern Himalaya, India Using the WEPP Model. J. Hydrol. 2011, 405, 261–276. [Google Scholar] [CrossRef]
  47. Ma, L.; Zuo, C.Q. Study on Main Influencing Factors of Red Soil Slope Erosion Based on Water Erosion Prediction Model. Bull. Soil Water Conserv. 2012, 32, 26–29+33. [Google Scholar]
  48. Fu, B.; Wang, Y.; Xu, P.; Yan, K. Assessment of the Performance of WEPP in Purple Soil Area with Simulated Rainfall Experiments. J. Mt. Sci. 2012, 9, 570–579. [Google Scholar] [CrossRef]
  49. Wang, R.H.; Li, M.X.; Zhang, H.; Wang, F.; Zhang, J.F.; Jia, J.R.; Wei, C. Study on Indoor Simulated Rainfall with Different Vegetation Coverageon Slope Erosion Reduction in the Three Gorges Reservoir Area. J. Soil Water Conserv. 2023, 37, 59–64. [Google Scholar]
  50. Yu, G.Q.; Li, Z.B.; Zhang, X.; Li, P.; Chen, L.; Jia, L.L. Experimental Study on Law of Runoff-Erosion-Sediment Yield under Field Simulated Rainfall Condition. J. Soil Water Conserv. 2009, 23, 10–14. [Google Scholar]
  51. Rey, F. Harmonizing Erosion Control and Flood Prevention with Restoration of Biodiversity through Ecological Engineering Used for Co-Benefits Nature-Based Solutions. Sustainability 2021, 13, 11150. [Google Scholar] [CrossRef]
  52. Ediş, S.; Timur, Ö.B.; Tuttu, G.; Aytaş, İ.; Göl, C.; Özcan, A.U. Assessing the Impact of Engineering Measures and Vegetation Restoration on Soil Erosion: A Case Study in Osmancık, Türkiye. Sustainability 2023, 15, 12001. [Google Scholar] [CrossRef]
  53. Zhang, Q.; Xu, H.; Zhang, Z. Plot Size Modulates the Effects of Vegetation on Soil and Water Conservation at the Slope Scale on China’s Loess Plateau. Catena 2025, 258, 109284. [Google Scholar] [CrossRef]
  54. Hu, X.; Li, Y.; Guo, W.; Li, J.; Zhu, X.; Luo, L.; Tian, P.; Sun, H. Inhibiting Effects of Vegetation Coverage on Runoff, Sediment, and Organic Carbon Loss on Steep Loess Gully-Slopes. Land Degrad Dev. 2025, 36, 5800–5816. [Google Scholar] [CrossRef]
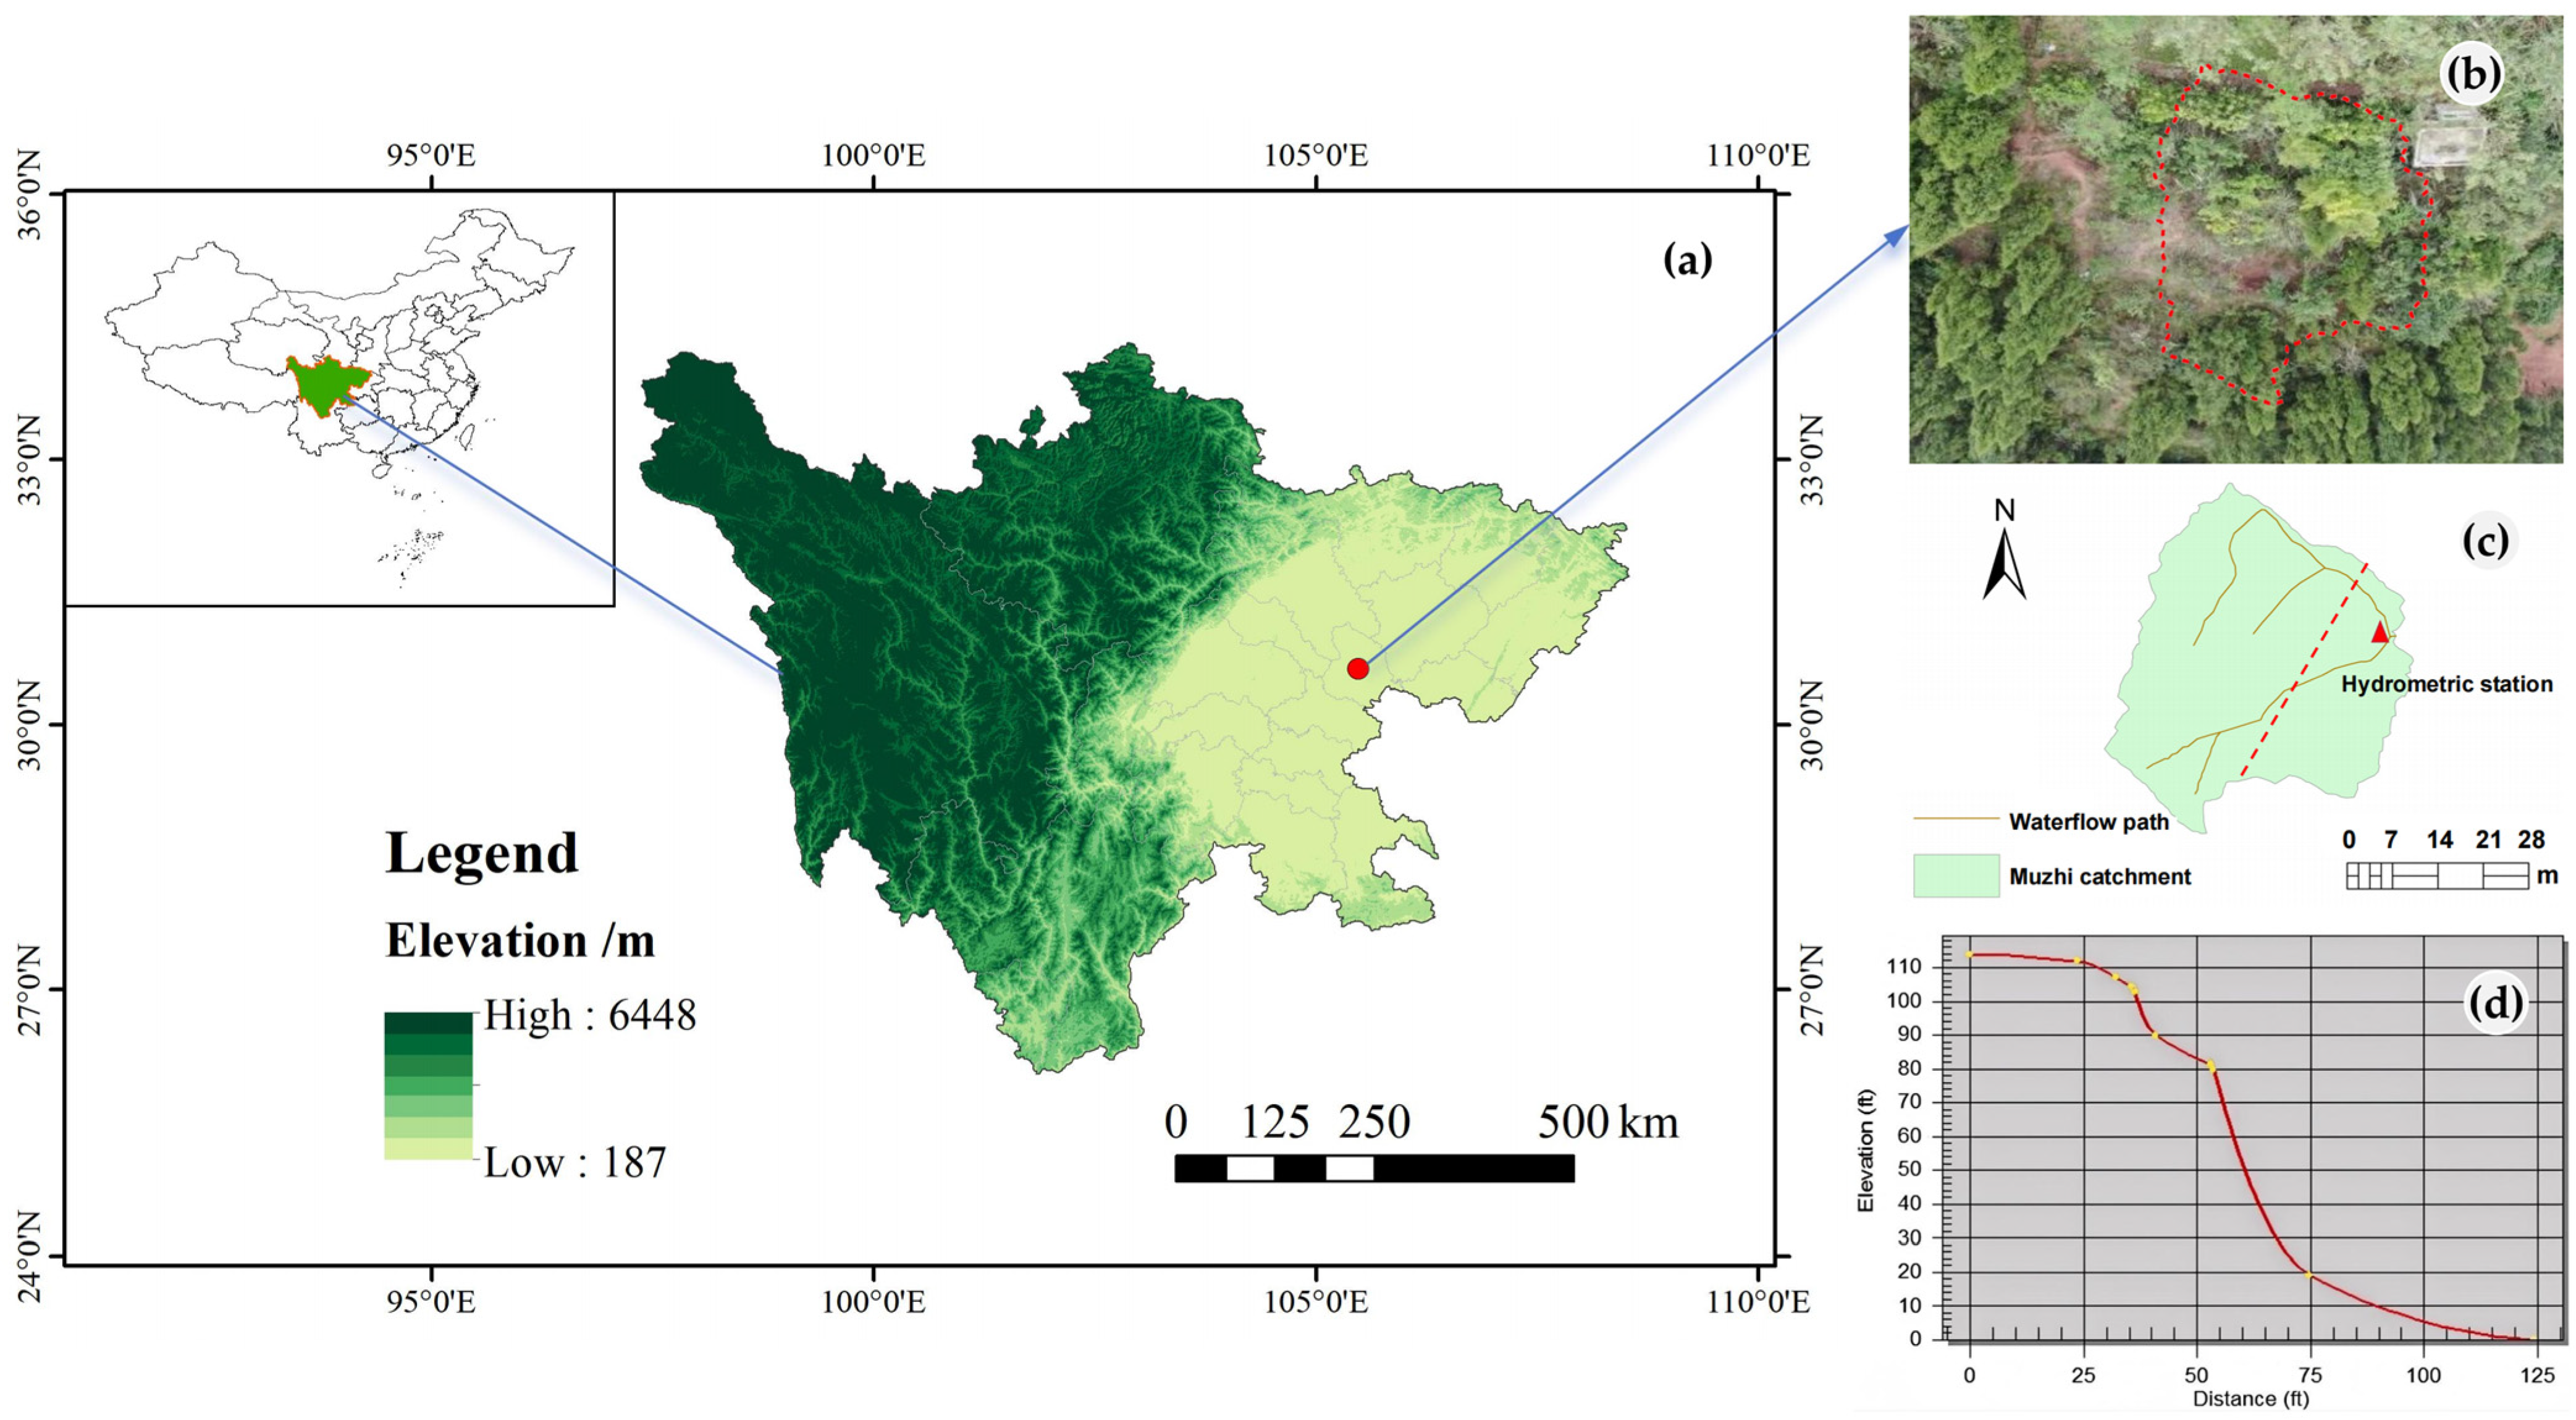
Figure 1. Location of Suining Soil and Water Conservation Experimental Station (a), natural vegetation restoration status of the catchment in 2022 (b), area range and hydrometric station of Muzhi catchment (c), slope ratio change in profile according to the red dashed line (d).
Forests 17 00029 g001
Figure 2. Monthly distribution of precipitation (a), runoff depth (b) and soil erosion modulus (c) during 1984–2018. The bar charts and error bars represent the mean values and standard errors, respectively.
Forests 17 00029 g002
Figure 3. M-K and Pettitt tests of runoff (a,c) and soil erosion modulus (b,d), dotted line is the significance level threshold (α = 0.05). The red dotted line (c,d) is the result of Pettitt test.
Forests 17 00029 g003
Figure 4. Interannual variation of precipitation (a), runoff (b) and soil erosion modulus (c).
Forests 17 00029 g004
Figure 5. Performance of the simulation model in predicting runoff depth and soil erosion modulus during calibration and verification periods. (Q1): 1984–1992, reference period; (Q2): 1993–2018, evaluation period.
Forests 17 00029 g005
Figure 6. Double cumulative curves of annual runoff depth (a) and annual soil erosion modulus (b).
Forests 17 00029 g006
Table 1. Vegetation coverage rate and plant species diversity in the chosen catchment during survey years.
YearCoverage RateNumber of Main SpeciesMain Tree SpeciesMain Shrub SpeciesMain Herbaceous Species
19846.5%3——Coriaria nepalensisSaccharum arundinaceum, Heteropogon contortus
199859.5%6Cupressus funebrisCoriaria nepalensis, Vitex negundoHeteropogon contortus, Acalypha australis L., Avenella flexuosa (L.) Drejer
200059.7%8Cupressus funebrisCoriaria nepalensis, Vitex negundo, Myrsine africana L., Cryptolepis sinensis (Lour.) Merr.Acalypha australis, Avenella flexuosa, Saccharum arundinaceum
200768.4%20Cupressus funebrisCoriaria nepalensis, Vitex negundo, Myrsine africana, Rubus piluliferus Focke, Ziziphus jujuba Mill., Ailanthus altissima (Mill.) Swingle, Elaeagnus umbellata Thunb., Toxicodendron succedaneum (L.) Kuntze, Dicranopteris pedata (Houtt.) Nakaike, Lespedeza bicolor Turcz.Saccharum arundinaceum, Ficus tikoua Bureau, Eragrostis ferruginea (Thunb.) P. Beauv., Pterygiella nigrescens Oliv., Eriophorum comosum (Wall.) Nees, Themeda triandra Forssk., Eulaliopsis binata, Pogonatherum crinitum (Thunb.) Kunth, Imperata cylindrica
201876.8%42Cupressus funebris, Robinia pseudoacacia L., Ligustrum lucidum W. T. Aiton, Rhus punjabensis Stewart, Dalbergia hupeana HanceCoriaria nepalensis, Vitex negundo, Myrsine africana, Eriobotrya japonica (Thunb.) Lindl., Lespedeza bicolor, Cryptolepis sinensis, Rubus innominatus S. Moore, Rubus coreanus Miq., Broussonetia papyrifera (L.) L’Hér. ex Vent.Arthraxon hispidus, Saccharum arundinaceum, Allium tenuissimum L., Imperata cylindrica, Iris graminea, Acorus gramineus Soland., Pogonatherum crinitum, Cyclosorus parasiticus (L.) Farw., Eremochloa ciliaris (L.) Merr., Lespedeza cuneata (Dum. Cours.) G. Don, Eulaliopsis binata
Table 2. Sensitivity value and grade of soil database parameters to annual rainfall, runoff depth, and soil erosion modulus.
TypeSoil AlbedoInitial SaturationInterrill ErosionRill ErosionSoil Critical Shear StressEffective Hydraulic Conductivity
Runoff depthannual rainfall0.52 **0.010.000.000.002.38 ***
single rainfall0.007.95 ***0.000.000.006.07 ***
Soil erosion modulusannual rainfall0.89 **0.030.0065.15 ***1.75 ***2.35 ***
single rainfall0.003.93 ***0.0028.51 ***1.17 ***5.82 ***
Note: “**” indicates moderate sensitivity; “***” indicates high sensitivity; while no symbol indicates no sensitivity.
Table 3. Impact of natural forest restoration on runoff sediment in the catchment.
MethodRecovery PeriodPrecipitation (mm)Runoff Depth
(mm)
Soil Erosion Modulus
(t/ha)
Contribution Ratio of Forest Restoration (%)
Measured ValueCalculated/Simulated ValueMeasured ValueCalculated/Simulated ValueRunoff DepthSoil Erosion Modulus
Double-CumulativeQ1610.3166.5-77.9-88.589.4
Q2582.7128.0162.119.171.7
WEPPQ1610.3166.5-77.9-76.183.5
Q2582.7128.0157.319.168.2
Disclaimer/Publisher’s Note: The statements, opinions and data contained in all publications are solely those of the individual author(s) and contributor(s) and not of MDPI and/or the editor(s). MDPI and/or the editor(s) disclaim responsibility for any injury to people or property resulting from any ideas, methods, instructions or products referred to in the content.