Article

Vegetation-Driven Changes in Soil Properties, Enzymatic Activities, and Microbial Communities of Saline–Alkaline Wetlands

1
College of Garden, Changchun University, Changchun 130012, China
2
Institute of Resource Utilization and Soil Conservation, Changchun University, Changchun 130022, China
*
Author to whom correspondence should be addressed.
Forests 2025, 16(9), 1468; https://doi.org/10.3390/f16091468
Submission received: 31 July 2025 / Revised: 6 September 2025 / Accepted: 12 September 2025 / Published: 16 September 2025
(This article belongs to the Section Forest Biodiversity)

Abstract

Saline–alkaline wetlands represent critical ecosystems for maintaining biodiversity, regulating hydrological processes, and supporting regional ecological resilience. However, the extent to which dominant vegetation regulates soil functionality and microbial assemblages in these unique saline systems remains insufficiently understood. In this study, we examined five characteristic vegetation types—Phragmites communis Trin., Typha angustifolia L., Bryophytes, Suaeda salsa (L.) Pall., Echinochloa phyllopogon (Stapf) Koss.—across the saline wetlands of Chagan Lake, northeast China, which are embedded in a heterogeneous matrix of forests, grasslands, and agricultural lands. Comprehensive assessments of soil physicochemical properties, enzyme activities, and bacterial communities were conducted, integrating high-throughput sequencing with multivariate statistical analyses. Our results revealed that vegetation cover markedly influenced soil attributes, particularly total organic carbon (TOC) and alkali-hydrolyzed nitrogen (AN), alongside key enzymatic functions such as urease and alkaline phosphatase activities. Proteobacteria, Actinobacteria, and Acidobacteria emerged as dominant bacterial phyla, with their relative abundances tightly linked to vegetation-induced shifts in soil environments. Notably, soils under E. phyllopogon demonstrated elevated bacterial diversity and enzymatic activities, underscoring the synergistic effects of plant selection on soil biogeochemical health. Structural equation modeling further elucidated complex pathways connecting vegetation, microbial diversity, soil quality, and enzymatic functioning. These findings emphasize the pivotal role of vegetation management in improving soil fertility, shaping microbial communities, and guiding the sustainable restoration of saline–alkaline wetlands under environmental stress.

Graphical Abstract

1. Introduction

Saline–alkaline wetlands embedded within heterogeneous landscapes are ecologically valuable ecosystems that play critical roles in regulating hydrological cycles, nutrient dynamics, and biodiversity [1]. The Chagan Lake system, located in the Songnen Plain of northeastern China, exemplifies such a wetland, situated within a mosaic of forests, grasslands, and agricultural lands [2]. These wetlands are highly dynamic and support essential ecosystem functions under various environmental stresses, including soil salinization and nutrient limitations [3].
Progressive salinization of wetland soils is a major ecological concern, particularly in arid and semi-arid regions. High salt concentrations can disrupt soil structure and chemistry, inhibit plant growth, reduce species richness, and impair critical ecosystem processes [4]. Vegetation acts as a key driver of soil development and microbial community structure in saline–alkaline wetlands. Through root exudation, litter deposition, and rhizosphere interactions, plants modify soil physicochemical properties, regulate nutrient availability, and create microhabitats that sustain diverse microbial taxa [5]. In saline ecosystems, halophytes adopt a range of adaptive strategies—including ion compartmentalization, osmolyte accumulation, succulence, and selective ion uptake—that allow them to tolerate osmotic and ionic stress. These mechanisms not only support plant survival but also influence soil conditions by reducing surface salinity, enhancing organic matter input, and stabilizing soil structure [6,7]. By altering rhizosphere chemistry and creating favorable microenvironments, halophytes can facilitate the establishment of other species and promote positive feedback between vegetation and soil microbial communities. In turn, soil microbial communities contribute to organic matter decomposition, enzymatic activity, and nutrient cycling, all of which are vital for maintaining soil fertility and supporting plant establishment under harsh conditions [8]. These plant–soil–microbe interactions are particularly important in saline–alkaline ecosystems, where abiotic stresses and nutrient limitations pose substantial challenges to ecological stability [9].
Recent studies highlight that vegetation composition, especially the presence of salt-tolerant species, can enhance soil organic carbon storage, stimulate enzymatic processes, and foster microbial communities adapted to high salinity. Such interactions are consistent with theoretical frameworks of stress-gradient dynamics, which suggest that under severe abiotic stress, facilitative interactions between plants and soil biota become increasingly important for ecosystem functioning [10,11]. However, there is still limited understanding of how different dominant vegetation types influence soil nutrient dynamics, enzymatic activity, and microbial diversity in saline–alkaline systems [12]. Addressing this knowledge gap is essential for designing restoration strategies that enhance ecosystem functions, conserve biodiversity, and increase landscape-level resilience under ongoing environmental change [13].
Chagan Lake, located in the Songnen Plain of northeastern China, represents a typical saline–alkaline wetland embedded within a heterogeneous matrix of forest, grassland, and agricultural land uses. The lake basin is characterized by pronounced salinity gradients, seasonal water-level fluctuations, and semi-arid continental climatic control, making it a suitable system to investigate plant–soil–microbe interactions under salinity stress. Regional surveys report soil EC (1:5 extract) typically ranging from 0.06 to 4.3 dS·m−1, surface pH values from 8.0 to >10.5, and SAR commonly between 3 and 86, indicative of moderate to strong saline–sodic conditions in the Songnen Plain [14,15,16]. The Chagan Lake area offers a natural experimental setting to investigate these processes. By examining soils beneath five dominant wetland plant types—including halophytic species, glycophytic species, and mixed communities of halophytes—we aim to elucidate how vegetation mediates soil physicochemical traits, enzymatic activities, and bacterial community composition. We hypothesize that different vegetation types exert distinct effects on soil fertility and microbial diversity, with salt-tolerant species promoting improved soil health and more diverse microbial communities. Insights from this research are expected to inform ecological restoration strategies and support sustainable management of saline–alkaline wetlands.

2. Materials and Methods

2.1. Study Area and Soil Sample Collection

This study was conducted in the saline–alkaline wetlands of Qianguoerluosi Mongolian Autonomous County (124°10′–124°32′ E, 45°10′–45°21′ N) on the Songnen Plain, northeastern China (Figure 1). The area comprises saline–alkaline wetlands embedded within a heterogeneous landscape of forest patches, grasslands, and agricultural lands. The region experiences a temperate continental monsoon climate, characterized by hot, humid summers and long, cold winters. Annual precipitation ranges from 400 to 450 mm, primarily occurring from June to August, and the mean annual temperature is approximately 5 °C. The flat terrain and shallow water bodies support both seasonal and perennial wetlands, creating diverse habitats and complex land–water interfaces [17].
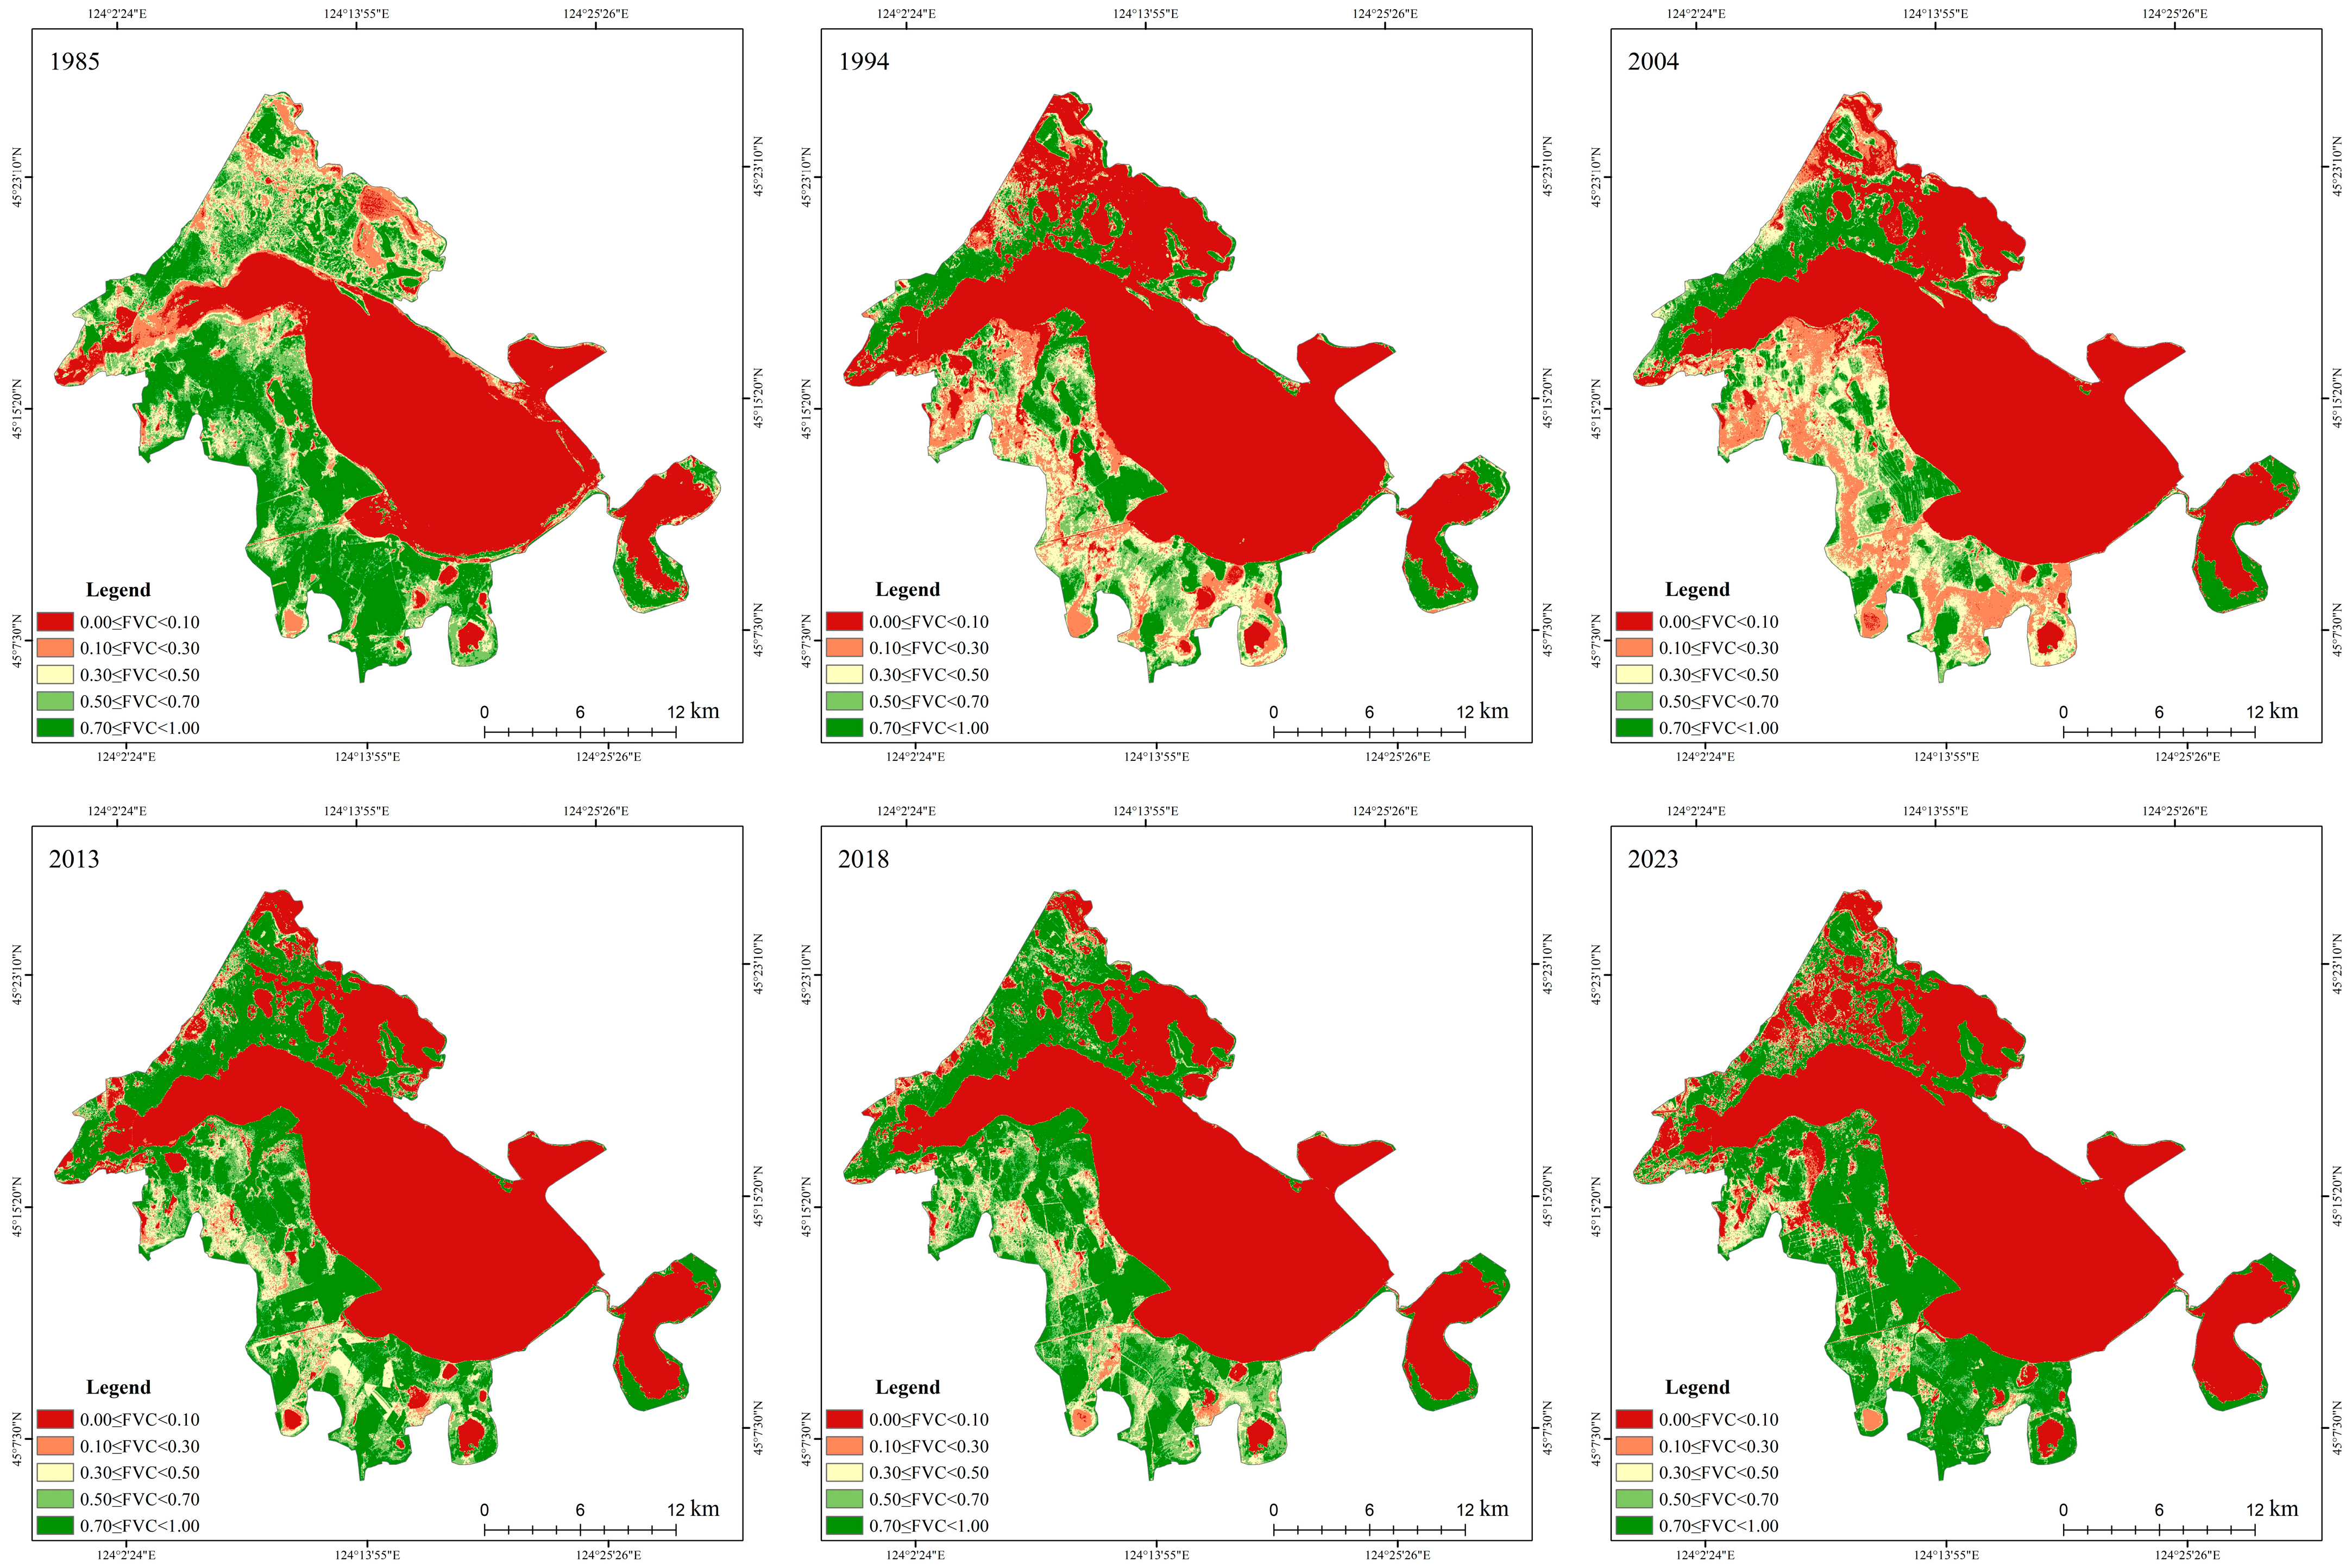
Over the past four decades, the wetlands have undergone gradual compositional changes driven by natural successional processes and minor anthropogenic influences. To provide a long-term ecological context, historical vegetation cover was reconstructed using estimates from 1984, 1994, 2004, 2013, 2019, and 2023 (Figure 1), allowing us to track vegetation dynamics across the study area (Figure 2).
In the present study, five dominant plant communities were selected—Phragmites communis Trin., Typha angustifolia L., Bryum spp., Suaeda salsa (L.) Pall., Echinochloa phyllopogon (Stapf) Koss.—as they represent the most ecologically significant functional groups in the Chagan Lake saline–alkaline wetlands. Specifically, P. communis and T. angustifolia are tall emergent macrophytes that stabilize sediments, contribute substantial litter inputs, and create anaerobic microhabitats that regulate nutrient cycling; Bryum spp. are pioneer bryophytes tolerant to salinity stress, forming biological soil crusts that influence microtopography and initial soil development; S. salsa is a typical halophyte with strong ion-compartmentalization capacity, widely distributed in saline flats and playing a critical role in reducing surface salinity and improving soil fertility; and E. phyllopogon is a salt-tolerant annual grass that thrives under waterlogged conditions, contributing to rapid nutrient turnover and providing a contrasting functional type to perennial halophytes. Collectively, these five communities encompass hydrophytes, halophytes, bryophytes, and glycophytic grasses, thereby capturing the main vegetation strategies and functional groups that regulate soil physicochemical properties, enzymatic activity, and microbial diversity in this ecosystem [18,19,20]. Soil sampling was conducted in July–August 2023 across five representative plots (W1–W5), with three replicate sampling points per vegetation type (Figure 1). At each sampling point, five subsamples were collected following an “S-shaped” five-point method within a 1 m × 1 m quadrat to account for spatial heterogeneity. Surface litter was carefully removed before soil excavation at 0–20 cm depth. Rhizosphere soil adhering to plant roots was gently loosened using a clean shovel and pooled into sterile plastic bags. Approximately 100 g of soil was collected from each sampling point. Composite soil samples were homogenized and divided into two subsamples: one portion was air-dried at ambient temperature for subsequent physicochemical analyses, and the other was kept in a portable cooler at 4 °C during transport and subsequently stored at −80 °C in the laboratory to preserve microbial integrity for DNA extraction and high-throughput sequencing. Detailed information on the sampling design and vegetation types is provided in Table 1.

2.2. Soil Physicochemical and Microbial Analyses

Soil composites were homogenized and divided into two subsamples. One was air-dried for physicochemical analyses: pH was determined using a benchtop pH meter (PHS-3C), electrical conductivity (EC) with a conductivity meter (DDS-307), total organic carbon (TOC) by potassium dichromate oxidation under external heating, total nitrogen (TN) via Kjeldahl spectrophotometry, and total phosphorus (TP) by colorimetric spectrophotometry. Available nitrogen (AN) was extracted with alkaline borate, and available phosphorus (AP) was measured by the Olsen method combined with molybdenum-antimony anti-ascorbic acid colorimetry [21,22]. The second subsample was kept at 4 °C during transport and stored at −80 °C to preserve microbial integrity for DNA extraction and high-throughput sequencing of the 16S rRNA V3–V4 region.

2.3. High-Throughput Sequencing

Following the extraction of total DNA of the sample, primers were designed based on conserved regions, and sequencing joints were appended to the primers. The PCR amplification was conducted, and the amplicons were purified, quantified, and homogenized to form a sequencing library. The constructed library was first subjected to an initial inspection, and a qualified library was sequenced through the application of the IlluminaHiSeq2500 platform. The original image data obtained from high-throughput sequencing (such as IlluminaHiSeq and other sequencing platforms) were converted into SequencedReads after BaseCalling analysis. The resulting double-ended sequences in FASTQ (fq) format underwent quality screening. FLASH software (version 1.2.11) was adopted to align and connect the qualified double-ended sequences according to overlapping bases. The results contained sequence information of reads and their corresponding sequencing quality information. The sequencing data generated in this study have been deposited in the NCBI Sequence Read Archive (SRA) under the accession number SRP557169.

2.4. Soil Enzymatic Activity Determination

The catalase (CAT) activity in the soil was assessed through the utilization of potassium permanganate titration [23]. The alkaline phosphatase (ALP) activity was determined using colorimetry [24]. Urease (UE) activity was determined through the phenol-sodium hypochlorite colorimetric method [25]. Soil sucrase (SC) activity was measured by 3, 5-dinitrosalicylic acid colorimetry [26].

2.5. Data Analysis

Four indices, including Chao1, ACE, Simpson, and Shannon, were utilized for the analysis of alpha diversity in samples, and the indices were calculated by QIIME2 software (version 2022.2). Beta diversity was assessed based on Bray–Curtis’s dissimilarity matrices to evaluate community composition differences among samples. Non-metric multidimensional scaling (NMDS) was performed using the vegan package in R (version 4.3.3) to visualize variation in microbial communities across different vegetation types. Heatmap clustering was used to display taxonomic abundance patterns at the genus level. Redundancy analysis (RDA) was conducted in Canoco 5.0 (Microcomputer Power, Ithaca, NY, USA) to explore the relationships between environmental factors (e.g., pH, EC, and SOM) and bacterial community structure. One-way analysis of variance (ANOVA) was used to determine significant differences in soil physicochemical properties among vegetation groups using SPSS software (version 26.0). Descriptive statistics and preliminary data processing were carried out in Microsoft Excel 2019. To further explore the potential causal pathways and interactions among vegetation type, soil chemical properties, and microbial diversity, partial least squares structural equation modeling (PLS-SEM) was conducted using SmartPLS 4.0 (SmartPLS GmbH, Hamburg, Germany). The structural model was constructed based on hypothesized relationships between latent variables and tested through bootstrapping (n = 5000 resamples). Model fit was evaluated using standard criteria such as SRMR (standardized root mean square residual), R2 values, and path coefficients.

3. Results

3.1. Soil Chemical Properties

As presented in Table 2, soil chemical properties varied significantly among the different vegetation types. The lowest pH was recorded at W5, with a mean value of 8.18, classifying it as slightly alkaline relative to the other sites. This moderate alkalinity may create more favorable conditions for microbial activity compared with the more strongly alkaline soils, potentially influencing variations in bacterial community composition. The soil organic carbon (SOC) content ranged from 2.15 to 9.47 g·kg−1, with W1 and W5 exhibiting the highest values. In contrast, W2 and W3 showed significantly lower SOC concentrations. Significant differences in total nitrogen (TN), total phosphorus (TP), alkali-hydrolyzed nitrogen (AN), and available phosphorus (AP) were also observed among treatments (p < 0.05). Although AN concentration showed relatively small absolute differences, the variation among vegetation types was statistically significant. The highest total phosphorus (TP) content was observed at W5 (3.17 g·kg−1), significantly higher than at the other sites, whereas the available phosphorus (AP) was the lowest (33.53 mg·kg−1). This discrepancy is likely due to the alkaline soil conditions at W5 (pH > 8), under which phosphorus tends to precipitate as insoluble calcium and magnesium phosphates, reducing its bioavailability regardless of total phosphorus content. Thus, the low AP at W5 reflects chemical immobilization in alkaline soils rather than limited phosphorus conversion efficiency. Soils under W1 and W3 had similar levels of TN, TP, AN, and AP, suggesting that the presence of Bryum spp. had a minimal influence on nutrient enrichment. However, except for TN, all nutrient indicators in W3 were lower than those in W1, potentially reflecting nutrient competition or reduced input rates under mixed vegetation.

3.2. Soil Enzymatic Activity

As shown in Table 3, urease (UE) activity exhibited the widest variation among all measured soil enzymes, ranging from 121.48 to 406.67 mg·g−1·d−1. This was followed by sucrase (SC; 7.38–15.41 mg·g−1·d−1) and alkaline phosphatase (ALP; 0.75–23.65 mg·g−1·d−1), while catalase (CAT) showed the lowest activity across treatments (0.40–0.64 mg·g−1·d−1). UE activity in W5 was significantly higher than that in other treatments (p < 0.05) and was approximately 2.35 times greater than that in W3 (121.48 mg·g−1·d−1), possibly due to enhanced plant–soil–microbe interactions. Similarly, ALP activity was markedly elevated in W5, reaching 23.65 mg·g−1·d−1—more than 30 times higher than in W3, which recorded the lowest value (0.75 mg·g−1·d−1). This suggests that microbial communities in the E. phyllopogon rhizosphere may strongly promote phosphorus-cycling enzyme activity. SC activity was also significantly higher in W3 (14.35 mg·g−1·d−1) and W5 (15.41 mg·g−1·d−1) compared to other treatments (p < 0.05). Notably, despite the lowest available P level observed in W5, the elevated SC activity may reflect a microbial strategy to mobilize phosphorus under conditions of limited availability. CAT activity was relatively higher in W1 and W3, suggesting enhanced oxidative stress response and microbial metabolic activity in these soils [27].
Overall, the E. phyllopogon community demonstrated strong potential to enhance soil enzymatic activity, which may in turn improve microbial-mediated processes such as protein and carbohydrate metabolism.

3.3. Composition of Soil Bacterial Community

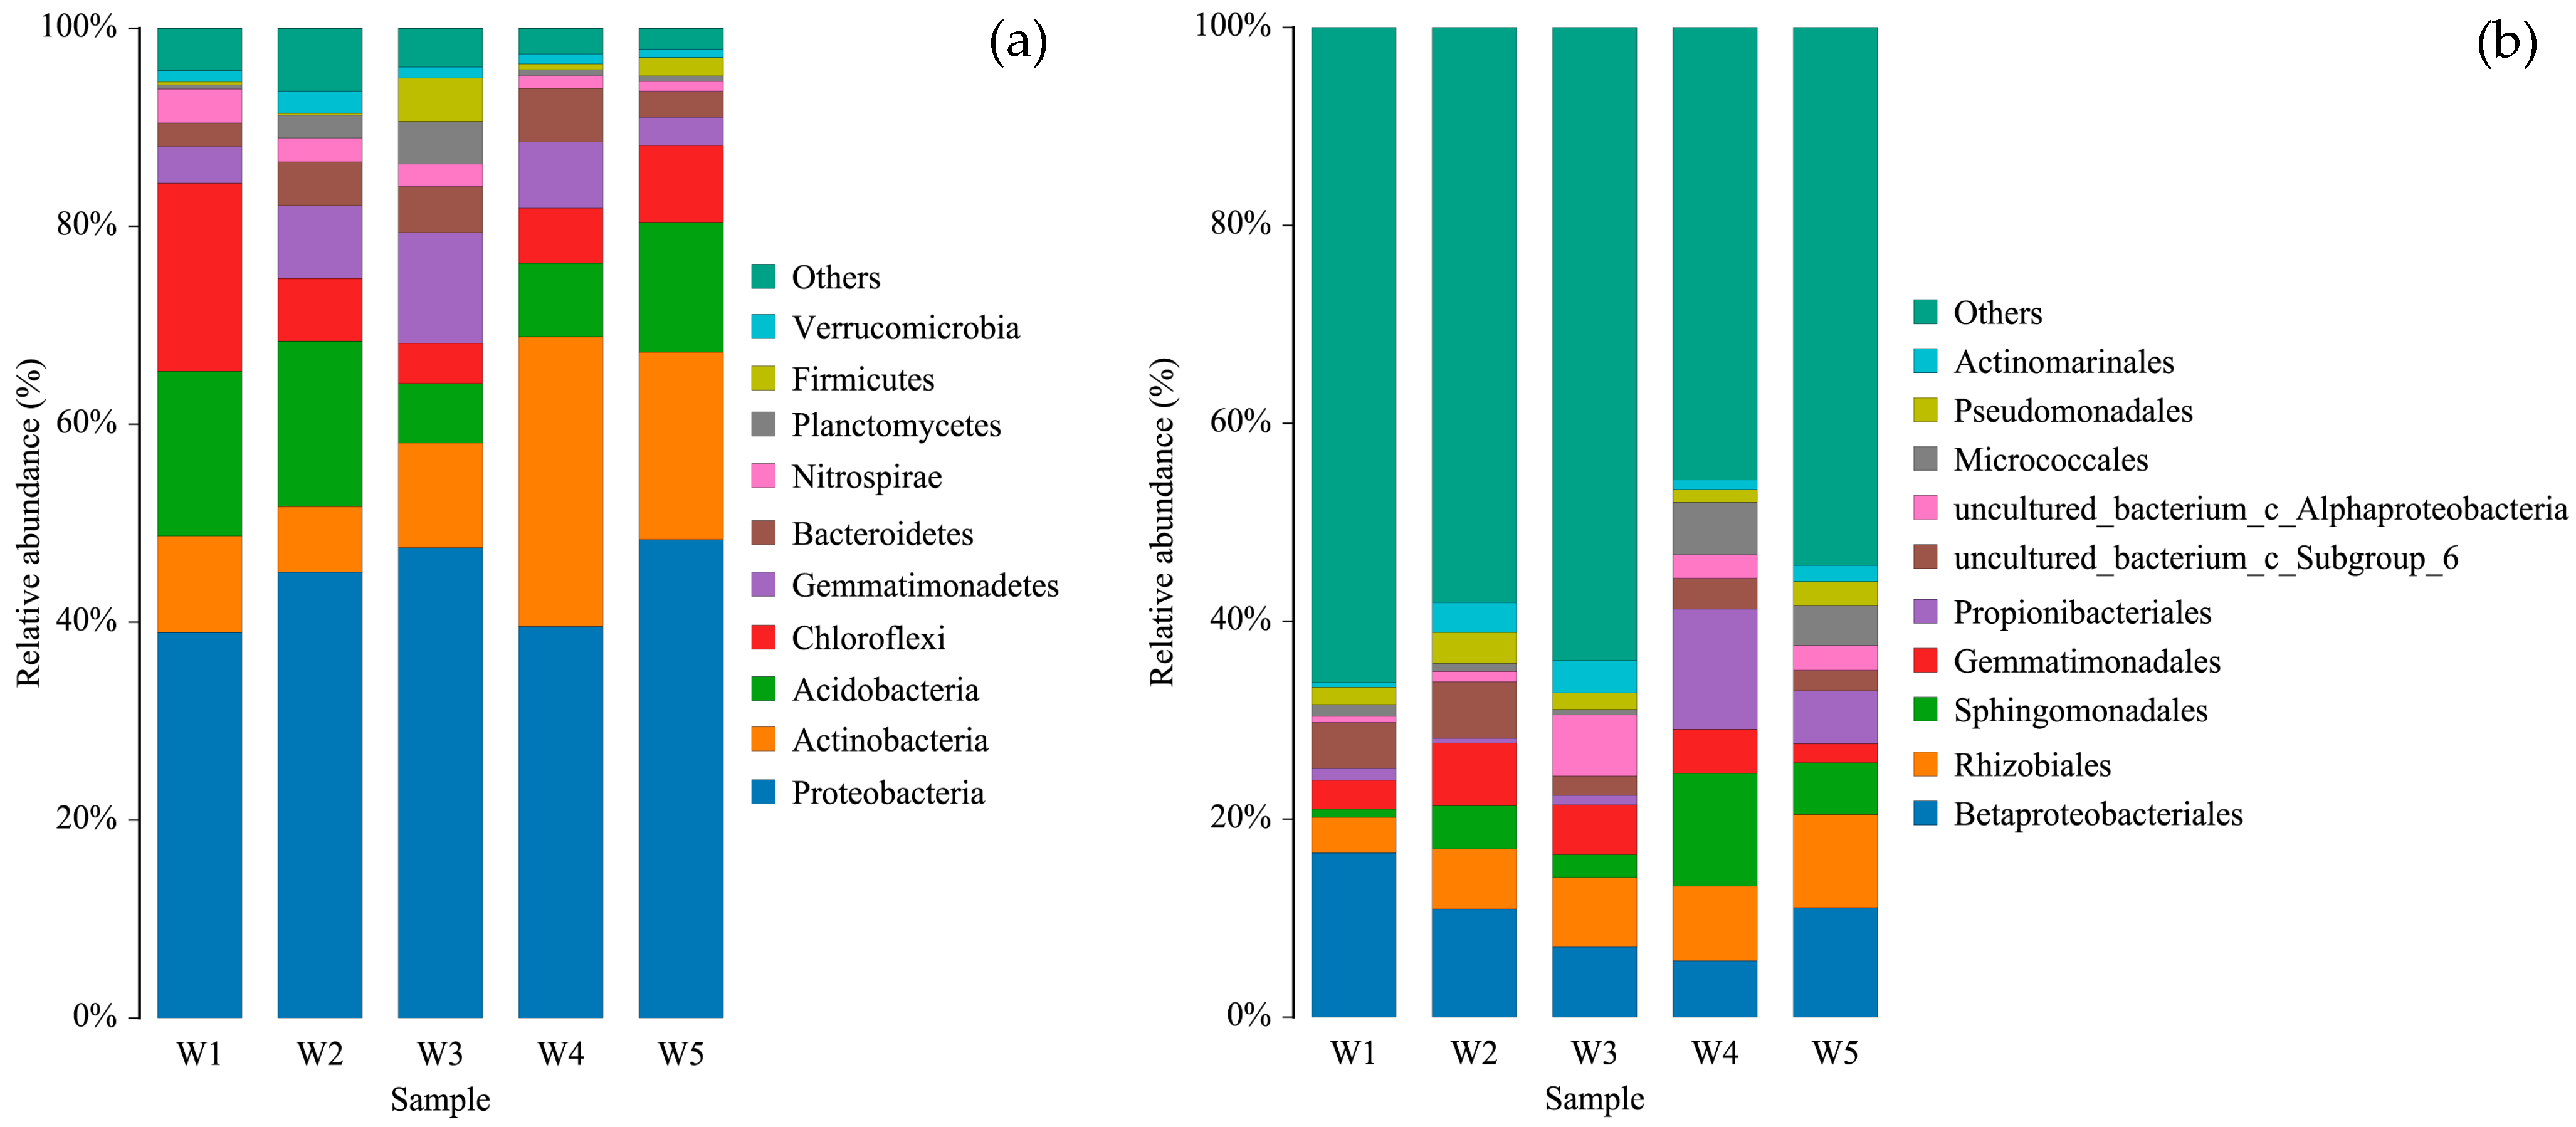
Based on 16S rRNA gene sequencing, a total of 28 phyla, 83 classes, 198 orders, 322 families, 498 genera, and 520 species were identified across all soil samples. At the phylum level (Figure 3a), Proteobacteria were the most dominant group, with an average relative abundance of 43.9%, followed by Actinobacteria, Acidobacteria, Chloroflexi, Gemmatimonadetes, Bacteroidetes, Nitrospirae, Planctomycetes, Firmicutes, and Verrucomicrobia. These ten phyla collectively accounted for over 90% of the bacterial community composition in each vegetation type, with total relative abundance values of 95.7%, 93.7%, 96.1%, 97.4%, and 97.9% for W1 to W5, respectively, indicating a relatively stable microbial structure among the wetland soils. Gemmatimonadetes exhibited the lowest relative abundance in W5 (2.87%). Significant variations were observed in the relative abundances of Actinobacteria, Acidobacteria, and Chloroflexi among vegetation types (p < 0.05). Actinobacteria were particularly enriched in W4 (29.27%), significantly higher than in the other treatments. In contrast, Acidobacteria and Chloroflexi showed their lowest relative abundances in W3, at 6.01% and 4.08%, respectively.
The highest abundance of Proteobacteria was detected in W5 (48.3%), potentially associated with increased SC, TOC, and AN content. Although Proteobacteria abundance in W3 was similar (47.5%), the lower SC activity observed in this treatment might have contributed to reduced TOC levels. At the order level (Figure 3b), 198 taxa were detected, with significant differences (p < 0.05) among vegetation types. The predominant bacterial orders included Betaproteobacteriales (10.27%), Rhizobiales (6.72%), Sphingomonadales (4.84%), Gemmatimonadales (4.12%), and Propionibacteriales (4.03%). The highest relative abundance of Betaproteobacteriales occurred in W1 (16.59%), while Rhizobiales showed the lowest proportion (3.59%) across all treatments. Sphingomonadales peaked in W4 (11.40%), and Gemmatimonadales were most abundant in W2 (6.33%) but decreased to 1.91% in W5.
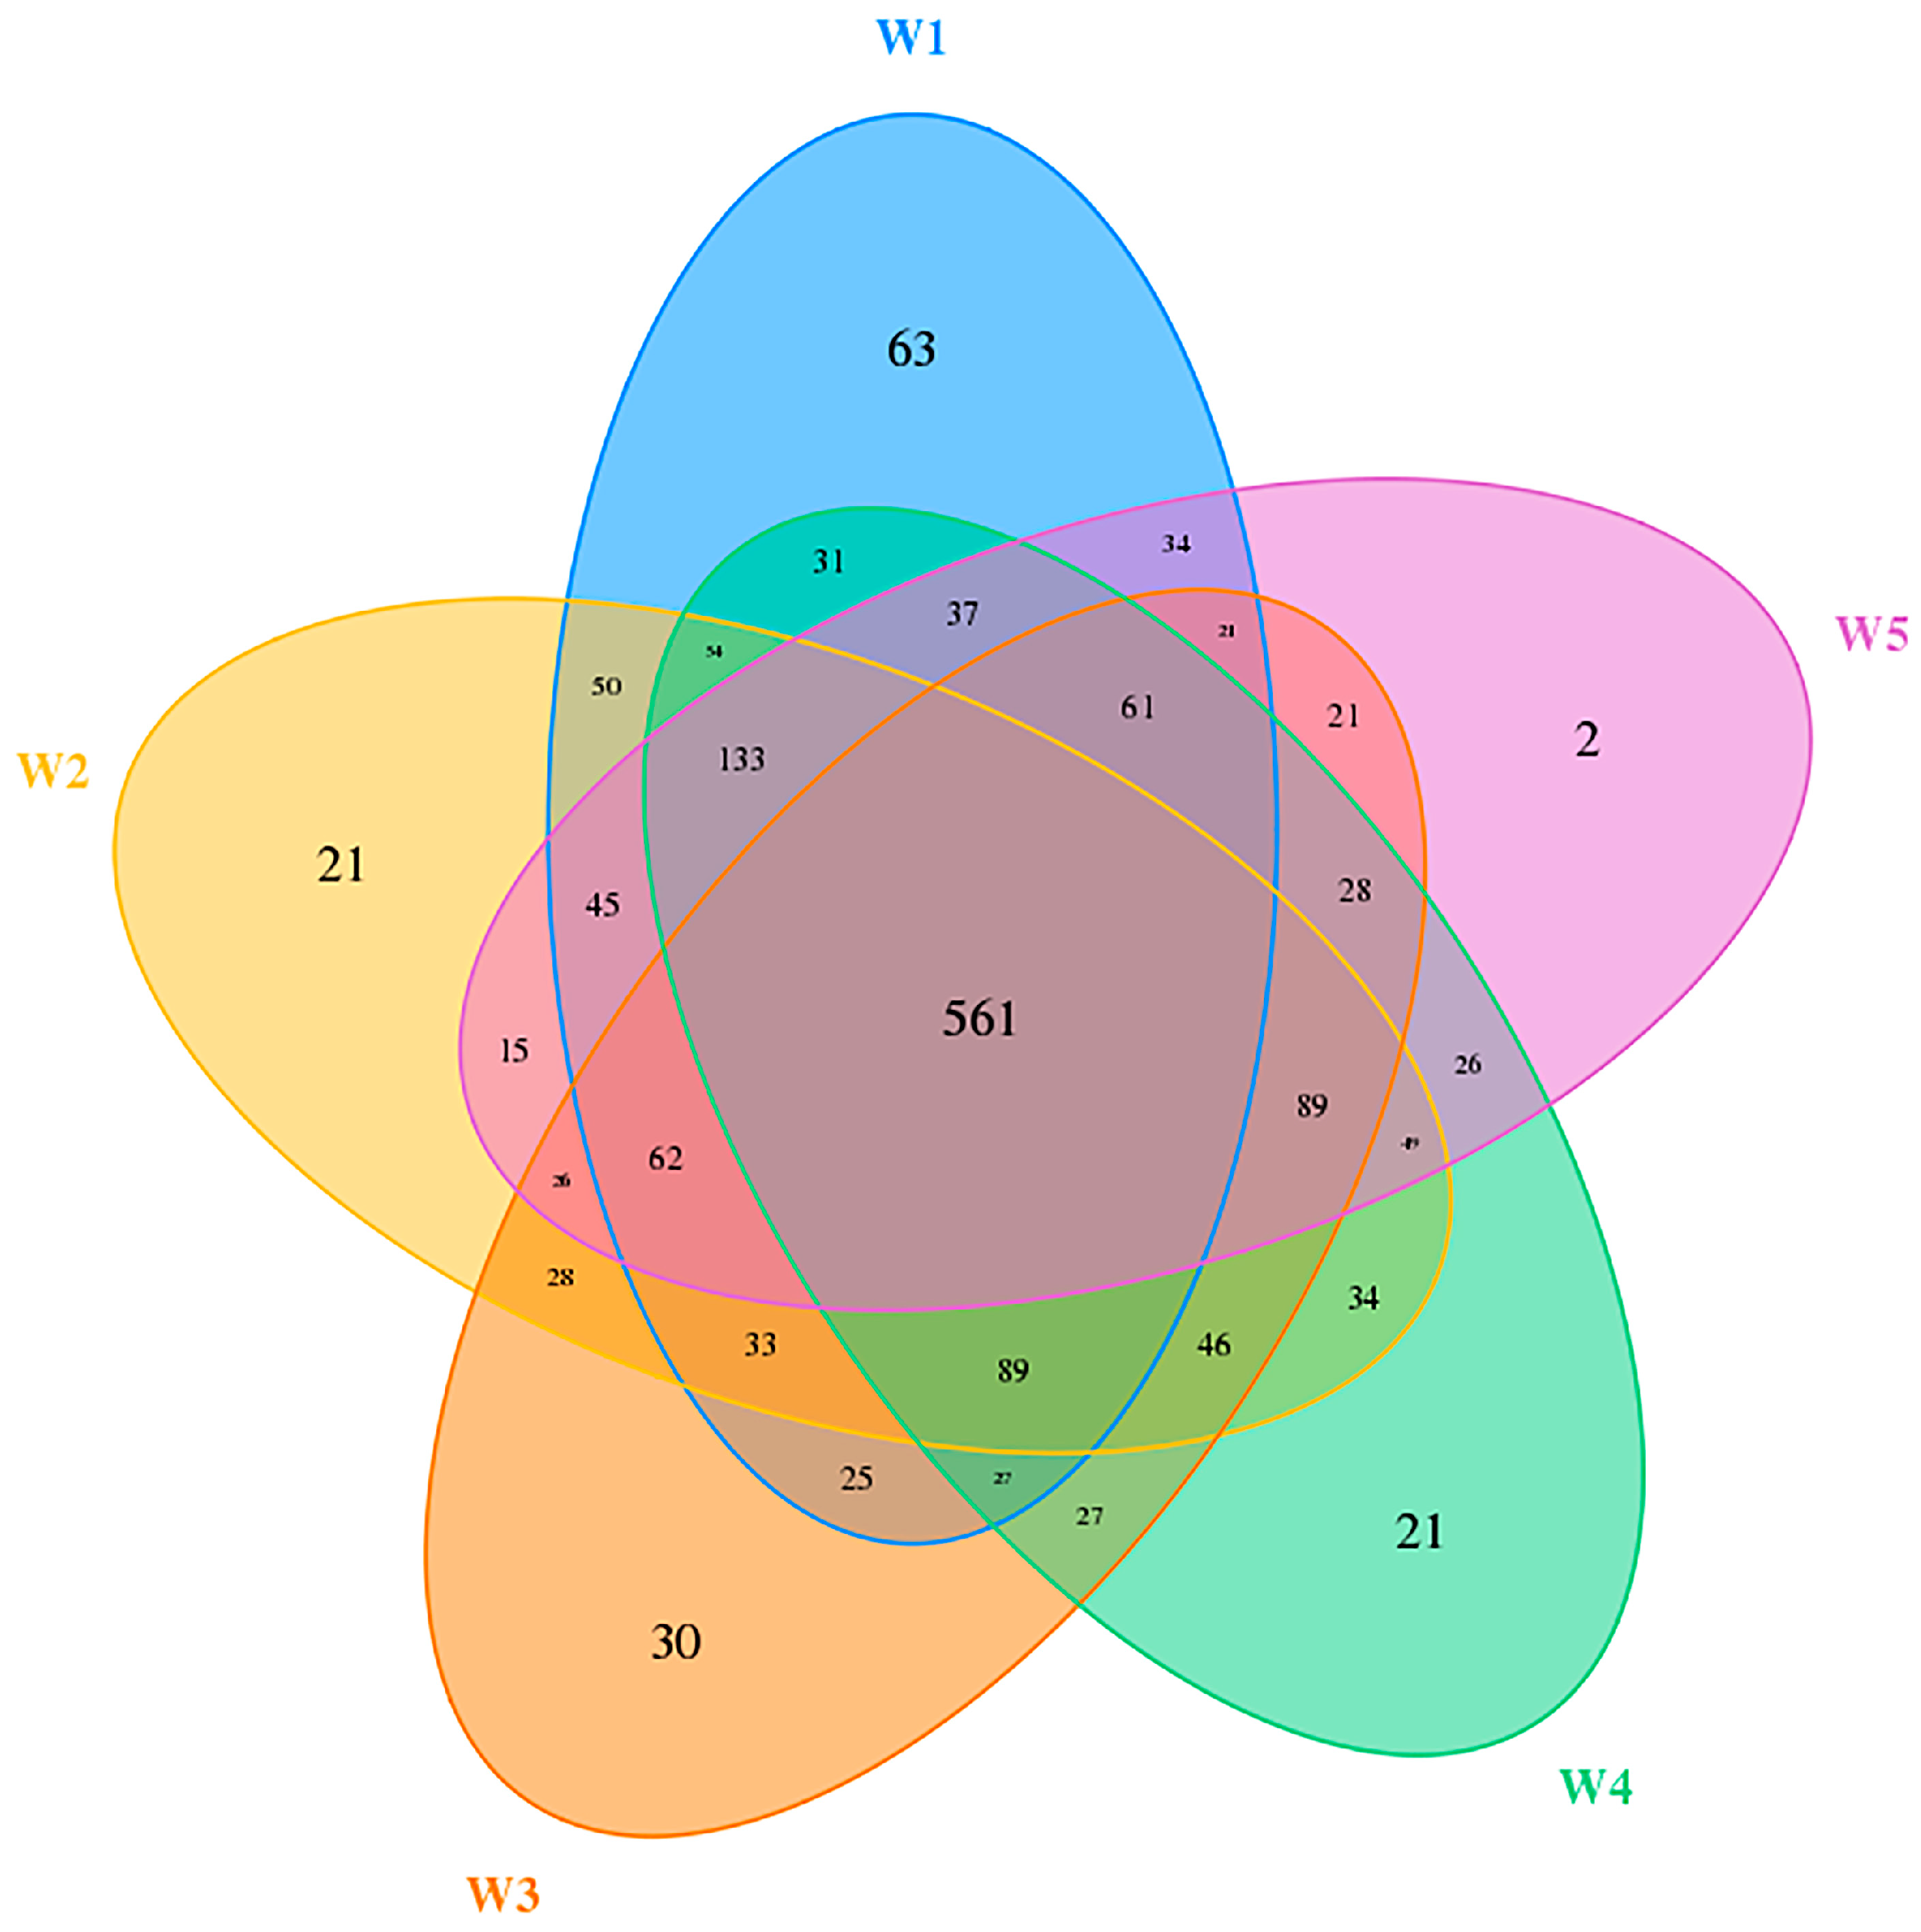
To further investigate the uniqueness and overlap of bacterial taxa among vegetation types, Venn diagrams were used to visualize the distribution of operational taxonomic units (OTUs) (Figure 4). A total of 561 OTUs were shared across all treatments. The number of unique OTUs was highest in W1 (63), followed by W3 (30), while W2 and W4 each contained 21 unique OTUs. W5 had the fewest unique OTUs, with only two detected.

3.4. Soil Bacterial Diversity

High-throughput sequencing generated a total of 50,000 raw reads for each of the five vegetation treatments, except for W5, which yielded 19,998 reads. After quality filtering, clean reads amounted to 47,778 (W1), 47,787 (W2), 47,492 (W3), 47,558 (W4), and 19,026 (W5), respectively. The observed number of operational taxonomic units (OTUs) ranged from 1174 to 1335. Coverage values for W1 through W4 exceeded 0.99, indicating that the sequencing depth was sufficient to represent the majority of bacterial communities present. Although the coverage of W5 was slightly lower (0.97), it still adequately reflected the microbial composition (Table 4).
Diversity indices further revealed clear differences among treatments. The ACE index suggested relatively high and consistent bacterial richness across all samples, while Simpson’s index values, approaching 1, indicated high evenness. According to the Chao1 estimator, bacterial richness was significantly higher in W1, W2, and W4 compared to W3 and W5, implying that plant community complexity positively influenced soil microbial richness.
Although the Shannon and Simpson indices displayed similar trends, they revealed nuanced differences in bacterial diversity. The highest Shannon diversity was observed in W5, followed by W1, W2, W3, and the lowest in W4. These findings suggest that both vegetation identity and plant–plant interactions play essential roles in shaping microbial diversity in saline wetland soils.
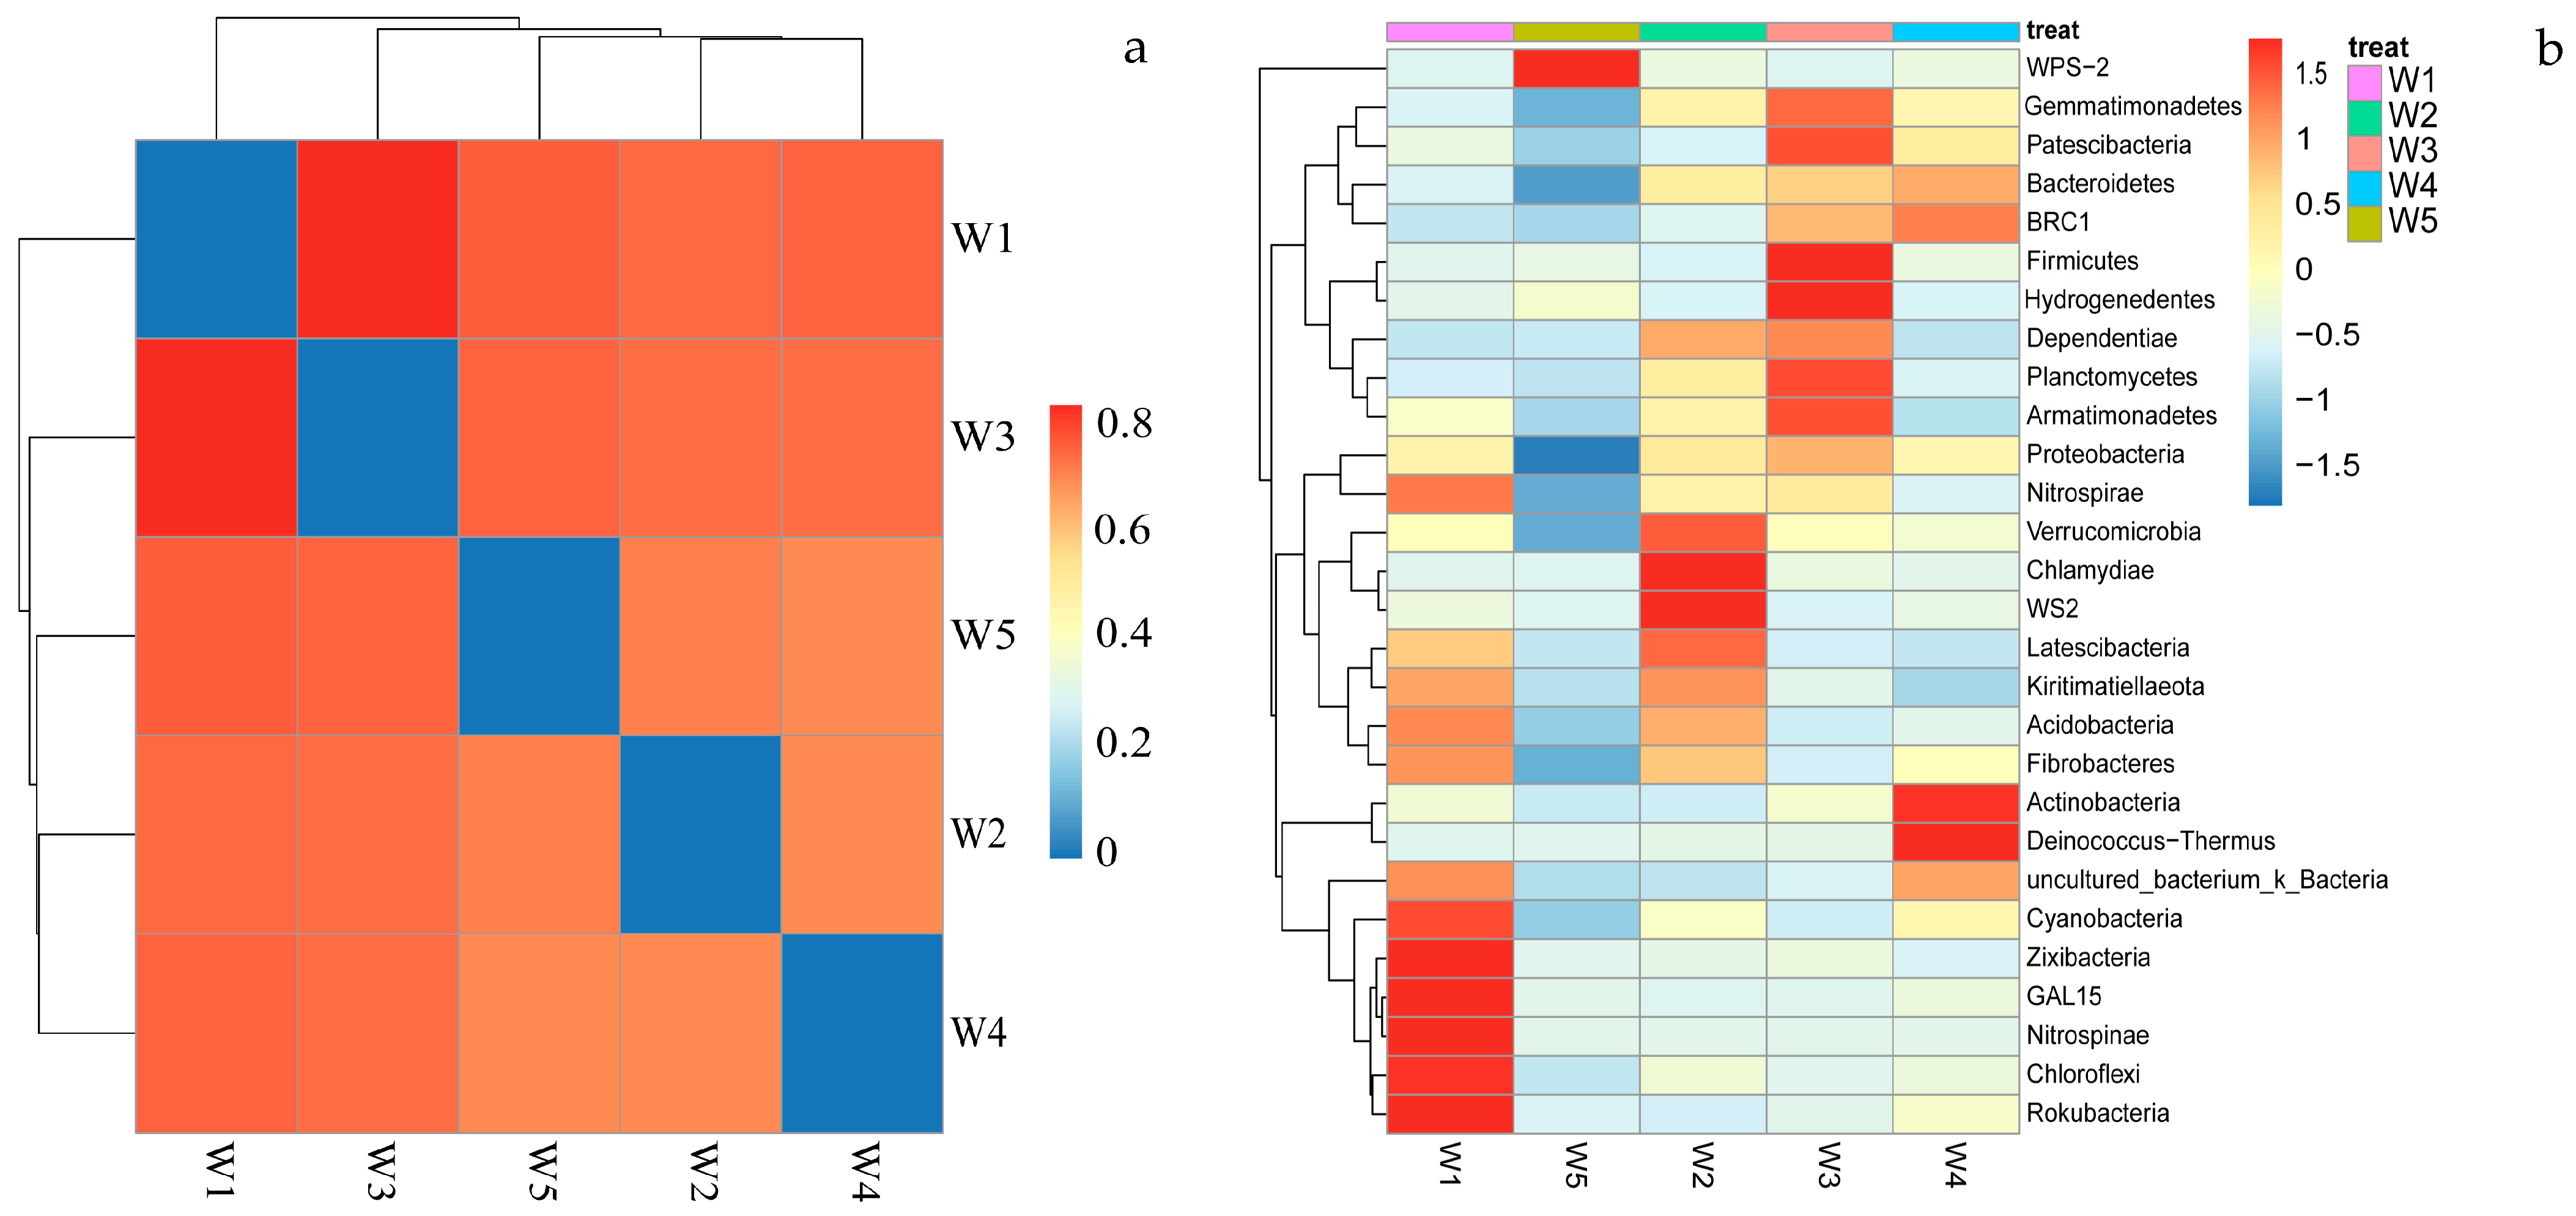
In the heatmap analysis (Figure 5a), the soil bacterial communities in W2 and W4 appeared to cluster more closely, suggesting a degree of compositional similarity under the influence of Phragmites communis. In contrast, W1 and W3 showed marked dissimilarity, indicating that the addition of Bryophyta to P. communis soil led to considerable shifts in microbial composition, likely due to synergistic effects between the two plant types. Heatmap visualization based on the 28 most abundant bacterial phyla (Figure 5b) revealed distinct phylum-level dominance patterns across treatments. In W1, the dominant taxa included Rokubacteria, Chloroflexi, Nitrospinae, GAL15, Zixibacteria, and Cyanobacteria. WPS-2 was most enriched in W5, whereas W2 was primarily dominated by WS2 and Chlamydiae. In W3, Firmicutes and Hydrogenedentes were the most prominent, while Deinococcus–Thermus and Actinobacteria exhibited the highest relative abundance in W4. These findings indicate that different vegetation assemblages exert strong selective pressures on soil microbial composition at the phylum level, reflecting both plant-specific influences and potential functional differentiation among microbial communities.

3.5. Correlation Between Soil Bacterial Communities, Enzymes, and Soil Chemical Properties

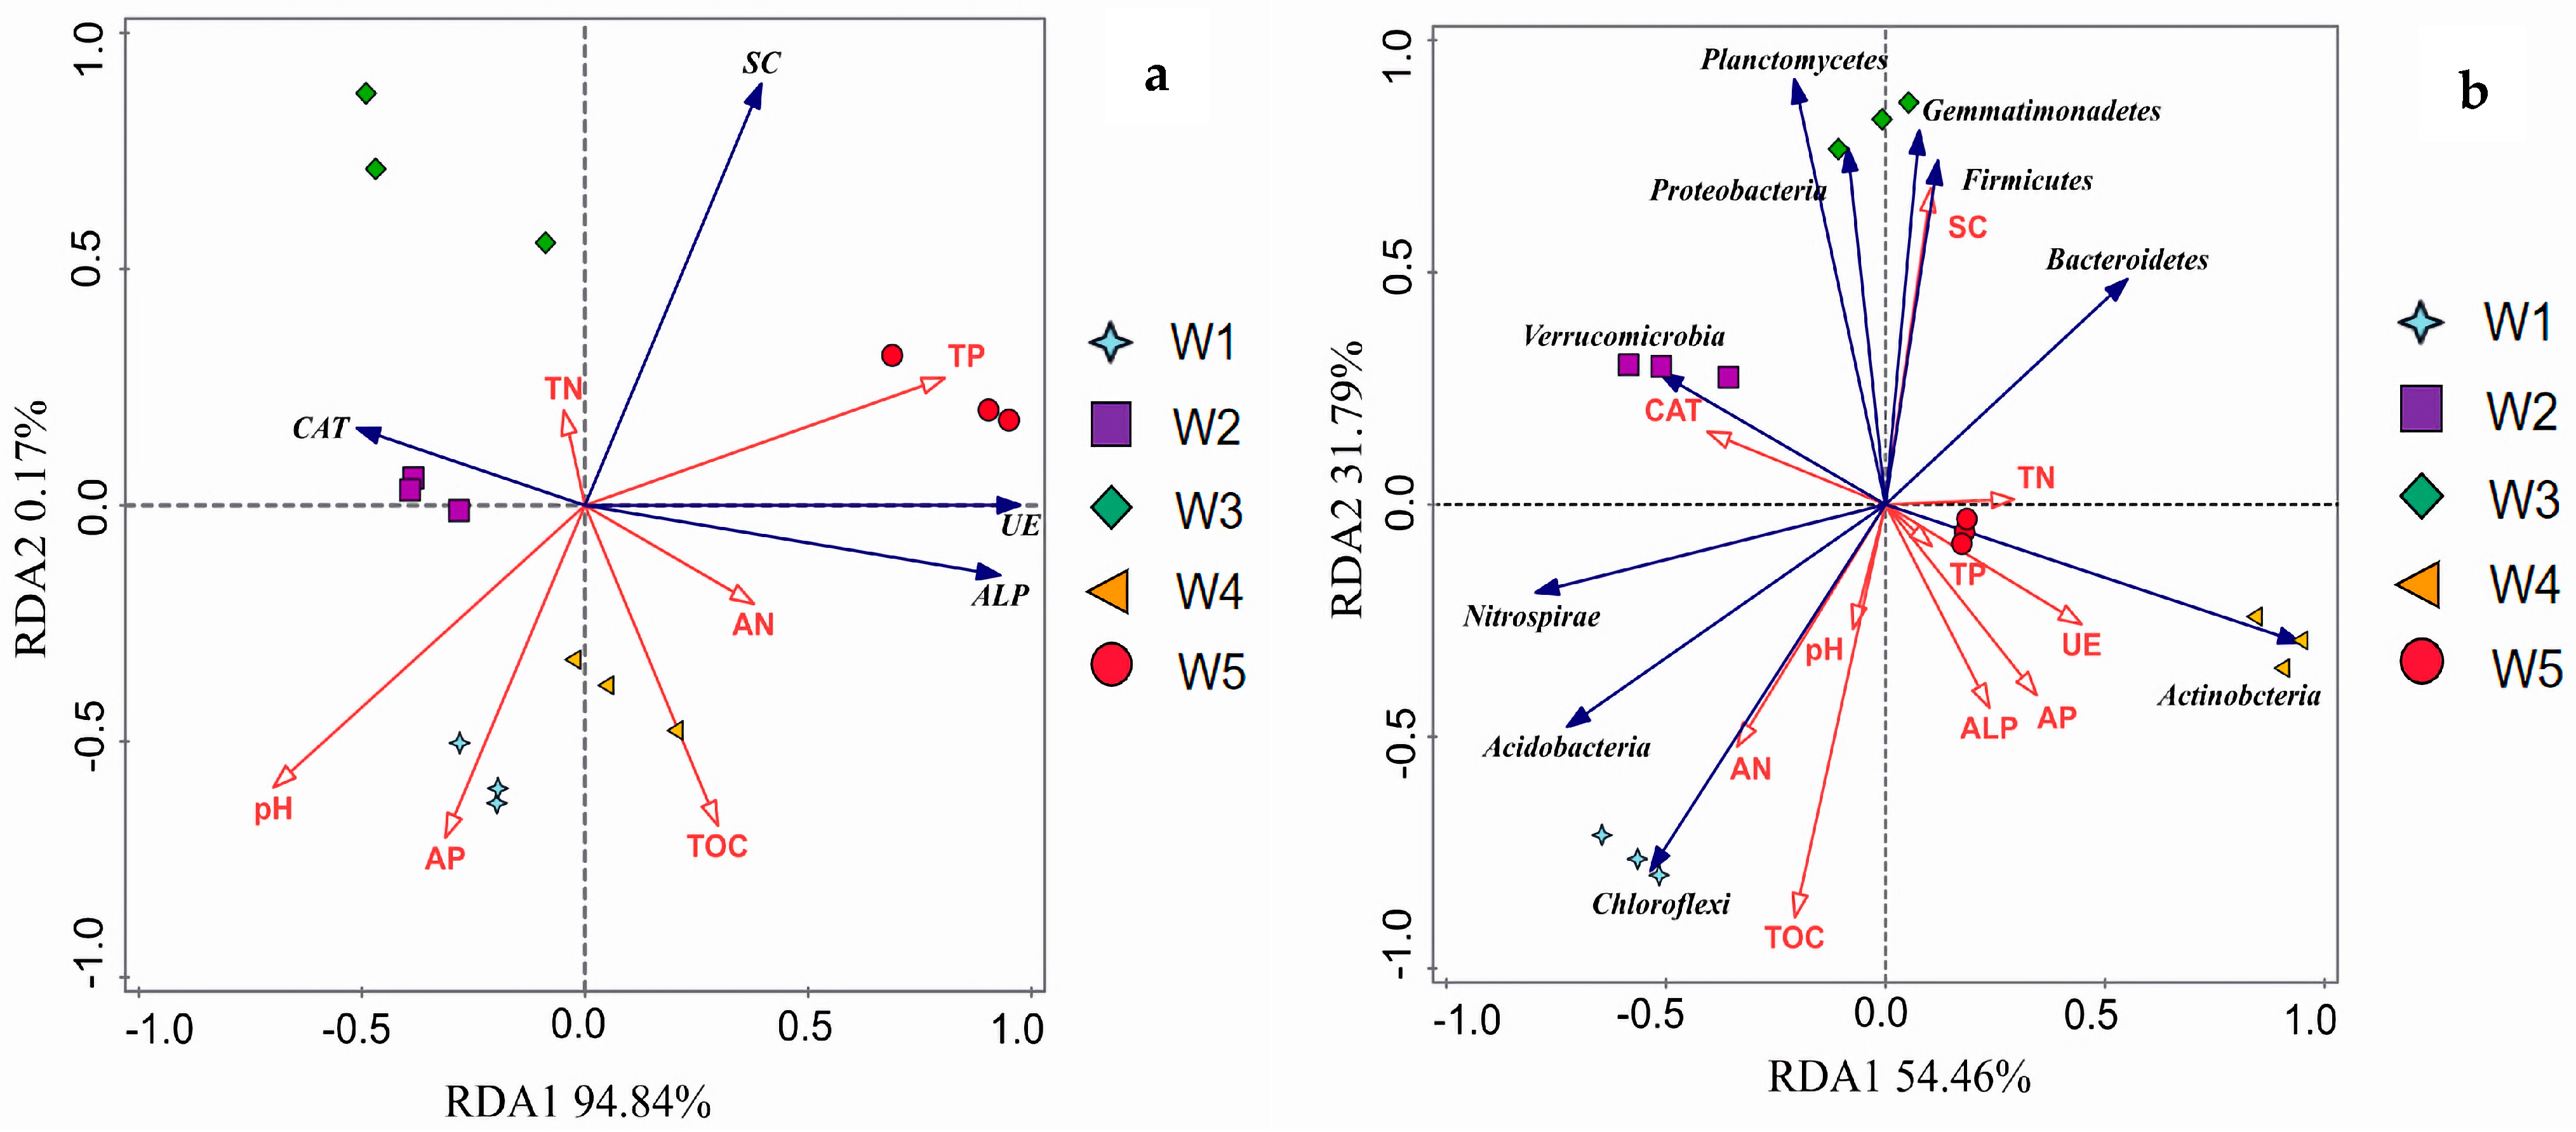
Soil enzymatic activities and microbial community composition are key indicators for assessing ecosystem restoration and soil functional improvement. As shown in Figure 6a, the redundancy analysis (RDA) revealed that the first and second axes explained 94.84% and 0.17% of the total variation, respectively, indicating that the first axis captured the major trends in the dataset. Among soil chemical properties, total phosphorus (TP) was strongly associated with treatment W5 and showed a close correlation with urease (UE) activity. Alkali-hydrolyzable nitrogen (AN) was more strongly correlated with alkaline phosphatase (ALP) activity. Figure 6b illustrates the relationships among bacterial phyla, soil enzymes, and chemical variables. Gemmatimonadetes was positively associated with sucrase (SC) activity, while Firmicutes also showed a strong response to SC. Chloroflexi was closely linked to AN and appeared to be particularly influenced by W5. Verrucomicrobia was more strongly related to catalase (CAT) activity, whereas Actinobacteria showed a closer correlation with UE and were primarily associated with W4.
These findings suggest that distinct bacterial taxa are selectively enriched under specific vegetation conditions, and their abundance is significantly shaped by soil nutrient status and enzymatic activities, reflecting tight plant–soil–microbe interactions in saline wetland ecosystems.
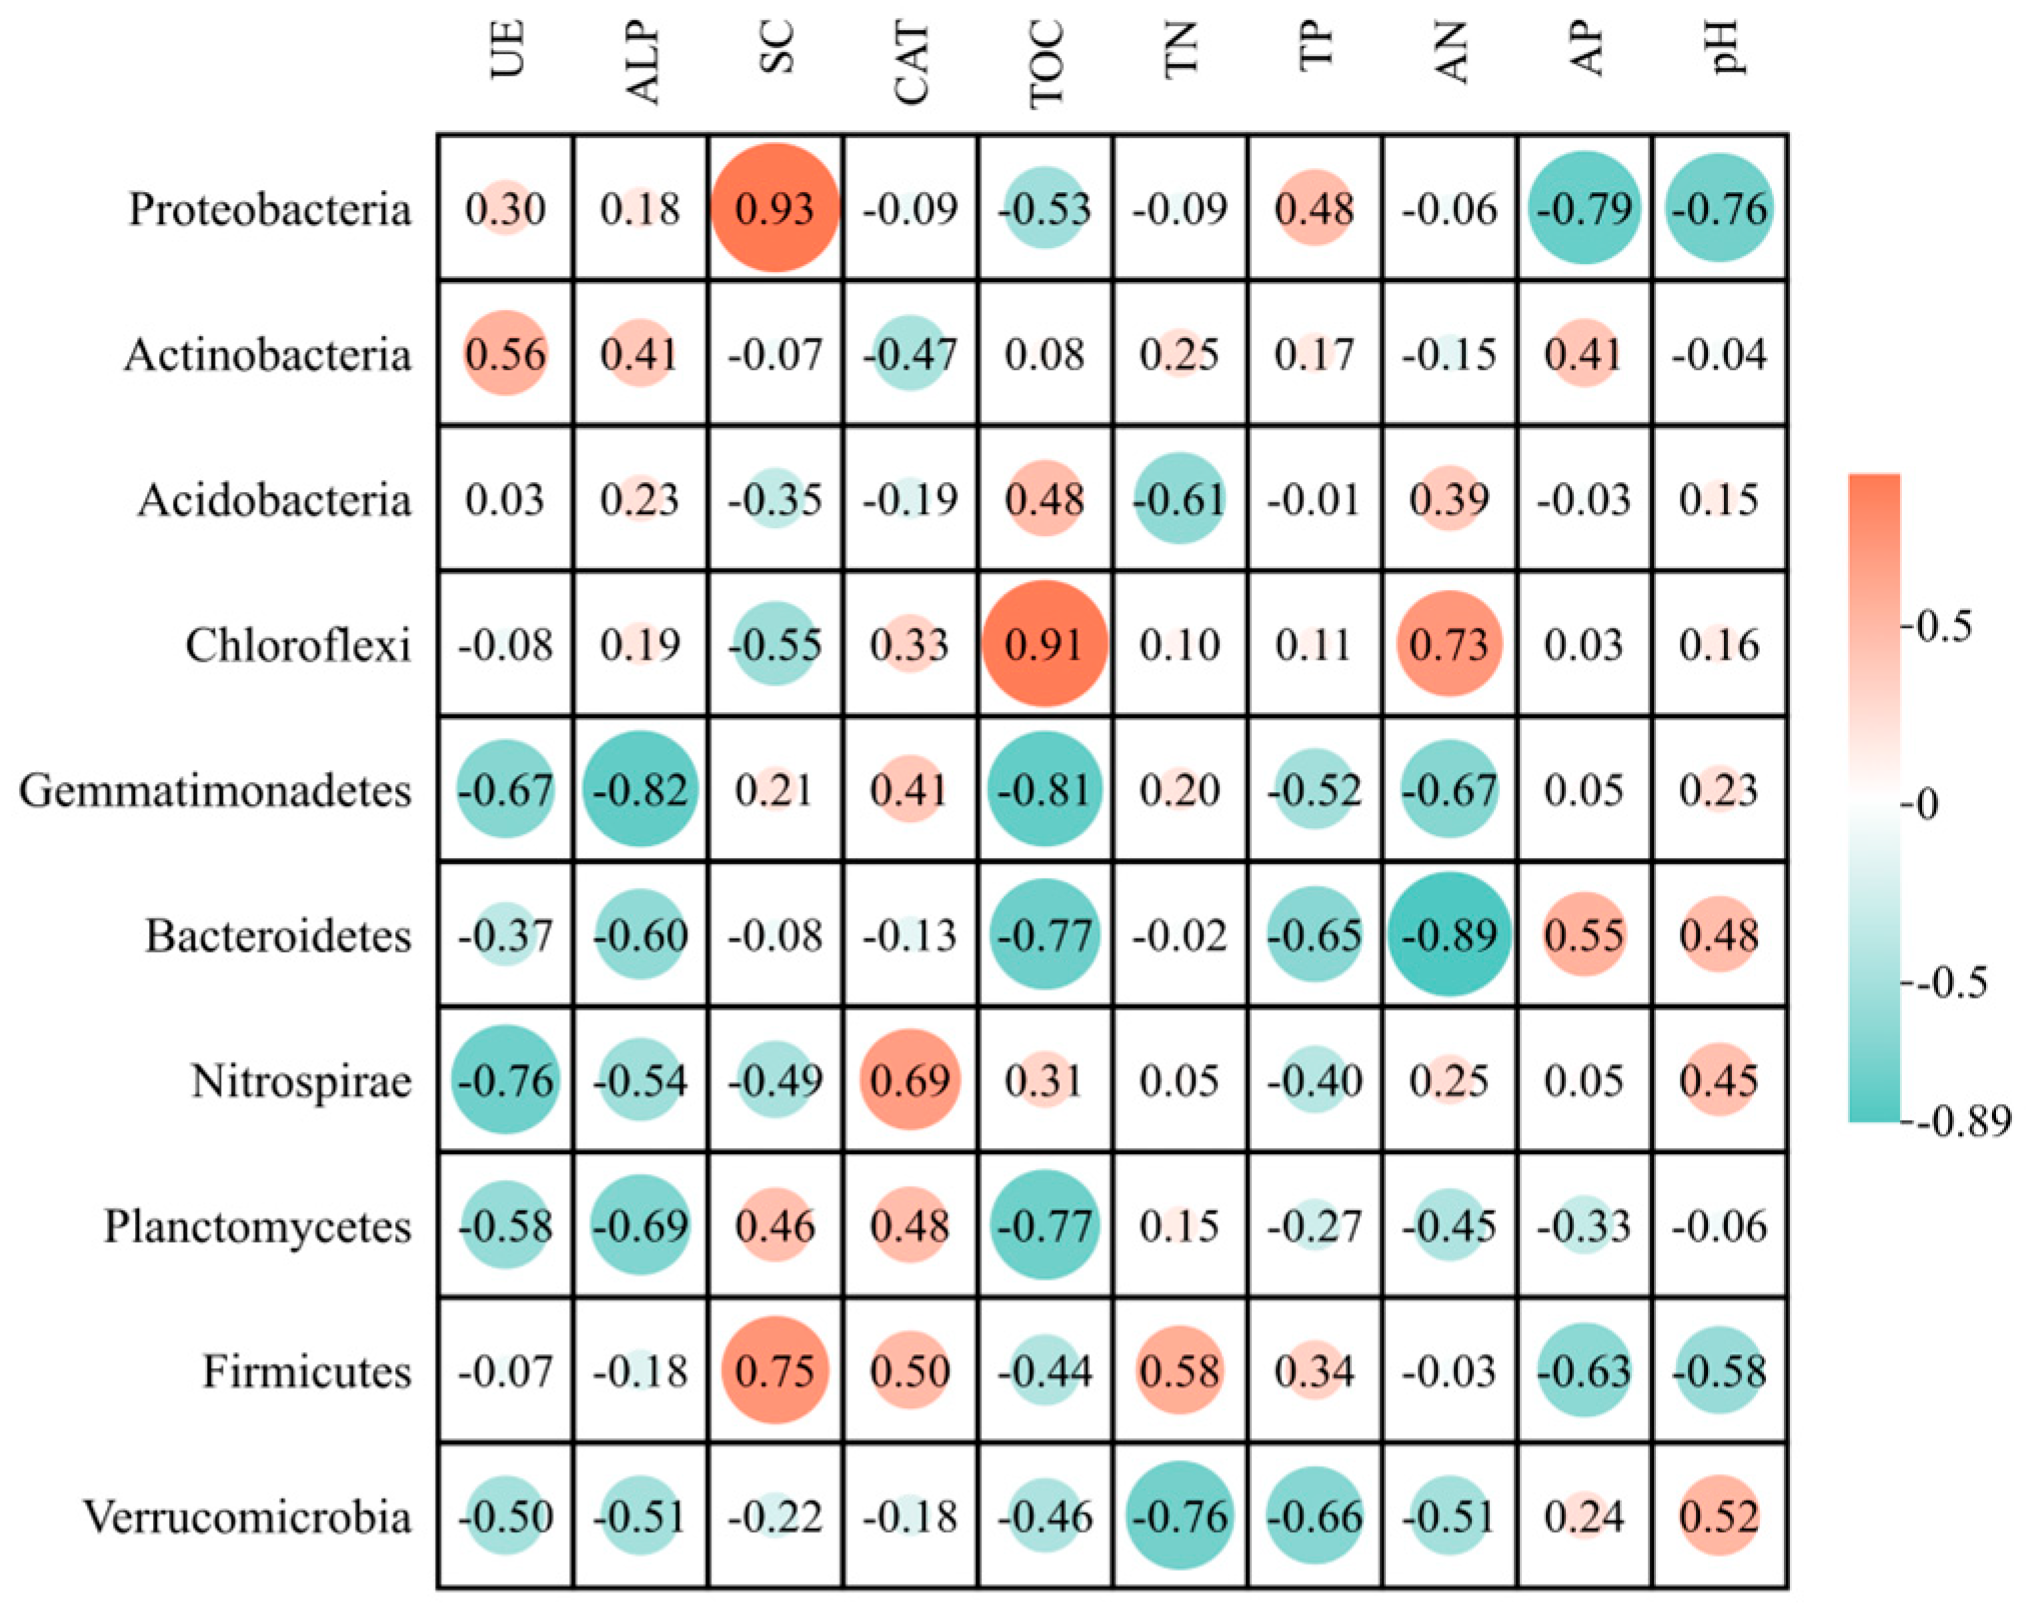
Correlation analysis of soil bacterial communities and environmental factors across different vegetation types in the Chagan Lake wetland revealed several significant relationships at the phylum level (Figure 7). Gemmatimonadetes exhibited a significant negative correlation with both soil alkaline phosphatase (ALP) activity and total organic carbon (TOC) (p < 0.05). In contrast, Proteobacteria and Firmicutes were significantly positively correlated with soil sucrase (SC) activity (p < 0.05), suggesting their potential involvement in soil carbon cycling processes. Chloroflexi showed a significant positive correlation with TOC (p < 0.05), indicating its possible contribution to organic matter turnover. Conversely, Bacteroidetes were negatively correlated with alkali-hydrolyzable nitrogen (AN) (p < 0.05), suggesting a potential sensitivity to nitrogen availability.
These findings underscore the strong linkages between vegetation-mediated shifts in soil conditions and the structure and function of microbial communities, highlighting the role of specific bacterial taxa in driving nutrient cycling in saline wetland ecosystems.

3.6. Integrated Summary of Findings

Overall, this study demonstrated that vegetation treatments at the forest–wetland ecotone substantially influenced soil nutrient dynamics, enzymatic activities, and microbial communities in the saline wetlands of Chagan Lake. Across treatments, soils under W5 generally exhibited lower pH and elevated organic carbon content, conditions favoring increased activities of enzymes such as urease and alkaline phosphatase. Microbial alpha diversity, reflected by ACE and Chao1 indices, was strongly associated with vegetation composition, while distinct shifts in Shannon diversity indicated changes in community evenness across plant covers.
High-throughput sequencing revealed Proteobacteria as the dominant bacterial phylum throughout, yet with notable adjustments in the relative abundances of Actinobacteria, Acidobacteria, and Chloroflexi among treatments, highlighting the role of vegetation-driven soil modifications in shaping microbial assemblages. Redundancy analyses further underscored tight associations between key soil parameters (e.g., TOC, AP, pH) and specific bacterial taxa.
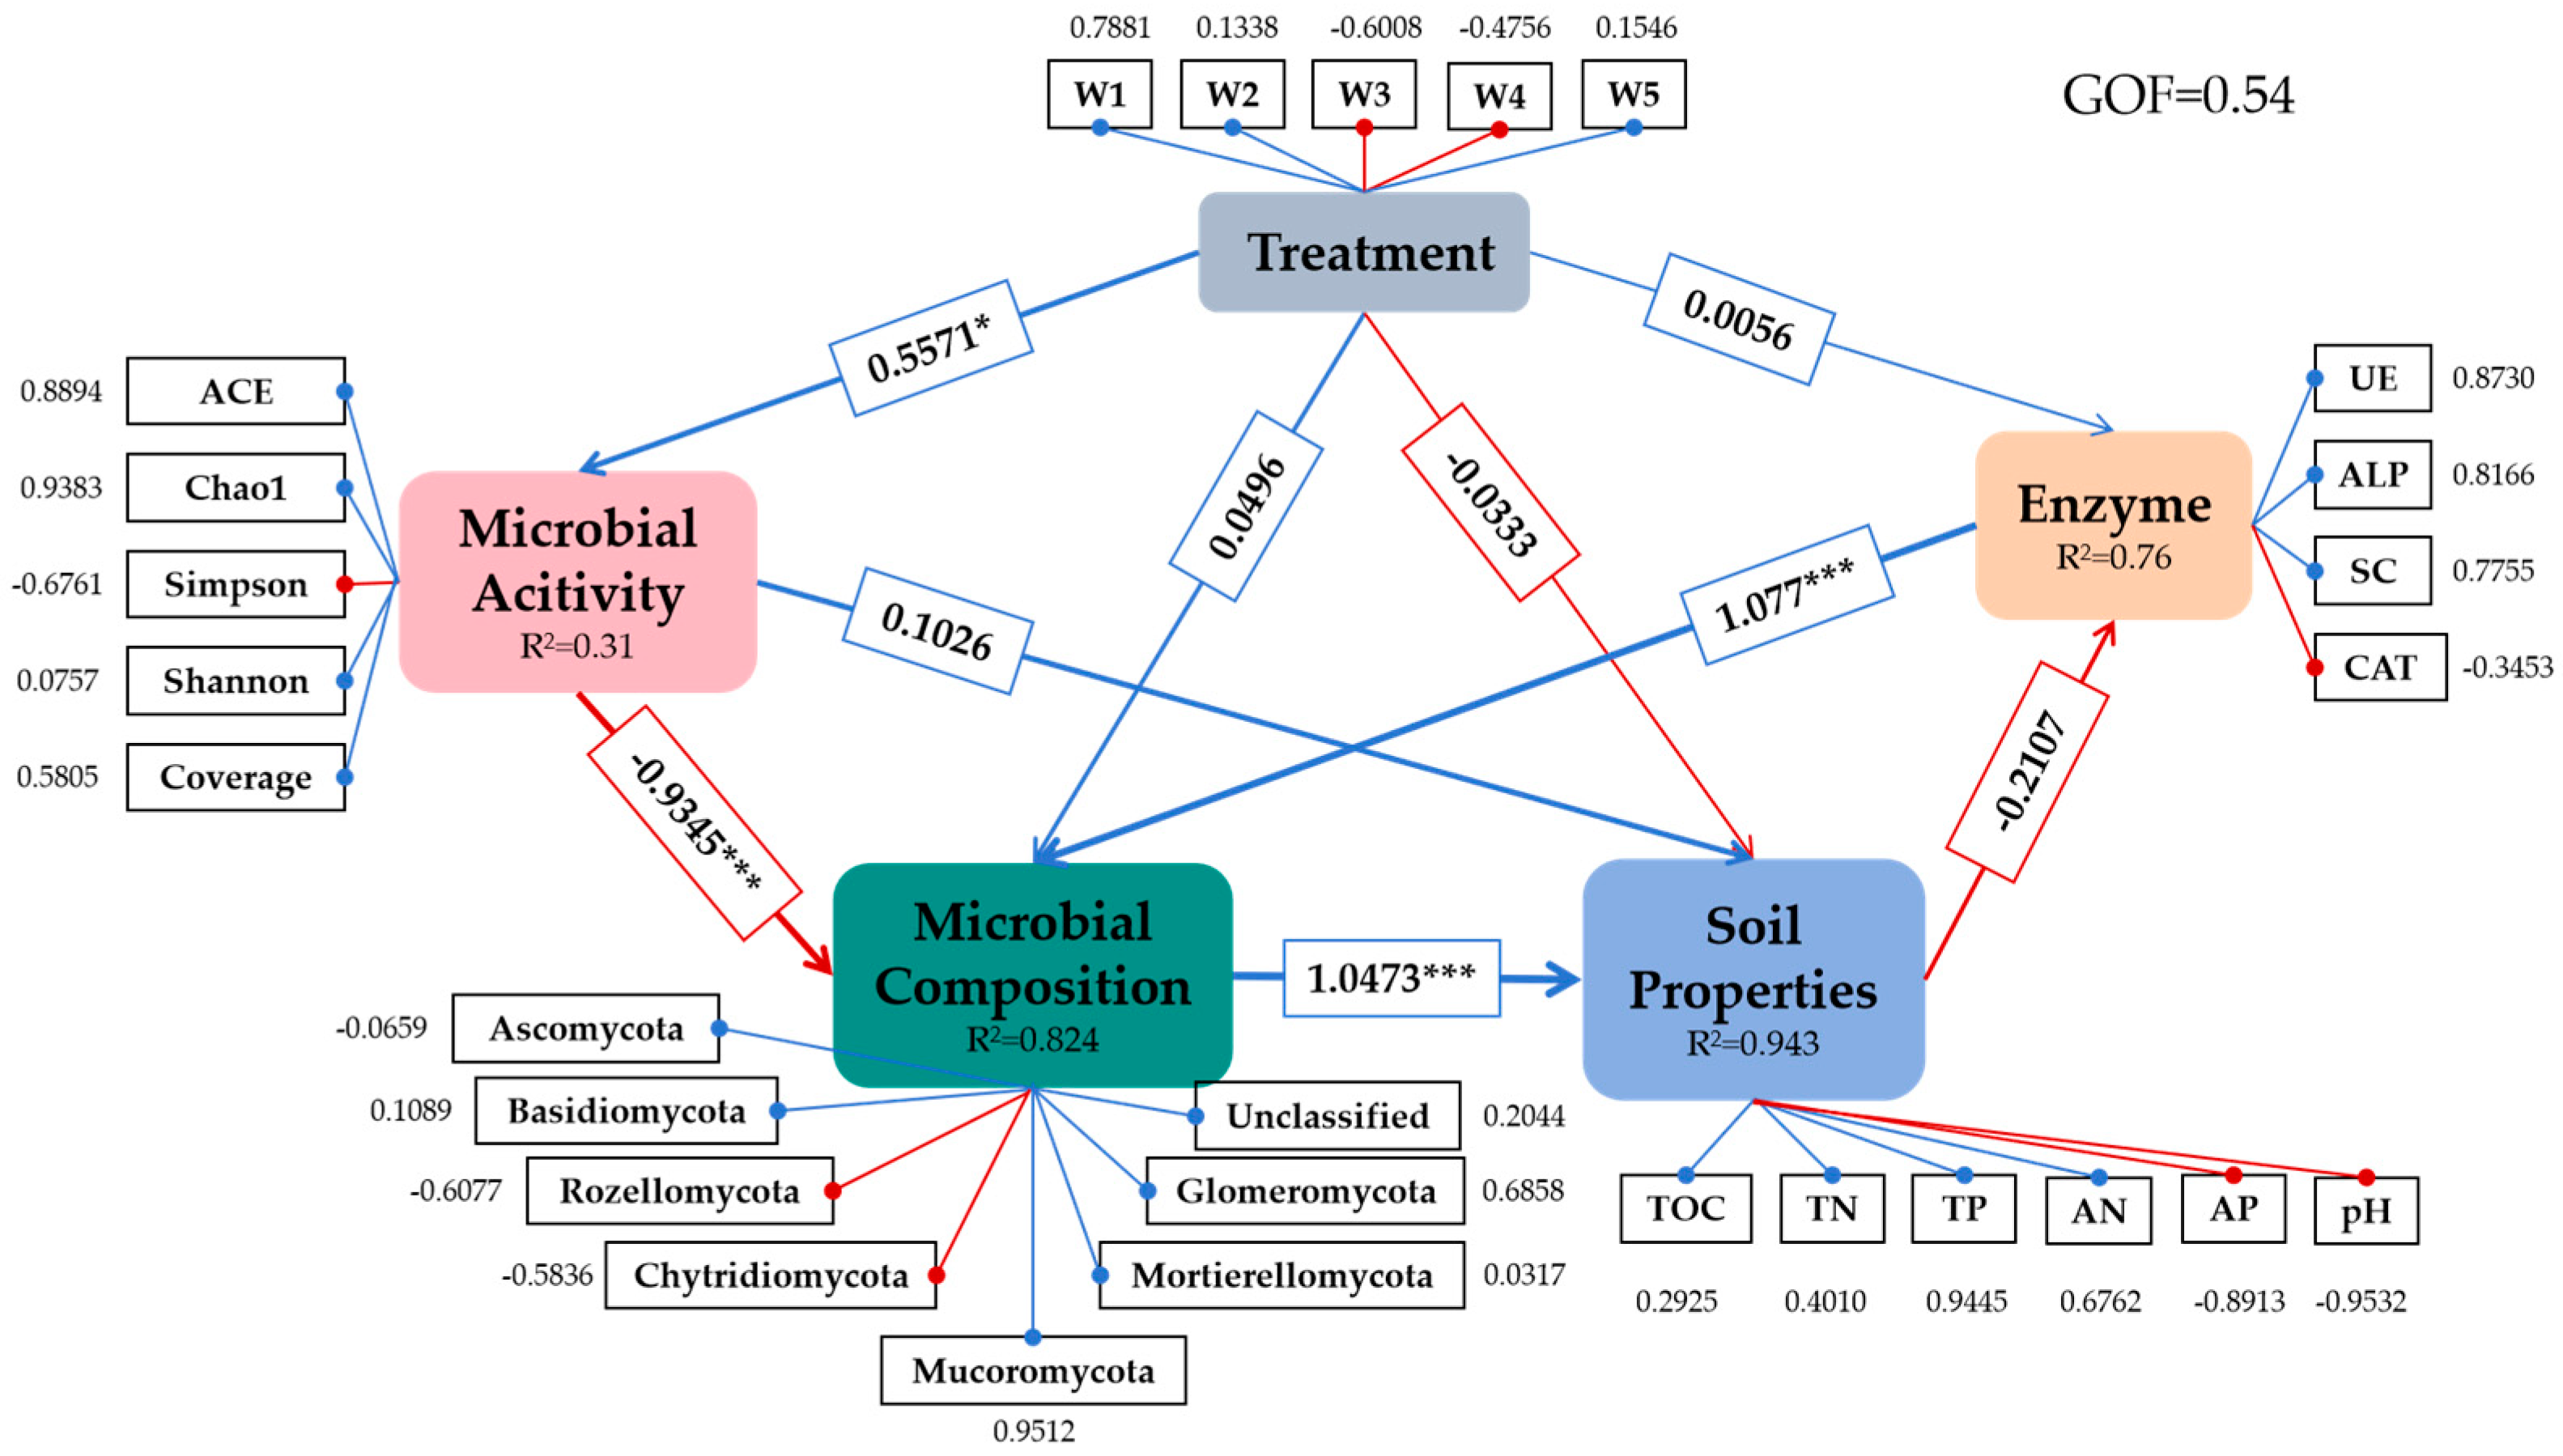
Critically, partial least squares structural equation modeling (PLS-SEM) integrated these multi-layered datasets and unveiled a well-structured model (GOF = 0.54) capturing complex interdependencies. The model explained 82.4% of the variance in microbial community composition (R2 = 0.82), 94.3% of the variance in soil physicochemical properties (R2 = 0.94), and 75.9% in enzyme activities (R2 = 0.76), indicating robust explanatory power (Figure 8).
Notably, microbial activity indices (ACE, Chao1, Simpson, Shannon, Coverage) exhibited a strong direct negative effect on microbial community composition (β = −0.93, p < 0.001), suggesting that shifts in microbial diversity metrics were closely linked to changes in the dominant community structures under different vegetation regimes. In turn, microbial composition had a pronounced positive impact on soil physicochemical properties (β = 1.05, p < 0.001), underscoring the key role of microbial assemblages in modulating organic matter dynamics and nutrient cycling in saline soils. Furthermore, microbial composition exerted a substantial positive direct effect on enzymatic activities (β = 1.08), while soil properties displayed a modest negative direct relationship (β = −0.21), collectively accounting for the high variance explained in enzyme functions.

4. Discussion

4.1. Effects of Vegetation Type on Soil Nutrient Dynamics

Vegetation type is a key driver of soil nutrient dynamics, primarily through its influence on litter input, root exudates, and microenvironmental modification [28]. In the saline–alkaline wetlands of Chagan Lake, plant composition strongly shapes soil nutrient status by modulating pH, organic matter availability, and nutrient cycling. Soils under E. phyllopogon, for example, tend to exhibit reduced alkalinity, creating more favorable conditions for microbial activity and plant growth [29,30]. Elevated organic carbon and nitrogen under certain vegetation types are likely to enhance microbial diversity and activity, while variations in phosphorus availability reflect interactions between soil chemistry and nutrient cycling processes [31,32,33]. These observations highlight the dual role of vegetation in chemically buffering the soil environment and indirectly promoting microbial-mediated nutrient turnover, which is critical for maintaining soil functionality under saline–alkaline stress [34,35,36].
In addition, saline–alkaline conditions impose osmotic stress that reduces soil water potential, thereby limiting plant water uptake and altering rhizosphere processes [37]. Plants such as E. phyllopogon may mitigate this stress through osmolyte secretion and selective ion uptake, creating a microenvironment more favorable to microbial colonization [38]. These adaptations not only sustain plant growth but also facilitate microbial activity and nutrient turnover under osmotic constraints, emphasizing that vegetation effects on soil nutrients reflect both chemical buffering and stress alleviation mechanisms.

4.2. Influence of Soil Bacterial Community Structure on Soil Functional Properties

Soil microbial communities are key drivers of soil biogeochemical cycles, influencing organic matter decomposition, nutrient mineralization, and soil health [39]. High-throughput sequencing in this study showed that Proteobacteria were the most abundant phylum across the vegetation types examined, which is in line with some previous observations in saline–alkaline soils [40]. While it is acknowledged that specialized alkaliphilic and halophilic taxa typically thrive under strongly alkaline and saline conditions, Proteobacteria remained a dominant component in our samples. Members of this phylum are functionally diverse, with well-documented roles in nitrification, sulfur cycling, and denitrification, thereby contributing substantially to carbon and nitrogen turnover in these soils [41]. Proteobacteria are highly responsive to carbon-rich environments, indicating their critical role in mediating organic carbon turnover in saline–alkaline wetlands [42]. Actinobacteria contribute to nitrogen cycling through their enzymatic activities [43], while Acidobacteria appear to facilitate phosphorus availability under different vegetation types [44]. Chloroflexi may play a supporting role in carbon cycling, particularly under saline–alkaline stress, whereas certain groups, such as Bacteroidetes, might be sensitive to variations in nitrogen availability [45]. Overall, these patterns underscore that vegetation-mediated shifts in soil chemistry, including organic carbon, nitrogen, phosphorus, and pH, strongly influence microbial community structure and functionality [46]. Such interactions highlight the integrative role of plant–microbe feedback in maintaining nutrient cycling and soil ecosystem function under challenging saline–alkaline conditions.
Importantly, osmotic stress induced by high salinity represents another selective force shaping microbial assemblages. Halophilic and halotolerant taxa possess osmoprotective strategies, such as compatible solute synthesis and ion transport regulation, which allow them to maintain cellular homeostasis [47]. Vegetation that alleviates rhizospheric osmotic stress can thus indirectly promote the persistence of broader microbial functional groups, beyond strictly halophilic specialists. This highlights the coupled role of vegetation and osmotic regulation in structuring soil microbial communities under saline–alkaline stress.

4.3. Interactions Between Enzyme Activities and Microbial Diversity Across Vegetation Types

Soil enzyme activities are widely recognized as sensitive indicators of microbial metabolism and overall soil biochemical functioning [48]. Variations in enzymatic activities, including sucrase (SC), alkaline phosphatase (ALP), urease (UE), and catalase (CAT), generally reflect underlying shifts in microbial community composition and soil chemical properties [49]. Enhanced UE and ALP activities have been linked to more efficient nitrogen and phosphorus cycling, which in turn can support microbial turnover and nutrient availability, ultimately promoting vegetation growth in saline–alkaline ecosystems [32,50]. Proteobacteria tend to thrive under carbon-rich conditions and are often associated with elevated SC activity, indicating their role in carbon processing [51]. Actinobacteria, due to their capacity to decompose organic nitrogen compounds, are commonly correlated with urease activity, highlighting their contribution to nitrogen dynamics [52]. Nonetheless, high salinity and extreme alkalinity impose osmotic and ionic stress, potentially constraining enzyme activities such as ALP and reflecting the sensitivity of soil biochemical processes to environmental stressors [53]. Collectively, these patterns suggest that vegetation-mediated modifications of soil chemistry and microbial composition can regulate enzymatic functioning, emphasizing the importance of plant–microbe–soil feedback in sustaining nutrient cycling in saline–alkaline wetlands. This constraint is closely tied to osmotic stress, which reduces microbial metabolic efficiency by imposing energy costs for maintaining intracellular ion balance and water relations [54]. Vegetation types that reduced soil salinity and improved nutrient availability—such as E. phyllopogon—also indirectly enhanced enzymatic activities. These results indicate that optimizing vegetation cover can effectively modulate soil microbial functions and enzyme activities, thereby improving soil biochemical quality in saline–alkaline ecosystems.

4.4. Structural Interdependencies Revealed by PLS-SEM

The PLS-SEM analysis revealed hierarchical linkages among microbial diversity, community composition, soil physicochemical properties, and enzyme activities in the saline wetlands of Chagan Lake. The model accounted for 82.4% of the variance in microbial composition, 94.3% in soil chemical traits, and 75.9% in enzyme activities (GOF = 0.54), indicating robust structural relationships. Correlation analysis further showed strong associations between key bacterial phyla and soil variables, highlighting that microbial assemblages mediate vegetation-driven soil processes.
A strong negative effect of microbial diversity on community composition (β = −0.93) suggests that under saline stress, higher diversity may promote the selection of specialized or competitive taxa, consistent with previous observations that osmotic stress drives niche differentiation and halotolerance in bacterial communities [55,56]. Microbial composition, in turn, positively influenced soil quality (β = 1.05), indicating that shifts in dominant taxa directly contribute to organic carbon accumulation, nitrogen retention, and nutrient cycling [57,58]. Moreover, microbial composition had a direct positive effect on enzyme activities (β = 1.08), emphasizing that structurally diverse bacterial communities enhance soil biochemical functioning, particularly for urease and alkaline phosphatase, which are critical for nitrogen and phosphorus turnover in saline–alkaline soils [59,60].
The slight negative effect from soil properties to enzyme activities (β = −0.21) likely reflects feedback limitations under high salinity or nutrient thresholds, whereby extreme soil conditions constrain enzymatic efficiency despite favorable microbial assemblages [61,62]. Overall, these results illustrate a cascading mechanism: vegetation influences microbial diversity and composition, which drives soil nutrient dynamics and enzymatic functioning. This mechanistic understanding supports the targeted selection of vegetation types that ameliorate salinity, enhance nutrient availability, and foster microbial communities, thereby improving soil multifunctionality and resilience. Integrating microbial community management into restoration strategies is therefore essential for sustaining saline wetland ecosystem functions [63].

4.5. Implications for Saline Wetland Restoration and Management

The findings of this study provide important practical insights into the ecological restoration and management of saline wetlands, especially at forest-wetland boundaries. First, vegetation types such as E. phyllopogon not only ameliorated soil alkalinity but also enhanced soil fertility by boosting organic carbon and nitrogen levels and fostering diverse microbial communities [64]. Strategic plant selection based on functional traits can thus significantly accelerate wetland soil improvement [65]. Second, promoting beneficial microbial groups like Proteobacteria and Actinobacteria through vegetation management can enhance nutrient cycling and increase soil resilience against saline stress [66]. Microbial community shifts serve as early indicators of restoration success. Third, monitoring enzyme activities, such as sucrase and urease, provides a sensitive means to assess soil recovery and microbial functional potential during restoration projects [67]. Finally, the observed heterogeneity among vegetation types highlights the importance of biodiversity in restoration planning. Mixed vegetation strategies may offer synergistic effects, enhancing soil multifunctionality and ecosystem stability [68]. Overall, integrating vegetation management, microbial monitoring, and biochemical assessments provides a comprehensive framework for restoring and sustaining the health of saline–alkaline wetlands. It is acknowledged that plant–soil–microbe interactions are inherently bidirectional. However, in our study, the long-term persistence of vegetation types in a relatively stable environmental context supports the interpretation that vegetation structure can act as a key driver of soil biochemical and microbial traits, rather than being solely a consequence of pre-existing soil conditions. This inference is further supported by our structural equation modeling, which identifies vegetation as an upstream predictor influencing both soil attributes and microbial diversity.
Despite these valuable insights, this study has several limitations. First, our investigation was based on a single sampling campaign and did not capture seasonal or interannual variations in vegetation–soil–microbe interactions, which may influence the stability of the observed patterns. Second, the study was conducted in a specific saline–alkaline wetland region in northeastern China; thus, the generalizability of the findings to other climatic zones and wetland types may be limited. Third, although we inferred causal relationships through structural equation modeling, long-term manipulative experiments are needed to validate these pathways and disentangle the reciprocal feedback between vegetation and soil properties.
Future research should therefore focus on multi-season and long-term monitoring, controlled vegetation restoration experiments, and cross-site comparisons across different saline wetland ecosystems. In addition, integrating metagenomic or transcriptomic approaches would provide a deeper mechanistic understanding of microbial functional potential under vegetation-driven restoration. Such efforts will further refine strategies for managing and restoring saline–alkaline wetlands under ongoing global change.

5. Conclusions

This study elucidates how different vegetation types drive alterations in soil physicochemical traits, enzymatic activities, and bacterial community structure within saline–alkaline wetlands at the forest–wetland interface. Vegetation cover significantly influenced soil nutrient dynamics; for example, E. phyllopogon reduced soil pH toward neutrality and enhanced organic carbon and nitrogen levels, thereby creating conditions more favorable for microbial processes otherwise constrained by excessive alkalinity.
Bacterial community composition also shifted across vegetation types. While Proteobacteria remained abundant, consistent with their functional versatility in nutrient cycling, the prominence of specialized halophilic and alkaliphilic taxa under alkaline saline conditions should not be overlooked. These functional groups likely play equally critical roles in sustaining soil processes, reflecting microbial adaptation strategies to salinity and high pH stress. Variations in Actinobacteria and Acidobacteria abundances further highlight vegetation-driven differences in nitrogen and phosphorus dynamics.
Enzymatic activities, particularly urease and alkaline phosphatase, responded sensitively to vegetation treatments and mirrored changes in both microbial community composition and soil chemical properties. These patterns emphasize the tight plant–soil–microbe feedback that regulates ecosystem functioning under saline stress.
Taken together, our results provide site-specific evidence that vegetation capable of ameliorating soil salinity while fostering adaptive microbial communities may contribute to soil quality improvement in degraded wetlands. However, we acknowledge that these findings are based on a single observational study in the Chagan Lake system, and broader generalizations to saline–alkaline wetlands globally should be made with caution. Future multi-site and long-term studies are required to validate whether the vegetation–soil–microbe linkages observed here hold across diverse saline ecosystems. Nevertheless, incorporating microbial indicators such as community composition and enzyme activities into restoration monitoring frameworks appears to be a promising direction for assessing soil functional recovery in saline–alkaline environments.

Author Contributions

Conceptualization, Q.L. and S.J.; methodology, Q.L., S.J. and P.W.; software, Q.L. and S.J.; validation, Q.L. and S.J.; formal analysis, J.Z. and Y.X.; investigation, Q.L., P.W. and Y.Q.; resources, Q.L. and S.J.; data curation, S.J. and X.G.; writing—original draft preparation, Q.L. and S.J.; writing—review and editing, Q.L.; supervision, Q.L. and X.Z.; project administration, Q.L.; funding acquisition, Q.L. All authors have read and agreed to the published version of the manuscript.

Funding

This research was supported by grants from the General Project of Natural Science Foundation of Jilin Province (20250202140SF) and the Climbing Project of Changchun University (ZKP202202).

Data Availability Statement

Data are contained within the article.

Conflicts of Interest

The authors declare no conflicts of interest.

References

  1. Ding, J.; Yu, S. Structural and Functional Characteristics of Soil Microbial Communities in Forest–Wetland Ecotones: A Case Study of the Lesser Khingan Mountains. Life 2025, 15, 570. [Google Scholar] [CrossRef]
  2. Wu, D.; Bai, H.; Zhao, C.; Peng, M.; Chi, Q.; Dai, Y.; Gao, F.; Zhang, Q.; Huang, M.; Niu, B. The characteristics of soil microbial co-occurrence networks across a high-latitude forested wetland ecotone in China. Front. Microbiol. 2023, 14, 1160683. [Google Scholar] [CrossRef]
  3. Wang, H.; Krauss, K.W.; Noe, G.B.; Stagg, C.L.; Swarzenski, C.M.; Duberstein, J.A.; Conner, W.H.; DeAngelis, D.L. Modeling soil porewater salinity response to drought in tidal freshwater forested wetlands. J. Geophys. Res. Biogeosci. 2020, 125, e2018JG004996. [Google Scholar] [CrossRef]
  4. Wang, H.; Dai, Z.; Trettin, C.C.; Krauss, K.W.; Noe, G.B.; Burton, A.J.; Stagg, C.L.; Ward, E.J. Modeling impacts of drought-induced salinity intrusion on carbon dynamics in tidal freshwater forested wetlands. Ecol. Appl. 2022, 32, e2700. [Google Scholar] [CrossRef] [PubMed]
  5. Stefanowicz, A.M.; Kapusta, P.; Stanek, M.; Rożek, K.; Rola, K.; Zubek, S. Herbaceous plant species and their combinations positively affect soil microorganisms and processes and modify soil physicochemical properties in a mesocosm experiment. For. Ecol. Manag. 2023, 532, 120826. [Google Scholar] [CrossRef]
  6. Ren, J.; Li, X.; Zhao, K. Quantitative Analysis of Relationships Between Crack Characteristics and Properties of Soda-saline Soils in Songnen Plain, China. Chin. Geogr. Sci. 2015, 25, 591–601. [Google Scholar] [CrossRef]
  7. Daba, A. Rehabilitation of soil salinity and sodicity using diverse amendments and plants: A critical review. Discov. Environ. 2025, 3, 53. [Google Scholar] [CrossRef]
  8. Yuan, L.; Wang, J.; Liu, R.; Tang, Y.; Wu, D.; Jin, R.; Zhu, W. Soil properties, climate, and topography jointly determine plant community characteristics in marsh wetlands. J. Plant Res. 2025, 138, 37–50. [Google Scholar] [CrossRef] [PubMed]
  9. Zhang, G.; Zhang, L.; Shi, Z.; Yang, Y.; Liu, J. Microbial nutrient limitation and carbon use efficiency in saline-alkali soil amended with biochar: Insights from ecoenzymatic C: N: P stoichiometry. Biochar 2025, 7, 68. [Google Scholar] [CrossRef]
  10. Song, X.; Su, Y.; Zheng, J.; Zhang, Z.; Liang, Z.; Tang, Z. Study on the effects of salt tolerance type, soil salinity and soil characteristics on the element composition of Chenopodiaceae halophytes. Plants 2022, 11, 1288. [Google Scholar] [CrossRef] [PubMed]
  11. Tootoonchi, M.; Gettys, L.A.; Ferrell, J.A.; Erickson, J.E.; Bhadha, J.H. Salt tolerance assessment of aquatic and wetland plants: Increased salinity can reshape aquatic vegetation communities. Hydrobiologia 2023, 850, 4575–4587. [Google Scholar] [CrossRef]
  12. Wang, W.; Liu, Y.; Zhao, Z.; Liu, R.; Wang, F.; Zhang, Z.; Yu, Q. Moss Biochar Facilitates Root Colonization of Halotolerant Halomonas salifodinae for Promoting Plant Growth Under Saline–Alkali Stress. Soil Syst. 2025, 9, 73. [Google Scholar] [CrossRef]
  13. Li, F.; Guo, Y.; Wang, Z.; Mu, Y. Influence of different phytoremediation on soil microbial diversity and community composition in saline-alkaline land. Int. J. Phytoremediation 2022, 24, 507–517. [Google Scholar] [CrossRef]
  14. Sergey, S. Learning from halophytes: Physiological basis and strategies to improve abiotic stress tolerance in crops. Ann. Bot. 2013, 112, 1209–1221. [Google Scholar] [CrossRef]
  15. He, Q.; Bertness, M.D. Extreme stresses, niches, and positive species interactions along stress gradients. Ecology 2014, 95, 1437–1443. [Google Scholar] [CrossRef]
  16. Li, Z.; Jiang, Z.; Qu, Y.; Cao, Y.; Sun, F.; Dai, Y. Analysis of landscape change and its driving mechanism in Chagan Lake National Nature Reserve. Sustainability 2022, 14, 5675. [Google Scholar] [CrossRef]
  17. Zhao, Y.; Wang, G.; Zhao, M.; Wang, M.; Xue, Z.; Liu, B.; Jiang, M. Seed limitation and saline-alkaline stress restrict wetland restoration potential in the Songnen Plain, northeastern China. Ecol. Indic. 2021, 129, 107998. [Google Scholar] [CrossRef]
  18. Wang, Y.; Lei, H.; Chen, J. Effects of continuous periodic Phragmites harvesting on microbial characteristics and soil multifunctionality in wetlands adjacent to residential and agricultural areas. Environ. Technol. Innov. 2025, 40, 104386. [Google Scholar] [CrossRef]
  19. Yan, J.; Wang, L.; Hu, Y.; Tsang, Y.F.; Zhang, Y.; Wu, J.; Fu, X.; Sun, Y. Plant litter composition selects different soil microbial structures and in turn drives different litter decomposition pattern and soil carbon sequestration capability. Geoderma 2018, 319, 194–203. [Google Scholar] [CrossRef]
  20. Lombardi, T.; Bertacchi, A.; Pistelli, L.; Pardossi, A.; Pecchia, S.; Toffanin, A.; Sanmartin, C. Biological and Agronomic Traits of the Main Halophytes Widespread in the Mediterranean Region as Potential New Vegetable Crops. Horticulturae 2022, 8, 195. [Google Scholar] [CrossRef]
  21. Liu, J.; Qiu, T.; Peñuelas, J.; Sardans, J.; Tan, W.; Wei, X.; Cui, Y.; Cui, Q.; Wu, C.; Liu, L.; et al. Crop residue return sustains global soil ecological stoichiometry balance. Glob. Change Biol. 2023, 29, 2203–2226. [Google Scholar] [CrossRef] [PubMed]
  22. Zhang, H.; Xiao, G.Z.; Li, L.B.; Su, F.K.; Yang, J. Optimal Color Development Conditions and Spectrophotometric Wavelength for Determination of Total Phosphorus in Soil by Mo-Sb Anti Colorimetric Method. Soil Fertil. Sci. China 1992, 2, 46–48. [Google Scholar]
  23. Beck, T. Die Messung der Katalaseaktivitt von Bden. J. Plant Nutr. Soil Sci. 2010, 130, 68–81. [Google Scholar] [CrossRef]
  24. Shu, S.Y.; Wang, K.L.; Zhang, W.; He, X.Y.; Liu, S.J.; Wei, G.F. Soil alkaline phosphatase activity at different vegetation succession stages in karst peak-cluster depression. Chin. J. Ecol. 2010, 29, 1722–1728. [Google Scholar] [CrossRef]
  25. Karlson, P.; Nachtigall, M. Ein biologischer Test zur quantitativen Bestimmung der Juvenilhormon-Aktivitt von Insektenextrakten. J. Insect Physiol. 1961, 7, 210–215. [Google Scholar] [CrossRef]
  26. Ge, Y.; Wang, Q.; Wang, L.; Liu, W.; Liu, X.; Huang, Y.; Christie, P. Response of soil enzymes and microbial communities to root extracts of the alien Alternanthera philoxeroides. Arch. Agron. Soil Sci. 2017, 64, 708–717. [Google Scholar] [CrossRef]
  27. Zandi, P.; Schnug, E. Reactive oxygen species, antioxidant responses and implications from a microbial modulation perspective. Biology 2022, 11, 155. [Google Scholar] [CrossRef]
  28. Du, X.; Li, M.S.; Song, D.; Yang, J.S.; Liu, H.; Sui, X.; Huo, T.B. Changes in the bacterial community structure and diversity of Chagan Lake sediments, northeastern China. Appl. Ecol. Environ. Res. 2022, 20, 4257–4270. [Google Scholar] [CrossRef]
  29. Yin, F.; Zhang, F. Reclamation of abandoned saline-alkali soil increased soil microbial diversity and degradation potential. Plant Soil 2022, 477, 521–538. [Google Scholar] [CrossRef]
  30. Pan, Y.; She, D.; Shi, Z.; Cao, T.; Xia, Y.; Shan, J. Salinity and high pH reduce denitrification rates by inhibiting denitrifying gene abundance in a saline-alkali soil. Sci. Rep. 2023, 13, 2155. [Google Scholar] [CrossRef]
  31. Liu, Y.; Wang, K.; Dong, L.; Li, J.; Wang, X.; Shangguan, Z.; Qu, B.; Deng, L. Dynamics of litter decomposition rate and soil organic carbon sequestration following vegetation succession on the Loess Plateau, China. Catena 2023, 229, 107225. [Google Scholar] [CrossRef]
  32. Prommer, J.; Walker, T.W.N.; Wanek, W.; Braun, J.; Zezula, D.; Hu, Y.; Hofhansl, F.; Richter, A. Increased microbial growth, biomass, and turnover drive soil organic carbon accumulation at higher plant diversity. Glob. Change Biol. 2020, 26, 669–681. [Google Scholar] [CrossRef]
  33. Liu, M.; Li, X.; Zhu, R.; Chen, N.; Ding, L.; Chen, C. Vegetation richness, species identity and soil nutrients drive the shifts in soil bacterial communities during restoration process. Environ. Microbiol. Rep. 2021, 13, 411–424. [Google Scholar] [CrossRef] [PubMed]
  34. Sekaran, U.; McCoy, C.; Kumar, S.; Subramanian, S. Soil microbial community structure and enzymatic activity responses to nitrogen management and landscape positions in switchgrass (Panicum virgatum L.). Gcb Bioenergy 2019, 11, 836–851. [Google Scholar] [CrossRef]
  35. Ma, J.; Wang, G.; Liu, X.; Lei, B.; Xing, G. Effects of Phosphorus Application Levels on Its Uptake and Utilization in Foxtail Millet. Agronomy 2024, 14, 2078. [Google Scholar] [CrossRef]
  36. Luo, M.; Moorhead, D.L.; Ochoa-Hueso, R.; Mueller, C.W.; Ying, S.C.; Chen, J. Nitrogen loading enhances phosphorus limitation in terrestrial ecosystems with implications for soil carbon cycling. Funct. Ecol. 2022, 36, 2845–2858. [Google Scholar] [CrossRef]
  37. Araújo, C.A.; Ferreira, P.C.; Pupin, B.; Dias, L.P.; Avalos, J.; Edwards, J.; Hallsworth, J.E.; Rangel, D.E. Osmotolerance as a determinant of microbial ecology: A study of phylogenetically diverse fungi. Fungal Biol. 2019, 124, 273–288. [Google Scholar] [CrossRef]
  38. Bhattacharyya, A.; Pablo, C.H.D.; Mavrodi, O.V.; Weller, D.M.; Thomashow, L.S.; Mavrodi, D.V. Rhizosphere plant-microbe interactions under water stress. In Advances in Applied Microbiology; Academic Press: Cambridge, MA, USA, 2021. [Google Scholar]
  39. Naylor, D.; McClure, R.; Jansson, J. Trends in microbial community composition and function by soil depth. Microorganisms 2022, 10, 540. [Google Scholar] [CrossRef]
  40. Nan, L.; Guo, Q.; Cao, S.; Zhan, Z. Diversity of bacterium communities in saline-alkali soil in arid regions of Northwest China. BMC Microbiol. 2022, 22, 11. [Google Scholar] [CrossRef]
  41. Song, L.; Wang, Y.; Zhang, R.; Yang, S. Microbial mediation of carbon, nitrogen, and sulfur cycles during solid waste decomposition. Microb. Ecol. 2023, 86, 311–324. [Google Scholar] [CrossRef] [PubMed]
  42. Liao, W.; Tong, D.; Li, Z.; Nie, X.; Liu, Y.; Ran, F.; Liao, S. Characteristics of microbial community composition and its relationship with carbon, nitrogen and sulfur in sediments. Sci. Total Environ. 2021, 795, 148848. [Google Scholar] [CrossRef]
  43. Dong, H.; Sun, H.; Fan, S.; Jiang, L.; Ma, D. Rhizobacterial communities, enzyme activity, and soil properties affect rice seedling’s nitrogen use. Agron. J. 2021, 113, 633–644. [Google Scholar] [CrossRef]
  44. Zheng, M.M.; Wang, C.; Li, W.X.; Guo, L.; Cai, Z.J.; Wang, B.R.; Chen, J.; Shen, R.F. Changes of acid and alkaline phosphatase activities in long-term chemical fertilization are driven by the similar soil properties and associated microbial community composition in acidic soil. Eur. J. Soil Biol. 2021, 104, 103312. [Google Scholar] [CrossRef]
  45. Qu, X.; Pan, Y.; Wang, P.; Ran, L.; Qin, G.; Li, Q.; Kang, P. Response of phyllosphere and rhizosphere microbial communities to salt stress of Tamarix chinensis. Plants 2024, 13, 1091. [Google Scholar] [CrossRef]
  46. Msimbira, L.A.; Smith, D.L. The roles of plant growth promoting microbes in enhancing plant tolerance to acidity and alkalinity stresses. Front. Sustain. Food Syst. 2020, 4, 106. [Google Scholar] [CrossRef]
  47. Vaidya, S.; Dev, K.; Sourirajan, A. Distinct Osmoadaptation Strategies in the Strict Halophilic and Halotolerant Bacteria Isolated from Lunsu Saltwater Body of Northwest Himalayas. Curr. Microbiol. 2018, 75, 888–895. [Google Scholar] [CrossRef]
  48. Li, X.; Qu, C.; Bian, Y.; Gu, C.; Jiang, X.; Song, Y. New insights into the responses of soil microorganisms to polycyclic aromatic hydrocarbon stress by combining enzyme activity and sequencing analysis with metabolomics. Environ. Pollut. 2019, 255, 113312. [Google Scholar] [CrossRef] [PubMed]
  49. Williams, G.; Miller, R.; Deng, S. Dynamic relationships between microbial community, enzyme activity, and soil properties across global ecosystems. Appl. Soil Ecol. 2025, 206, 105843. [Google Scholar] [CrossRef]
  50. Cheng, Y.; Xu, X.; Zhang, Y.; Gu, X.; Nie, H.; Zhu, L. Intercropping of Echinochloa frumentacea with Leguminous Forages Improves Hay Yields, Arbuscular Mycorrhizal Fungi Diversity, and Soil Enzyme Activities in Saline–Alkali Soil. Agronomy 2023, 13, 2356. [Google Scholar] [CrossRef]
  51. Song, J.; Min, L.; Wu, J.; He, Q.; Chen, F.; Wang, Y.; Nazir, R. Response of the microbial community to phosphate-solubilizing bacterial inoculants on Ulmus chenmoui Cheng in Eastern China. PLoS ONE 2021, 16, e0247309. [Google Scholar] [CrossRef]
  52. AbdelGawad, H.; Abuelsoud, W.; Madany, M.M.; Selim, S.; Zinta, G.; Mousa, A.S.; Hozzein, W.N. Actinomycetes enrich soil rhizosphere and improve seed quality as well as productivity of legumes by boosting nitrogen availability and metabolism. Biomolecules 2020, 10, 1675. [Google Scholar] [CrossRef]
  53. Zhou, J.; Miao, Y.; Guo, L.; Zhang, T.; Nie, Z.; Luo, X.; Yang, F.; Wang, Z. Evaluating the Enzyme Activities and Soil Physicochemical Properties of Four Typical Halophytic Communities in Saline-Sodic Soil. Agronomy 2024, 14, 141. [Google Scholar] [CrossRef]
  54. Zhang, Y.; Wang, Y. Microbial response to environmental stresses: From fundamental mechanisms to biotechnological applications. FEMS Microbiol. Rev. 2020, 44, 348–369. [Google Scholar] [CrossRef]
  55. Bustos-Caparros, E.; Viver, T.; Gago, J.F.; Rodriguez-Rojas, L.M.; Hatt, J.K.; Venter, S.N.; Fuchs, B.M.; Amann, R.; Bosch, R.; Konstantinidis, K.T.; et al. Ecological success of extreme halophiles subjected to recurrent osmotic disturbances is primarily driven by congeneric species replacement. ISME J. 2024, 18, wrae215. [Google Scholar] [CrossRef] [PubMed]
  56. Wang, X.; Xu, L.; Qi, X.; Huang, J.; Han, M.; Wang, C.; Li, X.; Jiang, H. Microbial assembly and stress-tolerance mechanisms in salt-adapted plants along the shore of a Salt Lake: Implications for saline–alkaline soil remediation. Microorganisms 2025, 13, 1942. [Google Scholar] [CrossRef]
  57. Yin, R.; Deng, H.; Wang, H.-L.; Zhang, B. Vegetation type affects soil enzyme activities and microbial functional diversity following re-vegetation of a severely eroded red soil in sub-tropical China. Catena 2014, 115, 96–103. [Google Scholar] [CrossRef]
  58. Philippot, L.; Chenu, C.; Kappler, A.; Rillig, M.C.; Fierer, N. The interplay between microbial communities and soil properties. Nat. Rev. Microbiol. 2024, 22, 226–239. [Google Scholar] [CrossRef]
  59. Tardy, V.; Spor, A.; Mathieu, O.; Lévèque, J.; Terrat, S.; Plassart, P.; Regnier, T.; Bardgett, R.D.; van der Putten, W.H.; Roggero, P.P.; et al. Shifts in microbial diversity through land use intensity as drivers of carbon mineralization in soil. Soil Biol. Biochem. 2015, 90, 204–213. [Google Scholar] [CrossRef]
  60. Wang, D.; Lan, Y.; Chen, W.; Liu, Z.; Gao, J.; Cao, D.; Wang, Q.; Mazhang, C.; An, X. Response of bacterial communities, enzyme activities and dynamic changes of soil organic nitrogen fractions to six-year different application levels of biochar retention in Northeast China. Soil Tillage Res. 2024, 240, 106097. [Google Scholar] [CrossRef]
  61. Dong, Y.; Chen, R.; Petropoulos, E.; Yu, B.; Zhang, J.; Lin, X.; Gao, M.; Feng, Y. Interactive effects of salinity and SOM on the ecoenzymatic activities across coastal soils subjected to a saline gradient. Geoderma 2022, 406, 115519. [Google Scholar] [CrossRef]
  62. Chauhan, P.; Sharma, N.; Tapwal, A.; Kumar, A.; Verma, G.S.; Meena, M.; Seth, C.S.; Swapnil, P. Soil microbiome: Diversity, benefits and interactions with plants. Sustainability 2023, 15, 14643. [Google Scholar] [CrossRef]
  63. Qi, X.; Chen, T.; Ding, C.; Chen, X.; He, B.; Hu, W. Diversity of fungal communities in the rhizosphere soil of Tamarix chinensis in saline–alkaline wetland. Environ. Dev. Sustain. 2025, 27, 8693–8709. [Google Scholar] [CrossRef]
  64. Liu, L.; Liu, D.; Ding, X.; Chen, M.; Zhang, S. Straw incorporation and nitrogen fertilization enhance soil carbon sequestration by altering soil aggregate and microbial community composition in saline-alkali soil. Plant Soil 2024, 498, 341–356. [Google Scholar] [CrossRef]
  65. Sloey, T.M.; Ellis, V.S.; Kettenring, K.M. Using plant functional traits to inform wetland restoration. Wetlands 2023, 43, 92. [Google Scholar] [CrossRef]
  66. Farooqi, Z.U.R.; Qadir, A.A.; Alserae, H.; Raza, A.; Mohy-Ud-Din, W. Organic amendment–mediated reclamation and build-up of soil microbial diversity in salt-affected soils: Fostering soil biota for shaping rhizosphere to enhance soil health and crop productivity. Environ. Sci. Pollut. Res. 2023, 30, 109889–109920. [Google Scholar] [CrossRef]
  67. Sun, T.; Zhou, J.; Shi, L.; Feng, W.; Dippold, M.A.; Zang, H.; Kurganova, I.; de Gerenyu, V.L.; Kalinina, O.; Giani, L.; et al. Microbial growth rates, carbon use efficiency and enzyme activities during post-agricultural soil restoration. Catena 2022, 214, 106226. [Google Scholar] [CrossRef]
  68. Guo, J.; Kneeshaw, D.; Peng, C.; Wu, Y.; Feng, L.; Qu, X.; Wang, W.; Pan, C.; Feng, H. Positive effects of species mixing on biodiversity of understory plant communities and soil health in forest plantations. Proc. Natl. Acad. Sci. USA 2025, 122, e2418090122. [Google Scholar] [CrossRef]
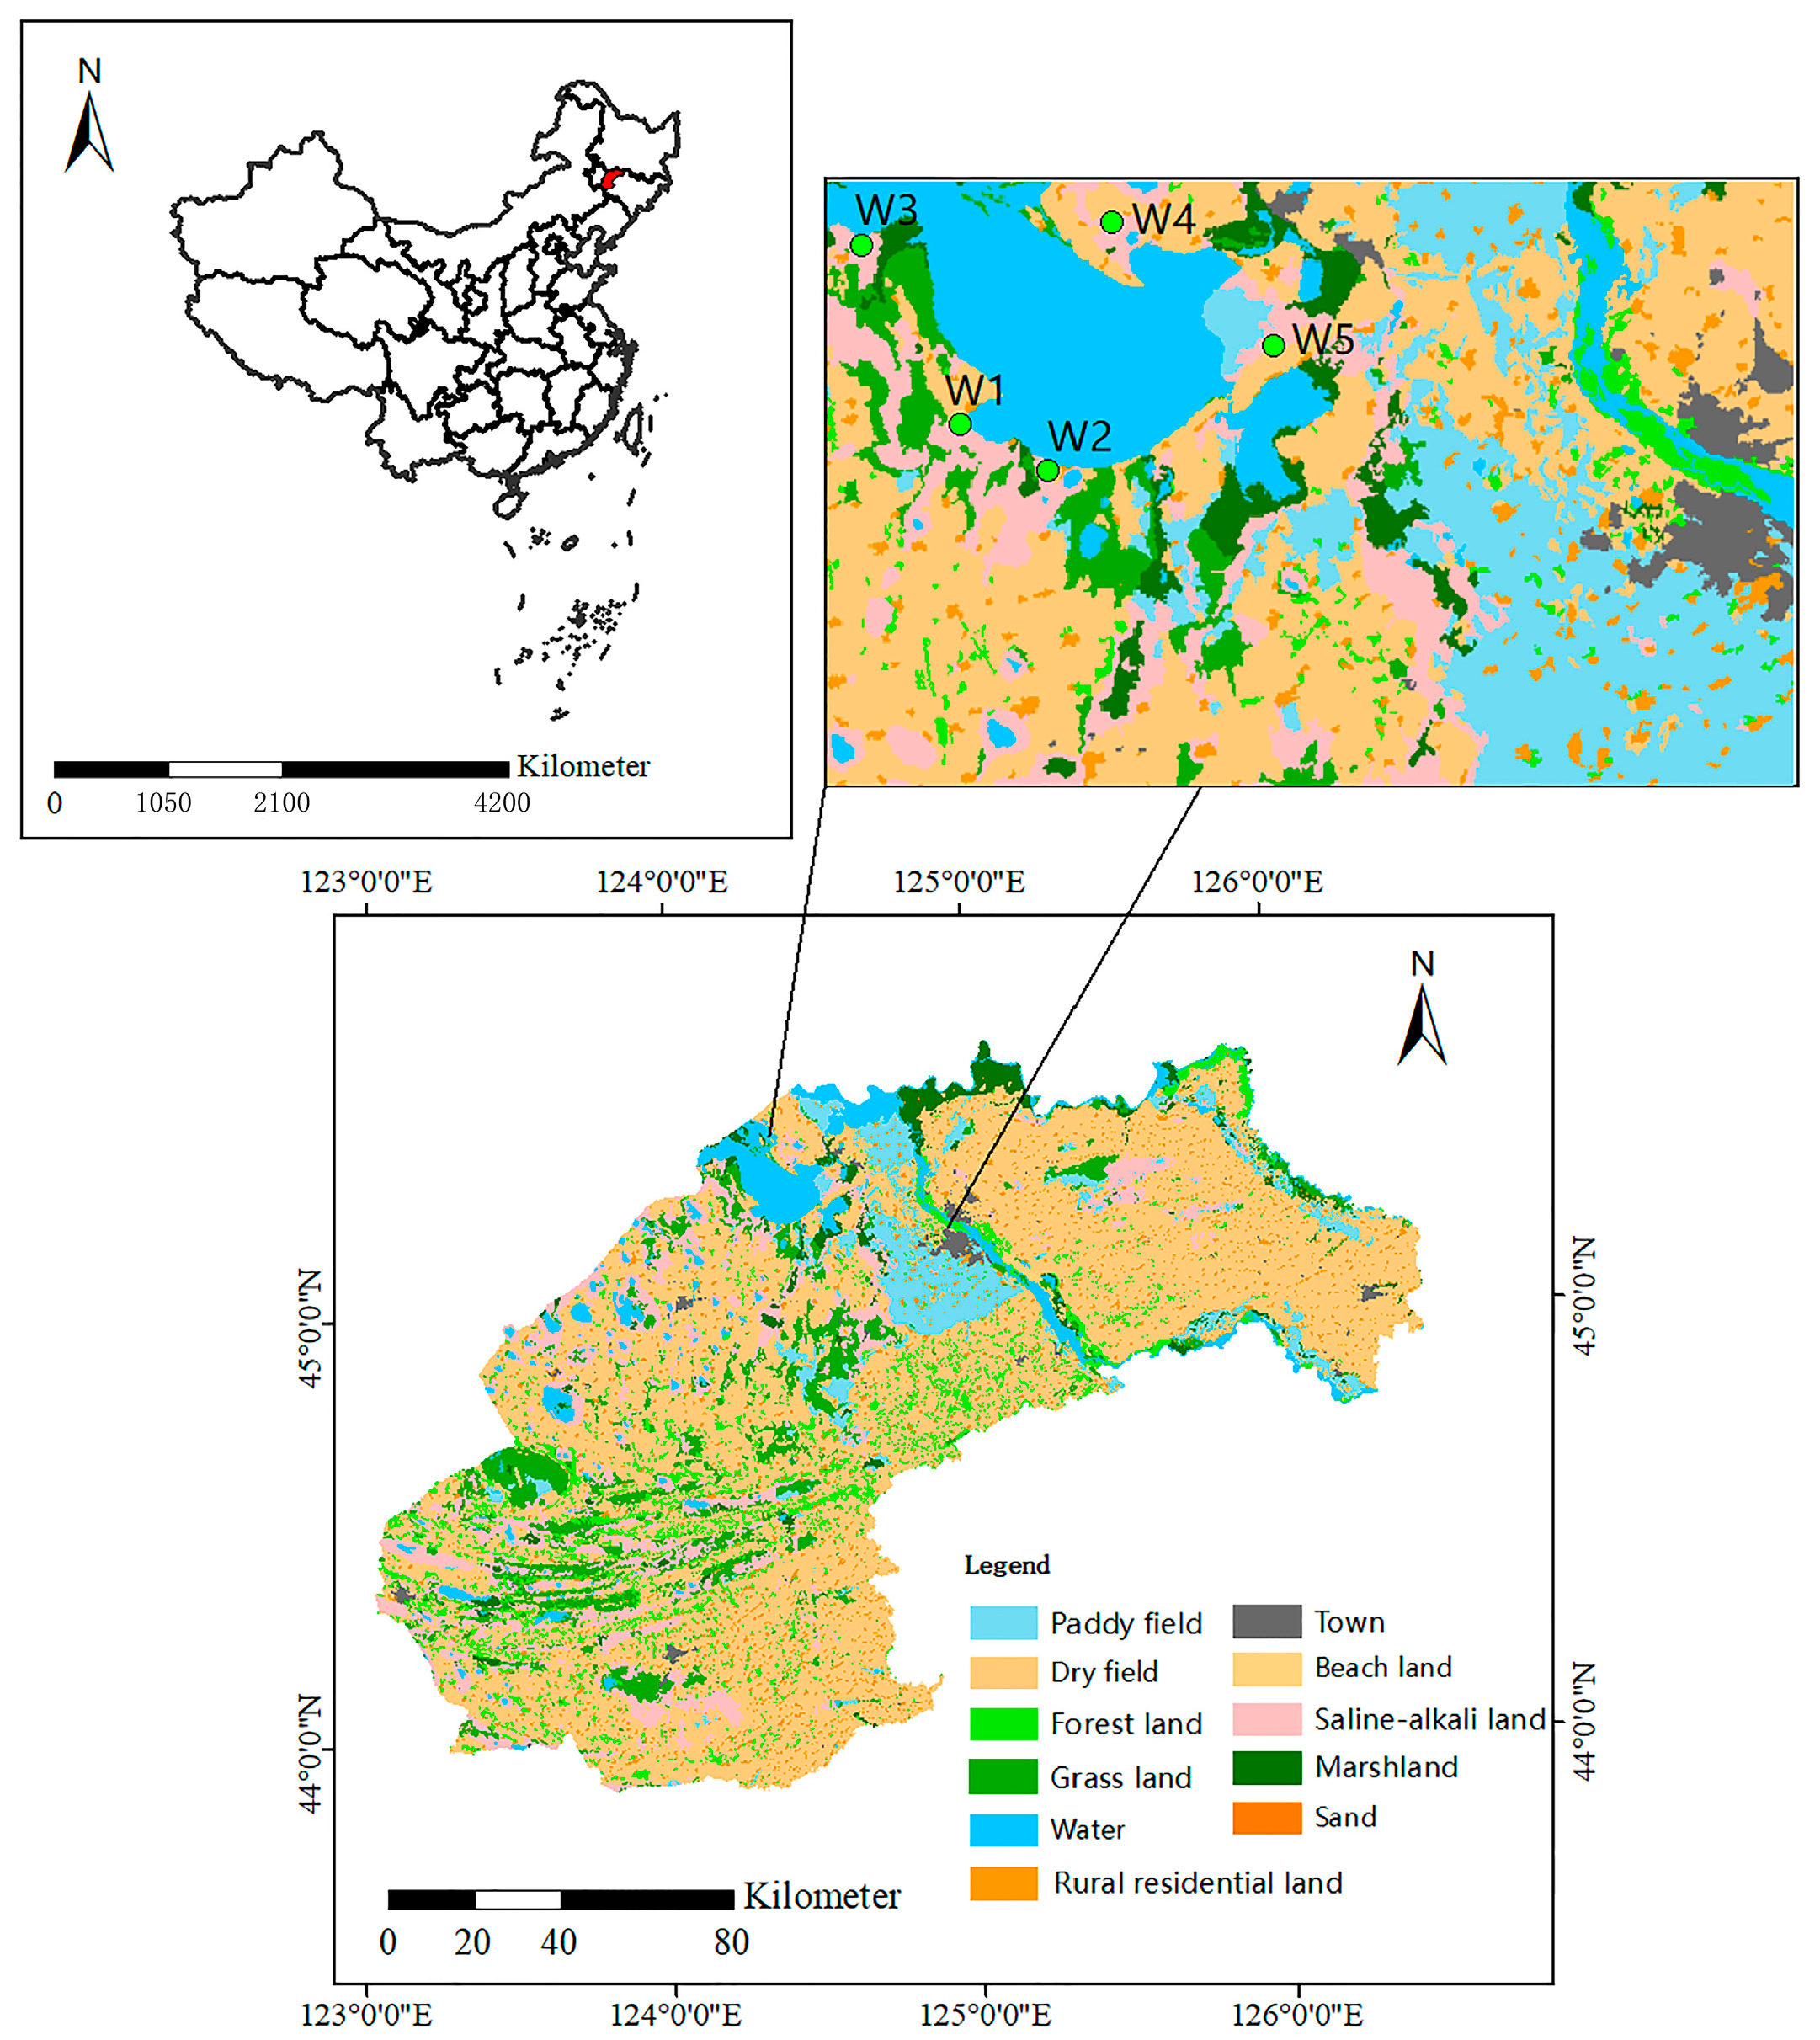
Figure 1. Location of Chagan Lake Study Area in China.
Forests 16 01468 g001
Figure 2. Vegetation cover changes in Chagan Lake (1984–2003).
Forests 16 01468 g002
Figure 3. Order levels in different vegetation types. (a) Relative abundance of soil bacterial communities at the phylum level; (b) Relative abundance of soil bacterial communities at the order level.
Forests 16 01468 g003
Figure 4. Number of common and unique genera and OTUs of soil bacteria in different vegetation types.
Forests 16 01468 g004
Figure 5. Cluster analysis of soil thermograms for different vegetation types. (a) Soil heat maps and hierarchical clustering between groups of different vegetation types. The colour gradient from blue to red indicates the distance between samples from near to far; (b) Heat map and hierarchical clustering of the relative abundance of the top 28 phyla detected in the soil bacterial community. Colour gradient from blue to red indicates low to high relative abundance.
Forests 16 01468 g005
Figure 6. (a) Correlation between soil chemical properties and enzymatic activities in different vegetation types. (b) Redundancy analysis of soil chemical properties, enzymatic activities, and bacterial communities in different vegetation types.
Forests 16 01468 g006
Figure 7. Correlation between major bacterial communities and soil chemical properties and enzyme activities.
Forests 16 01468 g007
Figure 8. PLS-SEM illustrates the regulatory pathways of microbial community, soil properties, and enzyme activities under different treatments. * Means p < 0.05, and *** means p < 0.001. The red line indicates the positive path, and the blue line indicates the negative path. The width of the line indicates the degree of influence. The values next to the lines are the path coefficients. R2 represents the proportion of the explained variance.
Forests 16 01468 g008
Table 1. Basic information on the samples taken from the Chagan Lake sample site.
Sample IDDominant VegetationpHEC
(dS/m)
W1Phragmites communis Trin.9.83 ± 0.053.6 ± 0.04
W2Phragmites communis Trin. + Typha orientalis L.10.07 ± 0.022.8 ± 0.05
W3Phragmites communis Trin. + Bryum spp.9.09 ± 0.103.2 ± 0.03
W4Phragmites communis Trin. + Suaeda salsa (L.) Pall.10.12 ± 0.025.7 ± 0.02
W5Echinochloa phyllopogon (Stapf) Koss.8.18 ± 0.021.8 ± 0.03
Table 2. Chemical characteristics of soil samples from different vegetation types.
Sample
ID
SOC
(g·kg−1)
TN
(g·kg−1)
TP
(g·kg−1)
AN
(mg·kg−1)
AP
(mg·kg−1)
pH
W19.47 ± 0.60 d0.58 ± 0.36 bc2.16 ± 1.24 c4.78 ± 0.40 b41.06 ± 0.20 c9.83 ± 0.05 c
W22.46 ± 0.25 a0.23 ± 0.81 a1.50 ± 1.16 a1.12 ± 0.12 a42.34 ± 0.53 c10.07 ± 0.02 d
W32.15 ± 0.08 a0.69 ± 1.40 c2.16 ± 0.91 c2.08 ± 0.35 a35.61 ± 1.25 b9.09 ± 0.10 b
W44.53 ± 0.16 b0.55 ± 0.12 bc1.79 ± 1.26 b1.28 ± 0.40 a48.61 ± 1.43 d10.12 ± 0.02 d
W56.17 ± 0.01 c0.49 ± 0.70 b3.17 ± 1.09 d4.14 ± 1.24 b33.53 ± 1.59 a8.18 ± 0.02 a
Note: SOC, soil organic carbon; TN, total nitrogen; TP, total phosphorus; AN, alkali-hydrolyzed nitrogen; AP, available phosphorus. According to Duncan’s multiple comparison test, different letters indicate significant differences between treatments (p < 0.05).
Table 3. Enzymatic activities of soil samples from different vegetation types.
Sample
ID
UE
(mg·g−1·d−1)
ALP
(mg·g−1·d−1)
SC
(mg·g−1·d−1)
CAT
(mg·g−1·d−1)
W1157.31 ± 2.18 b9.29 ± 0.28 b3.98 ± 1.73 a0.61 ± 0.02 b
W2141.85 ± 3.96 b3.32 ± 0.16 a8.14 ± 0.98 b0.43 ± 0.06 a
W3121.48 ± 9.70 a0.75 ± 0.14 a14.35 ± 1.80 c0.64 ± 0.02 b
W4236.1 ± 16.17 c8.64 ± 1.69 b5.61 ± 1.18 a0.42 ± 0.03 a
W5406.67 ± 5.61 d23.65 ± 3.55 c15.41 ± 0.00 c0.40 ± 0.06 a
Note: UE, urease; ALP, alkaline phosphatase; SC, sucrase; and CAT, catalase. According to Duncan’s multiple comparison test, different letters indicated significant differences between treatments (p < 0.05).
Table 4. Analysis of soil bacterial α-diversity indices between groups.
Sample
ID
ACEChao1SimpsonShannonCoverage
W11483.59 ± 4.56 b1510.54 ± 8.68 c0.99 ± 0.04 b8.8 ± 0.97 b0.99 ± 0 b
W21541.05 ± 8.01 c1580.49 ± 6.06 c0.99 ± 0.01 b8.74 ± 1.01 b0.99 ± 0 b
W31351.32 ± 5.35 a1353.45 ± 4.63 a0.99 ± 0.06 b8.48 ± 0.27 b0.99 ± 0 b
W41505.6 ± 5.90 c1565.26 ± 6.17 c0.98 ± 0.04 a8.14 ± 0.52 a0.99 ± 0 b
W51432.79 ± 6.06 b1417.49 ± 9.92 b1 ± 0.02 b8.95 ± 0.19 b0.97 ± 0.01 a
Note: Sample ID is the name of the sample; Chao1, Ace, Shannon, and Simpson represent each index; and Coverage is the coverage of the sample library. According to Duncan’s multiple comparison test, different letters indicated significant differences between treatments (p < 0.05).
Disclaimer/Publisher’s Note: The statements, opinions and data contained in all publications are solely those of the individual author(s) and contributor(s) and not of MDPI and/or the editor(s). MDPI and/or the editor(s) disclaim responsibility for any injury to people or property resulting from any ideas, methods, instructions or products referred to in the content.