Abstract
Tree height is a critical indicator for estimating forest stock and can be effectively acquired by UAV-LiDAR. Ground filtering works to classify ground points and non-ground points and can impact the tree height extraction results, while the points classification quality obtained by ordinary filtering methods is limited in complex forest conditions. A partitioned cloth simulation filtering (PCSF) method based on different vegetation cover was proposed in this study to improve the classification accuracy, and tree heights were extracted to demonstrate the effectiveness of the proposed method. UAV-LiDAR data and field measurements collected from the Lutou experimental forest farm in the southern subtropical forest region of China were used for validation, and the slope-based filtering, progressive triangulated irregular network densification filtering (PTD), moving surface fitting filtering (MSFF), and CSF were adopted for comparisons. The results showed that the proposed method yielded the best ground filtering effect, reducing the filtering total error by 2.12%–4.22% compared with other methods, and the relative root mean squared error (rRMSE) of extracted tree heights was reduced by 1.24%–3.84%, respectively. The proposed method can achieve a satisfactory filtering effect and tree height extraction result, which provides a methodological basis to precisely extract tree heights in large-scale forests.
1. Introduction
Forests are pivotal components of terrestrial ecosystems, playing a critical role in global biodiversity conservation and climate regulation through carbon sequestration [1,2]. As fundamental structural units of forests, individual trees require precise quantification of their structural parameters, such as tree height, diameter at breast height (DBH), and crown width, for accurate forest stock estimation. Accurate estimation of individual tree parameters is essential for forest carbon stock measurement and ecological value assessment [3,4]. Traditional field-based methods for acquiring these parameters are notoriously time-consuming, labor-intensive, and prone to human error, limiting their scalability for large-area forest inventories [5].
Remote sensing technologies, particularly Unmanned Aerial Vehicle (UAV) platforms, leveraging the advantages of high efficiency and convenience, are widely applied in forest resource monitoring [6]. UAV-borne optical imagery facilitates cost-effective three-dimensional (3D) canopy reconstruction, although its accuracy diminishes under dense canopies or suboptimal lighting [7]. Multispectral/hyperspectral sensors facilitate species classification and biochemical trait estimation but lack direct vertical structural measurements [8]. Light detection and ranging (LiDAR) has revolutionized forest inventory through high-fidelity 3D structural point cloud data acquisition, enabling efficient and precise extraction of large-scale tree parameters through single-tree segmentation algorithms [9,10]. This capability is indispensable for large-scale, high-precision forest resource mapping and carbon stock assessment.
Ground filtering, the process of separating ground points from non-ground points, is a critical prerequisite step for deriving accurate terrain models and subsequent individual tree metrics from UAV-LiDAR data [11,12,13]. The effectiveness of ground filtering directly governs the quality of downstream forest parameter extraction. Numerous filtering algorithms have been developed, broadly categorized as slope-based, interpolation-based, surface-based, and morphological-based. Slope-based methods divide ground and non-ground points by discriminating the height difference between neighboring points [13,14]. Tuning an appropriate slope threshold is crucial for such methods, and the most improved approaches are focused on delivering slope threshold setting schemes with autonomous terrain adaptation. Interpolation-based filtering uses surface reconstruction algorithms combined with height thresholding [15,16,17]. This approach employs interpolation techniques such as progressive triangulated irregular network densification filtering (PTD) and thin plate spline interpolation (TPS). While computationally intensive parameter optimization is required [18], these methods demonstrate stable performance. Surface-based filtering algorithms achieve ground filtering by constructing mathematical or physical models to simulate real ground surfaces [19,20]. The accuracy of the simulated terrain surfaces is a vital factor affecting the filtering results [21]. Morphological filtering removes non-ground points via morphological opening operations, with performance dependent on window size and height difference thresholds [22,23]. Hierarchical progressive filtering, mean shift segmentation, and interpolation-based window sizes determination improve accuracy [24,25].
Two key limitations hinder robust filtering in these complex scenarios. (1) Parameter Sensitivity and Tuning Burden: Many established algorithms require tuning multiple interdependent parameters (e.g., window size, slope threshold, height difference) to achieve optimal results across varying terrain and vegetation conditions. This manual tuning process is often subjective, time-consuming, and impractical for large-scale applications [20,22,26]. Although algorithms like Cloth Simulation Filtering (CSF) have gained popularity due to their simplicity (fewer, more intuitive parameters), computational efficiency, and demonstrated robustness in various settings [27,28,29,30], they are not immune to this challenge. (2) Limited Adaptability to Spatial Heterogeneity: Applying filtering algorithms with a single, fixed set of parameters across large, topographically diverse forest landscapes often leads to localized failures, as optimal parameters vary with terrain complexity (e.g., slope, roughness, relief) and vegetation density [25,31]. While strategies exist to adapt key parameters based on local topographic indices (e.g., slope, curvature) [14,32], these approaches frequently introduce additional parameters or complex rules, conflicting with the goal of simplifying the filtering process.
Partitioned filtering has emerged as a powerful strategy to address spatial heterogeneity [33,34]. It segments large areas by topography or surface features, autonomously selects optimal parameters per subzone, and performs partition-level filtering [35,36,37,38,39]. Better partitioning enhances subzone results, improving global accuracy. Yang et al. [36] implemented a region-specific segmentation strategy based on four topographic features (slope, standard deviation of depth, Gaussian curvature, and roughness), effectively reducing intra-regional terrain complexity and consequently enhancing filtering accuracy. Combining clustering algorithms and characteristics of point cloud distribution, Ni et al. [37] partitioned their study area into smooth clusters, rough clusters, and scattered point areas, representing buildings, vegetation, and other features, respectively. The region growth algorithm based on smoothing constraints has been employed successfully in classifying urban building areas with remarkable geometric features of point cloud distribution, but difficult to be effective in forest areas with disorganized clusters of point cloud distributions [38]. In summary, the above studies achieved better filtering results by adopting partitioned filtering with different partitioning schemes. Consequently, current partitioning methods, often developed for urban or simpler landscapes, struggle to achieve effective segmentation that accurately reflects the underlying vegetation-driven complexity affecting filter performance in forests.
Therefore, a clear research gap exists: the lack of an efficient and robust partitioned filtering framework specifically designed for large-scale, topographically complex subtropical forests, which explicitly accounts for vegetation cover heterogeneity and overcomes the limitations imposed by sparse ground point clouds for terrain-based partitioning. To bridge this gap, this study proposes a novel partitioned cloth simulation filtering (PCSF) method based on vegetation cover intensity (VCI). This approach constructs a vegetation cover index (VCI) to evaluate cover levels and partition forest point clouds. CSF is then applied per partition with VCI-guided automated parameter tuning. This work establishes a crucial methodological foundation for enhancing the precision of UAV-LiDAR applications in individual tree parameter extraction within complex forest ecosystems, contributing significantly to advancements in forest remote sensing and supporting the goals of precision forestry and carbon monitoring.
2. Materials and Methods
2.1. Study Area
The proposed filtering method was validated on the Lutou experimental forestry farm of Central South University of Forestry & Technology (CSUFT) located in Yueyang City, Hunan Province, as shown in Figure 1, with a total area of 4940 ha and a forest cover of 92%. The landscape is dominated by middle and low mountains, with altitudes ranging from 124 m to 1273 m and slopes of approximately 15°~45°. The site belongs to the humid continental monsoon climate zone, with an average precipitation of 1624.8 mm per year and an average annual temperature of 16.8·°C. The primary tree species include Cyclobalanopsis glauca (Cyclobalanopsis glauca (Thunb.) Oerst.), Castanopsis eyrei (Castanopsis eyrei (Champ.) Tutch.), Chinese fir (Cunninghamia lanceolata), and some species of Camelliaceae and Magnoliaceae.
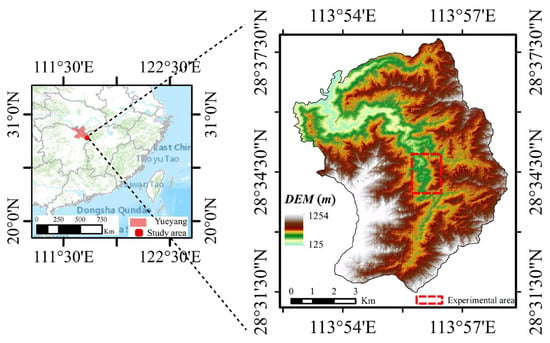
Figure 1.
Location of the study area.
A continuous area of size 1.1 km2 was selected within the forest site as our experimental area to validate the proposed filtering method. The landform types in this region include buildings, roads, and woodlands with different levels of vegetation cover.
2.2. LiDAR Data Collection and Preprocessing
LiDAR data were obtained in December 2020 with a Riegl VUX-1LR (RIEGL Laser Measurement Systems, Horn, Austria) laser sensor mounted on a BB-4 UAV (Shanghai Huace Navigation Technology Co., Ltd., Shanghai, China) platform. The flight adopted a zig-zag route design, with a waypoint interval of 30 m. The flight belt interval was set to 100 m, and the flight altitude was 150 m above the ground. The scanning angle was 140° to 180°, and the laser pulse emission frequency of the scanner was 300 kHz. In order to eliminate the impact of significant local density differences on the final results, after fixed-density resampling, the average point cloud density was approximately 5.2 pts/m2.
This process inevitably produces noisy point clouds due to the environment or system errors in the scanner, leading to unreliable filtering results [30,40,41]. Therefore, we performed denoising based on the standard deviation multiplier of the point cloud neighborhood to remove noisy points [42]. The algorithm calculates the median (Me) and standard deviation (SD) of the average distance between a target point and its neighboring points to obtain the distance threshold D (Equation (1)) and then judges the target point: if the average distance d (Equation (2)) between the target point and its neighboring points is greater than D, the point is regarded as a noise point and removed. Referring to related studies [19], we assign k = 3 and N = 16.
where k is the standard deviation multiplier, d denotes the average distance between the target point (xo, yo, zo) and its neighboring points (xi, yi, zi), and N denotes the number of neighboring points.
2.3. Reference Data
2.3.1. Field Measurement Data Collection
The field survey was conducted in January 2021 to acquire information from elevation checkpoints and individual trees. The sample locations were evenly distributed within the forest site, and a 20 m × 20 m sample plot was defined. Four boundary points of the sample plot served as elevation checkpoints. The coordinates and elevations of the sample plot borders and individual trees were obtained by employing a real-time kinematic global navigation satellite system (RTK GNSS) with centimeter-level positioning precision. Individual trees within the sample plot with a diameter breast height (DBH) greater than 5 cm were marked. The tree heights were measured using a laser rangefinder, specifically the TruPulse200 model (Laser Technology Inc., Centennial, CO, USA), which achieved an accuracy of 0.3 m at 300 m, and the ultimate tree height was determined by averaging the two measurements to lower manual errors. A total of 8 Chinese fir forest sample plots were investigated with a total number of 523 individual trees. From these plots, 162 trees distributed around the experimental area were selected to verify the estimation accuracy of tree height. The statistics showed that the measured tree height ranged from 4.5 m to 19.5 m, with a mean value of 12.65 m and a coefficient of variation (CV) of 21.93%.
2.3.2. Filtered Classification Reference Data
The reference filtered data were processed in LiDAR360 software (Version 6.0, https://www.lidar360.com/ (accessed on 10 May 2023)) using the “automatic + manual” method [43]. The preliminary classified ground and non-ground points were obtained by the built-in filtering algorithm of LiDAR360 and then manually revised with elevation check point of field survey data for a reliable classification result. A total of 5,715,267 points were recorded, including 932,719 ground points and 4,782,548 non-ground points.
2.4. Methodology of PCSF
The core idea of the PCSF method is to partition raw point clouds of the forested areas according to the spatial differences in vegetation cover, which are evaluated by the vegetation cover index (VCI), and then perform filtering at the partition level by using CSF with an optimal parameter setting. The method includes three sections: calculation of VCI, grid classification, and partition filtering. The method flow is shown in Figure 2.
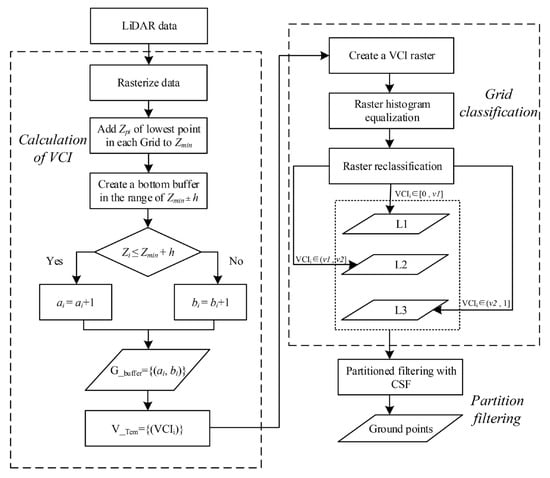
Figure 2.
Flow chart of the PCSF method.
2.4.1. Calculating the Vegetation Cover Index
The algorithm creates appropriately sized grids and calculates the VCI value for each grid to generate a VCI grid. The VCI was proposed to evaluate the vegetation cover level, and its acquisition processes are shown in Figure 3. First, the relatively low points and relatively high points were distinguished in the local range, and then the vegetation coverage was expressed by the percentage of relatively high points, namely, the VCI. The details are as follows.
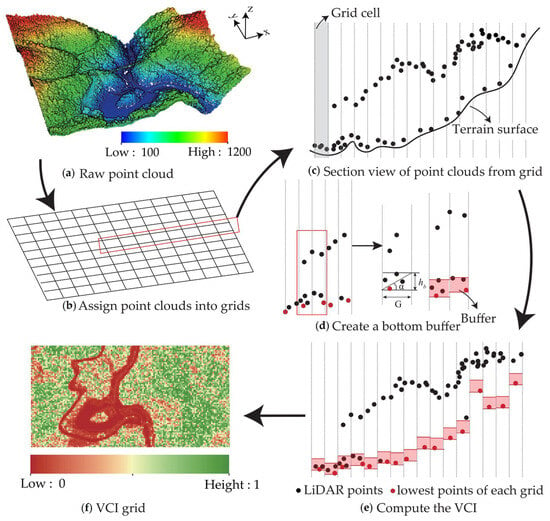
Figure 3.
Sketch map of vegetation cover index (VCI) acquisition. (a) Raw point cloud; (b–e) construction and derivation process of the VCI; (f) converted VCI grid data.
- Search for the lowest point in each grid.
At a fine scale, the lowest point of a spatial dataset is generally assumed to be the ground point [18]. According to this theory, we projected the LiDAR point clouds on the XY plane and assigned them into suitably sized grids so that the topographic variation within each grid was as consistent as possible. Then, the Z-coordinate of the lowest point Pi in each grid was queried, denoted as Zpi, and added to the dataset Zmin. If there was no point cloud distribution in the current grid, Zpi = 0 was defined. Referring to Wan et al. [33] and considering that the terrain change within each grid was not significant and the quantity of point clouds needed to generate a reliable VCI, the grid size G was determined to be 2 m.
- 2.
- Create a bottom buffer.
Bottom buffers for each grid based on dataset Zmin were established in this step. Centered at Z = Zpi, the bottom buffer with a width threshold of hb was retrieved up and down along the Z-axis direction. The width threshold hb depends on the grid size and satisfies the following relation (Equation (3)). Then, the number of point clouds inside and outside the bottom buffer for each grid was recorded, namely, the number of relatively low points (ai) and relatively high points (bi). Finally, dataset G_buffer = {(ai, bi) |i = 1,2,3,…, n} (n is the number of grids) is obtained.
where hb is the buffer width threshold, G is the grid size, and α indicates the average slope of the study area. Here, we set α = 30°.
- 3.
- Compute the VCI.
The VCI of each grid was calculated using dataset G_buffer and stored in the dataset V_Tem = {(VCIi) |i = 1,2,3,…, n} (n is the number of grids). VCIi represents the percentage of relatively high points (Equation (4)), and if there is no point distribution in the grid, the VCIi of the current grid will be recorded as 0. The more relatively high points there are the larger the VCIi and the higher the vegetation coverage.
where ai is the number of relatively low points and bi is the number of relatively high points.
2.4.2. Grid Classification
The VCI grid was reclassified and segmented into three partitions—L1, L2, and L3—which were sorted into increasing order of vegetation coverage. This process was performed in ArcMap 10.6 software. First, the VCI grid was reclassified according to its pixel value VCIi. One-third (v1) and two-thirds (v2) of the VCI range were set as the threshold values, VCIi [0, v1] for L1, VCIi [v1, v2] for L2, and VCIi [v2, 1] for L3. Then, the vector boundaries of the three types of partitions were extracted, which were utilized to clip raw point clouds of the forested areas.
2.4.3. Partition Filtering
We implement partitioned filtering for each partition. CSF with optimal parameter settings is applied to each partition separately for ground filtering. CSF is a surface-based filtering algorithm that adapts the “cloth simulation” of 3D computer graphics to the filtering process of LiDAR clouds [30]. Construct a mass-spring model to simulate the “cloth” the displacement of masses is controlled by gravity and the internal force of the model, thus changing the shape of the cloth to simulate the terrain. First, the original point cloud is turned upside down, and then the cloth model is assumed to fall from above the inverse point cloud by gravity. The final shape of the cloth is determined by analyzing the interaction between the particles of cloth and the surrounding LiDAR points, as well as between the particles of the cloth. Finally, the point clouds are classified into ground and non-ground points according to the distance between the points and the cloth model (Figure 4).
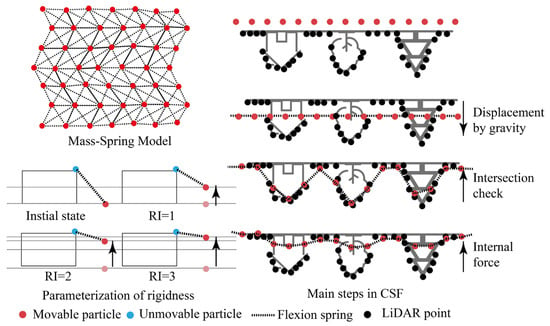
Figure 4.
Schematic diagram of the CSF principle.
Major parameters of CSF include rigidness (RI), grid resolution (GR), and distance threshold (hcc), where RI is the most critical parameter and determines the magnitude of the internal force of the cloth model. Opting for an appropriate RI for different vegetation cover areas can yield a superior filtering result. For areas with sparse vegetation cover, the sensor of the UAV-LiDAR scanner receives many echoes from the ground. Therefore, the smaller the RI is, the softer the simulation cloth and the finer the depiction of terrain changes. As surface vegetation cover increases, decreasing LiDAR points fall on the ground, with a smaller RI, and it is more likely that vegetation points will be mistaken for ground points (Figure 5). Based on such characteristics, an RI of 1 was set in L1, an RI of 2 was set in L2, an RI of 3 was set in L3, and then ground filtering was executed at the partition level. In addition, a sensitivity analysis of parameters GR and hcc was carried out in the discussion (Section 4) considering their effects on the filtering results of different partitions.
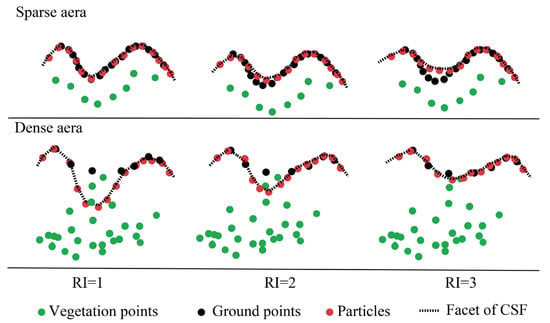
Figure 5.
RI sensitivity of the CSF algorithm for different regions.
2.5. Accuracy Evaluation
2.5.1. Vegetation Cover Index Reliability Evaluation
The reliability of the VCI was validated by the canopy coverage (CC). CC extracted using LiDAR data is reliable and has been used as reference data, indicating its coverage in several previous studies [43,44]. The acquisition process of CC is as follows. First, the digital surface model (DSM) and digital elevation model (DEM) are generated by a triangulated irregular network (TIN) interpolation algorithm using the uppermost points of the vegetation points and ground points of reference filtered data [45]. Then, the two are subtracted to obtain the canopy height model (CHM) [46,47], which is employed to calculate CC (Equation (5)).
where represents the number of tree crown attributes within the grid, and represents the total number of grids.
2.5.2. Validation of the Filtering
Quality and quantitative evaluations were performed to evaluate the filtering accuracy and reliability. The ground points obtained by filtering methods were utilized to generate DEMs, which were used to qualitatively illustrate the filtering performance of the proposed PCSF. The quantitative evaluation metrics include the type I error (TI), type II error (TII), total error (TE), and kappa coefficient, which were calculated using the cross matrix of errors (Table 1) [48]. The type I error represents the ground points misclassified as non-ground points, the type II error indicates the non-ground points misclassified as ground points, and the total error represents the ratio of all misclassified points to the total number of point clouds [49].

Table 1.
Calculation of evaluation metrics.
The comparison of quantitative evaluations was made with four classic filtering algorithms to demonstrate the ability of PCSF, including slope-based [15], PTD [18], moving surface fitting filtering (MSFF) [23], and CSF [21]. The implementation of the slope-based and MSFF in Point Cloud Magic (PCM) software V2.0, PTD in LiDAR360 V5.0, and CSF in Python 3.7 were adopted, while several combinations of parameters were evaluated to acquire the best filtering results. Table 2 lists the parameter setting combinations of the four comparative methods. The parameter settings corresponding to the results with the lowest total error were adopted. In addition, the quality of the DEM and filtering details of the CSF and PCSF were compared to illustrate the finesse of the proposed method.

Table 2.
Parameter settings of the comparative methods.
2.5.3. Tree Height Extraction and Accuracy Evaluation
The marker-controlled watershed algorithm was used for individual tree segmentation and extracting their coordinates. Then, the maximum–minimum method was performed to estimate individual tree heights [50,51]. The coefficient determination R2 (Equation (6)), the root mean squared error (RMSE) (Equation (7)), and the relative root mean squared error (rRMSE) (Equation (8)) were used to assess the accuracy of tree height extraction [52].
where m represents the number of parameters, represents the extracted parameter, represents the reference parameter, and represents the average value of the measured parameters.
3. Results
3.1. Vegetation Cover Index Partition
Figure 6 shows the reliability evaluation results of the VCI. The CC generated from LiDAR data and VCI were generally consistent (Figure 6a,b). The Pearson correlation analysis between VCI and CC illustrated that VCI has a significant positive correlation with CC, with a correlation coefficient of r = 0.708 (p < 0.05) (Figure 6c).
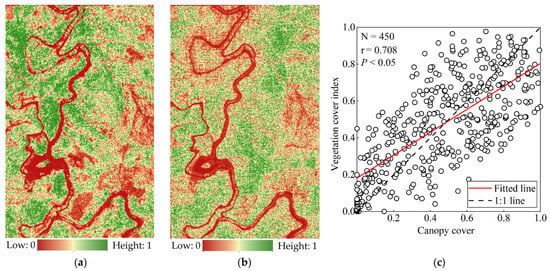
Figure 6.
Vegetation coverage calculation results. (a) Canopy cover (CC); (b) vegetation cover index (VCI); (c) VCI and CC fitting results.
The partitioning and filtering results of the experimental area are presented in Figure 7. The distribution of L1, L2, and L3 was interspaced (Figure 7a). L1 was distributed in a linear pattern, and the feature types in the area were dominated by forested roads and buildings. The L2 and L3 areas were dominated by vegetation and were distributed in patches and blocks, with L2 having a smaller area, mainly around L1, and the largest percentage of the area was occupied by L3. The filtering results indicated that PCSF could filter a large forested area (Figure 7b).
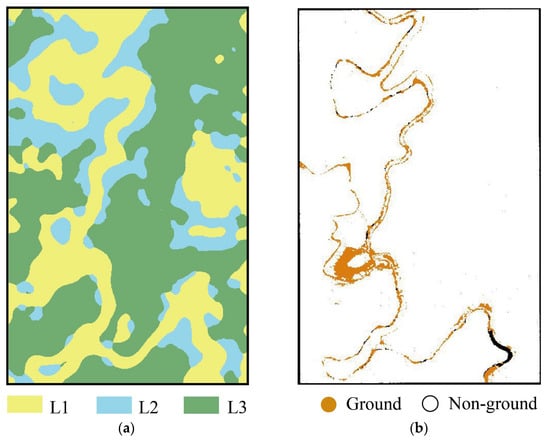
Figure 7.
(a) Partitioning results; (b) filtering results.
3.2. Accuracy of Ground Filtering
3.2.1. Quality Evaluation
The spatial distribution of type I and type II errors and the point cloud cross-sections of CSF and PCSF are shown in Figure 8. The results demonstrated that type I error points were more likely to occur in areas with sparse vegetation cover, and type II errors mainly existed in areas with dense vegetation cover. Compared with CSF, PCSF significantly reduced type I errors (Figure 8b,c) and slightly decreased type II errors (Figure 8i,j). As shown by the point cloud cross-section details, PCSF could distinguish ground and non-ground points effectively (Figure 8d,e,i,j)
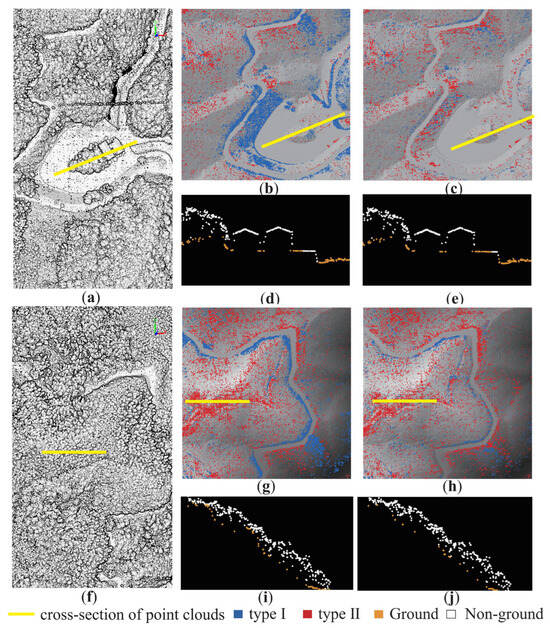
Figure 8.
Results of each group: (the first column) shows the raw point clouds, (the second column) shows the error distribution and point cloud cross-section of CSF, (the third column) shows the error distribution and point cloud cross-section of PCSF; (a–e) represent the raw point clouds and filtering results of the sparsely vegetation covered area; (f–j) represent the raw point clouds and filtering results of densely vegetation covered area.
The comparison of the DEMs generated by the CSF and PCSF showed that both CSF and PCSF were able to preserve the principal terrain features, and the latter was more efficient in preserving terrain details (Figure 9). For sparser vegetation areas, the DEM surface of PCSF had remarkably fewer unnatural triangular surfaces than that of CSF (Figure 9a,c). For dense vegetation cover areas, the DEM of PCSF was smoother, with a less uneven convex hull, and closer to the reference DEM (Figure 9d–f).
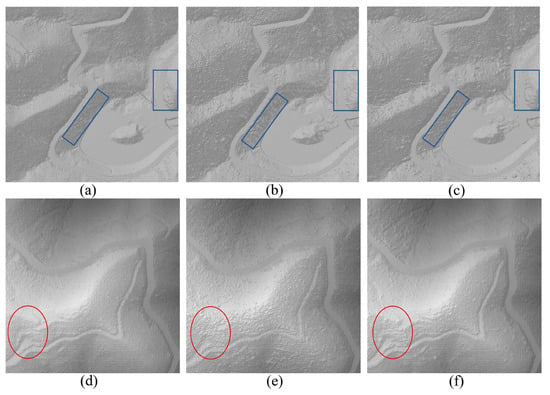
Figure 9.
Comparison of the DEM details. (a–c) represent the DEMs of the reference data, CSF, and PCSF in the sparse vegetation cover area, respectively; (d–f) represent the DEMs of the reference data, CSF, and PCSF in the dense vegetation cover area, respectively. The red circle indicates the “convex hull” in the DEM, and the blue box indicates the lack of terrain details.
3.2.2. Quantitative Evaluation
The filtering errors and kappa coefficients of the five filtering methods are shown in Table 3. The type I errors were greater than the type II errors in all five filtering methods. The type I error of PTD was the greatest at 24.71%, and the type II error of the slope-based method was the greatest at 4.53%. The total errors were less than 6.35% in all filtering methods, among which the total error of PCSF was 2.13%, with a 2.12%–4.22% reduction compared to the others. PCSF yielded the highest kappa coefficient of 90.17%, which was 4.78% higher than that of CSF.

Table 3.
Accuracy comparison of five methods.
3.3. Evaluation of Stand Parameter Extraction
In this study, a total of 131 individual trees could be correctly segmented from the CHM obtained after processing by all five filtering methods. To analyze the effect of filtering on tree height estimation by LiDAR data, we compared their extraction accuracy (Figure 10). The extracted tree height of slope-based filtering was determined to be the worst, with an R2 of 0.84 and the highest RMSE of 1.00 m. PCSF achieved the best fitting effect (R2 = 0.93) and the lowest RMSE of 0.53 m. The rRMSE of PCSF was reduced by 1.24%–3.84% compared with other methods. A significance test of the absolute values of tree height residuals showed that PCSF significantly differed from other methods (p < 0.05), which indicated that filtering with PCSF can significantly improve the extraction accuracy of tree heights.
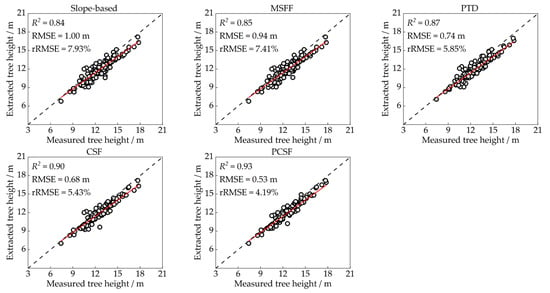
Figure 10.
Accuracy of the extracted tree height.
4. Discussion
4.1. Parameter Sensitivity of PCSF
The PCSF includes a user-defined parameter, the average slope α, and three default parameters—the rigidness (RI), the grid resolution (GR), and the distance threshold (hcc). We analyzed the fitting results of the CC and the VCI estimated with different α (from 10° to 60° with steps of 5°) (Figure 11) and found that, with increasing α, the R2 first increases, peaks at α of 30°, and then decreases. The RMSE is the opposite, while the mean of VCI continues to decrease. Notably, the VCI mean at α = 30° is slightly larger than the CC, while at α = 45°, it is closest to the CC. This may occur because vegetation distribution in this area is highly variable, and the overall average vegetation cover fails to reflect localized variance. Therefore, an α = 30° may better characterize local vegetation cover. This finding is consistent with previous slope measurements in the Lutou Forestry Farm. When α > 45°, the VCI mean is consistently lower than the CC because larger α values increase buffer width hb, causing more points to be misclassified as low points and resulting in VCI underestimation.
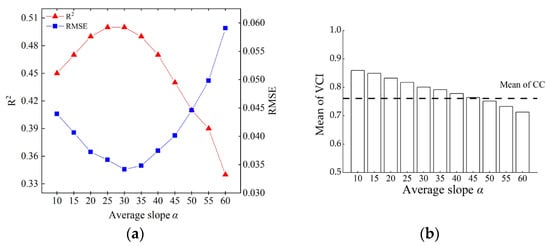
Figure 11.
VCI estimation results for different average slopes α. (a) Accuracy of VCI with different α; (b) mean of VCI with different α.
RI, GR, and hcc are key parameters of CSF. RI was set based on the partitioning results (Section 3). GR affects the filtering fineness and working time, and hcc determines the classification of raw points as ground points and non-ground points. To quantify their effects on the filtering results, we performed a sensitivity analysis of GR (from 0.3–2 m) and hcc (from 0.2–2 m with steps of 0.2 m). As shown in Figure 12, the total error (TE) of the three partitions continues to increase with increasing GR (Figure 12a–c). The size of GR determines the number of cloth particles and is closely related to the fineness of the cloth model [30]. The number of particles increases with a smaller GR, and the cloth model becomes finer, decreasing the filtering error.
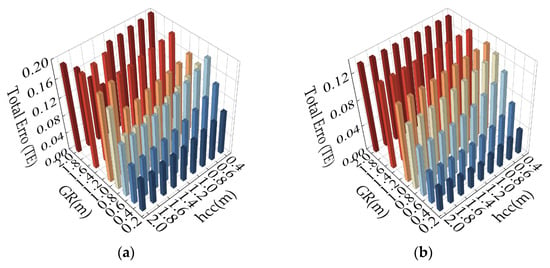
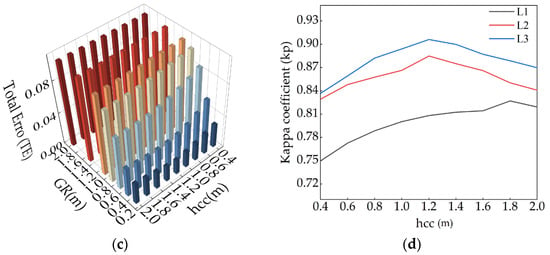
Figure 12.
Parameter sensitivity of CSF. (a) Total error (TE) for different parameter settings in Region L1; (b) TE for different parameter settings in Region L2; (c) TE for different parameter settings in Region L3; (d) kappa for different parameter hcc settings in three regions.
With the increase in hcc, the trend of changes in filtering accuracy TE values in the three partitions is similar. Additionally, we found that limiting values exist for hcc, which differ in diverse vegetation cover areas. When hcc is lower than the limiting value, TE decreases with increasing hcc; when hcc is higher than that, TE increases with increasing hcc (Figure 12a–c). To explore partition-specific hcc thresholds, GR was set as 0.3 m, and the correlation of filtering accuracy (kappa) and hcc of the three partitions is illustrated in Figure 12d. L2 and L3 yielded the highest filtering accuracy at an hcc of 1.2 m, and L1 achieved the highest filtering accuracy at an hcc of 1.8 m. This occurs because the vegetation in L1 is sparse, and thus, the collected points are dominated by ground points. Setting a higher hcc can reduce the misclassification of ground points. Both L2 and L3 contain a great number of vegetation points and have similar feature characteristics, so the sensitivity analysis results of hcc in L2 and L3 are consistent. The large density of point clouds, where ground points that have not been correctly classified still persist in L1 and cause a high type I error, may be the reason why the filtering accuracy of L3 is higher than that of L1. A similar result was obtained by Cai et al. [53] when using a high density of point clouds for ground filtering. In addition, the surface in L3 is covered by only uniformly distributed vegetation. In contrast, the surface cover in L1 is more complex (including sparse low vegetation, bridges, roads, and buildings), increasing the difficulty of filtering and leading to low accuracy. The results of Chen et al. [54] and Moudry et al. [28] also illustrate that the simpler the ground cover is, the better the filtering results in the region.
4.2. PCSF Performance Analysis
Compared with the slope-based MSFF, PTD, and CSF, PCSF showed superior accuracy and robustness in a large-scale forested area, with optimal performance in the evaluation metrics of filtering TE (Table 3) and tree height extraction RMSE (Figure 10). PCSF-generated DEMs yielded the best results with enhanced terrain detail (Figure 8, Figure 9 and Figure 13).
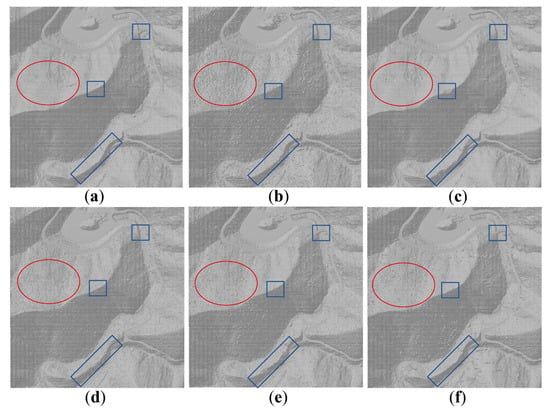
Figure 13.
DEM comparison. (a–f) DEMs generated from the reference data, slope-based filtering, PTD, MSFF, CSF, and PCSF, respectively. The red circles indicate the “convex hull” of the DEM, and blue boxes indicate the missing terrain of the DEM.
In dense vegetation, slope-based methods filtering tended to separate more ground points, which contributed to the misclassification of non-ground points and thus produced rough convex hulls on the DEM surfaces (Figure 13b), while the PCSF-generated DEM was much smoother (Figure 13f). This is because the slope-based method discriminates ground points from non-ground points based on a fixed slope threshold [15]. It is difficult to ensure a complete terrain with a lower slope threshold, while a higher threshold will misclassify the objective points as ground points [43]. PCSF preserves topography by fitting cloth models to terrain surfaces, enabling accurate ground point identification across large areas [30]. However, when the vegetation is too dense, there may be few understory points colliding with the particle of the cloth model, leading to topographic errors [23].
In sparse vegetation, PTD MSFF and CSF showed topographic deficiencies (shown as blue boxes in Figure 13b,c), while PCSF retained the complete topography and captured more topographic details (Figure 13f). PTD and MSFF failed to identify in-plane bridges (Figure 13b,c shown as blue boxes), probably because the ground seed points identified by PTD and MSFF are too sparse. PTD prefers to carefully select ground points to minimize type II errors during the TIN iterative densification process [20,55], while MSFF ignores surfaces during fitting [56]. In contrast, CSF and PCSF better followed the real terrain more closely by mass-spring iterations. In ridges with large topographic variations, CSF showed some “ridge flattening”, since CSF with a single parameter setting for global filtration could not adjust for local differences [32]. PCSF addressed this by partitioning via VCI, accommodating local variations.
4.3. Advantages and Disadvantages of PCSF in Forested Areas
Vegetation is the dominant characteristic of forested areas, with spatial variation in distribution and coverage, which are considered an indicator of forest stratification and partition [57]. PCSF adopted a partition scheme based on the vegetation cover differences across the study area, achieving forest partitioning more effectively than schemes using topographic features used in previous studies [33,34], and thus demonstrated superiority in complex forest scenarios with large continuous areas.
In terms of metrics for evaluating the vegetation cover, we constructed the VCI, whose basic principle relies on discrepancies in UAV-LiDAR point clouds recorded across diverse vegetation coverage zones. Specifically, as the vegetation cover increases, the number of point clouds recording ground information decreases, while the number of vegetation point clouds increases. Hence, the proportion of vegetation point clouds can represent the degree of vegetation cover. Compared with other indicators, such as canopy coverage [44] or gap ratio [58], VCI is calculated directly using the spatial coordinate information of raw point clouds, offering straightforwardness in theory and producing stable and reliable results (Figure 6). Moreover, the VCI is theoretically almost unaffected by the point cloud density. The probability of the UAV-LiDAR point clouds reaching the ground and canopy only depends on the vegetation cover status of a certain area. The ratio of high-to-low classified points remains stable across densities, ensuring consistent partitioning. Research of Ma et al. [44] demonstrated that the accuracy of vegetation cover estimation can be stabilized at a high level when the point cloud density is between 1 and 10 pts/m2, with significant degradation occurring only below 1 pts/m2.
However, PCSF has deficiencies. It is sensitive to the quality of LiDAR data. When excessive noise or abnormal stratification exists in the point cloud, it may lead to filtering errors and affect tree height extraction results. The partitioning strategy of PCSF has limitations. Sensitivity analysis of the average slope α (Figure 11) shows VCI underestimation and rising RMSE when α > 45°. Thus, filtering steep slopes (>45°) risks erroneous partitioning. Future research can be carried out in terms of partitioning strategy optimization. Hierarchical multilevel filtering offers promising improvements [59], while deep learning-based and semantic segmentation approaches may advance partition methods [60,61].
5. Conclusions
In this research, a PCSF method based on the VCI was proposed and validated with UAV-LiDAR data and field measurement data collected from the Lutou Experimental Forest Farm of CSUFT. Filtering and tree height extraction results were compared against four classical filtering algorithms (slope-based, PTD, MSFF, and CSF). From the results, the following conclusions can be drawn:
- (1)
- The VCI can be used as an evaluation index of forest vegetation cover, and its results are reliable. The VCI and CC fitting results are linearly distributed, showing a significant positive correlation, with an r of 0.708 (p < 0.05);
- (2)
- The PCSF effectively improves the filtering accuracy over a large forested area. Among the five methods, PCSF has the smallest total error (TE = 2.98%) and the highest accuracy (kappa = 88.29%), and the generated DEM is closest to the reference data.
- (3)
- The PCSF significantly improves the accuracy of tree height extraction, with rRMSE reduced by 1.24%–3.84% compared with other methods.
Overall, the utilization of vegetation cover for forest area segmentation proves to be both feasible and effective. Comparative analysis reveals that partitioned filtering demonstrates superior performance to global filtering approaches, particularly in achieving enhanced accuracy in point cloud processing and subsequent tree parameter extraction. This work establishes a theoretical framework for UAV-LiDAR applications in precise individual tree height estimation within large-scale forest ecosystems. Nevertheless, the PCSF methodology exhibits limitations in topographically complex terrains, showing reduced adaptability to steep slopes and areas with sparse vegetation distribution, which may result in potential filtering inaccuracies. Future investigations will prioritize the development of optimized spatial partitioning strategies for forested landscapes, with particular emphasis on improving topographic adaptability and edge detection algorithms. Achieving high-precision ground point filtering in complex scenarios by partitioning forests into multi-scale sub-units, training region-specific parameter sets using ensemble models to minimize manual calibration, and constructing a point cloud filtering framework that balances computational efficiency with precision across diverse forest structures.
Author Contributions
Conceptualization, K.M.; Formal analysis, J.Y., H.S., S.C. and M.G.; Funding acquisition, K.M., H.S. and C.L.; Investigation, K.M., S.C. and M.G.; Methodology, J.Y., H.S. and C.L.; Validation, K.M. and S.C.; Writing—original draft, K.M. and J.Y.; Writing—review and editing, C.L. All authors have read and agreed to the published version of the manuscript.
Funding
This research was funded by the Natural Science Foundation of China, grant number 32471861 and 31971578; the Hunan Provincial Natural Science Foundation of China, grant number 2022JJ30078 and 2025JJ80004; and the Science and Technology Innovation Program of Hunan Province, grant number 2023RC1065.
Data Availability Statement
Data are contained within the article.
Conflicts of Interest
The authors declare no conflicts of interest.
References
- Hunka, N.; May, P.; Babcock, C.; Rosa, J.; Soriano, M.; Saucedo, R.; Armston, J.; Santoro, M.; Suarez, D.; Herold, M.; et al. A geostatistical approach to enhancing national forest biomass assessments with Earth Observation to aid climate policy needs. Remote Sens. Environ. 2025, 318, 114557. [Google Scholar] [CrossRef]
- Liang, X.; Hyyppä, J.; Kaartinen, H.; Lehtomäki, M.; Pyörälä, J.; Pfeifer, N.; Holopainen, M.; Brolly, G.; Francesco, P.; Hackenberg, J.; et al. International Benchmarking of Terrestrial Laser Scanning Approaches for Forest Inventories. ISPRS J. Photogramm. Remote Sens. 2018, 144, 137–179. [Google Scholar] [CrossRef]
- Kašpar, V.; Zapletal, M.; Samec, P.; Komárek, J.; Bílek, J.; Juráň, S. Unmanned aerial systems for modelling air pollution removal by urban greenery. Urban For. Urban Green. 2022, 78, 127757. [Google Scholar] [CrossRef]
- Mercier, A.; Myllymäki, M.; Hovi, A.; Schraik, D.; Rautiainen, M. Exploring the potential of SAR and terrestrial and airborne LiDAR in predicting forest floor spectral properties in temperate and boreal forests. Remote Sens. Environ. 2025, 316, 114486. [Google Scholar] [CrossRef]
- Liang, X.; Kukko, A.; Hyyppä, J.; Lehtomäki, M.; Pyörälä, J.; Yu, X.; Kaartinen, H.; Jaakkola, A.; Wang, Y. In-situ measurements from mobile platforms: An emerging approach to address the Old Challenges Associated with Forest Inventories. ISPRS J. Photogramm. Remote Sens. 2018, 143, 97–107. [Google Scholar] [CrossRef]
- Li, X.; Li, L.; Ni, W.; Mu, X.; Wu, X.; Laurin, G.; Vangi, E.; Stereńczak, K.; Chirici, G.; Yu, S.; et al. Validating GEDI tree canopy cover product across forest types using co-registered aerial LiDAR data. ISPRS J. Photogramm. Remote Sens. 2024, 207, 326–337. [Google Scholar] [CrossRef]
- Qin, H.; Zhou, W.; Yao, Y.; Wang, W. Individual Tree Segmentation and Tree Species Classification in Subtropical Broadleaf Forests Using UAV-Based LiDAR, Hyperspectral, and Ultrahigh-Resolution RGB Data. Remote Sens. Environ. 2022, 280, 113143. [Google Scholar] [CrossRef]
- Zhang, R.; Huang, J.; Liu, Y.; Wang, X.; Li, Y.; Zeng, Y.; Liu, P.; Wang, X.; Zhang, Z.; Zhang, J.; et al. Unveiling Scale-Dependent Elevational Patterns and Drivers of Tree β Diversity on a Subtropical Mountain Using Sentinel-2 Remote Sensing Data. Forest 2025, 16, 917. [Google Scholar] [CrossRef]
- Ma, K.; Xiong, Y.; Jiang, F.; Chen, S.; Sun, H. A Novel Vegetation Point Cloud Density Tree-Segmentation Model for Overlapping Crowns Using Uav Lidar. Remote Sens. 2021, 13, 1442. [Google Scholar] [CrossRef]
- Chen, Z.; Dai, L.; Wang, D.; Guo, Q.; Zhao, R. FS-MVSNet: A Multi-View Image-Based Framework for 3D Forest Reconstruction and Parameter Extraction of Single Trees. Forests 2025, 16, 927. [Google Scholar] [CrossRef]
- Kükenbrink, D.; Marty, M.; Rehush, N.; Abegg, M.; Ginzler, C. Evaluating the potential of handheld mobile laser scanning for an operational inclusion in a national forest inventory-A Swiss case study. Remote Sens. Environ. 2025, 321, 114685. [Google Scholar] [CrossRef]
- Fareed, N.; Flores, J.P.; Das, A.K. Analysis of UAS-LiDAR Ground Points Classification in Agricultural Fields Using Traditional Algorithms and PointCNN. Remote Sens. 2023, 15, 483. [Google Scholar] [CrossRef]
- Cai, S.; Yu, S.; Hui, Z.; Tang, Z. ICSF: An Improved Cloth Simulation Filtering Algorithm for Airborne LiDAR Data Based on Morphological Operations. Forests 2023, 14, 1520. [Google Scholar] [CrossRef]
- Nie, S.; Wang, C.; Xi, X.; Luo, S.; Zhu, X.; Li, G.; Liu, H.; Tian, J.; Zhang, S. Assessing the Impacts of Various Factors on Treetop Detection Using LiDAR-Derived Canopy Height Models. IEEE Trans. Geosci. Remote Sens. 2019, 57, 10099–10115. [Google Scholar] [CrossRef]
- Vosselman, G. Slope Based Filtering of Laser Altimetry Data. Int. Arch. Photogramm. Remote Sens. 2000, 33, 935–942. [Google Scholar]
- Sithole, G.; Vosselman, G. Filtering of Laser Altimetry Data Using a Slope Adaptive Filter. Int. Arch. Photogramm. Remote Sens. 2001, 34, 203–210. [Google Scholar]
- Nie, S.; Wang, C.; Dong, P. A Revised Progressive TIN Densification for Filtering Airborne LiDAR Data. Measurement 2017, 104, 70–77. [Google Scholar] [CrossRef]
- Ni, Z.; Shi, K.; Cheng, X.; Wu, X.; Yang, J.; Pang, L.; Shi, Y. Research on UAV-LiDAR-Based Detection and Prediction of Tree Risks on Transmission Lines. Forests 2025, 16, 578. [Google Scholar] [CrossRef]
- Li, F.; Zhu, H.; Luo, Z.; Shen, H.; Li, L. An Adaptive Surface Interpolation Filter Using Cloth Simulation and Relief Amplitude for Airborne Laser Scanning Data. Remote Sens. 2021, 13, 2938. [Google Scholar] [CrossRef]
- Zhao, X.; Guo, Q.; Su, Y.; Xue, B. Improved Progressive TIN Densification Filtering Algorithm for Airborne LiDAR Data in Forested Areas. ISPRS J. Photogramm. Remote Sens. 2016, 117, 79–91. [Google Scholar] [CrossRef]
- Huang, J.; Wang, Y.; Yu, Y. Multi-Criteria Filtration and Extraction Strategy for Understory Elevation Control Points Using ICESat-2 ATL08 Product. Forests 2024, 15, 2064. [Google Scholar] [CrossRef]
- Liu, W.; Zhang, Y.; Ge, X.; Li, Y.; Liu, Y.; Bu, X.; Liang, X. An Improved Knowledge-Based Ground Moving Target Relocation Algorithm for a Lightweight Unmanned Aerial Vehicle-Borne Radar System. Remote Sens. 2025, 17, 1182. [Google Scholar] [CrossRef]
- Cai, S.; Liang, X.; Yu, S. A Progressive Plane Detection Filtering Method for Airborne LiDAR Data in Forested Landscapes. Forests 2023, 14, 498. [Google Scholar] [CrossRef]
- Zhang, K.; Chen, S.C.; Whitman, D.; Shyu, M.L.; Yan, J.; Zhang, C. A Progressive Morphological Filter for Removing Nonground Measurements from Airborne LIDAR Data. IEEE Trans. Geosci. Remote Sens. 2003, 41, 872–882. [Google Scholar] [CrossRef]
- Pingel, T.J.; Clarke, K.C.; McBride, W.A. An Improved Simple Morphological Filter for the Terrain Classification of Airborne LIDAR Data. ISPRS J. Photogramm. Remote Sens. 2013, 77, 21–30. [Google Scholar] [CrossRef]
- Hui, Z.; Hu, Y.; Yevenyo, Y.Z.; Yu, X. An Improved Morphological Algorithm for Filtering Airborne LiDAR Point Cloud Based on Multi-Level Kriging Interpolation. Remote Sens. 2016, 8, 35. [Google Scholar] [CrossRef]
- Hui, Z.; Jin, S.; Xia, Y.; Nie, Y.; Xie, X.; Li, N. A Mean Shift Segmentation Morphological Filter for Airborne LiDAR DTM Extraction under Forest Canopy. Opt. Laser Technol. 2021, 136, 106728. [Google Scholar] [CrossRef]
- Moudrý, V.; Klápště, P.; Fogl, M.; Gdulová, K.; Barták, V.; Urban, R. Assessment of LiDAR Ground Filtering Algorithms for Determining Ground Surface of Non-Natural Terrain Overgrown with Forest and Steppe Vegetation. Meas. J. Int. Meas. Confed. 2020, 150, 107047. [Google Scholar] [CrossRef]
- Chen, C.; Guo, J.; Wu, H.; Li, Y.; Shi, B. Performance Comparison of Filtering Algorithms for High-Density Airborne LiDAR Point Clouds over Complex Landscapes. Remote Sens. 2021, 13, 2663. [Google Scholar] [CrossRef]
- Zhang, W.; Qi, J.; Wan, P.; Wang, H.; Xie, D.; Wang, X.; Yan, G. An Easy-to-Use Airborne LiDAR Data Filtering Method Based on Cloth Simulation. Remote Sens. 2016, 8, 501. [Google Scholar] [CrossRef]
- Ma, K.; Li, C.; Jiang, F.; Xu, L.; Yi, J.; Huang, H.; Sun, H. Improvement of Treetop Displacement Detection by UAV-LiDAR Point Cloud Normalization: A Novel Method and A Case Study. Drones 2023, 7, 262. [Google Scholar] [CrossRef]
- Sun, J.; Zhang, Z.; Long, B.; Qin, S.; Yan, Y.; Wang, L.; Qin, J. Method for determining cloth simulation filtering threshold value based on Curvature Value of Fitting Curve. Int. J. Grid Util. Comput. 2021, 12, 276–286. (In Chinese) [Google Scholar] [CrossRef]
- Wan, P.; Zhang, W.; Skidmore, A.K.; Qi, J.; Jin, X.; Yan, G.; Wang, T. A Simple Terrain Relief Index for Tuning Slope-Related Parameters of LiDAR Ground Filtering Algorithms. ISPRS J. Photogramm. Remote Sens. 2018, 143, 181–190. [Google Scholar] [CrossRef]
- Qin, N.; Tan, W.; Ma, L.; Zhang, D.; Guan, H.; Li, J. Deep learning for filtering the ground from ALS point clouds: A dataset, evaluations and issues. ISPRS J. Photogramm. Remote Sens. 2023, 202, 246–261. [Google Scholar] [CrossRef]
- Grilli, E.; Menna, F.; Remondino, F. A Review of Point Clouds Segmentation and Classification Algorithms. Int. Arch. Photogramm. Remote Sens. Spat. Inf. Sci.-ISPRS Arch. 2017, 42, 339–344. [Google Scholar] [CrossRef]
- Yang, A.; Wu, Z.; Yang, F.; Su, D.; Ma, Y.; Zhao, D.; Qi, C. Filtering of Airborne LiDAR Bathymetry Based on Bidirectional Cloth Simulation. ISPRS J. Photogramm. Remote Sens. 2020, 163, 49–61. [Google Scholar] [CrossRef]
- Ni, H.; Lin, X.; Zhang, J.; Chen, D.; Peethambaran, J. Joint Clusters and Iterative Graph Cuts for ALS Point Cloud Filtering. IEEE J. Sel. Top. Appl. Earth Obs. Remote Sens. 2018, 11, 990–1004. [Google Scholar] [CrossRef]
- Qin, L.; Wu, W.; Tian, Y.; Xu, W. LiDAR Filtering of Urban Areas with Region Growing Based on Moving-Window Weighted Iterative Least-Squares Fitting. IEEE Geosci. Remote Sens. Lett. 2017, 14, 841–845. [Google Scholar] [CrossRef]
- Liu, C.; Li, J.; Zhang, S.; Ding, L. A Point Clouds Filtering Algorithm Based on Grid Partition and Moving Least Squares. Procedia Eng. 2012, 28, 476–482. [Google Scholar] [CrossRef]
- Zhang, J.; Lin, X. Filtering Airborne LiDAR Data by Embedding Smoothness-Constrained Segmentation in Progressive TIN Densification. ISPRS J. Photogramm. Remote Sens. 2013, 81, 44–59. [Google Scholar] [CrossRef]
- Pfeifer, N.; Stadler, P.; Briese, C. Derivation of Digital Terrain Models in the SCOP++ Environment. In Proceedings of the OEEPE Workshop on Airborne Laser scanning and Interferometric SAR for Detailed Digital Terrain Models, Stockholm, Sweden, 1–3 March 2001; p. 3612. [Google Scholar]
- Rusu, R.B.; Cousins, S. 3D Is Here: Point Cloud Library (PCL). In Proceedings of the 2011 IEEE International Conference on Robotics and Automation, Shanghai, China, 9–13 May 2011; pp. 1–4. [Google Scholar] [CrossRef]
- Zhao, X.; Su, Y.; Li, W.K.; Hu, T.; Liu, J.; Guo, Q. A Comparison of LiDAR Filtering Algorithms in Vegetated Mountain Areas. Can. J. Remote Sens. 2018, 44, 287–298. [Google Scholar] [CrossRef]
- Ma, Q.; Su, Y.; Guo, Q. Comparison of Canopy Cover Estimations from Airborne LiDAR, Aerial Imagery, and Satellite Imagery. IEEE J. Sel. Top. Appl. Earth Obs. Remote Sens. 2017, 10, 4225–4236. [Google Scholar] [CrossRef]
- Khosravipour, A.; Skidmore, A.K.; Isenburg, M. Generating Spike-Free Digital Surface Models Using LiDAR Raw Point Clouds: A New Approach for Forestry Applications. Int. J. Appl. Earth Obs. Geoinf. 2016, 52, 104–114. [Google Scholar] [CrossRef]
- Wulder, M.; Niemann, K.O.; Goodenough, D.G. Local Maximum Filtering for the Extraction of Tree Locations and Basal Area from High Spatial Resolution Imagery. Remote Sens. Environ. 2000, 73, 103–114. [Google Scholar] [CrossRef]
- Popescu, S.C.; Wynne, R.H.; Nelson, R.F. Estimating Plot-Level Tree Heights with Lidar: Local Filtering with a Canopy-Height Based Variable Window Size. Comput. Electron. Agric. 2003, 37, 71–95. [Google Scholar] [CrossRef]
- Sithole, G.; Vosselman, G. Report: ISPRS Comparison of Filters; ISPRS Commission III. Working Group; Department of Earth Observation and Space Systems, Delft University of Technology: Delft, The Netherlands, 2003; pp. 71–78. [Google Scholar]
- Cohen, J. A Coefficient of Agreement for Nominal Scales. Educ. Psychol. Meas. 1960, 20, 37–46. [Google Scholar] [CrossRef]
- Chen, Q.; Baldocchi, D.; Gong, P.; Kelly, M. Isolating Individual Trees in a Savanna Woodland Using Small Footprint LiDAR Data. Photogramm. Eng. Remote Sens. 2006, 72, 923–932. [Google Scholar] [CrossRef]
- Ma, K.; Chen, Z.; Fu, L.; Tian, W.; Jiang, F.; Yi, J.; Du, Z.; Sun, H. Performance and Sensitivity of Individual Tree Segmentation Methods for UAV-LiDAR in Multiple Forest Types. Remote Sens. 2022, 14, 298. [Google Scholar] [CrossRef]
- Tao, S.; Wu, F.; Guo, Q.; Wang, Y.; Li, W.; Xue, B.; Hu, X.; Li, P.; Tian, D.; Li, C.; et al. Segmenting Tree Crowns from Terrestrial and Mobile LiDAR Data by Exploring Ecological Theories. ISPRS J. Photogramm. Remote Sens. 2015, 110, 66–76. [Google Scholar] [CrossRef]
- Cai, S.; Zhang, W.; Liang, X.; Wan, P.; Qi, J.; Yu, S.; Yan, G.; Shao, J. Filtering Airborne LiDAR Data through Complementary Cloth Simulation and Progressive TIN Densification Filters. Remote Sens. 2019, 11, 1037. [Google Scholar] [CrossRef]
- Chen, C.; Wang, M.; Chang, B.; Li, Y. Multi-Level Interpolation-Based Filter for Airborne LiDAR Point Clouds in Forested Areas. IEEE Access 2020, 8, 41000–41012. [Google Scholar] [CrossRef]
- Lin, X.; Zhang, J. Segmentation-Based Filtering of Airborne LiDAR Point Clouds by Progressive Densification of Terrain Segments. Remote Sens. 2014, 6, 1294–1326. [Google Scholar] [CrossRef]
- Liu, X.; Chen, Y.; Cheng, L.; Yao, M.; Deng, S.; Li, M.; Cai, D. Airborne Laser Scanning Point Clouds Filtering Method Based on the Construction of Virtual Ground Seed Points. J. Appl. Remote Sens. 2017, 11, 016032. [Google Scholar] [CrossRef]
- Jiang, X.; Li, G.; Lu, D.; Chen, E.; Wei, X. Stratification-Based Forest Aboveground Biomass Estimation in a Subtropical Region Using Airborne LiDAR Data. Remote Sens. 2020, 12, 1101. [Google Scholar] [CrossRef]
- Ahmed, O.S.; Franklin, S.E.; Wulder, M.A. Integration of LiDAR and Landsat Data to Estimate Forest Canopy Cover in Coastal British Columbia. Photogramm. Eng. Remote Sens. 2014, 80, 953–961. [Google Scholar] [CrossRef]
- Chen, C.; Li, Y.; Yan, C.; Dai, H.; Liu, G.; Guo, J. An Improved Multi-Resolution Hierarchical Classification Method Based on Robust Segmentation for Filtering ALS Point Clouds. Int. J. Remote Sens. 2016, 37, 950–968. [Google Scholar] [CrossRef]
- Dai, H.; Hu, X.; Shu, Z.; Qin, N.; Zhang, J. Deep Ground Filtering of Large-Scale ALS Point Clouds via Iterative Sequential Ground Prediction. Remote Sens. 2023, 15, 961. [Google Scholar] [CrossRef]
- Dechesne, C.; Mallet, C.; Le Bris, A.; Gouet-Brunet, V. Semantic Segmentation of Forest Stands of Pure Species Combining Airborne Lidar Data and Very High-Resolution Multispectral Imagery. ISPRS J. Photogramm. Remote Sens. 2017, 126, 129–145. [Google Scholar] [CrossRef]
Disclaimer/Publisher’s Note: The statements, opinions and data contained in all publications are solely those of the individual author(s) and contributor(s) and not of MDPI and/or the editor(s). MDPI and/or the editor(s) disclaim responsibility for any injury to people or property resulting from any ideas, methods, instructions or products referred to in the content. |
© 2025 by the authors. Licensee MDPI, Basel, Switzerland. This article is an open access article distributed under the terms and conditions of the Creative Commons Attribution (CC BY) license (https://creativecommons.org/licenses/by/4.0/).