Article

Temperature Regulates BVOCs-Induced O3 Formation Potential Across Various Vegetation Types in the Sichuan Basin, China

College of Geography and Planning, Chengdu University of Technology, Chengdu 610059, China
*
Author to whom correspondence should be addressed.
Forests 2025, 16(7), 1091; https://doi.org/10.3390/f16071091
Submission received: 13 May 2025 / Revised: 19 June 2025 / Accepted: 25 June 2025 / Published: 1 July 2025
(This article belongs to the Section Forest Meteorology and Climate Change)

Abstract

Ground-level ozone (O3) pollution is a problem when managing air quality in China, and biogenic volatile organic compounds (BVOCs) are key precursors of O3 formation. Vegetation type and temperature influence BVOC emissions, yet the differences in emissions across vegetation types and their temperature responses still exhibit significant uncertainties. This study was focused on the Sichuan Basin in China. It used the G95 model to develop a high-resolution BVOC emission inventory, allowing the analysis of emission characteristics for different vegetation types. The study also used a temperature sensitivity algorithm to assess how temperature changes affect BVOC emissions. The impact of these emissions on regional O3 formation potential (OFP) was then quantified using the OFP method. The results show significant differences in BVOC emissions across vegetation types. Forests at the basin edges (mixed, broad-leaved, and coniferous) have much higher emission intensity (10.5 t/km2) than agricultural areas in the center of the basin (0.15 t/km2). In terms of composition, monoterpenes (MON) mainly dominate mixed and coniferous forests (42.28% and 58.37%, respectively), while isoprene (ISOP) dominates broad-leaved forests (64.02%). The study found that temperature generally increases BVOC emissions, which vary by vegetation type. Broad-leaved forests have the highest temperature sensitivity (3.94%), much higher than agricultural vegetation (0.03%). BVOC emissions exhibit a seasonal pattern of “high in summer, low in winter” and a spatial pattern of “high at the edges, low at the center”. Temperature also influences emission intensity and composition, thus driving variations in the potential for O3 formation. Seasonally, different vegetation types show structural changes in OFP contribution. Broad-leaved forests, dominated by ISOP, show a significant increase in summer contribution (+8.0%), becoming the main source of O3 precursors. In contrast, mixed forests, dominated by MON, show a clear decrease in summer contribution (−6.3%).

1. Introduction

Ground-level ozone (O3) pollution presents a significant challenge for air quality management in China. Its formation primarily depends on photochemical reactions between volatile organic compounds (VOCs) and nitrogen oxides (NOx) under sunlight [1,2,3]. As key precursors to O3, VOCs are either anthropogenic (AVOCs) or biogenic (BVOCs), depending on their source [4,5]. While stringent emission control policies have led to a decline in AVOC emissions in recent years [6], globally, BVOCs account for up to 90% of total VOC emissions [7]. Compared to AVOCs, BVOCs (e.g., isoprene and monoterpenes) react much faster with ·OH due to their unsaturated double-bond structures. This rapid reaction generates RO2 and HO2. These radicals then drive a chain reaction that consumes NO and recycles·OH. As a result, NO2 photolysis continuously produces O3, increasing ground-level ozone concentrations [8,9,10]. Notably, under high NOx conditions, this cycle becomes much more efficient. In contrast, under low NOx, RO2/HO2 may undergo self-reactions, terminating the chain and suppressing O3 formation [11,12,13]. Therefore, accurately quantifying BVOC emissions and their environmental drivers is critical for regional O3 pollution control.
BVOC emissions are highly dependent on vegetation type. Studies have shown that plants are primarily responsible for BVOC emissions [14,15]. The physiological metabolism pathways and leaf structures of different plant species result in marked variations in their emission profiles and intensity [16,17,18]. Consequently, vegetation distribution patterns influence regional BVOC emission levels and their ozone generation effects. Additionally, BVOC emissions are strongly influenced by environmental factors, with temperature being a central control factor. BVOC emissions are also controlled by multiple environmental factors. Temperature increases emission rates by boosting plant metabolism [19,20,21]. It may also change the composition of the BVOCs. Soil moisture strongly affects emissions. Drought reduces isoprene but increases monoterpenes in some trees [22,23]. Nutrients like nitrogen and phosphorus influence emissions too [24]. They affect plant growth and enzyme activity. Leaf development stage matters. CO2 levels also change emission patterns [25]. However, temperature has the strongest direct effect. It controls key enzymes like isoprene synthase. Higher temperature exponentially increases emissions. Global warming may amplify this effect [26]. While substantial progress has been made in characterizing BVOC emission patterns [27], particularly regarding temperature responses and the distinct emission profiles of different forest types (tropical isoprene-dominated vs. boreal monoterpene-dominated systems), key mechanistic understanding and quantitative predictions still face challenges.
Researchers have systematically studied the mechanisms and influencing factors of BVOC emissions. Several emission models, including BEIS, GloBEIS, G95, and MEGAN, have been developed [14,28,29,30,31] and are widely used for regional and global BVOC emission simulations [32]. The G95 model, based on the G91 and G93 methods, incorporates a standardized vegetation classification system, a dynamic response mechanism for photosynthetically active radiation (PAR), and an optimized temperature dependence parameterization scheme. These features make simulating the spatial-temporal variations of BVOCs more accurate [33]. The G95 model has a simple structure. It requires fewer input data. This improves its versatility and ease of use. The model works well in data-limited regions. Studies show G95 performs reliably for regional emission inventories [34]. Regional BVOC inventories often face data constraints. G95 offers a practical solution. It balances accuracy with feasibility.
The Sichuan Basin is one of the most ozone-polluted regions in China because its unique geographical and meteorological conditions have led to the accumulation of air pollutants [35,36]. The region has diverse and extensive vegetation types. In 2020, the vegetation coverage reached 40.03%, a significant increase of 4.93% from 2010 [37]. Accordingly, the basin provides an ideal setting to study BVOC emission characteristics and their response to temperature changes. In recent years, Sichuan Province has implemented several policies to control VOC emissions, such as restricting vehicle use, reducing solvent emissions, and promoting clean production technologies, leading to a decline in AVOC emissions (https://www.sc.gov.cn/, accessed on 6 May 2025). However, the reduction and management of BVOCs have not received similar attention, with limited research and policy support.
This study systematically assessed the BVOC emission characteristics of different vegetation types, analyzed their response to temperature changes, and quantified their potential contribution to ozone formation. Using the G95 model, a high-resolution BVOC emission inventory for the Sichuan Basin was constructed to calculate the emissions and spatial-temporal distribution of key compounds such as isoprene and monoterpenes under different vegetation types. A temperature-sensitivity algorithm was also applied to design multiple temperature scenarios, quantifying the temperature response of BVOC emissions across vegetation types. Finally, using the ozone formation potential (OFP) method and maximum incremental reactivity (MIR) coefficients, the study evaluated the contribution intensity and differences in BVOCs from various vegetation sources to regional O3 formation.
The results provide targeted vegetation management recommendations for O3 pollution control in the Sichuan Basin and offer a new analytical perspective for regional BVOCs–O3 coupling research.

2. Materials and Methods
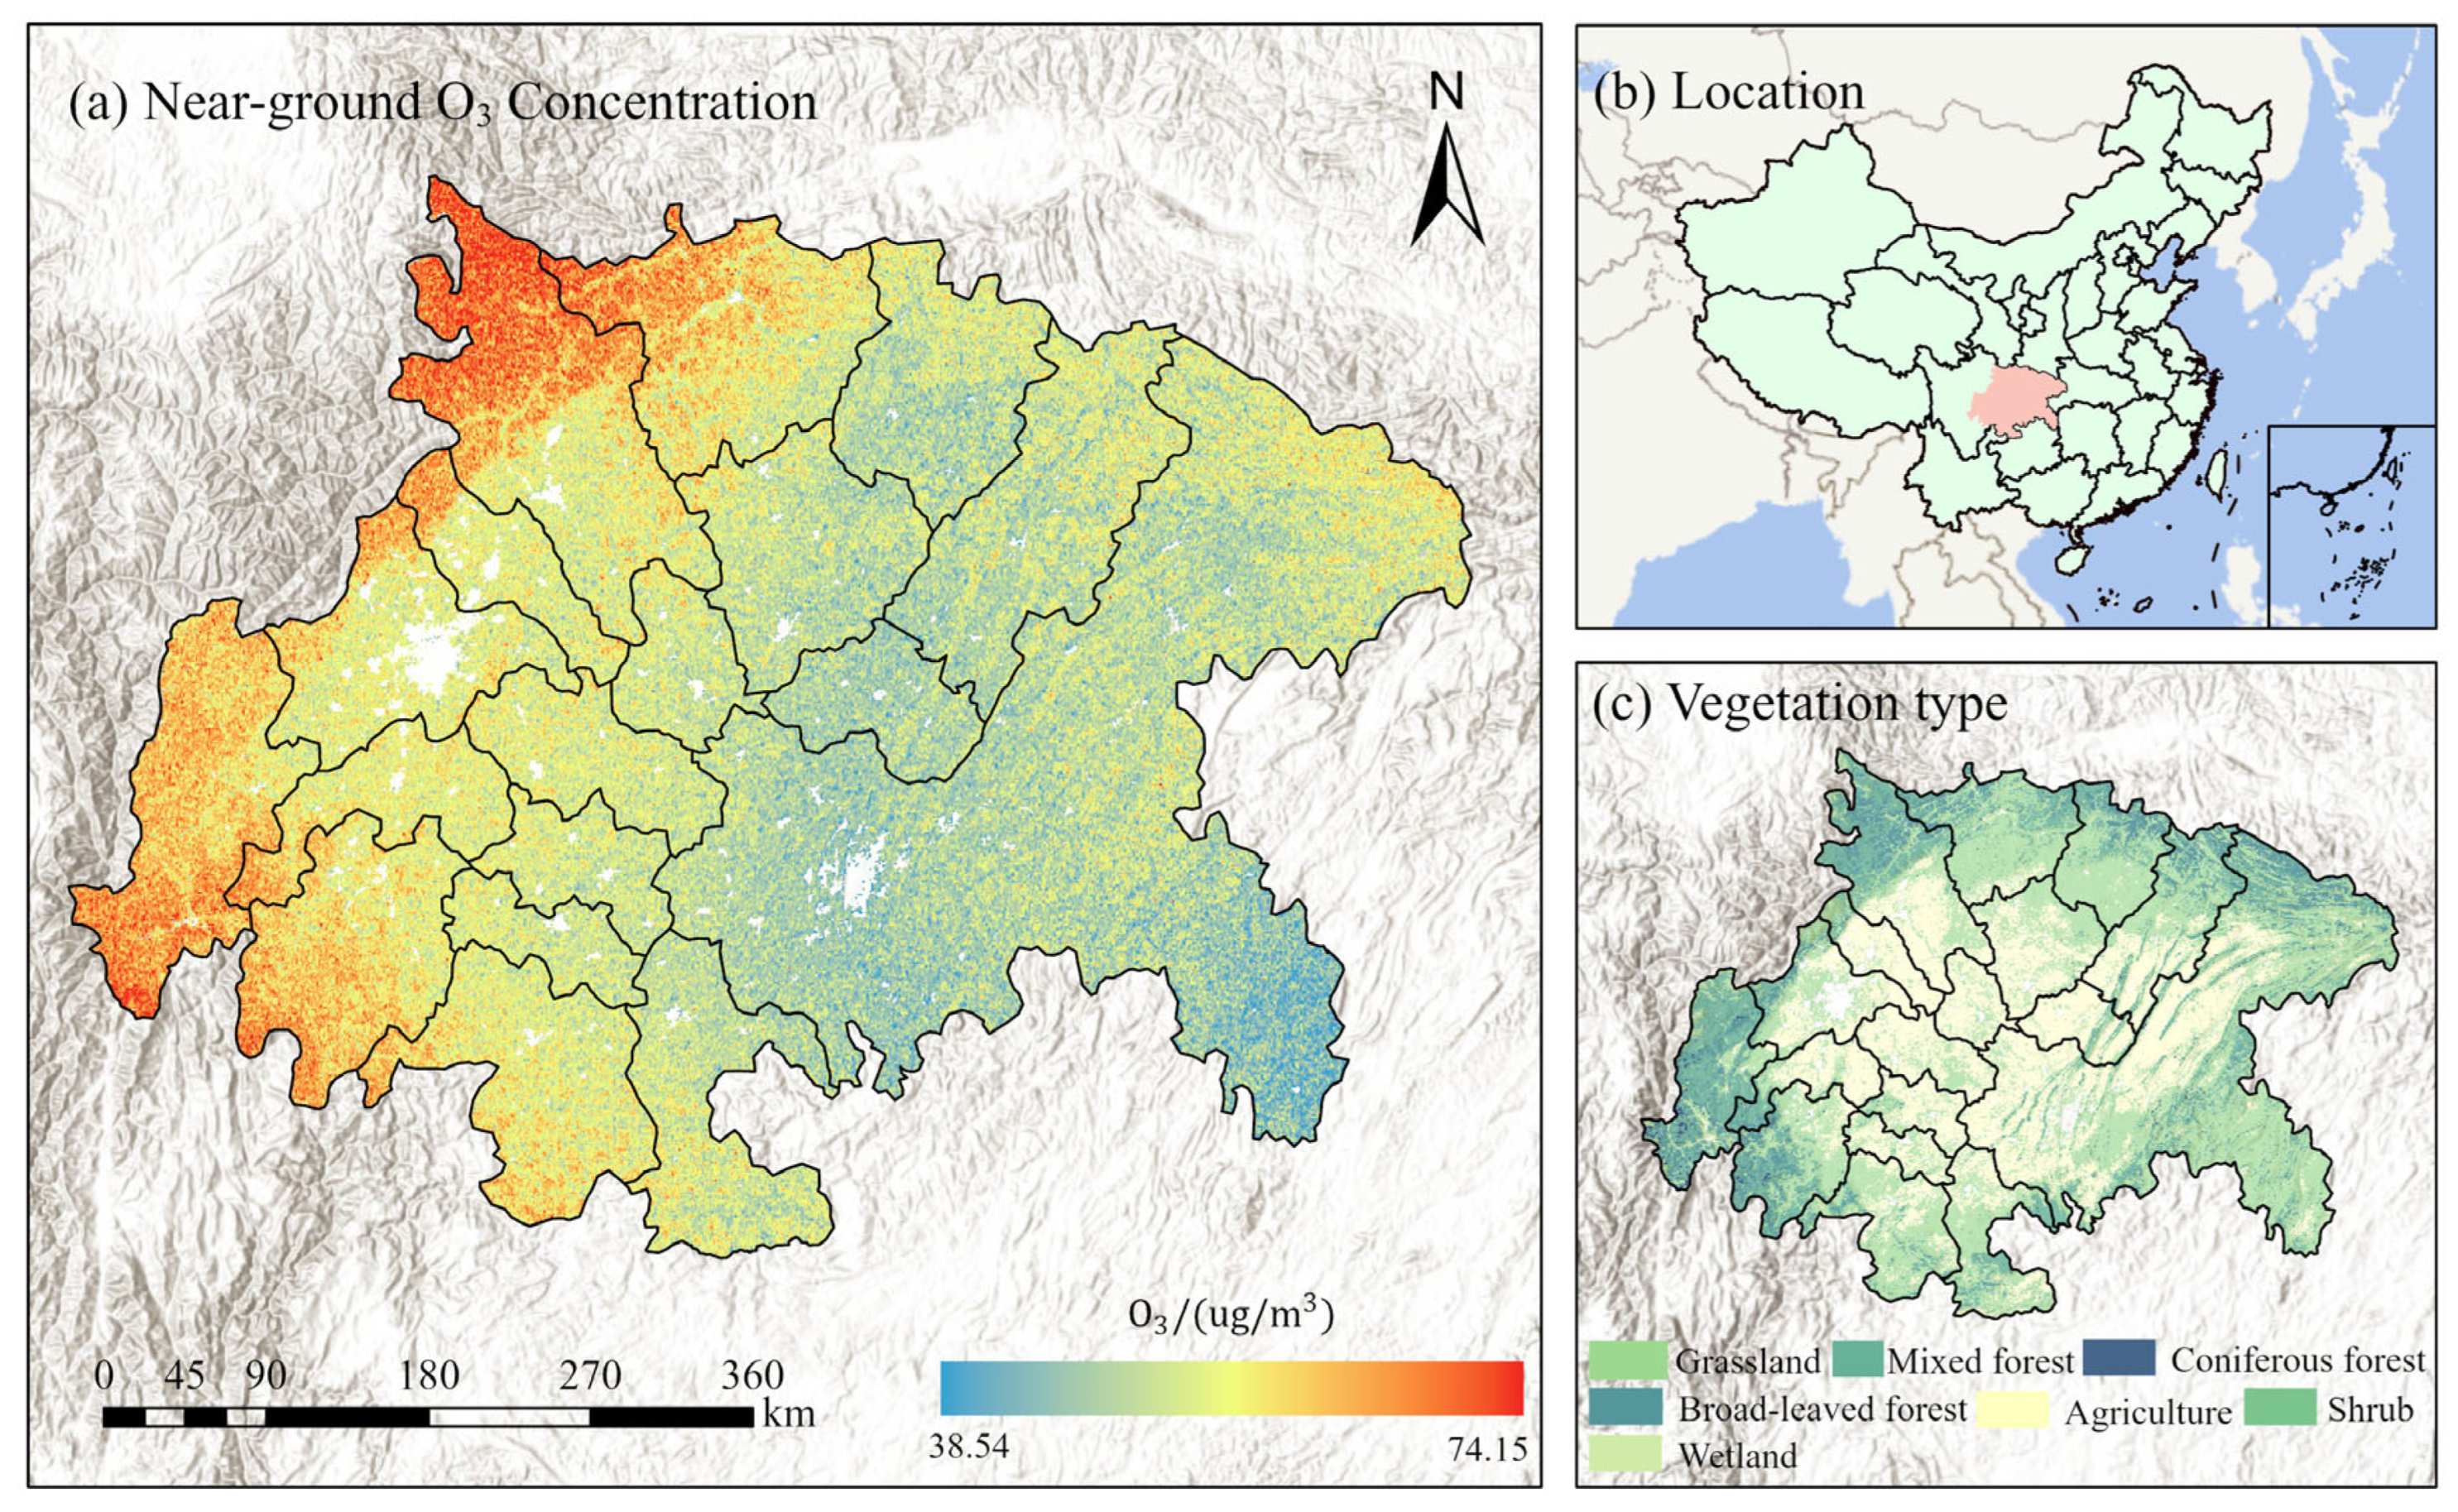
2.1. Study Area

The Sichuan Basin lies at 102.16° E and 30.32° N in southwestern China. It covers 18 cities and is characterized by peripheral mountainous regions with elevations ranging from 2000 to 3000 m. The basin floor consists of hilly plains with elevations between 300 and 800 m. The bottom features low mountains, plains, and hills, while the margins comprise medium and low mountains. The basin is generally closed, resulting in low wind speeds, high humidity, and high atmospheric stability. These conditions hinder the dispersal of air pollutants [38,39]. As the region lies in the Central Subtropical Humid Climate Zone, annual precipitation averages 1000–1300 mm while temperatures typically range from 16 to 18 °C. There are diverse vegetation types, with subtropical evergreen broad-leaved forests being the most common, followed by subtropical coniferous forests (Figure 1).

2.2. Data Sources and Processing

Table 1 presents the data sources. The temperature data includes the 1 km monthly mean temperature dataset of China (1901–2022), obtained from the National Tibetan Plateau Scientific Data Center [40]. Photosynthetically active radiation (PAR) data were acquired from NASA and resampled while considering the global 1° to 1 km resolution. Vegetation data were extracted from MODIS Land Cover (MOD12Q1) using IGBP classification. Following Table 2, we reclassified 17 land types into 7 categories: coniferous forest, broadleaf forest, mixed forest, shrubland, grassland, wetland vegetation, and agricultural vegetation. Emission factors and leaf biomass density were collected from the literature review published by China Environmental Science [41]. O3 concentrations were derived from the dataset provided in an earlier publication for the area [42].

2.3. Estimating BVOC Emissions

The G95 model [43] is based on the impact of BVOC emission sources, emission rates, and environmental factors. It provides a more accurate estimation of BVOC emissions from different vegetation types. The calculations include leaf biomass density and emissions of ISOP, MON, and OVOCs, as follows:
E I S O P = v × D × γ t × γ p
E M O N , O V O C s = v × D × γ t
where E I S O P and E M O N , O V O C s represent the emission flux of ISOP, MON, and OVOCs, respectively, measured in μ g   C / ( m 2 · h ) ; v represents the standard emission rate under standard conditions (temperature: 303 K, PAR: 1000 μ m o l / ( m 2 · s ) ), which is expressed in μ g   C / ( g · h ) ; D represents the leaf biomass density, measured in g / m 3 ; and γ t and γ p are the correction factors of the temperature and the PAR, respectively.
This study defines emission intensity as BVOC emissions per unit area each year. The unit is t/km2. This metric standardizes BVOC emissions. It helps compare spatial patterns at the regional scale.
Emissions of ISOP were mostly affected by temperature and PAR, while MON and OVOC emissions were affected by temperature only [43,44]. Each correction factor can be determined by:
Correction factor for ISOP:
γ t = exp C T 1 T T S R T S T 1 + exp C T 2 T T M R T S T
γ P = α C L Q 1 + α 2 Q 2 0.5
Correction factor for MON and OVOCs:
γ t = exp β T T S
where T (K) is the current leaf surface temperature; T S is the leaf surface temperature under standard conditions, which is a constant value (303 K); and T M is 314 K. R is the gas equilibrium constant (8.314 J / K ) and Q is the current PAR [ μ m o l / ( m 2 · s ) ] . C T 1 is the empirical constant (95,000 J / m o l ) and C T 2 also represents an empirical constant (230,000 J / m o l ). C L ,   α , and β are the empirical constants having values of 1.066, 0.0027, and 0.09, respectively [43].

2.4. Simulated Scenario Setting

Ambient temperature, light intensity, and vegetation type influence the spatial-temporal distribution of BVOC emissions [38,45,46]. During the BVOC emission process, only ISOP emission is affected by light intensity [47]. The influence of PAR in the region changes little over time and space. Therefore, the study chose the environmental temperature factor for multi-temperature scenario simulation settings because it has the highest influence [48,49]. Based on the temperature threshold of the Sichuan Basin, Table 3 presents five temperature scenarios (S1–S5): 30 °C, 20 °C, 10 °C, 0 °C, and −10 °C.
The contribution rate of different vegetation types to total BVOC emissions under different simulation scenarios was calculated as follows:
C = E i E × 100 %
where C is the contribution rate (%); and E i and E are the emission intensity of BVOCs for species i and the total emission intensity of BVOCs in the simulated scenario ( t / k m 2 ), respectively.

2.5. The Impact of BVOC Emissions on the Environment

The effect of BVOC emissions from different types of vegetation on O3 concentration can be characterized by the OFP, which represents the maximum contribution of different VOC species (ISOP, MON, and OVOCs) to O3 generation under optimal reaction conditions [50]. The study used the MIR method for calculation [51]. This method measures the amount of O3 formed for each additional unit of ISOP, MON, and OVOCs. The calculation formula is as follows:
O F P i = E i × M I R i
where O F P i represents the generated OFP corresponding to VOC species I; E i is the emission quantity of species i ; and M I R i is the MIR factor for species i . Existing research has reported component-specific MIR values. Isoprene (ISOP) measures 10.61 g/g; monoterpenes (MON) show 4.04 g/g [52]; while other VOCs (OVOCs) average 5.45 g/g [53].

3. Results and Discussion

3.1. BVOC Emission Characteristics of Different Vegetation Types

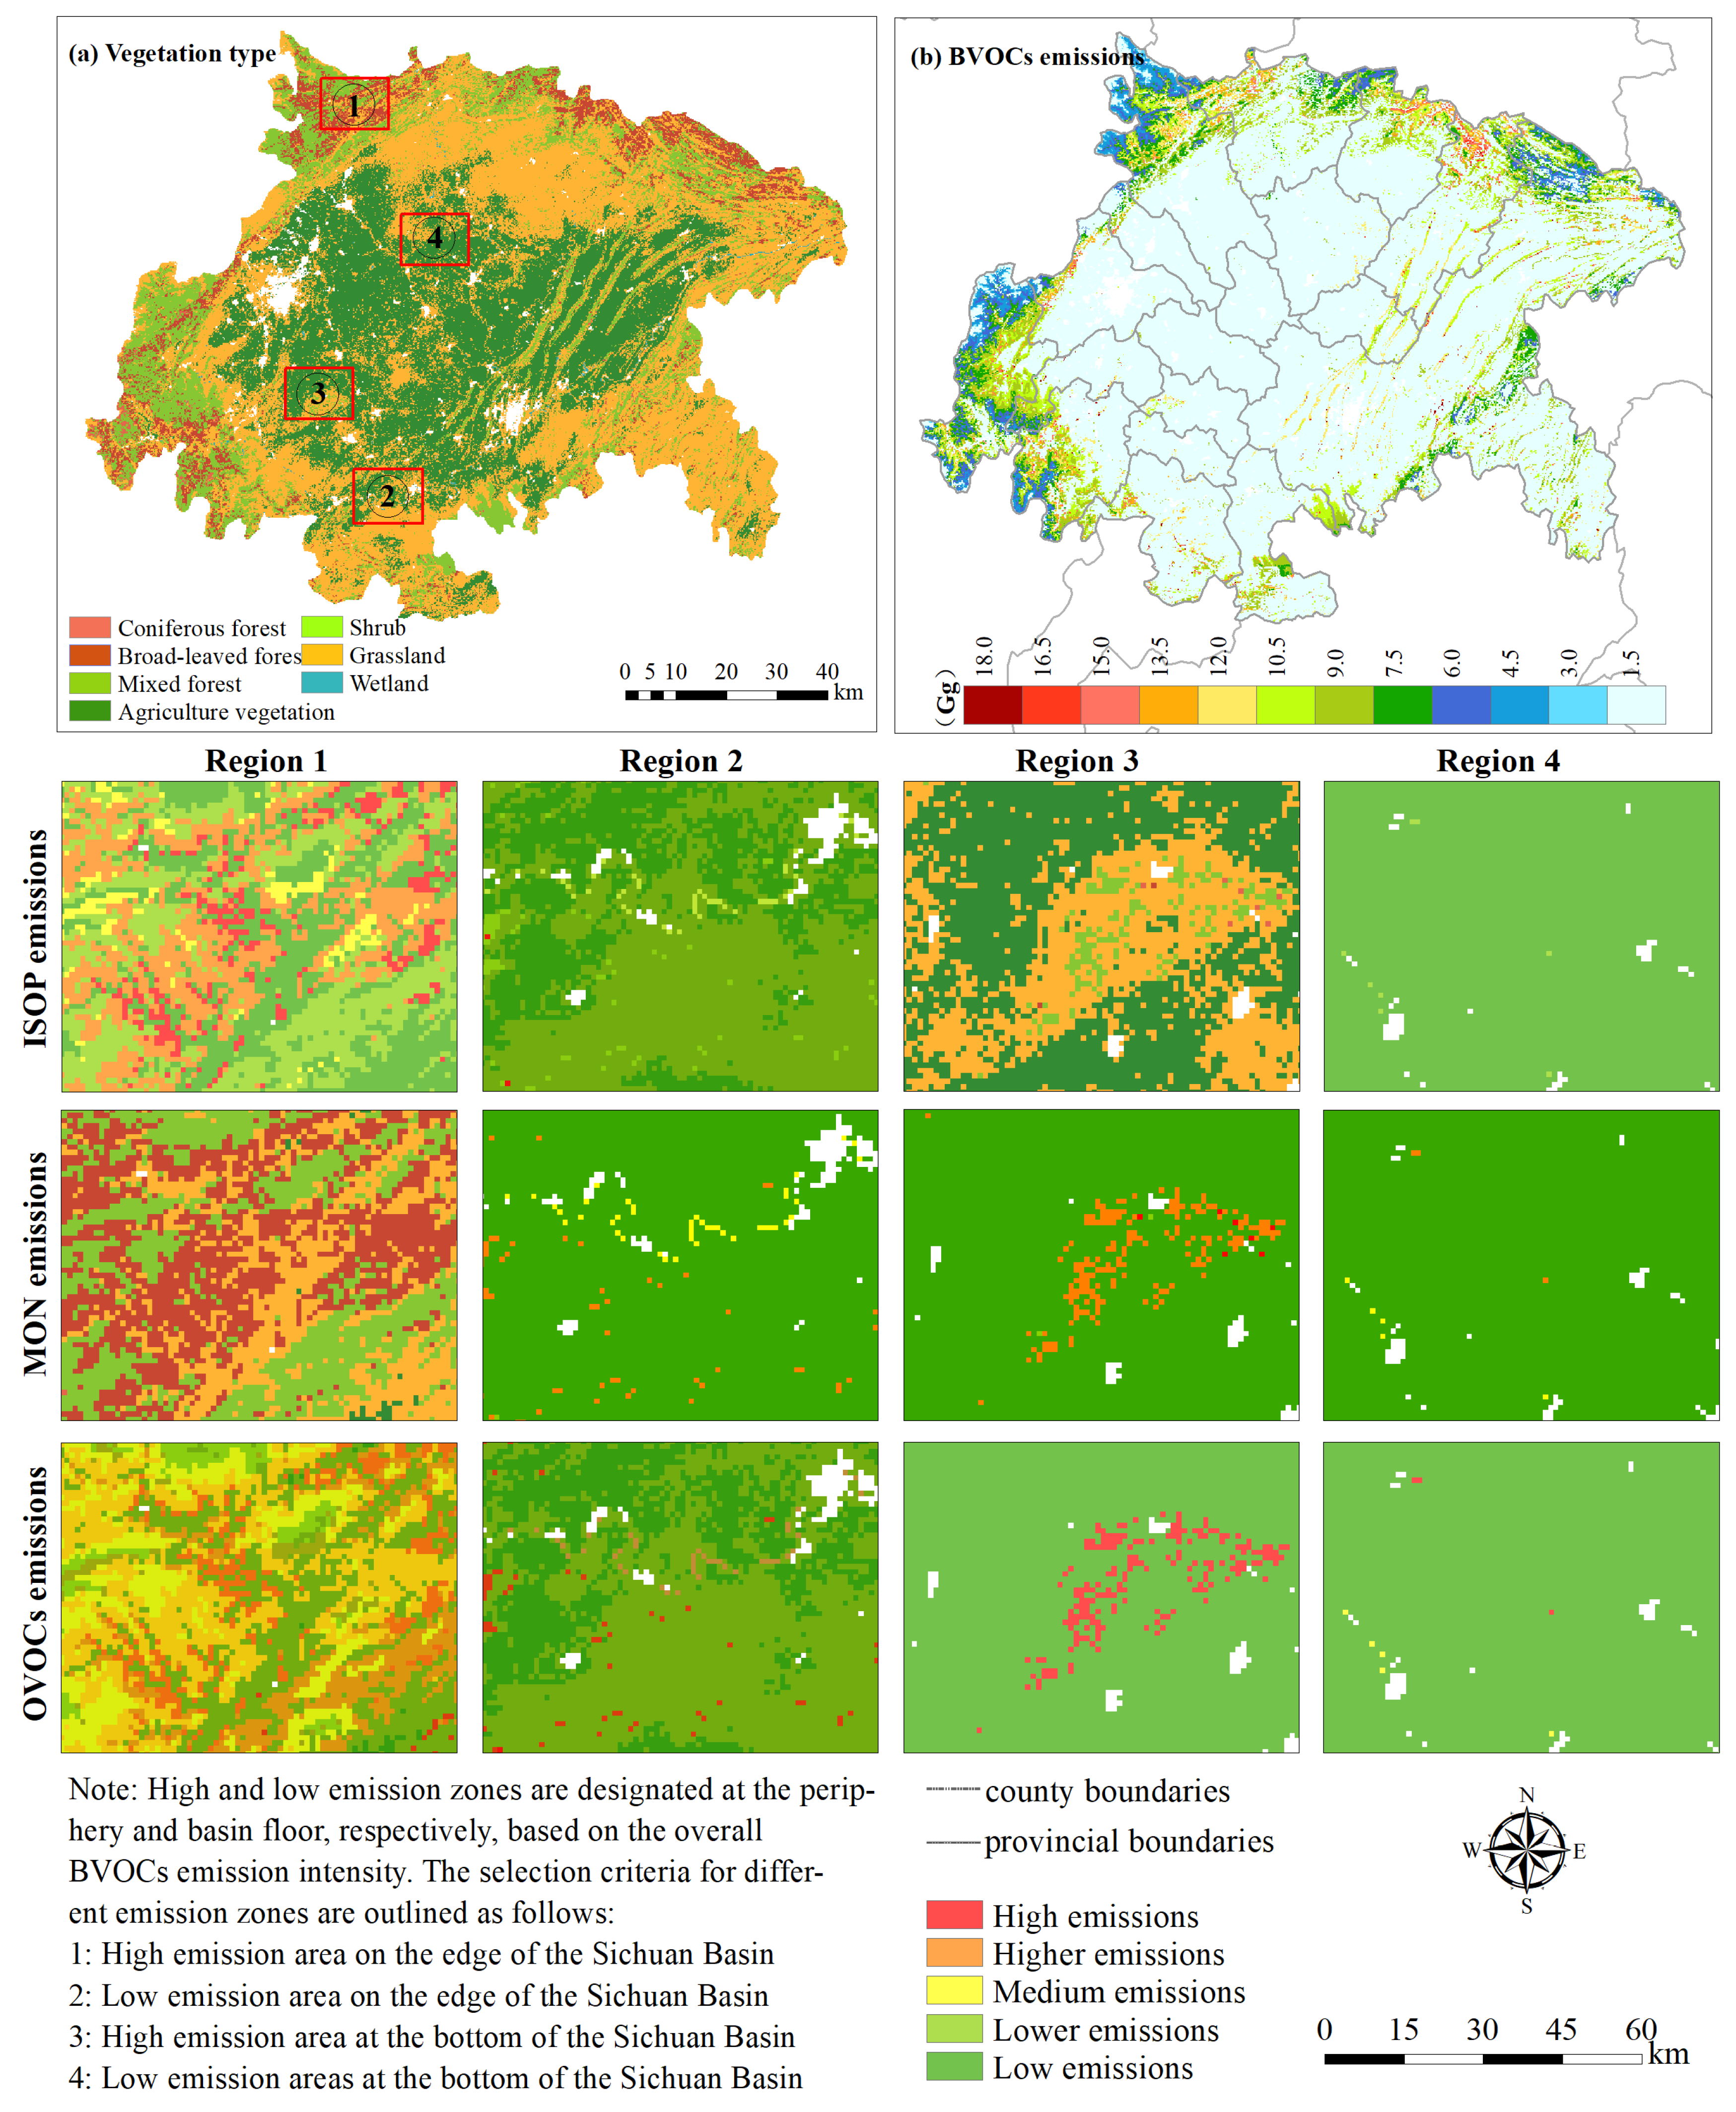
3.1.1. The Role of Different Vegetation BVOC Emissions in the Edge–Center Distribution Pattern

Based on G95 model estimates, the total BVOC emissions in the Sichuan Basin for 2020 were 623.26 Gg. ISOP, MON, and OVOCs accounted for 30.80%, 35.29%, and 33.91%, respectively. Table 4 shows the BVOC emission characteristics of different vegetation types. Mixed forests were the dominant emission source, with an annual emission of 292.67 Gg, representing 46.96% of the total, followed by broad-leaved forests, which emitted 197.90 Gg (31.75%). Emissions from agricultural vegetation and shrublands were relatively low, at 5.01 Gg and 0.02 Gg, respectively.
In terms of the emission intensity (emission per unit area), broad-leaved forests show the highest BVOC emission intensity (10.5 t/km2). Their dominance stems from three ecophysiological advantages. First, they possess higher isoprene synthase (ISPS) activity [54]. Second, their larger specific leaf area (SLA) enhances precursor production. Third, their efficient stomatal conductance promotes BVOC release. These traits synergize strongly under high light and temperature [31,38]. In contrast, agricultural emissions are minimal (0.15 t/km2). Crop domestication weakened defensive volatile pathways. Intensive management also reduces leaf area index (LAI) and shortens growth cycles [30]. Mixed forests exhibit a distinct high-total, low-intensity pattern. Conifer–broadleaf mixtures lower per-area emissions but gain regional dominance through wider distribution. These patterns reveal fundamental plant trait trade-offs. Vegetation structure, physiology, and spatial distribution collectively shape regional BVOC fluxes.
In terms of composition (as shown in Figure 2), different vegetation types exhibit different emission profiles. Coniferous forests, mixed forests, grasslands, and agricultural vegetation are primarily dominated by MON, with mixed forests showing the highest proportion of MON emissions (42.28%). In contrast, broad-leaved forests, shrubs, and wetlands are primarily dominated by ISOP, with broad-leaved forests having an ISOP proportion as high as 64.02%. These compositional differences reflect the unique physiological metabolic pathways of the vegetation types: MON are mainly associated with plant defense mechanisms and are commonly found in woody plants such as coniferous forests [55,56], while ISOP, a byproduct of photosynthesis, is more prominent in broad-leaved forests with higher photosynthetic efficiency [54].
At the prefecture-level city scale, the vegetation composition of most areas in the basin is dominated by mixed forests for BVOC emissions, with the edge regions exhibiting a more complex vegetation emission structure. Specifically, in the northern edge regions, such as Dazhou and Mianyang, and in the western edge areas, such as Leshan and Ya’an, the combined BVOC emissions from mixed, deciduous broad-leaved, and coniferous forests account for over 85% of the total emissions in the region. In Ya’an, this proportion reaches as high as 97.06%, highlighting the significant contribution of forest ecosystems in the edge mountain areas to regional BVOC emissions. In contrast, in cities located at the basin’s bottom, such as Zigong, Suining, Ziyang, and Nanchong, where the terrain is flat and agricultural activities are intensive, BVOC emissions are primarily sourced from grasslands and agricultural vegetation. The proportion of emissions from these vegetation types is notably higher than in other regions. This spatial differentiation in emission patterns deeply reflects the role of the “mountain-hill-plain” topographic gradient in the Sichuan Basin, which regulates the vegetation distribution and BVOC emissions, thus shaping the overall spatial pattern of BVOC emissions.
Figure 3 shows the spatial distribution of BVOC emission intensities in the basin for 2020. The gridded results indicate that high emission areas are mainly concentrated in the edge and northern regions of the basin, such as Leshan and Ya’an in the east, as well as Bazhong, Guangyuan, Mianyang, and Dazhou in the north. Combined with the vegetation type distribution shown in the figure, these high-emission areas lie predominantly in regions with dense forests (mainly broad-leaved and coniferous). In contrast, the BVOC emission levels at the bottom of the basin are relatively low, such as in areas with concentrated farmland, including Neijiang, Nanchong, Ziyang, Zigong, and Suining, where the regional BVOC emission intensity is less than 1000 kg/m3. Overall, influenced by the spatial distribution of vegetation types, BVOC emissions in the Sichuan Basin exhibit a typical spatial pattern of “high at the basin edge, low at the basin bottom”.

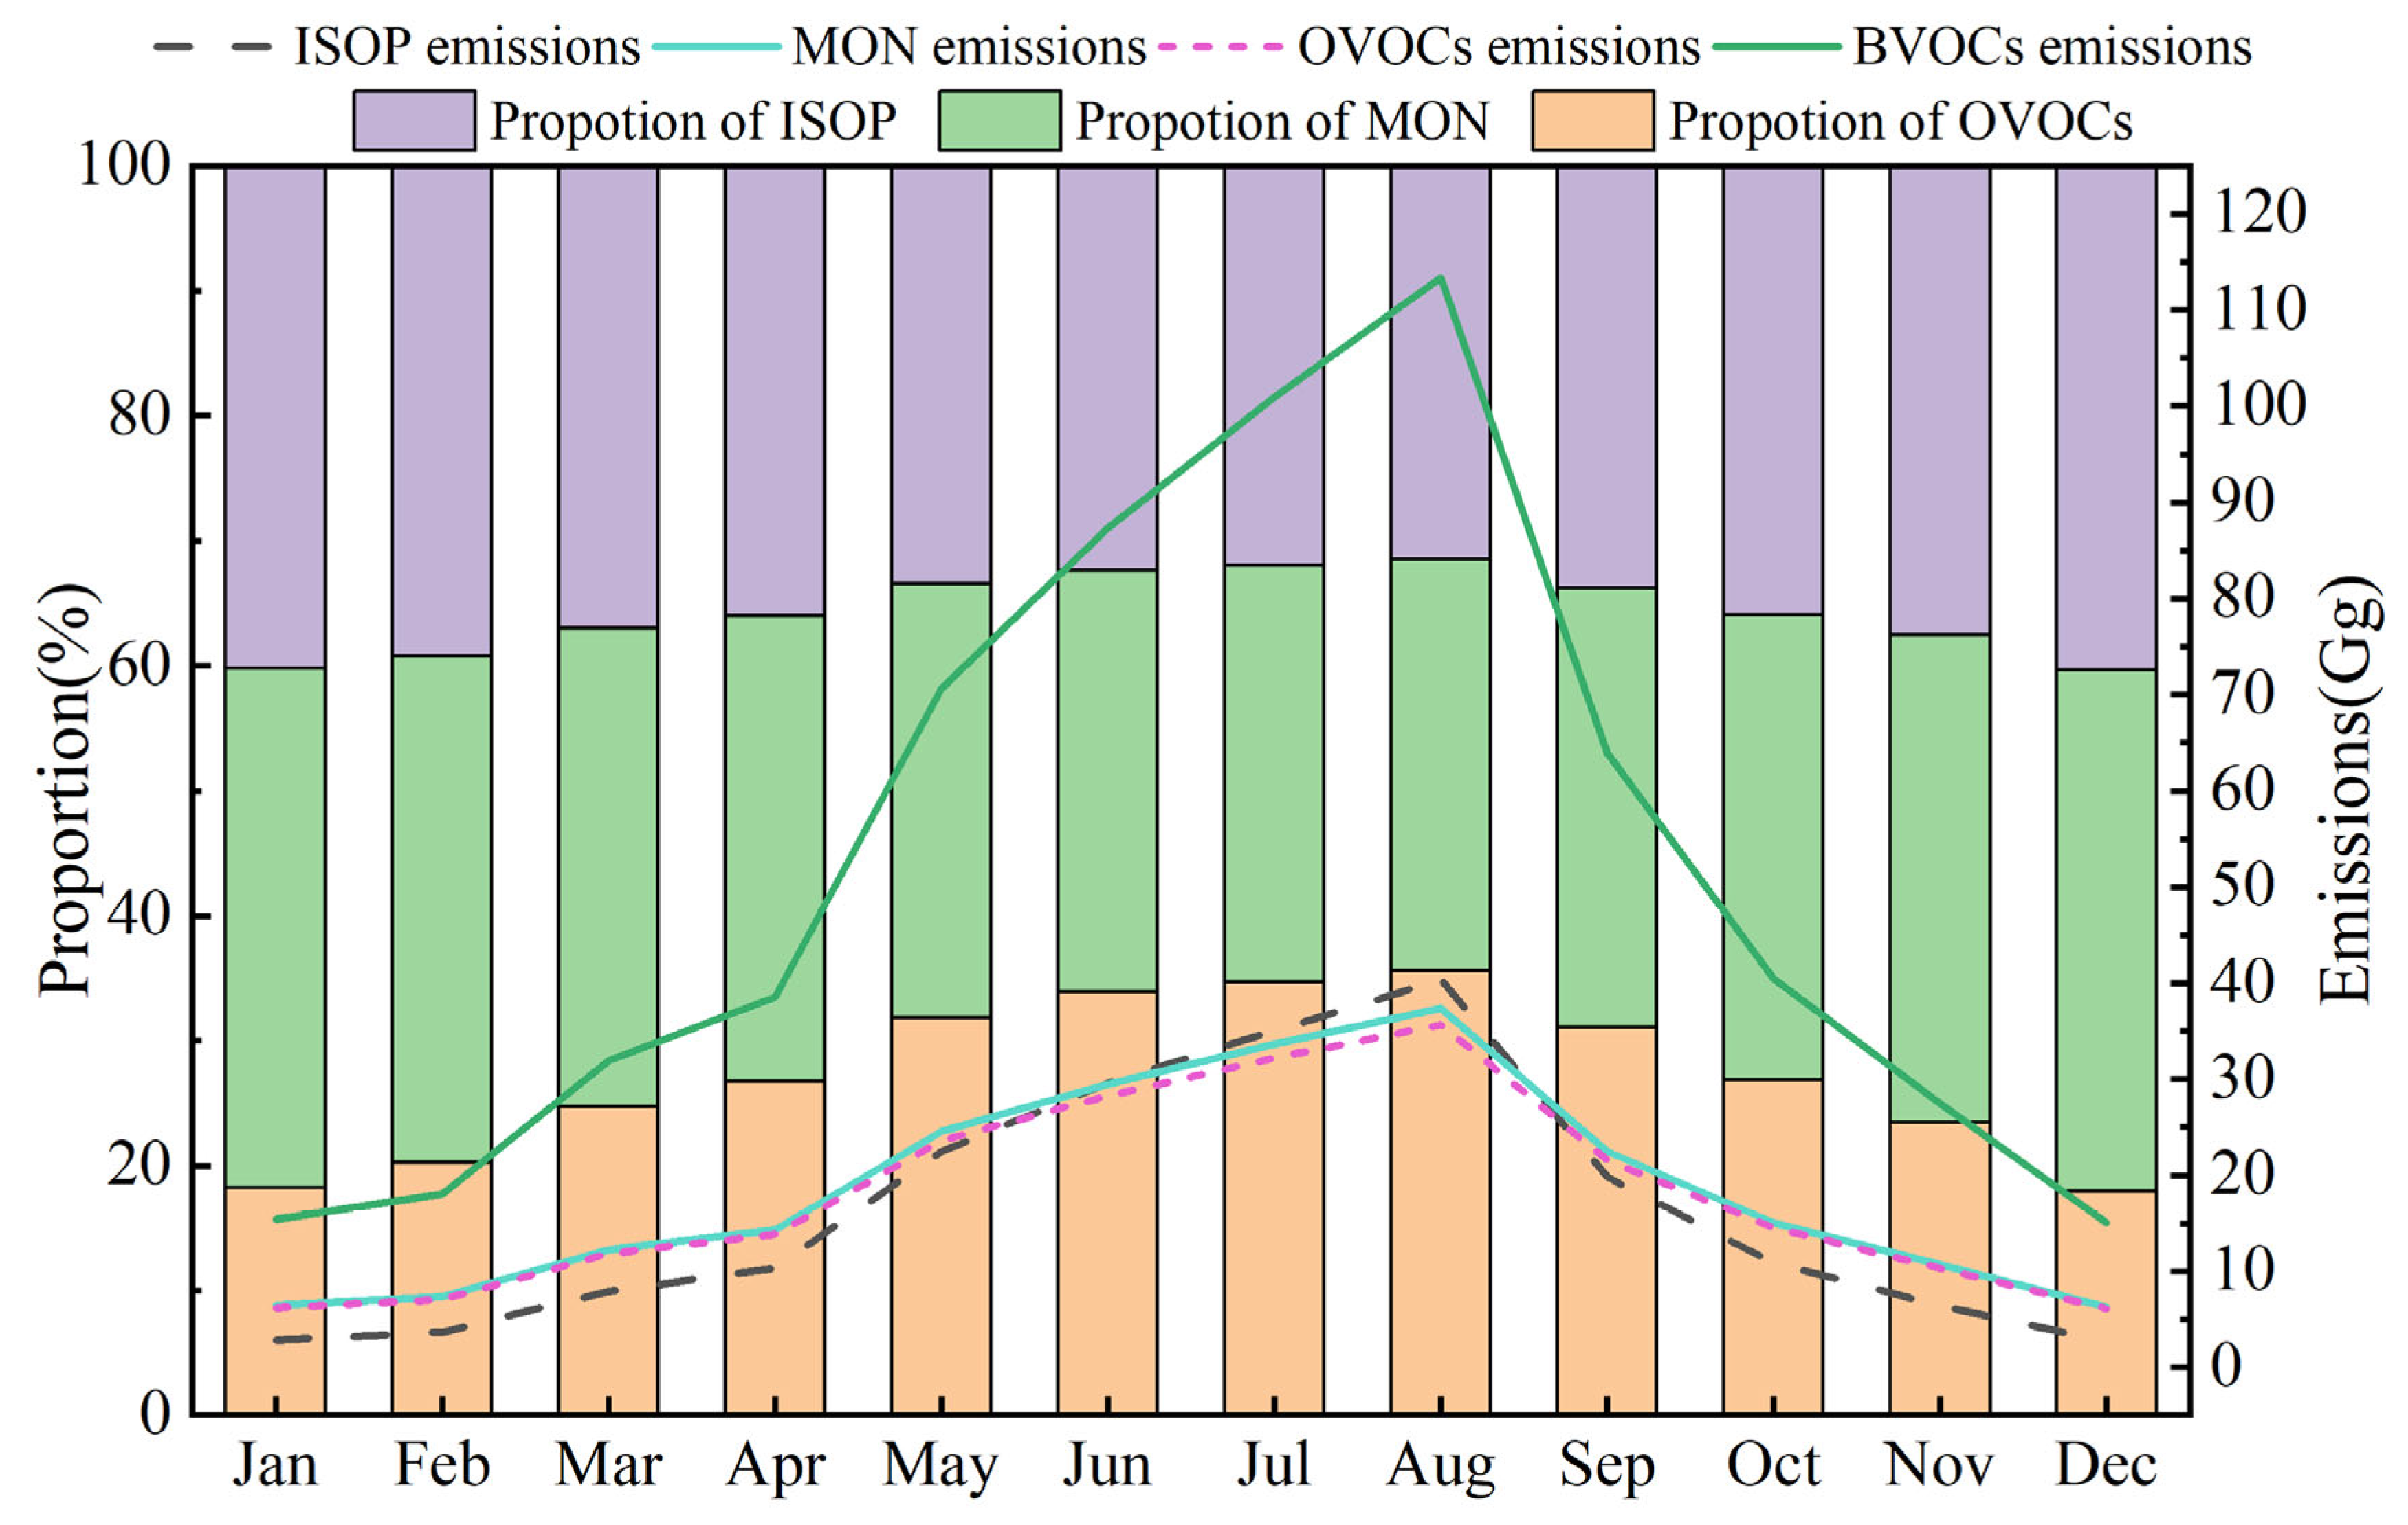
3.1.2. Seasonal Cyclical Variation Characteristics of BVOCs from Different Vegetation Types

As shown in Figure 4, BVOC emissions in the Sichuan Basin exhibit marked seasonal characteristics, with a clear “high in summer, low in winter” cyclical variation. Summer (June to August) represents the peak emission period, with emissions in August accounting for 18.19% of the total annual emissions. In contrast, emissions during the winter are notably lower. In terms of compositional changes, ISOP, MON, and OVOCs all reach their peaks in summer. Specifically, ISOP emissions begin to rise sharply in April, surpassing MON and OVOCs and becoming the dominant component at the start of June. The seasonal variation is primarily driven by the synergistic regulation of climate factors, such as temperature and solar radiation. High temperatures and radiation conditions significantly enhance the physiological activity of vegetation and the biosynthesis of BVOCs [57], thereby increasing emission intensity.
Significant differences in the contribution of different vegetation types to BVOC emissions are shown in Figure 5. Mixed forests, broad-leaved forests, and grasslands are the primary BVOC emission sources in the Sichuan Basin. Mixed and broad-leaved forests have high emission potential due to their strong per-unit biomass emission capacity, while grasslands, owing to their widespread distribution, contribute significantly to emissions in cumulative terms. Although the absolute emissions of all vegetation types generally exhibit high values in summer, their monthly emission proportions show distinct differences. Broad-leaved forests, shrublands, and wetlands, which are dominated by ISOP emissions, exhibit a synchronized increase in their emission share during the summer, with their emission trends highly consistent with regional total emissions. In contrast, vegetation types primarily emitting MON, such as coniferous forests and agricultural lands, exhibit a decrease in their relative emission share during the summer. This indicates that different vegetation types exhibit varying sensitivities to environmental factors.
Furthermore, as existing studies suggest, temperature plays a dominant role in regulating BVOC emissions. Guenther highlighted that the emission rate of ISOP follows an exponential relationship with leaf temperature, and an increase in temperature significantly enhances the activity of its synthetic enzymes, driving rapid emission escalation [58]. Conversely, the emission mechanisms of MON and OVOCs partially depend on leaf storage mechanisms and stomatal conductance. These emissions are regulated by both temperature and radiation but show a less pronounced response to temperature changes compared to ISOP [38]. Additionally, under extreme high-temperature conditions, emissions of certain components may be negatively affected, such as reduced emission levels due to stomatal closure or decreased enzyme activity [21].

3.2. Regulation of Temperature on BVOC Emissions from Different Vegetation Types

The previous analysis has shown that BVOC emissions in the Sichuan Basin exhibit significant seasonal variations, with a “summer high, winter low” pattern evident in the total emission levels, the emission trends of different components, and the contributions from various vegetation types. This seasonal change is closely related to fluctuations in environmental factors [23,59], with temperature increases during summer identified as one of the key drivers of BVOC emissions [60]. Since different vegetation types exhibit significant differences in the dominant emission components, physiological structures, and ecological strategies, their responses to temperature change also differ. Therefore, investigating the specific role of temperature in regulating BVOC emissions from different vegetation types will help deepen our understanding of regional emission dynamics and improve the accuracy of emission simulations.
Accordingly, the study set different temperature scenarios (e.g., −10 °C for low temperature, 0/10/20 °C temperature gradients, and 30 °C for high temperature) to systematically analyze the temperature response characteristics of BVOC emissions from different vegetation types in the Sichuan Basin. The results show that temperature is a key environmental factor regulating BVOC emissions. The emission contribution of each vegetation type increases with rising temperatures (Figure 6). Under low-temperature conditions (−10 °C), coniferous forests exhibit a strong emission advantage, with an MON emission contribution rate of 0.22%, significantly higher than other vegetation types, which are in the following order: coniferous forest > mixed forest > broad-leaved forest > wetland > shrubland > grassland > agricultural vegetation. This characteristic aligns with the MON-dominated emission pattern observed in winter. In contrast, the emission pattern changes significantly under high-temperature conditions (30 °C). The ISOP emission contribution rate from broad-leaved forests rises sharply to 14.78%, resulting in a new emission sequence of broad-leaved forest > coniferous forest > shrubland > mixed forest > wetland > grassland > agricultural vegetation, which matches the ISOP-dominated emission feature observed in summer.
An in-depth analysis of temperature sensitivity reveals significant differences in how vegetation types respond to temperature fluctuations. Under constant temperature gradients (increasing by 10 °C), broad-leaved forests exhibit the strongest positive response (average growth rate of 3.94%), with the growth rate of ISOP emissions reaching 2.95% and exhibiting extreme sensitivity to temperature. The response intensity of other vegetation types decreases in the following order: coniferous forests (2.93%) > shrubland (2.28%) > mixed forests (2.06%) > wetlands (1.50%) > grassland (0.17%) > agricultural vegetation (0.03%). This gradient difference mainly arises from the physiological traits and metabolic pathways of each vegetation type. Broad-leaved forests are most sensitive to temperature changes due to their efficient photosynthetic systems, while agricultural vegetation, due to human management and simpler ecosystem structures, shows the weakest temperature dependence [29].
These findings reveal the regulatory effect of temperature on BVOC emissions from different vegetation types and provide strong support for understanding seasonal variations in BVOC emissions in the basin region. In low temperatures in winter, cold-resistant coniferous forests become the main source of MON emissions, while high temperatures in summer activate the strong ISOP-emission capacity of broad-leaved forests. The differences in temperature sensitivity across vegetation types also suggest that, under global warming, broad-leaved forests may become the primary contributor to regional BVOC emission growth. This trend will significantly impact regional atmospheric chemical processes and air quality. Therefore, in the context of climate change, it is crucial to pay attention to the potential impact of changes in vegetation composition on BVOC emissions.

3.3. Impact of BVOC Emissions from Different Vegetation Types on Ozone Formation

The total OFP of BVOCs in the Sichuan Basin is 407.72 × 10⁴ t. The contribution of different components to the OFP exhibits significant differences. ISOP contributes 203.68 × 10⁴ t to the OFP, accounting for 49.96%, which is significantly higher than MON (88.75 × 10⁴ t) and OVOCs (115.17 × 10⁴ t). Further, the spatial distribution of OFP in the Sichuan Basin still exhibits a prominent “high at the edges, low at the bottom” emission pattern. When examining the spatial distribution results of different components, in areas with annual average emission intensities above 3 t/km2, the coverage area of ISOP accounts for 6.34%, which is much higher than MON (0.06%) and OVOCs, indicating its dominant role in high-OFP areas (Figure 7). Overall, ISOP is not only the component in Sichuan Basin BVOCs that contributes the most to ozone formation; its high emission intensity and strong reactivity make it a key driving factor of regional ozone pollution potential, warranting particular attention in atmospheric pollution prevention and fine management.
There are distinct differences in the contribution of BVOC emissions from the different vegetation types to the OFP (as shown in Figure 8). Among them, mixed forests, broad-leaved forests, and grassland are the main contributors to the OFP in the Sichuan Basin, accounting for 44.51%, 37.78%, and 13.41% of the total OFP, respectively. In combination, these three types contribute more than 95%, playing a dominant role in the formation of regional ozone pollution.
From the perspective of the OFP component composition, the OFP in broad-leaved forests, shrubland, and wetlands is primarily driven by ISOP, which accounts for as much as 78.98%, 81.56%, and 56.48% of their respective OFP values. In contrast, the OFP from coniferous forests, grassland, and agricultural vegetation is primarily contributed by MON, which have relatively lower reactivity and a more limited role in promoting ozone formation.
Further comparison of the BVOC emission components and their proportion in the OFP reveals that, despite not dominating certain vegetation types, the proportion of ISOP emissions in the OFP significantly increases. This indicates that their photochemical activity amplifies their role in regional ozone pollution formation [61]. The difference not only reflects the ecological basis of BVOC emission characteristics between different vegetation types but also highlights the core role of reactivity in regulating the ozone formation potential.
The contribution of different vegetation types to O3 formation exhibits marked seasonal variation, which is not only influenced by temperature but also closely related to the composition of BVOC emissions from each vegetation type and its photochemical activity. Under high summer temperatures, the contribution order is as follows: mixed forests (43.08%) > broad-leaved forests (39.47%) > grassland (13.22%) > agricultural vegetation (1.63%) > coniferous forests (1.55%) > wetlands (1.03%) > shrubland (0.00%). Among these, broad-leaved forests and shrublands (Figure 9), which primarily release photochemically active ISOP, exhibit a significant positive temperature dependence. This is particularly true for broad-leaved forests, whose contribution in summer reaches 39.47%, which is 7.99% higher than that in winter, making them an important source of summer O3 formation.
In winter, the contribution structure changes significantly, with coniferous forests showing a 6.31% increase in their relative contribution compared to summer, presenting a negative temperature dependence. This may be related to the weaker sensitivity of MON (which are primarily emitted by coniferous forests) to temperature compared to ISOP in photochemical reactions. In contrast, mixed forests, wetlands, grassland, and agricultural vegetation show relatively stable seasonal variation, with their contribution being slightly higher in winter than in summer.
Overall, this temperature-driven difference in relative contributions suggests that seasonal regulation should be considered in O3 pollution-control strategies. In summer, management of BVOC emissions from broad-leaved forests and shrubland regions should be strengthened, while in winter, the potential impact of coniferous forests and other cold-season vegetation should be monitored. Furthermore, attention should be paid to the dynamic changes in BVOC composition across different seasons to improve the scientific understanding of regional ozone formation mechanisms and the precision of pollution control.

3.4. Uncertainty Analysis

In this study, although a high spatial and temporal resolution BVOC emission inventory for the Sichuan Basin was constructed using the G95 model, and the temperature response characteristics of different vegetation types and their impact on ozone formation potential were systematically assessed, uncertainties still exist in the overall results.
First, the estimation of BVOC emissions depends on the accurate classification of vegetation types. The vegetation data used in this study primarily comes from remote sensing products. Although remote sensing data have wide spatial coverage and high update frequency, the classification accuracy is limited by factors such as image resolution, classification algorithms, and the representativeness of training samples. This can lead to classification errors in some regions, which will directly affect the assignment of vegetation emission factors and introduce uncertainty in estimating emission intensity.
Second, in the temperature regulation of BVOC emissions from different vegetation types, this study used scenario analysis under the assumption that the response mechanisms of vegetation to temperature remain stable. However, in the real world, extremely high temperatures, droughts, and other climatic stresses may induce nonlinear changes in plant metabolic processes, leading to deviations in how emissions behave and thus limiting the adaptability of simulation results. Furthermore, the calculation of the OFP depends on MIR coefficients, which are mostly derived from laboratory-controlled single-component reaction experiments, making it difficult to reflect the complex nonlinear chemical processes between multiple precursors and oxidants in the actual atmosphere. Moreover, differences in the atmospheric background composition across different regions lead to regional adaptability difficulties with MIR parameters, and there is insufficient local empirical support, introducing further uncertainty in OFP estimation.
Although the aforementioned uncertainties may affect the accuracy of both the emission inventory and OFP assessments, this study’s BVOC emission inventory remains valuable. The inventory covers multiple vegetation types with high spatial and temporal resolution. It provides a foundation for identifying key emission sources and understanding regional differences in ozone precursors. For future research, three key improvements should be made: (1) strengthening local field observations; (2) systematically obtaining emission factors for typical vegetation, including their temperature response characteristics; and (3) incorporating higher-resolution meteorological data and more refined vegetation classification schemes. These enhancements would reduce model uncertainty and increase the practical application value of the findings for regional air quality management and policy-making.

4. Conclusions

BVOC emissions from different vegetation types are closely related to regional ozone pollution. The G95 model was used to construct a 2020 BVOC emission inventory for the Sichuan Basin, and multi-scenario simulations were applied to analyze their temperature response relationships quantitatively. Based on this, the contribution of BVOC emissions from different vegetation types to ozone formation was analyzed. The main conclusions are as follows:
(1)
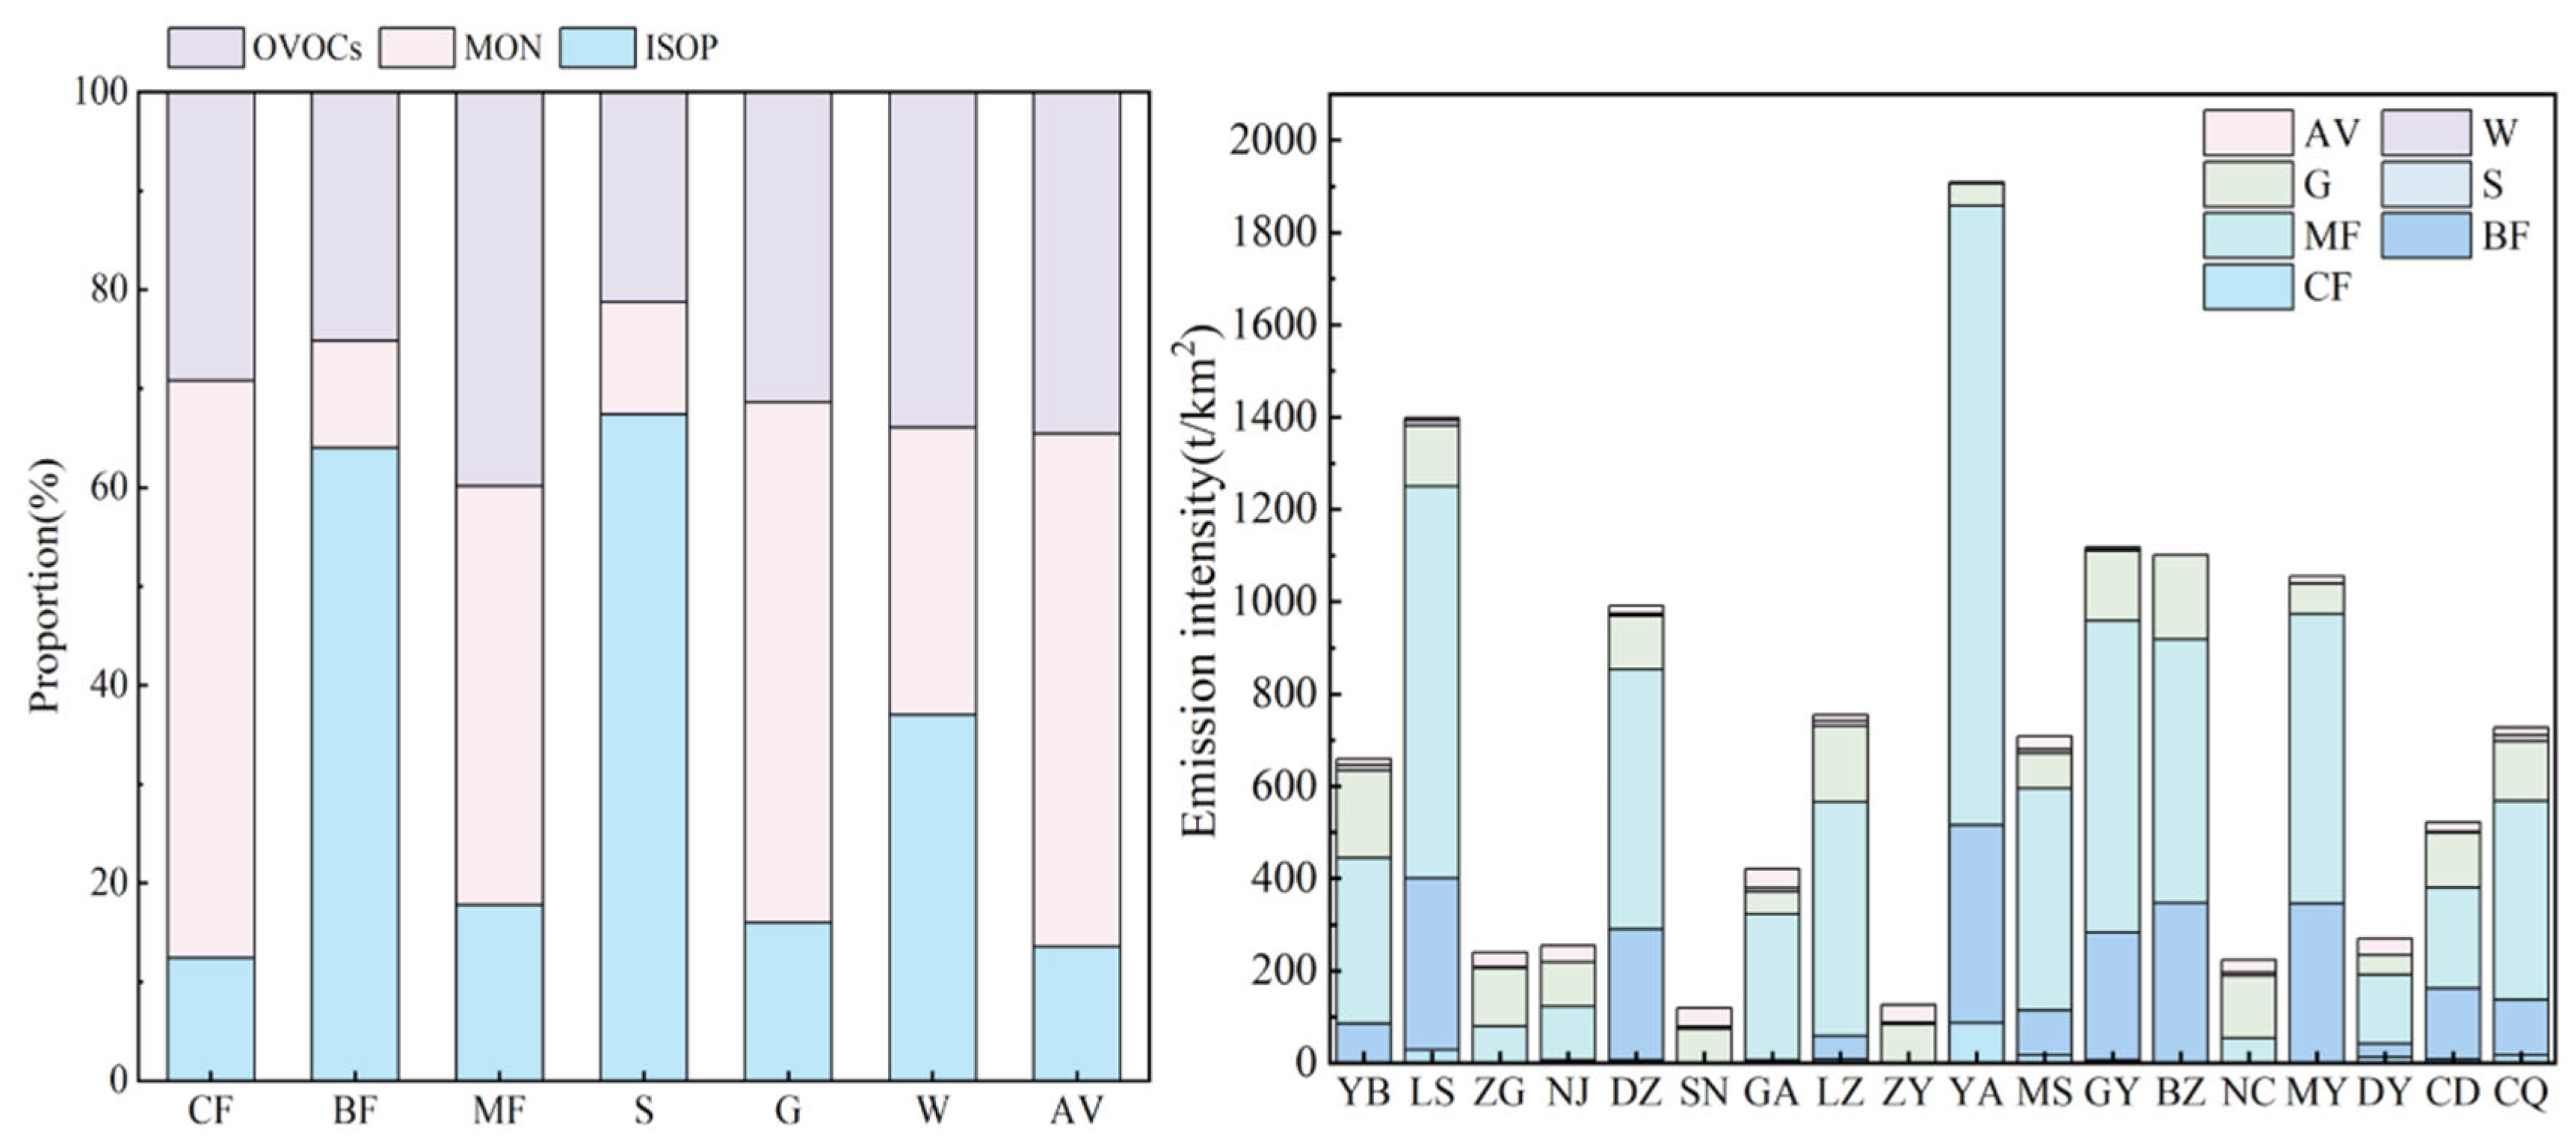
The total BVOC emissions in the Sichuan Basin in 2020 were 623.26 Gg, with ISOP, MON, and OVOCs accounting for 30.80%, 35.29%, and 33.91%, respectively. Different vegetation types exhibited significant differences in total emissions and emission intensity. Although mixed forests contributed the highest total emissions (50.24%), broad-leaved forests had the highest emission intensity (10.5 t/km2). In terms of composition, broad-leaved forests, shrublands, and wetlands mainly emitted ISOP, while coniferous forests, mixed forests, and grasslands mainly emitted MON, reflecting differences in their metabolic mechanisms. In terms of spatial distribution, the edges of the basin (e.g., Ya’an, Dazhou, and Mianyang) exhibited higher emissions due to widespread forest cover and diverse vegetation. In contrast, the agricultural areas at the basin’s center were mainly dominated by emissions from grasslands and crops, leading to lower overall emission intensity. Overall, BVOC emissions in the Sichuan Basin showed a spatial distribution of “higher at the edges, lower at the center,” influenced by vegetation type.
(2)
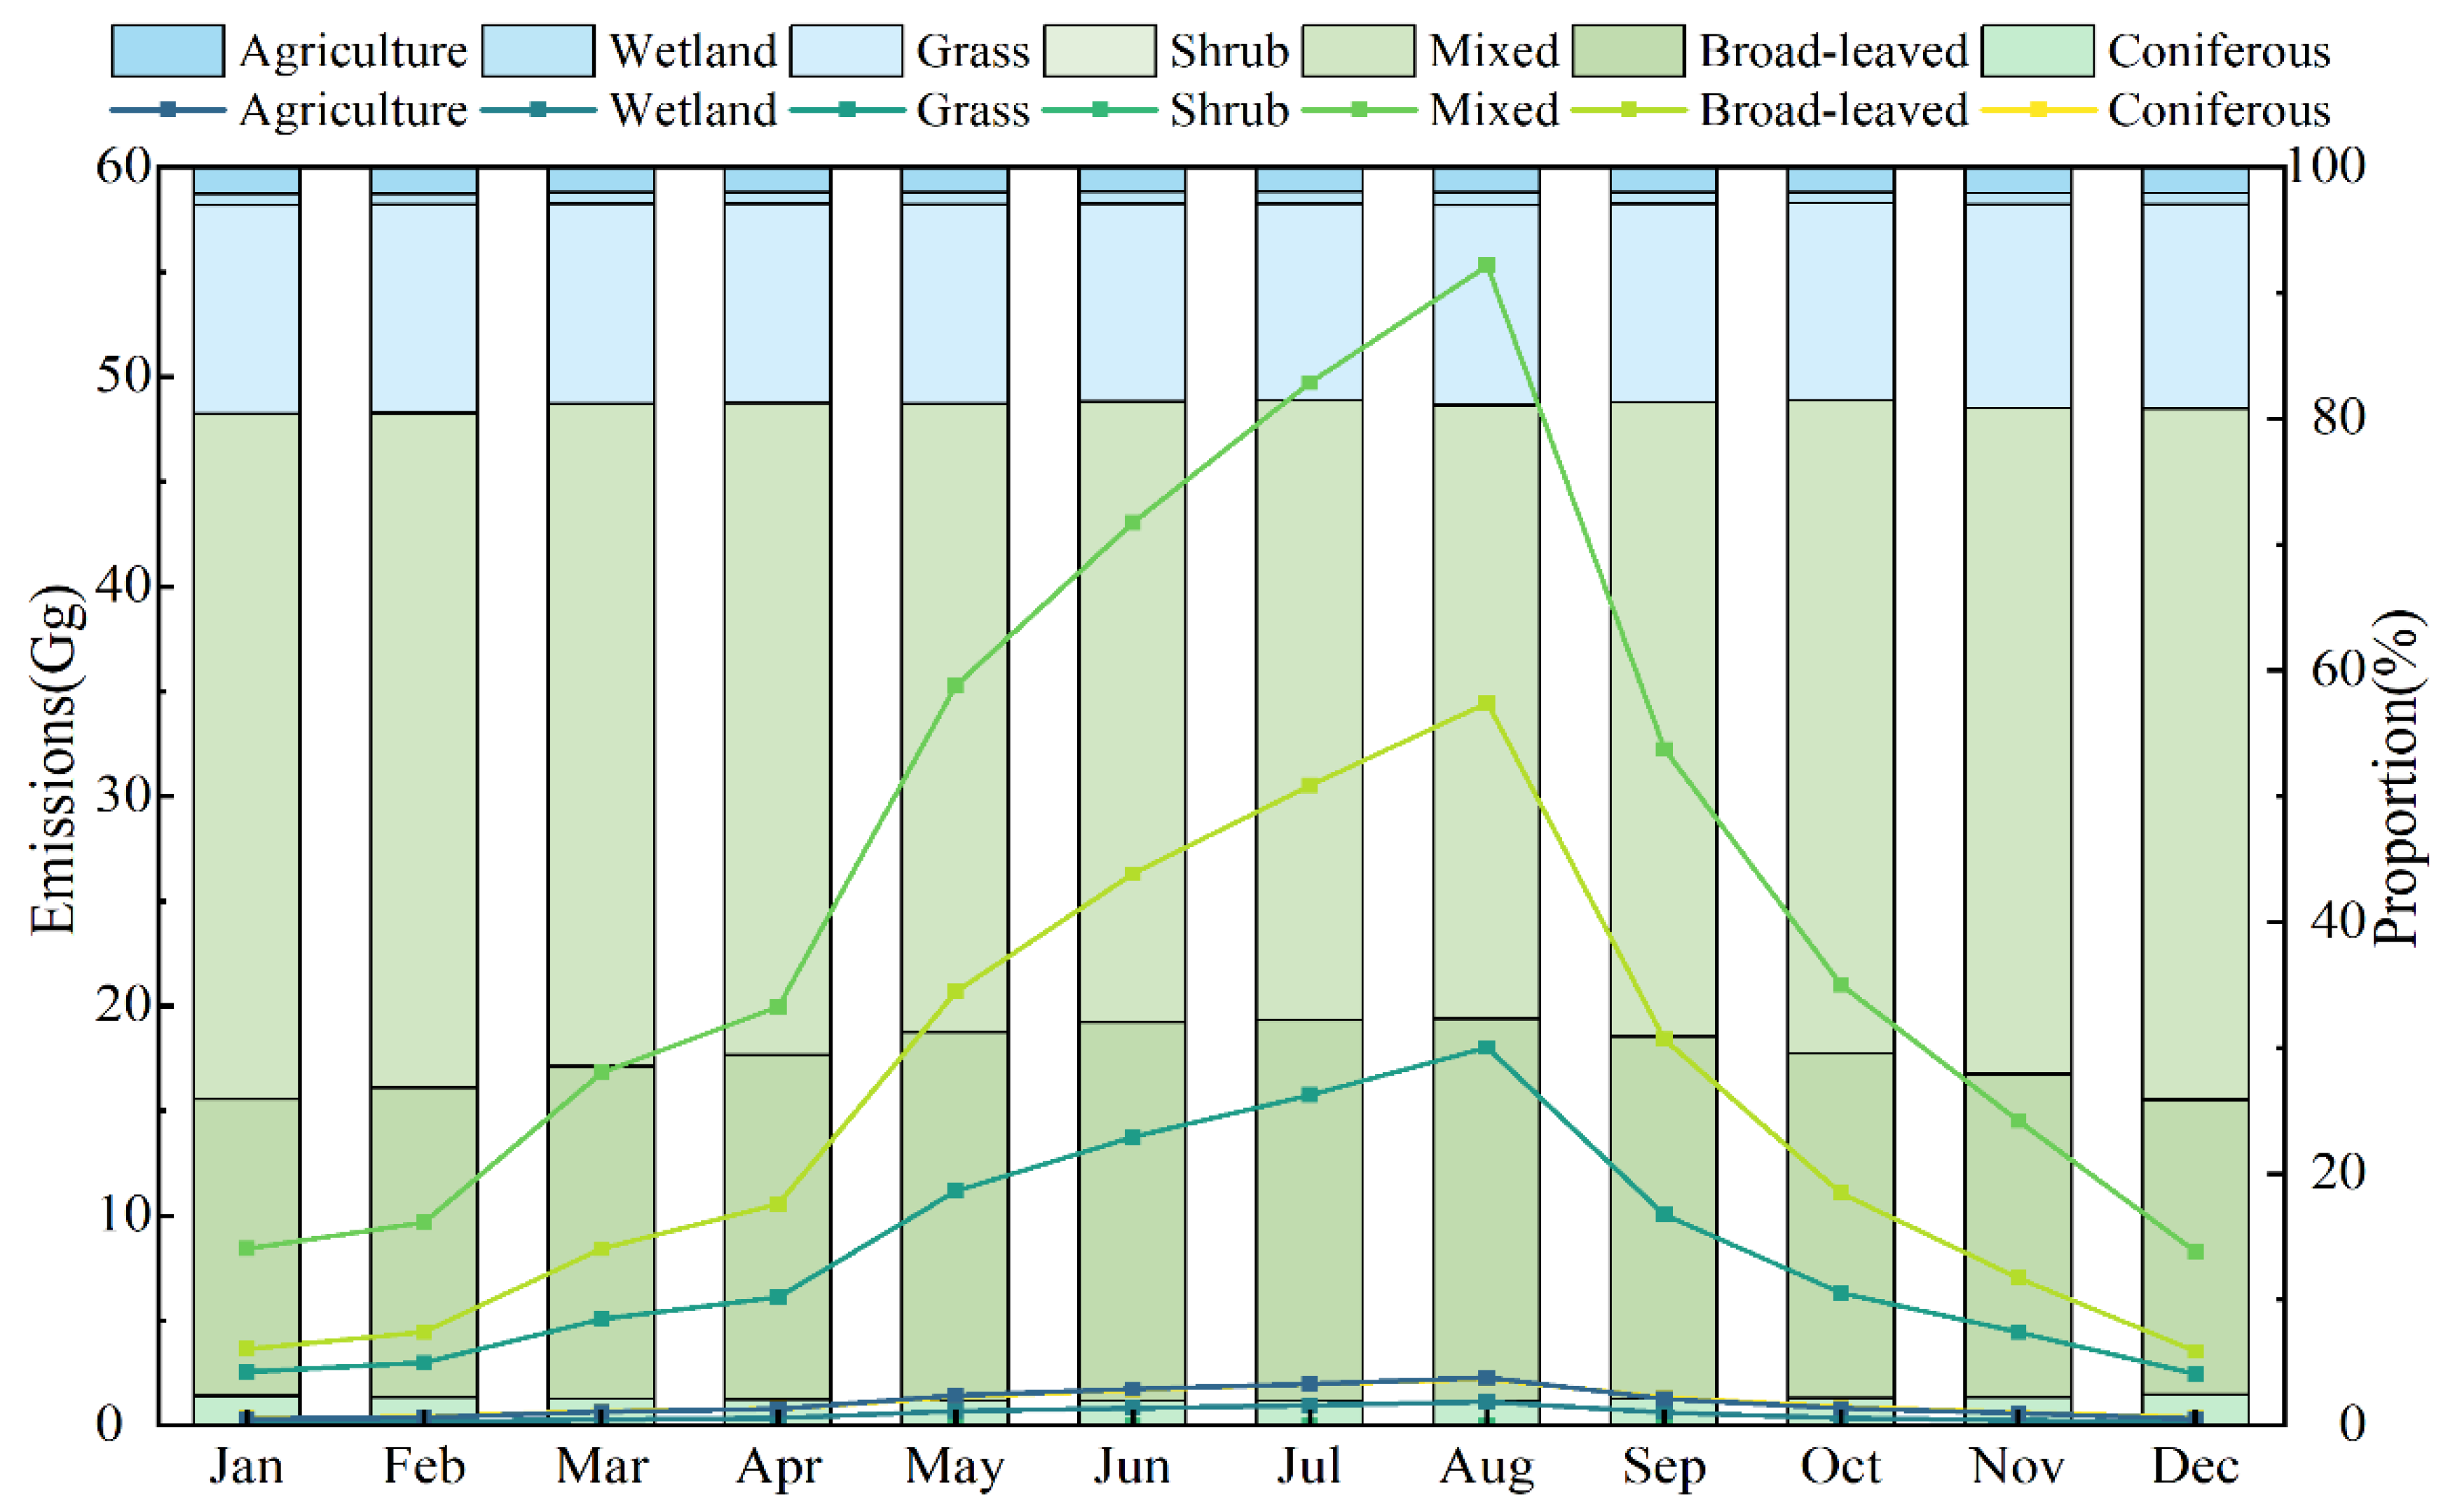
BVOC emissions in the Sichuan Basin exhibited significant seasonal variation, with an overall pattern of “high in summer, low in winter”. In August, emissions accounted for 18.19% of the annual total. The three main components (ISOP, MON, and OVOCs) all peaked in summer, with ISOP becoming the dominant component from June onward. Climate factors such as temperature and solar radiation primarily drove seasonal variation, with high temperatures and strong radiation significantly enhancing BVOC emissions from vegetation, thereby increasing emission intensity. Different vegetation types showed varying sensitivities to climate factors. Types like broad-leaved forests, shrublands, and wetlands, which mainly emit ISOP, showed a significant increase in emissions during summer, while coniferous forests and farmlands, which mainly emit MON, showed a decrease in relative emissions, indicating lower sensitivity to environmental factors. Overall, the dynamic evolution of the emission structure in the Sichuan Basin is determined by the differences in the response mechanisms of different vegetation types and their components to environmental factors.
(3)
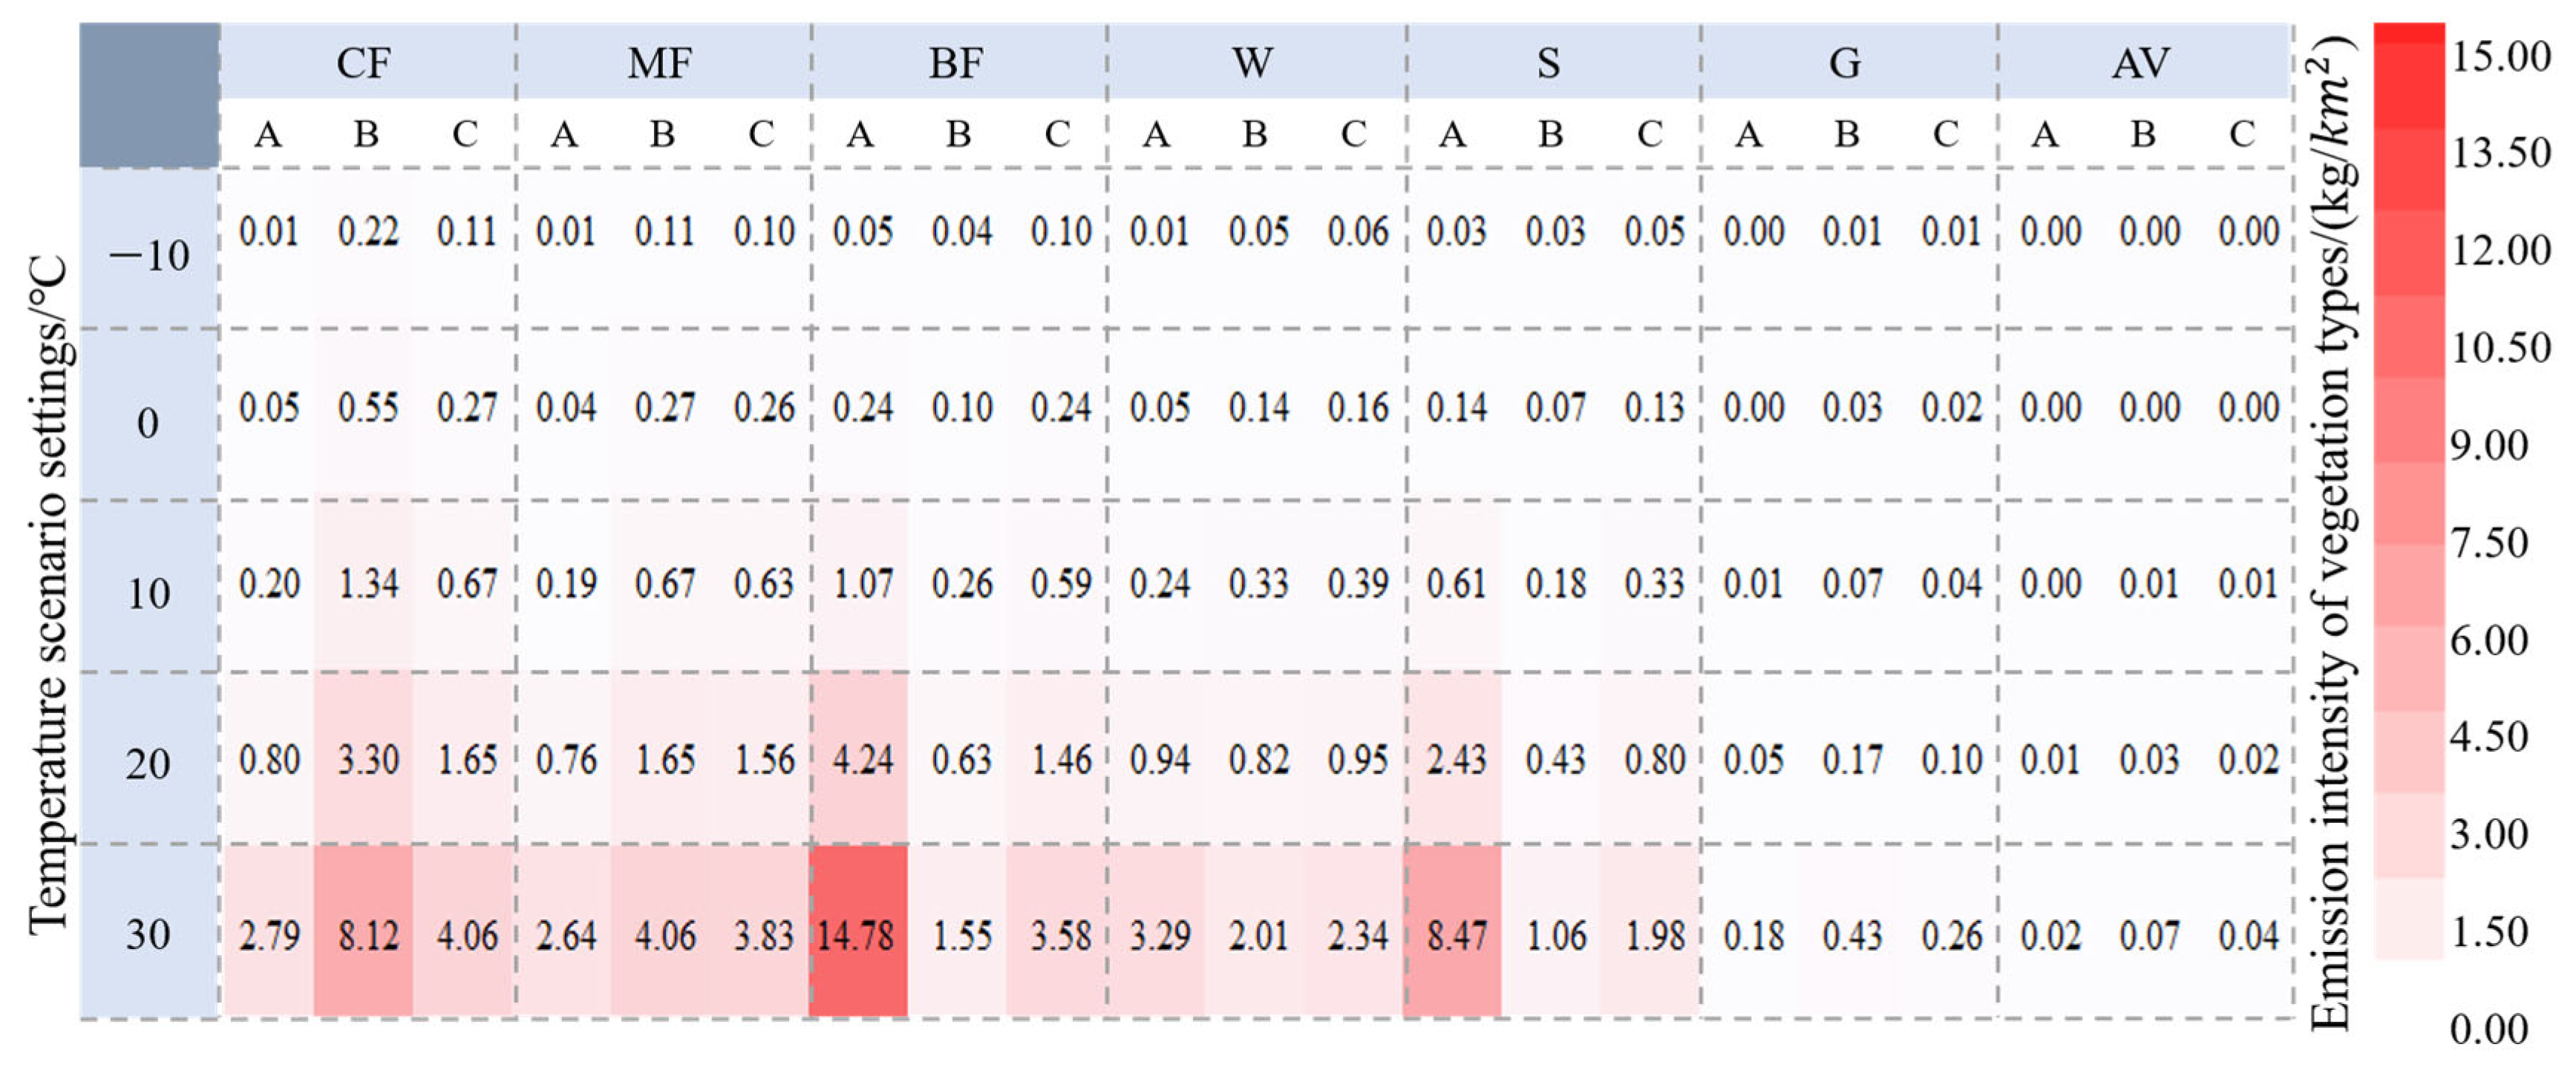
Temperature is one of the dominant factors regulating BVOC emissions in the Sichuan Basin. The emission intensity of all vegetation types significantly increased with rising temperatures, consistent with previous work, but their response characteristics differed notably. Under low-temperature conditions (−10 °C), coniferous forests dominated MON emissions, showing strong cold tolerance. In contrast, under high-temperature conditions (30 °C), broad-leaved forests exhibited a sharp increase in ISOP emissions, becoming the major contributor with a significant high-temperature response. The iso-temperature analysis further revealed the temperature sensitivity gradient of different vegetation types: broad-leaved forests were the most sensitive (3.94%), while agricultural vegetation was the least sensitive (0.03%).
(4)
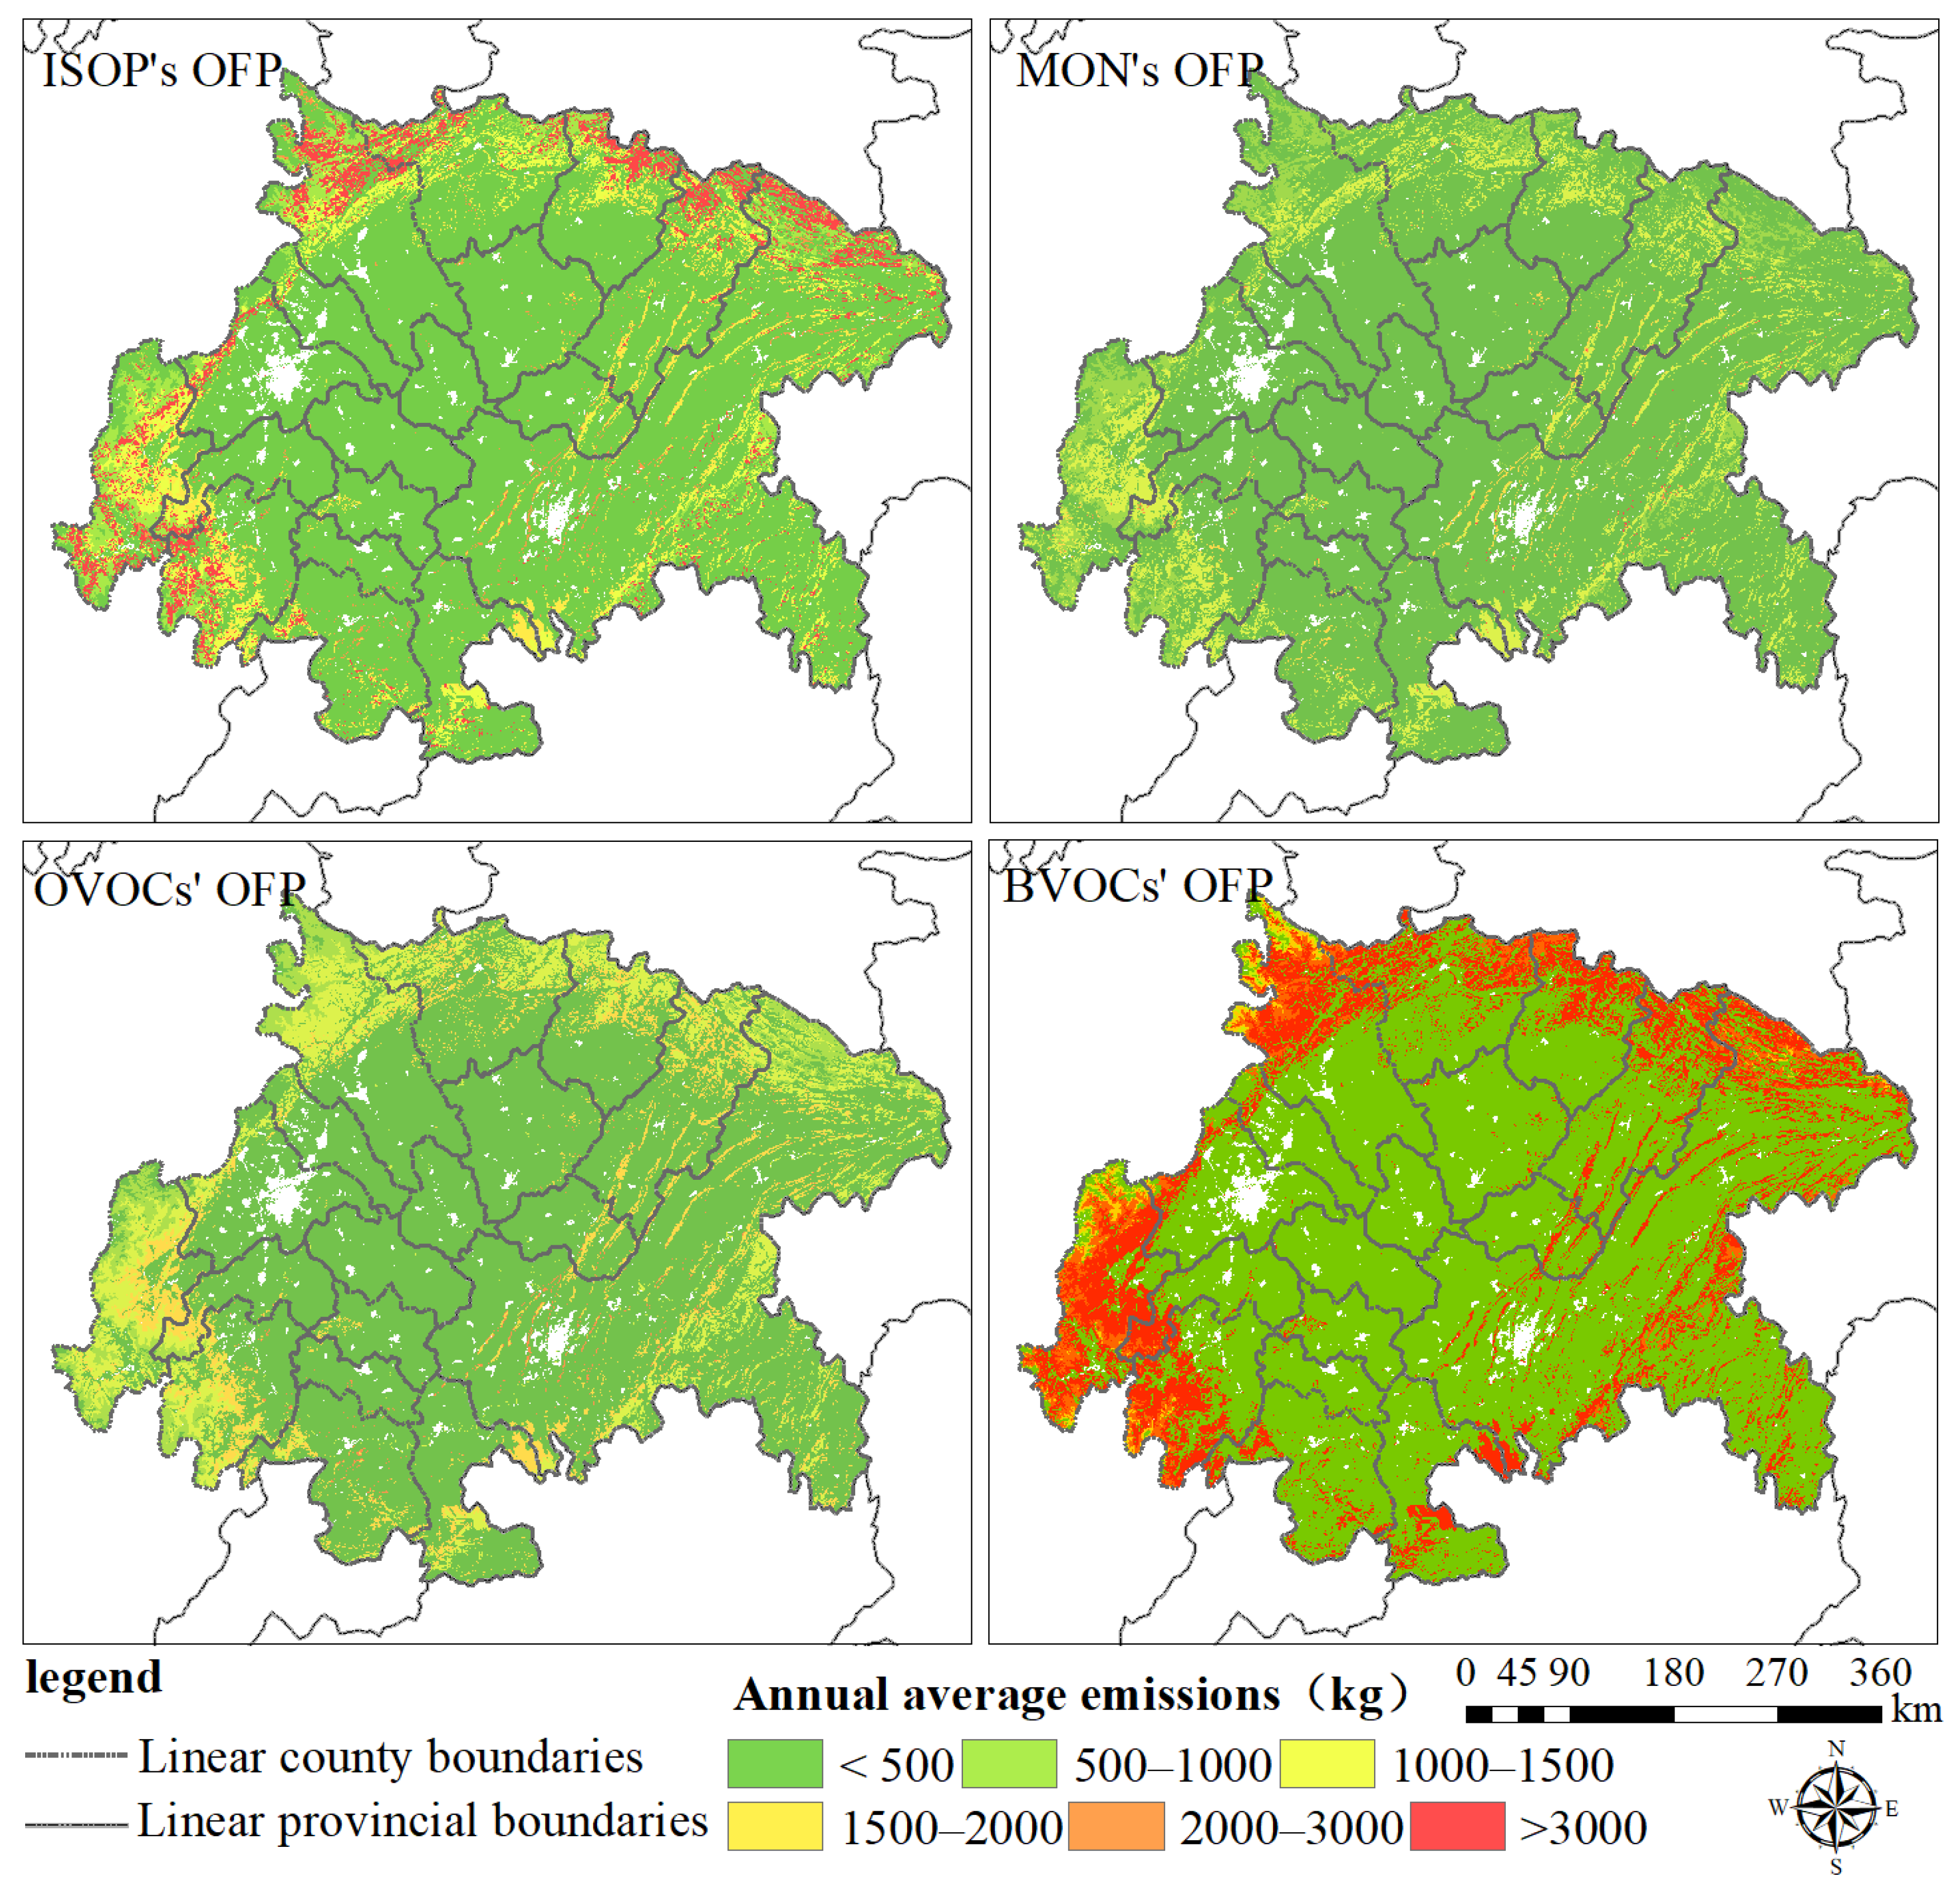
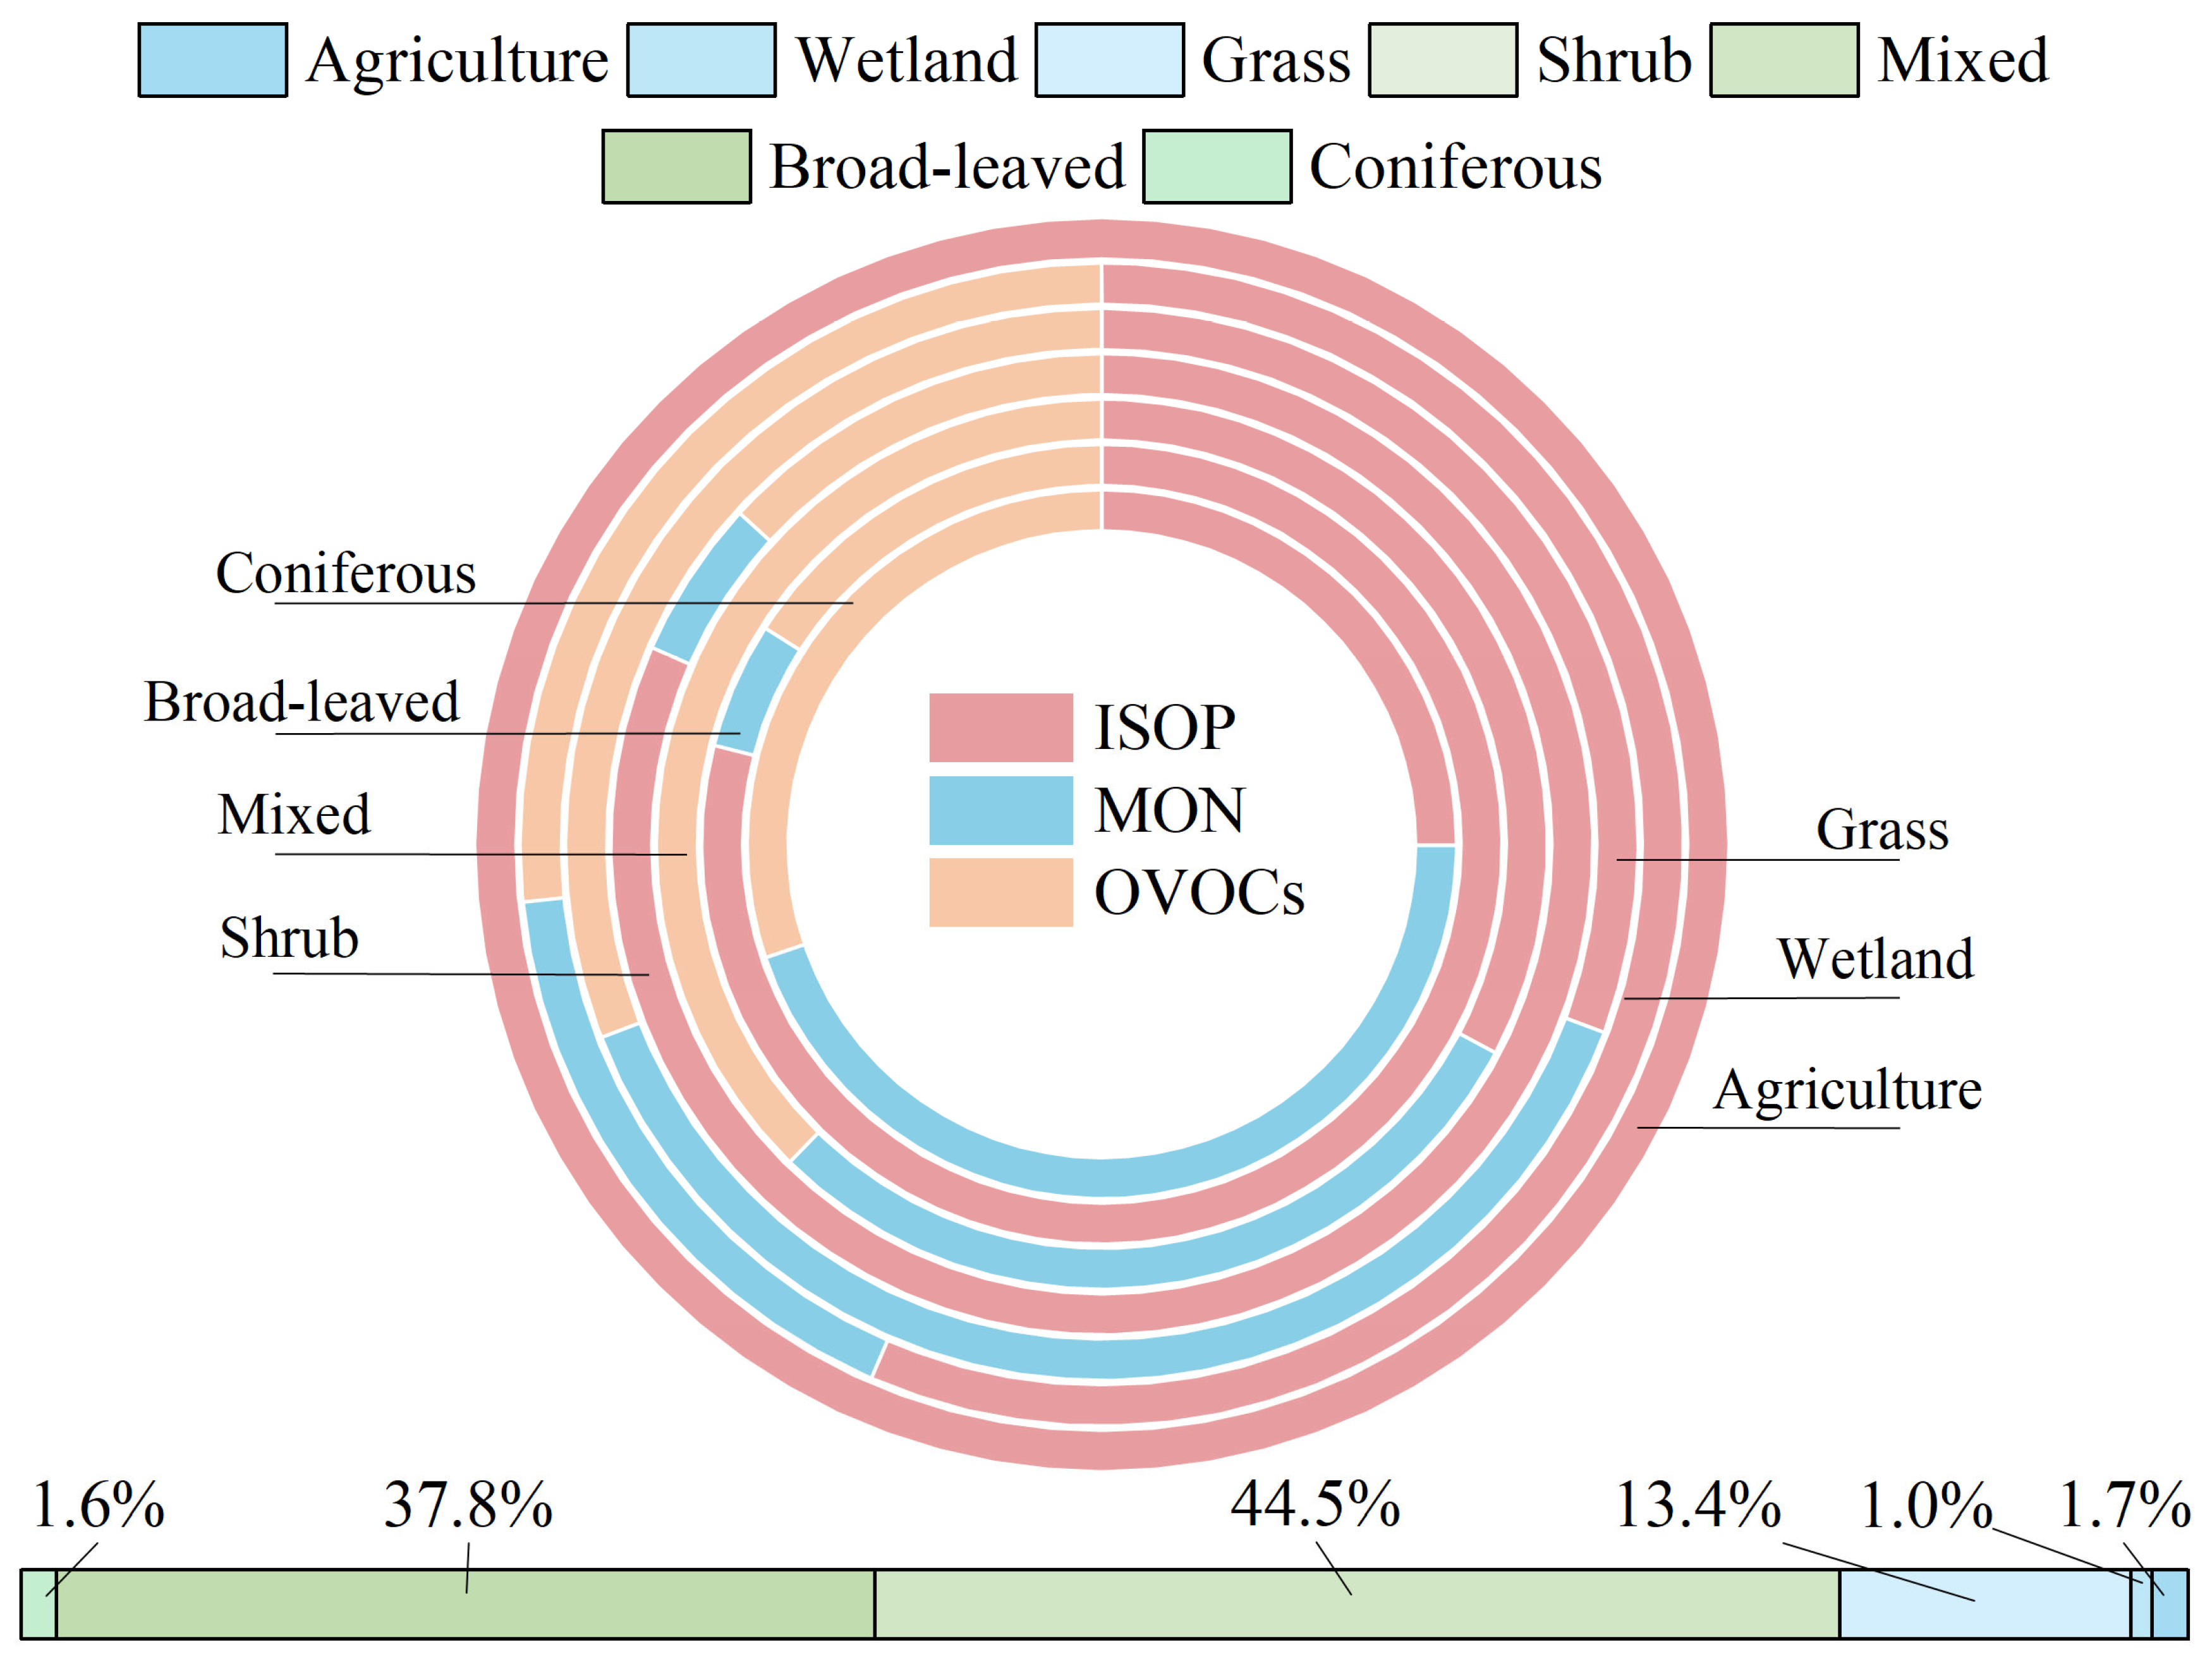
The total OFP of BVOCs in the Sichuan Basin is 4.08 million tons. ISOP is the largest contributor, accounting for 49.96%. It dominates in areas with high emission intensity. There is a significant difference among BVOC components. ISOP far exceeds MON and OVOCs. In terms of vegetation types, mixed forests, broadleaf forests, and grasslands are the main sources. Together, they contribute over 95% of the total OFP. The OFP from broadleaf forests, shrubs, and wetlands is mainly driven by highly reactive ISOP. In contrast, coniferous forests, grasslands, and croplands are dominated by MON, which has lower reactivity and weaker impact on ozone formation. OFP contributions show structural seasonal changes. In summer, mixed and broadleaf forests contribute more. In winter, the relative share of coniferous forests and other cold-season vegetation increases.

Author Contributions

Data curation, Q.Z. and Z.X.; Methodology, Q.Z.; supervision, L.Y.; Visualization, Z.X. and J.W.; writing—original draft, Q.Z.; writing—review and editing, L.Y. and E.L. All authors have read and agreed to the published version of the manuscript.

Funding

This research was funded by the National Natural Science Foundation of China under Grant No. 42201439.

Data Availability Statement

The original contributions presented in this study are included in the article. Further inquiries can be directed to the corresponding author.

Acknowledgments

We would like to express our deepest gratitude to Lin Yi and Zhihong Liu for their invaluable guidance and insightful feedback throughout the preparation of this paper. Their expertise and encouragement have been instrumental in shaping the direction and quality of this work. Additionally, we would like to thank all the public bodies that have made the data available through their online digital archives.

Conflicts of Interest

The authors declare no conflicts of interest.

References

  1. Liu, B.; Jin, Y.; Li, C. Analysis and prediction of air quality in Nanjing from autumn 2018 to summer 2019 using PCR-SVR-ARMA combined model. Sci. Rep. 2021, 11, 348. [Google Scholar] [CrossRef] [PubMed]
  2. Wang, H.; Huang, C.; Tao, W.; Gao, Y.; Wang, S.; Jing, S.; Wang, W.; Yan, R.; Wang, Q.; An, J.; et al. Seasonality and reduced nitric oxide titration dominated ozone increase during COVID-19 lockdown in eastern China. npj Clim. Atmos. Sci. 2022, 5, 24. [Google Scholar] [CrossRef]
  3. Wang, D.; Pu, D.; De, S.I.; Zhu, L.; Yang, X.; Sun, W.; Xia, H.; Song, Z.; Li, X.; Li, J.; et al. Evolution of global O3-NOx-VOCs sensitivity before and after the COVID-19 from the ratio of formaldehyde to NO2 from satellite observations. J. Environ. Sci. 2025, 156, 102–113. [Google Scholar] [CrossRef] [PubMed]
  4. Yenisoy-Karakas, S.; Dorter, M.; Odabasi, M. Intraday and interday variations of 69 volatile organic compounds (BVOCs and AVOCs) and their source profiles at a semi-urban site. Sci. Total Environ. 2020, 723, 138028. [Google Scholar] [CrossRef]
  5. Wang, Y.; Tan, X.; Huang, L.; Wang, Q.; Li, H.; Zhang, H.; Zhang, K.; Liu, Z.; Traore, D.; Yaluk, E.; et al. The impact of biogenic emissions on ozone formation in the Yangtze River Delta region based on MEGANv3.1. Air Qual. Atmos. Health 2021, 14, 763–774. [Google Scholar] [CrossRef]
  6. Ma, M.; Gao, Y.; Ding, A.; Su, H.; Liao, H.; Wang, S.; Wang, X.; Zhao, B.; Zhang, S.; Fu, P.; et al. Development and Assessment of a High-Resolution Biogenic Emission Inventory from Urban Green Spaces in China. Environ. Sci. Technol. 2022, 56, 175–184. [Google Scholar] [CrossRef] [PubMed]
  7. Moradi, A.; Abera, T.A.; Shayle, E.S.; Muhammed, M.A.; Zeuss, D. Modeling Long-Term Dynamics of Biogenic Volatile Organic Compounds (BVOCs) in Germany Based on Major Precursors. Environ. Sci. Technol. 2025, 59, 4587–4596. [Google Scholar] [CrossRef]
  8. Wang, H.; Wu, Q.; Guenther, A.B.; Yang, X.; Wang, L.; Xiao, T.; Li, J.; Feng, J.; Xu, Q.; Cheng, H. A long-term estimation of biogenic volatile organic compound (BVOC) emission in China from 2001–2016: The roles of land cover change and climate variability. Atmos. Chem. Phys. 2021, 21, 4825–4848. [Google Scholar] [CrossRef]
  9. Shao, M.; Wei, Y.; Lv, S.; Liao, Z.; Zou, J.; Zhu, J. Contribution and Mechanisms of BVOCs Emitted From a Typical Large Lake with Algal Bloom to O3 Levels in Lakeside Urban Areas. J. Geophys. Res. Atmos. 2025, 130, e2024JD042248. [Google Scholar] [CrossRef]
  10. Gao, C.; Zhang, X.; Lun, X.; Gao, Y.; Guenther, A.; Zhao, H.; Zhang, S.; Huang, L.; Song, K.; Huang, X.; et al. BVOCs’ role in dynamic shifts of summer ozone formation regimes across China and policy implications. J. Environ. Manag. 2025, 376, 124150. [Google Scholar] [CrossRef]
  11. Hang, J.; Wang, X.; Liang, J.; Zhang, X.; Wu, L.; Du, Y.; Zhang, Y.; Buccolieri, R. Numerical investigation of the impact of urban trees on O3–NOx–VOCs chemistry and pollutant dispersion in a typical street canyon. Atmos. Environ. 2023, 311, 119998. [Google Scholar] [CrossRef]
  12. Zheng, H.; Kong, S.; He, Y.; Song, C.; Cheng, Y.; Yao, L.; Chen, N.; Zhu, B. Enhanced ozone pollution in the summer of 2022 in China: The roles of meteorology and emission variations. Atmos. Environ. 2023, 301, 119701. [Google Scholar] [CrossRef]
  13. Chen, P.; Zhao, X.; Wang, O.; Shao, M.; Xiao, X.; Wang, S.; Wang, Q.G. Characteristics of VOCs and their Potentials for O3 and SOA Formation in a Medium-sized City in Eastern China. Aerosol Air Qual. Res. 2022, 22, 210239. [Google Scholar] [CrossRef]
  14. Wang, L.; Lun, X.; Wu, J.; Wang, Q.; Tao, J.; Dou, X.; Zhang, Z. Investigation of biogenic volatile organic compounds emissions in the Qinghai-Tibetan Plateau. Sci. Total Environ. 2023, 902, 165877. [Google Scholar] [CrossRef]
  15. Basso, L.S.; Marani, L.; Gatti, L.V.; Miller, J.B.; Gloor, M.; Melack, J.; Cassol, H.L.G.; Tejada, G.; Domingues, L.G.; Arai, E.; et al. Amazon methane budget derived from multi-year airborne observations highlights regional variations in emissions. Commun. Earth Environ. 2021, 2, 246. [Google Scholar] [CrossRef]
  16. Zhang, Q.; Li, L.; Zhao, W.; Wang, X.; Jiang, L.; Liu, B.; Li, X.; Lu, H. Emission characteristics of VOCs from forests and its impact on regional air quality in Beijing. China Environ. Sci. 2021, 41, 622–632. [Google Scholar]
  17. Bao, X.; Zhou, W.; Xu, L.; Zheng, Z. A meta-analysis on plant volatile organic compound emissions of different plant species and responses to environmental stress. Environ. Pollut. 2023, 318, 120886. [Google Scholar] [CrossRef]
  18. Cai, B.; Cheng, H.; Kang, T. Establishing the emission inventory of biogenic volatile organic compounds and quantifying their contributions to O3 and PM2.5 in the Beijing-Tianjin-Hebei region. Atmos. Environ. 2024, 318, 120206. [Google Scholar] [CrossRef]
  19. Sindelarova, K.; Markova, J.; Simpson, D.; Huszar, P.; Karlicky, J.; Darras, S.; Granier, C. High-resolution biogenic global emission inventory for the time period 2000–2019 for air quality modelling. Earth Syst. Sci. Data 2022, 14, 251–270. [Google Scholar] [CrossRef]
  20. Baggesen, N.; Li, T.; Seco, R.; Holst, T.; Michelsen, A.; Rinnan, R. Phenological stage of tundra vegetation controls bidirectional exchange of BVOCs in a climate change experiment on a subarctic heath. Glob. Change Biol. 2021, 27, 2928–2944. [Google Scholar] [CrossRef]
  21. Yu, H.; Holopainen, J.K.; Kivimaenpaa, M.; Virtanen, A.; Blande, J.D. Potential of Climate Change and Herbivory to Affect the Release and Atmospheric Reactions of BVOCs from Boreal and Subarctic Forests. Molecules 2021, 26, 2283. [Google Scholar] [CrossRef] [PubMed]
  22. Cai, M.; An, C.; Guy, C. A scientometric analysis and review of biogenic volatile organic compound emissions: Research hotspots, new frontiers, and environmental implications. Renew. Sustain. Energy Rev. 2021, 149, 111317. [Google Scholar] [CrossRef]
  23. Gao, C.; Zhang, X.; Yang, H.; Huang, L.; Zhao, H.; Zhang, S.; Xiu, A. Quantifying the impacts of environmental stress factors on biogenic volatile organic compound emissions in China. Agric. For. Meteorol. 2025, 366, 110480. [Google Scholar] [CrossRef]
  24. Ndah, F.; Valolahti, H.; Schollert, M.; Michelsen, A.; Rinnan, R.; Kivimaenpaa, M. Influence of increased nutrient availability on biogenic volatile organic compound (BVOC) emissions and leaf anatomy of subarctic dwarf shrubs under climate warming and increased cloudiness. Ann. Bot. 2022, 129, 443–455. [Google Scholar] [CrossRef] [PubMed]
  25. Wang, X.; Zhang, Y.; Tan, Y.; Tan, Y.; Bai, J.; Gu, D.; Ma, Z.; Du, J.; Han, Z. Effects of light on the emissions of biogenic isoprene and monoterpenes: A review. Atmos. Pollut. Res. 2022, 13, 101397. [Google Scholar] [CrossRef]
  26. Wang, N.; Wang, H.; Huang, X.; Chen, X.; Zou, Y.; Deng, T.; Li, T.; Lyu, X.; Yang, F. Extreme weather exacerbates ozone pollution in the Pearl River Delta, China: Role of natural processes. Atmos. Chem. Phys. 2024, 24, 1559–1570. [Google Scholar] [CrossRef]
  27. Smolander, S.; He, Q.; Mogensen, D.; Zhou, L.; Back, J.; Ruuskanen, T.; Noe, S.; Guenther, A.; Aaltonen, H.; Kulmala, M.; et al. Comparing three vegetation monoterpene emission models to measured gas concentrations with a model of meteorology, air chemistry and chemical transport. Biogeosciences 2014, 11, 5425–5443. [Google Scholar] [CrossRef]
  28. Lun, X.; Lin, Y.; Chai, F.; Fan, C.; Li, H.; Liu, J. Reviews of emission of biogenic volatile organic compounds (BVOCs) in Asia. J. Environ. Sci. 2020, 95, 266–277. [Google Scholar] [CrossRef]
  29. Zhang, M.; Zhao, C.; Yang, Y.; Du, Q.; Shen, Y.; Lin, S.; Gu, D.; Su, W.; Liu, C. Modeling sensitivities of BVOCs to different versions of MEGAN emission schemes in WRF-Chem (v3.6) and its impacts over eastern China. Geosci. Model Dev. 2021, 14, 6155–6175. [Google Scholar] [CrossRef]
  30. Ciccioli, P.; Silibello, C.; Finardi, S.; Pepe, N.; Ciccioli, P.; Rapparini, F.; Neri, L.; Fares, S.; Brilli, F.; Mircea, M.; et al. The potential impact of biogenic volatile organic compounds (BVOCs) from terrestrial vegetation on a Mediterranean area using two different emission models. Agric. For. Meteorol. 2023, 328, 109255. [Google Scholar] [CrossRef]
  31. Chen, P.; Zhao, X.; Wang, O.; Shao, M.; Xiao, X.; Wang, S.; Wang, Q.G. Emission characteristics of biogenic volatile organic compounds in a subtropical pristine forest of southern China. J. Environ. Sci. 2025, 148, 665–682. [Google Scholar] [CrossRef] [PubMed]
  32. Li, L.; Yang, W.; Xie, S.; Wu, Y. Estimations and uncertainty of biogenic volatile organic compound emission inventory in China for 2008–2018. Sci. Total Environ. 2020, 733, 139301. [Google Scholar] [CrossRef] [PubMed]
  33. Yuan, X.; Xu, Y.; Du, Y.; Feng, Z. Differences of biogenic volatile organic compound emissions from urban forests in Nanjing and Beijing. China Environ. Sci. 2022, 42, 1489–1500. [Google Scholar]
  34. Zhao, D.; Lun, X.; Wang, Q.; Wu, J.; Wang, X.; Feng, R. Emission Characteristics of Biogenic Volatile Organic Compounds in Shandong Province. Res. Environ. Sci. 2023, 36, 1487–1497. [Google Scholar]
  35. Wang, C.; Zhang, X.; Wang, J.; Pan, J.; Gao, J. Simulation of ozone pollution events in Sichuan Basin under the alternating effects of continental high pressure and subtropical high pressure circulation. Atmos. Res. 2025, 322, 108121. [Google Scholar] [CrossRef]
  36. Li, S.; Guo, J.; Wang, Y.; Lian, X.; Li, J. The Characteristics of PM2.5 and O3 Synergistic Pollution in the Sichuan Basin Urban Agglomeration. Atmosphere 2025, 16, 329. [Google Scholar] [CrossRef]
  37. Zhu, L.; Xie, S.; Yang, H.; Ma, M.; Xia, J. Topographic distribution characteristic of vegetation coverage change trend in Sichuan Province based on MODIS-EVI from 2000 to 2020. Ecol. Sci. 2024, 43, 187–195. [Google Scholar]
  38. Yu, S.-J.; Seo, Y.-S.; Son, Y.-S.; Kim, J.-C. Characteristics of BVOCs emitted from representative tree species in South Korea according to environmental influences. Atmos. Environ. 2024, 318, 120238. [Google Scholar] [CrossRef]
  39. Wang, J.; Zhang, X.; Wang, C.; Pan, J.; Gao, J. Early springtime O3 pollution episode in the Sichuan Basin: Transboundary and process analysis. Environ. Pollut. 2025, 373, 126163. [Google Scholar] [CrossRef]
  40. Peng, S.; Gang, C.; Cao, Y.; Chen, Y. Assessment of climate change trends over the Loess Plateau in China from 1901 to 2100. Int. J. Climatol. 2017, 38, 2250–2264. [Google Scholar] [CrossRef]
  41. Mao, H.; Zhang, K.; Di, B. Studies on estimates of biogenic VOC emission and its temporal and spatial distribution in Sichuan. China Environ. Sci. 2016, 36, 1289–1296. [Google Scholar]
  42. Chi, Y.; Zhan, Y.; Wang, K.; Ye, H. Sequential spatiotemporal distribution of PM2.5, SO2 and Ozone in China from 2015 to 2020. Earth Syst. Sci. Data Discuss. 2023, 2023, 1–38. [Google Scholar]
  43. Guenther, A.; Hewitt, C.N.; Erickson, D.; Fall, R.; Geron, C.; Graedel, T.; Harley, P.; Klinger, L.; Lerdau, M.; Mckay, W.A.; et al. A global model of natural volatile organic compound emissions. J. Geophys. Res.-Atmos. 1995, 100, 8873–8892. [Google Scholar] [CrossRef]
  44. Pierce, T.; Geron, C.; Bender, L.; Dennis, R.; Tonnesen, G.; Guenther, A. Influence of increased isoprene emissions on regional ozone modeling. J. Geophys. Res.-Atmos. 1998, 103, 25611–25629. [Google Scholar]
  45. Zeng, J.; Zhang, Y.; Mu, Z.; Pang, W.; Zhang, H.; Wu, Z.; Song, W.; Wang, X. Temperature and light dependency of isoprene and monoterpene emissions from tropical and subtropical trees: Field observations in south China. Appl. Geochem. 2023, 155, 105727. [Google Scholar] [CrossRef]
  46. Maison, A.; Lugon, L.; Park, S.-J.; Baudic, A.; Cantrell, C.; Couvidat, F.; D’Anna, B.; Di Biagio, C.; Gratien, A.; Gros, V.; et al. Significant impact of urban tree biogenic emissions on air quality estimated by a bottom-up inventory and chemistry transport modeling. Atmos. Chem. Phys. 2024, 24, 6011–6046. [Google Scholar] [CrossRef]
  47. Oku, H.; Iqbal, A.; Oogai, S.; Inafuku, M.; Mutanda, I. Relationship between Cumulative Temperature and Light Intensity and G93 Parameters of Isoprene Emission for the Tropical Tree Ficus septica. Plants 2024, 13, 243. [Google Scholar] [CrossRef]
  48. Long, Q.; Qiao, Y.; Jiang, T.; Li, Y.; He, M.; Luo, L. Effects of High Temperature on Biogenic Emissions and O3 Generation Contribution: A Case Study of July-August 2022 in Sichuan Basin. Res. Environ. Sci. 2023, 36, 2331–2343. [Google Scholar]
  49. Wang, N.; Du, Y.; Chen, D.; Meng, H.; Chen, X.; Zhou, L.; Shi, G.; Zhan, Y.; Feng, M.; Li, W.; et al. Spatial disparities of ozone pollution in the Sichuan Basin spurred by extreme, hot weather. Atmos. Chem. Phys. 2024, 24, 3029–3042. [Google Scholar] [CrossRef]
  50. Liu, D.; Hai, S.; Meng, J.; Zhang, W.; Zhou, Y.; Zhao, Y.; Liu, X.; Li, W.; Sheng, L. Crucial VOCs influences on ozone formation in North China: A spatial perspective. Atmos. Environ. 2025, 351, 121183. [Google Scholar] [CrossRef]
  51. Lee, S.-H.; Lee, J.-S.; Lee, H.-M.; Kwon, H.-A.; Nowlan, C.R.; Abad, G.G.; Park, R.J.; Park, J.-H.; Kang, S.; Shin, H.-J.; et al. Understanding Ozone Formation and Carbonyl Contributions in the Seoul Metropolitan Area. Aerosol Air Qual. Res. 2024, 24, 230227. [Google Scholar] [CrossRef]
  52. Venecek, M.A.; Carter, W.P.L.; Kleeman, M.J. Updating the SAPRC Maximum Incremental Reactivity (MIR) scale for the United States from 1988 to 2010. J. Air Waste Manag. Assoc. 2018, 68, 1301–1316. [Google Scholar] [CrossRef] [PubMed]
  53. Cai, B.; Cheng, H.; Qi, H.; Li, A.; Kang, T. Contribution of Different Types of Vegetation to Oand PMin Typical Cities in Beijing-Tianjin-Hebei Region in Summer. China Environ. Sci. 2023, 43, 2734–2743. [Google Scholar]
  54. Jing, X.; Lun, X.; Fan, C.; Ma, W. Emission patterns of biogenic volatile organic compounds from dominant forest species in Beijing, China. J. Environ. Sci. 2020, 95, 73–81. [Google Scholar] [CrossRef]
  55. Zoric, M.; Kostic, S.; Kladar, N.; Bozin, B.; Vasic, V.; Kebert, M.; Orlovic, S. Phytochemical Screening of Volatile Organic Compounds in Three Common Coniferous Tree Species in Terms of Forest Ecosystem Services. Forests 2021, 12, 928. [Google Scholar] [CrossRef]
  56. Borsdorf, H.; Bentele, M.; Mueller, M.; Rebmann, C.; Mayer, T. Comparison of Seasonal and Diurnal Concentration Profiles of BVOCs in Coniferous and Deciduous Forests. Atmosphere 2023, 14, 1347. [Google Scholar] [CrossRef]
  57. Baek, D.-H.; Seo, Y.-B.; Yu, S.-J.; Choi, I.-Y.; Lee, S.-W.; Son, Y.-S.; Dinh, T.-V.; Kim, J.-C. Comparison of biogenic volatile organic compounds emissions from representative urban tree species in South Korea and evaluation of standard emission rate models. Atmos. Environ. 2024, 333, 120654. [Google Scholar] [CrossRef]
  58. Ma, F.; Zhang, G.; Zhang, J.; Luo, X.; Liao, L.; Wang, H.; Tang, X.; Yi, Z. Isoprenoid emissions from Schima superba and Cunninghamia lanceolata: Their responses to elevated temperature by two warming facilities. Sci. Total Environ. 2024, 930, 172669. [Google Scholar] [CrossRef]
  59. Li, L.; Bai, G.; Han, H.; Wu, Y.; Xie, S.; Xie, W. Localized biogenic volatile organic compound emission inventory in China: A comprehensive review. J. Environ. Manag. 2024, 353, 120121. [Google Scholar] [CrossRef]
  60. Mochizuki, T.; Ikeda, F.; Tani, A. Effect of growth temperature on monoterpene emission rates of Acer palmatum. Sci. Total Environ. 2020, 745, 140886. [Google Scholar] [CrossRef] [PubMed]
  61. Kalbande, R.; Kumar, B.; Maji, S.; Yadav, R.; Atey, K.; Rathore, D.S.; Beig, G. Machine learning based quantification of VOC contribution in surface ozone prediction. Chemosphere 2023, 326, 138474. [Google Scholar] [CrossRef]
Figure 1. Overview of the Sichuan Basin’s geography, main vegetation types, and near-ground O3 concentrations. (a) Spatial distribution of annual mean surface ozone concentrations in 2020. Red indicates high-value areas. Green shows low-value zones. (b) Geographical location of the Sichuan Basin. (c) Spatial distribution of major vegetation types studied in the Sichuan Basin.
Forests 16 01091 g001
Figure 2. Composition of BVOC components from different vegetation types and vegetation-based BVOC emission profiles of prefecture-level cities in the Sichuan Basin. Note: CF means Coniferous forest, MF means Mixed forest, BF means Broad-leaved forest, W means Wetland, S means Shrub, G means Grassland, AV means Agriculture vegetation; YB is Yibin, LS is Leshan, ZG is Zigong, NJ is Neijiang, DZ is Dazhou, SN is Suining, GA is Guangan, LZ is Luzhou, ZY is Ziyang, YA is Yaan, MS is Meishan, GY is Guangyuan, BZ is Bazhong, NC is Nanchong, MY is Mianyang, DY is Deyang, CD is Chengdu, CQ is Chongqin.
Forests 16 01091 g002
Figure 3. Spatial gradient characteristics of BVOC emissions in the Sichuan Basin (2020).
Forests 16 01091 g003
Figure 4. The variation characteristics and component composition of BVOC emissions in the Sichuan Basin from January to December 2020. Line charts show monthly variations of different components. Stacked bar charts display percentage contributions of ISOP, MON, and OVOCs each month.
Forests 16 01091 g004
Figure 5. The variation characteristics and proportion of BVOC emissions from different vegetation types in the Sichuan Basin from January to December 2020. The line chart shows the monthly linear trends in BVOC emissions for each vegetation type. The bar chart displays the percentage contribution of each vegetation type to the total BVOC emissions per month.
Forests 16 01091 g005
Figure 6. BVOC emission intensity from different vegetation types under various temperatures. Note: CF means Coniferous forest, MF means Mixed forest, BF means Broad-leaved forest, W means Wetland, S means Shrub, G means Grassland, AV means Agriculture vegetation; A means ISOP, B means MON, C means OVOCs.
Forests 16 01091 g006
Figure 7. Annual average OFP spatial distribution map of natural resources in the Sichuan Basin. (Note: The OFP of BVOCs is the sum of the OFPs of ISOP, MON, and OVOCs.).
Forests 16 01091 g007
Figure 8. OFP contribution proportions of BVOC emissions and their components from different vegetation types. The donut chart displays BVOC component percentages for each vegetation type. The bar chart compares vegetation types’ OFP contributions to totals. Colors represent different vegetation types (see legend).
Forests 16 01091 g008
Figure 9. Seasonal variation trends in OFP contributions from different vegetation types.
Forests 16 01091 g009
Table 1. Data used in this study.
DataSourcePeriodResolution
TemperatureTPDCJanuary 2020–December 20201 km
PARNASAJanuary 2020–December 2020
Vegetation typeNASA20201 km
Emission factorsRef. [33]--
LMDRef. [33]--
Ozone concentrationshttps://doi.org/10.5281/zenodo.7580726, accessed on 29 April 20251 January 2020–31 December 20201 km
Table 2. Land cover reclassification scheme.
Vegetation TypeIGBP Land Cover
Coniferous forestEvergreen Needleleaf Forest; Deciduous Needleleaf Forest
Broad-leaved forestEvergreen Broadleaf Forest
Deciduous Broadleaf Forest
Mixed forestMixed Forest
ShrublandClosed Shrublands
Open Shrublands
GrasslandWoody Savannas
Savannas
Grasslands
Wetland vegetationPermanent Wetlands
Agricultural vegetationCroplands
Cropland/Natural Vegetation Mosaic
Non-vegetationWater Bodies
Urban and Built-Up
Permanent Snow and Ice
Barren or Sparsely Vegetated
Table 3. Scenario design.
ScenarioSetting SchemeTemperature Setting/°C
Temperature classification scenarioS130
S220
S310
S40
S5−10
Table 4. Emission characteristics of BVOCs from different vegetation types in the Sichuan Basin (2020).
EmissionsArea
( k m 2 )
Emission Intensity
( t / k m 2 )
Emission
( G g )
Proportion
(%)
Grassland103.92 16.67%125,2070.83
Shrub0.02 0.00%210.28
Mixed forest292.67 46.96%38,3587.63
Broad-leaved forest197.90 31.75%18,84710.50
Agriculture vegetation11.71 1.88%78,0990.15
Wetland5.01 0.80%6008.35
Coniferous forest12.02 1.93%12679.49
Disclaimer/Publisher’s Note: The statements, opinions and data contained in all publications are solely those of the individual author(s) and contributor(s) and not of MDPI and/or the editor(s). MDPI and/or the editor(s) disclaim responsibility for any injury to people or property resulting from any ideas, methods, instructions or products referred to in the content.

