Article

A Participatory Multi-Criteria Approach to Select Areas for Post-Fire Restoration After Extreme Wildfire Events

by
Sara María Casados
1,*,
Sergio Rodríguez-Fernández
1,
Susete Marques
1,
Ana María Monsalve Cuartas
1,
Sergio de Frutos
2,
Lluís Coll
2,3 and
José G. Borges
1
1
Forest Research Center and Associated Laboratory TERRA, School of Agriculture (ISA), University of Lisbon, Tapada da Ajuda, 1349-017 Lisboa, Portugal
2
Joint Research Unit CTFC-Agrotecnio-CERCA, Crta. St. Llorenç de Morunys, km. 2, 25280 Solsona, Spain
3
Department of Agriculture and Forest Sciences and Engineering (DCEFA), University of Lleida, 25192 Lleida, Spain
*
Author to whom correspondence should be addressed.
Forests 2025, 16(7), 1090; https://doi.org/10.3390/f16071090
Submission received: 4 June 2025 / Revised: 23 June 2025 / Accepted: 26 June 2025 / Published: 1 July 2025
(This article belongs to the Section Natural Hazards and Risk Management)

Abstract

Extreme wildfire events (EWEs) are becoming increasingly frequent in Mediterranean regions, posing significant threats to ecosystems. This study aimed to support post-fire restoration planning by developing a prioritization framework that categorizes areas according to different levels of vulnerability to the adverse impacts of EWEs. We developed a multi-criteria decision analysis (MCDA) approach to classify these areas within a fire perimeter. The process begins with the collection of available spatial data to assess the pre- and post-fire conditions. Following this, a set of criteria and sub-criteria was established through a participatory approach with local stakeholders. The analytic hierarchy process (AHP) was used to determine stakeholders’ preferences, which were then processed using the Criterium Decision Plus (CDP) version 4 software to support problem modeling. A combined consistency check was applied to ensure both individual coherence and group agreement. Finally, the methodology was integrated using the Ecosystem Management Decision Support (EMDS) software version 9, resulting in a spatial prioritization map that visually represents the levels of restoration priority and serves as a decision-support tool for post-fire restoration planning. Both the process and its results are discussed for an application to a large fire perimeter in the Vale do Sousa forested landscape.

1. Introduction

Across the globe, the frequency and intensity of large-scale wildfires have been steadily increasing [1]. Among these events, a particularly dangerous subset has emerged: extreme wildfire events (EWEs) [2]. These fires are characterized by extreme behavior, with exceptionally high energy release, unpredictable spread patterns, and unprecedented size [3].
In 2017, Portugal experienced the most severe instances of EWEs in its recorded history, with fires whose suppression exceeded the human and logistical capacities [4]. Socio-economic dynamics, such as rural depopulation, land abandonment, and shifting land use patterns, are linked to the increasing vulnerability of landscapes to wildfires [5,6].
Given the increasing frequency and severity of EWEs in Portugal, prioritization within restoration planning efforts is very important [7,8]. The process of decision-making can be effectively supported by GIS tools, especially when engaging with multiple stakeholders [9,10,11]. As Mediterranean landscapes are coupled socio-ecological systems [12,13], societal engagement through a participatory process contributes to the effectiveness of decision-making [14].
In the broader literature on post-fire restoration efforts, among the main criteria used to evaluate the landscape after a wildfire, the resprouting ability of fire-prone species is a key factor in assessing vegetation recovery [15]. Soil erosion also plays a central role in understanding land degradation following wildfires. The Revised Universal Soil Loss Equation (RUSLE) is a widely used model to estimate the long-term average annual soil loss [16,17]. Fire severity, defined as the degree of biomass consumption or degradation caused by fire [18], strongly influences post-fire plant responses, depending on both the species’ traits and fire intensity.
Involving stakeholders in selecting criteria strengthens the fire and forest management strategies [19,20] and allows for context-specific decision-making. Geospatial technologies support the process by facilitating data visualization and spatial analysis [21,22,23], while also enabling the monitoring of post-fire vegetation recovery over time [24]. Tools like the Ecosystem Decision Support (EMDS) software and the Criterium Decision Plus (CDP) application from InfoHarvest (Seattle, WA, USA) exemplify how stakeholder preferences can be effectively incorporated into a GIS-based environment [25,26].
Recent applications of MCDA have emphasized the importance of stakeholder involvement in defining utility functions and assigning weights. For example, recent research engaged multiple stakeholders to prioritize the location of fuel treatments in forests to facilitate suppression if a wildfire occurs [27,28]. A key component of MCDA is the use of pairwise comparisons, typically conducted through questionnaires or surveys within the analytic hierarchy process (AHP) framework [29,30].
AHP is extensively applied in various fields, including natural resource management, due to its effectiveness in facilitating multi-objective planning [31]. AHP problem structuring involves the design of a hierarchy of criteria and sub-criteria to reflect their relative importance [32]. Consistency in AHP refers to the degree of logical coherence among paired comparisons, specifically relating to the principle of cardinal transitivity between judgements [33]. For example, one study incorporated an approach to evaluate both individual consistency and overall group coherence when deriving weights [34].
To our knowledge, no studies have applied a spatial MCDA approach for post-fire restoration prioritization following EWEs, either in Portugal or internationally. This research aims to fill this gap by designing post-fire restoration prioritization planning with local stakeholders to address restoration concerns following the EWE event in 2017 in Vale do Sousa, Portugal.
This study aimed to develop a participatory and spatially explicit decision-support approach to guide restoration planning after wildfires. The hypothesis is that integrating expert and stakeholder knowledge through a structured multi-criteria approach can effectively identify priority areas for post-fire restoration, reflecting both ecological and social needs. To achieve this, the study first identified and structured relevant criteria for restoration prioritization through a participatory process. It then applied the analytic hierarchy process (AHP) to quantify the relative importance of each criterion and define parameters that distinguish between low- and high-priority areas, as perceived by different stakeholders. Rather than excluding participants with lower consistency in their responses, all inputs were integrated to promote inclusivity and reduce potential bias. Finally, the results were synthesized into a spatial prioritization map, offering a practical tool for decision-makers involved in post-fire restoration efforts in the study area.

2. Materials and Methods

2.1. Study Area Description

The research was conducted in Vale do Sousa, located in northwestern Portugal. It extends over an area of 28,940 ha, from which 14,320 ha corresponds to the Joint Management Areas (ZIF), separated by the Douro River. Elevation ranges from 20 to 710 m in the south and to 400 m in the north. Its topography is very uneven, and slopes can be very steep. This rural region has a Mediterranean climate with an Atlantic influence, and the soils present are mostly Umbric Leptosols and Leptic Regosols, developed over schist and granite bedrocks [35].
In the case study area, the land use composition following the EWE event was characterized by a predominance of forest stands (68.68%) (Figure 1). Within the forested landscape, eucalypt forests (Eucalyptus globulus Labill.) were the most prevalent, covering 53.79% of the total area and 80.34% of the forest area, followed by Maritime pine (Pinus pinaster Aiton.) forests, covering 11.06% of the forested area. Both species are used in commercial forestry. At a smaller scale, other forest species are also present.
Agriculture is the second most prominent land use (16.59%). Urban, industrial, and infrastructure areas make up 6.51% of the landscape. Shrublands extend over 6.55% of the area, suggesting the presence of transitional or degraded areas, or natural shrub-dominated ecosystems.
Wildfires have been very frequent in the three municipalities over which the Vale do Sousa landscape is distributed (Figure 2). In Portugal, 2017 ranked as the second warmest of the last two decades, marked by an extended drought, particularly a dry period from April to December, heightening the fire risk [36]. During this year, the total burned area in the study region reached 9700 ha (25.7% of the total area).

2.1.1. Characterization of the 2017 Fire Perimeter and Pre-Selection of Criteria and Sub-Criteria

The EWE that affected Vale do Sousa in 2017 was selected for detailed analysis due to its exceptional severity and enduring impacts at both the national and local scales in Portugal. Within the overall burned area in the region, a continuous patch was identified as the focus for applying a spatially explicit restoration prioritization model. A specific fire perimeter from 2017 was selected due to its uninterrupted fire spread, exceeding the suppression capacity. This fire perimeter corresponded to a large and continuous burned patch that displayed extreme fire behavior and exceeded the human suppression capabilities.
The characterization of the 2017 fire perimeter as well as the pre-selection of criteria and sub-criteria required the retrieval of information on key factors influencing the post-fire restoration needs. These were based on publicly available cartographic layers or data easily derived through the GIS processing of existing sources [37]. Specifically, inventory data about the wildfire perimeters and part of the criteria were retrieved from the Institute for Nature Conservation and Forests and the School of Agronomy [38,39]. Available information on the soil properties was extracted from the “Carta de Solos e Carta de Aptidão da Terra para a Agricultura (1:25,000)” [40,41] and converted to the American Soil Classification System [42]. The slope length and steepness were represented by the L and S factors [43], and the C factor reflects the vegetation cover as a function of tree canopy density [44].
Fire severity, defined as the degree of biomass consumption or degradation caused by fire [45], strongly influences the post-fire plant responses, depending on both the species’ traits and fire intensity. Higher fire severity often results in a greater loss of plant cover and organic matter, increasing the soils’ vulnerability to erosion [46].
Post-fire vegetation was evaluated using the Land Use and Occupation Classification [47], which facilitated a detailed analysis of the type of species present in the area. To address the species level detail in the area affected by the fire, simulated inventories were used to obtain information related to the composition and biometric variables of the vegetation cover [48,49,50,51,52,53], enabling a more accurate understanding of species recovery potential in the burned area. Spatial data related to human presence and infrastructure were compiled, following the approach in [54].
To define the protection zones around watercourses, information was extracted from the National Environmental Information System (SNIAmb) [55]. In accordance with Decree-Law no. 54/2005, buffer zones of 10 m were applied for non-navigable waterways and 30 m for navigable waterways. Buffers were applied to the shapefile of social areas, including isolated buildings and settlements, in accordance with Portuguese legal requirements [56]. Similarly, a 10-m buffer was applied on each side of the road network, following Decree-Law no. 82/2021, to account for protection needs around transportation infrastructure [57].

2.1.2. Establishment of Expert Panel

As part of the participatory approach, this study identified and mapped key stakeholders operating within the Vale do Sousa region, taking advantage of ongoing interaction with the FIRE-RES project (Innovative technologies and socio-ecological-economic solutions for fire resilient territories in Europe—https://fire-res.eu/about-fire-res/ accessed on 13/08/2024), Community of Wildfire Innovation (CWI).
The latter brings together a wide range of people and organizations (e.g., NIFP municipalities, NGO’s, the forest industry, Forest Service, Civil Protection Agency) [58], from which this research pooled a stakeholder panel that included representatives from the Institute for Nature Conservation and Forests (Instituto da Conservação da Natureza e das Florestas, ICNF), municipalities such as Castelo de Paiva and Paredes, the Vale do Sousa Forest Association, which includes two brigades of firefight sappers (Associação Florestal do Vale do Sousa, AFVS), the Intermunicipal Community of Tâmega and Sousa (Comunidade Intermunicipal do Tâmega e Sousa), Portucalea (Associação Florestal do Grande Porto) and the Portuguese National Authority for Emergency and Civil Protection (Autoridade Nacional de Emergência e Proteção Civil, ANEPC), the National Energy Networks (Redes Energéticas Nacionais, REN), CoLAB ForestWise, and the School of Agronomy from the University of Lisbon (Instituto Superior de Agronomia, ISA). This step aimed at involving people and organizations in decision-making processes to build legitimacy and contribute to the acceptance of solutions [59]. Email invitations were sent outlining the study’s goals, their role in the process, and the future activities including an in-person FG session and an online survey for the weighting process of the criteria and sub-criteria.

2.1.3. Definition of Criteria, Sub-Criteria, and Parameters

The primary goal of this step was to refine and validate the preliminary set of criteria and sub-criteria to prioritize the spatial allocation of restoration activities. To achieve this, an interaction with the stakeholders was facilitated by providing the initial guidelines relevant to post-fire conditions, grouped under broader thematic categories. The approach encompassed a focus group (FG) with the expert panel [60]. Building on this interaction, the expert panel also defined the parameters for assessing each criterion and sub-criteria.
Parameters denoted the lower and upper threshold values that determine when a criterion or sub-criterion is assigned higher or lower priority in the restoration prioritization process.
To ensure comparability and integration of the selected criteria, the raw data were standardized by transforming the original values into a common preference scale. This allowed us to align all spatial layers according to their relative importance in the decision-making process. A key issue in MCDA evaluation is the transformation of the original criterion values into a common preference scale, based on the relative desirability or impact of specific parameter values [61].

2.1.4. Participants’ Performance Weighting of the Criteria and Sub-Criteria

For the weighting of criteria and sub-criteria, an online survey was structured in two parts. The first part focused on pairwise comparisons, in which participants evaluated the relative importance of each criterion. In the second part, the participants were asked to express their preferences regarding spatial attribute such as whether to prioritize areas inside or outside the buffer zones of water lines. For the assessment of the consistency of each expert’s judgements in the AHP framework, we used the standard consistency ratio (CR), along with Spearman’s rank correlation and Euclidean distance (ED). The CR values for each participant were calculated (Equation (1)) to assess the internal consistency of their pairwise comparisons. Spearman’s rank correlation was used to measure the alignment between each participant’s ranking and the group consensus, calculated as the geometric mean of individual judgments for each sub-criteria. In contrast, Euclidean distance evaluated the divergence between each participant and all others, penalizing opinions that were farther from the consensus.
To address inconsistencies and enhance consensus among expert judgements, a set of adjusted weights was derived. This adjustment combined the normalized reciprocal values of each participant’s CR with measures of agreement and similarity, specifically Spearman’s rank correlation and Euclidean distance.
w n = 1 C R n i = 1 N 1 C R i
where:
  • w n = weight assigned to participant n ;
  • C R n = consistency ratio of participant n ;
  • N = total number of participants.
The ED measures how far each participant’s opinions are from the others. If a participant deviates from the rest, they obtain a higher distance, meaning that their judgement is less in line with the consensus. The following equation measures the overall distance between the weightings given for each participant and those of all the other participants:
E D i = 1 n 1 n j = 1 , j i m k = 1 w i k w j k 2
where:
  • E D i = Euclidean distance for participant i ;
  • 1 n 1 = normalization factor, making ED values comparable across participants;
  • n = total number of participants;
  • m = total number of criteria;
  • w i k = weight assigned by participant i to criterion k ;
  • w j k = weight assigned by participant j to criterion k ;
  • n j = 1 , j i = summation across all participants j excluding i (to compare participant i with each of the other participants);
  • m k = 1 = summation across all criteria.
To check how much each expert agreed with the group, the Spearman’s rank correlation was used. This method compared the order (ranking) of weights each participant gave to the criteria and sub-criteria with the overall group’s ranking, based on the mean of all responses. A higher Spearman value means that the expert’s answers were more in line with the group. The equation is structured as follows:
ρ = 1 6 Σ d i 2 / n ( n 2 1 )
where:
  • ρ = Spearman rank correlation coefficient;
  • d i = difference between the ranks for each pair of observations (participant rank vs. average rank);
  • n = total number of criteria being ranked;
  • Σ d i 2 = sum of the squared differences between the ranks.

2.1.5. Hierarchical Decision Model and the Prioritization Map for Restoration

The working environment from ArcMap software (version 10.2.2) allowed us to collect and process the spatial data as well as the arrangements regarding the resolution and coordinate system. The CDP model was used to structure the problem into a hierarchical model, defining the objective, criteria, sub-criteria, and participant’s averaged weights to reflect the group’s preference on how to define restoration prioritization areas. This model was processed by the EMDS system (version 9) embedded in ArcGIS Pro (version 3.4.0) to generate individual priority maps for each main group criteria and a final composite map.
To facilitate interpretation of the main criteria maps for ‘Soil Erosion’ (SE), ‘Natural Recovery Capacity of the Vegetation’ (NRCV), and ‘Social Protection’ (SP), we used a classification method based on equal intervals, dividing the standardized values into five categories: ‘Very low’, ‘Low ’, ‘Medium’, ‘High’, and ‘Very high’. Each class had an identical range of values, allowing for straightforward and uniform interpretation across the study area [62].
The final map of restoration priorities was generated by integrating the outputs of the three main criteria maps into five categories. These maps, each representing performance across the landscape, were combined using their respective weights derived from the AHP process. For the visualization of the prioritization areas, the natural breaks (Jenks) algorithm for classification was used, which optimizes the clustering of similar values while maximizing the distinctions between categories.

3. Results

3.1. Characterization of 2017 EWE and Pre-Selection of Criteria and Sub-Criteria

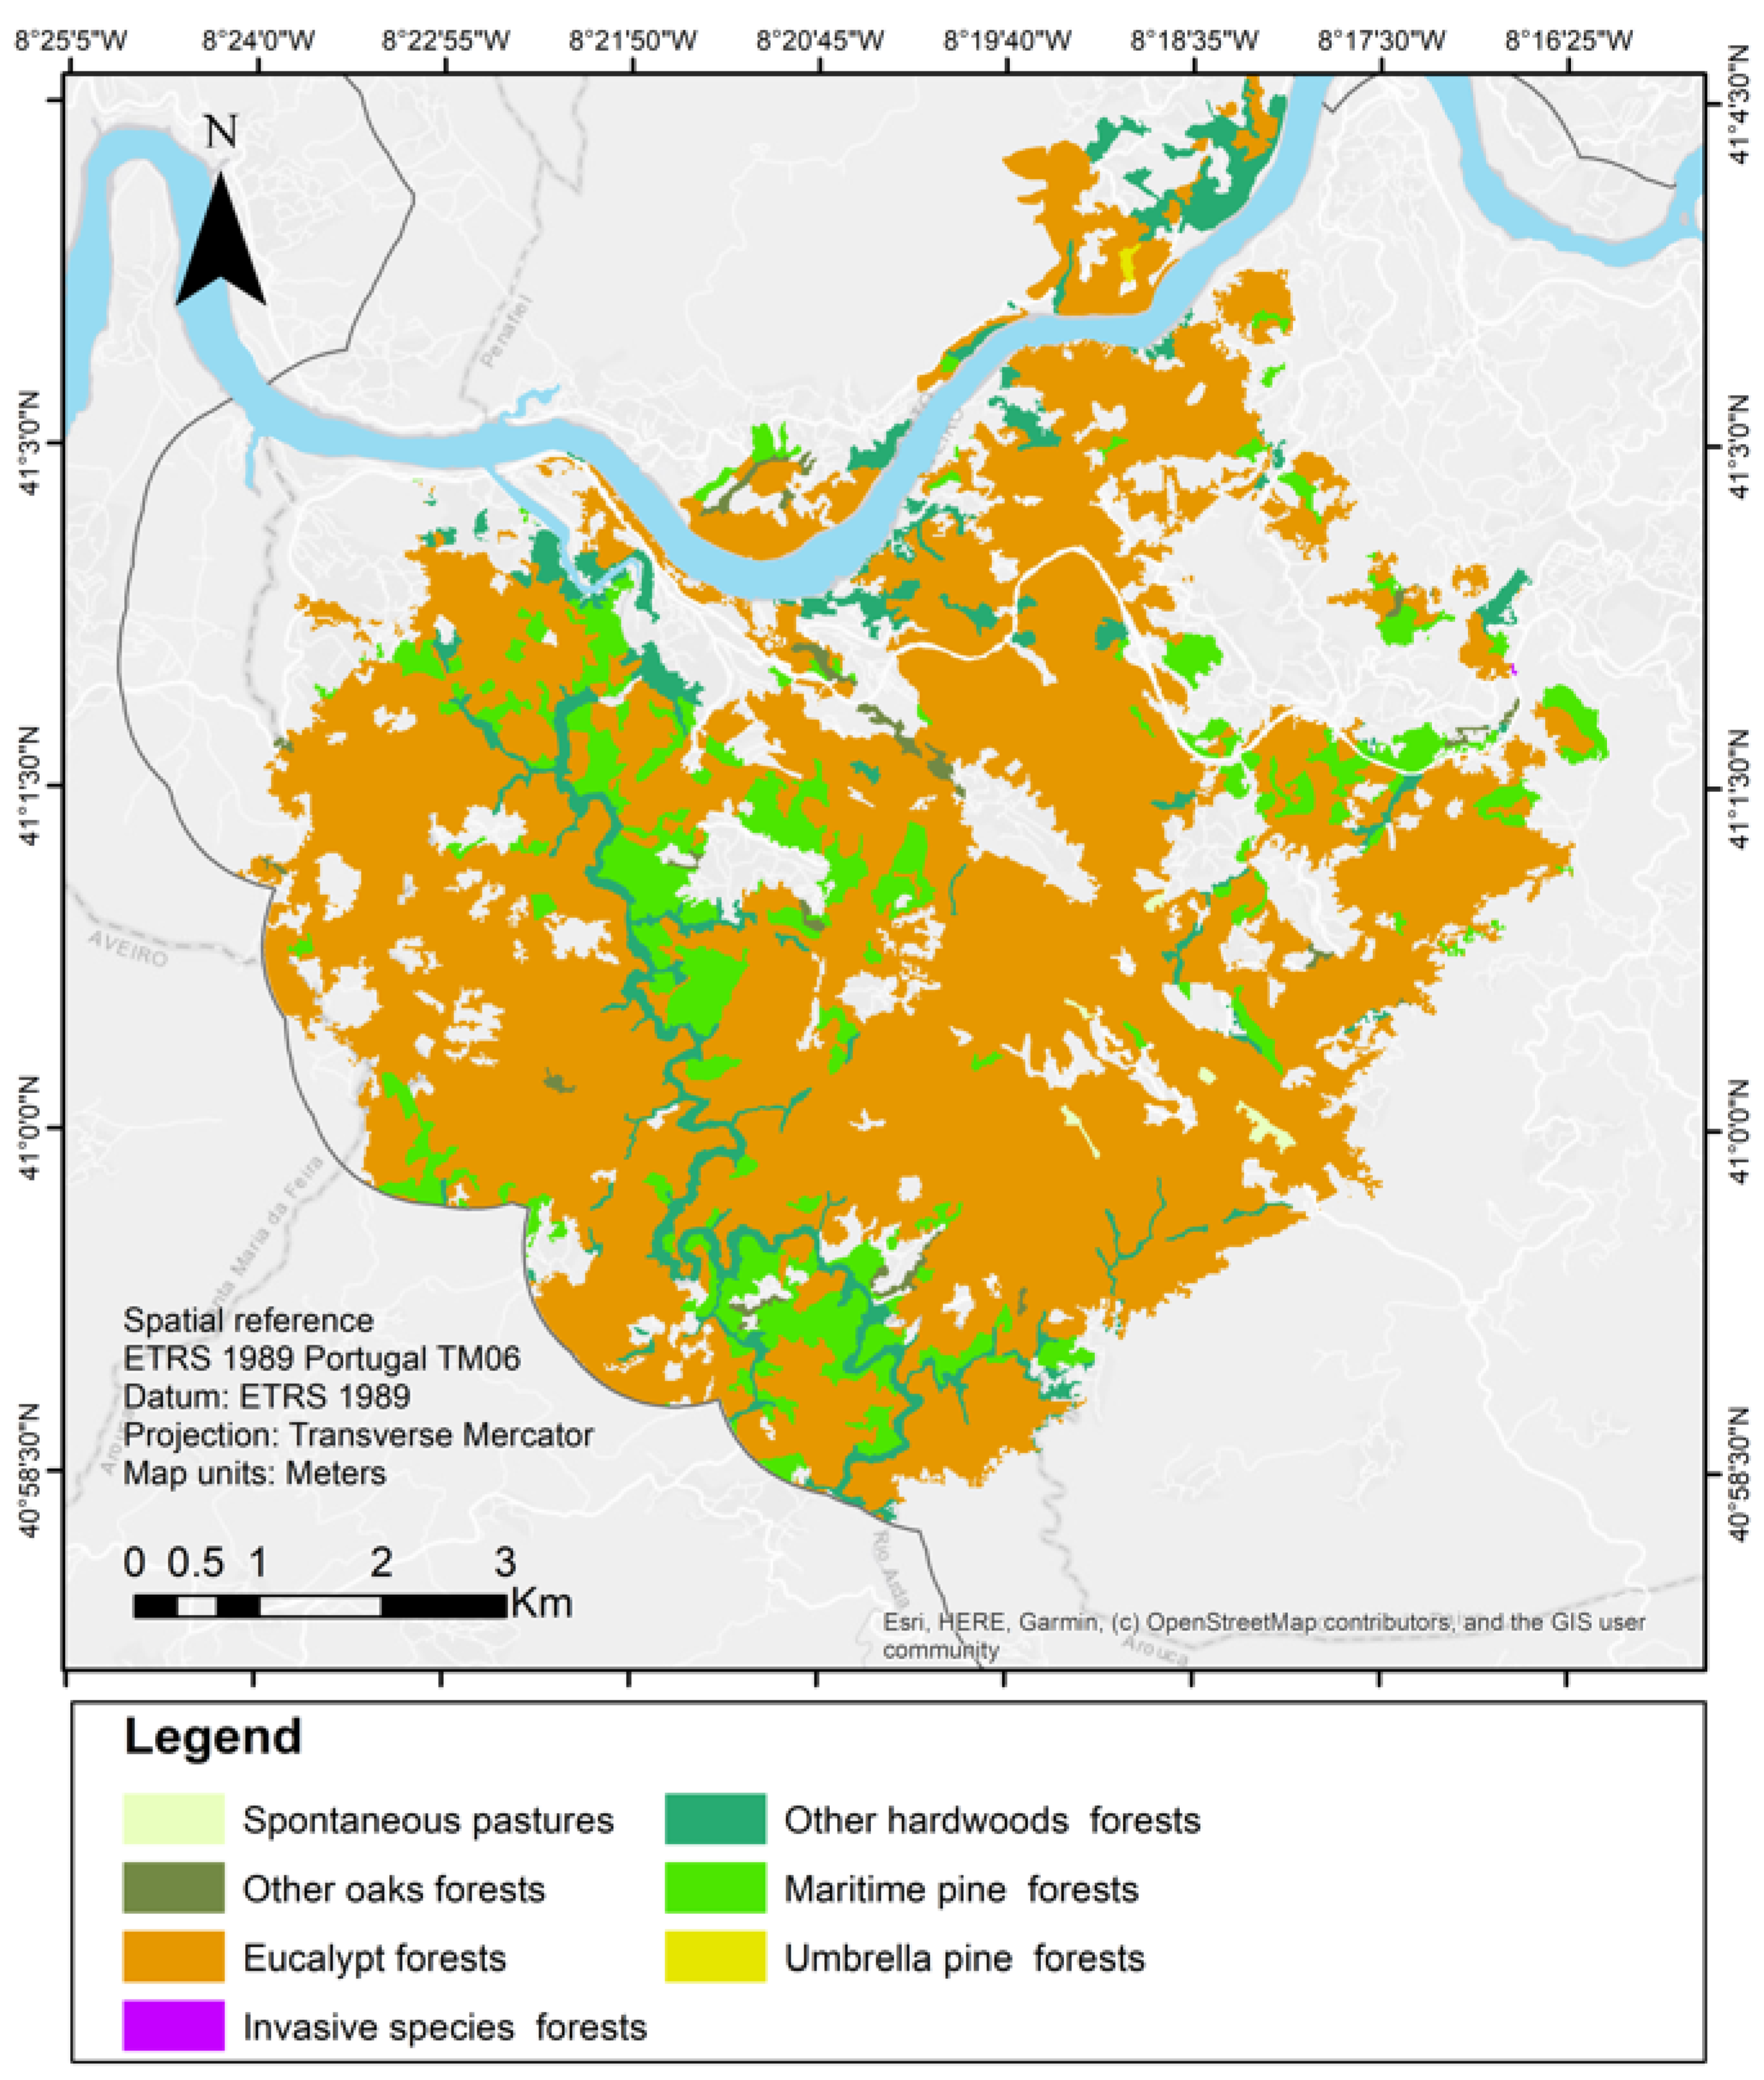
Due to its continuous spatial extent and the severity of its impact, which overwhelmed the local control and suppression capacities, a single and continuous fire perimeter from 2017 was selected (Figure 3). It affected approximately 5755 ha, and eucalypt forests extended over 4226 ha (80.45%), while maritime pine forests areas ranked second (580.89 ha, 11.06%). The perimeter included other hardwood forests areas (386.44 ha, 7.36%), other oak forests (0.85%), spontaneous pastures (0.24%), umbrella pine forests (0.05%), and invasive species (0.23%) areas.
The preliminary set included three criteria—‘Soil Erosion’ (SE), the ‘Natural Recovery Capacity of the Vegetation’ (NRCV), and ‘Social Protection’ (SP) (Table 1)—and six sub-criteria (Table 1).

3.2. Finalized Criteria, Sub-Criteria, and Parameters for Prioritization

Three main criteria were kept for the analysis, while a total of 10 sub-criterions were selected to reflect the key ecological and social factors influencing the assignment of post-fire restoration priority (Table 2). The criteria ‘Soil Erosion’ (SE) contained six sub-criterions, with the inclusion of ‘Presence of Water Lines’. The criteria ‘Natural Recovery Capacity of the Vegetation’ (NRCV) included two sub criterions, and ‘Social Areas’ was changed to ‘Social Protection’ (SP), and two sub-criterions were added according to the participants’ input during the session.
The criteria of SE included six sub-criteria: the K factor (soil erodibility), L factor and S factor (topography), C factor (vegetation cover), Fire Severity, and Presence of Water Lines. The fire severity was found in two main criteria, as it influences both the SE and NRCV. Stakeholders agreed to include the ‘Presence of Water Lines’ under the SE criteria. The goal of the NRCV is to assess the vegetation’s ability to regenerate after a wildfire, considering the fire severity patterns. The two sub-criterions were the ‘Natural Recovery Potential of Species’ (NRPS) and ‘Fire Severity’.
The criteria of ‘Social Protection’ (SP) included two sub-criteria: ‘Presence of Social Areas’ and ‘Presence of Road Network’. According to the stakeholders, the inclusion of both sub-criteria should be included to help guide interventions that directly address risk, particularly erosion and limited vegetation recovery.

3.3. Weighting of Criteria and Sub-Criteria for Restoration Prioritization

Results from the AHP pairwise comparisons revealed that the stakeholders prioritized ecological factors in post-fire restoration planning, with ‘Natural Recovery Capacity of the Vegetation’ receiving the highest weight (39.2%), followed closely by ‘Soil Erosion’. Meanwhile ‘Social Protection’ was weighted lower (22.8%) (Table 3).
At the sub-criteria level, the pairwise comparison results revealed distinct patterns of stakeholder prioritization within each main criterion (Table 4). Under the SE group, the Presence of Water Lines emerged as the most influential sub-criterion (28.1%), followed by Fire Severity (22.9%) and the K factor (17.7%). L and S factors and vegetation cover (C factor) were assigned lower weights. Within the NRCV group, the Natural Recovery Potential of Species (NRPS) received a dominant weight (68.4%), over Fire Severity (31.6%). Finally, for the SP group, the stakeholders assigned more importance to the Presence of Social Areas (56.5%) than to the Presence of Road Network (43.5%).
Final weights were calculated based on the CR, ED, and Spearman’s rank correlation, allowing for a more robust integration of expert input. The average weights varied across participants, ranging from 9.2% to 15.1%. Participant 3 contributed the most to the final aggregated weight, reflecting both high agreement with the other participants and acceptable internal consistency. In contrast, Participant 2 contributed the least (9.2%), likely due to lower consistency or divergence in prioritization patterns (Table 5).
When calculating the weights separately at the main criteria level to reflect the potential differences in participant consistency across the AHP model, ‘Natural Recovery Capacity of the Vegetation’ remained the most prioritized criterion, with a final weight of 41.6% (Table 6). ‘Soil Erosion’ followed closely at 38.3%, while ‘Social Protection’ received the lowest weight at 20.1%. Compared with the earlier aggregated weighting results (Table 3), this disaggregated approach resulted in a slightly higher weight for ‘Natural Recovery Capacity of the Vegetation’ and a modest decrease for SP.
At the sub-criteria level, the final weights showed variation within each main criterion (Table 7). The sub-criterion ‘Presence of Water Lines’ remained the most influential sub-criterion (31.3%), reflecting strong consensus on the role of hydrological features in erosion risk. ‘Fire Severity‘ was also significant (22.3%), while slope-related factors (K, S, L, and C factors) were comparatively less influential, particularly the L factor (5.3%). Within ‘Natural Recovery Capacity of the Vegetation’, the ‘Natural Recovery Potential of Species’ (65.8%) clearly outweighed ‘Fire Severity’ (33.8%), indicating a preference for proactive, species-based restoration capacity over disturbance intensity. For the SP group criteria, the ‘Presence of Social Areas’ was weighted more heavily (55.7%) than the ‘Presence of Road Network’ (44.3%).

3.4. Hierarchical Model

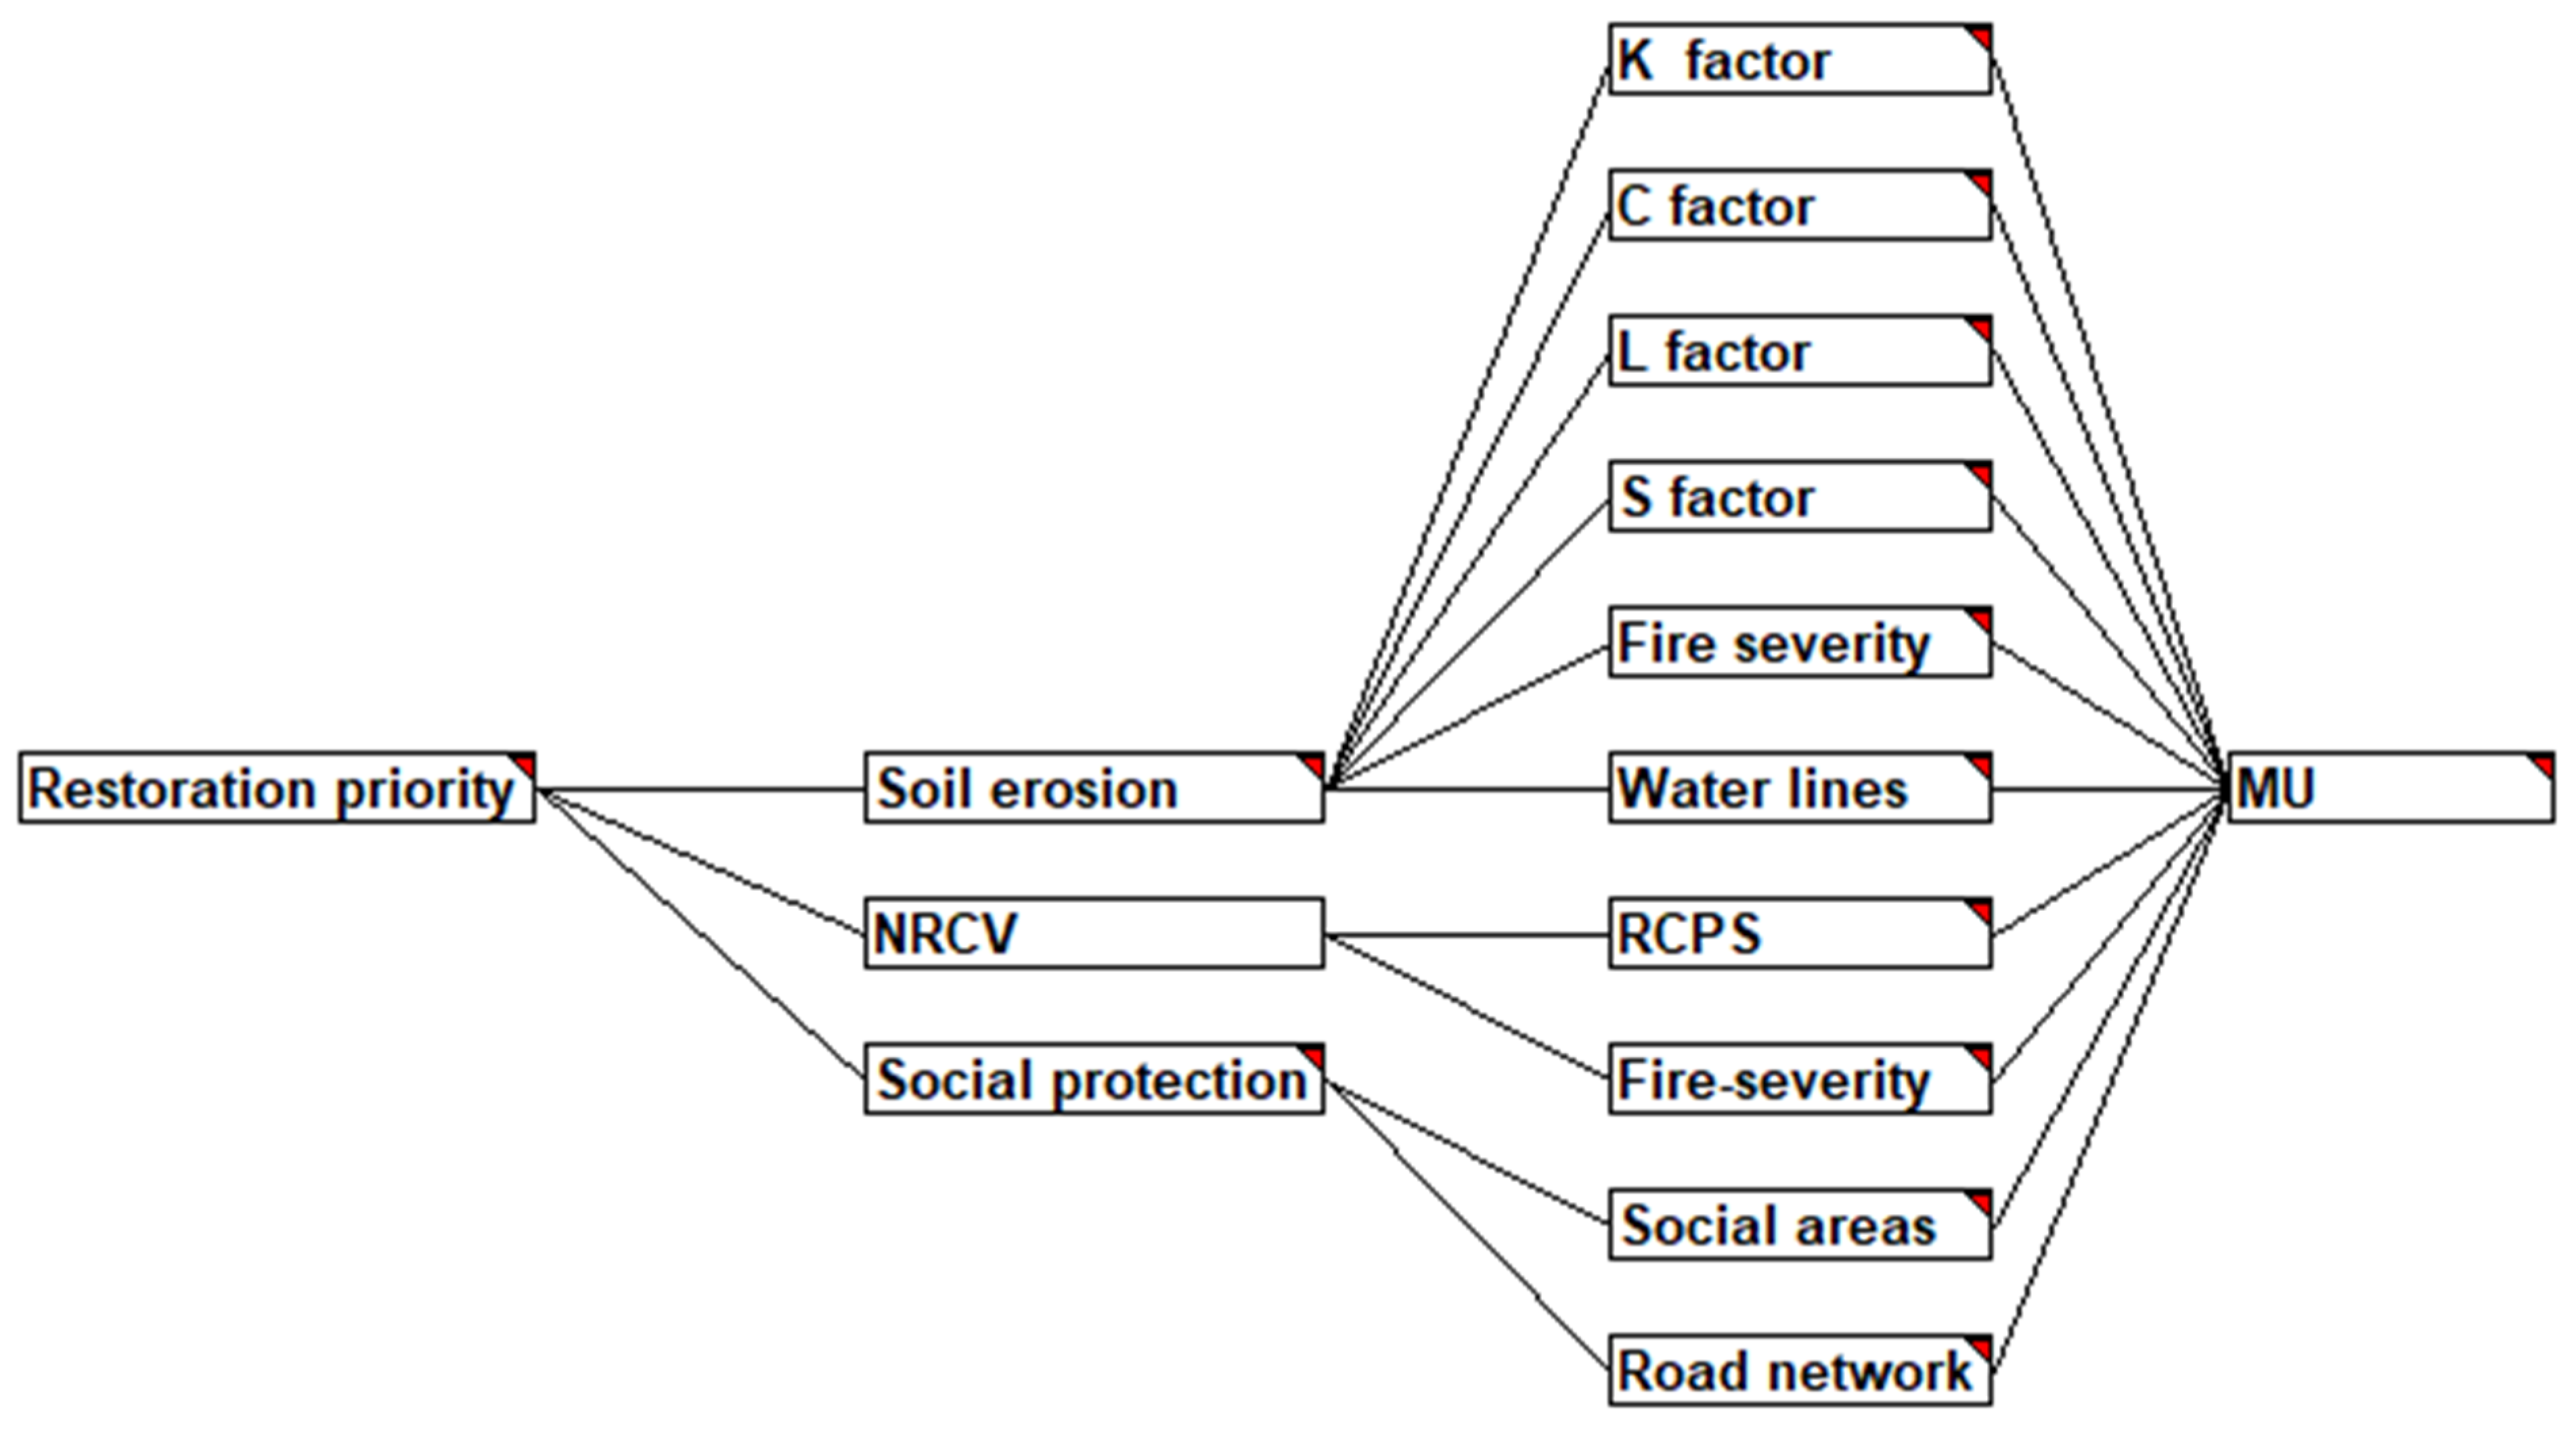
The hierarchical model (Figure 4) reflected the preferences of all participants, adjusted by the weights’ results.
The survey results revealed stakeholder preferences that emphasized the importance of ecological over social criteria, which were incorporated into the final weighting scheme. The model structured the decision-making hierarchy across two levels: the main criteria and the sub-criteria. To integrate expert input, each block was assigned the final weight based on the Spearman’s rank correlation (S), Euclidean distance (ED), and consistency ratio (CR).

3.5. Development of the Restoration Prioritization Map

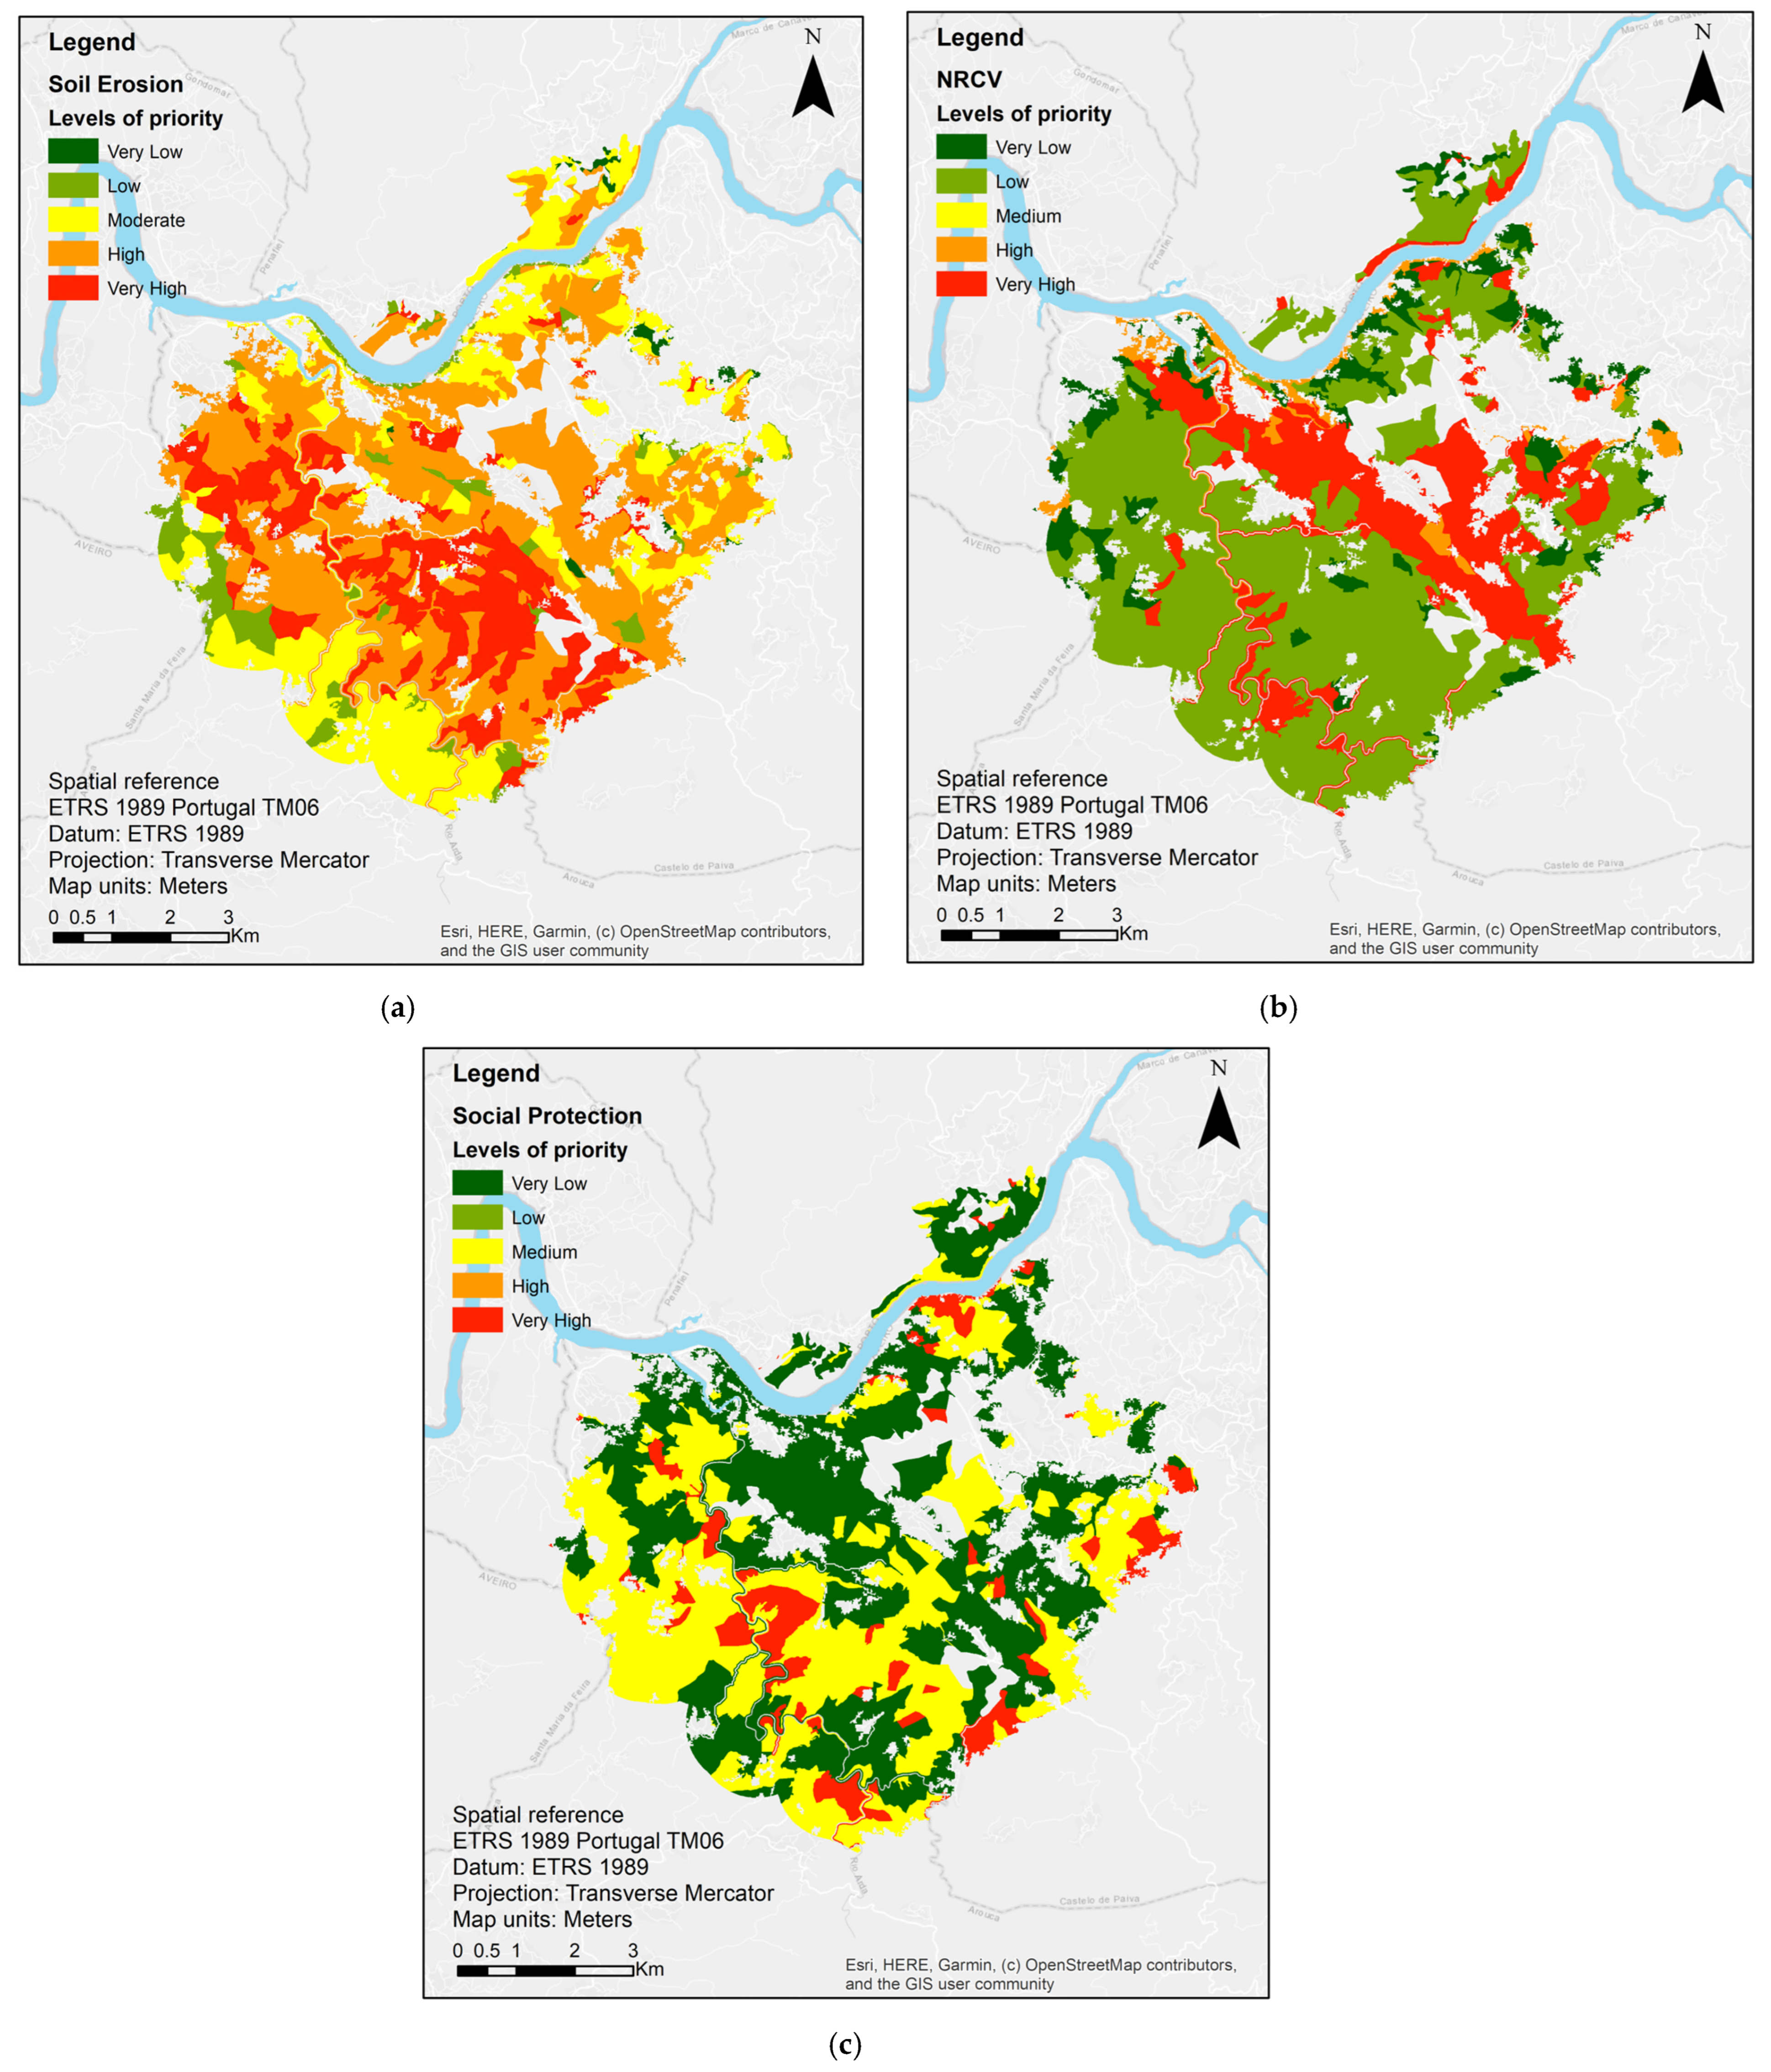
The CDP model, implemented within the EMDS framework in ArcGIS Pro, generated a series of spatial maps that displayed the outcomes of the evaluation process. These maps illustrated how each criterion and sub-criterion performed across the landscape (Figure 5). Each map contains attribute fields representing the calculated priority scores based on the weighted criteria derived from the stakeholders’ input.
The final map of the restoration priorities (Figure 6) resulted from the integration of the three main criteria maps using their respective AHP-derived weights. The composite map revealed spatial patterns in restoration needs, with high-priority areas concentrated primarily along riparian zones. These zones consistently emerged as critical due to their overlap with areas of high soil erosion risk and low natural vegetation recovery capacity of species.
The spatial prioritization results revealed distinct levels of restoration prioritization across the fire perimeter from the combination of the socio-ecological landscape criteria. From this final map of priorities, information regarding the area distribution for each priority class is presented below (Table 8).
At the ‘Very high’ (6.80%, 360.10 ha) priority and ‘High priority’ (21.94%, 1162.19 ha) levels, stakeholders emphasized the need to protect riparian zones, recognizing their ecological importance in the landscape and their role as natural buffers against EWEs; these areas were consistently assigned as medium to high priority levels, particularly where the fire severity values were moderate to high. In addition, these highly prioritized areas included native species stands, such as the non-riparian species like cork oak (Quercus suber) and chestnut (Castanea Sativa), due to their higher conservation value according to the participants’ input.
At the ‘Medium’ priority level (38.12%,2019.46 ha), combinations of lower fire severity with sensitive land cover types, such as non-resprouter dominated forests or slopes near water bodies, also emerged as significant. These zones may not have experienced the most intense burns, but they still exhibit structural vulnerabilities that when coupled with certain topographic or vegetative traits, increase their susceptibility to degradation over time.
At the ‘Low’ (29.66%, 1571.22 ha) and ‘Very Low’ (3.49%, 184.76 ha) prioritization levels, areas with low fire severity, high canopy cover, and minimal slope were located. These areas are more likely to recover naturally due to better ecological conditions and lower exposure to erosion or water-related impacts. These zones, while still within the fire perimeter, presented more favorable conditions for regeneration, with limited immediate risk of erosion. In addition, these areas often overlap with social infrastructure such as settlements and a denser road network. According to the stakeholders, the proximity to human activity implies a higher likelihood of receiving rapid attention during and after wildfire events, whether through firefighting efforts or emergency interventions.

4. Discussion

This study proposed a science-based, post-fire restoration prioritization methodology. The model integrated both ecological and social criteria to reflect the diverse restoration needs of the landscape. Its application enabled the identification of areas where restoration is most urgent. What makes this approach unique is the deliberate inclusion of both ecological and social concerns through a participatory process involving local stakeholders. This integration helps ensure that the prioritization captures the challenges and concerns faced on the affected area, making the framework more relevant and useful for guiding post-fire restoration efforts in practice.
The analysis of the fire perimeter in Vale do Sousa focused on the largest and most continuous fire patch affected by the 2017 wildfire events, providing a relevant spatial context for the prioritization model. This event, part of which has been documented as Portugal’s most catastrophic fire season, exemplifies the characteristics of an EWE. Such events are increasingly frequent worldwide, and wildfires have grown in size and severity, creating an environmental and social crisis with disproportionate impacts on vulnerable communities, public health, and ecological systems [63]. Although the present study prioritized restoration areas within fire perimeters based on current post-fire conditions, we recognize the importance of incorporating future climate projections and considerations of long-term ecosystem resilience.
This framework was designed to be replicable in other fire-prone landscapes. The selection and processing of each criterion were transparently documented, the weighting procedure was conducted using a structured and participatory analytic hierarchy process (AHP), and implementation was carried out using publicly available spatial datasets within a geographic information system (GIS) and EMDS environment. These characteristics make the methodology technically transferable.
The weighting outcomes revealed a strong stakeholder preference for ecological dimensions in post-fire restoration, particularly the natural recovery capacity of the vegetation and soil erosion risk. This prioritization underscores a shared concern with landscape resilience and the biophysical conditions that influence the recovery trajectories. The lower emphasis on social protection suggests that in the Vale do Sousa context, stakeholders viewed ecological stabilization as a prerequisite for securing long-term safety and functionality. Notably the inclusion of fire severity as a transversal criterion reflects its dual role in influencing both erosion potential and vegetation dynamics.
In this study, fire severity was integrated into two separate criteria: ‘Soil Erosion’ and ‘Natural Recovery Capacity of the Vegetation’ to reflect its influence on post-fire landscape processes. While some level of high severity can promote ecological renewal, extensive patches of high severity can lead to regeneration failure and disrupt habitats for species reliant on late-seral conditions [64]. Such post-fire conditions can critically affect the water quality and biodiversity, making these areas essential targets for ecological restoration [65].
The use of CDP and EMDS in this study provided a framework to aggregate individual stakeholder inputs into a single group decision model. These tools facilitated the development of a consensus-based prioritization map by integrating weighted criteria and value functions within a hierarchical structure. Compared with qualitative approaches, such as manual scoring, CDP and EMDS offer greater traceability and the ability to manage criteria relationships systematically.
One of the main limitations of this study was the reliance on available spatial data, which contained the completeness and resolution of certain variables. In particular, the processing of canopy cover and species composition data resulted in the partial loss of spatial information in some areas. This limitation led to a reduction in the total coverage of burned areas included in the final analysis. Nevertheless, despite these data gaps, the framework developed still offers valuable insights into restoration priorities and remains a robust tool for supporting post-fire decision-making.

5. Conclusions

This research presented a spatially explicit MCDA approach, supported by expert knowledge, to identify and prioritize the most and least vulnerable areas for post-fire restoration. By integrating ecological and social criteria into a composite prioritization map, this methodology provides a framework for decision-makers to target interventions where they are most needed. The resulting maps not only distinguish the levels of restoration priority, but also reflect the convergence of multiple risk factors. In doing so, this approach addresses the urgent challenge of allocating limited resources in fire-prone landscapes.
Beyond its application in the study area, this framework can be adapted to other regions facing similar post-fire restoration challenges, offering a flexible tool for landscape-scale planning. Future research could expand on this work by integrating dynamic variables such as projected climate scenarios, long-term vegetation trajectories, and the economic costs of interventions. Additionally, testing the framework through field implementation and collaboration with land managers could enhance its practical relevance and support the design of more resilient restoration strategies. We suggest that future research should aim to integrate these aspects into restoration planning frameworks to support adaptive, robust, and forward-looking strategies.

Author Contributions

Conceptualization, S.M.C., S.R.-F., S.d.F. and L.C.; Methodology, S.M.C., S.R.-F., S.d.F., L.C., J.G.B. and S.M.; Software, S.M.C. and S.R.-F.; Validation, S.M.C., S.M. and S.R.-F.; Formal analysis, S.M.C.; Investigation, S.M.C.; Resources, S.M.C. and S.M.; Data curation, S.M. and S.R.-F.; Writing—original draft preparation, S.M.C. and A.M.M.C.; Writing—review and editing, S.d.F., S.M., A.M.M.C., J.G.B. and S.R.-F.; Visualization, S.M.C.; Supervision, J.G.B.; Project administration, S.M.C. and J.G.B. All authors have read and agreed to the published version of the manuscript.

Funding

This research received funding from H2020-LCGD-2020-3/101037419, titled “FIRE-RES—Innovative technologies and socio-ecological economic solutions for fire resilient territories in Europe,” funded by the EU Horizon 2020—Research and Innovation Framework Program. This work was also funded by the Forest Research Center (UIDB/00239: Centro de Estudos Florestais and by Associate Laboratory TERRA. The Portuguese Science Foundation (FCT) also funded this research in the scope of Norma Transitória—DL57/2016/CP1382/CT15.

Data Availability Statement

Data are contained within the article.

Acknowledgments

This work was supported by FCT—Fundação para a Ciência e Tecnologia, I.P. through project reference UID/00239: Centro de Estudos Florestais. We would like to express our sincere gratitude to the Associação Florestal de Vale do Sousa (AFVS) for their valuable support throughout this study, especially to Sandra Pinto for her coordination efforts with the Instituto Superior de Agronomia (ISA) and for facilitating crucial contacts with local stakeholders. We thank the researchers from the Department of Agricultural and Forest Sciences and Engineering at the University of Lleida, especially to Pere Gelabert, for generating the fire severity satellite data used in this study. We gratefully acknowledge Keith Reynolds (retired from the USDA Pacific Northwest Research Station) for the development of the Ecosystem Management Decision Support (EMDS) system and for making it freely available, which was instrumental in supporting the decision analysis framework used in this study. We also acknowledge InfoHarvest as the provider of CDP, especially to Philip Murphy, who is from this software. Finally, we extend our sincere gratitude to all those who supported and contributed to this research. We also thank Paulo Firmino, who works at ForChange, for his thorough review and valuable input.

Conflicts of Interest

The authors declare no conflicts of interest.

Abbreviations

The following abbreviations are used in this manuscript:
EWEsExtreme wildfire events
MCDAMulti-criteria decision analysis
AHPAnalytic hierarchy process
GISGeographic information system
RUSLERevised Universal Soil Loss Equation
ZIFZona de Intervenção Florestal
CWICommunity of Wildfire Innovation
DGTDireção-Geral do Território
dNBRDifferenced normalized burn ratio
CRConsistency ratio
EMDSEcosystem Decision Support System
CDPCriterium Decision Plus
AFVSAssociação Florestal do Vale do Sousa
ICNFInstituto da Conservação da Natureza e das Florestas
FGFocus group
EDEuclidean distance

References

  1. Gill, M.; Stephens, S.L.; Cary, G.J. The Worldwide “Wildfire” Problem. Ecol. Appl. 2013, 23, 438–454. [Google Scholar] [CrossRef]
  2. Tedim, F.; Leone, V.; Amraoui, M.; Bouillon, C.; Coughlan, M.; Delogu, G.; Fernandes, P.; Ferreira, C.; McCaffrey, S.; McGee, T.; et al. Defining Extreme Wildfire Events: Difficulties, Challenges, and Impacts. Fire 2018, 1, 9. [Google Scholar] [CrossRef]
  3. Tedim, F.; Leone, V.; Coughlan, M.; Bouillon, C.; Xanthopoulos, G.; Royé, D.; Correia, F.J.M.; Ferreira, C. Extreme Wildfire Events: The Definition. In Extreme Wildfire Events and Disasters: Root Causes and New Management Strategies; Tedim, F., Leone, V., McGee, T.K., Eds.; Elsevier: Amsterdam, The Netherlands, 2019; pp. 3–29. [Google Scholar] [CrossRef]
  4. Beighley, M.; Hyde, A.C. Portugal Wildfire Management in a New Era: Assessing Fire Risks, Resources and Reforms. Indep. Rep. 2018, 9, 52. Available online: https://www.isa.ulisboa.pt/files/cef/pub/articles/2018-04/2018_Portugal_Wildfire_Management_in_a_New_Era_Engish.pdf (accessed on 3 November 2024).
  5. Pereira, M.G.; Trigo, R.M.; Da Camara, C.C.; Pereira, J.M.C.; Leite, S.M. Synoptic patterns associated with large summer forest fires in Portugal. Agric. For. Meteorol. 2005, 129, 11–25. [Google Scholar] [CrossRef]
  6. Nunes, L.J.R.; Meireles, C.I.R.; Gomes, C.J.P.; Ribeiro, N.M.C.A. Historical Development of the Portuguese Forest: The Introduction of Invasive Species. Forests 2019, 10, 974. [Google Scholar] [CrossRef]
  7. Ager, A.A.; Vaillant, N.M.; McMahan, A. Restoration of fire in managed forests: A model to prioritize landscapes and analyze tradeoffs. Ecosphere 2013, 4, 1–19. [Google Scholar] [CrossRef]
  8. Mansourian, S.; Stanturf, J.A.; Derkyi, M.A.A.; Engel, V.L. Forest Landscape Restoration: Increasing the positive impacts of forest restoration or simply the area under tree cover? Restor. Ecol. 2017, 25, 178–183. [Google Scholar] [CrossRef]
  9. Derak, M.; Silva, E.; Climent-Gil, E.; Bonet, A.; López, G.; Cortina-Segarra, J. Multicriteria analysis of critical areas for restoration in a semiarid landscape: A comparison between stakeholder groups. J. Environ. Manag. 2023, 336, 117545. [Google Scholar] [CrossRef]
  10. Malczewski, J.; Rinner, C. Introduction to GIS-MCDA. In Multicriteria Decision Analysis in Geographic Information Science; Springer: Berlin/Heidelberg, Germany, 2015; pp. 23–54. [Google Scholar] [CrossRef]
  11. Takam Tiamgne, X.; Kanungwe Kalaba, F.; Raphael Nyirenda, V.; Phiri, D. Modelling areas for sustainable forest management in a mining and human dominated landscape: A Geographical Information System (GIS)-Multi-Criteria Decision Analysis (MCDA) approach. Ann. GIS 2022, 28, 343–357. [Google Scholar] [CrossRef]
  12. Liu, J.; Dietz, T.; Carpenter, S.R.; Folke, C.; Alberti, M.; Redman, C.L.; Schneider, S.H.; Ostrom, E.; Pell, A.N.; Lubchenco, J.; et al. Coupled human and natural systems. AMBIO 2007, 36, 639–649. [Google Scholar] [CrossRef]
  13. Yang, A.; Bellwood-Howard, I.; Lippe, M. Social-ecological systems and forest landscape restoration. In Forest Landscape Restoration: Integrated Approaches to Support Effective Implementation; Mansourian, S., Parrotta, J., Eds.; Earthscan/Routledge: New York, NY, USA, 2018. [Google Scholar] [CrossRef]
  14. Dey, D.C.; Schweitzer, C.J. Restoration for the future: Endpoints, targets, and indicators of progress and success. J. Sustain. For. 2014, 33 (Suppl. 1), S43–S65. [Google Scholar] [CrossRef]
  15. Catry, F.X.; Rego, F.; Moreira, F.; Fernandes, P.M.; Pausas, J.G. Post-fire tree mortality in mixed forests of central Portugal. For. Ecol. Manag. 2010, 260, 1184–1192. [Google Scholar] [CrossRef]
  16. Desmet, P.J.J.; Govers, G. A GIS procedure for automatically calculating the USLE LS factor on topographically complex landscape units. J. Soil Water Conserv. 1996, 51, 427–433. [Google Scholar] [CrossRef]
  17. Renard, K.; Foster, G.; Weesies, G.; McCool, D.; Yoder, D. Predicting Soil Erosion by Water: A Guide to Conservation Planning with the Revised Universal Soil Loss Equation (RUSLE); Agriculture Handbook No.703; USDA: Washington, DC, USA, 1997.
  18. Fernández-García, V.; Miesel, J.; Baeza, M.J.; Marcos, E.; Calvo, L. Wildfire effects on soil properties in fire-prone pine ecosystems: Indicators of burn severity legacy over the medium term after fire. Appl. Soil Ecol. 2019, 135, 147–156. [Google Scholar] [CrossRef]
  19. Gamboa, G.; Pinto-Correia, T.; Ribeiro, P.; Antunes, P. Participatory multi-criteria evaluation of landscape values to inform wildfire management. J. Environ. Manag. 2023, 327, 116762. [Google Scholar] [CrossRef] [PubMed]
  20. Marques, M.; Reynolds, K.M.; Marto, M.; Lakicevic, M.; Caldas, C.; Murphy, P.J.; Borges, J.G. Multicriteria decision analysis and group decision-making to select stand-level forest management models and support landscape-level collaborative planning. Forests 2021, 12, 399. [Google Scholar] [CrossRef]
  21. Store, R.; Kangas, J. Integrating spatial multi-criteria evaluation and expert knowledge for GIS-based habitat suitability modelling. Landsc. Urban Plan. 2001, 55, 79–93. [Google Scholar] [CrossRef]
  22. Malczewski, J. GIS-based multicriteria decision analysis: A survey of the literature. Int. J. Geogr. Inf. Sci. 2006, 20, 703–726. [Google Scholar] [CrossRef]
  23. Cervelli, E.; Pindozzi, S.; Allevato, E.; Saulino, L.; Silvestro, R.; Scotto di Perta, E.; Saracino, A. Landscape planning integrated approaches to support post-wildfire restoration in natural protected areas: The Vesuvius National Park case study. Land 2022, 11, 1024. [Google Scholar] [CrossRef]
  24. Bastos, A.; Gouveia, C.M.; DaCamara, C.C.; Trigo, R.M. Modelling post-fire vegetation recovery in Portugal. Biogeosciences 2011, 8, 3593–3607. [Google Scholar] [CrossRef]
  25. Reynolds, K.M.; Hessburg, P.F.; Keane, R.E.; Menakis, J.P. National fuel treatment budgeting in US federal agencies: Capturing opportunities for transparent decision-making. For. Ecol. Manag. 2009, 258, 2373–2381. [Google Scholar] [CrossRef]
  26. Reynolds, K.M.; Hessburg, P.F. An overview of the ecosystem management decision-support system. In Making Transparent Environmental Management Decisions: Applications of the Ecosystem Management Decision Support System; Springer: Berlin, Germany, 2014; pp. 3–22. [Google Scholar] [CrossRef]
  27. Krsnik, G.; Olivé, E.B.; Nicolau, M.P.; Larrañaga, A.; Terés, J.Á.; Garcia-Gonzalo, J.; Olabarria, J.R.G. Spatial multi-criteria analysis for prioritising forest management zones to prevent large forest fires in Catalonia (NE Spain). Environ. Chall. 2024, 15, 100959. [Google Scholar] [CrossRef]
  28. Rodríguez-Fernández, S.; Murphy, P.J.; Reynolds, K.M.; Poudel, S.; Borges, J.G.; González-Olabarria, J.R. Participatory multi-criteria decision analysis to prioritise management areas that help suppress wildfires. Front. For. Glob. Change-For. Manag. 2025; submitted. [Google Scholar]
  29. Ananda, J.; Herath, G. The use of analytic hierarchy process to incorporate stakeholder preferences into regional forest planning. For. Policy Econ. 2003, 5, 13–26. [Google Scholar] [CrossRef]
  30. Kwatra, S.; Kumar, A.; Sharma, S.; Sharma, P. Stakeholder participation in prioritizing sustainability issues at regional level using analytic hierarchy process (AHP) technique: A case study of Goa, India. Environ. Sustain. Indic. 2021, 11, 100116. [Google Scholar] [CrossRef]
  31. Kangas, J.; Kangas, A. Multiple criteria decision support in forest management—The approach, methods applied, and experiences gained. For. Ecol. Manag. 2005, 207, 133–143. [Google Scholar] [CrossRef]
  32. Saaty, T.L.; Vargas, L.G. Models, Methods, Concepts & Applications of the Analytic Hierarchy Process, 2nd ed.; Springer: New York, NY, USA, 2012; Volume 175. [Google Scholar] [CrossRef]
  33. Saaty, T. Competitive priorities and knowledge management: An empirical investigation of manufacturing companies in UAE. J. Manuf. Technol. Manag. 2008, 26, 791–806. [Google Scholar] [CrossRef]
  34. Srđević, B.; Suvočarev, K.; Srđević, Z. AHP grupno odlučivanje bez konsenzusa: Primer planiranja segmentacije mokrog polja. Vodoprivreda 2008, 40, 51–58. [Google Scholar]
  35. IUSS Working Group WRB. World Reference Base for Soil Resources 2014, Updated 2015: International Soil Classification System for Naming Soils and Creating Legends for Soil Maps; FAO: Rome, Italy, 2015. [Google Scholar]
  36. Zeferino, J.A. Optimizing the location of aerial resources to combat wildfires: A case study of Portugal. Nat. Hazards 2020, 100, 1195–1213. [Google Scholar] [CrossRef]
  37. de Frutos, S.; Casados, S.; Samblàs, E.; Gelabert, P.; Vilà-Vilardell, L.; Balguerías, E.; Arencibia, L.F.; Grillo, F.; Piqué, M.; Borges, J.; et al. FIRE-RES Project. D2.7 IA Brief 2.6 Designing Post-Fire Restoration Strategies, Zenodo. 2025. Available online: https://fire-res.eu/wp-content/uploads/2025/06/D2.7_FIRE-RES_Post-fire-restoration-strategies.pdf (accessed on 20 April 2025).
  38. Comissão Municipal de Defesa da Floresta. Plano Municipal de Defesa Da Floresta Contra Incêndios. 2015, pp. 1–43. Available online: https://www.cm-arouca.pt/municipio/areas-de-atuacao/floresta/plano-municipal-de-defesa-da-floresta-contra-incendios/ (accessed on 10 February 2024).
  39. Comissão Municipal de Defesa da Floresta. Plano Municipal de Defesa da Floresta Contra Incêndios 2021–2030, Caderno II: Plano de Ação. 2019, pp. 1–81. Available online: https://fogos.icnf.pt/pmdfci/18_Viseu/1808/3G/Caderno_II/PMDFCI_1808_Mortagua_CadernoII.pdf (accessed on 14 May 2025).
  40. Direcção Regional de Agricultura de entre Douro e Minho. Carta de Solos e Carta de Aptidão da Terra para a Agricultura (1:25,000) em Entre Douro e Minho. 1999. Available online: https://snisolos.dgadr.gov.pt/downloads (accessed on 23 September 2024).
  41. Panagos, P.; Meusburger, K.; Ballabio, C.; Borrelli, P.; Alewell, C. Soil erodibility in Europe: A high-resolution dataset based on LUCAS. Sci. Total Environ. 2014, 479–480, 189–200. [Google Scholar] [CrossRef]
  42. Wischmeier, W.; Johnson, C.; Cross, B. A soil erodibility nomograph for farmland and construction sites. J. Soil Water Conserv. 1971, 26, 189–193. [Google Scholar]
  43. Constantino, A.T.; Coutinho, M.A. A erosão hídrica como factor limitante da aptidão da terra. Aplicação à região de Entre-Douro e Minho. Rev. Ciênc. Agrár. 2001, XXIV, 439–462. [Google Scholar]
  44. Rodrigues, A.R.; Botequim, B.; Tavares, C.; Pécurto, P.; Borges, J.G. Addressing soil protection concerns in forest ecosystem management under climate change. For. Ecosyst. 2020, 7, 36. [Google Scholar] [CrossRef]
  45. Barreiro, S.; Tomé, M. SIMPLOT: Simulating the impacts of fire severity on sustainability of eucalyptus forests in Portugal. Ecol. Indic. 2011, 11, 36–45. [Google Scholar] [CrossRef]
  46. Keeley, J.E. Fire intensity, fire severity and burn severity: A brief review and suggested usage. Int. J. Wildland Fire 2009, 18, 116–126. [Google Scholar] [CrossRef]
  47. Sistema de Monitorização da Ocupação do Solo (SMOS). Carta de Uso e Ocupação do Solo—COS 2018. 2018. Available online: https://snig.dgterritorio.gov.pt (accessed on 14 May 2025).
  48. Gómez-García, E.; Crecente-Campo, F.; Barrio-Anta, M.; Diéguez-Aranda, U. A disaggregated dynamic model for predicting volume, biomass and carbon stocks in even-aged pedunculate oak stands in Galicia (NW Spain). Eur. J. For. Res. 2015, 134, 569–583. [Google Scholar] [CrossRef]
  49. Gómez-García, E.; Diéguez-Aranda, U.; Cunha, M.; Rodríguez-Soalleiro, R. Comparison of harvest-related removal of aboveground biomass, carbon and nutrients in pedunculate oak stands and in fast-growing tree stands in NW Spain. For. Ecol. Manag. 2016, 365, 119–127. [Google Scholar] [CrossRef]
  50. Claessens, H.; Oosterbaan, A.; Savill, P.; Rondeux, J. A review of the characteristics of black alder (Alnus glutinosa (L.) Gaertn.) and their implications for silvicultural practices. Forestry 2010, 83, 163–175. [Google Scholar] [CrossRef]
  51. Rodríguez-González, P.M.; Stella, J.C.; Campelo, F.; Ferreira, M.T.; Albuquerque, A. Subsidy or stress? Tree structure and growth in wetland forests along a hydrological gradient in Southern Europe. For. Ecol. Manag. 2010, 259, 2015–2025. [Google Scholar] [CrossRef]
  52. Patrício, M.D.S.F. Análise da Potencialidade Produtiva do Castanheiro em Portugal; Instituto Politecnico de Braganca: Braganza, Portugal, 2006. [Google Scholar]
  53. Filipa, A.F.L. Implementação de um Modelo de Crescimento Para Castanheiro no Simulador da Floresta StandsSIM.md. Master’s Thesis, University of Lisboa, Lisbon, Portugal, 2019. [Google Scholar]
  54. Casados, S. Restoration After Wildfires in Vale do Sousa, Portugal: A Proposal and Test of a Participatory Multi-Criteria Approach; 2024. Available online: http://hdl.handle.net/10400.5/101452 (accessed on 20 December 2024).
  55. Agência Portuguesa do Ambiente. Sistema Nacional de Informação de Ambiente. 2025. Available online: https://sniamb.apambiente.pt/ (accessed on 3 June 2025).
  56. Decree Law No. 54/2005. Ownership of Water Resources. Available online: https://diariodarepublica.pt/dr/legislacao-consolidada/lei/2005-34543575 (accessed on 1 April 2025).
  57. Decree-Law No. 82/2021, of October 13. Establishing the Integrated Management System for Rural Fires in mainland Portugal (SGIFR). Available online: https://climate-laws.org/documents/decree-law-no-822021-establishing-the-integrated-management-system-for-rural-fires-in-mainland-portugal-sgifr-511b?id=decree-law-no-82-2021-establishing-the-integrated-management-system-for-rural-fires-in-mainland-portugal-sgifr_684c (accessed on 1 November 2024).
  58. FIRE-RES. Technical Periodic Reports. 2025. Available online: https://fire-res.eu/deliverables-and-reports/ (accessed on 14 May 2025).
  59. Luján Soto, R.; Cuéllar Padilla, M.; de Vente, J. Participatory selection of soil quality indicators for monitoring the impacts of regenerative agriculture on ecosystem services. Ecosyst. Serv. 2020, 45, 101157. [Google Scholar] [CrossRef]
  60. Nyumba, T.O.; Wilson, K.; Derrick, C.J.; Mukherjee, N. The use of focus group discussion methodology: Insights from two decades of application in conservation. Methods Ecol. Evol. 2018, 9, 20–32. [Google Scholar] [CrossRef]
  61. Alayan, R.; Rotich, B.; Lakner, Z. A Comprehensive Framework for Forest Restoration after Forest Fires in Theory and Practice: A Systematic Review. Forests 2022, 13, 1354. [Google Scholar] [CrossRef]
  62. Milic, N.; Popovic, B.; Mijalkovic, S.; Marinkovic, D. The Influence of Data Classification Methods on Predictive Accuracy of Kernel Density Estimation Hotspot Maps. Int. Arab J. Inf. Technol. 2019, 16, 1053–1062. [Google Scholar]
  63. D’Evelyn, S.M.; Jung, J.; Alvarado, E.; Baumgartner, J.; Caligiuri, P.; Hagmann, R.K.; Henderson, S.B.; Hessburg, P.F.; Hopkins, S.; Kasner, E.J.; et al. Wildfire, Smoke Exposure, Human Health, and Environmental Justice Need to be Integrated into Forest Restoration and Management. Curr. Environ. Health Rep. 2022, 9, 366–385. [Google Scholar] [CrossRef] [PubMed]
  64. Eyes, S.; Roberts, S.; Johnson, M. California spotted owl (Strix occidentalis occidentalis) habitat use patterns in a burned landscape. Condor 2017, 119, 375–388. [Google Scholar] [CrossRef]
  65. Daufour, S.; Rodríguez, P. Definición del concepto de zona riparia y vegetación de ribera: Principios y recomendaciones. 2019. Available online: https://converges.eu/resources/riparian-zone-riparian-vegetation-definition-principles-and-recommendations/ (accessed on 14 May 2025).
Figure 1. Land use and occupation chart (2018), Vale do Sousa, Portugal. Source: Direção-Geral do Território (DGT).
Forests 16 01090 g001
Figure 2. Forest fire perimeters (2016–2022) in the Vale do Sousa region, Portugal. Source: Instituto da Conservação da Natureza e das Florestas (ICNF).
Forests 16 01090 g002
Figure 3. Land use and occupation affected by the 2017 EWE.
Forests 16 01090 g003
Figure 4. Hierarchical prioritization model in CDP integrating the final participant’s performance and their weights of importance for each block. Note: MU accounts for the management units present in the study area.
Forests 16 01090 g004
Figure 5. Prioritization maps listed as: (a) Soil Erosion (SE), (b) Natural Recovery Capacity of the Vegetation (NRCV), and (c) Social Protection (SE).
Forests 16 01090 g005
Figure 6. Final map showing the restoration priority areas, obtained by combining the three main criteria maps with the corresponding weights.
Forests 16 01090 g006
Table 1. Preliminary set of criteria and sub-criteria.
CriteriaSub-CriteriaUnitsFormat
SESoil erodibility (K factor)Mg∙ha−1 MJ∙mm−1Raster
Slope length and steepness (LS factor)DimensionlessRaster
Vegetation cover (C factor)Dimensionless-
Fire severity (dNBR)DimensionlessRaster
NRCVNatural recovery potential of species after a fireDimensionless-
Fire severity (dNBR)DimensionlessRaster
SAN/AMtsVector
Note: SE refers to ‘Soil Erosion’, NRCV refers to ‘Natural Recovery Capacity of the Vegetation’, and SA to ‘Social Areas’.
Table 2. Incorporation of the new criteria and sub-criteria for restoration prioritization areas.
CriteriaSub-CriteriaUnitsFormatScale/ResolutionParameters (Min. and Max. Values)
SESoil erodibility (K factor)Mg∙ha−1 MJ∙mm−1Raster50 m0.008–0.061
Slope length (L factor)DimensionlessRaster50 m1–12.26
Steepness (S factor)DimensionlessRaster50 m0.02–11.2
Vegetation cover (C factor)DimensionlessVector-0–0.03
Fire severity (dNBR)DimensionlessRaster50 m−365.06–1566.6
Presence of water lines *Mts (buffer on each side of the water line)Vector-0 = > 10, 30; 1 = < 10, 30
NRCVNatural recovery potential of species (NRPS)DimensionlessVector-1–5 (classes)
Fire severity (dNBR)DimensionlessRaster50 m−365.06–1566.6
SPPresence of social areas *Mts (buffer)Vector-0 = < 100; 1 = > 100
Presence of road network *Mts (buffer)Vector-0 = < 10; 1 = > 10
Note: Sub-criterions with asterisks are new additions from the stakeholders’ input. For the presence of water lines, the parameters were 10 m for non-navigable water lines and 30 m for navigable water lines). SE refers to ‘Soil Erosion’, NRCV refers to ‘Natural Recovery Capacity of the Vegetation’, and SP to ‘Social Protection’.
Table 3. Pairwise comparison criteria weights.
Criteria Weights (0–1)
SENRCVSP
0.380 (38%)0.392 (39.2%)0.228 (22.8%)
Note: SE refers to ‘Soil Erosion’, NRCV refers to ‘Natural Recovery Capacity of the Vegetation’, and SP to ‘Social Protection’.
Table 4. Pairwise comparison sub-criteria weights.
CriteriaSub-CriteriaWeights (0–1)
per Criteria Group
SEK factor0.177 (17.7%)
L factor0.069 (6.9%)
S factor0.105 (10.5%)
C factor0.139 (13.9%)
Fire Severity0.229 (22.9%)
Presence of Water Lines0.281 (28.1%)
NRCVNatural Recovery Potential of Species (NRPS)0.684 (68.4%)
Fire Severity0.316 (31.6%)
SPPresence of Social Areas0.565 (56.5%)
Presence of Road Network0.435 (43.5%)
Note: SE refers to ‘Soil Erosion’, NRCV refers to ‘Natural Recovery Capacity of the Vegetation’, and SP to ‘Social Protection’.
Table 5. Final weights of the participants.
P1P2P3P4P5P6P7P8P9
S0.1180.0840.1180.120.1220.120.1200.0690.127
ED0.1000.0720.1140.1330.1350.1130.1250.0710.138
CR0.1370.1210.2220.0790.1030.0720.0660.1410.059
Average0.1180.0920.1510.1110.1200.1020.1049.40.108
(%)11.8%9.2%15.1%11.1%12%10.2%10.4%9.4%10.8%
Note: S refers to ‘Spearman’, ED to ‘Euclidean Distance’, and CR to ‘Consistency Ratio’.
Table 6. Final main criteria weights.
Criteria Weights (0–1)
SENRCVSP
0.383 (38.3%)0.416 (41.6%)0.201 (20.10%)
Note: SE refers to ‘Soil Erosion’, NRCV refers to ‘Natural Recovery Capacity of the Vegetation’, and SP to ‘Social Protection’.
Table 7. Final sub-criteria weights.
CriteriaSub-CriteriaWeights (0–1) per Criteria Group
SEK factor0.173 (17.3%)
L factor0.053 (5.3%)
S factor0.103 (10.3%)
C factor0.135 (13.5%)
Fire Severity0.223 (22.3%)
Presence of Water Lines0.313 (31.3%)
NRCVNatural Recovery Potential of Species (NRPS)0.658 (65.8%)
Fire Severity0.338 (33.8%)
SPPresence of Social Areas0.557 55.7%)
Presence of Road Network0.443 (44.3%)
Note: SE refers to ‘Soil Erosion’, NRCV refers to ‘Natural Recovery Capacity of the Vegetation’, and SP to ‘Social Protection’.
Table 8. Area distribution per priority class.
Priority ClassArea (ha)Area (%)
Very Low184.763.49
Low1571.2229.66
Medium2019.4638.12
High1162.1921.94
Very High360.106.80
Total5297.72100.00
Disclaimer/Publisher’s Note: The statements, opinions and data contained in all publications are solely those of the individual author(s) and contributor(s) and not of MDPI and/or the editor(s). MDPI and/or the editor(s) disclaim responsibility for any injury to people or property resulting from any ideas, methods, instructions or products referred to in the content.

