Temperature Regulates BVOCs-Induced O3 Formation Potential Across Various Vegetation Types in the Sichuan Basin, China
Abstract
1. Introduction
2. Materials and Methods
2.1. Study Area
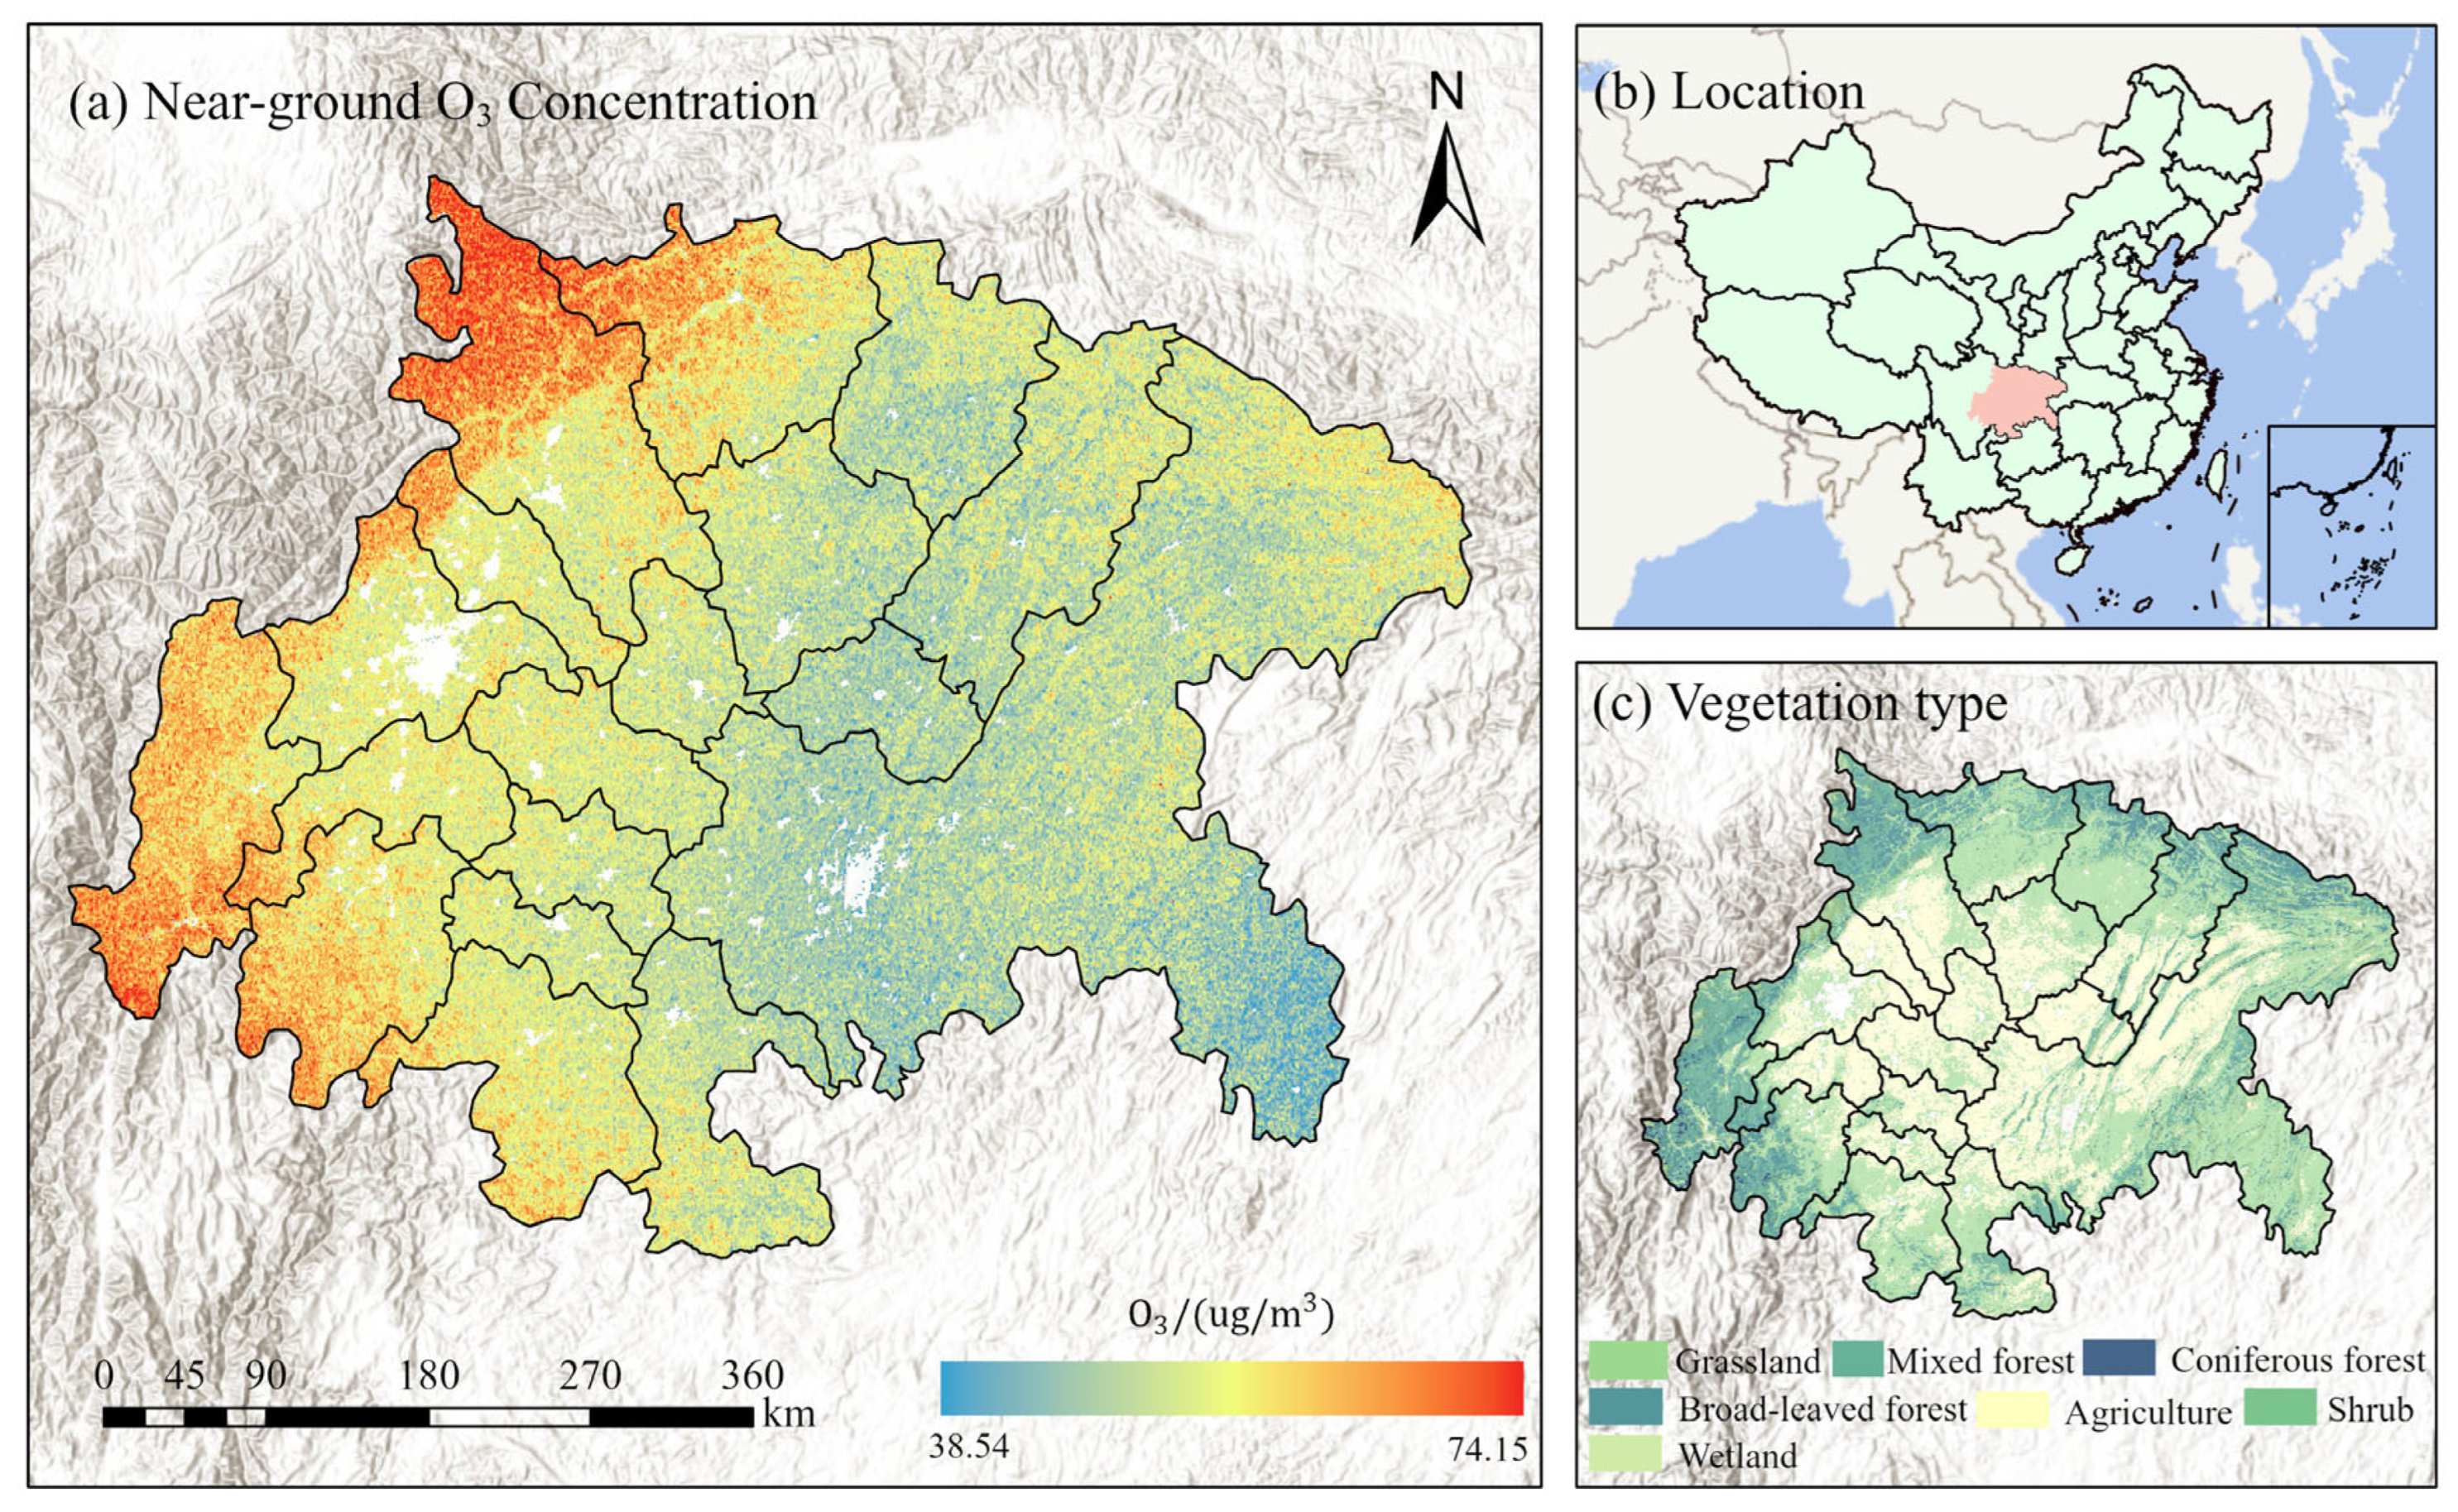
2.2. Data Sources and Processing
2.3. Estimating BVOC Emissions
2.4. Simulated Scenario Setting
2.5. The Impact of BVOC Emissions on the Environment
3. Results and Discussion
3.1. BVOC Emission Characteristics of Different Vegetation Types
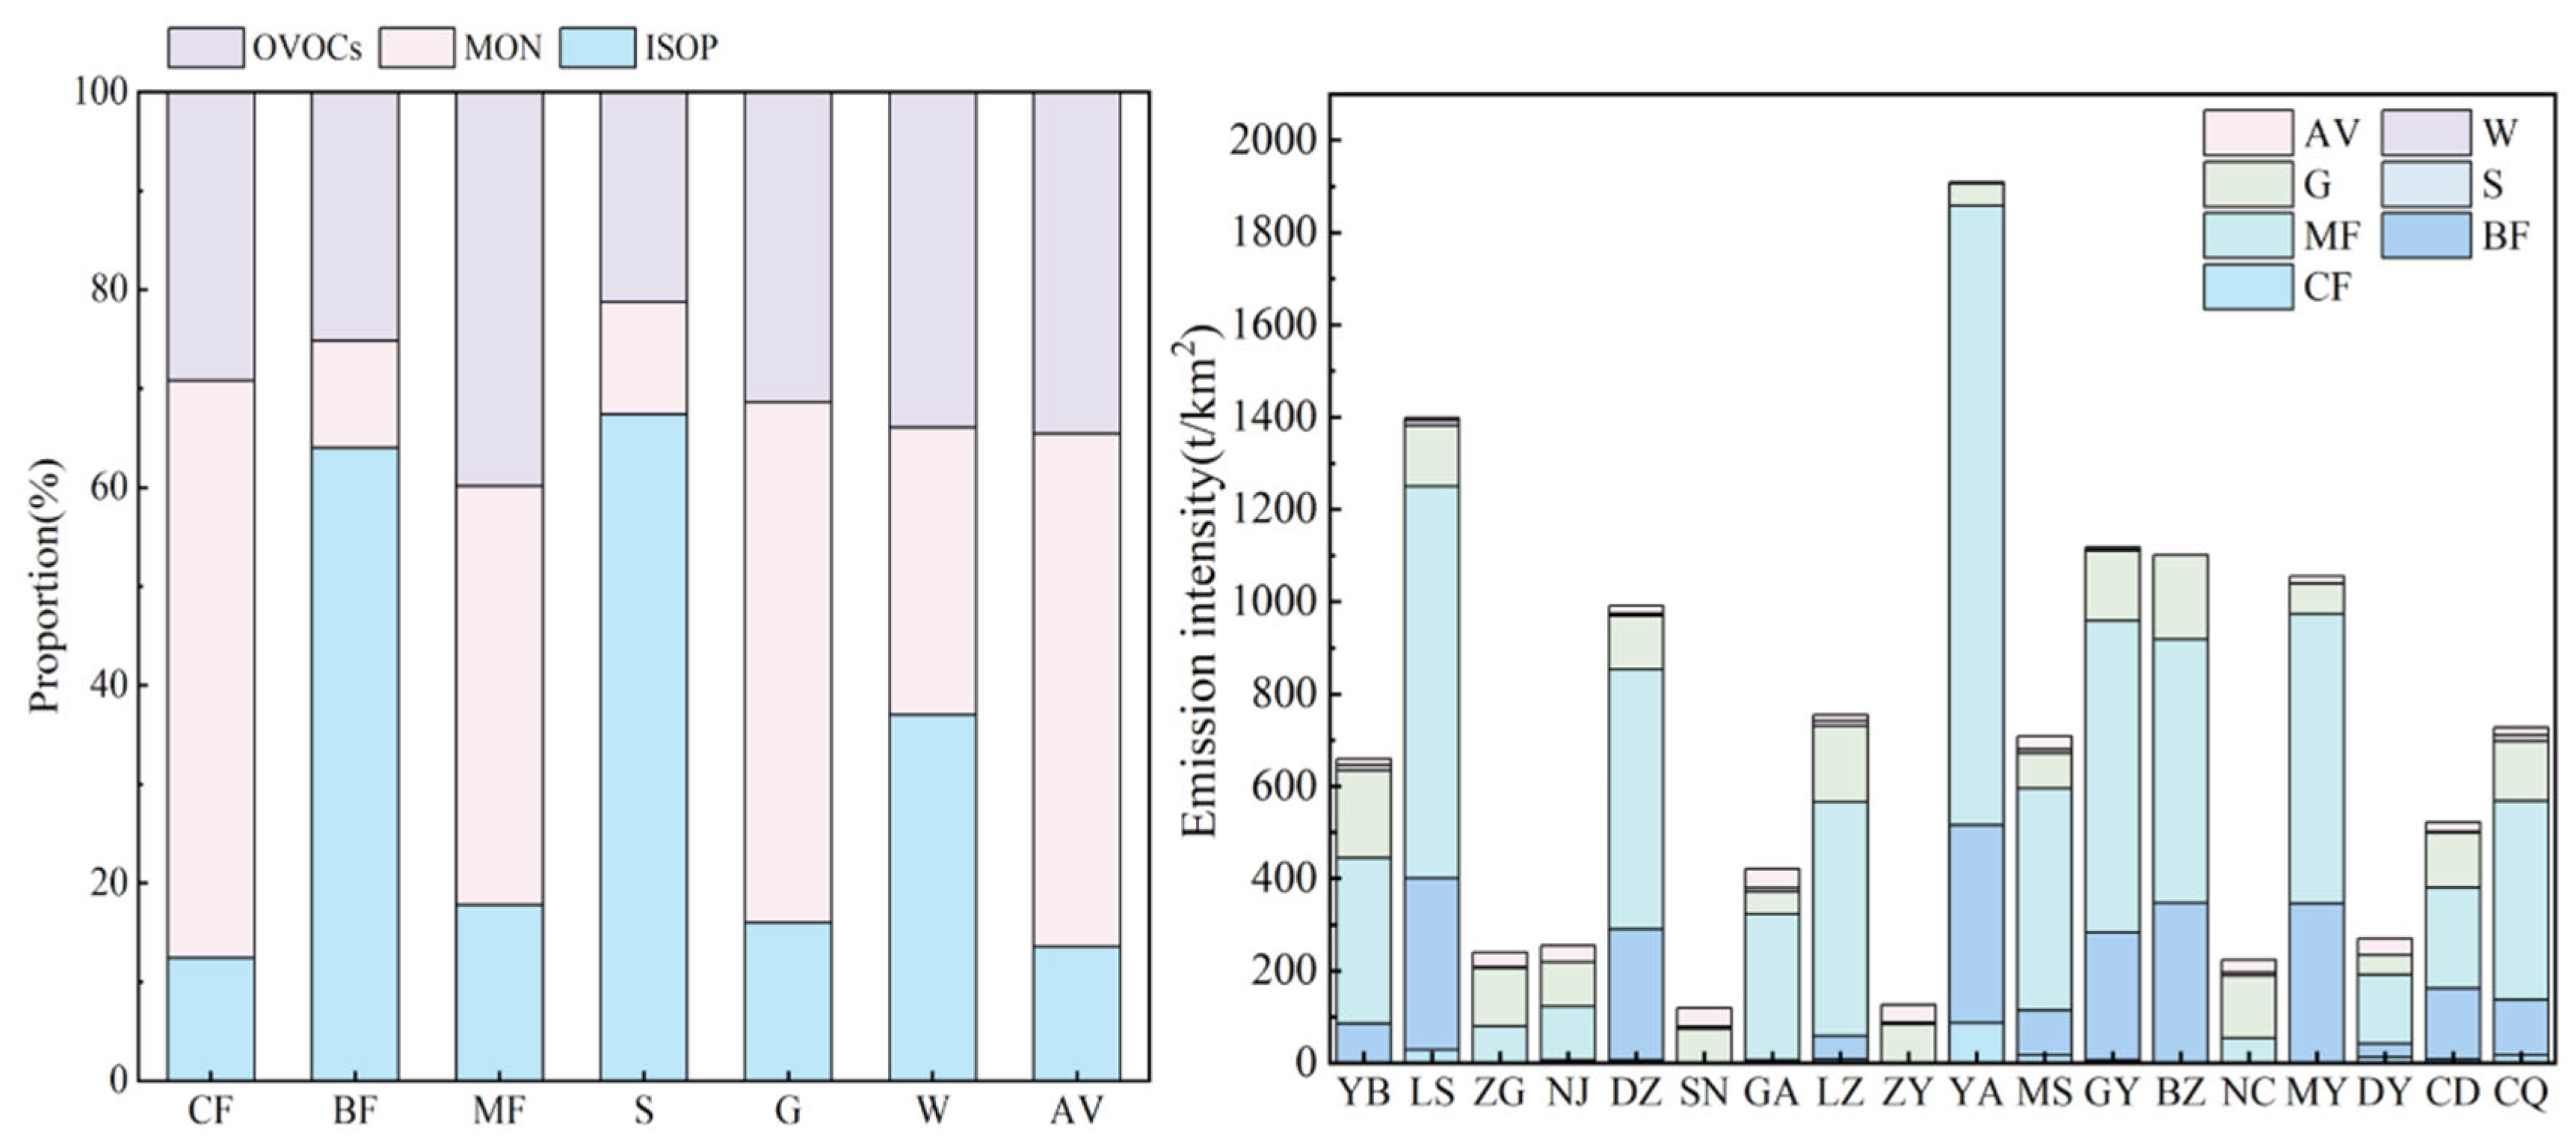
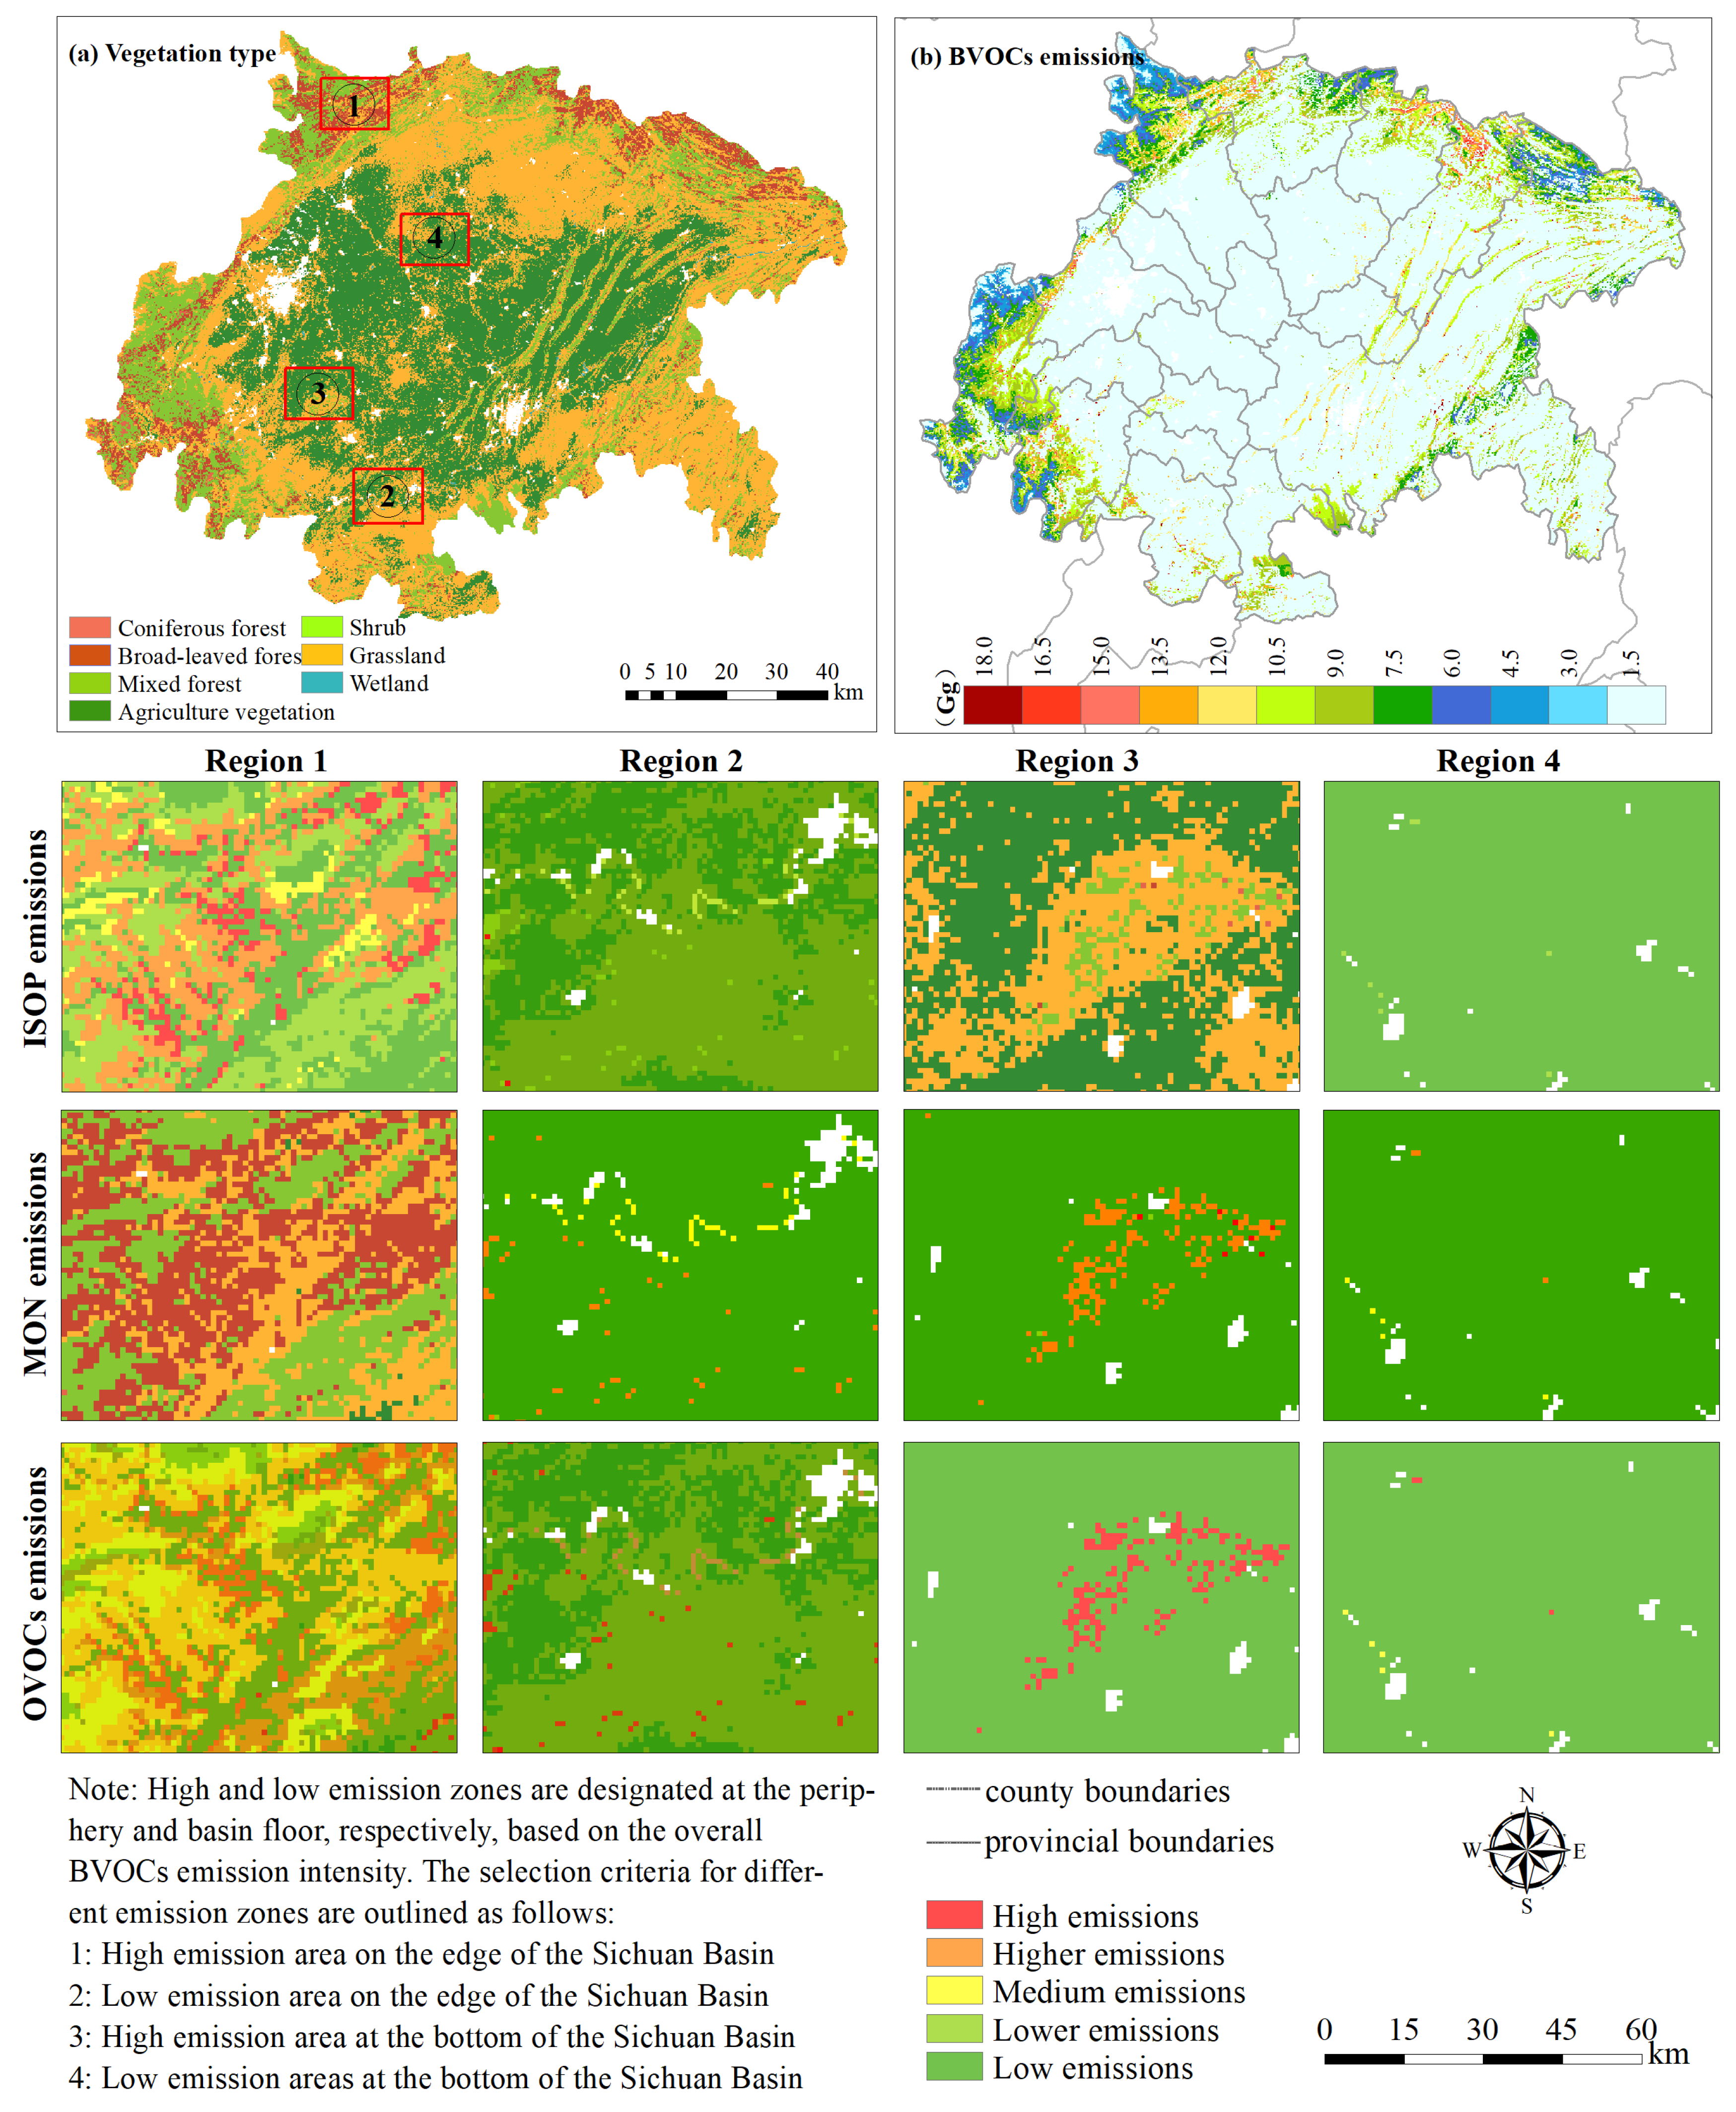
3.1.1. The Role of Different Vegetation BVOC Emissions in the Edge–Center Distribution Pattern
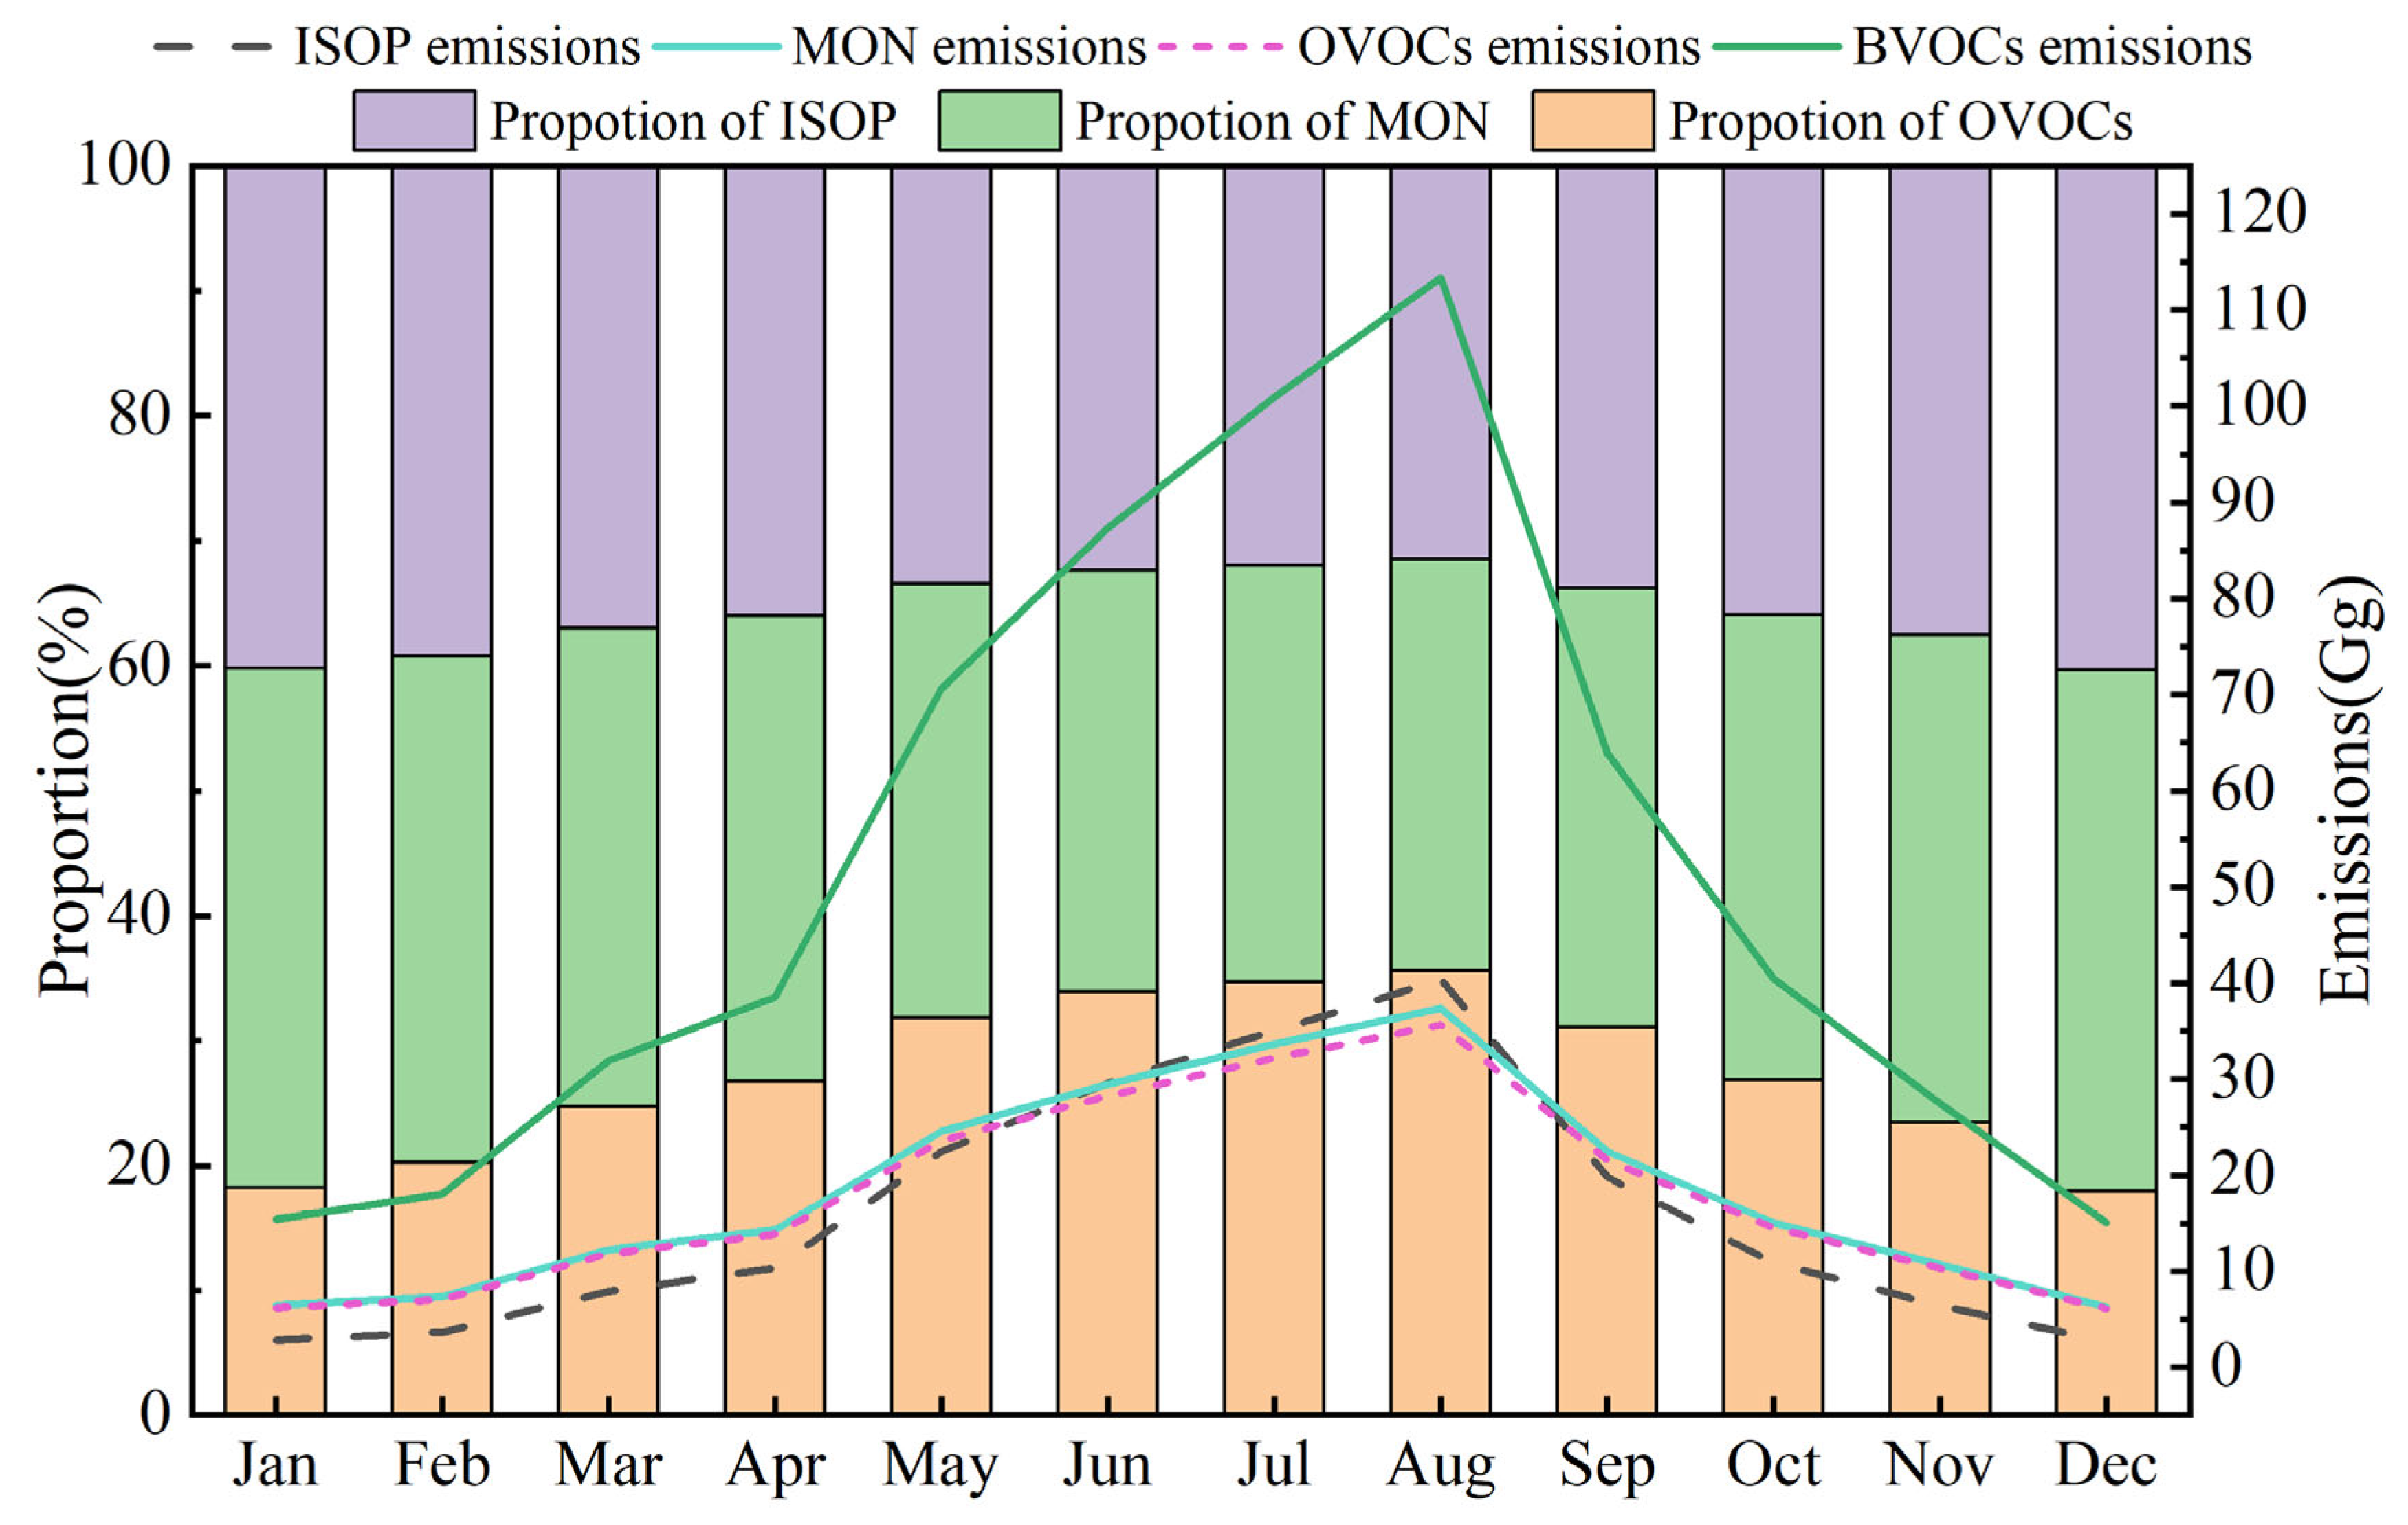
3.1.2. Seasonal Cyclical Variation Characteristics of BVOCs from Different Vegetation Types
3.2. Regulation of Temperature on BVOC Emissions from Different Vegetation Types
3.3. Impact of BVOC Emissions from Different Vegetation Types on Ozone Formation
3.4. Uncertainty Analysis
4. Conclusions
- (1)
- The total BVOC emissions in the Sichuan Basin in 2020 were 623.26 Gg, with ISOP, MON, and OVOCs accounting for 30.80%, 35.29%, and 33.91%, respectively. Different vegetation types exhibited significant differences in total emissions and emission intensity. Although mixed forests contributed the highest total emissions (50.24%), broad-leaved forests had the highest emission intensity (10.5 t/km2). In terms of composition, broad-leaved forests, shrublands, and wetlands mainly emitted ISOP, while coniferous forests, mixed forests, and grasslands mainly emitted MON, reflecting differences in their metabolic mechanisms. In terms of spatial distribution, the edges of the basin (e.g., Ya’an, Dazhou, and Mianyang) exhibited higher emissions due to widespread forest cover and diverse vegetation. In contrast, the agricultural areas at the basin’s center were mainly dominated by emissions from grasslands and crops, leading to lower overall emission intensity. Overall, BVOC emissions in the Sichuan Basin showed a spatial distribution of “higher at the edges, lower at the center,” influenced by vegetation type.
- (2)
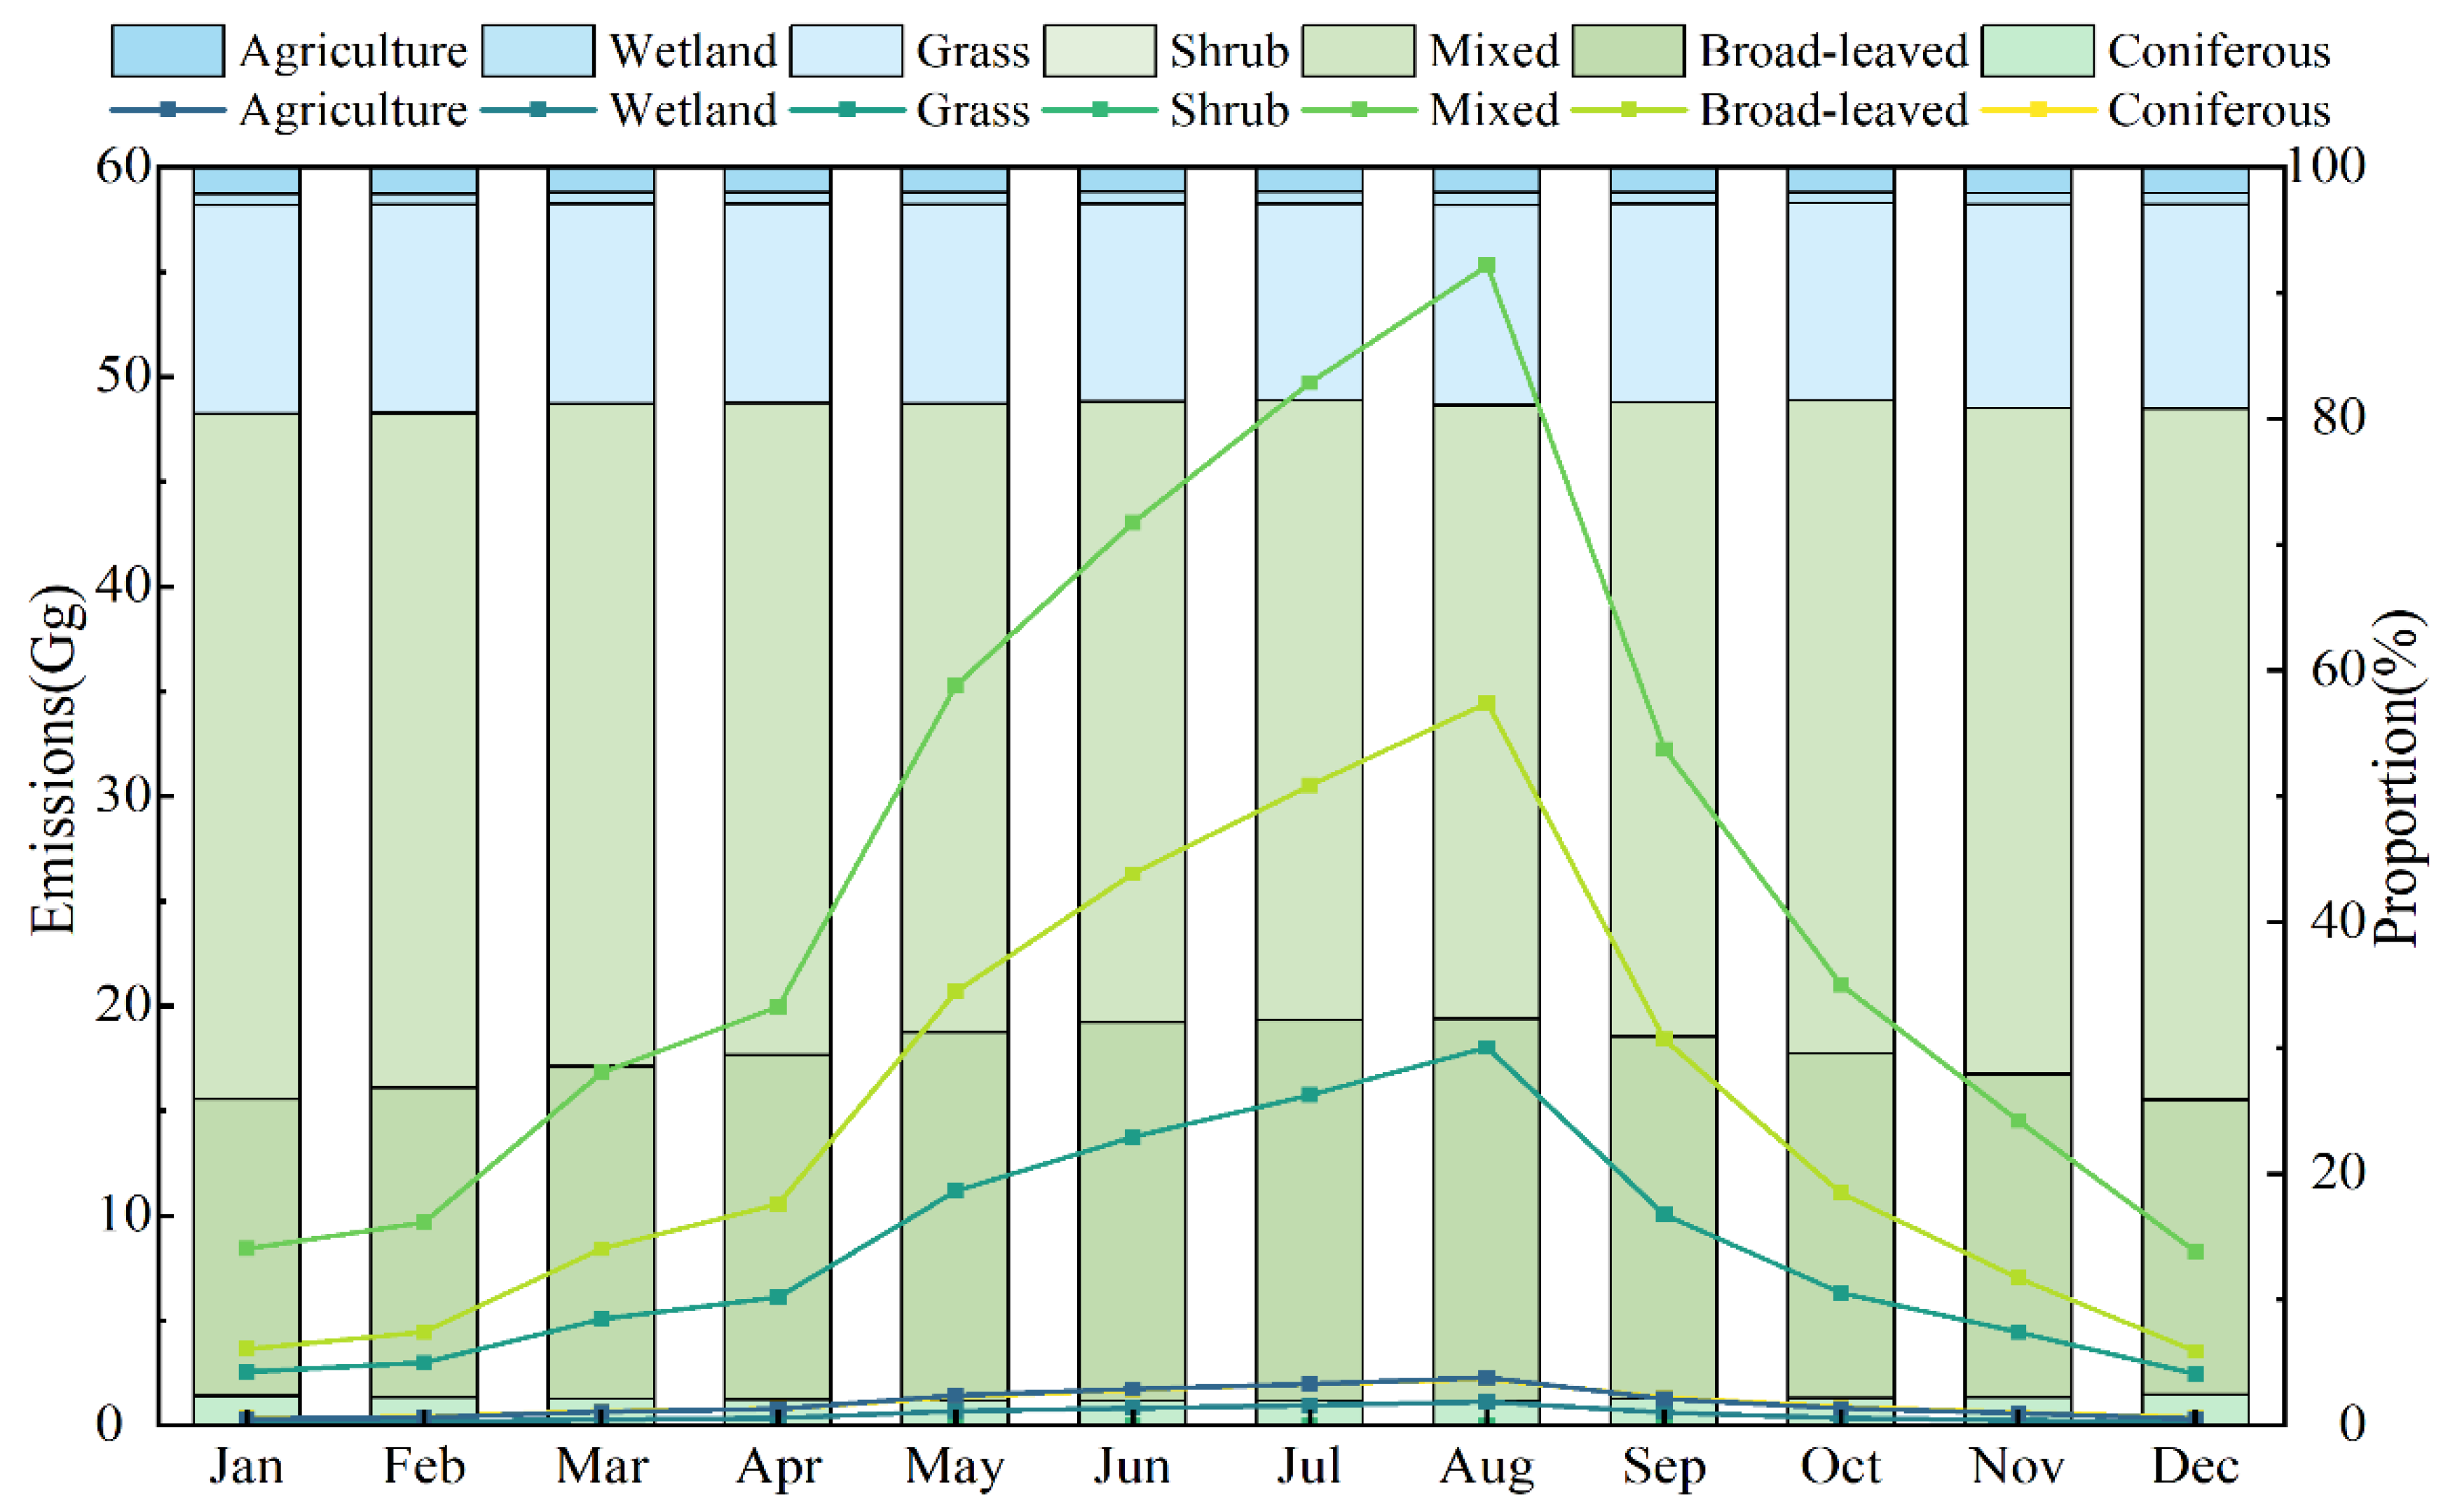
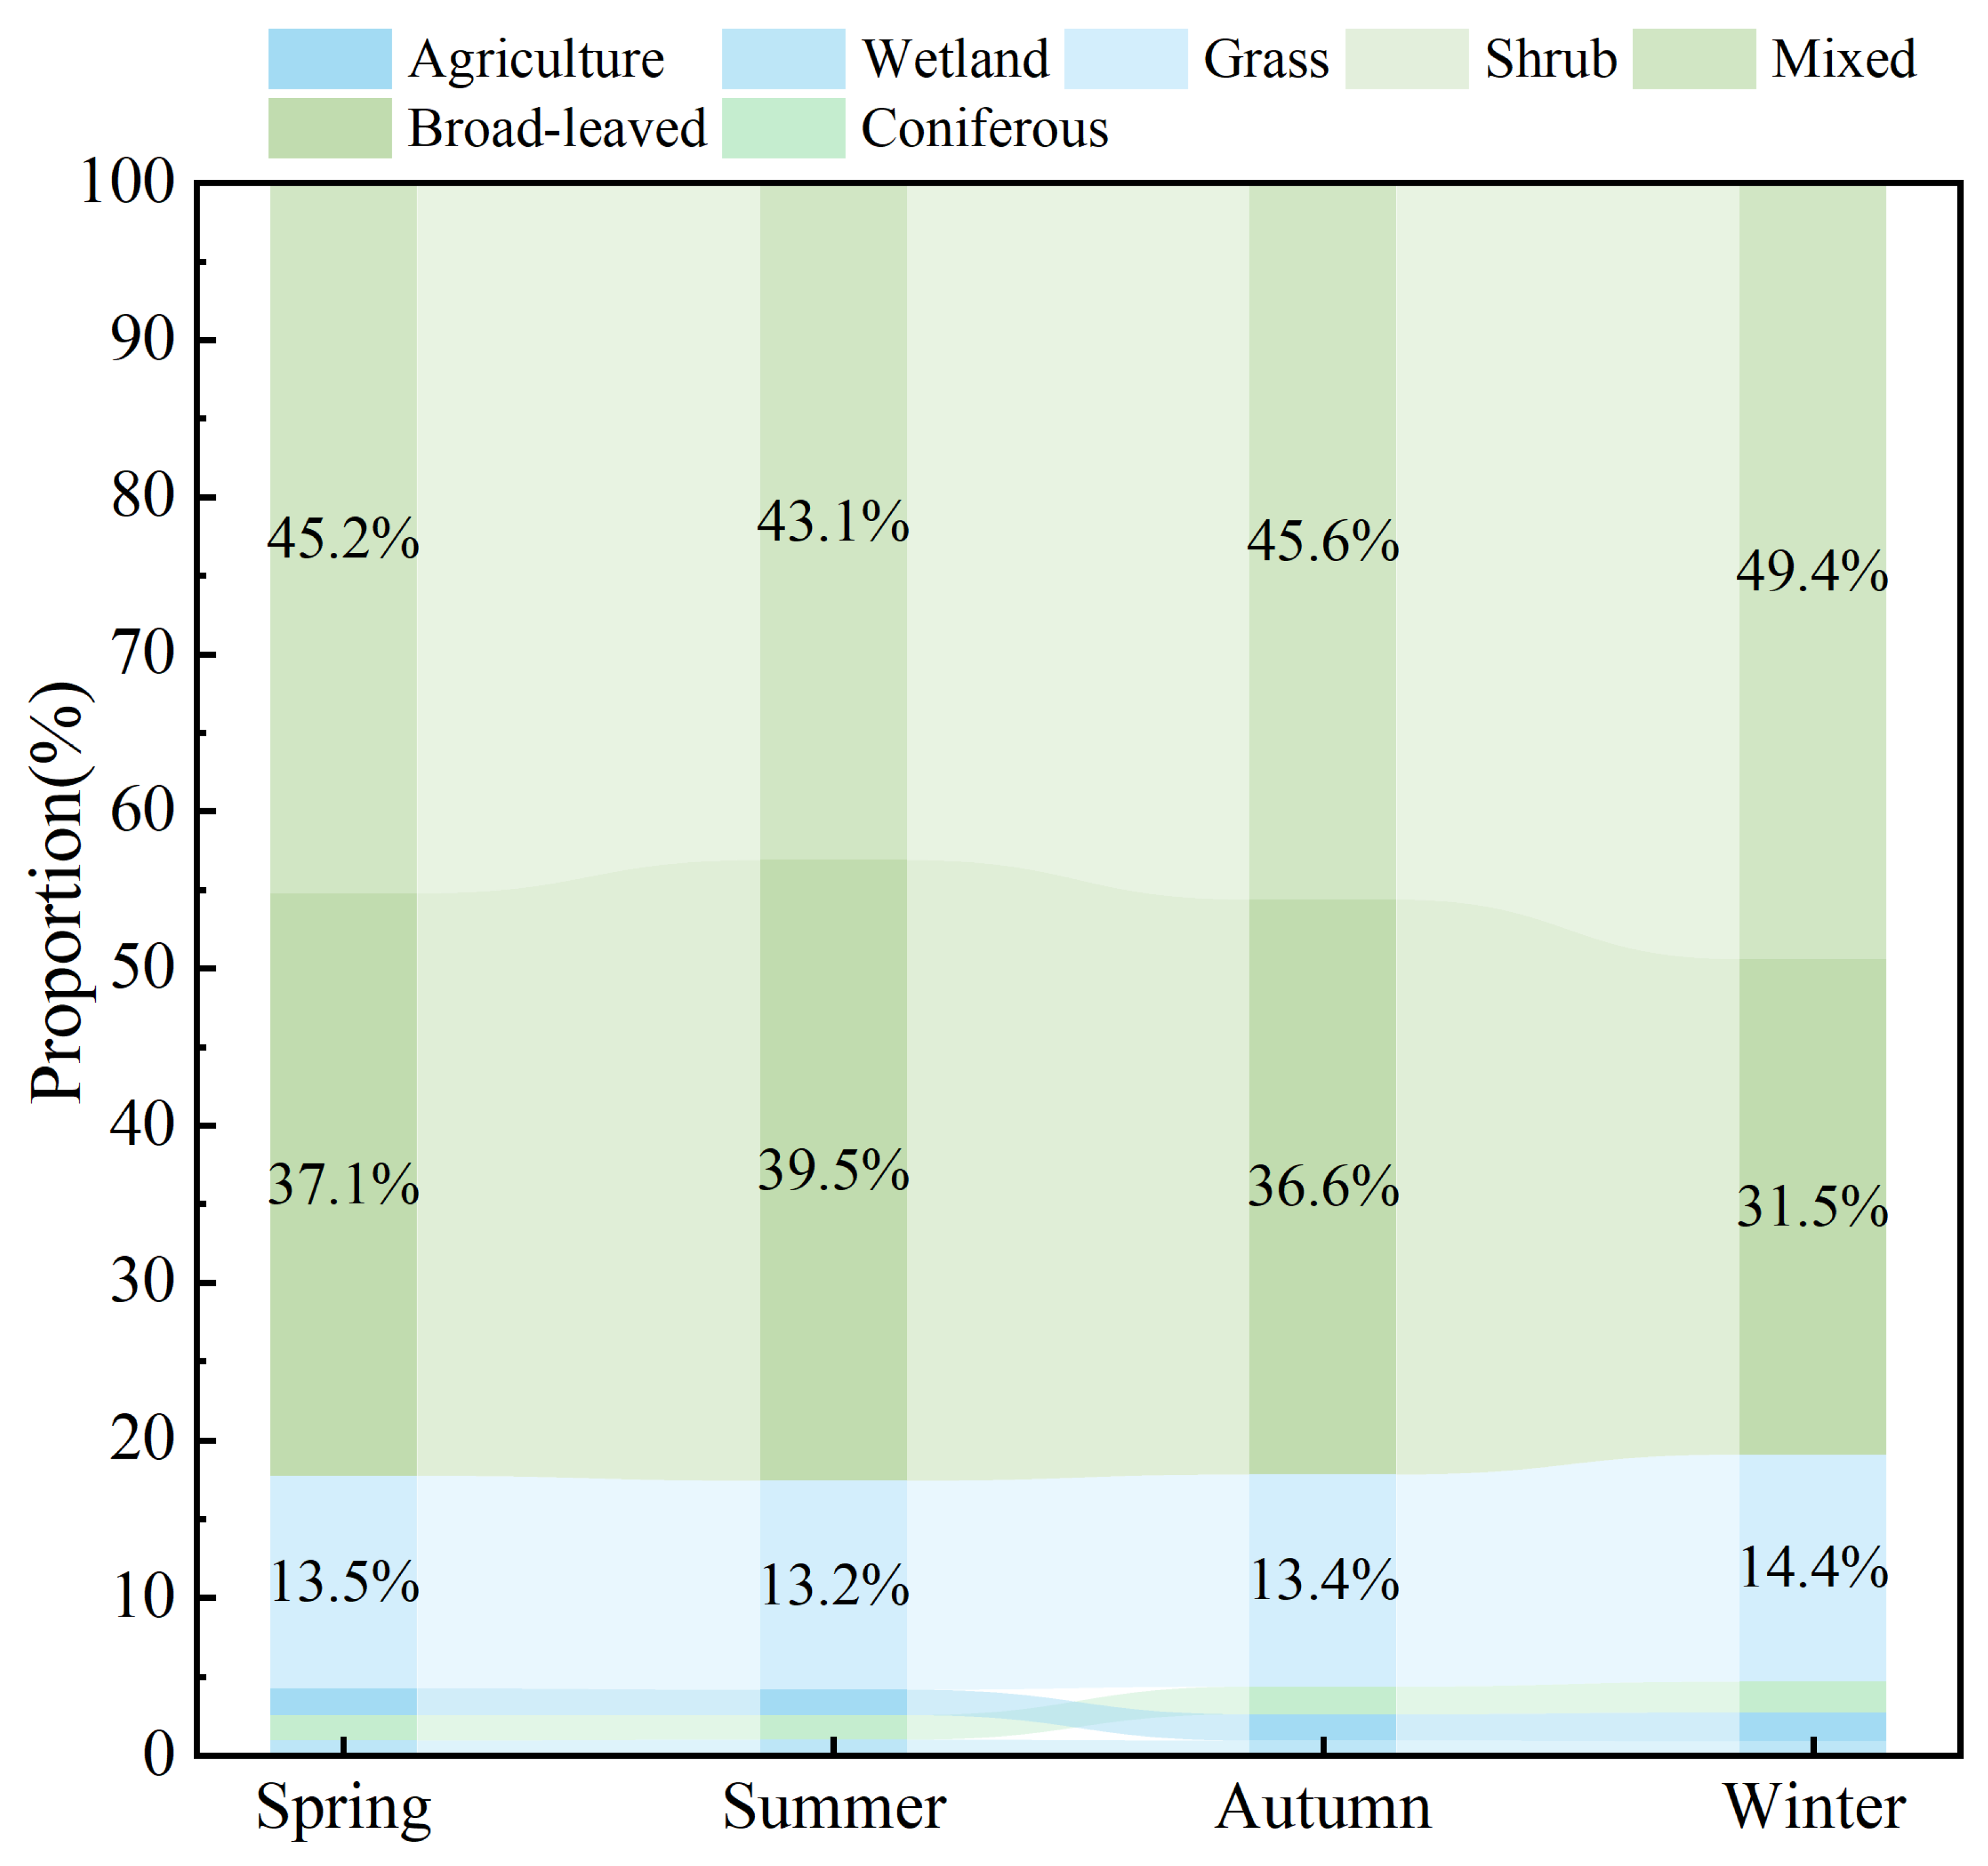
- BVOC emissions in the Sichuan Basin exhibited significant seasonal variation, with an overall pattern of “high in summer, low in winter”. In August, emissions accounted for 18.19% of the annual total. The three main components (ISOP, MON, and OVOCs) all peaked in summer, with ISOP becoming the dominant component from June onward. Climate factors such as temperature and solar radiation primarily drove seasonal variation, with high temperatures and strong radiation significantly enhancing BVOC emissions from vegetation, thereby increasing emission intensity. Different vegetation types showed varying sensitivities to climate factors. Types like broad-leaved forests, shrublands, and wetlands, which mainly emit ISOP, showed a significant increase in emissions during summer, while coniferous forests and farmlands, which mainly emit MON, showed a decrease in relative emissions, indicating lower sensitivity to environmental factors. Overall, the dynamic evolution of the emission structure in the Sichuan Basin is determined by the differences in the response mechanisms of different vegetation types and their components to environmental factors.
- (3)
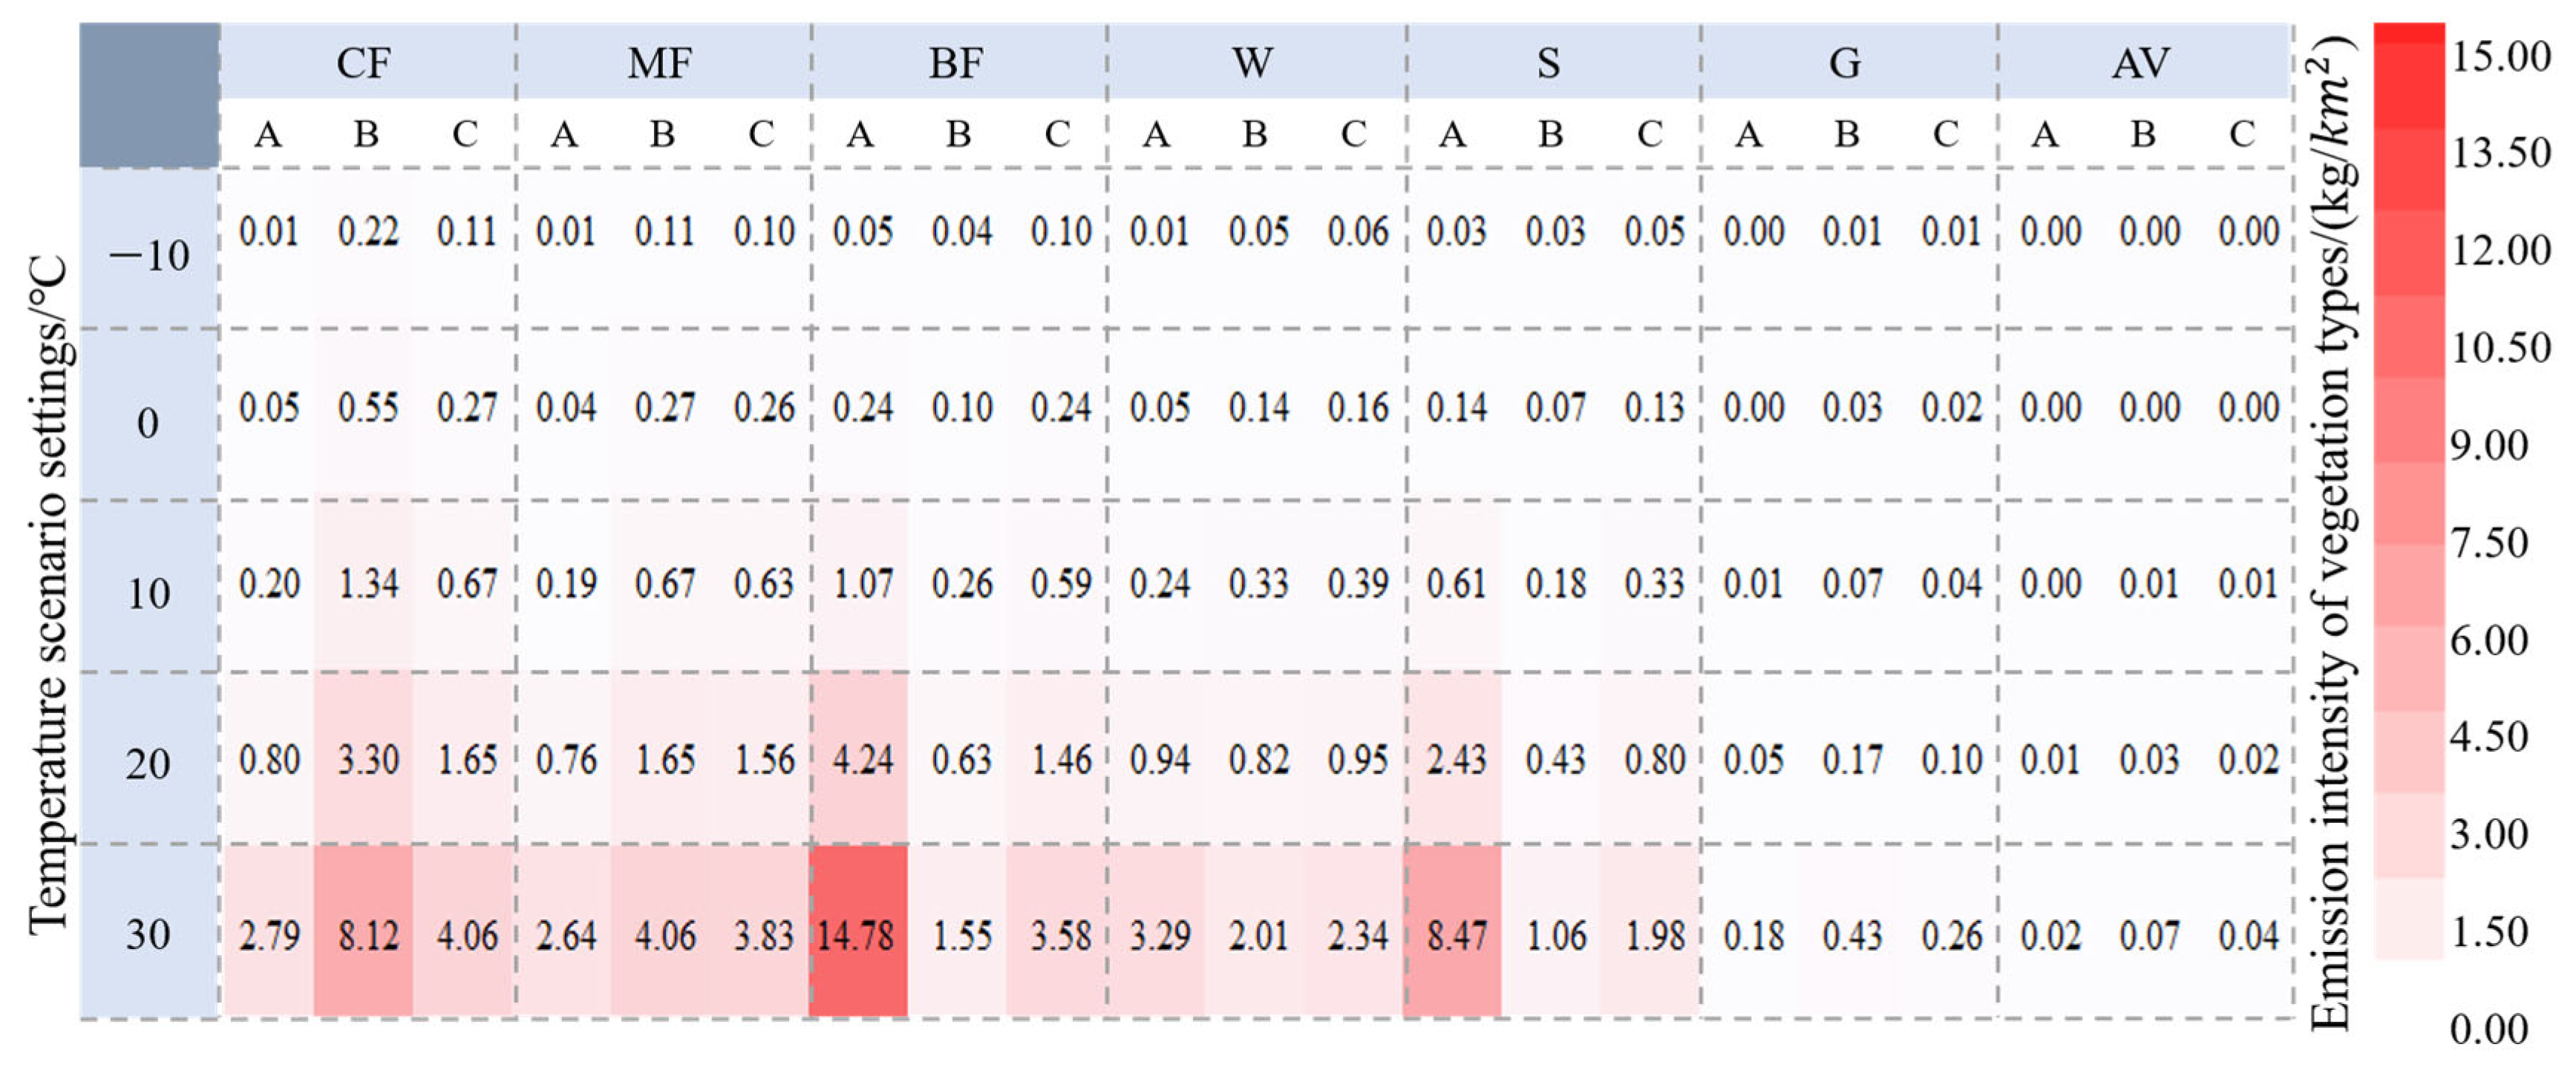
- Temperature is one of the dominant factors regulating BVOC emissions in the Sichuan Basin. The emission intensity of all vegetation types significantly increased with rising temperatures, consistent with previous work, but their response characteristics differed notably. Under low-temperature conditions (−10 °C), coniferous forests dominated MON emissions, showing strong cold tolerance. In contrast, under high-temperature conditions (30 °C), broad-leaved forests exhibited a sharp increase in ISOP emissions, becoming the major contributor with a significant high-temperature response. The iso-temperature analysis further revealed the temperature sensitivity gradient of different vegetation types: broad-leaved forests were the most sensitive (3.94%), while agricultural vegetation was the least sensitive (0.03%).
- (4)
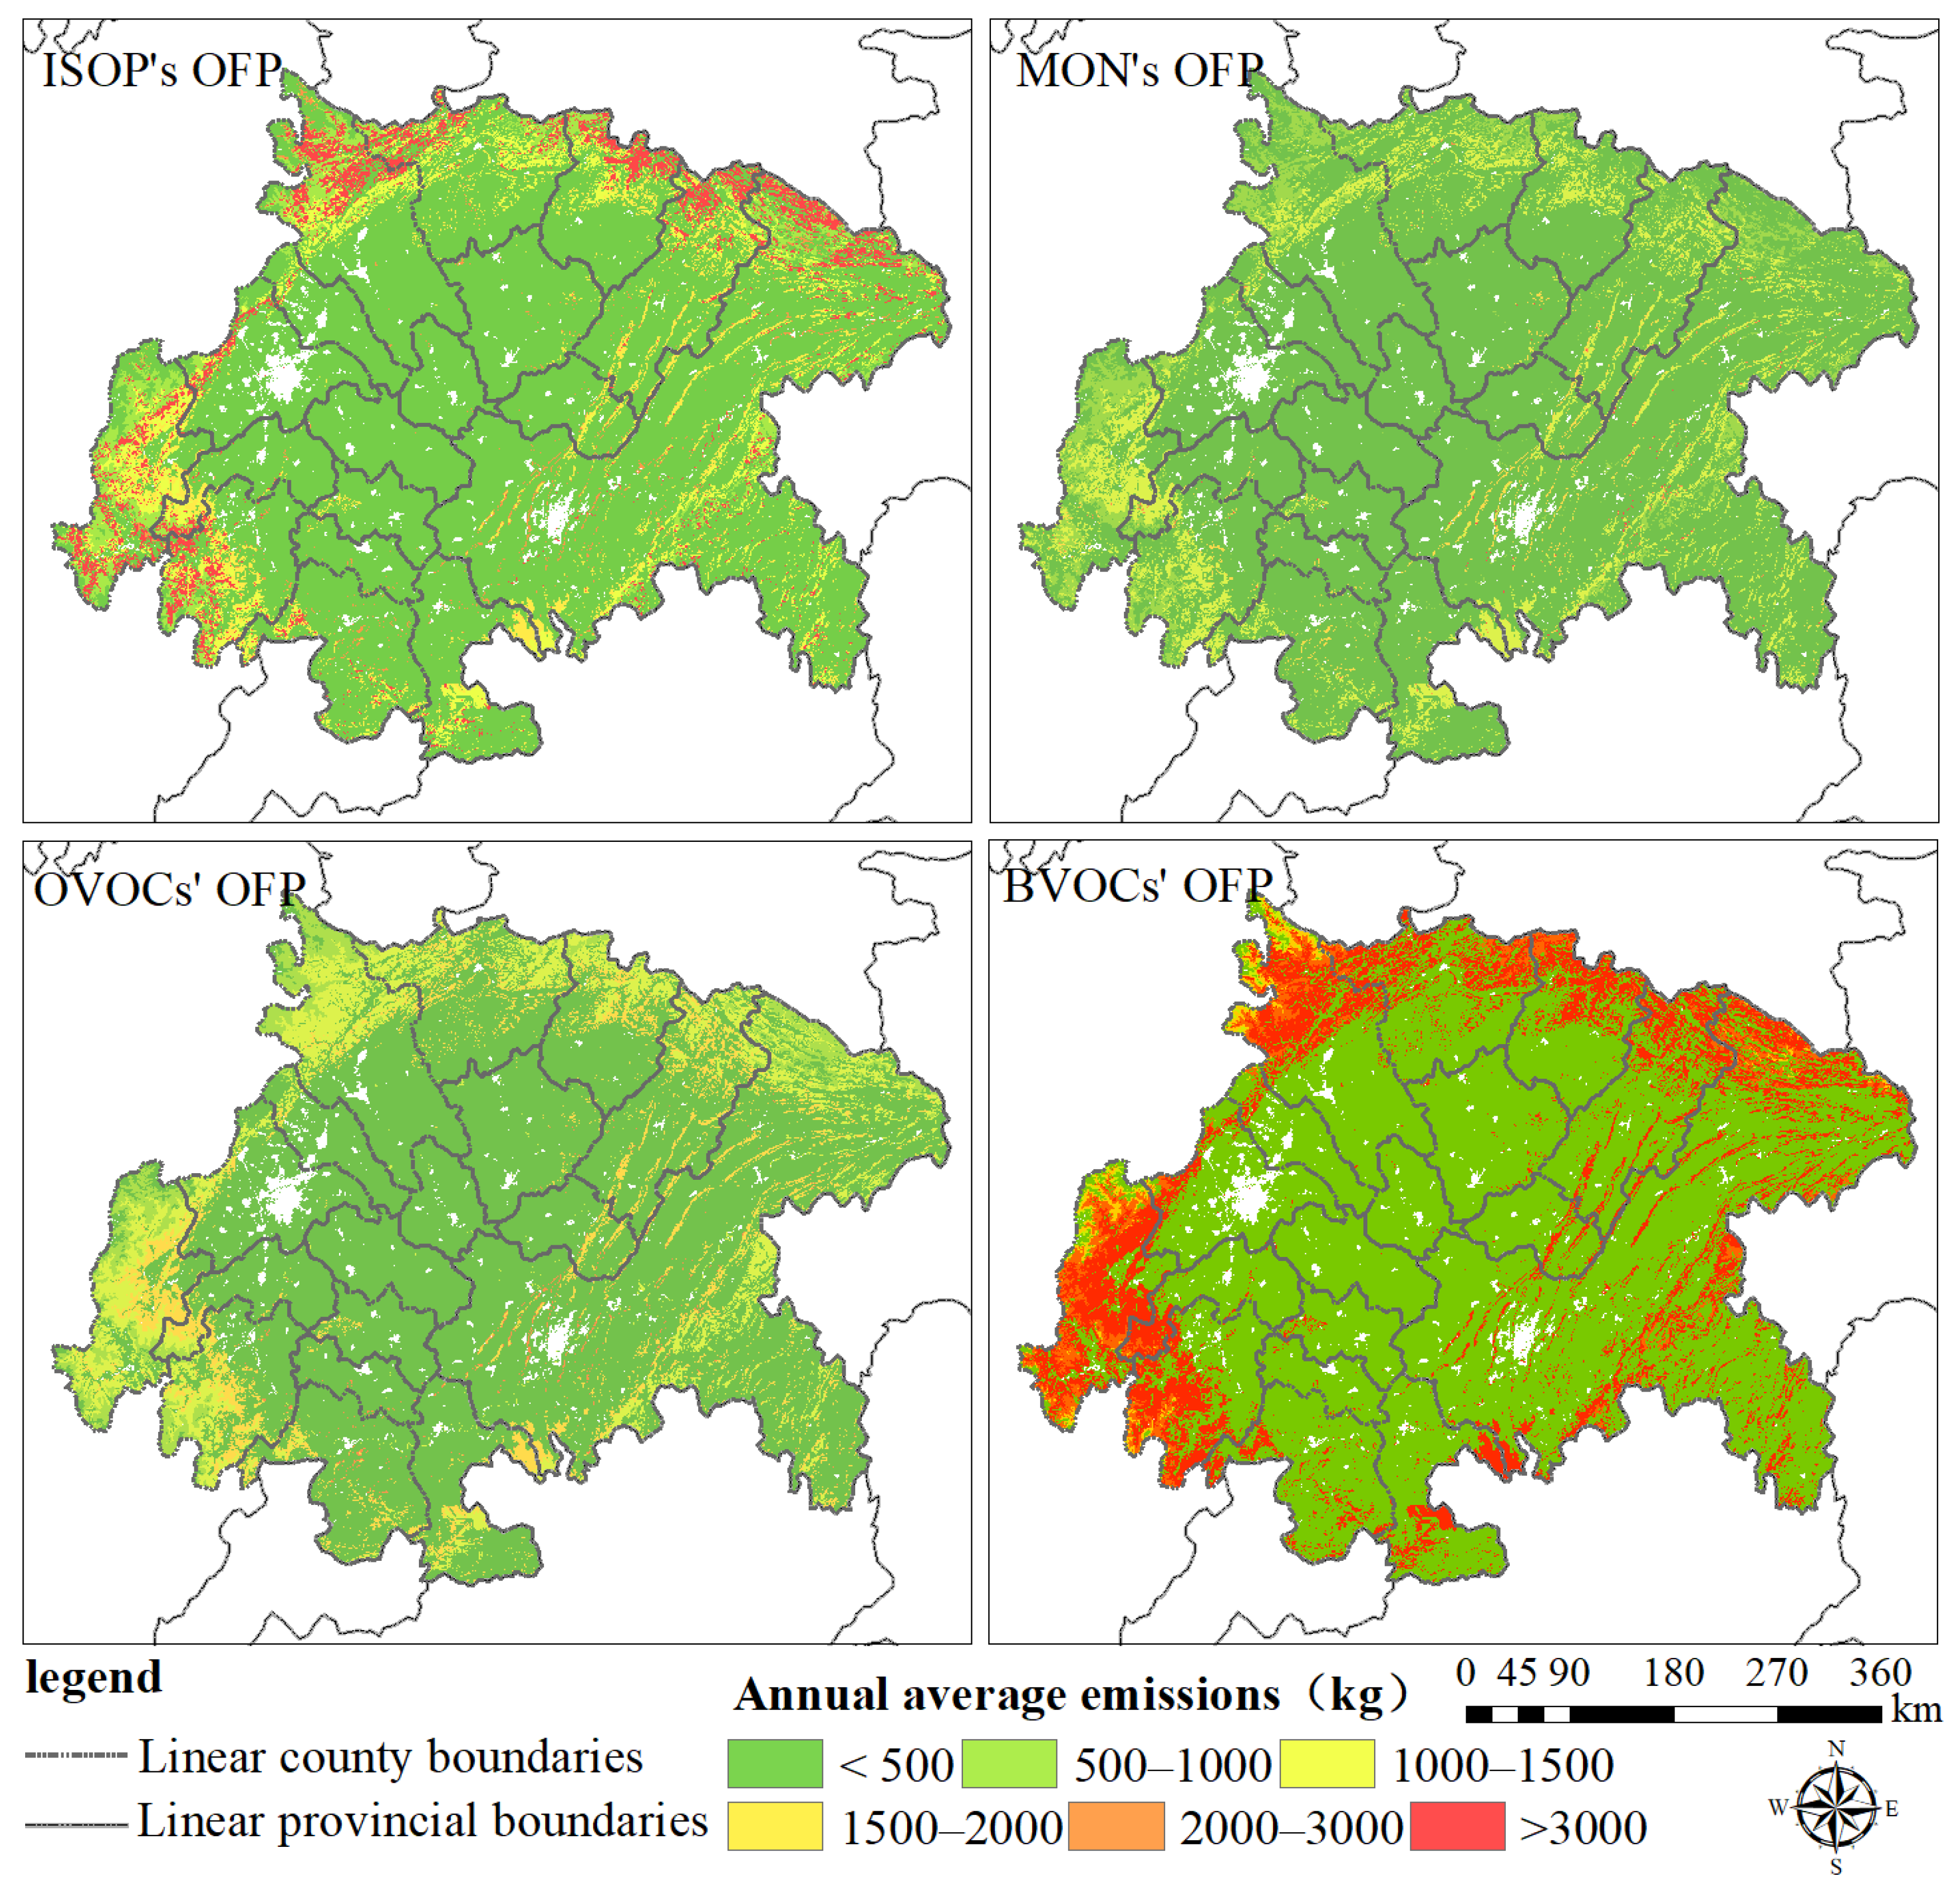
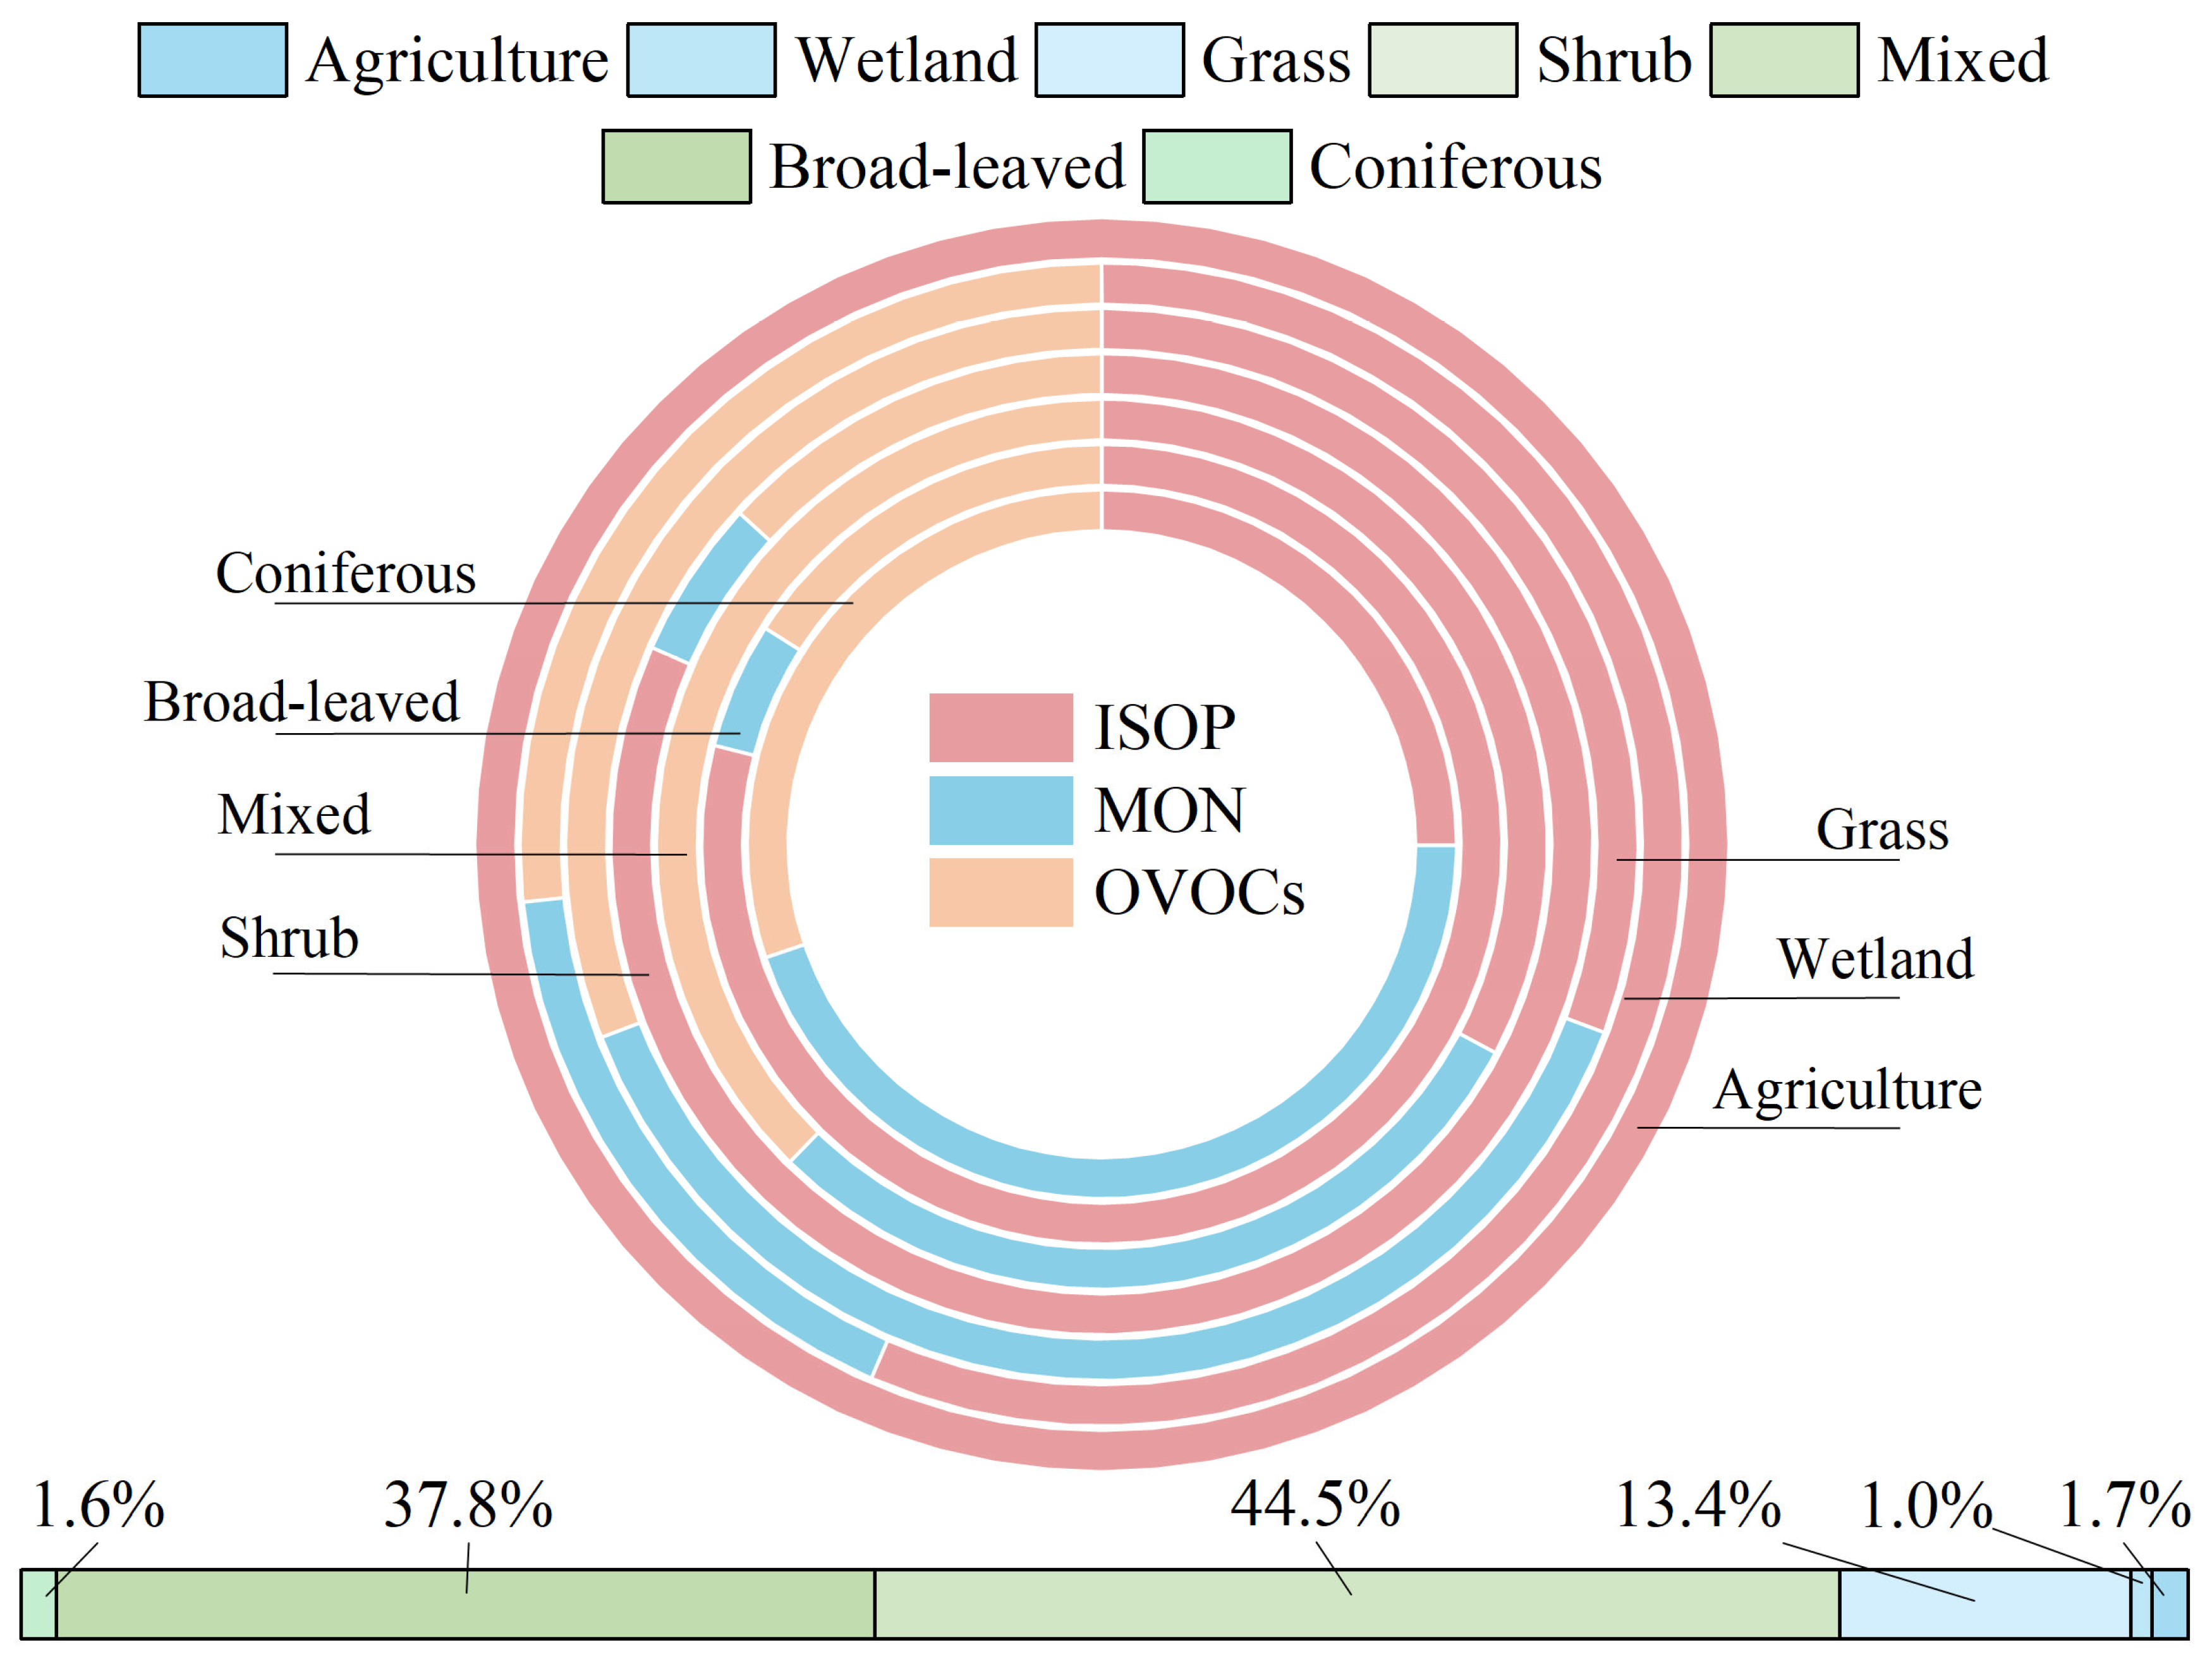
- The total OFP of BVOCs in the Sichuan Basin is 4.08 million tons. ISOP is the largest contributor, accounting for 49.96%. It dominates in areas with high emission intensity. There is a significant difference among BVOC components. ISOP far exceeds MON and OVOCs. In terms of vegetation types, mixed forests, broadleaf forests, and grasslands are the main sources. Together, they contribute over 95% of the total OFP. The OFP from broadleaf forests, shrubs, and wetlands is mainly driven by highly reactive ISOP. In contrast, coniferous forests, grasslands, and croplands are dominated by MON, which has lower reactivity and weaker impact on ozone formation. OFP contributions show structural seasonal changes. In summer, mixed and broadleaf forests contribute more. In winter, the relative share of coniferous forests and other cold-season vegetation increases.
Author Contributions
Funding
Data Availability Statement
Acknowledgments
Conflicts of Interest
References
- Liu, B.; Jin, Y.; Li, C. Analysis and prediction of air quality in Nanjing from autumn 2018 to summer 2019 using PCR-SVR-ARMA combined model. Sci. Rep. 2021, 11, 348. [Google Scholar] [CrossRef] [PubMed]
- Wang, H.; Huang, C.; Tao, W.; Gao, Y.; Wang, S.; Jing, S.; Wang, W.; Yan, R.; Wang, Q.; An, J.; et al. Seasonality and reduced nitric oxide titration dominated ozone increase during COVID-19 lockdown in eastern China. npj Clim. Atmos. Sci. 2022, 5, 24. [Google Scholar] [CrossRef]
- Wang, D.; Pu, D.; De, S.I.; Zhu, L.; Yang, X.; Sun, W.; Xia, H.; Song, Z.; Li, X.; Li, J.; et al. Evolution of global O3-NOx-VOCs sensitivity before and after the COVID-19 from the ratio of formaldehyde to NO2 from satellite observations. J. Environ. Sci. 2025, 156, 102–113. [Google Scholar] [CrossRef] [PubMed]
- Yenisoy-Karakas, S.; Dorter, M.; Odabasi, M. Intraday and interday variations of 69 volatile organic compounds (BVOCs and AVOCs) and their source profiles at a semi-urban site. Sci. Total Environ. 2020, 723, 138028. [Google Scholar] [CrossRef]
- Wang, Y.; Tan, X.; Huang, L.; Wang, Q.; Li, H.; Zhang, H.; Zhang, K.; Liu, Z.; Traore, D.; Yaluk, E.; et al. The impact of biogenic emissions on ozone formation in the Yangtze River Delta region based on MEGANv3.1. Air Qual. Atmos. Health 2021, 14, 763–774. [Google Scholar] [CrossRef]
- Ma, M.; Gao, Y.; Ding, A.; Su, H.; Liao, H.; Wang, S.; Wang, X.; Zhao, B.; Zhang, S.; Fu, P.; et al. Development and Assessment of a High-Resolution Biogenic Emission Inventory from Urban Green Spaces in China. Environ. Sci. Technol. 2022, 56, 175–184. [Google Scholar] [CrossRef] [PubMed]
- Moradi, A.; Abera, T.A.; Shayle, E.S.; Muhammed, M.A.; Zeuss, D. Modeling Long-Term Dynamics of Biogenic Volatile Organic Compounds (BVOCs) in Germany Based on Major Precursors. Environ. Sci. Technol. 2025, 59, 4587–4596. [Google Scholar] [CrossRef]
- Wang, H.; Wu, Q.; Guenther, A.B.; Yang, X.; Wang, L.; Xiao, T.; Li, J.; Feng, J.; Xu, Q.; Cheng, H. A long-term estimation of biogenic volatile organic compound (BVOC) emission in China from 2001–2016: The roles of land cover change and climate variability. Atmos. Chem. Phys. 2021, 21, 4825–4848. [Google Scholar] [CrossRef]
- Shao, M.; Wei, Y.; Lv, S.; Liao, Z.; Zou, J.; Zhu, J. Contribution and Mechanisms of BVOCs Emitted From a Typical Large Lake with Algal Bloom to O3 Levels in Lakeside Urban Areas. J. Geophys. Res. Atmos. 2025, 130, e2024JD042248. [Google Scholar] [CrossRef]
- Gao, C.; Zhang, X.; Lun, X.; Gao, Y.; Guenther, A.; Zhao, H.; Zhang, S.; Huang, L.; Song, K.; Huang, X.; et al. BVOCs’ role in dynamic shifts of summer ozone formation regimes across China and policy implications. J. Environ. Manag. 2025, 376, 124150. [Google Scholar] [CrossRef]
- Hang, J.; Wang, X.; Liang, J.; Zhang, X.; Wu, L.; Du, Y.; Zhang, Y.; Buccolieri, R. Numerical investigation of the impact of urban trees on O3–NOx–VOCs chemistry and pollutant dispersion in a typical street canyon. Atmos. Environ. 2023, 311, 119998. [Google Scholar] [CrossRef]
- Zheng, H.; Kong, S.; He, Y.; Song, C.; Cheng, Y.; Yao, L.; Chen, N.; Zhu, B. Enhanced ozone pollution in the summer of 2022 in China: The roles of meteorology and emission variations. Atmos. Environ. 2023, 301, 119701. [Google Scholar] [CrossRef]
- Chen, P.; Zhao, X.; Wang, O.; Shao, M.; Xiao, X.; Wang, S.; Wang, Q.G. Characteristics of VOCs and their Potentials for O3 and SOA Formation in a Medium-sized City in Eastern China. Aerosol Air Qual. Res. 2022, 22, 210239. [Google Scholar] [CrossRef]
- Wang, L.; Lun, X.; Wu, J.; Wang, Q.; Tao, J.; Dou, X.; Zhang, Z. Investigation of biogenic volatile organic compounds emissions in the Qinghai-Tibetan Plateau. Sci. Total Environ. 2023, 902, 165877. [Google Scholar] [CrossRef]
- Basso, L.S.; Marani, L.; Gatti, L.V.; Miller, J.B.; Gloor, M.; Melack, J.; Cassol, H.L.G.; Tejada, G.; Domingues, L.G.; Arai, E.; et al. Amazon methane budget derived from multi-year airborne observations highlights regional variations in emissions. Commun. Earth Environ. 2021, 2, 246. [Google Scholar] [CrossRef]
- Zhang, Q.; Li, L.; Zhao, W.; Wang, X.; Jiang, L.; Liu, B.; Li, X.; Lu, H. Emission characteristics of VOCs from forests and its impact on regional air quality in Beijing. China Environ. Sci. 2021, 41, 622–632. [Google Scholar]
- Bao, X.; Zhou, W.; Xu, L.; Zheng, Z. A meta-analysis on plant volatile organic compound emissions of different plant species and responses to environmental stress. Environ. Pollut. 2023, 318, 120886. [Google Scholar] [CrossRef]
- Cai, B.; Cheng, H.; Kang, T. Establishing the emission inventory of biogenic volatile organic compounds and quantifying their contributions to O3 and PM2.5 in the Beijing-Tianjin-Hebei region. Atmos. Environ. 2024, 318, 120206. [Google Scholar] [CrossRef]
- Sindelarova, K.; Markova, J.; Simpson, D.; Huszar, P.; Karlicky, J.; Darras, S.; Granier, C. High-resolution biogenic global emission inventory for the time period 2000–2019 for air quality modelling. Earth Syst. Sci. Data 2022, 14, 251–270. [Google Scholar] [CrossRef]
- Baggesen, N.; Li, T.; Seco, R.; Holst, T.; Michelsen, A.; Rinnan, R. Phenological stage of tundra vegetation controls bidirectional exchange of BVOCs in a climate change experiment on a subarctic heath. Glob. Change Biol. 2021, 27, 2928–2944. [Google Scholar] [CrossRef]
- Yu, H.; Holopainen, J.K.; Kivimaenpaa, M.; Virtanen, A.; Blande, J.D. Potential of Climate Change and Herbivory to Affect the Release and Atmospheric Reactions of BVOCs from Boreal and Subarctic Forests. Molecules 2021, 26, 2283. [Google Scholar] [CrossRef] [PubMed]
- Cai, M.; An, C.; Guy, C. A scientometric analysis and review of biogenic volatile organic compound emissions: Research hotspots, new frontiers, and environmental implications. Renew. Sustain. Energy Rev. 2021, 149, 111317. [Google Scholar] [CrossRef]
- Gao, C.; Zhang, X.; Yang, H.; Huang, L.; Zhao, H.; Zhang, S.; Xiu, A. Quantifying the impacts of environmental stress factors on biogenic volatile organic compound emissions in China. Agric. For. Meteorol. 2025, 366, 110480. [Google Scholar] [CrossRef]
- Ndah, F.; Valolahti, H.; Schollert, M.; Michelsen, A.; Rinnan, R.; Kivimaenpaa, M. Influence of increased nutrient availability on biogenic volatile organic compound (BVOC) emissions and leaf anatomy of subarctic dwarf shrubs under climate warming and increased cloudiness. Ann. Bot. 2022, 129, 443–455. [Google Scholar] [CrossRef] [PubMed]
- Wang, X.; Zhang, Y.; Tan, Y.; Tan, Y.; Bai, J.; Gu, D.; Ma, Z.; Du, J.; Han, Z. Effects of light on the emissions of biogenic isoprene and monoterpenes: A review. Atmos. Pollut. Res. 2022, 13, 101397. [Google Scholar] [CrossRef]
- Wang, N.; Wang, H.; Huang, X.; Chen, X.; Zou, Y.; Deng, T.; Li, T.; Lyu, X.; Yang, F. Extreme weather exacerbates ozone pollution in the Pearl River Delta, China: Role of natural processes. Atmos. Chem. Phys. 2024, 24, 1559–1570. [Google Scholar] [CrossRef]
- Smolander, S.; He, Q.; Mogensen, D.; Zhou, L.; Back, J.; Ruuskanen, T.; Noe, S.; Guenther, A.; Aaltonen, H.; Kulmala, M.; et al. Comparing three vegetation monoterpene emission models to measured gas concentrations with a model of meteorology, air chemistry and chemical transport. Biogeosciences 2014, 11, 5425–5443. [Google Scholar] [CrossRef]
- Lun, X.; Lin, Y.; Chai, F.; Fan, C.; Li, H.; Liu, J. Reviews of emission of biogenic volatile organic compounds (BVOCs) in Asia. J. Environ. Sci. 2020, 95, 266–277. [Google Scholar] [CrossRef]
- Zhang, M.; Zhao, C.; Yang, Y.; Du, Q.; Shen, Y.; Lin, S.; Gu, D.; Su, W.; Liu, C. Modeling sensitivities of BVOCs to different versions of MEGAN emission schemes in WRF-Chem (v3.6) and its impacts over eastern China. Geosci. Model Dev. 2021, 14, 6155–6175. [Google Scholar] [CrossRef]
- Ciccioli, P.; Silibello, C.; Finardi, S.; Pepe, N.; Ciccioli, P.; Rapparini, F.; Neri, L.; Fares, S.; Brilli, F.; Mircea, M.; et al. The potential impact of biogenic volatile organic compounds (BVOCs) from terrestrial vegetation on a Mediterranean area using two different emission models. Agric. For. Meteorol. 2023, 328, 109255. [Google Scholar] [CrossRef]
- Chen, P.; Zhao, X.; Wang, O.; Shao, M.; Xiao, X.; Wang, S.; Wang, Q.G. Emission characteristics of biogenic volatile organic compounds in a subtropical pristine forest of southern China. J. Environ. Sci. 2025, 148, 665–682. [Google Scholar] [CrossRef] [PubMed]
- Li, L.; Yang, W.; Xie, S.; Wu, Y. Estimations and uncertainty of biogenic volatile organic compound emission inventory in China for 2008–2018. Sci. Total Environ. 2020, 733, 139301. [Google Scholar] [CrossRef] [PubMed]
- Yuan, X.; Xu, Y.; Du, Y.; Feng, Z. Differences of biogenic volatile organic compound emissions from urban forests in Nanjing and Beijing. China Environ. Sci. 2022, 42, 1489–1500. [Google Scholar]
- Zhao, D.; Lun, X.; Wang, Q.; Wu, J.; Wang, X.; Feng, R. Emission Characteristics of Biogenic Volatile Organic Compounds in Shandong Province. Res. Environ. Sci. 2023, 36, 1487–1497. [Google Scholar]
- Wang, C.; Zhang, X.; Wang, J.; Pan, J.; Gao, J. Simulation of ozone pollution events in Sichuan Basin under the alternating effects of continental high pressure and subtropical high pressure circulation. Atmos. Res. 2025, 322, 108121. [Google Scholar] [CrossRef]
- Li, S.; Guo, J.; Wang, Y.; Lian, X.; Li, J. The Characteristics of PM2.5 and O3 Synergistic Pollution in the Sichuan Basin Urban Agglomeration. Atmosphere 2025, 16, 329. [Google Scholar] [CrossRef]
- Zhu, L.; Xie, S.; Yang, H.; Ma, M.; Xia, J. Topographic distribution characteristic of vegetation coverage change trend in Sichuan Province based on MODIS-EVI from 2000 to 2020. Ecol. Sci. 2024, 43, 187–195. [Google Scholar]
- Yu, S.-J.; Seo, Y.-S.; Son, Y.-S.; Kim, J.-C. Characteristics of BVOCs emitted from representative tree species in South Korea according to environmental influences. Atmos. Environ. 2024, 318, 120238. [Google Scholar] [CrossRef]
- Wang, J.; Zhang, X.; Wang, C.; Pan, J.; Gao, J. Early springtime O3 pollution episode in the Sichuan Basin: Transboundary and process analysis. Environ. Pollut. 2025, 373, 126163. [Google Scholar] [CrossRef]
- Peng, S.; Gang, C.; Cao, Y.; Chen, Y. Assessment of climate change trends over the Loess Plateau in China from 1901 to 2100. Int. J. Climatol. 2017, 38, 2250–2264. [Google Scholar] [CrossRef]
- Mao, H.; Zhang, K.; Di, B. Studies on estimates of biogenic VOC emission and its temporal and spatial distribution in Sichuan. China Environ. Sci. 2016, 36, 1289–1296. [Google Scholar]
- Chi, Y.; Zhan, Y.; Wang, K.; Ye, H. Sequential spatiotemporal distribution of PM2.5, SO2 and Ozone in China from 2015 to 2020. Earth Syst. Sci. Data Discuss. 2023, 2023, 1–38. [Google Scholar]
- Guenther, A.; Hewitt, C.N.; Erickson, D.; Fall, R.; Geron, C.; Graedel, T.; Harley, P.; Klinger, L.; Lerdau, M.; Mckay, W.A.; et al. A global model of natural volatile organic compound emissions. J. Geophys. Res.-Atmos. 1995, 100, 8873–8892. [Google Scholar] [CrossRef]
- Pierce, T.; Geron, C.; Bender, L.; Dennis, R.; Tonnesen, G.; Guenther, A. Influence of increased isoprene emissions on regional ozone modeling. J. Geophys. Res.-Atmos. 1998, 103, 25611–25629. [Google Scholar]
- Zeng, J.; Zhang, Y.; Mu, Z.; Pang, W.; Zhang, H.; Wu, Z.; Song, W.; Wang, X. Temperature and light dependency of isoprene and monoterpene emissions from tropical and subtropical trees: Field observations in south China. Appl. Geochem. 2023, 155, 105727. [Google Scholar] [CrossRef]
- Maison, A.; Lugon, L.; Park, S.-J.; Baudic, A.; Cantrell, C.; Couvidat, F.; D’Anna, B.; Di Biagio, C.; Gratien, A.; Gros, V.; et al. Significant impact of urban tree biogenic emissions on air quality estimated by a bottom-up inventory and chemistry transport modeling. Atmos. Chem. Phys. 2024, 24, 6011–6046. [Google Scholar] [CrossRef]
- Oku, H.; Iqbal, A.; Oogai, S.; Inafuku, M.; Mutanda, I. Relationship between Cumulative Temperature and Light Intensity and G93 Parameters of Isoprene Emission for the Tropical Tree Ficus septica. Plants 2024, 13, 243. [Google Scholar] [CrossRef]
- Long, Q.; Qiao, Y.; Jiang, T.; Li, Y.; He, M.; Luo, L. Effects of High Temperature on Biogenic Emissions and O3 Generation Contribution: A Case Study of July-August 2022 in Sichuan Basin. Res. Environ. Sci. 2023, 36, 2331–2343. [Google Scholar]
- Wang, N.; Du, Y.; Chen, D.; Meng, H.; Chen, X.; Zhou, L.; Shi, G.; Zhan, Y.; Feng, M.; Li, W.; et al. Spatial disparities of ozone pollution in the Sichuan Basin spurred by extreme, hot weather. Atmos. Chem. Phys. 2024, 24, 3029–3042. [Google Scholar] [CrossRef]
- Liu, D.; Hai, S.; Meng, J.; Zhang, W.; Zhou, Y.; Zhao, Y.; Liu, X.; Li, W.; Sheng, L. Crucial VOCs influences on ozone formation in North China: A spatial perspective. Atmos. Environ. 2025, 351, 121183. [Google Scholar] [CrossRef]
- Lee, S.-H.; Lee, J.-S.; Lee, H.-M.; Kwon, H.-A.; Nowlan, C.R.; Abad, G.G.; Park, R.J.; Park, J.-H.; Kang, S.; Shin, H.-J.; et al. Understanding Ozone Formation and Carbonyl Contributions in the Seoul Metropolitan Area. Aerosol Air Qual. Res. 2024, 24, 230227. [Google Scholar] [CrossRef]
- Venecek, M.A.; Carter, W.P.L.; Kleeman, M.J. Updating the SAPRC Maximum Incremental Reactivity (MIR) scale for the United States from 1988 to 2010. J. Air Waste Manag. Assoc. 2018, 68, 1301–1316. [Google Scholar] [CrossRef] [PubMed]
- Cai, B.; Cheng, H.; Qi, H.; Li, A.; Kang, T. Contribution of Different Types of Vegetation to Oand PMin Typical Cities in Beijing-Tianjin-Hebei Region in Summer. China Environ. Sci. 2023, 43, 2734–2743. [Google Scholar]
- Jing, X.; Lun, X.; Fan, C.; Ma, W. Emission patterns of biogenic volatile organic compounds from dominant forest species in Beijing, China. J. Environ. Sci. 2020, 95, 73–81. [Google Scholar] [CrossRef]
- Zoric, M.; Kostic, S.; Kladar, N.; Bozin, B.; Vasic, V.; Kebert, M.; Orlovic, S. Phytochemical Screening of Volatile Organic Compounds in Three Common Coniferous Tree Species in Terms of Forest Ecosystem Services. Forests 2021, 12, 928. [Google Scholar] [CrossRef]
- Borsdorf, H.; Bentele, M.; Mueller, M.; Rebmann, C.; Mayer, T. Comparison of Seasonal and Diurnal Concentration Profiles of BVOCs in Coniferous and Deciduous Forests. Atmosphere 2023, 14, 1347. [Google Scholar] [CrossRef]
- Baek, D.-H.; Seo, Y.-B.; Yu, S.-J.; Choi, I.-Y.; Lee, S.-W.; Son, Y.-S.; Dinh, T.-V.; Kim, J.-C. Comparison of biogenic volatile organic compounds emissions from representative urban tree species in South Korea and evaluation of standard emission rate models. Atmos. Environ. 2024, 333, 120654. [Google Scholar] [CrossRef]
- Ma, F.; Zhang, G.; Zhang, J.; Luo, X.; Liao, L.; Wang, H.; Tang, X.; Yi, Z. Isoprenoid emissions from Schima superba and Cunninghamia lanceolata: Their responses to elevated temperature by two warming facilities. Sci. Total Environ. 2024, 930, 172669. [Google Scholar] [CrossRef]
- Li, L.; Bai, G.; Han, H.; Wu, Y.; Xie, S.; Xie, W. Localized biogenic volatile organic compound emission inventory in China: A comprehensive review. J. Environ. Manag. 2024, 353, 120121. [Google Scholar] [CrossRef]
- Mochizuki, T.; Ikeda, F.; Tani, A. Effect of growth temperature on monoterpene emission rates of Acer palmatum. Sci. Total Environ. 2020, 745, 140886. [Google Scholar] [CrossRef] [PubMed]
- Kalbande, R.; Kumar, B.; Maji, S.; Yadav, R.; Atey, K.; Rathore, D.S.; Beig, G. Machine learning based quantification of VOC contribution in surface ozone prediction. Chemosphere 2023, 326, 138474. [Google Scholar] [CrossRef]
| Data | Source | Period | Resolution |
|---|---|---|---|
| Temperature | TPDC | January 2020–December 2020 | 1 km |
| PAR | NASA | January 2020–December 2020 | 1° |
| Vegetation type | NASA | 2020 | 1 km |
| Emission factors | Ref. [33] | - | - |
| LMD | Ref. [33] | - | - |
| Ozone concentrations | https://doi.org/10.5281/zenodo.7580726, accessed on 29 April 2025 | 1 January 2020–31 December 2020 | 1 km |
| Vegetation Type | IGBP Land Cover |
|---|---|
| Coniferous forest | Evergreen Needleleaf Forest; Deciduous Needleleaf Forest |
| Broad-leaved forest | Evergreen Broadleaf Forest |
| Deciduous Broadleaf Forest | |
| Mixed forest | Mixed Forest |
| Shrubland | Closed Shrublands |
| Open Shrublands | |
| Grassland | Woody Savannas |
| Savannas | |
| Grasslands | |
| Wetland vegetation | Permanent Wetlands |
| Agricultural vegetation | Croplands |
| Cropland/Natural Vegetation Mosaic | |
| Non-vegetation | Water Bodies |
| Urban and Built-Up | |
| Permanent Snow and Ice | |
| Barren or Sparsely Vegetated |
| Scenario | Setting Scheme | Temperature Setting/°C |
|---|---|---|
| Temperature classification scenario | S1 | 30 |
| S2 | 20 | |
| S3 | 10 | |
| S4 | 0 | |
| S5 | −10 |
| Emissions | Area | Emission Intensity | ||
|---|---|---|---|---|
| Emission | Proportion (%) | |||
| Grassland | 103.92 | 16.67% | 125,207 | 0.83 |
| Shrub | 0.02 | 0.00% | 2 | 10.28 |
| Mixed forest | 292.67 | 46.96% | 38,358 | 7.63 |
| Broad-leaved forest | 197.90 | 31.75% | 18,847 | 10.50 |
| Agriculture vegetation | 11.71 | 1.88% | 78,099 | 0.15 |
| Wetland | 5.01 | 0.80% | 600 | 8.35 |
| Coniferous forest | 12.02 | 1.93% | 1267 | 9.49 |
Disclaimer/Publisher’s Note: The statements, opinions and data contained in all publications are solely those of the individual author(s) and contributor(s) and not of MDPI and/or the editor(s). MDPI and/or the editor(s) disclaim responsibility for any injury to people or property resulting from any ideas, methods, instructions or products referred to in the content. |
© 2025 by the authors. Licensee MDPI, Basel, Switzerland. This article is an open access article distributed under the terms and conditions of the Creative Commons Attribution (CC BY) license (https://creativecommons.org/licenses/by/4.0/).
Share and Cite
Zhang, Q.; Xue, Z.; Yi, L.; Wang, J.; Liu, E. Temperature Regulates BVOCs-Induced O3 Formation Potential Across Various Vegetation Types in the Sichuan Basin, China. Forests 2025, 16, 1091. https://doi.org/10.3390/f16071091
Zhang Q, Xue Z, Yi L, Wang J, Liu E. Temperature Regulates BVOCs-Induced O3 Formation Potential Across Various Vegetation Types in the Sichuan Basin, China. Forests. 2025; 16(7):1091. https://doi.org/10.3390/f16071091
Chicago/Turabian StyleZhang, Qi, Zhanpeng Xue, Lin Yi, Jiayuan Wang, and Enqin Liu. 2025. "Temperature Regulates BVOCs-Induced O3 Formation Potential Across Various Vegetation Types in the Sichuan Basin, China" Forests 16, no. 7: 1091. https://doi.org/10.3390/f16071091
APA StyleZhang, Q., Xue, Z., Yi, L., Wang, J., & Liu, E. (2025). Temperature Regulates BVOCs-Induced O3 Formation Potential Across Various Vegetation Types in the Sichuan Basin, China. Forests, 16(7), 1091. https://doi.org/10.3390/f16071091


