Article

Assessment and Prediction of Carbon Sink Resource Potential in Arbor Forests: A Case Study of Mentougou District, Beijing, China

School of Ecology and Nature Conservation, Beijing Forestry University, Beijing 100083, China
*
Author to whom correspondence should be addressed.
Forests 2025, 16(6), 926; https://doi.org/10.3390/f16060926
Submission received: 15 April 2025 / Revised: 26 May 2025 / Accepted: 30 May 2025 / Published: 31 May 2025
(This article belongs to the Special Issue Forest Monitoring and Modeling Under Climate Change)

Abstract

:
As the largest terrestrial carbon pool, forest ecosystems play a pivotal role in climate change mitigation through greenhouse gas regulation. This study estimated the carbon sequestration potential of arbor forests at the county-level scale in Mentougou District, Beijing, based on subcompartment vector data from forest surveys and employed the Intergovernmental Panel on Climate Change (IPCC) carbon stock–biomass difference methodology. Additionally, using 2020 as the baseline year, the research projected carbon sink potential and carbon sequestration–oxygen release values for 2030 and 2060 by applying the carbon stock change methodology and the carbon sequestration–oxygen release value methodology. The results showed that there is a total carbon stock of 2.198 million tonnes (Mt) C in Mentougou, with an average storage density of 33.4 t C/ha. Natural broadleaf forests constituted the dominant carbon pool (79.2%), followed by planted coniferous stands (11.9%), collectively accounting for 91.1% of the regional arboreal carbon storage. In the future, the district’s arboreal carbon stock is projected to reach 3.17 Mt C in 2030 and 4.82 Mt C in 2060, with cumulative sequestration reaching 0.97 Mt C and 2.63 Mt C, respectively. It is evident that the carbon storage dynamics in Mentougou were governed by three principal determinants: (1) natural broadleaf forests dominate carbon storage (1.559 Mt C) in Mentougou, exceeding planted coniferous stands by 6.7-fold; (2) carbon storage decreases progressively with younger age classes, while carbon density increases steadily with stand maturity; (3) mid-elevation slopes (600–1200 m) concentrate 48% of regional stocks, with shaded slopes being optimal carbon sinks, and slope position gradients reveal topography-driven carbon accumulation patterns, confirming scale-dependent material transport effects. The value of carbon fixation and oxygen release of existing arbor forests in Mentougou District was CNY 6.12 billion, and this is predicted to reach CNY 8.84 billion by 2030, with a further anticipated increase to CNY 13.45 billion by 2060. Our analysis provides empirical evidence and quantitative support for forestry carbon sink initiatives at the regional scale and thus promotes the achievement of dual-carbon goals proposed by the Chinese government.

1. Introduction

The negative impacts of global climate change have reshaped public perceptions of carbon, emphasizing global warming caused by greenhouse gas emissions as a shared challenge for humanity and highlighting the critical importance of enhancing carbon storage in Earth’s ecosystems and reducing carbon emissions to ensure sustainable social development [1,2,3]. Forest ecosystems are the largest organic carbon pool in terrestrial ecosystems, with high carbon density and fast carbon accumulation rates, contributing up to 80% of carbon sinks in terrestrial ecosystems [4,5]. By the end of 2020, China’s forest resources will reach 220 million hectares, and the carbon sequestration potential of forests will reach 9.2 Gt C [6], which has the functions of mitigating climate change, protecting biodiversity, and maintaining the balance of ecosystems, and plays a special role in responding to climate change. Forestry carbon sink projects can increase atmospheric carbon fixation through forest protection, restoration, and management measures, and the protection of primary forests and the restoration of damaged forests can effectively prevent the release of carbon, increase carbon sequestration capacity, and promote the health of forest ecosystems [7]. In addition, management measures such as rational inter-felling and afforestation can sustainably fix carbon dioxide in vegetation and soils, which can help to increase the forest’s carbon stock [8]. Increasing carbon stocks through ecosystem restoration and biodiversity conservation will improve the stability and permanence of carbon fixation.
In recent years, researchers have conducted numerous studies on the carbon sequestration capacity of forest vegetation at different scales. At the global scale, the total carbon sink of global forests outside agriculture and cities was calculated to be 328 Gt C based on a combination of ground and satellite data [9], while Bastin calculated the global forest carbon stock outside agriculture and cities to be 205 Gt C by generating a model of global forest restoration potential through field measurements [10]. At the national scale, Zhang et al. assessed and predicted the spatial pattern of carbon source and sink conversion based on the NEP, combining the maximum entropy model and the patch generation land use simulation model (PLUS) to predict that China’s terrestrial ecosystems will have a carbon stock of 23.58 Pg C in 2030 [11]; meanwhile, Peng et al. used the classical logistic equation and nonlinear fitting to obtain the maximum carbon stock of China’s forest vegetation of 19.03 Pg C [12]. At the regional scale, Li et al. used remote sensing estimation methods to account for 50.27 million tonnes of carbon sequestered by forest vegetation in state-owned forest farms in Shaanxi Province from 2000 to 2020 [13], while Chong et al. constructed a geographically weighted regression model based on the data of measured carbon density sampling points, combined with remote sensing variables such as vegetation index and texture index, to estimate the carbon stock of terrestrial ecosystems in Beijing, Tianjin, and Hebei in 2021 [14]. The carbon stock of terrestrial ecosystems in 2021 was estimated to be 2.18 × 10⁹ Mg [15]. Currently, under the background of global change mainly marked by the increase in atmospheric CO2 concentration, forest carbon sequestration and oxygen release services as an effective way to cope with climate change have attracted extensive attention from the international community [4], and the study of the value of carbon sequestration and oxygen release services can improve the understanding of the change law of ecosystem services in time and space, enhance the potential of forests to cope with climate change, and sustain sustainable regional development [16].
The current estimation methods of forest vegetation carbon stock mainly include the estimation method based on satellite remote sensing data, the estimation method based on process modeling, and the sample plot inventory method [17,18]. The first two methods can cover a wide geographical area at the macro-scale, but they cannot understand the surface characteristics at the small and medium scales, such as the county level, which leads to the low accuracy of the results, and they cannot be better integrated with the development of forestry carbon sink projects, which makes it difficult to provide effective forest management suggestions in the development and assessment of forest carbon sink resources in the county area. The sample plot inventory method is a method of estimating carbon stock based on the actual survey data of forest standard sample plots. Although the United Nations Intergovernmental Panel on Climate Change (hereinafter referred to as the IPCC method) in the sample plot inventory method ignores the accumulation of trees with a diameter at breast height (DBH) of less than 5 cm in the forest stand, making the results small, the method is simple to operate, can be used for micro- and macro-scale studies, and can also ensure the relationship between the accumulation and biomass. It is the most commonly used method for forest ecosystem carbon sink resource assessment in forestry carbon sink project development, as it ensures the coordination between stock and biomass.
Here, based on the IPCC method combined with the actual development scenarios of forestry carbon sink projects at the county scale in China, this study takes Mentougou District in Beijing as an example, assesses the carbon stock of its existing arbor forests based on the inventory data of forest resources in the region, and predicts the potential of carbon sinks and the value of carbon sequestration and oxygen release for 2030 and 2060 by using the method of change in carbon stock and the method of value of carbon sequestration and release of carbon and oxygen.

2. Materials and Methods
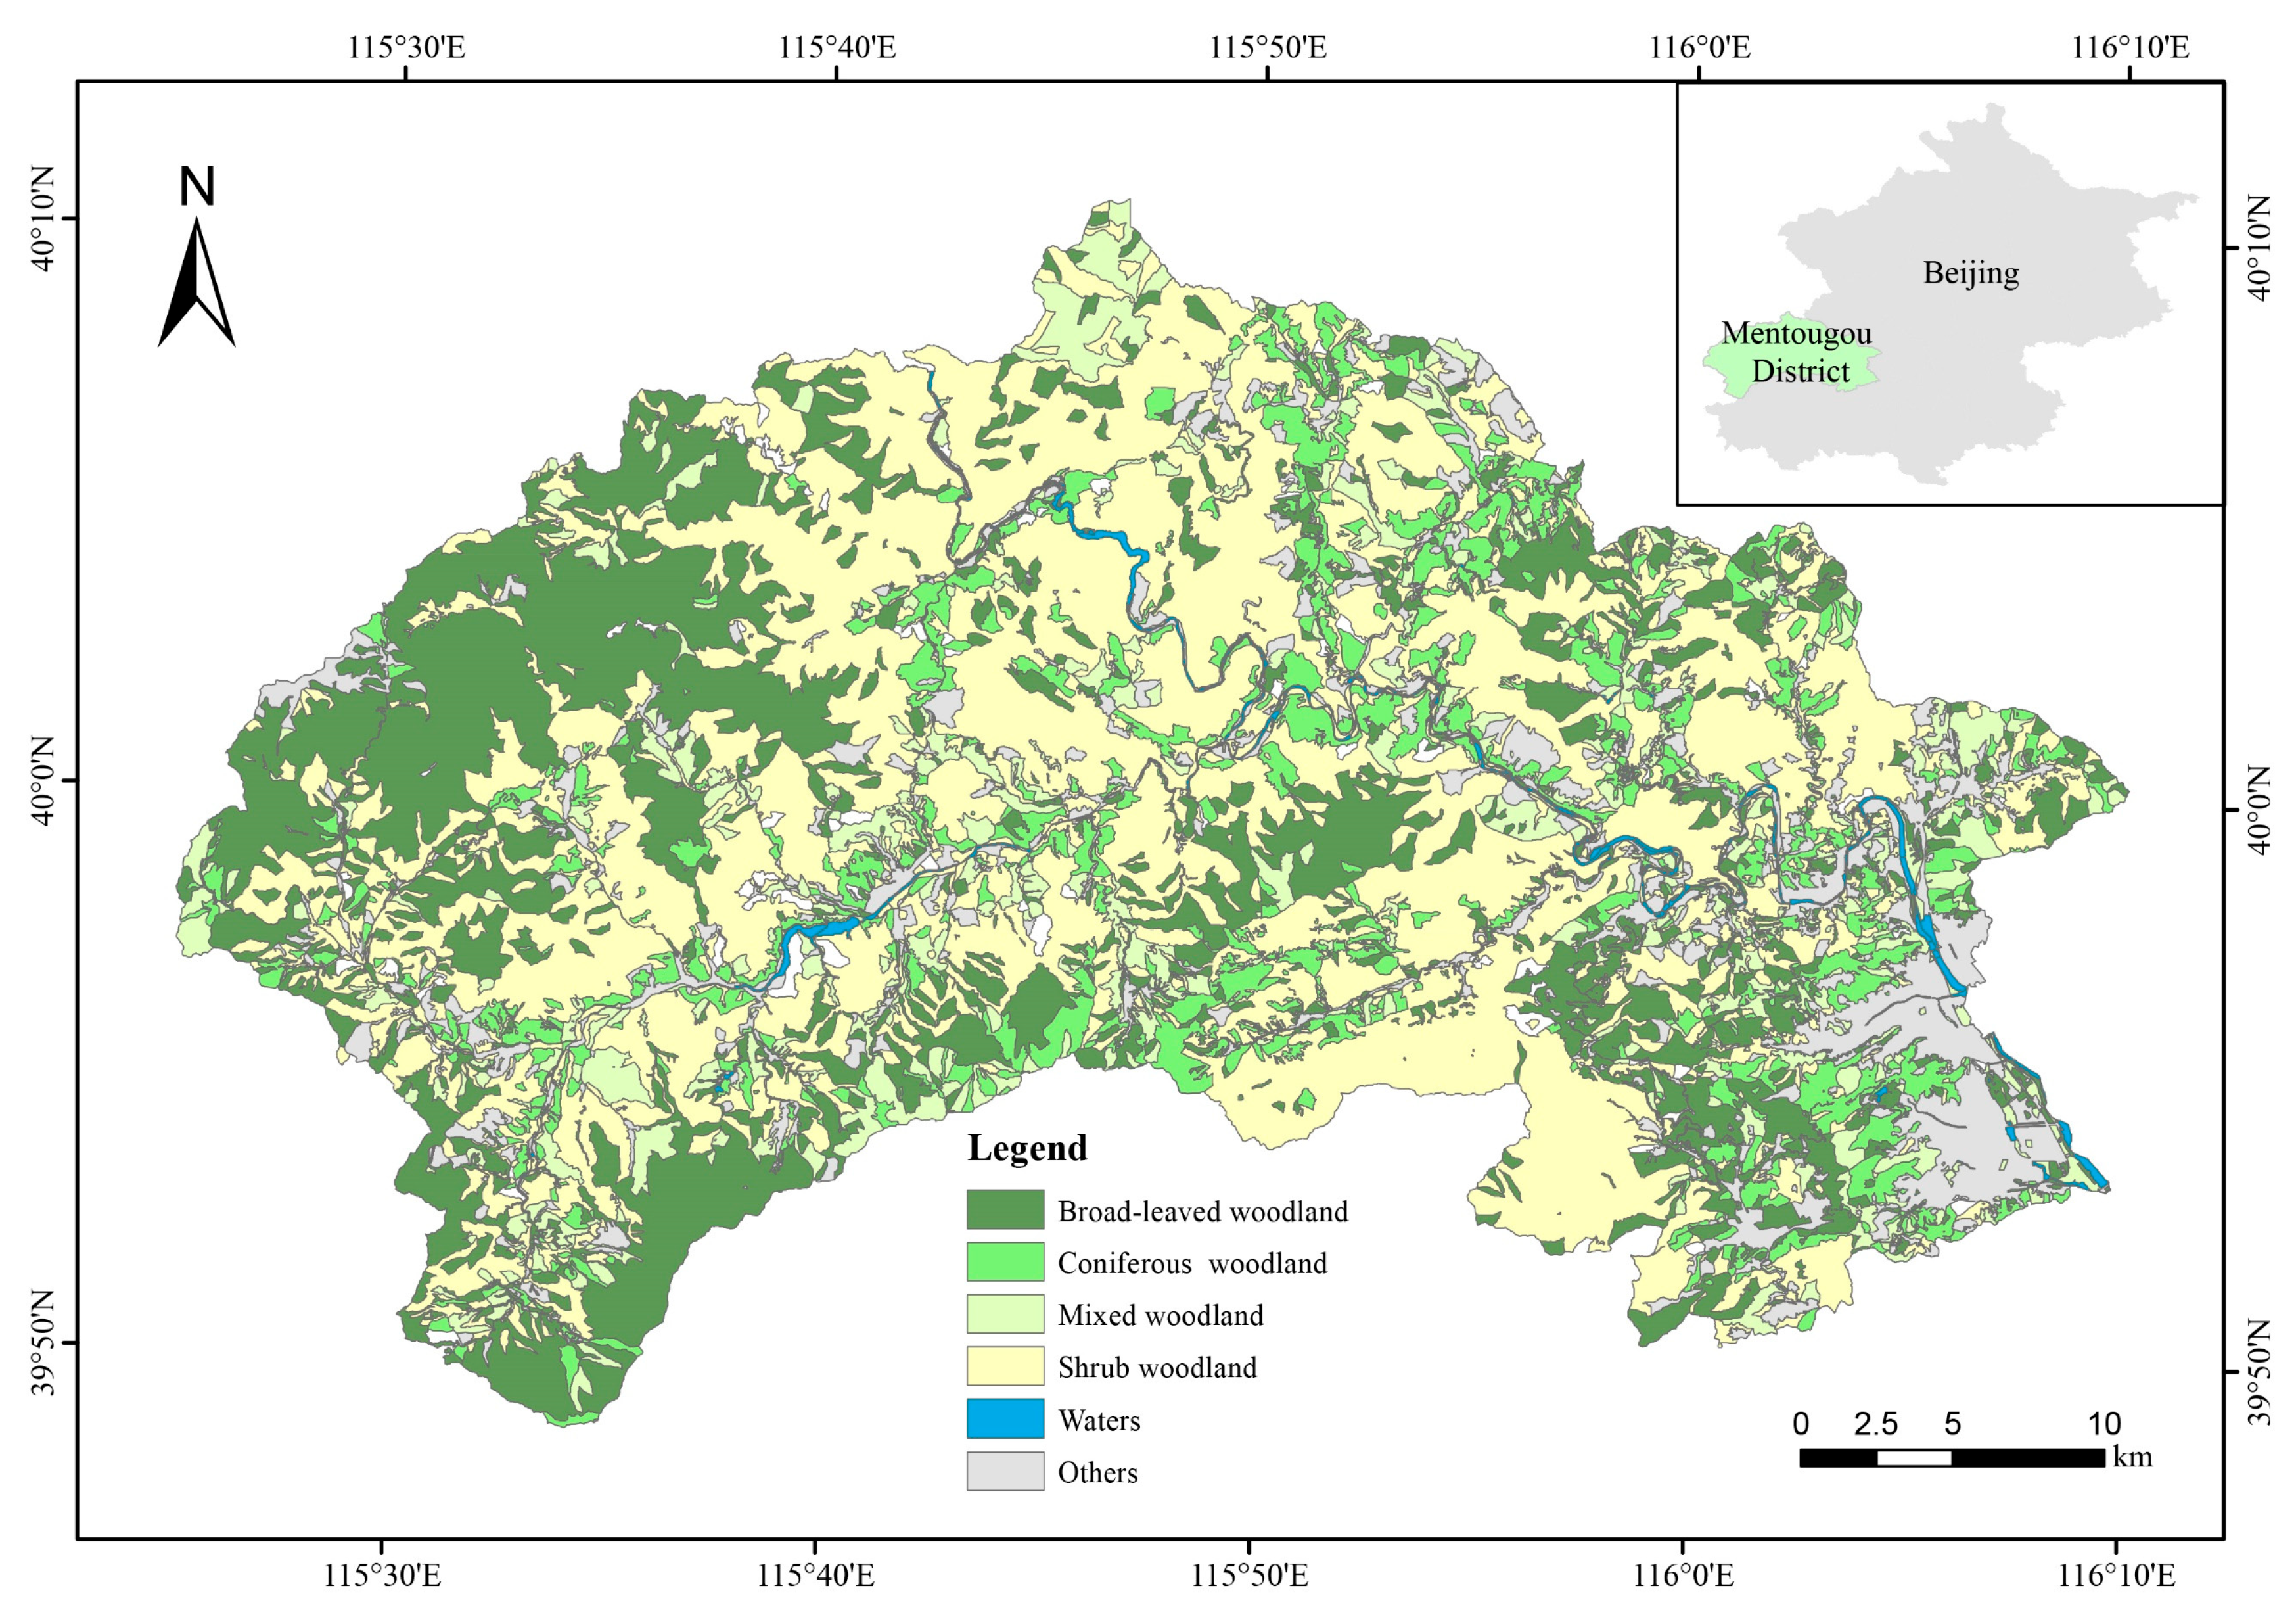
2.1. Study Area

Mentougou District is located in southwestern Beijing, 23 km away from the central city (Figure 1), covering an area of 1447.85 km2, with the terrain high in the northwest and low in the southeast, and with a jagged, stepped-up topography. It has a mid-latitude continental monsoon climate, with an average annual temperature of 10 °C, an annual precipitation of 600 mm, and four distinct seasons. The region benefits from favorable climatic conditions characterized by 2470 annual sunshine hours and a frost-free period averaging 200 days. This combination of abundant solar exposure and extended growing season creates optimal conditions for agricultural activities and outdoor cultivation [19]. The forest area in the district is 657.9 km2 with a forest cover rate of 45.4%, which belongs to the warm-temperate broad-leaved forest type, and the main tree species are ash (Fraxinus chinensis Roxb.), elm (Ulmus pumila L.), mountain poplar (Populus davidiana Dode), and acacia (Robinia pseudoacacia L.) [20].

2.2. Data Acquisition

The administrative division data of Mentougou District was obtained from a vector map of provinces, cities, and counties in China. The table of forest resource area distribution, area accumulation distribution of different forest types, and different age groups in Mentougou District was obtained from the Mentougou District Forest Resource Class II survey data (2020) provided by the Mentougou Landscaping and Greening Bureau; the parameters of biomass carbon metering of each tree species were cited in the ‘Study on the Greenhouse Gas Inventory of China in 2005’ [21] and supplemented and updated based on the existing literature and field measurement data (Table S1). Based on stand origin, forests in the study area were classified into natural forests and planted forests. According to vegetation types, they were further categorized into broadleaf forests, coniferous forests, and sparse forests. A stratified sampling method was employed to select 45 representative sample plots across the study area. To ensure sample representativeness, at least three 20 m × 20 m standard quadrats were established for each vegetation type. Detailed geographical coordinates, altitude, slope, and dominant tree species within the quadrats were recorded. Subsequently, tree-by-tree measurements were conducted to systematically measure and record growth parameters—including tree height, diameter at breast height (DBH), and crown width—for every individual tree within the quadrats. The current forest vegetation cover of Mentougou District is 65,790.55 ha, and based on the age group, tree forests can be classified into young forests (42,595.04 ha), medium-aged forests (14,114.13 ha), near-mature forests (4704.72 ha), mature forests (3718.10 ha), and over-mature forests (658.56 ha).
The digital elevation model (DEM), serving as fundamental geospatial data characterizing three-dimensional terrain morphology, has been extensively applied in topographic parameter extraction, watershed hydrological modeling, and land cover classification. Its core strength lies in accurately characterizing terrain undulations and local topographic features through three-dimensional elevation representation, providing foundational support for quantitative derivation of slope gradient, aspect, and topographic position parameters. This study employs NASA’s 30 m resolution DEM dataset accessed via the Google Earth Engine (GEE) platform, primarily for quantitative analysis of spatial distribution patterns in vegetation carbon stocks and density within the study area.

2.3. Data Analysis

2.3.1. Carbon Stock Calculation

This study is based on the Intergovernmental Panel on Climate Change (IPCC) method, which has the advantages of accuracy, simplicity, and high efficiency, and can be used in different scales through appropriate transformations. In order to further improve the calculation accuracy of the results, this study calculates the biomass of each dominant tree species (group) based on the age classes, and the carbon stocks of natural forests and planted forests can be calculated by the summing of carbon stocks of each age class of different stand origins. The basic idea is to calculate the biomass of each dominant tree species through the biomass expansion factor on the basis of the stock of each age class of the dominant tree species in the tree forest. The carbon content of each tree species (group) is used to calculate the carbon stock of each small group, and the sum of the carbon stocks of each small group is the total carbon stock.
Calculation of biomass carbon stock in arbor forests is performed by taking the small class of forest management as the basic unit and classifying according to the dominant tree species. Then, based on the data of volume and age per unit area of arbor forest, we constructed the logistic fitting equation of volume density and age of each major dominant tree species (Table S2) [22], and the calculation formula is as follows:
f V j = a j 1 + b j · e c j · t j
In Formula (1), f(Vj) is the stock density of the dominant tree species; aj, bj, and cj are relevant constants of the relationship between the stock density of the tree species and the forest age (Table S2); and tj is the forest age of the dominant tree species. Formula (1) was extended and combined with the biomass expansion factor method (Formula (2)) to estimate the carbon density and carbon stock of each small class [23], which was calculated as follows:
f F C = i = 1 n j = 1 m k = 1 k A i j k · a j 1 + b j · e c j · t j + t · S V D j · B E F j · 1 + R S R j · C F j
In Formula (2), f(FC) is the biomass carbon stock of the arbor forests, Aijk is the area of the first age group of the tree species in the small class, SVDj is the basic wood density of the tree species, BEFj is the biomass expansion factor of the dominant tree species, RSRj is the ratio of belowground biomass to aboveground biomass of the dominant tree species, and CFj is the biomass carbon rate of the tree species, which is set to 0.5, derived from the Fourth Assessment Report of the Intergovernmental Panel on Climate Change (https://archive.ipcc.ch/publications_and_data/ar4/wg3/en/contents.html, accessed on 28 March 2025). The calculation of litter carbon stock was carried out using the ratio of litter biomass to aboveground biomass of forest land provided by the IPCC [24], with the formula below.
f D F j = A j · f A G B j · D R D F · C F D F
In Formula (3), f(DFj) is the carbon stock of the litter; Aj is the area of the tree species j; f(AGBj) is the aboveground biomass density of the tree species; DRDF is the ratio of litter biomass to aboveground biomass, which is set to 4%; and CFDF is the carbon content of the litter, which is set to 0.37. Both values were derived from the Fourth Assessment Report of the Intergovernmental Panel on Climate Change.

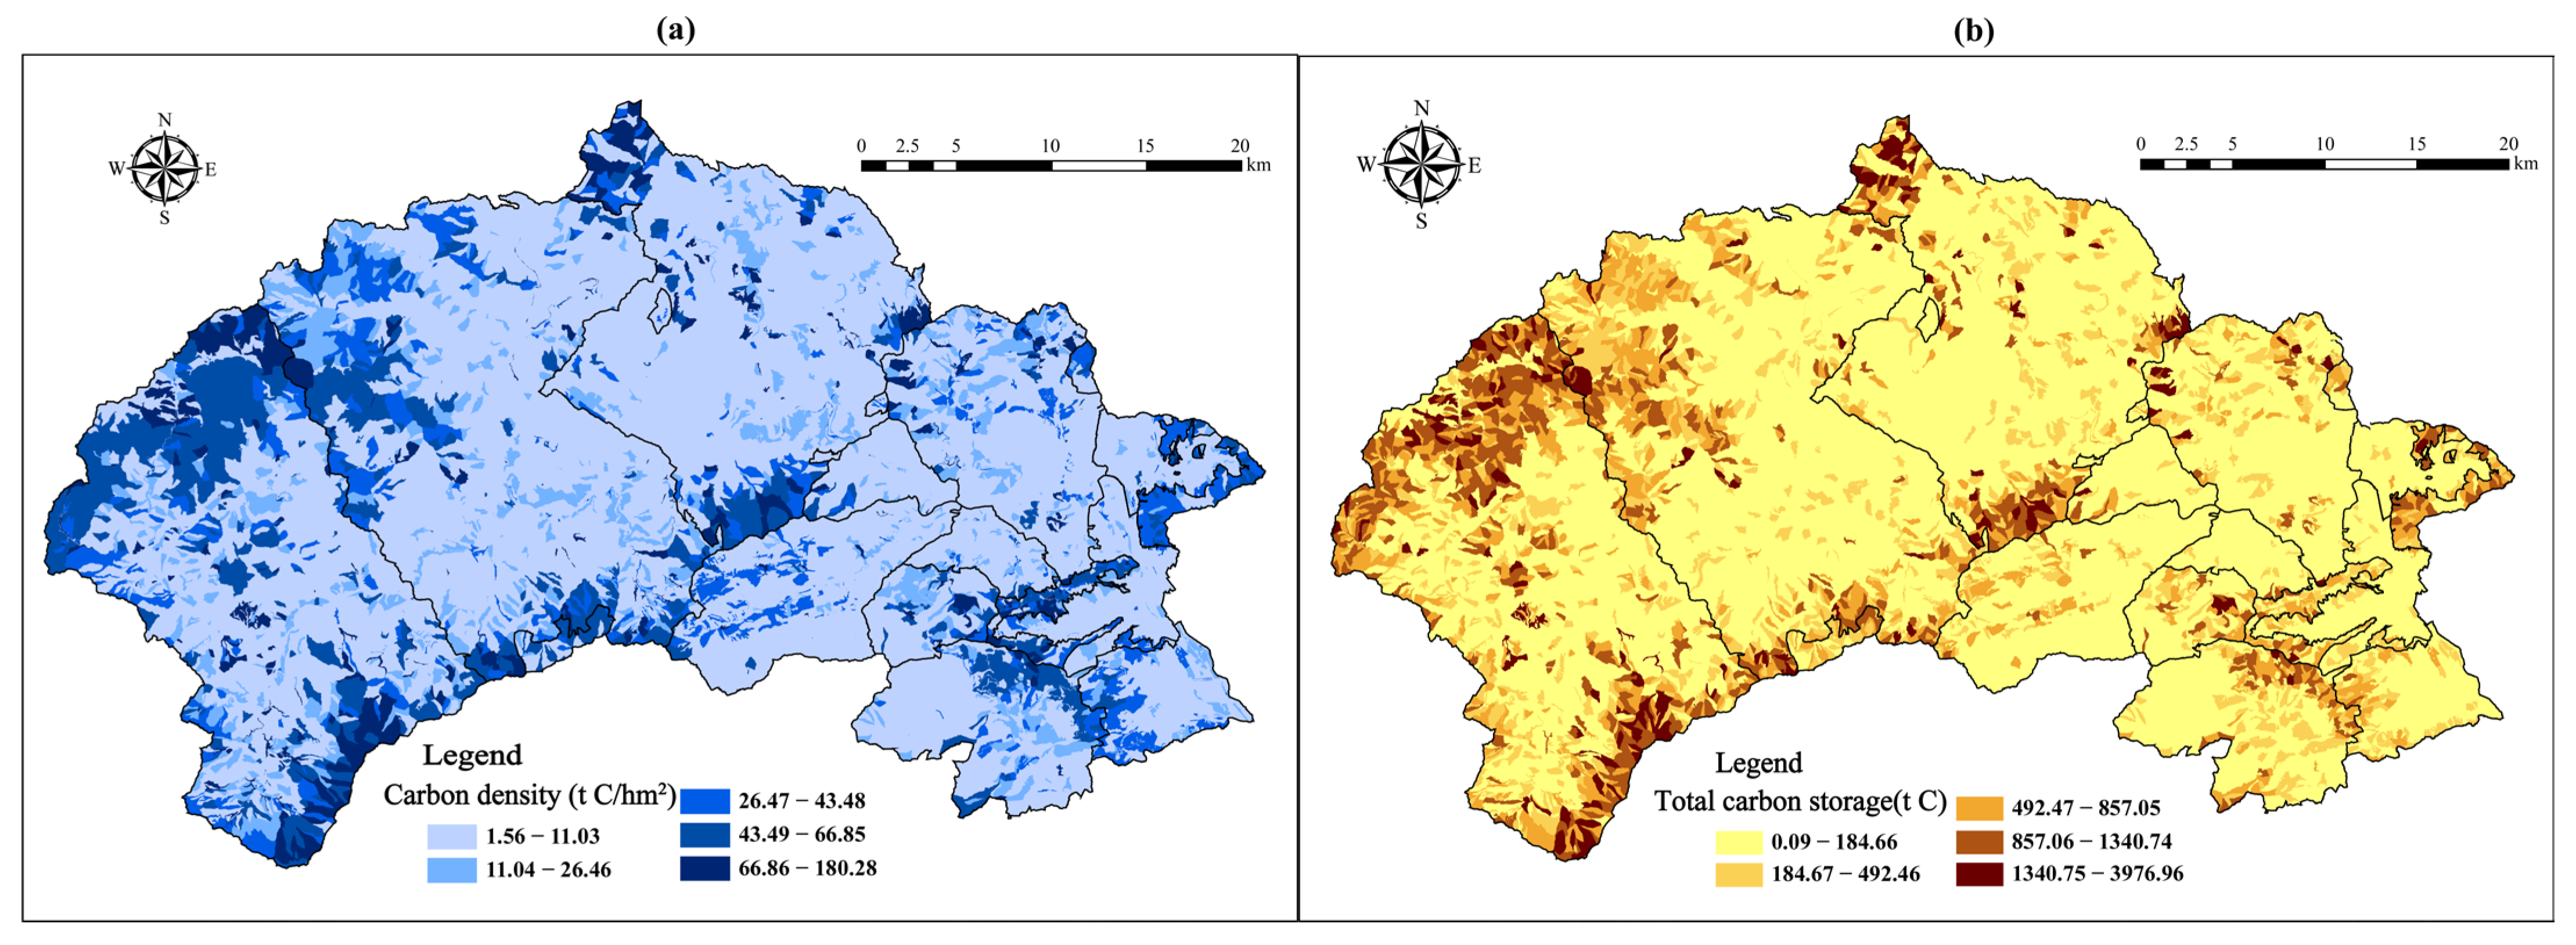
2.3.2. Spatial Heterogeneity in the Distribution of Vegetation Carbon Stocks and Carbon Density

Utilizing geographic information system (GIS) platforms, this study integrates subcompartment vector data with digital elevation models (DEMs) to quantitatively analyze spatial distribution patterns of vegetation carbon stocks and density. The study area, spanning 0–2400 m in elevation (Figure 2a), was stratified into four elevation gradients using 600 m equal intervals: 0–600 m, 600–1200 m, 1200–1800 m, and 1800–2400 m. Slope gradients were classified into five categories (Figure 2b) based on geomorphic characteristics: gentle (0–5°), moderate (6–25°), steep (26–40°), abrupt (41–50°), and precipitous (51–85°). Aspect orientations were divided into five azimuthal classes: flat terrain (−1–+1°), north-facing slopes (+1–45°, 315–360°), semi-shaded slopes (45–135°), south-facing slopes (135–225°), and semi-sunny slopes (225–315°). Topographic positions were categorized into six types: upper slope, middle slope, lower slope, valley, ridge, and flat slope, forming the basis for spatial heterogeneity analysis.

2.3.3. Carbon Sink Projections

The prediction of carbon sinks in arbor forests is based on the estimation of carbon sinks in existing arbor forests on the basis of the small class data from the Mentougou District Forest Resources Survey in 2020, assuming that there will be no change in the area and species of each small class of existing forests in the future, and that no deforestation and other activities will occur. Based on the statistically identified dominant tree species in arbor forests, classified by stand origin and stand age, the carbon stock change methodology was applied to calculate the carbon sink for each subcompartment from 2020 to 2030 and from 2020 to 2060.
The stock change approach of carbon is used to calculate the carbon sink potential of arbor forests in the future with the formula below.
j = 1 S C y j , 1 2 = j = 1 S C j , y 2 S C j , y 1 T y 2 T y 1 · 44 12
In Formula (4), ∆SCyj,1–2 is the carbon sink generated by the carbon pools of aboveground and belowground biomass of a dominant tree species from the year y1 to y2; Ty1 and Ty2 are the years y1 and y2 of the prediction period, respectively; SCj,∆y1 and SCj,∆y2 are the sums of carbon stocks generated by the aboveground and belowground biomass of the dominant tree species in the years y1 to y2, respectively; 44/12 is the ratio of molecular weights of CO2 to C.

2.3.4. Accounting for the Value of Carbon Sequestration and Oxygen Release

Based on the Specification for the Assessment of Forest Ecosystem Service Functions [25], the calculation of carbon sequestration and oxygen release in arbor forests and the value are shown in the formulas below.
V = V c × G c + V o × G o
G c = A × 1.63 × R c × C v × x
G o = 1.19 × A × C v × x
In the formulas, V is the value of forest carbon sequestration and oxygen release (CNY), Vc denotes the price of carbon sequestration of 512.17 CNY/t, Vo is the price of oxygen of 979.87 CNY/t [26], Gc and Go are the amount of carbon sequestration and oxygen release (t), respectively, Cv is the net productivity of the forest stand (Mg·hm−2·a−1), A is the area of the forest (ha), x is the age of the tree (year), and Rc is the ratio of the relative molecular masses of carbon to carbon dioxide, with a calculated value of 27.27%.

3. Results

3.1. Carbon Stocks and Sinks of Arbor Forests in Mentougou District

3.1.1. Estimation of Carbon Stocks and Carbon Intensity Based on Different Carbon Pools

In 2020, the total carbon stock of arbor forests in Mentougou District reached 2.198 million tonnes (Mt) C (Figure 3b), exhibiting pronounced spatial heterogeneity in carbon pool composition. The aboveground biomass carbon pool dominated with 1.19 Mt t C (54.1% of total), reflecting the predominant contribution of canopy biomass accumulation to carbon sequestration. The belowground biomass carbon pool contained 313,000 t C (14.2%), demonstrating the foundational role of root systems in carbon stabilization, while the litter carbon pool constituted 695,000 t C (31.7%), highlighting its regulatory function in soil carbon cycling through decomposition processes. This structural pattern of “aboveground dominance with belowground-litter synergy” aligns with temperate forest ecosystem carbon allocation principles while manifesting vegetation structural characteristics shaped by regional plantation management practices. The average forest carbon density was 33.4 t C/ha (Figure 3a), with aboveground and belowground carbon densities of 18.1 Mg C ha−1 and 4.8 Mg C ha−1, respectively. This spatial heterogeneity in carbon sequestration functionality informs differentiated ecological management strategies: steep slopes require enhanced litter retention measures to mitigate carbon loss risks, while gentle terrains should optimize stand structures to enhance aboveground carbon accumulation efficiency.

3.1.2. Carbon Stock and Carbon Density Analysis of Different Vegetation Types

The study area contains 36,257.6 ha of natural forests, demonstrating significantly higher mean carbon density (45.8 t C/ha) compared to plantations (21 t C/ha), with natural forests exhibiting 2.18-fold greater carbon storage capacity. In terms of absolute carbon stocks, natural forests accumulated 1,589,000 t C, surpassing plantation stocks (609,000 t C) by a factor of 2.61. Vegetation-type analysis reveals natural broadleaf forests (1.559 Mt C) and planted coniferous forests (445,000 t C) collectively account for over 90% of regional carbon storage (Table 1), while planted broadleaf forests, natural coniferous forests, natural sparse forests, and planted sparse forests show comparatively lower contributions. Notably, carbon density varies substantially among vegetation types, with natural coniferous forests achieving the maximum density (64.8 t C/ha), followed by natural broadleaf forests (43.3 t C/ha), both significantly exceeding other vegetation categories.

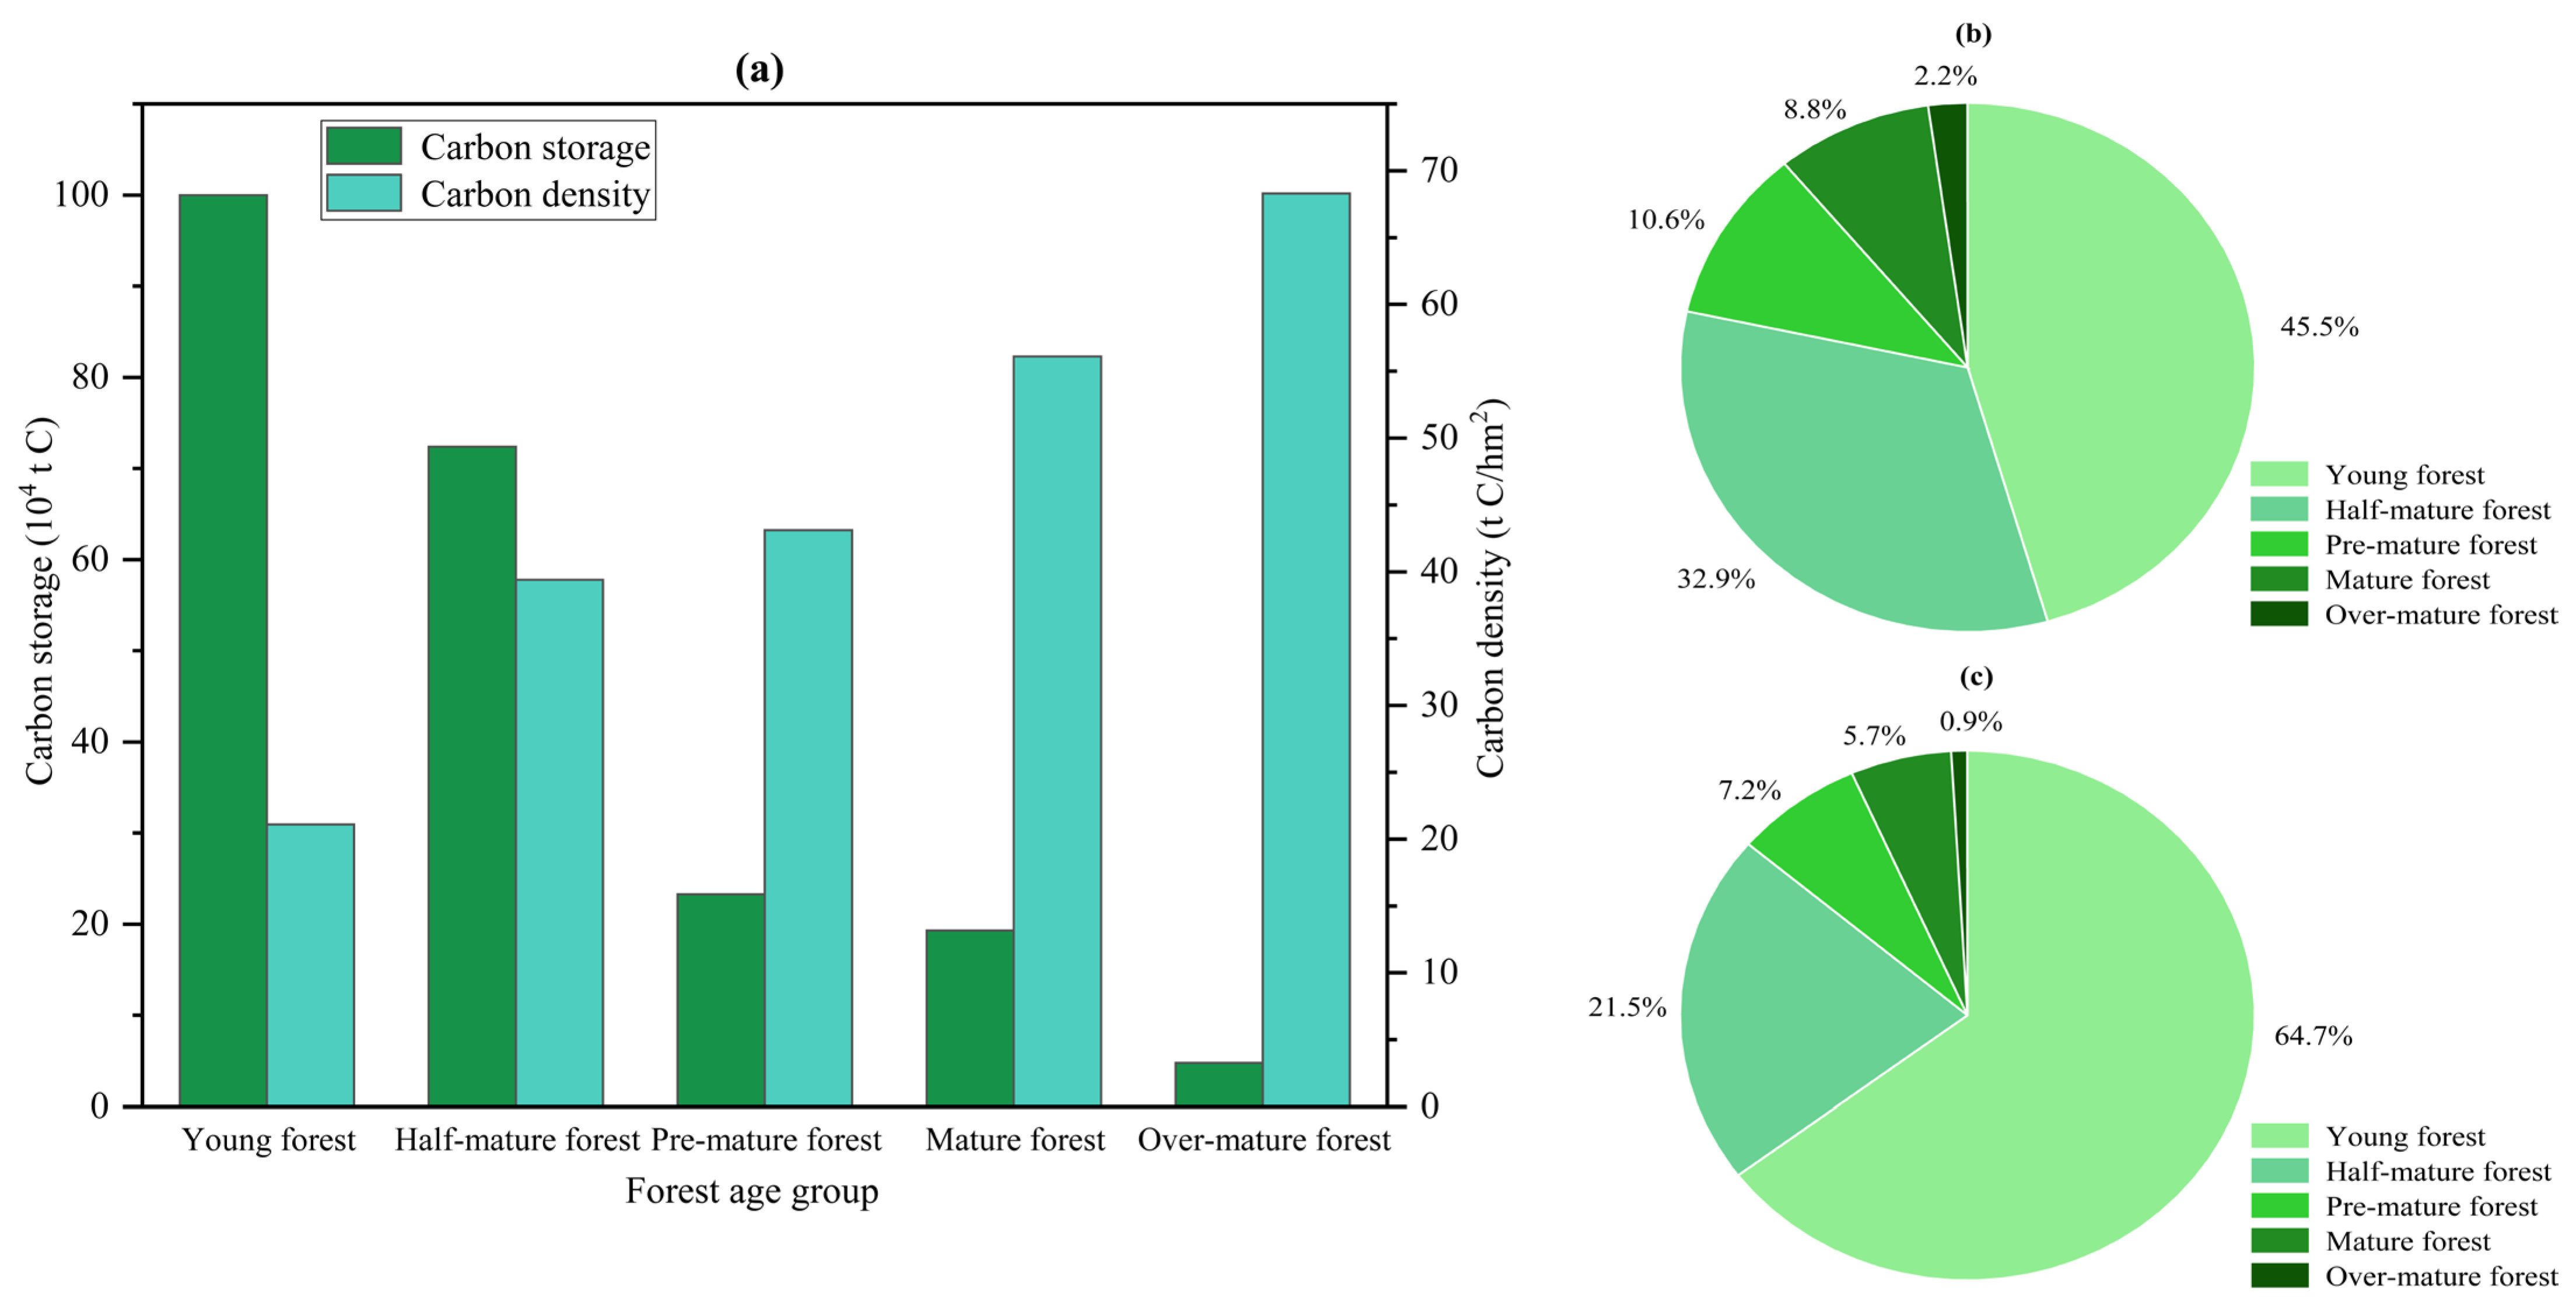
3.1.3. Characteristics of Carbon Stock and Carbon Density Distribution of Arbor Forests Among Different Age Groups

Forest age affects the carbon stock and carbon density of arbor forests to a certain extent. In Mentougou District, young forests dominated the tree forests, accounting for 64.7% of the total area of tree forests in the district, and their carbon stock accounted for 45.5% of the total carbon stock; young forests were followed by middle-aged forests, near-mature forests, mature forests, and over-mature forests, which accounted for 21.5%, 7.2%, 5.7%, and 0.9% of the total area of tree forests in the district, respectively, and their corresponding carbon stock accounted for 32.9%, 10.6%, 8.8%, and 2.2% (Figure 4). The carbon stocks of tree forests of different age groups varied greatly, and the young forest with the largest carbon stock was 20.68 times larger than the over-mature forest with the smallest carbon stock. In terms of average carbon density, the average carbon density of the tree forests in 2020 was 33.4 tonnes of carbon per hectare, but there were large differences in the carbon density of the tree forests in different age groups. The carbon densities of young, middle-aged, near-mature, mature, and over-mature forests were 21.1 t C/ha, 39.4 t C/ha, 43.1 t C/ha, 56.1 t C/ha, and 68.3 t C/ha, respectively, and the corresponding carbon stocks were 1.0 Mt C, 724,000 t C, 233,000 t C, 193,000 t C, and 48,000 t C, respectively (Figure 4). The average carbon density showed a trend of increasing with the age of the forest.

3.2. Analysis of Factors Affecting Carbon Stocks and Carbon Intensity

3.2.1. Analysis of Carbon Stocks and Carbon Density at Different Altitudes

The arbor forest carbon stocks in the study area exhibit distinct elevational distribution patterns (Table S3). Approximately 98% of total carbon storage occurs at an elevation below 1800 m, with maximum accumulation (1.063 Mt C, 48%) in the 600–1200 m zone. Subsequent contributions derive from 1200–1800 m (607,000 t C, 27%) and <600 m (506,000 t C, 23%) gradients, while the high-elevation zone (1800–2400 m) shows minimal storage. Carbon density displays an elevational increase, peaking at 67.7 t C/ha in 1800–2400 m, followed by 47.8 t C/ha in 1200–1800 m. Comparative analysis reveals that natural broadleaf forests are predominantly distributed in mid-elevation ranges (600–1800 m), whereas planted coniferous forests are concentrated in lower elevations (0–1200 m).

3.2.2. Analysis of Carbon Stocks and Carbon Density at Different Slopes

The slope gradient analysis (Table S4) identifies moderate slopes and steep slopes as primary carbon sink carriers, contributing 1.044 Mt C (47%) and 942,000 t C (42%), respectively, collectively accounting for 89% of total carbon storage. This reflects the topographic advantages of moderate–steep slopes in promoting forest carbon accumulation through optimized hydrothermal regimes and enhanced soil development. Gentle, abrupt, and precipitous slopes show limited contributions due to restricted area availability or harsh edaphic conditions. Carbon density demonstrates slope-dependent characteristics: steep slopes achieve the maximum (35.9 t C/ha), attributed to biomass densification driven by terrain-induced vertical growth stress in arbor species; moderate slopes exhibit 29.9 t C/ha, correlating with homogeneous stand structures from plantation intensive management; abrupt slopes record the minimum (25.7 t C/ha), likely constrained by organic matter loss through soil erosion.
Slope suitability analysis of vegetation types reveals divergent patterns: natural broadleaf forests—the core carbon sink component—concentrate 49% of their carbon stocks on steep slopes and 41% on moderate slopes, highlighting ecological adaptation advantages of deep-rooted species in rugged terrains. Conversely, planted coniferous forests display pronounced slope selectivity, with 69% of their carbon stocks clustered in moderate slopes, reflecting spatial allocation strategies balancing terrain accessibility and silvicultural costs in afforestation projects. This differentiated spatial configuration elucidates synergistic mechanisms between natural selection and anthropogenic intervention shaping carbon sink patterns: steep slopes maintain high-density carbon stabilization through natural forest ecosystems, while moderate slopes achieve carbon increment via scaled plantation expansion. Together, these complementary systems form the spatial scaffolding of forest carbon sequestration functionality.

3.2.3. Carbon Stock and Carbon Density Analysis Based on Different Slope Orientations

Aspect-based differentiation analysis of arbor forest carbon stocks in the study area (Table S5) reveals significant spatial heterogeneity in aspect-oriented carbon distribution. North-facing (shaded) and semi-shaded slopes constitute primary carbon reservoirs, collectively accounting for 62.9% of total carbon storage: north-facing slopes contain 816,000 t C (37.1%), followed by semi-shaded slopes with 567,000 t C (25.8%). South-facing (sunny) and semi-sunny slopes collectively contribute 37.1%, while flat terrain shows negligible carbon stocks. Carbon density demonstrates aspect-driven stratification, with north-facing slopes exhibiting the highest value (33.9 t C/ha), followed by decreasing gradients in semi-sunny (30.5 t C/ha) and south-facing slopes (29.3 t C/ha).
Further analysis indicates natural broadleaf forests display multi-aspect distribution patterns, predominantly occupying north-facing, semi-shaded, and semi-sunny slopes. Notably, their carbon density values in sunny/semi-sunny aspects surpass those in shaded counterparts. In contrast, planted coniferous forests concentrate 84% of their stocks on shaded/semi-shaded slopes, with correspondingly higher aspect-specific carbon densities compared to sunny exposures. This aspect-dependent carbon density heterogeneity underscores adaptive differentiation of forest types to topographic environments; natural broadleaf forests demonstrate light optimization strategies across aspects, while managed coniferous plantations exhibit photic stress avoidance behavior through aspect selection.

3.2.4. Carbon Stock and Carbon Density Analysis Based on Different Slope Positions

Analysis of slope position effects on forest carbon stocks and density (Table S6) reveals significant spatial heterogeneity across topographic gradients. Total carbon storage displays a hierarchical distribution: upper slopes (1.054 Mt C) > mid-slopes (678,000 t C) > lower slopes (356,000 t C) > valleys (66,000 t C) > flat terrain (41,000 t C) > ridges (3000 t C), aggregating to 2.198 Mt C, demonstrating terrain-driven regulatory control over carbon accumulation. Carbon density spatial differentiation diverges from stock patterns; valleys (38.9 t C/ha) and ridges (38.7 t C/ha) exhibit maximum densities despite minimal stock contributions, suggesting micro-terrain units may form high-density carbon niches through hydrothermal redistribution.
The carbon sequestration capacity of natural and planted forests exhibits systematic differentiation across topographic gradients. Natural broadleaf forests dominate both in carbon stocks (35.3% of regional total) and density (43.5–53 t C/ha), with peak density occurring in valleys (53 t C/ha), likely attributable to deep soils and nutrient enrichment in valley bottoms. Planted systems demonstrate functional divergence: planted broadleaf forests concentrate stocks in mid–upper slopes (78,000 t C) but show lower density (24.1–37.9 t C/ha); planted coniferous forests, despite accumulating 219,000 t C on upper slopes, achieve merely one-third of the density (16.9–36.4 t C/ha) of natural coniferous forests (59.4–70.3 t C/ha), reflecting the inhibitory effects of monoculture management on carbon density. Degraded stands (natural/planted sparse forests) exhibit minimal stocks (1000–5000 t C) and carbon intensity generally below 15 t C/ha, except for planted sparse forests in flat terrain (34.1 t C/ha), indicating severely compromised carbon sequestration functionality. This spatial differentiation provides critical scientific basis for precision carbon management: prioritization of conservation of natural forests in carbon density hotspots (valleys/ridges), optimization of planted forest configurations on mid–upper slopes, and implementation of ecological restoration of degraded stands.

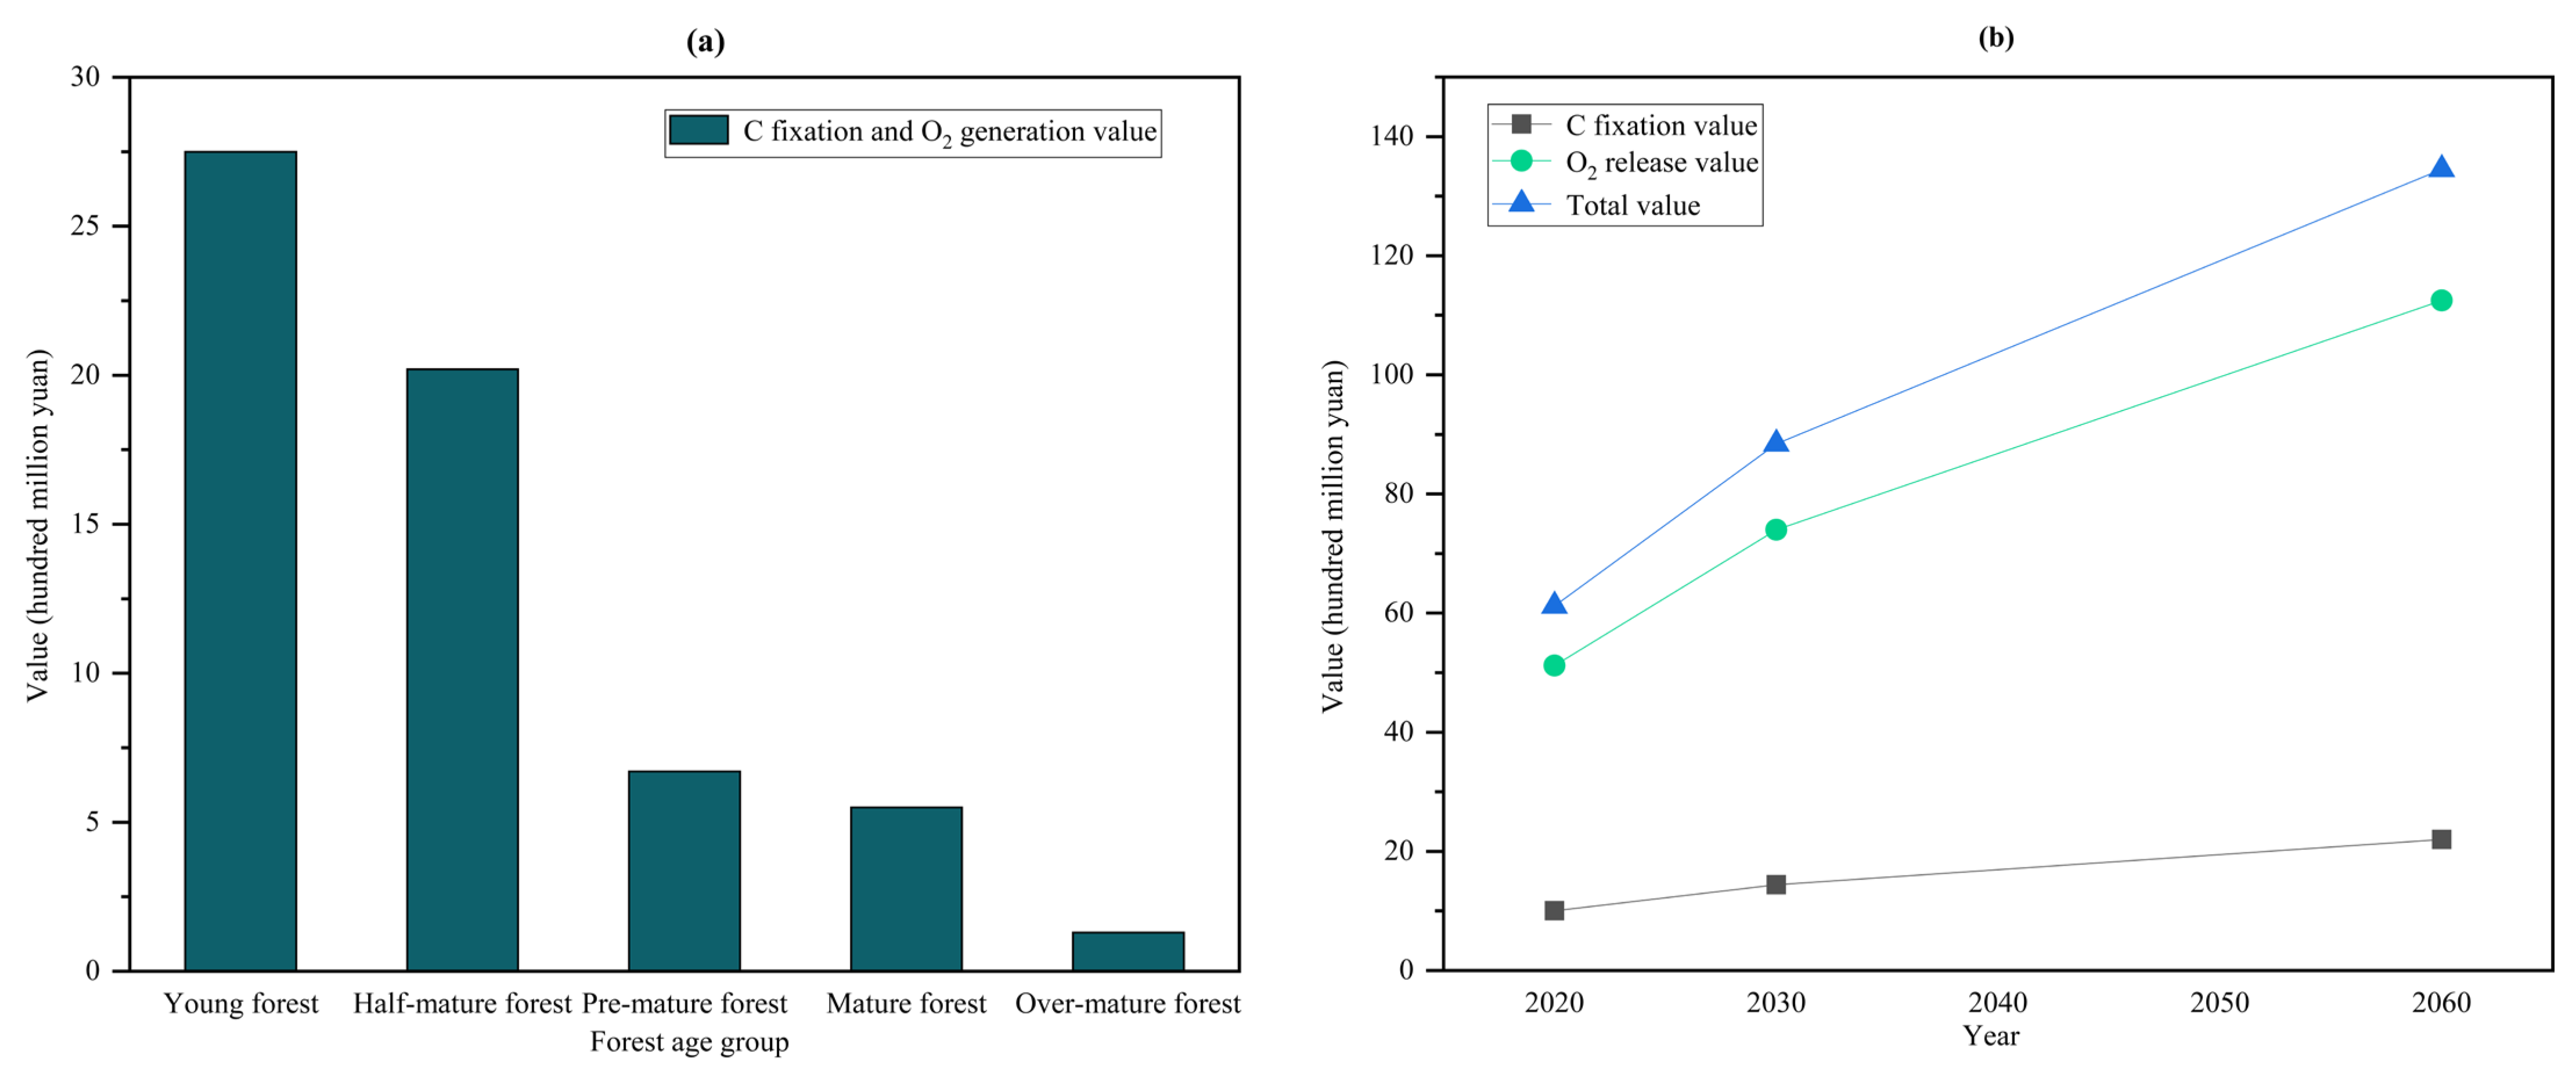
3.3. Forecast of Carbon Stocks and Sink Potential in Mentougou District

Projections based on carbon stock change methodology indicate sustained enhancement of carbon sequestration capacity in Mentougou’s arbor forests, demonstrating significant temporal cumulative effects (Figure 5a). Forecasts predict regional carbon stocks will exceed 3.17 Mt C by 2030, representing a 42.7% net increase from the 2020 baseline (2.198 Mt C). Natural forest systems are projected to contribute 2.348 Mt C (74.1%), while plantations account for 822,000 t C (25.9%), with cumulative sequestration of natural forests (759,000 t C) being 3.56-fold higher than plantations (213,000 t C), underscoring their central driving role in mid-term carbon sink growth. By the 2060 carbon neutrality target year, stocks are anticipated to reach 4.824 Mt C—a 115.4% increase from 2020 levels. Natural and planted forests are expected to form 3.349 Mt C (69.4%) and 1.475 Mt C (30.6%), respectively, with their cumulative sequestration disparity expanding to 2.03-fold (1.76 Mt C vs. 866,000 t C). This trajectory reveals the irreplaceable ecological resilience of natural forests in long-term carbon sequestration, while plantation carbon sinks, though growing at moderated rates, still provide crucial incremental support for regional carbon peaking through scaled expansion.
The carbon sequestration potential of different biomass pools exhibits pronounced temporal heterogeneity and functional complementarity (Figure 5b). By 2030, aboveground biomass is projected to lead growth with a cumulative increment of 555,000 t C (46.6% increase from 2020), primarily stemming from continuous canopy biomass accumulation. Synergistic growth in belowground biomass (154,000 t C, 49.2% increase from 2020) and litter pools (263,000 t C, 37.8% increase from 2020) reflects enhanced soil carbon stabilization through root system development and litter layer expansion. Long-term projections (2060) reveal structural divergence in growth rates: aboveground carbon sequestration reaches 1.238 Mt C (104% increase from 2020), with decelerated growth indicating stand maturation; belowground pools maintain parallel growth (335,000 t C, 107% increase from 2020) via root network optimization, while litter pools achieve leapfrog enhancement (1.053 Mt C, 151.5% increase from 2020) attributed to increased litter input from aging stands and reduced decomposition rates. Notably, the litter pool’s disproportionate expansion (21.8% of total by 2060) disrupts traditional aboveground-dominated sequestration patterns, necessitating forest management transitions from singular biomass regulation to holistic carbon pool optimization. This underscores urgent needs for developing slope-specific litter retention technologies, particularly in steep terrain, to mitigate carbon re-release risks from geomorphic disturbances. These multi-pool synergistic dynamics provide scientific foundations for formulating full-lifecycle carbon enhancement strategies.

3.4. Oxygen Sequestration Value of Arbor Forests in Mentougou District

In 2020, the total value of carbon and oxygen sequestration in arbor forests in Mentougou District was CNY 6.12 billion, of which the value of carbon and oxygen sequestration in natural forests was CNY 4.43 billion and that in plantation forests was CNY 1.69 billion. Based on the division of arbor forests into age groups, the value of carbon and oxygen sequestration in young forests, middle-aged forests, near-mature forests, mature forests, and mature forests was CNY 2.75 billion, CNY 2.02 billion, CNY 0.67 billion, CNY 0.55 billion, and CNY 1.33 billion, of which young forests accounted for 44.9% of the total value. The value of carbon and oxygen sequestration in tree forests is predicted to reach CNY 8.84 billion and CNY 13.45 billion in 2030 and 2060, respectively, an increase of 44.4% and 119.8%, so the value of carbon and oxygen sequestration has a large potential for growth (Figure 6).

4. Discussion

In this study, the carbon stock of arbor forests in 2020 was calculated to be 2.198 Mt C based on the forest inventory data in Mentougou District, and the average annual carbon sink from 2020 to 2030 was 97,000 t C/year. Zeng et al. measured the carbon sink of the forest vegetation in 2020 in Mentougou District as 94,000 t C/year based on the photosynthesis rate method, which is slightly lower than the results of the present study [27]. One study has indicated that the average carbon density of China’s arbor forests in 2020 was 37.3 t C/ha [28], while the average carbon density of arbor forests in our study area in 2020 was 33.4 t C/ha, which was slightly lower than the national average carbon density of arbor forests in China during the same period and slightly lower than the average carbon density of the forest in Beijing during the same period, which was 34.35 t C/ha [29]. In summary, the results of this study are relatively accurate and reflect the actual situation of carbon stock and carbon density of arbor forests in Mentougou District, Beijing.
Forest age is a key factor affecting forest carbon stocks [30,31]. In the study area, the carbon sequestration rate and carbon density of middle-aged and young forests were low until they peaked at the stage of near-mature and mature forests, and with the increase of forest age, the average carbon density increased accordingly. In other words, there was an obvious positive correlation between age group and carbon density, which was consistent with previous studies [32]. In Mentougou District, the area proportion of middle-aged and young forests reached 86.2%, the storage capacity per unit area of arborvitae forests was 50.9 m3/ha, and the average carbon density and storage capacity per unit area were relatively low. If the study area is still dominated by middle-aged and young forests with low carbon densities, while the proportion of near-mature forests and mature forests with high carbon densities is relatively low, it will lead to a slower growth rate of forest carbon stocks in the region [15]. Therefore, when strengthening the nursery management of existing middle-aged and young forests, giving priority to the growth of near-mature forests and mature forests and optimizing the age group structure is the key to promoting the construction and sustainable development of forestry carbon sink projects [33].
Forest stand origin directly affects forest carbon density, which is one of the important evaluation indexes of forest carbon sink function and quality, by influencing the species composition, structure, and growth rate of forests [34]. In 2020, the average carbon density of natural forests in Mentougou District, Beijing, was 43.8 t C/ha, in which the value is lower than the national average of 49.85 tC/ha for natural forests during the same period [28], below the 48.75 t C/ha projected for China’s natural forests by Fang et al. [35] and also less than the 51.18 t C/ha estimated for arborvitae forests in Yunnan Province by Li Haikui et al. [36]. The primary reason for this discrepancy lies in the suboptimal age structure of forests in Mentougou District, where middle-aged and young forests constitute 86.2% of the total forest area, resulting in a relatively low carbon density. The average carbon density of plantation forests in Mentougou District in 2020 was 20.6 t C/ha. This figure is comparable to the 24.75 t C/ha estimated for Beijing forests by Zhang Feng et al. [37] and shows little difference from the 22.53 t C/ha estimated by Fan Dengxing et al. [38] for Beijing forests, as well as the 21.41 t C/ha reported for plantations in Maguan County, Yunnan Province [39]. Although the carbon density of plantation forests in Mentougou District aligns with findings from various studies in other regions, it is imperative to continue strengthening the nurturing management of these plantations and optimizing their structure. Such efforts will enhance overall forest quality and carbon sequestration potential in the study area. The average carbon density of natural forests in Mentougou District significantly exceeds that of plantation forests, a finding consistent with research conducted by various scholars in other regions [40,41]. This underscores the role of natural forests as the primary contributors to carbon sinks in Mentougou District’s arborvitae forests, highlighting their superior carbon sequestration capacity and forest quality.
Elevational gradients significantly redistribute regional hydrothermal conditions, influencing spatial patterns of forest carbon storage through microenvironmental variations affecting vegetation growth, distribution, and litter decomposition processes [42]. The results demonstrate an elevational increase in carbon density, with lower carbon density at lower elevations (0–600 m) primarily attributed to anthropogenic disturbances like grazing. As elevation rises, decreasing temperatures and increasing precipitation drive vertical zonation of vegetation productivity [43]. This aligns with Ren et al.’s [44] findings in Chengdu forests where carbon stocks peaked at mid-elevations (600–1200 m), exhibiting an inverted “V”-shaped distribution pattern. Slope gradients mediate carbon dynamics through erosion-induced nutrient/water redistribution. Moderate slopes dominate carbon storage (47% of total), benefiting from optimal hydrothermal–soil conditions and afforestation programs like the Grain for Green initiative. Contrasting Tian et al.’s [45] unimodal pattern, our study reveals a hump-shaped density trend peaking at steep slopes: moderate slopes reduce anthropogenic pressure, while abrupt slopes experience carbon loss through nutrient leaching, explaining the observed density decline beyond critical gradients.
The carbon sequestration and oxygen release service functions of forest ecosystems are influenced by factors such as forest type, stand composition, and age structure. Regional differences and interactions among these factors result in significant variations in the value of carbon sequestration and oxygen release across different forest ecosystems in China [46]. In 2020, the annual average value of carbon sequestration and oxygen release per unit area in Mentougou District, Beijing, was CNY 0.39 million per hectare per year, which is lower than the CNY 0.98 million per hectare per year estimated by Feng et al. [47] for China’s forest ecosystems, lower than the CNY 1.33 million per hectare per year estimated by Zhou et al. [48] for the Changqing Nature Reserve in Shaanxi Province, and significantly lower than the CNY 2.6 million per hectare per year estimated by Li et al. [49] for the forest ecosystems in the Dianchi Lake Basin. The primary reasons for this discrepancy are the high proportion of young and middle-aged forests in the study area, which have weaker resistance to stress, leading to less persistent carbon sequestration. Additionally, the prevalence of single-species stands makes them more susceptible to pests, diseases, and climate change, resulting in unstable carbon storage. Consequently, the annual average value of carbon sequestration and oxygen release per unit area in the study area is relatively low. To address this, Mentougou District in Beijing should enhance forest management to improve forest quality, reduce unreasonable human disturbances, and optimize stand structure to enhance ecological resilience and stability. Advanced technologies such as drones and big data platforms should be actively utilized to monitor and analyze the status of forest resources in a timely manner, thereby minimizing the frequency of forest disasters. By implementing multiple measures, the carbon sequestration potential of forest vegetation in Mentougou District can be further enhanced, contributing to Beijing’s achievement of its “dual carbon” goals.

5. Conclusions

This study estimates carbon stocks and corresponding economic values of arbor forests in Mentougou District from 2020 to 2060 using the IPCC volume-derived biomass methodology. The results demonstrate the following:
(1) In 2020, the study area’s arbor forests stored 2.198 Mt C with an average density of 33.4 t C/ha, yielding a total carbon sequestration and oxygen release value of CNY 6.12 billion. The carbon stock hierarchy by vegetation type was natural broadleaf forests (1.559 Mt C) > planted coniferous forests (445,000 t C) > planted broadleaf forests (159,000 t C) > natural coniferous forests (28,100 t C) > planted sparse forests (5200 t C) > natural sparse forests (1600 t C), where natural broadleaf forests demonstrated significantly higher carbon stocks than other vegetation types. The age class distribution was as follows: young stands (1.0 Mt C) > middle-aged stands (724,000 t C) > near-mature stands (233,000 t C) > mature stands (193,000 t C) > over-mature stands (48,000 t C). Altitudinally, 1.063 Mt C (48% of total) was concentrated in the 600–1200 m elevation zone. Slope gradient analysis revealed 89% of total carbon storage accumulated on moderate and steep slopes.
(2) The study assumes that both the area and tree species composition of existing forests remain unchanged in the future, with no deforestation or other disruptive activities occurring. The analysis solely considers biomass and carbon stock changes resulting from natural forest growth processes. The result shows the study area’s arbor forest carbon stocks will reach 3.17 Mt C by 2030, representing a 42.7% increase from 2020 with cumulative sequestration of 972,000 t C, and an estimated carbon–oxygen service value of CNY 8.84 billion. By 2060, stocks are anticipated to grow to 4.824 Mt C (2.626 Mt C cumulative sequestration), with the corresponding valuation reaching CNY 13.45 billion. These results highlight both the substantial market potential and critical challenges of county-scale forest carbon sinks in China. Strategic priorities include intensifying silvicultural practices in middle-aged and young stands to optimize age class structures, enhancing forest resource monitoring systems to mitigate carbon leakage risks, and establishing localized carbon trading mechanisms. Such measures will facilitate the realization of forest carbon value while promoting regional sustainable development through ecological–economic synergy.

Supplementary Materials

The following supporting information can be downloaded at: https://www.mdpi.com/article/10.3390/f16060926/s1, Table S1: Parameters of biomass expansion factors, below-ground biomass to above-ground biomass ratio and wood density of dominant tree species; Table S2: Logistic equation fitting parameters for the unit area volume and stand age of main dominant tree species; Table S3: Forest carbon storage and carbon density by elevation gradient; Table S4: Forest carbon storage and carbon density on different slopes; Table S5: Forest carbon storage and carbon density on different aspects; Table S6: Forest carbon storage and carbon density on all slopes.

Author Contributions

Conceptualization and writing, Yongcheng Geng; supervision, Xiaoxian Liu; data curation, project administration and funding acquisition, Shuhong Wu. All authors have read and agreed to the published version of the manuscript.

Funding

This research was funded by National Natural Science Foundation of China (Grant No. 32471663).

Data Availability Statement

Data are contained within the article.

Conflicts of Interest

The authors declare no conflict of interest.

References

  1. Rosa De, D.; Ballabio, C.; Lugato, E.; Fasiolo, M.; Jones, A.; Panagos, P. Soil organic carbon stocks in European croplands and grasslands: How much have we lost in the past decade? Glob. Change Biol. 2024, 30, e16992. [Google Scholar]
  2. Yang, H.; Ciais, P.; Frappart, F.; Li, X.; Brandt, M.; Fensholt, R.; Fan, L.; Saatchi, S.; Besnard, S.; Deng, Z. Global increase in biomass carbon stock dominated by growth of northern young forests over past decade. Nat. Geosci. 2023, 16, 886–892. [Google Scholar]
  3. Zhou, W.; Guan, K.; Peng, B.; Margenot, A.; Lee, D.; Tang, J.; Jin, Z.; Grant, R.; Delucia, E.; Qin, Z. How does uncertainty of soil organic carbon stock affect the calculation of carbon budgets and soil carbon credits for croplands in the US Midwest? Geoderma 2023, 429, 116254. [Google Scholar] [CrossRef]
  4. Kruhlov, I.; Thom, D.; Chaskovskyy, O.; Keeton, W.S.; Scheller, R.M. Future forest landscapes of the Carpathians: Vegetation and carbon dynamics under climate change. Reg. Environ. Change 2018, 18, 1555–1567. [Google Scholar] [CrossRef]
  5. Shang, R.; Chen, J.M.; Xu, M.; Lin, X.; Li, P.; Yu, G.; He, N.; Xu, L.; Gong, P.; Liu, L. China’s current forest age structure will lead to weakened carbon sinks in the near future. Innov. 2023, 4, 100515. [Google Scholar] [CrossRef]
  6. Zhu, J.H.; Tian, Y.; Li, Q.; Liu, H.Y.; Guo, X.Y.; Tian, H.L.; Liu, C.F.; Xiao, W.F. The current and potential carbon sink in forest ecosystem in China. Acta Ecol. Sin. 2023, 43, 3442–3457. [Google Scholar]
  7. Wu, S.H.; Song, W.M. Sources of uncertainty and its estimating approach for estimating greenhouse gas emission by sources and removals by sinks from afforestation and reforestation under CDM. Sci. Silvae Sin. 2010, 46, 31–36. [Google Scholar]
  8. Sun, R.; He, D.; Yan, J. Generation Mechanism of Supply and Demand Gap of Forestry Carbon Sequestration Based on Evolutionary Game: Findings from China. Forests 2022, 13, 1488. [Google Scholar] [CrossRef]
  9. Mo, L.; Zohner, C.M.; Reich, P.B.; Liang, J.; de Miguel, S.; Nabuurs, G.J.; Renner, S.S.; van den Hoogen, J.; Araza, A.; Herold, M.; et al. Integrated global assessment of the natural forest carbon potential. Nature 2023, 624, 92–101. [Google Scholar] [CrossRef]
  10. Bastin, J.; Finegold, Y.; Garcia, C.; Mollicone, D.; Rezende, M.; Routh, D.; Zohner, C.M.; Crowther, T.W. The global tree restoration potential. Science 2019, 365, 76–79. [Google Scholar] [CrossRef]
  11. Zhang, D.; Zhao, Y.; Wu, J. Assessment of carbon balance attribution and carbon storage potential in China’s terrestrial ecosystem. Resour. Conserv. Recycl. 2023, 189, 106748. [Google Scholar] [CrossRef]
  12. Peng, B.; Zhou, Z.Y.; Cai, W.X.; Li, M.X.; Xu, L.; He, N.P. Maximum potential of vegetation carbon sink in Chinese forests. Sci. Total Environ. 2023, 905, 167325. [Google Scholar] [CrossRef]
  13. Li, S.Q.; Gao, L.; Li, H.; Jiang, J.Y.; Huang, M.J.; Guo, M.; Zan, L.S. Spatiotemporal evolution and driving factors of forest vegetation carbon sequestration in state-owned forest farms of Shaanxi Province. For. Econ. 2022, 44, 58–75. [Google Scholar]
  14. Chong, F.F.; Du, J.Q.; Zhu, X.Q.; Sun, B.Q.; Li, L.J.; Song, Z.B.; Wu, L.Y.; Chen, X.Y.; Zhai, G.Q. Carbon storage estimation and spatial pattern analysis of terrestrial ecosystems in the Beijing-Tianjin-Hebei region. Res. Environ. Sci. 2023, 36, 2065–2073. [Google Scholar]
  15. Fang, J.Y.; Guo, Z.D.; Piao, S.L.; Chen, A.P. Terrestrial vegetation carbon sinks in China, 1981–2000. Sci. China Ser. D Earth Sci. 2007, 50, 1341–1350. [Google Scholar] [CrossRef]
  16. Tang, X.; Zhao, X.; Bai, Y.; Tang, Z.; Wang, W.; Zhao, Y.; Wan, H.; Xie, Z.; Shi, X.; Wu, B. Carbon pools in China’s terrestrial ecosystems: New estimates based on an intensive field survey. Proc. Natl. Acad. Sci. USA 2018, 115, 4021–4026. [Google Scholar] [CrossRef]
  17. Mariano Neto, M.; Da Silva, J.B.; de Brito, H.C. Carbon stock estimation in a Brazilian mangrove using optical satellite data. Environ. Monit. Assess. 2024, 196, 9. [Google Scholar] [CrossRef]
  18. Sun, W.; Liu, X. Review on carbon storage estimation of forest ecosystem and applications in China. For. Ecosyst. 2020, 7, 4. [Google Scholar] [CrossRef]
  19. Yang, Y.H.; Cheng, C.; Li, C.; Fu, L.; Zhang, W.Q. Climate carrying capacity in ecological conservation area of western Beijing: A preliminary study. J. Agric. 2021, 11, 44–50. [Google Scholar]
  20. Yi, Y.; Shi, M.C.; Liu, C.J.; Wang, B.; Kang, H.Z.; Hu, X.L. Changes of Ecosystem Services and Landscape Patterns in Mountainous Areas: A Case Study in the Mentougou District in Beijing. Sustainability 2018, 10, 3689. [Google Scholar] [CrossRef]
  21. Su, W. The Study of China’s Greenhouse Gas Inventory in 2005; China Environmental Science Press: Beijing, China, 2014. [Google Scholar]
  22. Li, Q. Forest Carbon Storage and Carbon Sequestrationpotential During 2010–2050 in China; Chinese Academy Forestry: Beijing, China, 2016. [Google Scholar]
  23. Chave, J.; Réjou Méchain, M.; Búrquez, A.; Chidumayo, E.; Colgan, M.S.; Delitti, W.B.; Duque, A.; Eid, T.; Fearnside, P.M.; Goodman, R.C. Improved allometric models to estimate the aboveground biomass of tropical trees. Glob. Change Biol. 2014, 20, 3177–3190. [Google Scholar] [CrossRef] [PubMed]
  24. Tavankar, F.; Kivi, A.R.; Taheri-Abkenari, K.; Lo Monaco, A.; Venanzi, R.; Picchio, R. Evaluation of deadwood characteristics and carbon storage under different silvicultural treatments in a mixed broadleaves mountain forest. Forests 2022, 13, 259. [Google Scholar] [CrossRef]
  25. LY/T 1721-2008; Specifications for Assessment of Forest Ecosystem Services. National Standard Press: Beijing, China, 2008.
  26. Pan, H.Y.; Meng, J.H.; Wen, Z.Y. Evaluation on the implementation effect of forest management in Beijing mountainous areas based on GEP accounting. J. Northwest For. Univ. 2024, 39, 256–263. [Google Scholar]
  27. Zeng, Z.Q.; Song, H.Q.; Gao, J.H.; Wang, M.M.; Wu, Y.X.; Qi, L.H. Spatial and temporal change and potential prediction of carbon sequestrating and energy carbon emissing of forest vegetation in Beijing. Sci. Silvae Sin. 2023, 59, 51–60. [Google Scholar]
  28. Li, Q.; Zhu, J.H.; Feng, Y.; Xiao, W.F. Carbon storage and carbon sequestration potential of the forest in China. Clim. Change Res. 2018, 14, 287–294. [Google Scholar]
  29. Li, S.H.; Zhu, T.S.; Wei, C.X.; Ye, S.; Song, Y.T. Forest carbon storage calculation and carbon sink potential prediction in Beijing. Environ. Sci. Manag. 2024, 49, 22–27. [Google Scholar]
  30. Peichl, M.; Arain, M.A. Above-and belowground ecosystem biomass and carbon pools in an age-sequence of temperate pine plantation forests. Agric. For. Meteorol. 2006, 140, 51–63. [Google Scholar] [CrossRef]
  31. Zhang, C.; Ju, W.; Chen, J.M.; Li, D.; Wang, X.; Fan, W.; Li, M.; Zan, M. Mapping forest stand age in China using remotely sensed forest height and observation data. J. Geophys. Res. Biogeosci. 2014, 119, 1163–1179. [Google Scholar] [CrossRef]
  32. Zhou, T.; Shi, P.; Jia, G.; Dai, Y.; Zhao, X.; Shangguan, W.; Du, L.; Wu, H.; Luo, Y. Age-dependent forest carbon sink: Estimation via inverse modeling. J. Geophys. Res. Biogeosci. 2015, 120, 2473–2492. [Google Scholar] [CrossRef]
  33. Cai, W.; He, N.; Li, M.; Xu, L.; Wang, L.; Zhu, J.; Zeng, N.; Yan, P.; Si, G.; Zhang, X. Carbon sequestration of Chinese forests from 2010 to 2060: Spatiotemporal dynamics and its regulatory strategies. Sci. Bull. 2022, 67, 836–843. [Google Scholar] [CrossRef]
  34. Fang, J.Y.; Liu, G.H.; Xun, S.L. Biomass and net production of forest vegetation in China. Acta Ecol. Sin. 1996, 16, 497–508. [Google Scholar]
  35. Fang, J.Y.; Chen, A.P.; Peng, C.H.; Zhao, S.Q.; Ci, L.J. Changes in forest biomass carbon storage in China between 1949 and 1998. Science 2001, 292, 2320–2322. [Google Scholar] [CrossRef]
  36. Li, H.K.; Lei, Y.C.; Zeng, W.S. Forest vegetation carbon storage in China based on forest inventory data. Sci. Silvae Sin. 2011, 47, 7–12. [Google Scholar]
  37. Zhang, F.; Peng, Z.D. Study on forest carbon storage and carbon sink economic value in Beijing. For. Resour. Manag. 2021, 06, 52–58. [Google Scholar]
  38. Fan, D.X.; Yu, X.X.; Yue, Y.J.; Niu, L.L.; Gao, Z.L.; Ma, L.Y. Forest carbon storage and Its dynamic changes in Beijing City. J. Beijing For. Univ. 2008, 30 (Suppl. S2), 117–120. [Google Scholar]
  39. Feng, Y.; Wang, L.J. Analysis of carbon storage and carbon sequestration characteristics of arbor forests at the county scale: A case study of Maguan county. J. West China For. Sci. 2023, 52, 152–159. [Google Scholar]
  40. Huang, Y.N. Estimation of forest carbon storage in Talin forest farm using second-class survey data. J. Northeast. For. Univ. 2018, 46, 12–16. [Google Scholar]
  41. Tang, H.F.; Xu, Y.H.; Ai, J.L. Carbon storage, carbon density, and spatial distribution patterns of forest vegetation in Yunnan province. For. Resour. Manag. 2019, 05, 37–43. [Google Scholar]
  42. Bai, H.; Xu, Q.; Shi, S.L.; Zeng, W.Q.; Tan, L.P.; Peng, P.H. Radial growth of Abies fabri response to climate change along an altitudinal transect in the Mount Emei. J. Cent. South Univ. For. Technol. 2020, 40, 128–138. [Google Scholar]
  43. Xie, G.L.; He, G.X.; Li, J.X.; Gong, Y.M.; Liu, S.; Chang, T.; Tian, Y.X.; Zhu, Z.H.; Zhu, N.H. Leaf phenotypic variation in natural populations of the Cunninghamia securinega at different altitudes. J. Cent. South Univ. For. Technol. 2024, 44, 144–155. [Google Scholar]
  44. Ren, D.Z.; Liao, X.Y.; Xiao, Q.G.; Lai, C.H.; Song, F.; Meng, S.M.; Peng, X.Q. Carbon storage and spatial distribution patterns of forest vegetation in Chengdu City. J. West China For. Sci. 2021, 50, 74–81. [Google Scholar]
  45. Tian, Z.; Gao, F.; Sai, S.; Yang, Z.H.; Ding, G.D. Distribution characteristics of carbon storage and carbon density in forest ecosystems of Qingshuihe County. J. Arid. Land Resour. Environ. 2024, 38, 166–173. [Google Scholar]
  46. Ma, C.X.; Liu, J.J.; Kang, B.W.; Sun, S.H.; Ren, J.H. Evaluation of carbon sequestration and oxygen release service functions of forest ecosystems in Shaanxi province from 1999 to 2003. Acta Ecol. Sin. 2010, 30, 1412–1422. [Google Scholar]
  47. Feng, J.G.; Ding, L.B.; Wang, J.S.; Yao, P.P.; Yao, S.C.; Wang, Z.K. Evaluation of forest ecosystem services in China based on case studies. Chin. J. Appl. Ecol. 2016, 27, 1375–1382. [Google Scholar]
  48. Zhou, Y.; Yang, L. Valuation of carbon sequestration and oxygen release in forest ecosystems of nature reserves: A case study of Changqing nature reserve in Shaanxi province. Anhui For. Sci. Technol. 2018, 44, 18–23. [Google Scholar]
  49. Li, J.M.; Gong, X.H.; Zhang, Y.J.; Duan, C.Q.; Gao, W. Evaluation of carbon sequestration and oxygen release service value in forest ecosystems of Dianchi lake basin. J. Yunnan Univ. 2019, 41, 629–663. [Google Scholar]
Figure 1. Overview of land use in Mentougou District.
Forests 16 00926 g001
Figure 2. Schematic elevation of Mentougou District (a). Slope gradient map of Mentougou District (b).
Forests 16 00926 g002
Figure 3. Carbon density distribution of arborvitae forests in Mentougou District in 2020 (a). Carbon stock distribution of arborvitae forests in Mentougou District in 2020 (b).
Forests 16 00926 g003
Figure 4. Carbon stocks and carbon density by forest age group in 2020 (a); carbon stock share by forest age group in 2020 (b); area share (c).
Forests 16 00926 g004
Figure 5. Projected carbon stock in arborvitae forests in Mentougou District (a). Projected carbon sink in arborvitae forest in Mentougou District (b).
Forests 16 00926 g005
Figure 6. Oxygen fixation and release values by forest age group in 2020 (a); projected oxygen fixation and release values (b).
Forests 16 00926 g006
Table 1. Carbon storage and carbon density of different types.
TypeArea/hm2Carbon Storage (104tC)Carbon Density (tC/hm2)
Natural broad-leaved forest35,731.24155.943.3
Planted broad-leaved forest5838.0315.927.9
Natural coniferous forest453.272.8164.8
Planted coniferous forest23,330.6744.519.3
Natural sparse forest73.090.1629.2
Planted sparse forest364.250.5315.9
Research area65,790.55219.833.4
Disclaimer/Publisher’s Note: The statements, opinions and data contained in all publications are solely those of the individual author(s) and contributor(s) and not of MDPI and/or the editor(s). MDPI and/or the editor(s) disclaim responsibility for any injury to people or property resulting from any ideas, methods, instructions or products referred to in the content.

