Abstract
This study investigates the vibrational and acoustic properties of Sitka spruce (Picea sitchensis (Bong.) Carr.) and Indian rosewood (Dalbergia latifolia Roxb.), two common musical instrument woods, at moisture contents of 2%, 7%, and 12%. The specimens with dimensions of 400mm (longitudinal) × 25 mm (radial) × 10 mm (tangential) were tested under cantilever beam conditions using non-contact magnetic field excitation to generate sinusoidal and pulse signals. Vibration data were collected via acceleration sensors and FFT analyzers. The test method was based on ASTM D6874-12 standard. Results indicate that increasing moisture content reduces acoustic vibration characteristics, with hardwoods exhibiting higher declines than softwoods. From 2% to 12% moisture content, the first-order sound radiation quality factor of Sitka spruce and Indian rosewood decreased by 15.41% and 15.57%, respectively, while the sound conversion rate declined by 41.91% and 43.21%. Increased moisture content lowers first-order and second-order resonance frequencies, amplitude ratios, dynamic elastic modulus, vibration propagation velocity, acoustic radiation quality factor, and acoustic conversion efficiency, while increasing acoustic impedance and the loss factor. With excitation frequency increases from 100 Hz to 1500 Hz, vibration propagation velocity rises slightly, while the loss factor declines.
1. Introduction
Wood, as a unique renewable and eco-friendly building material, has advantages of environmental sustainability, carbon sequestration, and reusability. It is widely used in the musical instrument industry [1]. As a form of entertainment, musical instruments are becoming increasingly popular, driving the rapid growth of the instrument industry. Wood is essential for producing almost all instruments except brass instruments.
In the production of musical instruments, manufacturing processes and raw materials have a significantly impact on instrument acoustic quality. The wood for musical instruments has strict specifications that require consideration of tree species, grain orientation, annual ring width, surface roughness, and latewood percentage [2,3,4,5]. The acoustic properties of wood primarily depend on its vibrational characteristics, which are evaluated through parameters such as vibration mode, specific dynamic elastic modulus, acoustic radiation quality constant, and acoustic impedance [6,7]. A higher specific dynamic elastic modulus and acoustic radiation damping coefficient, as well as a lower acoustic impedance, are beneficial for the conversion of acoustic energy or the improvement of response velocity. The long-term natural aging of wood materials is an important step in the manufacturing process of wooden musical instruments. Wood that has undergone long-term natural aging, due to the recrystallization of cellulose and the depolymerization of hemicellulose, has reduced moisture absorption and improved acoustic vibration characteristics. However, the natural aging of wood is very slow [8,9]. At present, in the manufacturing process of musical instruments, by modifying the materials, the effect of natural aging that originally required decades can be achieved in a shorter period of time, which greatly benefits the development of the musical instrument manufacturing industry. High-temperature heat treatment [10,11,12,13,14], chemical immersion treatment [15,16,17], and moisture absorption cycling treatment [18,19] are commonly used methods to improve the vibration characteristics of wood.
Many researchers have focused on exploring the vibration acoustics of musical instrument materials and modified materials. There are also a few reports on the impact of moisture content changes on the vibration acoustic characteristics of musical instrument wood. Changes in wood moisture content affect its dimensional stability and can lead to unstable acoustic effects in musical instruments [20,21]. However, these studies have not yet systematically reported the influence of moisture content on the vibration modes and acoustic properties of wood during the process of moisture content changes.
In addition, the vibration response caused by surface impact or excitation of wood is related to the vibration characteristics and structure of the wood. Norimoto et al. [22], Matsunaga et al. [23], and Yoshitaka et al. [24] studied the vibration characteristics of wood as an acoustic board and found that the acoustic properties of wood are significantly influenced by the vibration characteristic parameters. Danihelová et al. [25], Mirbolouk et al. [26], Zhang et al. [27], Deng et al. [28], Kohantorabi et al. [29], Ahmed et al. [30], and Guan et al. [31] used methods such as blades, impact hammers, and iron balls to excite the wood to produce vibration and study the vibration characteristics of wood. Most researchers used contact-based excitation methods in experiments and obtained material vibration characteristics.
However, the vibration waveforms obtained by these methods have significant interference, making data analysis and processing difficult and prone to errors. Therefore, this study focuses on the commonly used materials for musical instruments, spruce and rosewood, with different moisture contents. Under the boundary conditions of cantilever beams [32,33], a non-contact magnetic field excitation method is used to generate sine and pulse waves of different frequencies, simulate regular acoustic waves, and excite the experiment materials. The vibration data of the materials are obtained using acceleration sensors and an FFT analyzer, and the vibration modes and acoustic vibration characteristics of the two commonly used musical instrument materials at different moisture contents are studied.
2. Materials and Methods
2.1. Experiment Materials
The experiment selected 90-degree radial cut boards of Sitka spruce (Picea sitchensis (Bong.) Carr.) and Indian rosewood (Dalbergia latifolia Roxb.) from Hunan kepma Musical Instrument Manufacturing Co., Ltd., Changsha, China, which are used as materials for musical instruments without visible defects such as cracking, deformation, decay, and discoloration. The experiment specimens are all heartwood and 400 × 25 × 10 (L × M × H). The cutting position of the specimen is shown in Figure 1. The surface of each sample was processed using a planer, and there were 12 samples for each type of wood. The mean densities of the Sitka spruce specimens at moisture contents of 2%, 7%, and 12% are 368.2 kg m−3, 386.3 kg m−3, and 404.3 kg m−3, respectively. The mean densities of the Indian rosewood specimens at moisture contents of 2%, 7%, and 12% are 830.3 kg m−3, 871.0 kg m−3, and 911.7 kg m−3, respectively. The annual ring width of spruce is about 0.57 mm, and the latewood rate is about 18.92%.
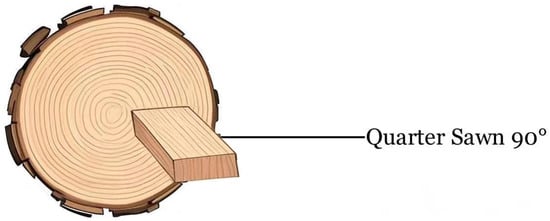
Figure 1.
The cutting position of the Sitka spruce (Picea sitchensis (Bong.) Carr.).
2.2. Adjustment of Specimen Moisture Content
Before cutting the specimen, the small 20 pieces were cut from the sawn lumber and weighed. The small pieces were then dried at 103 °C to a moisture content of 0%, and the moisture contents of the small pieces were calculated as the initial moisture content of each experiment piece. Then, the experimental specimens were placed in a constant-temperature and -humidity chamber for moisture content adjustment. The moisture contents of the experiment specimens were adjusted to 2%, 7%, and 12%, respectively. These moisture contents were chosen based on the actual situation of Chinese musical instrument manufacturers and the acoustic properties of wood at different moisture contents. (1) Due to regional differences, the musical instrument manufacturers often control the moisture content of the wood to be between 7% and 12%, in order to ensure that the wood is sufficiently moist to prevent drying and cracking. (2) The selection of moisture content close to 2% absolute dryness is mainly to study the acoustic vibration characteristics of wood under extreme drying conditions.
2.3. Experimental Device
The experimental setup is shown in Figure 2, where the specimen was subjected to boundary conditions with one end free and the other end fixed. A circular iron plate with a mass of approximately was attached to the free end of the specimen. The signal generator (Model DH1301, Jiangsu Donghua Testing Technology Co., Taizhou, China) sent out a setting signal, which was amplified by the power amplifier (Model DH5872, Jiangsu Donghua Testing Technology Co., Taizhou, China) and transmitted to the non-contact magnetic field exciter (Model DH41020, Jiangsu Donghua Testing Technology Co., Taizhou, China). The signal generated by the magnetic exciter excited the circular iron plate below the free end specimen, driving the specimen to vibration. The gap between the magnetic exciter and the circular iron plate below the free end of the specimen was 5 . Two IEPE piezoelectric accelerometer sensors (INV9822, China Orient Institute of Noise & Vibration, Beijing, China) were placed 20 away from the free and fixed ends respectively and fixed to the specimen with epoxy resin glue. These sensors were connected to the FFT analyzer (CF-9200, Japan ONOSOKKI company, Yokohama, Kanagawa, Japan) through cables. Channel 1 (CH1) of the FFT analyzer was connected to the accelerometer sensor at the free end, and channel 2 (CH2) was connected to the accelerometer sensor at the fixed end. The FFT analyzer was used to obtain vibration data of the specimen, which were then processed and analyzed by a computer. The test method was based on ASTM D6874-12 standard [34].
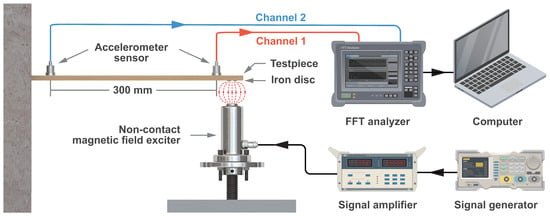
Figure 2.
Experimental device.
2.4. Experimental Method
Resonance Frequency Test: The signal generator was set to emit a sine signal, with peak-to-peak voltage set to 20 and phase set to 0°. The power amplifier was set to and 5 . The starting frequency of a sine signal was 50 , and the frequency increased by 1 Hz until 500 . The acceleration sensor at the free end of the specimen was CH1, referred to as the transmitting end. The acceleration sensor at the fixed end was CH2, which was called the receiving end. The ratio of frequency domain vibration intensity amplitude between CH2 and CH1 was calculated (referred to as amplitude ratio in this study). In the experiment, the FFT selected the Hanning window function to collect signals with a frequency resolution of 0.1 Hz. The FFT was set to automatically filter the collected data and generated time-domain and frequency-domain graphs of specimens with different moisture contents in the 50–1500 Hz frequency band. Based on the time-domain and frequency-domain data of the vibration signal of the specimen, the first-order and second-order resonance frequency values of the specimen can be obtained. There were 4 specimens for each moisture content, and the measured data were averaged.
Measurement of Vibration Propagation Velocity and Logarithmic Attenuation Coefficient: The signal generator was set to burst mode, the waveform was set to sine, the gate was set to N-cycles, the number of cycles was set to 1, the peak-to-peak value of the signal was set to 20 , the phase was set to 0°, and the power amplifier was set to and 5 . The starting frequency of the pulse signal was from 100 to 1500 , increasing by 100 each time. The FFT selected the rectangular window function to collect signals with a frequency resolution of . The distance between the two accelerometer sensors was 300 . The FFT values of the time-domain signals collected through CH1 and CH2 channels were used to calculate the vibration propagation velocity and logarithmic attenuation coefficient of the specimen.
3. Results and Discussion
3.1. The Influence of Moisture Content on the Resonance Frequency of Specimens
Figure 3 and Figure 4 show the time-domain and frequency-domain signals of spruce and rosewood specimens excited by a 100 sine wave with a moisture content of 7% at both the transmitting end (CH1) and the receiving end (CH2). From the figures, it can be seen that when the frequency of the transmitting signal was 100 , the receiving frequency of two specimens was also 100 . The accelerations are evaluated by their root mean square (RMS) effective value. The acceleration of the transmitting end of the spruce specimen was 1284 mm/s2r and the amplitude of the receiving end was 188 mm/s2r, corresponding to an amplitude ratio of 0.14. The amplitude of the transmitting end of the rosewood specimen was 982 mm/s2r, and the amplitude of the receiving end was 41.07 mm/s2r, with an amplitude ratio of 0.04. The decrease in vibration intensity at the receiving end compared to the transmitting end indicates that the excitation frequency did not cause resonance in the specimens.
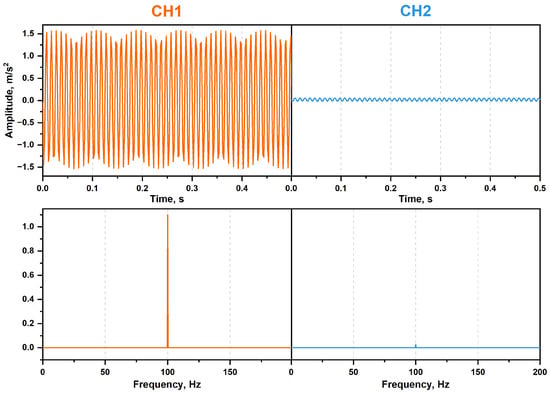
Figure 3.
Time- and frequency-domain signal of spruce specimen with the moisture content of 7% at 100 Hz sine wave excitation.
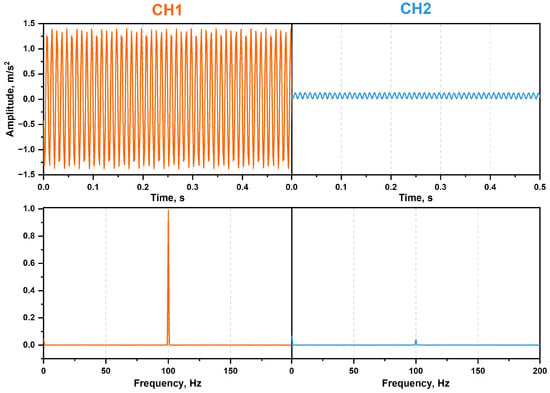
Figure 4.
Time- and frequency-domain signal of rosewood (Dalbergia latifolia Roxb.) specimen with the moisture content of 7% at 100 Hz sine wave excitation.
Figure 5a–c shows the amplitude ratios of spruce specimens at moisture contents of 2%, 7%, and 12%, and the sinusoidal wave excitation frequency band from 50 to 1500 at the signal transmission end. From the figure, it can be seen that the specimen with a moisture content of 12% has the maximum amplitude ratio of 14.88 at a frequency of 224 , indicating that this frequency was the first-order resonance frequency of the specimen under this moisture content condition. Similarly, at frequencies of 231 and 240 , the moisture contents of the specimens were 7% and 2%, and the amplitude ratios were the highest, at 16.10 and 21.70, respectively, which were the first-order resonance frequencies of the specimen. The first-order resonance frequency of the specimen decreased from 240 with a moisture content of 2% to 224 with a moisture content of 12%, with a decrease of 6.67%. The first-order amplitude ratio decreased from 21.70 with a moisture content of 2% to 14.88 with a moisture content of 12%, with a decrease of 31.43%.
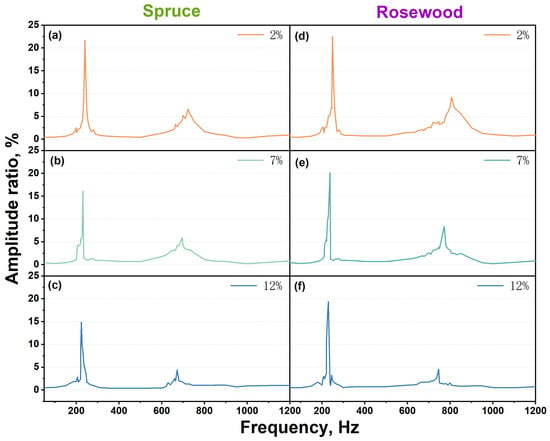
Figure 5.
Relationship between specimen resonance frequency and amplitude ratio with moisture content of the specimen: (a) 2% moisture content spruce, (b) 7% moisture content spruce, (c) 12% moisture content spruce, (d) 2% moisture content rosewood, (e) 7% moisture content rosewood, and (f) 12% moisture content rosewood.
It can also be observed from the figure that the second-order resonance frequencies of the specimens were 672 , 695 , and 724 when the moisture content was 12%, 7%, and 2%. At a frequency of 672 , the specimen with a moisture content of 12% had an amplitude ratio of 4.40. Similarly, for specimens with frequencies of 695 and 724 and moisture contents of 7% and 2%, the amplitude ratios were 5.88 and 6.60, respectively. The second-order resonance frequency of the specimen decreased from 724 with a moisture content of 2% to 672 with a moisture content of 12%, with a decrease of 7.18%. The second-order amplitude ratio decreased from 6.60 with a moisture content of 2% to 4.40 with a moisture content of 12%, with a decrease of 33.33%.
Figure 5d–f shows the amplitude ratios of rosewood specimens at moisture contents of 2%, 7% and 12%, and the sinusoidal wave frequency at the signal transmission end in the frequency band of 50 to 1500 . At a frequency of 230 , the specimen with 12% moisture content has the highest amplitude ratio of 19.4, indicating that this frequency was the first-order resonance frequency under this moisture content condition. Similarly, at a frequency of 238 and 249 , specimens with moisture contents of 7% and 2% exhibited the maximum amplitude ratios of 20.1 and 22.5, respectively, which were their first-order resonance frequencies. The first-order resonance frequency of the specimen decreased from 249 with a moisture content of 2% to 230 with a moisture content of 12%, with a decrease of 7.63%. The first-order amplitude ratio decreased from 22.54 with a moisture content of 2% to 19.42 with a moisture content of 12%, with a decrease of 13.84%.
It can also be observed from the figure that the second-order resonance frequencies of the specimens are 746 , 772 , and 806 when the moisture content is 12%, 7%, and 2%. At a frequency of 746 and a moisture content of 12%, the amplitude ratio of the specimen is 4.57. Similarly, for specimens with frequencies of 772 and 806 and moisture contents of 7% and 2%, the amplitude ratios are 8.36 and 9.17, respectively. The second-order resonance frequency of the specimen decreased from 806 with a moisture content of 2% to 746 with a moisture content of 12%, with a decrease of 7.44%. The second-order amplitude ratio decreased from 9.17 at a moisture content of 2% to 4.57 at a moisture content of 12%, with a decrease of 50.16%.
The increase in moisture content of the specimen leads to a decrease in the resonance frequencies and the amplitude ratios of first-order and second-order resonance frequency points. The main reasons were as follows: (1) An increase in moisture would cause lubrication between the fibers of wood, reducing its elastic modulus. (2) As the moisture content of the specimen increases, the friction and damping inside the specimen also increase, leading to increased energy loss. This enhanced damping effect would lead to a decrease in resonance frequency. (3) An increase in moisture content increases the quality of specimen. Although the relationship between resonance frequency and quality was relatively complex, under these conditions, an increase in quality would lead to a decrease in resonance frequency [35].
At the same moisture content, hardwood specimens have higher resonance frequencies and amplitude ratios of the first-order and second-order resonance points compared to softwood specimens. This is because hardwoods are generally denser, harder, and have more complex cellular structures than softwoods. Due to these characteristic, hardwood usually maintains higher elasticity, which results in a higher elastic modulus, leading to a higher resonance frequency and amplitude ratio of the first-order and second-order resonance frequency points [36].
3.2. The Influence of Moisture Content on the Acoustic Vibration Parameters of Specimens
Based on transverse vibration theory of beams, under the boundary conditions of cantilever beams, the dynamic elastic modulus of the specimen can be calculated after collecting the vibration signals, and the acoustic vibration parameters of the specimen can be further calculated.
The formula for calculating the dynamic elastic modulus E of specimens is as follows [37,38,39]:
where:
E: Dynamic elastic modulus of the specimen ();
f: Resonance frequency of the specimen ();
L: Length of the specimen ();
A: Cross-sectional area (m2);
: Density of the specimen (kg m−3);
: Moment of inertia (m4);
: Solution of Bernoulli. n is the order of the resonant frequency of the test piece, n = 1, 2, …, and acceptable approximate values can be expressed as follows:
Based on the dynamic elastic modulus of the test specimen, the specific dynamic elastic modulus (), the acoustic radiation quality constant (R), and the acoustic impedance (Z) of the specimen can be calculated using the following formulas [40]:
The velocity is c, with which sound travels through a material. The formula for calculation is as follows:
The time-domain signal is measured by FFT, and the first point of sudden rise or fall in channel CH1 is denoted as . Similarly, the first point of sudden rise or fall in channel CH2 is denoted as ; d is the distance between the two accelerometer sensors.
The logarithmic attenuation coefficient () is the average of all obtained logarithmic amplitude ratios [41], where A is the amplitude:
The damping ratio () is calculated using the following formula:
When is small ( < 0.1), the formula can be approximated as
The loss factor () is calculated using
The acoustic conversion efficiency () of the specimen is determined by
Table 1 shows the mean and standard deviation of the first and second dynamic elastic moduli, the specific dynamic elastic modulus, the sound radiation quality constant, the sound impedance, and the sound conversion efficiency for samples with different moisture contents. The dynamic elastic modulus is one of the important indicators for characterizing the mechanical properties of wood and plays a crucial role in evaluating the acoustic vibration characteristics. Figure 6 shows the dynamic elastic modulus of spruce and rosewood specimens under first-order and second-order vibration modes at moisture contents of 2%, 7%, and 12%, respectively. In the first-order vibration mode, the dynamic elastic modulus of spruce specimens decreased from with a moisture content of 2% to with a moisture content of 12%, with a decrease of 4.40%. The dynamic elastic modulus of rosewood specimens decreased from with a moisture content of 2% to with a moisture content of 12%, with a decrease of 6.38%. In the second-order vibration mode, the dynamic elastic modulus of spruce specimens decreased from with a moisture content of 2% to with a moisture of 12%, with a decrease of 5.36%. The dynamic elastic modulus of rosewood specimens decreased from with a moisture content of 2% to with a moisture content of 12%, with a decrease of 5.98%.

Table 1.
Mean and standard deviation of the first-order and second-order dynamic elastic modulus, specific dynamic elastic modulus, acoustic radiation quality constant, acoustic impedance, and acoustic conversion efficiency of specimens with different moisture contents.
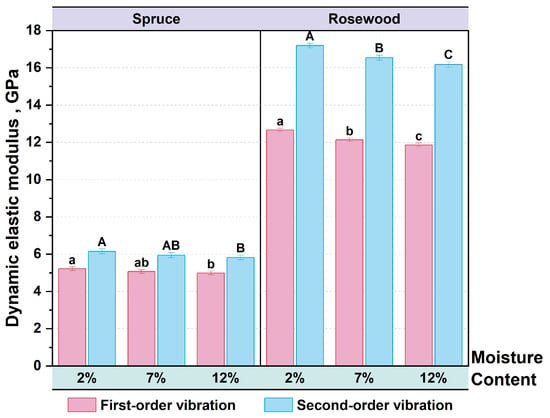
Figure 6.
Dynamic elastic modulus of first-order and second-order vibration modes of specimens with different moisture contents, where bars sharing same letter (e.g., a and ab): no significant difference; others (e.g., A and B): significant.
After the Tukey test, the data show that there was a significant difference in the dynamic elastic modulus of the spruce specimen under the first-order and second-order vibration modes at 2% and 12% moisture content, and that there was no significant difference in the moisture content at 7% compared to 2% and 12%. The data show that there is a significant difference between the dynamic elastic modulus of the rosewood specimen in the first-order and second-order vibration modes at 2%, 7%, and 12%.
As moisture content increased, the dynamic elastic modulus of the spruce and rosewood specimens decreased in both first-order and second-order vibration modes. The primary reasons are as follows: (1) When the moisture content increases, the water molecules bind with the hydroxyl groups in the amorphous region, causing the twisted regions between the cellulose chains to be released. The molecular chains are rearranged, crystallinity increases, the hydrogen bonds between the molecules weaken, and the rigidity of the cell wall decreases. This is the main reason for the decrease in dynamic elastic modulus. (2) After the moisture content increases, the energy loss (loss factor) increases, and more vibration energy is converted into heat and dissipated, further weakening the dynamic elastic modulus. The dynamic modulus of elasticity in the second-order vibration mode is higher than in the first-order vibration mode, because in higher-order vibration modes, the vibration frequency and deformation mode of the wood usually change, causing the material to exhibit higher stiffness. The decrease in the dynamic elastic modulus of the rosewood specimen was slightly higher than that of the spruce specimen, mainly due to its higher initial density, which makes it more sensitive to water absorption. Its thicker cell walls and more complex tissue structure result in a significant decrease in the stiffness of its microstructure after water absorption [42,43,44,45].
The specific dynamic modulus is an important parameter for characterizing the acoustic vibration characteristics of wood. The higher the value of the specific dynamic modulus, the better the acoustic vibration efficiency and quality of wood, making it more suitable as a raw material for instrument resonance components. Figure 7 shows the specific dynamic modulus of spruce and rosewood specimens under first-order and second-order vibration modes with moisture contents of 2%, 7%, and 12%, respectively. In the first-order vibration mode, the specific dynamic elastic modulus of spruce specimens decreased by 12.90% with the moisture content increasing from 2% to 12%. Similarly, the specific dynamic elastic modulus of rosewood specimens decreased by 14.66%. In the second-order vibration mode, the specific dynamic elastic modulus of spruce specimens decreased by 13.86%, while the specific dynamic elastic modulus of rosewood specimens decreased by 14.31% as the moisture content increased from 2% to 12%.
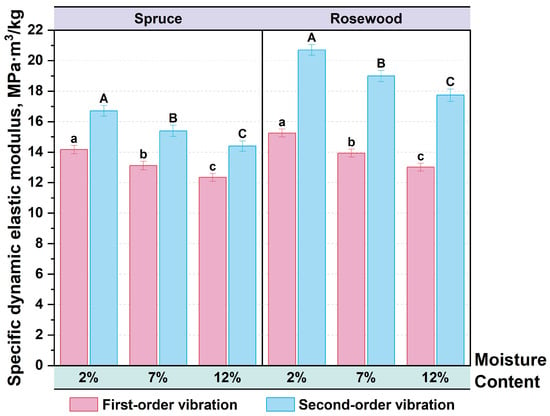
Figure 7.
Specific dynamic modulus of first-order and second-order vibration modes of specimens with different moisture contents, where bars sharing no same letter (e.g., A, B and C): significant difference.
After the Tukey test, significant differences were observed in the specific dynamic elastic modulii of spruce and rosewood specimens under the first and second vibration modes when compared in pairs at moisture contents of 2%, 7% and 12%.
As moisture content increases, the specific dynamic elastic modulus of spruce and rosewood specimens decreases in both first-order and second-order vibration modes. The primary reasons are as follows: (1) The adsorption of water weakens the intermolecular bonding of wood, resulting in a decrease in overall and local rigidity. (2) As the moisture content increases, the damping effect strengthens, further reducing the specific dynamic modulus. The decrease in the specific dynamic elastic modulus of the rosewood specimen is slightly higher than that of the spruce specimen, mainly because rosewood’s rigidity is more sensitive to changes in moisture content, and the decrease in dynamic elastic modulus is higher than that of spruce [46,47,48,49].
The acoustic radiation quality constant (R) is directly proportional to the energy used in the production of acoustic through vibration. The higher the R value, the higher the vibration efficiency and characteristics. Figure 8 shows the acoustic radiation quality constants of spruce and rosewood specimens in first-order and second-order vibration modes at moisture contents of 2%, 7%, and 12%, respectively. In the first-order vibration mode, the acoustic radiation quality constant of spruce specimens decreased by 14.96% with the moisture content increasing from 2% to 12%. Similarly, the acoustic radiation quality constant of rosewood specimens decreased by 15.92%. In the second-order vibration mode, the acoustic radiation quality constant of spruce specimens decreased by 15.48%, while the acoustic radiation quality constant of rosewood specimens decreased by 15.85% as the moisture content increased from 2% to 12%.
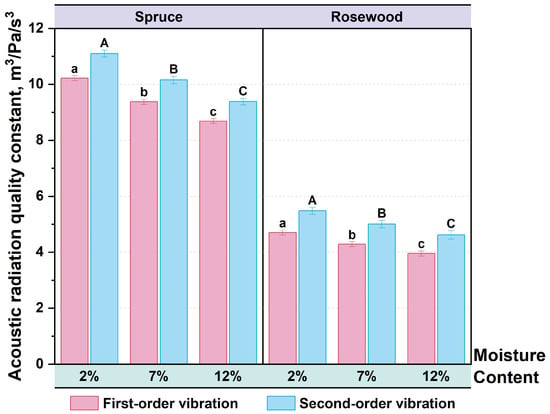
Figure 8.
Acoustic radiation quality constant of first-order and second-order vibration modes of specimens with different moisture contents, where bars sharing no same letter (e.g., A, B and C): significant difference.
After the Tukey test, the sound radiation quality constants of the spruce and rosewood test pieces in the first and second vibration modes were significantly different in the pairwise comparisons of the data at moisture contents of 2%, 7%, and 12%.
As moisture content increases, the acoustic radiation quality constant of spruce and rosewood specimens decreases in both first-order and second-order vibration modes. The reasons are as follows: (1) Adsorbing water weakens wood rigidity and decreases the acoustic radiation quality constant. (2) As the moisture content increases, so does the energy loss (loss factor), and the viscoelastic effect of the wood increases, causing more energy to be converted into heat during vibration and increasing energy loss. As the moisture content increases, the energy loss increases, and the viscoelastic effect of the wood also increases. This results in more energy being converted into heat during the vibration process, thereby increasing energy loss. The decrease in the acoustic radiation quality constant of the rosewood specimen was slightly higher than that of the spruce specimen. mainly due to the higher density and more significant damping effect of the rosewood specimen, which makes its acoustic characteristics more sensitive to changes in moisture content [40,50].
The acoustic impedance of wood reflects the impedance characteristics of acoustic wave energy propagation during vibration, and is one of the important parameters for evaluating the acoustic quality of wood. Using instrument wood with lower acoustic impedance values results in better vibration efficiency and acoustic characteristics.
Figure 9 shows the acoustic impedance of spruce and rosewood specimens under the first-order and second-order vibration modes with moisture contents of 2%, 7%, and 12%, respectively. In the first-order vibration mode, the acoustic impedance value of the spruce specimen with a moisture content of 12% increases by 2.16% compared to the specimen with a moisture content of 2%. Similarly, the acoustic impedance of the rosewood specimen with a moisture content of 12% increases by 1.54% compared to the specimen with a moisture content of 2%. In the second-order vibration mode, the acoustic impedance value of the spruce specimen with a moisture content of 12% increases by 2.67% compared to the specimen with a moisture content of 2%. Similarly, the acoustic impedance value of the rosewood specimen with a moisture content of 12% increases by 1.59% compared to the specimen with a moisture content of 2%.
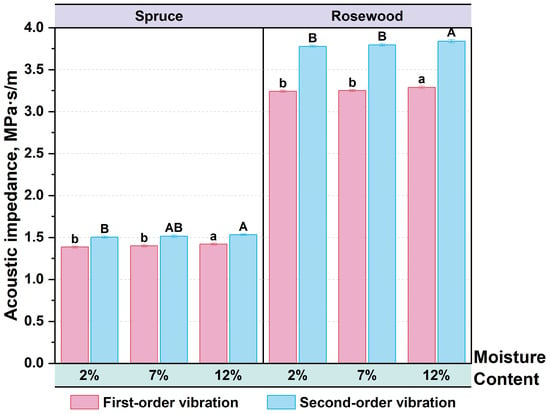
Figure 9.
Acoustic impedance of first-order and second-order vibration modes of specimens with different moisture contents, where bars sharing same letter (e.g., A and AB, or b and b): no significant difference; others (e.g., A and B): significant.
After the Tukey test, the spruce specimens with moisture contents of 2% and 7% showed no significant difference under first-order vibration, while 12% showed significant differences compared to 2% and 7%. Under second-order vibration, there is a significant difference between 2% and 12%, and no significant difference between 7% and 2% and 12%. The rosewood specimens with moisture contents of 2% and 7% showed no significant difference under first-order and second-order vibration, while 12% showed significant differences compared to 2% and 7%.
As moisture content increases, the acoustic impedance values of spruce and rosewood specimens increase in both the first-order and second-order vibration modes. This main reason that the density of wood increases significantly after absorbing water, which directly leads to an increase in acoustic impedance. The increase in the acoustic impedance value of the spruce specimen was slightly higher than that of the rosewood specimen, indicating that softwood was more sensitive to density changes related to moisture content. Meanwhile, the higher density characteristics of rosewood specimens result in relatively smaller changes in acoustic impedance value [51].
For the acoustic conversion efficiency (), as an evaluation parameter for the stability of pronunciation effect, the higher its value, the better the stability of the pronunciation effect. When vibrating, wood with higher values has more mechanical energy converted into sound energy, resulting in louder sound or higher sound wave radiation, and has a more significant resonance effect, which usually enhances the richness of the tone. Figure 10 shows the acoustic conversion efficiency of spruce and rosewood specimens under the first-order and second-order vibration modes with moisture contents of 2%, 7%, and 12%, respectively. In the first-order vibration mode, the acoustic conversion efficiency of the spruce specimen with a moisture content of 2% to 12% decreases by 40.07%. Similarly, the acoustic conversion efficiency of the rosewood specimen with a moisture content 2% to 12% decreases by 43.46%. In the second-order vibration mode, the acoustic conversion efficiency of the spruce specimen with a moisture content from 2% to 12% decreases by 41.65%. The acoustic conversion efficiency of the rosewood specimen with a moisture content of 2% to 12% decreases by 44.60%.
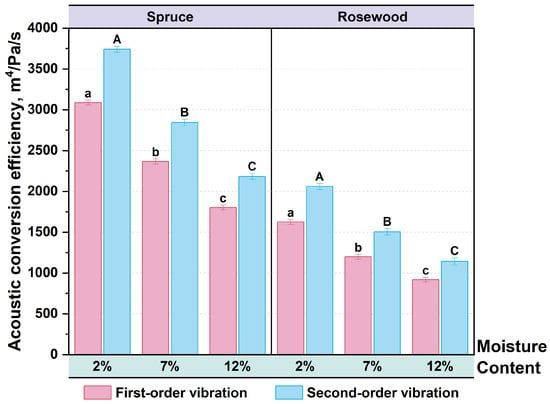
Figure 10.
Acoustic conversion efficiency of first-order and second-order vibration modes of specimens with different moisture contents, where bars sharing no same letter (e.g., A, B and C): significant difference.
After the Tukey test, the acoustic conversion efficiency of spruce and rosewood specimens in the first and second vibration modes showed significant differences in paired comparisons with moisture contents of 2%, 7%, and 12%.
As moisture content increases, the of spruce and rosewood specimens decreases in both first-order and second-order vibration modes. The main reasons are as follows: (1) The increased in moisture content weakens the rigidity of wood and reduces the acoustic energy conversion efficiency of vibrational energy. (2) The increase in wood density enhances its inertia and reduces the vibration efficiency per unit mass. (3) After absorbing water, the viscosity loss inside the wood significantly increases, resulting in more vibration energy being lost in the form of thermal energy. (4) Wood with high moisture content will reduce the velocity of vibration propagation and affect the rapid response of vibration. The decrease in response velocity reduces the efficiency of . The decrease in the of the spruce specimen was slightly lower than that of the rosewood specimen, which was related to its lower initial density and less influence of moisture content on the dynamic elastic modulus. The high density and strong damping of the rosewood specimen result in a higher decrease in [52,53,54].
3.3. The Influence of Moisture Content on the Vibration Propagation Velocity of Specimens
Figure 11 shows the time- and frequency-domain waves by the signal generator in burst mode. The gate control was set to N cycles, the number of cycles was 1, the waveform type was sine wave, and the output frequency was 100 . From the figure, it can be seen that the time-domain signal underwent brief oscillates. In the frequency-domain, the main lobe was symmetrically centered around 100 , with energy concentrated at this frequency. The side lobes exhibit lower amplitudes and gradual attenuation, showing the typical characteristics of a sine function. The pulse signal was transmitted through the magnetic exciter, causing a single vibration of the specimen.
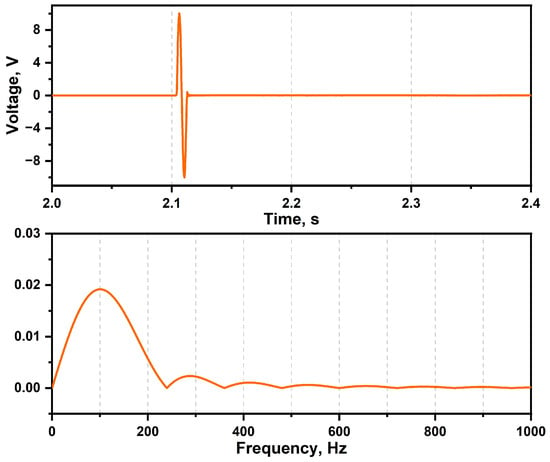
Figure 11.
Pulse input signal in time- and frequency-domain.
Figure 12 shows the time-domain signals of a spruce specimen with a moisture content of 7% excited by the pulse at the transmitting end (CH1) and receiving end (CH2). It was found that when the specimen was in a stationary state, it was suddenly excited by a pulse signal. The signals at the transmitting and receiving ends of the specimen suddenly increase to their maximum, and then gradually decay periodically to a stationary state. Moreover, the vibration intensity at the receiving end of the specimen decreases significantly compared to the transmitting end.
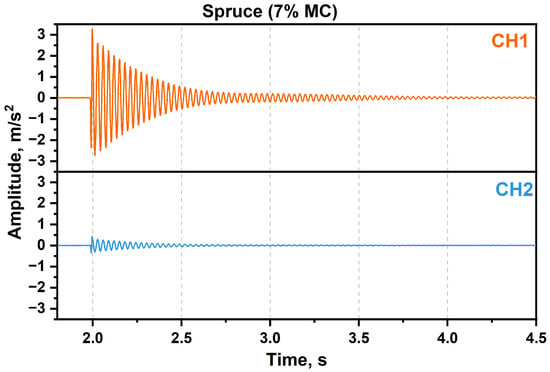
Figure 12.
The time-domain signals of a spruce specimen with a moisture content of 7% excited by the pulse at CH1 and CH2.
Figure 13a shows the relationship between vibration propagation velocity and frequency for spruce specimens with different moisture contents. It can be observed from the figure that, except for the resonance frequency point, the vibration propagation velocity increased with signal frequency. The vibration propagation velocity at 1500 of the specimen with a moisture content of 2% increased by 6.22% compared to 100 . Similarly, specimens with moisture contents of 7% and 12% showed an increase in vibration propagation velocity of 6.63% and 8.93%, respectively. In addition, at the same frequency, the vibration propagation velocity of specimens with a moisture content of 2% increased by 12.68% to 19.99% compared to those with a moisture content of 12%.
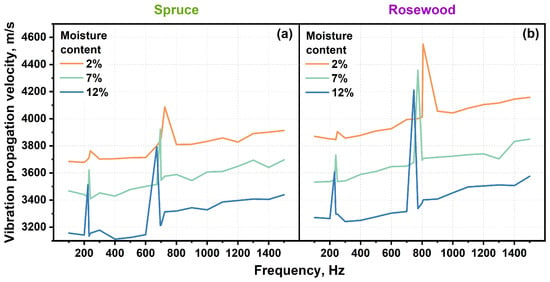
Figure 13.
Relationship between vibration propagation velocity and moisture content of specimens at different frequencies: (a) spruce and (b) rosewood.
Figure 13b shows the relationship between vibration propagation velocity and frequency for rosewood specimens with different moisture contents. Similarly to spruce specimens, except for the resonance frequency point, the vibration propagation velocity increased with the increase in signal frequency. The vibration propagation velocity at 1500 of the specimen with a moisture content of 2% increased by 7.42% compared to 100 . The specimens with moisture contents of 7% and 12% showed an increase in vibration propagation velocity of 9.00% and 9.12%, respectively. In addition, at the same frequency, the vibration propagation velocity of specimens with a moisture content of 2% increased by 16.27% to 20.44% compared to those with a moisture content of 12%.
In the low-frequency band, the vibration propagation velocity remained relatively stable, and the influence of frequency on vibration propagation velocity was not significant. The reason was that low-frequency vibrations have longer wavelengths, and the vibration propagation of waves was mainly influenced by the macroscopic elastic modulus and density of the wood. As the frequency gradually increased to the mid-frequency band, the vibration propagation velocity slightly increased, which was a manifestation of frequency enhancement effect. The reason is that the mid-frequency band may excite higher modal vibrations in wood, improving the efficiency of wave energy transfer between fibers, while the elastic modulus slightly increases with frequency.
At the first-order and second-order resonance frequencies, the vibration propagation velocity of spruce and rosewood specimens significantly increased. This is because at the resonance frequency, the response of the material becomes more sensitive, the vibration amplitude increases, and the relative movement between wood molecules intensifies, thereby improving the efficiency of vibration energy transfer. The vibration propagation velocity at the second-order resonance frequency increases more significantly compared to the first-order resonance frequency. This occurs due to the fact that the energy concentration effect of the second-order resonance mode was stronger, and the dynamic elastic modulus was significantly increased. Wood with a high vibration transmission velocity can more effectively transmit sound waves, improve sound propagation efficiency, and generate higher loudness and stronger volume output. These woods are suitable for use with high or clear bright tones, such as the soundboard of some musical instruments. As the moisture content increases, the vibration propagation velocity of spruce and rosewood specimens significantly decreases. This is because of the following: (1) When the moisture content of wood increases, its cells absorb water, increasing the density of the wood. At the same time, this weakens the hydrogen bonding between the fibers, which reduces the modulus of elasticity. The decrease in the modulus of elasticity leads to a decrease in vibration propagation velocity. (2) The increase in moisture causes an increase in damping inside the wood, which causes faster attenuation of vibration energy during transmission. This energy loss not only reduces the velocity of vibration transmission, but also affects the clarity and resonance characteristics of the sound [55,56,57,58,59].
3.4. The Influence of Moisture Content on the Loss Factor of Specimens
Figure 14a shows the relationship between the loss factor and frequency for spruce specimens with different moisture contents. Except for the resonance frequency points, the loss factor of the specimens decreased with the increase in signal frequency. The loss factor for the specimen with a moisture content of 2% decreased by 11.76% at 100 compared to 1500 . Similarly, the loss factor for specimens with a moisture content decreased by 13.84% and 11.84%, respectively. In addition, at the same frequency, the loss factor of the specimen with a moisture content of 12% increased by 23.41% to 55.65% compared to 2%.
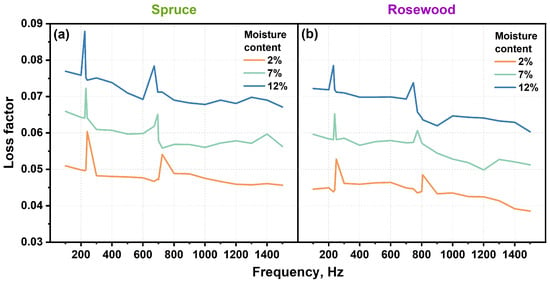
Figure 14.
Relationship between loss factor and moisture content at different frequencies: (a) spruce and (b) rosewood.
Figure 14b shows the relationship between the loss factor and frequency for rosewood specimens with different moisture contents. Similarly, except for the resonance frequency point, the loss factor of the specimens decreases with in increase of signal frequency. The loss factor with a moisture content of 2% in the specimen decreased by 13.63% at 100 compared to 1500 . Similarly, the moisture contents of the specimens were 7% and 12%, with a loss factor of 13.55% and 16.66% respectively. At the same frequency, the loss factor of the specimen with a moisture content of 12% increased by 31.20% to 62.97% compared to 2%.
The loss factor represents the ratio of the energy lost by heat in each vibration cycle to the energy stored in the medium. The lower the value, the higher the vibration efficiency, the slower the attenuation, and the fuller and longer the sound. With the increase in frequency, the loss factor shows a downward trend, mainly due to the small damping effect of medium-frequency signals on wood, and a weakening of friction and energy loss effects. At the first-order and second-order resonance frequencies, the loss factors of spruce and rosewood specimen significantly increased, with the increase in the loss factor at the first-order resonance frequency being higher than at the second-order resonance frequency. As moisture content increases, the loss factors of spruce and rosewood specimens significantly increase. This is because of the following: (1) When moisture content increases, water molecules enter the cell walls of the wood and form new hydrogen bonds with the hydroxyl groups in the wood, thereby weakening the existing intermolecular forces. This rearrangement of molecules causes the material to experience higher internal friction during vibration, increasing energy loss and raising the loss factor. (2) In wood vibration, the movement of the water in the wood is not completely synchronized, which can result in hysteresis effects. This results in the partial conversion of mechanical energy into thermal energy, which increases the loss factor, especially at the resonance frequency. Resonance frequencies represent the peak vibration state of wood, in which internal friction and energy dissipation reach their maximum values [60,61,62,63,64,65].
4. Conclusions
This study analyzed the acoustic vibration characteristics of spruce and rosewood, commonly used musical instrument wood, by comparing the resonance frequency, amplitude ratio, dynamic elastic modulus, specific dynamic elastic modulus, acoustic radiation quality constant, acoustic impedance, and other indicators of specimens with different moisture contents. The research conclusions are as follows:
- The first-order and second-order resonance frequencies and amplitude ratios of spruce and rosewood specimens decreased with the increase in moisture content. At the same moisture content, the resonance frequencies and amplitude ratios at the first-order and second-order resonance points of the rosewood specimen were higher than those of the spruce specimen.
- The first-order and second-order dynamic elastic modulus, specific dynamic elastic modulus, acoustic radiation quality constant, and acoustic conversion efficiency of spruce and rosewood specimens decreased with increasing moisture content, while acoustic impedance increased significantly with increasing moisture content. The decreases in these parameters of the rosewood specimen were higher than those of the spruce specimen.
- As the moisture content increased, the vibration transmission velocity of the spruce and rosewood specimens decreased. Except at the resonance frequency point, the vibration transmission velocity increased with the increase in signal frequency. At the first-order and second-order resonance frequencies, the vibration transmission velocity of the spruce and rosewood specimens significantly increased. The increase in the vibration propagation velocity of the specimens at the first-order resonance frequency was lower than that at the second-order resonance frequency.
- With the increase in moisture content, the loss factor of the spruce and rosewood specimens significantly increased. Additionally, as frequency increased, the loss factor of the spruce and rosewood specimens showed a decreasing trend. At the first-order and second-order resonance frequencies, the loss factor of spruce and rosewood significantly increased. The increase in the loss factor of specimens at the first-order resonance frequency was higher than that at the second-order resonance frequency.
- The acoustic vibration characteristics of the spruce and rosewood specimens decreased with increasing moisture content. In actual production, excessively dry wood may crack and warp, and even affect the sound quality of musical instruments. Lower moisture content results in higher acoustic vibration characteristics. Therefore, between 7% and 12%, it is more recommended to use wood with a moisture content of 7%.
Author Contributions
Conceptualization, H.Q. and N.Z.; methodology, H.Q.; validation, H.Q., Y.C. and L.Z.; formal analysis, H.Q.; investigation, H.Q. and L.Z.; resources, H.Q.; data curation, H.Q.; writing—original draft preparation, H.Q.; writing—review and editing, H.Q., Y.C. and N.Z.; visualization, Y.C.; supervision, T.D.; funding acquisition, N.Z. and T.D. All authors have read and agreed to the published version of the manuscript.
Funding
This research received no external funding.
Data Availability Statement
The data that support the findings of this study are available from the corresponding author upon reasonable request.
Conflicts of Interest
The authors declare no conflicts of interest.
References
- Essien, C. Fundamental Considerations and Application of Acoustics as a Nondestructive Evaluation Technique of Wood Quality Properties. Ph.D. Thesis, Auburn University, Auburn, AL, USA, 2017. [Google Scholar]
- Lewandowski, M.; Foltynowicz, Z. Selected aspects of resonance properties of different woods and the construction of string instruments. Drewno 2022, 65, 1–16. [Google Scholar] [CrossRef]
- Xu, H.; Xu, G.; Wang, L.; Yu, L. Propagation behavior of acoustic wave in wood. J. For. Res. 2014, 25, 671–676. [Google Scholar] [CrossRef]
- Kamperidou, V.; Aidinidis, E.; Barboutis, I. Impact of structural defects on the surface quality of hardwood species sliced veneers. Appl. Sci. 2020, 10, 6265. [Google Scholar] [CrossRef]
- Dinulica, F.; Stanciu, M.D.; Savin, A. Correlation between Anatomical Grading and Acoustic-Elastic Properties of Resonant Spruce Wood Used for Musical Instruments. Forests 2021, 12, 1122. [Google Scholar] [CrossRef]
- Yang, Y. Vibration properties of Paulownia wood for Ruan sound quality using machine learning methods. J. For. Res. 2024, 35, 9. [Google Scholar] [CrossRef]
- Spycher, M.; Schwarze, F.W.M.R.; Steiger, R. Assessment of resonance wood quality by comparing its physical and histological properties. Wood Sci. Technol. 2008, 42, 325–342. [Google Scholar] [CrossRef]
- Bucur, V. A Review on Acoustics of Wood as a Tool for Quality Assessment. Forests 2023, 14, 1545. [Google Scholar] [CrossRef]
- Obataya, E. Effects of natural and artificial ageing on the physical and acoustic properties of wood in musical instruments. J. Cult. Herit. 2017, 27, S63–S69. [Google Scholar] [CrossRef]
- Rolleri, A.; Wentzel, M.; Aguilera, A.; Barros, J.L. Vibroacoustic properties as a function of crystallinity changes in heat-treated Pinus radiata D. Don wood. Wood Mater. Sci. Eng. 2024, 19, 247–252. [Google Scholar] [CrossRef]
- Zhu, L.j.; Jiang, T.; Wu, G. Improvement of Acoustic-Vibration Performance of E. urophylla by High-Temperature Heat Treatment. In Proceedings of the 6th International Conference on Measurement, Instrumentation and Automation (ICMIA), Zhuhai, China, 29–30 June 2017; Volume 154, pp. 148–153. [Google Scholar]
- Mania, P.; Molinski, W.; Roszyk, E.; Gorska, M. Optimization of Spruce (Picea abies L.) Wood Thermal Treatment Temperature to Improve Its Acoustic Properties. Bioresources 2020, 15, 505–516. [Google Scholar] [CrossRef]
- Buchelt, B.; Krueger, R.; Wagenfuehr, A. The vibrational properties of native and thermally modified wood in dependence on its moisture content. Eur. J. Wood Wood Prod. 2023, 81, 947–956. [Google Scholar] [CrossRef]
- Karami, E.; Bardet, S.; Matsuo, M.; Bremaud, I.; Gaff, M.; Gril, J. Effects of mild hygrothermal treatment on the physical and vibrational properties of spruce wood. Compos. Struct. 2020, 253, 112736. [Google Scholar] [CrossRef]
- Li, J.Z.; Furuno, T.; Zhou, W.R.; Ren, Q.; Han, X.Z.; Zhao, J.P. Properties of Acetylated Wood Prepared at Low Temperature in the Presence of Catalysts. J. Wood Chem. Technol. 2009, 29, 241–250. [Google Scholar] [CrossRef]
- Obataya, E.; Minato, K.; Tomita, B. Influence of moisture content on the vibrational properties of hematoxylin-impregnated wood. J. Wood Sci. 2001, 47, 317–321. [Google Scholar] [CrossRef]
- Hassen, M.F.; Hamdan, S.; Rahman, M.R. Investigation of the Acoustic Properties of Chemically Impregnated Kayu Malam Wood Used for Musical Instrument. Adv. Mater. Sci. Eng. 2018, 2018, 7829613. [Google Scholar] [CrossRef]
- Zeniya, N.; Endo-Ujiie, K.; Obataya, E.; Nakagawa-Izumi, A.; Matsuo-Ueda, M. Effects of water-soluble extractives on the vibrational properties and color of hygrothermally treated spruce wood. Wood Sci. Technol. 2019, 53, 151–164. [Google Scholar] [CrossRef]
- Arnold, M. Effect of moisture on the bending properties of thermally modified beech and spruce. J. Mater. Sci. 2010, 45, 669–680. [Google Scholar] [CrossRef]
- Bremaud, I.; Gril, J. Moisture content dependence of anisotropic vibrational properties of wood at quasi equilibrium: Analytical review and multi-trajectories experiments. Holzforschung 2021, 75, 313–327. [Google Scholar] [CrossRef]
- Viala, R.; Cabaret, J.; Sedighi-Gilani, M.; Placet, V.; Cogan, S. Effect of indented growth rings on spruce wood mechanical properties and subsequent violin dynamics. Holzforschung 2024, 78, 189–201. [Google Scholar] [CrossRef]
- Ono, T.; Norimoto, M. Anisotropy of dynamic Young’s modulus and internal friction in wood. Jpn. J. Appl. Phys. 1985, 24, 960. [Google Scholar] [CrossRef]
- Matsunaga, M.; Sugiyama, M.; Minato, K.; Norimoto, M. Physical and Mechanical Properties Required for Violin Bow Materials. Holzforschung 1996, 50, 511–517. [Google Scholar] [CrossRef]
- Kubojima, Y.; Okano, T.; Ohta, M. Vibrational properties of Sitka spruce heat-treated in nitrogen gas. J. Wood Sci. 1998, 4, 73–77. [Google Scholar] [CrossRef]
- Danihelova, A.; Spisiak, D.; Reinprecht, L.; Gergel, T.; Vidholdova, Z.; Ondrejka, V. Acoustic Properties of Norway Spruce Wood Modified with Staining Fungus (Sydowia polyspora). Bioresources 2019, 14, 3432–3444. [Google Scholar] [CrossRef]
- Mirbolouk, P.; Roohnia, M. Evaluation of Dynamic Modulus of Elasticity of Medium Density Fiberboard Panel from Longitudinal Vibration Tests on Specimens. Bioresources 2015, 10, 613–621. [Google Scholar] [CrossRef]
- Zhang, L.; He, L.; Liang, Y.; Zhang, J.; Zhang, H.; Zhou, J.; Cui, H.; Li, M.; Miao, Y.; Liu, Z. Modulating the Acoustic Vibration Performance of Wood by Introducing a Periodic Annular Groove Structure. Forests 2023, 14, 2360. [Google Scholar] [CrossRef]
- Deng, L.; Chen, X.; Chen, F.; Liu, X.e.; Jiang, Z. Effect of Environmental Humidity on the Acoustic Vibration Characteristics of Bamboo. Forests 2022, 13, 329. [Google Scholar] [CrossRef]
- Kohantorabi, M.; Hossein, M.A.; Shahverdi, M.; Roohnia, M. Vibration Based NDT Methods to Verify Wood Drying Efficiency. Drv. Ind. 2015, 66, 221–228. [Google Scholar] [CrossRef]
- Ahmed, S.A.; Adamopoulos, S. Acoustic properties of modified wood under different humid conditions and their relevance for musical instruments. Appl. Acoust. 2018, 140, 92–99. [Google Scholar] [CrossRef]
- Guan, C.; Zhang, H.; Zhou, L.; Wang, X. Dynamic determination of modulus of elasticity of full-size wood composite panels using a vibration method. Constr. Build. Mater. 2015, 100, 201–206. [Google Scholar] [CrossRef]
- Guan, C.; Zhang, H.; Hunt, J.F.; Yan, H. Determining shear modulus of thin wood composite materials using a cantilever beam vibration method. Constr. Build. Mater. 2016, 121, 285–289. [Google Scholar] [CrossRef]
- Wang, Z.; Xu, B.; Sayed, U.; Gu, X.; Qi, L.; Wang, X.; Wang, J. Testing of wood shear modulus based on cantilevered square plate torsional vibration method. Wood Mater. Sci. Eng. 2024, 1–13. [Google Scholar] [CrossRef]
- ASTM D6874-12; Standard Test Methods for Nondestructive Nvaluation of Wood-Based Flexural Members Using Transverse Vibration. ASTM International: West Conshohocken, PA, USA, 2012.
- Yang, H.; Yu, L.; Wang, L. Effect of moisture content on the ultrasonic acoustic properties of wood. J. For. Res. 2015, 26, 753–757. [Google Scholar] [CrossRef]
- Dumond, P.; Baddour, N. Experimental investigation of the mechanical properties and resonance frequencies of simply supported Sitka spruce plates. Wood Sci. Technol. 2015, 49, 1137–1155. [Google Scholar] [CrossRef]
- Yoshihara, H.; Maruta, M. Determining the Young’s modulus of solid wood by considering the fundamental frequency under the free-free flexural vibration mode. Wood Sci. Technol. 2021, 55, 919–936. [Google Scholar] [CrossRef]
- Bucur, V. Mechanical Characterisation of Materials for String Instrument. In Handbook of Materials for String Musical Instruments; Springer International Publishing: Cham, Switzerland, 2016; pp. 93–131. [Google Scholar]
- Brancheriau, L.; Baillères, H. Natural vibration analysis of clear wooden beams: A theoretical review. Appl. Sci. 2002, 36, 347–365. [Google Scholar] [CrossRef]
- Wegst, U.G.K. Wood for sound. Am. J. Bot. 2006, 93, 1439–1448. [Google Scholar] [CrossRef]
- Miao, Y.; Zhong, M.; Liu, Z.; Sun, F. Analysis of Wood Vibration Energy Attenuation Based on FFT Vibration Signal. Bioresources 2015, 10, 272–281. [Google Scholar] [CrossRef][Green Version]
- Fredriksson, M.; Rueggeberg, M.; Nord-Larsen, T.; Beck, G.; Thybring, E.E. Water sorption in wood cell walls-data exploration of the influential physicochemical characteristics. Cellulose 2023, 30, 1857–1871. [Google Scholar] [CrossRef]
- Goncalves, R.; Trinca, A.J.; Pellis, B.P. Elastic constants of wood determined by ultrasound using three geometries of specimens. Wood Sci. Technol. 2014, 48, 269–287. [Google Scholar] [CrossRef]
- Yang, R.; Dong, A.; Meng, X.; Sheng, Y.; Wang, F.; Xia, C.; Aladejana, J.T.; Fang, Z.; Zhao, R.; Zhan, X.; et al. Ultra-Thin Wood-Based Acoustic Diaphragms Fabricated via an Environmentally Friendly Strategy. ACS Appl. Mater. Interfaces 2022, 14, 47089–47099. [Google Scholar] [CrossRef]
- Liu, Z.; Liu, Y.; Yu, H.; Yuan, J. Measurement of the dynamic modulus of elasticity of wood panels. Front. For. China 2006, 1, 425–430. [Google Scholar] [CrossRef]
- Simic, K.; Gendvilas, V.; O’Reilly, C.; Harte, A.M. Predicting structural timber grade-determining properties using acoustic and density measurements on young Sitka spruce trees and logs. Holzforschung 2019, 73, 139–149. [Google Scholar] [CrossRef]
- Silva, L.S.Z.R.S.; Panzera, T.H.; Garcia, C.T.; Silva, D.A.L.; Lahr, F.A.R.; Christoforo, A.L. Physical-mechanical properties of Cajueiro wood estimated by non-destructive methods based on apparent density and natural vibration frequency. Cienc. Florest. 2023, 33, 1–22. [Google Scholar]
- Pantelic, F.; Mijic, M.; Pavlovic, D.S.; Ridley-Ellis, D.; Dudes, D. Analysis of a wooden specimen’s mechanical properties through acoustic measurements in the very near field. J. Acoust. Soc. Am. 2020, 147, EL320–EL325. [Google Scholar] [CrossRef] [PubMed]
- De Moura Aquino, V.B.; Zanini Ribeiro Soares, L.S.; Ruthes, H.C.; Arroyo, F.N.; Fraga, I.F.; Christoforo, A.L.; Dos Santos, H.F.; Chahud, E.; Melgaco Nunes Branco, L.A.; Rocco Lahr, F.A. Analysis of Moisture Content Variation on Strength and Stiffness Properties of Cedrela Odorata Wood Species. Wood Res. 2022, 67, 231–240. [Google Scholar] [CrossRef]
- Miao, Y.; Li, R.; Qian, X.; Yin, Y.; Yang, Y.; Jin, X.; Lin, B.; Liu, Y.; Liu, Z. Effect of extraction on the acoustic vibrational properties of Picea jezoensis var. microsperma (Lindl.) WCCheng & LKFu. Ann. For. Sci. 2021, 78, 24. [Google Scholar]
- Hu, W.; Li, S.; Liu, Y. Vibrational Characteristics of Four Wood Species Commonly Used in Wood Products. Bioresources 2021, 16, 7100–7110. [Google Scholar] [CrossRef]
- Viala, R.; Placet, V.; Cogan, S. Simultaneous non-destructive identification of multiple elastic and damping properties of spruce tonewood to improve grading. J. Cult. Herit. 2020, 42, 108–116. [Google Scholar] [CrossRef]
- Yang, Y.; Liu, Z.; Liu, Y. Prediction of lute acoustic quality based on soundboard vibration performance using multiple choice model. J. For. Res. 2017, 28, 855–861. [Google Scholar] [CrossRef]
- Hilde, C.; Woodward, R.; Avramidis, S.; Hartley, I.D. The Acoustic Properties of Water Submerged Lodgepole Pine (Pinus contorta) and Spruce (Picea spp.) Wood and Their Suitability for Use as Musical Instruments. Materials 2014, 7, 5688–5699. [Google Scholar] [CrossRef]
- Sotomayor Castellanos, J.R.; Villaseñor Aguilar, J.M. Material properties and acoustic performance indexes of twenty-two Mexican woods. Measurement by ultrasound. Madera Bosques 2018, 24, e2431132. [Google Scholar]
- Munk, C.; Pfriem, A. Influence of thermal modification and subsequent linseed oil impregnation on the sound propagation velocity and related acoustic properties of various wood species. In Proceedings of the Tenth European Conference on Wood Modification, Nancy, France, 25–26 April 2022. [Google Scholar]
- Montero, M.J.; de la Mata, J.; Esteban, M.; Hermoso, E. Influence of moisture content on the wave velocity to estimate the mechanical properties of large cross-section pieces for structural use of scots pine from spain. Maderas-Cienc. Tecnol. 2015, 17, 407–420. [Google Scholar] [CrossRef]
- Llana, D.F.; Iniguez-Gonzalez, G.; Martinez, R.D.; Arriaga, F. Influence of timber moisture content on wave time-of-flight and longitudinal resonance frequency in coniferous species for different instruments. Holzforschung 2018, 72, 405–411. [Google Scholar] [CrossRef]
- Llana, D.F.; Iniguez-Gonzalez, G.; Esteban, M.; Hermoso, E.; Arriaga, F. Timber moisture content adjustment factors for nondestructive testing (NDT): Acoustic, vibration and probing techniques. Holzforschung 2020, 74, 817–827. [Google Scholar] [CrossRef]
- Nkibeu, J.B.; Makomra, V.; Sali, M.; Jeremie, M. Damping properties of some tropical wood species determined by free transverse vibration method. Wood Mater. Sci. Eng. 2024, 1–7. [Google Scholar] [CrossRef]
- Sedik, Y.; Hamdan, S.; Jusoh, I.; Hasan, M. Acoustic Properties of Selected Tropical Wood Species. J. Nondestruct. Eval. 2010, 29, 38–42. [Google Scholar] [CrossRef]
- Goeken, J.; Fayed, S.; Schaefer, H.; Enzenauer, J. A Study on the Correlation between Wood Moisture and the Damping Behaviour of the Tonewood Spruce. Acta Phys. Pol. A 2018, 133, 1241–1260. [Google Scholar] [CrossRef]
- Zhang, L.; Tiemann, A.; Zhang, T.; Gauthier, T.; Hsu, K.; Mahamid, M.; Moniruzzaman, P.K.; Ozevin, D. Nondestructive assessment of cross-laminated timber using non-contact transverse vibration and ultrasonic testing. Eur. J. Wood Wood Prod. 2021, 79, 335–347. [Google Scholar] [CrossRef]
- Kohantorabi, M.; Hemmasi, A.; Talaeipour, M.; Roohnia, M.; Bazyar, B. Effect of Artificial Inhomogeneity of Density and Drilling on Dynamic Properties Developed by Poplar Block Species (Populus nigra) Jointed with Oak Wood (Quercus castaneifolia) Beams. Bioresources 2020, 15, 4711–4726. [Google Scholar] [CrossRef]
- Brancheriau, L.; Kouchade, C.; Bremaud, I. Internal friction measurement of tropical species by various acoustic methods. J. Wood Sci. 2010, 56, 371–379. [Google Scholar] [CrossRef]
Disclaimer/Publisher’s Note: The statements, opinions and data contained in all publications are solely those of the individual author(s) and contributor(s) and not of MDPI and/or the editor(s). MDPI and/or the editor(s) disclaim responsibility for any injury to people or property resulting from any ideas, methods, instructions or products referred to in the content. |
© 2025 by the authors. Licensee MDPI, Basel, Switzerland. This article is an open access article distributed under the terms and conditions of the Creative Commons Attribution (CC BY) license (https://creativecommons.org/licenses/by/4.0/).