
Stand Structures and Carbon Storage Potential of Mangroves in Chaungkaphee Protected Public Forest, Tanintharyi Coastal Region, Myanmar


Abstract
1. Introduction
2. Methodology
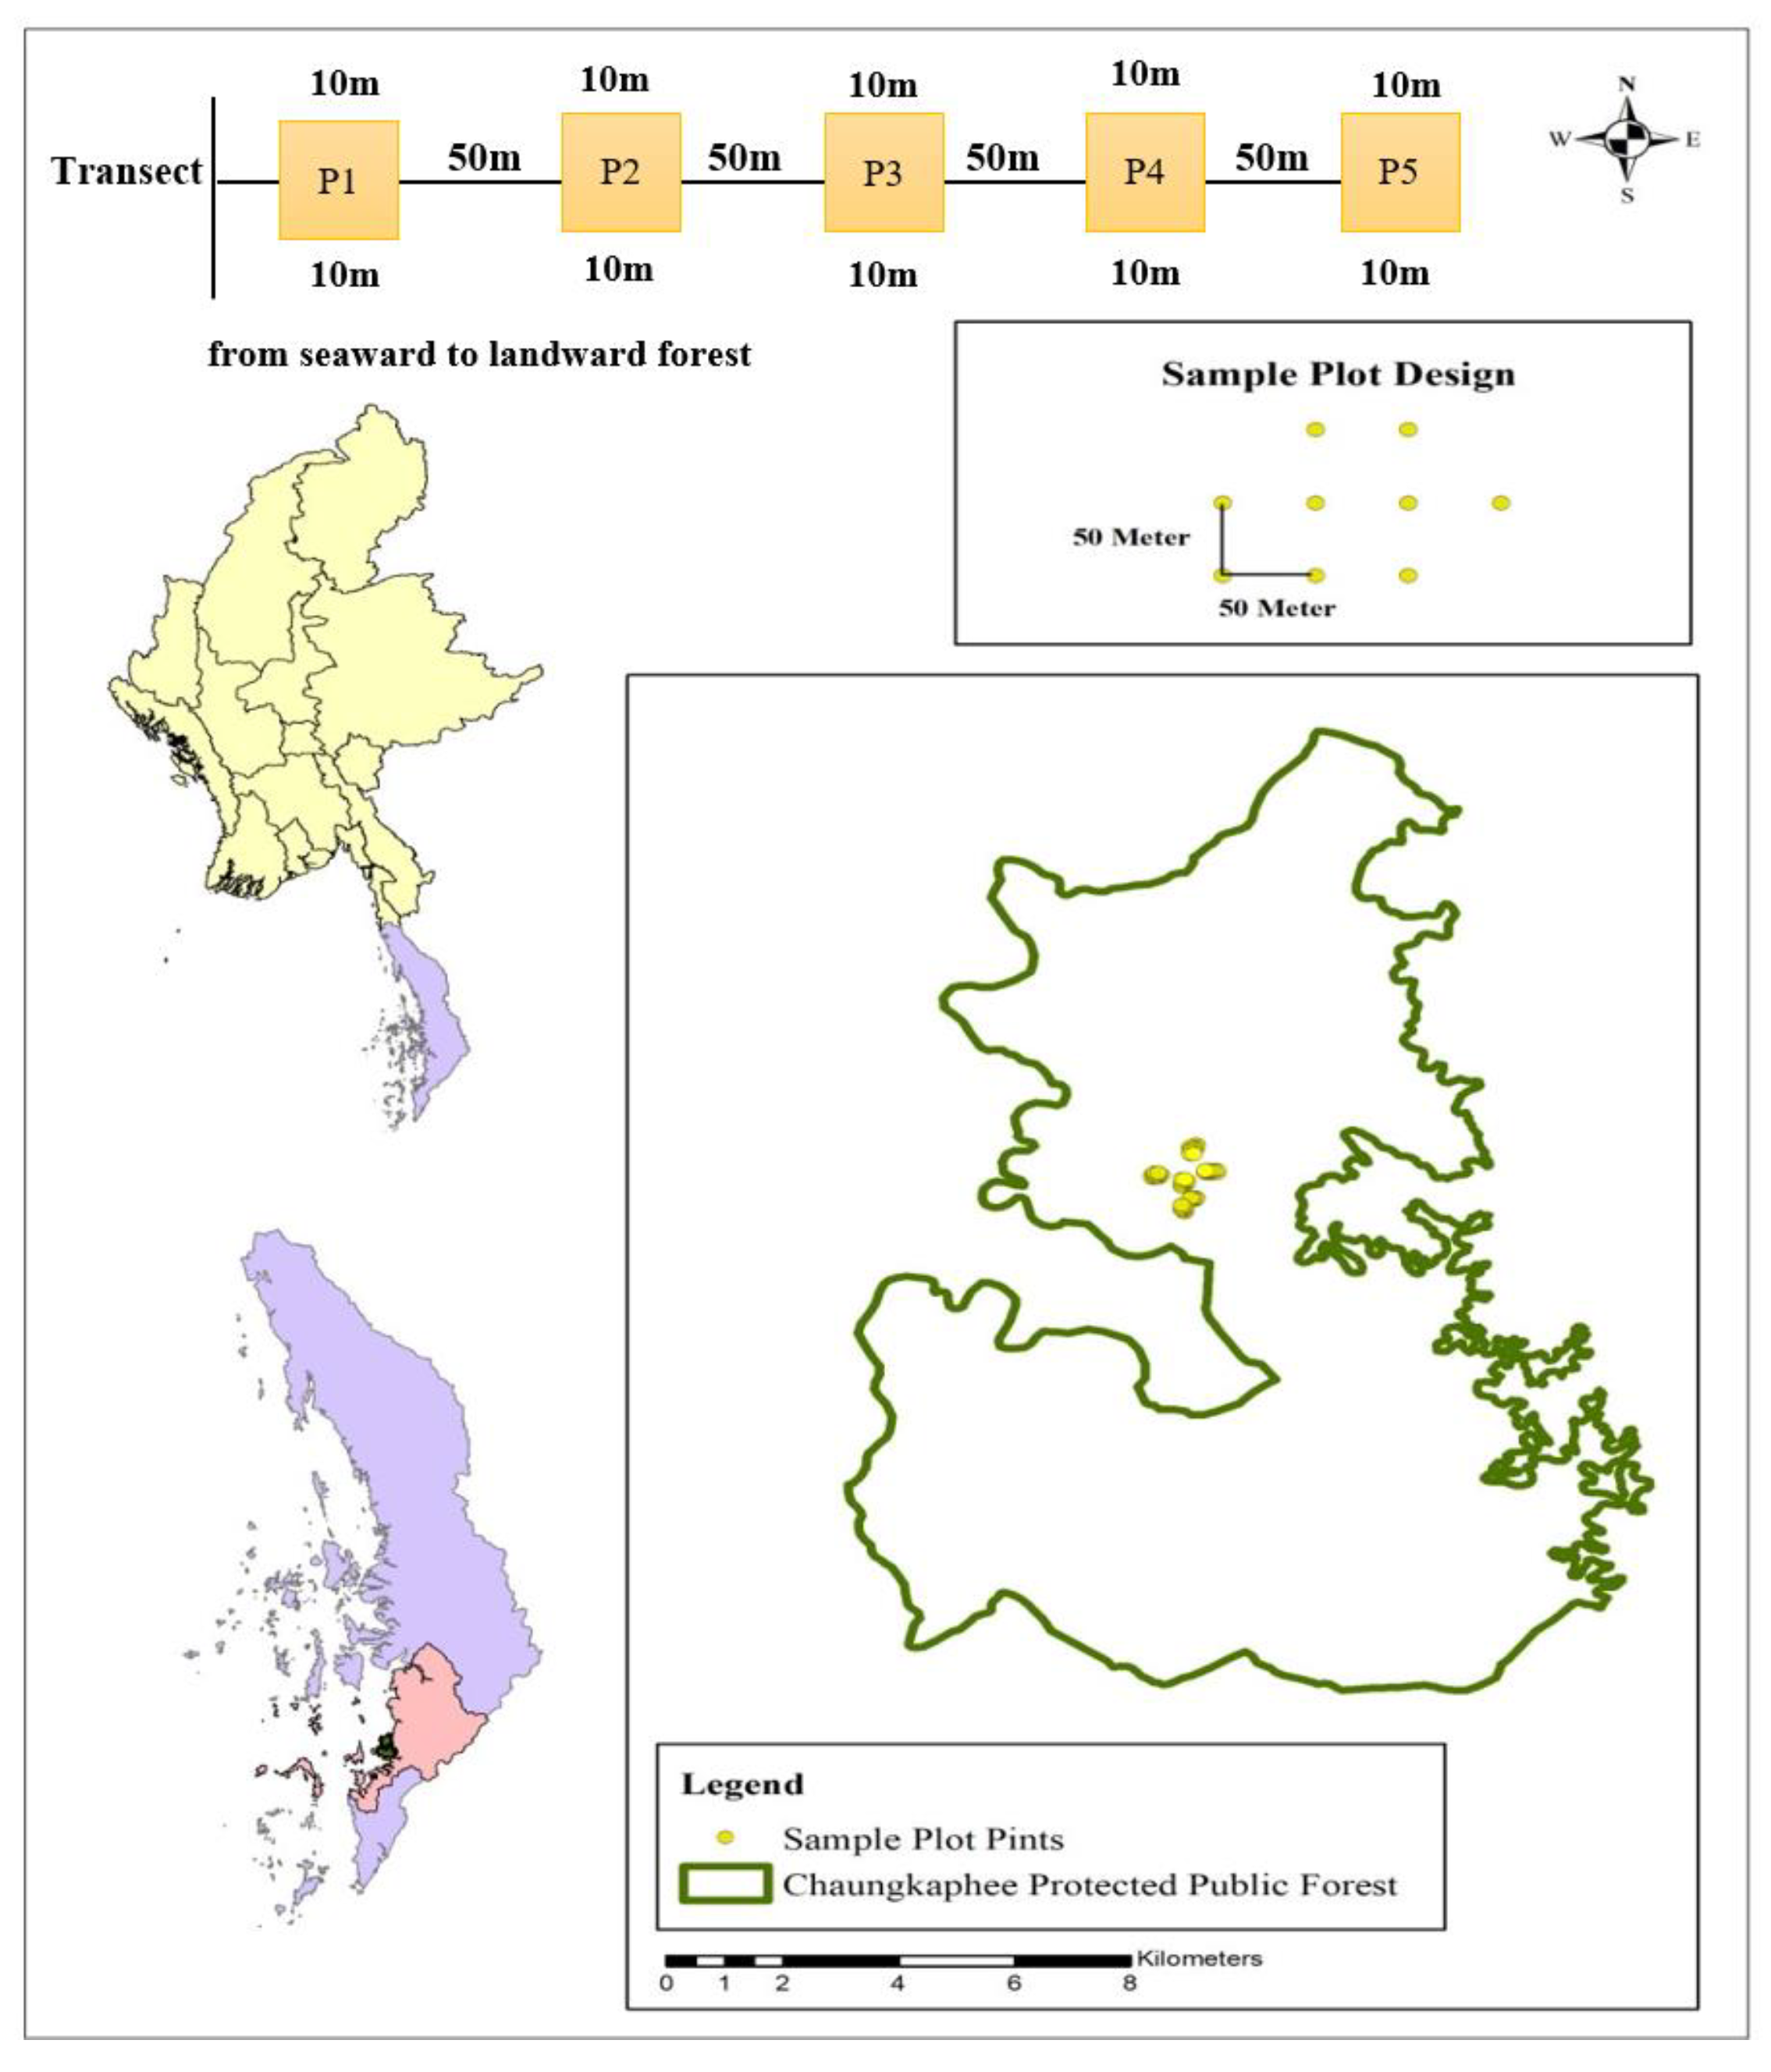
2.1. Study Site
2.2. Sampling Design and Data Collection
2.3. Soil Carbon Pool Estimation
2.4. Forest Structure and Biodiversity Index
2.5. Estimation of Carbon Stock
2.6. Statistical Analysis
3. Results
3.1. Stand Structure and Species Composition
3.2. Species Abundance in Natural Regeneration
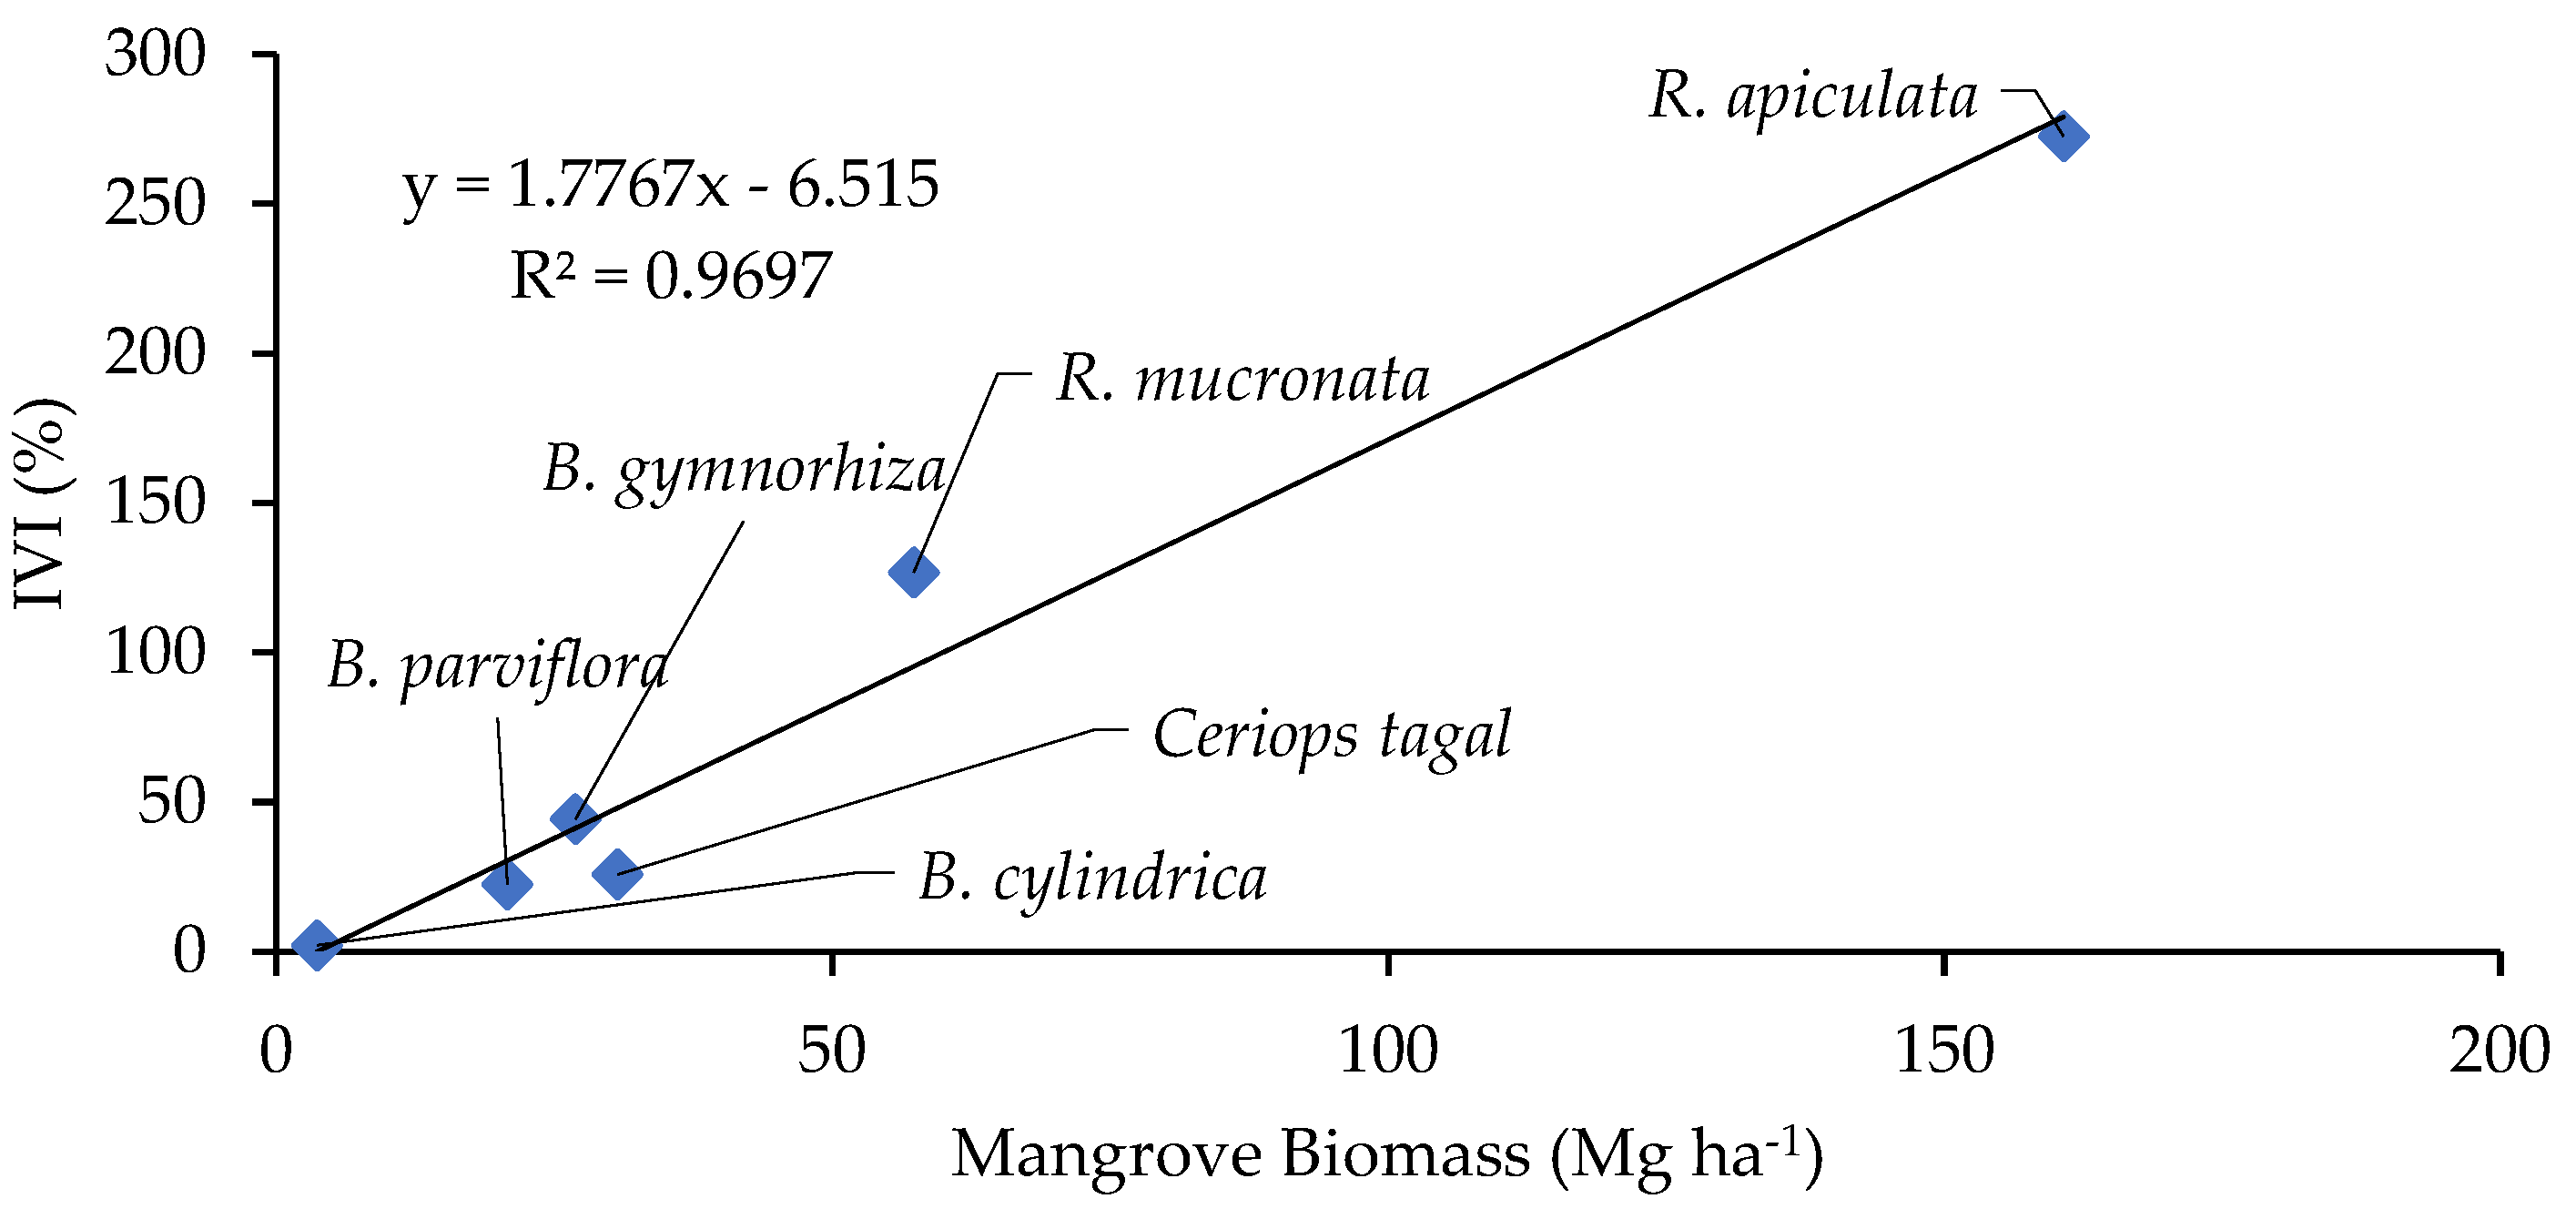
3.3. Vegetation Biomass and Carbon Stocks
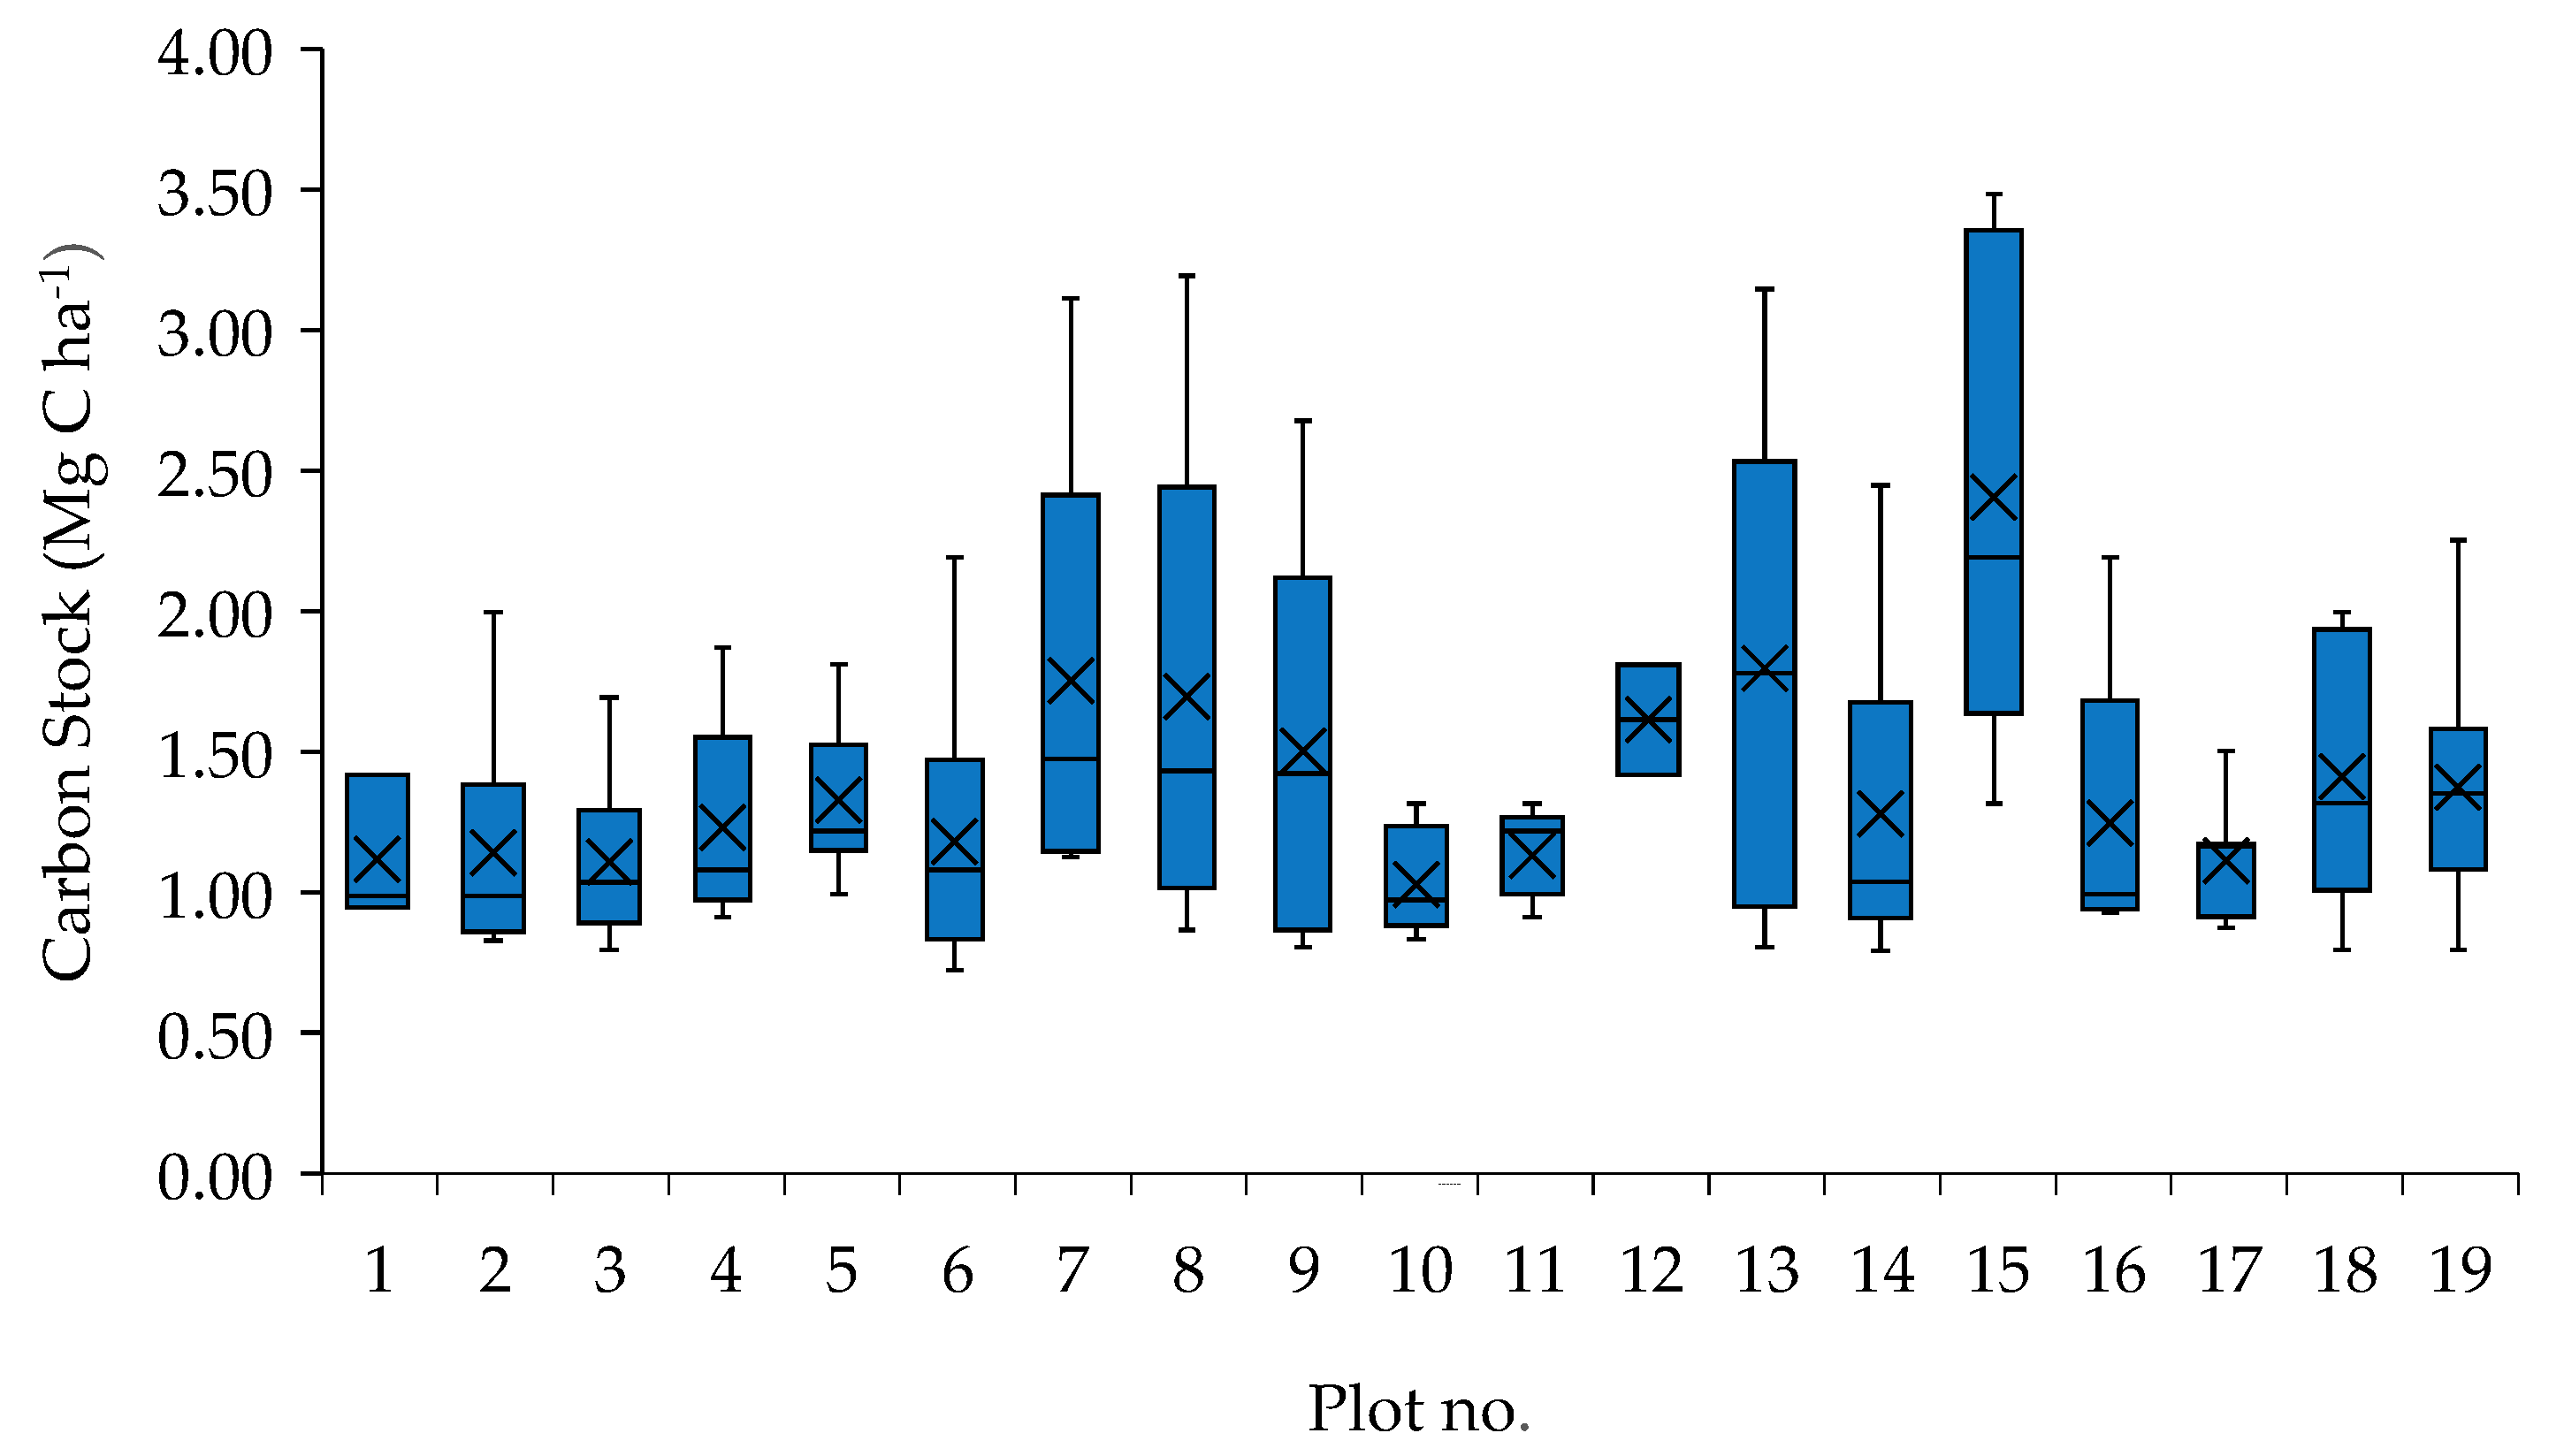
3.4. Vegetation Carbon Stocks per Plot
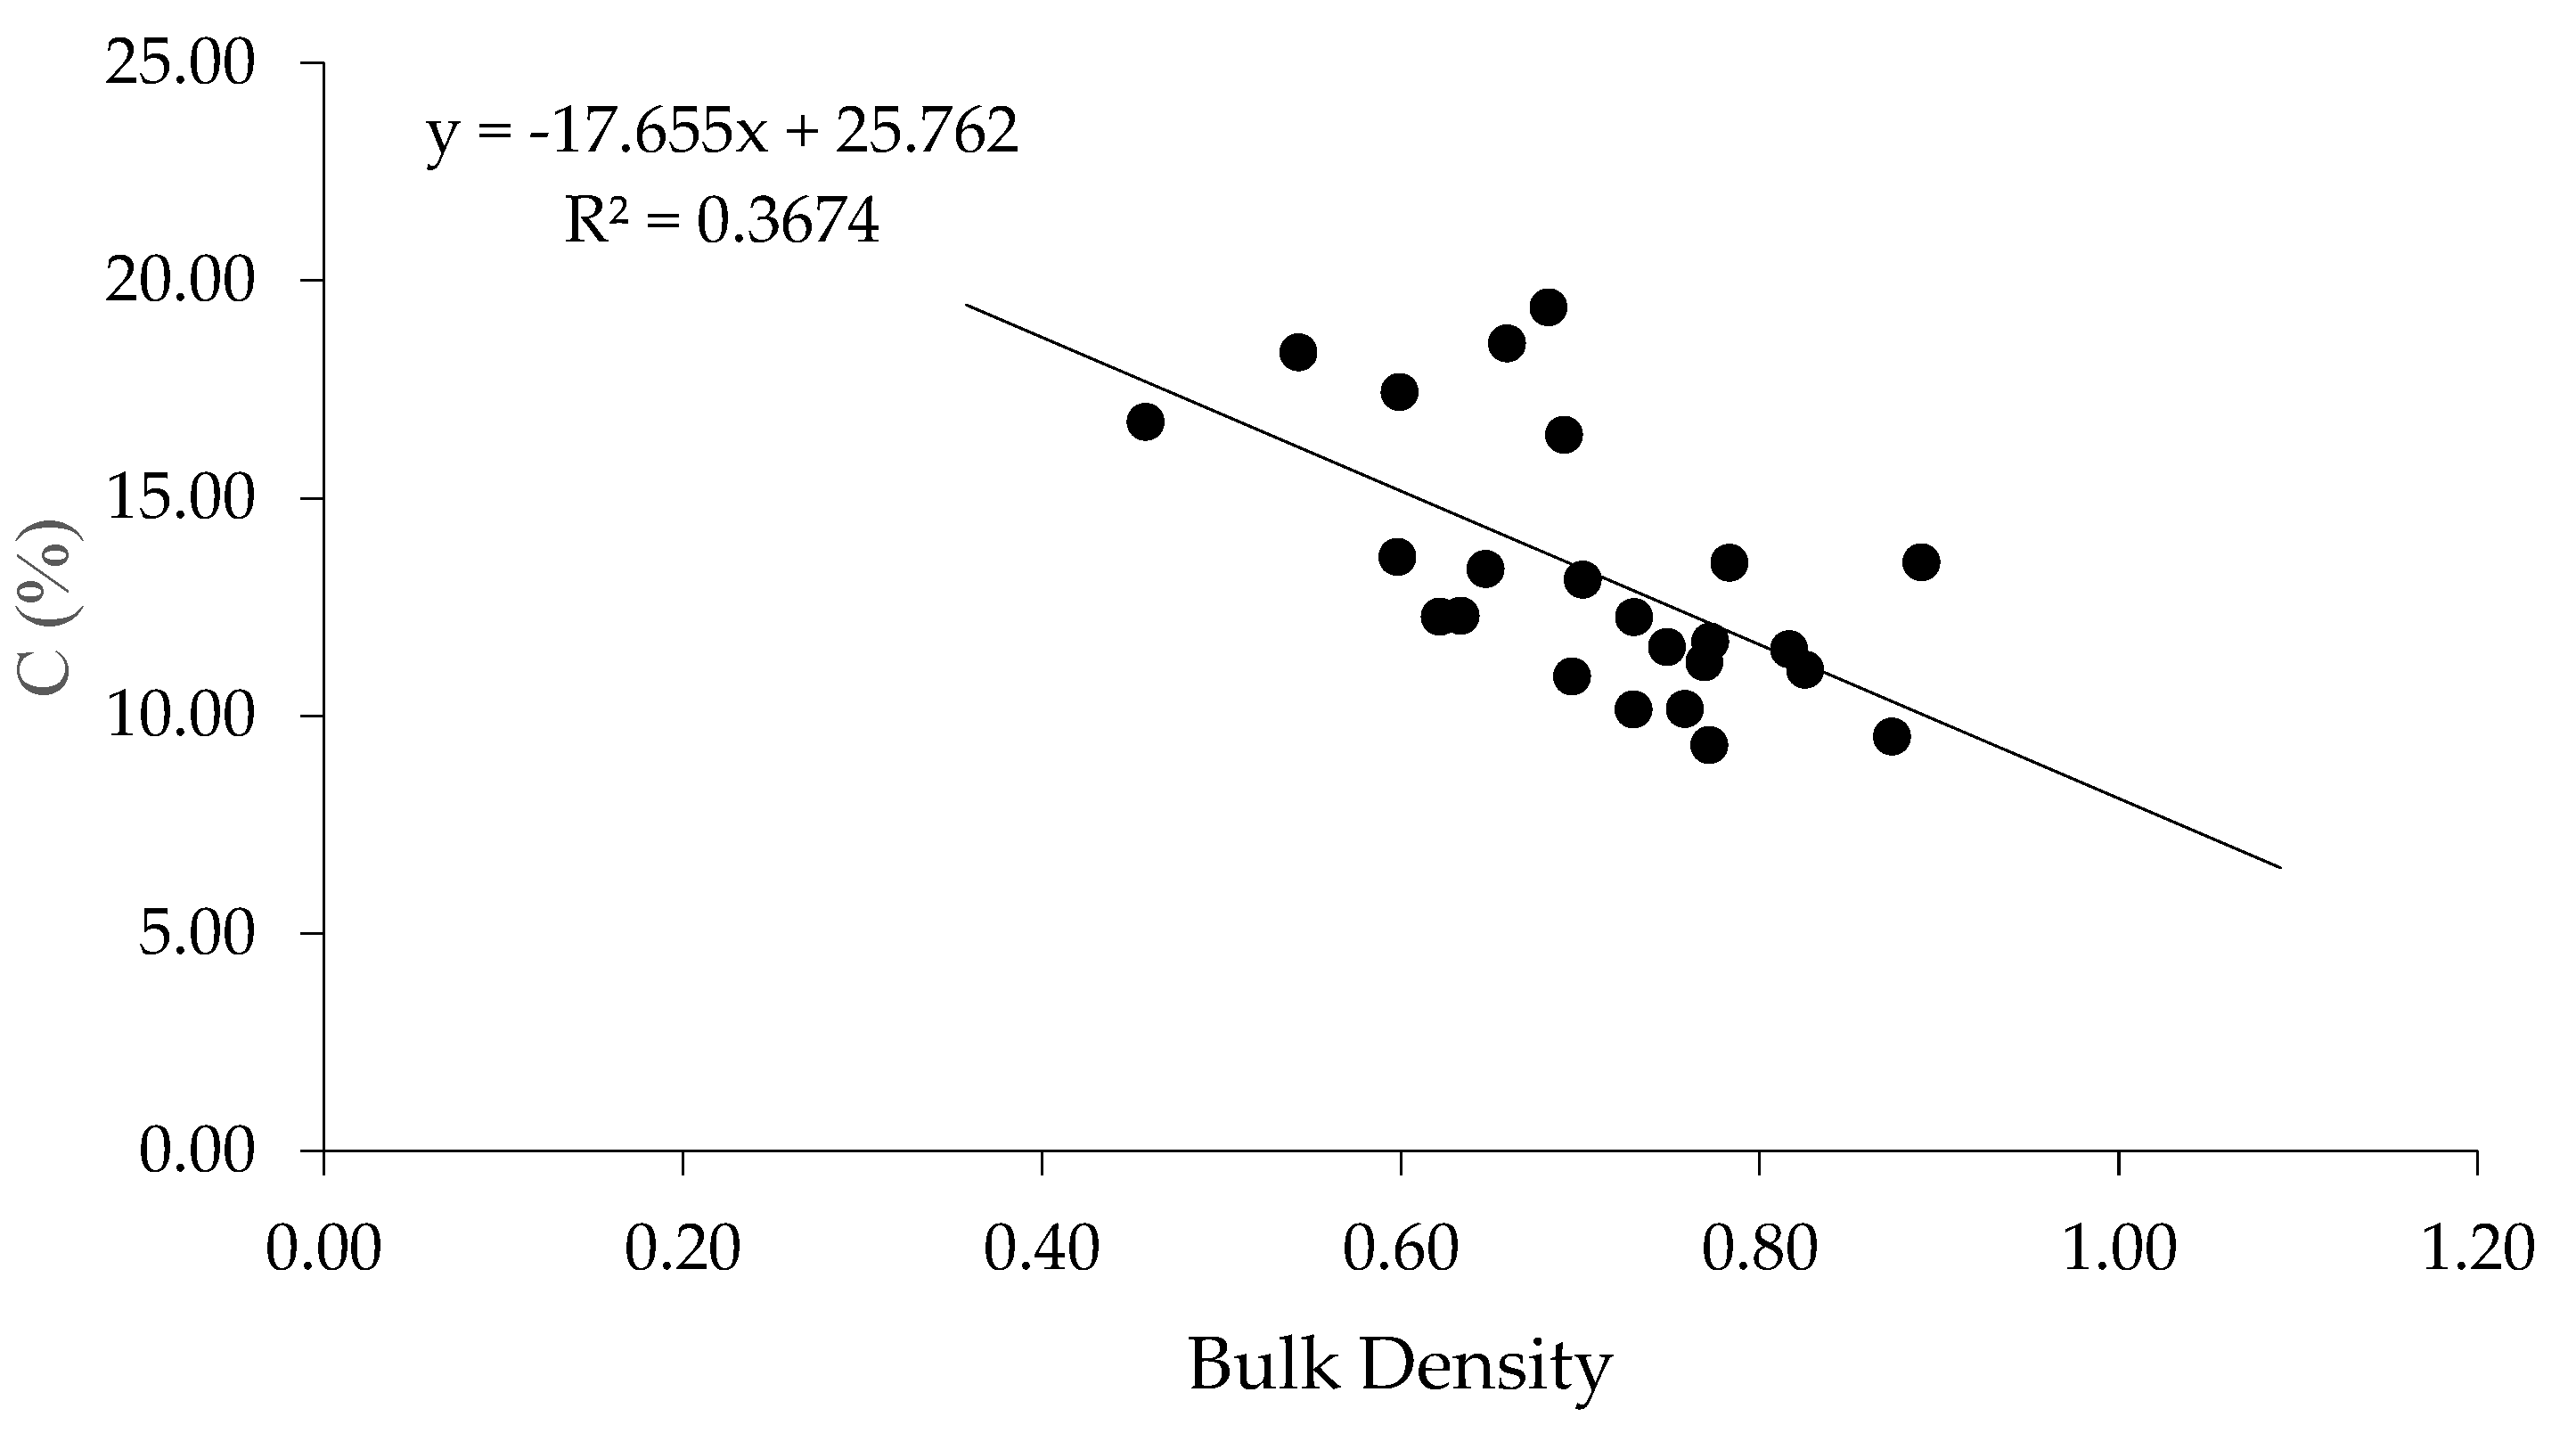
3.5. Soil Carbon Stock
3.6. Ecosystem Carbon Stock
4. Discussion
4.1. Structural Characteristics
4.2. Carbon Stock Valuation Estimates
5. Conclusions
Author Contributions
Funding
Data Availability Statement
Acknowledgments
Conflicts of Interest
Abbreviations
| DBH | Diameter at Breast Height |
| GPS | Global Positioning System |
| IVI | Importance Value Index |
| PPF | Protected Public Forest |
| MRRP | Myanmar Reforestation and Rehabilitation Program |
| WIF | Worldview International Foundation |
| WWF | World Wildlife Fund |
References
- Hilaluddin, F.; Yusoff, F.M.; Natrah, F.M.I.; Lim, P.T. Disturbance of Mangrove Forests Causes Alterations in Estuarine Phytoplankton Community Structure in Malaysian Matang Mangrove Forests. Mar. Environ. Res. 2020, 158, 104935. [Google Scholar] [CrossRef]
- Bird, E.C.F. Mangroves and Intertidal Morphology in Westernport Bay, Victoria, Australia. Mar. Geol. 1986, 69, 251–271. [Google Scholar] [CrossRef]
- Kazemi, A.; Castillo, L.; Curet, O.M. Mangrove Roots Model Suggest an Optimal Porosity to Prevent Erosion. Sci. Rep. 2021, 11, 9969. [Google Scholar] [CrossRef]
- Spenceley, A.P. The Role of Pneumatophores in Sedimentary Processes. Mar. Geol. 1977, 24, M31–M37. [Google Scholar] [CrossRef]
- Chu, T.-J.; Hsieh, H.-L.; Liao, C.; Huang, W.; Qian, W.; Moya, R.; Tenorio, C.; Torres-Gómez, D.; Cifuentes-Jara, M. Variation in Annual Ring and Wood Anatomy of Six Tree Mangrove Species in the Nicoya Gulf of Costa Rica. Water 2024, 16, 3207. [Google Scholar] [CrossRef]
- Asari, N.; Suratman, M.N.; Mohd Ayob, N.A.; Abdul Hamid, N.H. Mangrove as a Natural Barrier to Environmental Risks and Coastal Protection. In Mangroves: Ecology, Biodiversity and Management; Springer: Singapore, 2021; pp. 305–322. [Google Scholar]
- Aung, T.T.; Than, M.M.; Katsuhiro, O.; Yukira, M. Assessing the Status of Three Mangrove Species Restored by the Local Community in the Cyclone-Affected Area of the Ayeyarwady Delta, Myanmar. Wetl. Ecol. Manag. 2011, 19, 195–208. [Google Scholar] [CrossRef]
- FAO. FRA 2020 Report, Myanmar; FAO: Rome, Italy, 2020; Volume 1. [Google Scholar]
- Krauss, K.W.; Friess, D.A. World Atlas of Mangroves. Wetlands 2011, 31, 1003–1005. [Google Scholar] [CrossRef]
- Zöckler, C.; Aung, C. The Mangroves of Myanmar. In Sabkha Ecosystems: Volume VI: Asia/Pacific; Springer: Cham, Switzerland, 2019; pp. 253–268. [Google Scholar]
- Aye, W.N.; Wen, Y.; Marin, K.; Thapa, S.; Tun, A.W. Contribution of Mangrove Forest to the Livelihood of Local Communities in Ayeyarwaddy Region, Myanmar. Forests 2019, 10, 414. [Google Scholar] [CrossRef]
- Food and Agriculture Organization of the United Nations. Global Forest Resources Assessment 2010: Main. Report; Food and Agriculture Organization of the United Nations: Rome, Italy, 2010; ISBN 925106654X. [Google Scholar]
- Tun, Z.N.; Dargusch, P.; McMoran, D.J.; McAlpine, C.; Hill, G. Patterns and Drivers of Deforestation and Forest Degradation in Myanmar. Sustainability 2021, 13, 7539. [Google Scholar] [CrossRef]
- Richards, D.R.; Friess, D.A. Rates and Drivers of Mangrove Deforestation in Southeast Asia, 2000–2012. Proc. Natl. Acad. Sci. USA 2016, 113, 344–349. [Google Scholar] [CrossRef]
- Gaw, L.Y.F.; Linkie, M.; Friess, D.A. Mangrove Forest Dynamics in Tanintharyi, Myanmar from 1989–2014, and the Role of Future Economic and Political Developments. Singap. J. Trop. Geogr. 2018, 39, 224–243. [Google Scholar] [CrossRef]
- Mai Van, C.; Ngo, A.; Mai, T.; Dao, H.T. Bamboo Fences as a Nature-Based Measure for Coastal Wetland Protection in Vietnam. Front. Mar. Sci. 2021, 8, 756597. [Google Scholar]
- Schmitt, K.; Albers, T. Mangroves and Ecosystem-Based Coastal Protection in the Mekong River Delta, Vietnam. In Mangrove Biology, Ecosystem, and Conservation; IntechOpen: London, UK, 2023; ISBN 1837685908. [Google Scholar]
- Soe, K.K. The Interaction of Community Forestry with Rural Livelihoods in Myanmar: Challenges and Opportunities. Ph.D. Thesis, The Australian National University, Acton, Australia, 2018. [Google Scholar]
- Kauffman, J.B.; Adame, M.F.; Arifanti, V.B.; Schile-beers, L.M.; Bernardino, A.F.; Bhomia, R.K.; Donato, D.C.; Feller, I.C.; Ferreira, T.O.; Del Carmen Jesus Garcia, M.; et al. Total Ecosystem Carbon Stocks of Mangroves across Broad Global Environmental and Physical Gradients. Ecol. Monogr. 2020, 90, e01405. [Google Scholar] [CrossRef]
- Yong, Y.; Baipeng, P.; Guangcheng, C.; Yan, C. Processes of Organic Carbon in Mangrove Ecosystems. Acta Ecol. Sin. 2011, 31, 169–173. [Google Scholar] [CrossRef]
- Tan, L.-S.; Ge, Z.-M.; Li, S.-H.; Li, Y.-L.; Xie, L.-N.; Tang, J.-W. Reclamation-Induced Tidal Restriction Increases Dissolved Carbon and Greenhouse Gases Diffusive Fluxes in Salt Marsh Creeks. Sci. Total Environ. 2021, 773, 145684. [Google Scholar]
- Laffoley, D.; Grimsditch, G.D. The Management of Natural Coastal Carbon Sinks; Iucn: Gland, Switzerland, 2009; ISBN 283171205X. [Google Scholar]
- Machiwa, J.F.; Hallberg, R.O. An Empirical Model of the Fate of Organic Carbon in a Mangrove Forest Partly Affected by Anthropogenic Activity. Ecol. Modell. 2002, 147, 69–83. [Google Scholar] [CrossRef]
- Natarajan, M.; Ayyappan, S. Carbon Stock Assessment on Natural Mangrove Species of Avicennia Marina in Pichavaram Mangrove Forest Southeast Coast of India. Res. Sq. 2022. preprint. [Google Scholar]
- Zanvo, S.M.G.; Mensah, S.; Salako, K.V.; Kakaï, R.G. Tree Height-Diameter, Aboveground and Belowground Biomass Allometries for Two West African Mangrove Species. Biomass Bioenergy 2023, 176, 106917. [Google Scholar] [CrossRef]
- Trégarot, E.; Catry, T.; Pottier, A.; El-Hacen, E.H.M.; Sidi Cheikh, M.A.; Cornet, C.C.; Maréchal, J.P.; Failler, P. Coastal Protection Assessment: A Tradeoff between Ecological, Social, and Economic Issues. Ecosphere 2021, 12, ee03364. [Google Scholar] [CrossRef]
- Wang, Y.; Wang, X.; Khan, S.; Zhou, D.; Ke, Y. Evaluation of Mangrove Restoration Effectiveness Using Remote Sensing Indices—A Case Study in Guangxi Shankou Mangrove National Natural Reserve, China. Front. Mar. Sci. 2023, 10, 1280373. [Google Scholar] [CrossRef]
- Abino, A.C.; Castillo, J.A.A.; Lee, Y.J. Assessment of Species Diversity, Biomass and Carbon Sequestration Potential of a Natural Mangrove Stand in Samar, the Philippines. For. Sci. Technol. 2014, 10, 2–8. [Google Scholar] [CrossRef]
- Asadi, M.A.; Pambudi, G.S. Diversity and Biomass of Mangrove Forest within Baluran National Park, Indonesia. Aquac. Aquar. Conserv. Legis. 2020, 13, 19–27. [Google Scholar]
- Mori, N.; Chang, C.-W.; Inoue, T.; Akaji, Y.; Hinokidani, K.; Baba, S.; Takagi, M.; Mori, S.; Koike, H.; Miyauchi, M. Parameterization of Mangrove Root Structure of Rhizophora Stylosa in Coastal Hydrodynamic Model. Front. Built Environ. 2022, 7, 782219. [Google Scholar] [CrossRef]
- Aryal, D.R.; Ruiz, D.E.M.; Marroquín, C.N.T.; Ruiz, R.P.; Hernández, F.G.; Venegas, J.A.V.; Mendoza, A.P.; López, G.V.; Lugo, F.C.; Larramendi, L.A.R.; et al. Soil Organic Carbon Depletion from Forests to Grasslands Conversion in Mexico: A Review. Agriculture 2018, 8, 181. [Google Scholar] [CrossRef]
- de Blécourt, M.; Brumme, R.; Xu, J.; Corre, M.D.; Veldkamp, E. Soil Carbon Stocks Decrease Following Conversion of Secondary Forests to Rubber (Hevea Brasiliensis) Plantations. PLoS ONE 2013, 8, e69357. [Google Scholar] [CrossRef]
- Motsara, M.R.; Roy, R.N. Guide to Laboratory Establishment for Plant Nutrient Analysis; Food and Agriculture Organization of the United Nations: Rome, Italy, 2008. [Google Scholar]
- Sheikh, M.A.; Kumar, M.; Bussmann, R.W. Altitudinal Variation in Soil Organic Carbon Stock in Coniferous Subtropical and Broadleaf Temperate Forests in Garhwal Himalaya. Carbon Balance Manag. 2009, 4, 6. [Google Scholar] [CrossRef]
- Donato, D.C.; Kauffman, J.B.; Murdiyarso, D.; Kurnianto, S.; Stidham, M.; Kanninen, M. Mangroves among the Most Carbon-Rich Forests in the Tropics. Nat. Geosci. 2011, 4, 293–297. [Google Scholar] [CrossRef]
- Schaefer-Novelli, C.; Cintron, G.; Novelli, Y.S. Methods for Studying Mangrove Structure. In The Mangrove Ecosystem: Research Methods; Snedaker, S.C., Snedaker, J.G., Eds.; United Nations Educational, Scientific and Cultural Organization: Paris, France, 1984; pp. 91–113. Available online: http://www.sciepub.com/reference/14979 (accessed on 2 December 2021).
- Curtis, J.T.; McIntosh, R.P. The Interrelations of Certain Analytic and Synthetic Phytosociological Characters. Ecology 1950, 31, 434–455. [Google Scholar] [CrossRef]
- Shannon, C.E.; Weaver, W. The Mathematical Theory of Communication; The University of Illinois Press: Urbana, IL, USA, 1949; 117p. [Google Scholar]
- Komiyama, A.; Poungparn, S.; Kato, S. Common Allometric Equations for Estimating the Tree Weight of Mangroves. J. Trop. Ecol. 2005, 21, 471–477. [Google Scholar] [CrossRef]
- Chave, J.; Coomes, D.; Jansen, S.; Lewis, S.L.; Swenson, N.G.; Zanne, A.E. Towards a Worldwide Wood Economics Spectrum. Ecol. Lett. 2009, 12, 351–366. [Google Scholar] [CrossRef]
- IPCC. 2006 IPCC—Guidelines for National Greenhouse Gas Inventories; IPCC: Geneva, Switzerland, 2006. [Google Scholar]
- Curtis, R.O.; Post, B.W. Estimating Bulk Density from Organic-matter Content in Some Vermont Forest Soils. Soil Sci. Soc. Am. J. 1964, 28, 285–286. [Google Scholar]
- Aina, O.; Agboola, K.; Owoeye, M.; Ayodele, F. Comparison between the Bulk Density of Fallowed and Continuously Cultivated Lands: A Case Study of Kogi State University Research Farm. East Afr. Sch. J. Agric. Life Sci. 2019, 2, 414–419. [Google Scholar]
- Kang, L.; Huamei, H.; Ran, Y.; Shengpeng, Z.; Di, D.; Bo, P. Carbon Storage Potential and Influencing Factors of Mangrove Plantation in Kaozhouyang, Guangdong Province, South China. Front. Mar. Sci. 2025, 11, 1439266. [Google Scholar]
- Tun, A.W.; Aye, W.N. Impact of Planted Mangrove Species on Biomass Carbon and Other Structural Attributes in Ayeyarwady Region. Open J. For. 2023, 14, 98–116. [Google Scholar]
- Faridah-Hanum, I.; Kudus, K.A.; Saari, N.S. Plant Diversity and Biomass of Marudu Bay Mangroves in Malaysia. Pak. J. Bot. 2012, 44, 151–156. [Google Scholar]
- Tomlinson, P.B. The Botany of Mangroves. Kew Bull. 1986, 234, 373–374. [Google Scholar] [CrossRef]
- Alongi, D.M. Mangrove Forests: Resilience, Protection from Tsunamis, and Responses to Global Climate Change. Estuar. Coast. Shelf Sci. 2008, 76, 1–13. [Google Scholar] [CrossRef]
- Murray, B.; Pendleton, L.; Jenkins, W.; Sifleet, S. Green Payments for Blue Carbon: Economic Incentives for Protecting Threatened Coastal Habitats; Nicholas Institute for Environmental Policy Solutions, Duke University: Durham, NC, USA, 2011. [Google Scholar]
- Ariyanto, D.; Bengen, D.G.; Prartono, T.; Wardiatno, Y. Productivity and CNP Availability in Rhizophora Apiculata Blume and Avicennia Marina (Forssk.) Vierh. at Banggi Coast, Central Java-Indonesia. Adv. Environ. Sci. 2018, 10, 137. [Google Scholar]
- Walters, B.B.; Rönnbäck, P.; Kovacs, J.M.; Crona, B.; Hussain, S.A.; Badola, R.; Primavera, J.H.; Barbier, E.; Dahdouh-Guebas, F. Ethnobiology, Socio-Economics and Management of Mangrove Forests: A Review. Aquat. Bot. 2008, 89, 220–236. [Google Scholar] [CrossRef]
- Asadi, M.A.; Al-kareem, A.S.; Aprilianto, R.Y.; Sartimbul, A.; Yamindago, A.; Saputra, D.K.; Riyadi, A. Assessment of Mangrove Structures and Biomass on Islands along the Java Sea: A Case Study on Bawean Islands and Karimunjawa Islands. Front. Ecol. Evol. 2024, 12, 1422749. [Google Scholar]
- Asadi, M.A.; Yona, D.; Saputro, S.E. Species Diversity, Biomass, and Carbon Stock Assessments of Mangrove Forest in Labuhan, Indonesia. In IOP Conference Series: Earth and Environmental Science; IOP Publishing Ltd.: Bristol, UK, 2018; Volume 151, pp. 1955–1962. [Google Scholar]
- Kiruba-Sankar, R.; Krishnan, P.; Dam Roy, S.; Raymond Jani Angel, J.; Goutham-Bharathi, M.P.; Lohith Kumar, K.; Ragavan, P.; Kaliyamoorthy, M.; Muruganandam, R.; Rajakumari, S. Structural Complexity and Tree Species Composition of Mangrove Forests of the Andaman Islands, India. J. Coast. Conserv. 2018, 22, 217–234. [Google Scholar]
- Acharya, S.; Patra, D.K.; Mahalik, G.; Mohapatra, P.K. Quantitative Ecological Study of Rhizophoraceae Mangroves of Bhitarkanika Wildlife Sanctuary Regions of Odisha Coast, India. Proc. Natl. Acad. Sci. India Sect. B Biol. Sci. 2021, 91, 897–908. [Google Scholar]
- Guo, Z.; Huang, Y.; Chen, Y.; Duke, N.C.; Zhong, C.; Shi, S. Genetic Discontinuities in a Dominant Mangrove Rhizophora Apiculata (Rhizophoraceae) in the Indo-Malesian Region. J. Biogeogr. 2016, 43, 1856–1868. [Google Scholar]
- Kusmana, C.; Azizah, N.A. Species Composition and Vegetation Structure of Mangrove Forest in Pulau Rambut Wildlife Reserve, Kepulauan Seribu, DKI Jakarta. In IOP Conference Series: Earth and Environmental Science; IOP Publishing: Bristol, UK, 2022; Volume 950, p. 012020. [Google Scholar]
- Joshi, H.G.; Ghose, M. Community Structure, Species Diversity, and Aboveground Biomass of the Sundarbans Mangrove Swamps. Trop. Ecol. 2014, 55, 283–303. [Google Scholar]
- Aye, W.N.; Tong, X.; Tun, A.W. Species Diversity, Biomass and Carbon Stock Assessment of Kanhlyashay Natural Mangrove Forest. Forests 2022, 13, 1013. [Google Scholar] [CrossRef]
- Patindol, T.A.; Casas, E.V., Jr. Species Diversity and Composition of Mangroves in Tacloban City, Philippines. Ann. Trop. Res. 2019, 41, 67–75. [Google Scholar] [CrossRef]
- Pototan, B.; Capin, N.; Delima, A.G.; Novero, A. Assessment of Mangrove Species Diversity in Banaybanay, Davao Oriental, Philippines. Biodiversitas 2021, 22, 144–153. [Google Scholar]
- Lillo, E.P.; Malaki, A.; Alcazar, S.; Rosales, R.; Redoblado, B.; Diaz, J.; Pantinople, E.; Nuevo, R. Composition and Diversity of Mangrove Species in Camotes Island, Cebu, Philippines. J. Mar. Isl. Cult. 2022, 11, 158–174. [Google Scholar]
- Kridiborworn, P.; Chidthaisong, A.; Yuttitham, M.; Tripetchkul, S. Carbon Sequestration by Mangrove Forest Planted Specifically for Charcoal Production in Yeesarn, Samut Songkram. J. Sustain. Energy Environ. 2012, 3, 87–92. [Google Scholar]
- Calipayan, M.M.; Bello, M.P.; Aloquin, R.D.; Aculan, M.C.; Grace, S.; Brillantes, A. Diversity, Stand Structure, Biomass and Carbon Storage Potential of Natural and Planted Mangrove Forests in Samar, Philippines. J. Biodivers. Environ. Sci. 2024, 2024, 92–104. [Google Scholar]
- Alimbon, J.A.; Manseguiao, M.R.S. Species Composition, Stand Characteristics, Aboveground Biomass, and Carbon Stock of Mangroves in Panabo Mangrove Park, Philippines. Biodiversitas 2021, 22, 3130–3137. [Google Scholar] [CrossRef]
- Tobias, A.; Umali, A.G.A.; Malabrigo, P.; Galang, M.A. Mangrove Forest Inventory and Estimation of Carbon Storage and Sedimentation in Pagbilao. Wealth Account. Valuat. Ecosyst. Serv. 2017, 1–95. [Google Scholar]
- Henri, H.; Farhaby, A.M.; Supratman, O.; Adi, W.; Febrianto, S. Assessment of Species Diversity, Biomass and Carbon Stock of Mangrove Forests on Belitung Island, Indonesia. Biodiversitas 2024, 25, 21–29. [Google Scholar]
- Islam, M.S.; Saha, C.; Hossain, M. Biomass and Carbon Stocks in Mangrove-Afforested Areas, Central Coastal Areas of Bangladesh. Environ. Chall. 2023, 13, 100784. [Google Scholar] [CrossRef]
- Abino, A.C.; Castillo, J.A.A.; Lee, Y.J. Species Diversity, Biomass, and Carbon Stock Assessments of a Natural Mangrove Forest in Palawan, Philippines. Pak. J. Bot. 2014, 46, 1955–1962. [Google Scholar]
- Barcelete, R.C.; Palmero, E.M.; Buay, B.M.; Apares, C.B.; Dominoto, L.R.; Apares, C.; Lipae, H.; Cabrera, L.M.; Torres, M.A.; Requieron, E.A. Species Diversity and Above-Ground Carbon Stock Assessments in Selected Mangrove Forests of Malapatan and Glan, Sarangani Province, Philippines. J. Biodivers. Environ. Sci. 2016, 8, 265–274. [Google Scholar]
- Howard, J.; Hoyt, S.; Isensee, K.; Telszewski, M.; Pidgeon, E. (Eds.) Coastal Blue Carbon: Methods for Assessing Carbon Stocks and Emissions Factors in Mangroves, Tidal Salt Marshes, and Seagrasses; Conservation International, Intergovernmental Oceanographic Commission of UNESCO; International Union for Conservation of Nature: Arlington, VA, USA, 2014; pp. 1–180. [Google Scholar]
- Harishma, K.M.; Sandeep, S.; Sreekumar, V.B. Biomass and Carbon Stocks in Mangrove Ecosystems of Kerala, Southwest Coast of India. Ecol. Process 2020, 9, 31. [Google Scholar] [CrossRef]
- Drayton Chandler, R. Soil Organic Carbon Distribution with Depth: Implications for Ecosyste. Master’s Thesis, Clemson University, Clemson, SC, USA, 2016. Volume 18. [Google Scholar]
- Kauffman, J.B.; Heider, C.; Cole, T.G.; Dwire, K.A.; Donato, D.C. Ecosystem Carbon Stocks of Micronesian Mangrove Forests. Wetlands 2011, 31, 343–352. [Google Scholar] [CrossRef]
- Ezcurra, P.; Ezcurra, E.; Garcillán, P.P.; Costa, M.T.; Aburto-Oropeza, O. Coastal Landforms and Accumulation of Mangrove Peat Increase Carbon Sequestration and Storage. Proc. Natl. Acad. Sci. USA 2016, 113, 4404–4409. [Google Scholar]

| Species | DBH (cm) | H (m) | No. of Individual | Density (trees ha−1) | RD (%) | RF (%) | RBA (%) | IVI |
|---|---|---|---|---|---|---|---|---|
| Bruguiera cylindrica (L.) Blume | 5.8 | 11.20 | 1 | 100 | 0.637 | 2.50 | 0.511 | 3.648 |
| Bruguiera gymnorhiza (L.) Lam. | 6.96 ± 1.57 | 4.44 ± 0.68 | 12 | 1200 | 7.643 | 10.00 | 9.245 | 26.888 |
| Bruguiera parviflora (Roxb.) Wight & Arn. ex Griff. | 6.04 ± 0.52 | 9.59 ± 0.94 | 9 | 900 | 5.732 | 10.00 | 5.033 | 20.765 |
| Ceriops tagal (Perr.) C.B.Rob. | 5.5 ± 0.23 | 4.47 ± 0.94 | 12 | 1200 | 7.643 | 17.50 | 5.528 | 30.672 |
| Rhizophora apiculata Blume | 6.14 ± 0.76 | 7.02 ± 2.05 | 95 | 9500 | 60.510 | 45.00 | 55.209 | 160.718 |
| Rhizophora mucronata Lam. | 7.48 ± 1.34 | 8.73 ± 1.69 | 28 | 2800 | 17.834 | 15.00 | 24.474 | 57.309 |
| 6.39 ± 1.09 | 7.11 ± 2.28 | 157 | 15,700 | 100 | 100 | 100 | 300 |
| Species | Density (ind. ha−1) | RD (%) | RF (%) | IVI (RF + RD) |
|---|---|---|---|---|
| Avicennia officinalis L. | 100 | 0.641 | 2.13 | 2.769 |
| Bruguiera cylindrica (L.) Blume | 1300 | 8.333 | 8.51 | 16.844 |
| Bruguiera gymnorhiza (L.) Lam. | 2300 | 14.744 | 17.02 | 31.765 |
| Bruguiera parviflora (Roxb.) Wight & Arn. ex Griff. | 3700 | 23.718 | 12.77 | 36.484 |
| Ceriops decandra (Griff.) Ding Hou | 1000 | 6.410 | 8.51 | 14.921 |
| Ceriops tagal (Perr.) C.B.Rob. | 2300 | 14.744 | 17.02 | 31.765 |
| Rhizophora apiculata Blume | 4300 | 27.564 | 25.53 | 53.096 |
| Rhizophora mucronata Lam. | 600 | 3.846 | 8.51 | 12.357 |
| 15,600 | 100 | 100 | 200 |
| Species | Biomass (Mg ha−1) | Carbon Stock (Mg C ha−1) |
|---|---|---|
| Bruguiera cylindrica (L.) Blume | 2.10 | 0.93 |
| Bruguiera gymnorhiza (L.) Lam. | 44.28 | 19.63 |
| Bruguiera parviflora (Roxb.) Wight & Arn. ex Griff. | 22.52 | 9.96 |
| Ceriops tagal (Perr.) C.B.Rob. | 25.74 | 11.38 |
| Rhizophora apiculata Blume | 272.52 | 120.64 |
| Rhizophora mucronata Lam. | 126.75 | 56.22 |
| Plot | Density per ha | Biomass (Mg ha−1) | Carbon Stock (Mg C ha−1) | ||||
|---|---|---|---|---|---|---|---|
| AGB | BGB | TB | AGC | BGC | TC | ||
| 1 | 300 | 4.96 | 2.61 | 7.57 | 2.33 | 1.02 | 3.35 |
| 2 | 600 | 10.16 | 5.32 | 15.47 | 4.77 | 2.07 | 6.85 |
| 3 | 1300 | 21.32 | 11.22 | 32.54 | 10.02 | 4.38 | 14.40 |
| 4 | 900 | 16.45 | 8.56 | 25.01 | 7.73 | 3.34 | 11.07 |
| 5 | 900 | 17.79 | 9.20 | 26.99 | 8.36 | 3.59 | 11.95 |
| 6 | 1900 | 32.89 | 17.16 | 50.04 | 15.46 | 6.69 | 22.42 |
| 7 | 600 | 15.81 | 7.91 | 23.72 | 7.43 | 3.09 | 10.52 |
| 8 | 600 | 15.30 | 7.66 | 22.96 | 7.19 | 2.99 | 10.18 |
| 9 | 1100 | 24.74 | 12.56 | 37.30 | 11.63 | 4.90 | 16.52 |
| 10 | 800 | 12.13 | 6.44 | 18.58 | 5.70 | 2.51 | 8.21 |
| 11 | 700 | 11.72 | 6.17 | 17.89 | 5.51 | 2.41 | 7.92 |
| 12 | 200 | 4.83 | 2.45 | 7.28 | 2.27 | 0.96 | 3.23 |
| 13 | 1400 | 37.88 | 18.86 | 56.74 | 17.80 | 7.36 | 25.16 |
| 14 | 600 | 11.44 | 5.90 | 17.34 | 5.37 | 2.30 | 7.68 |
| 15 | 900 | 32.83 | 15.94 | 48.77 | 15.43 | 6.22 | 21.64 |
| 16 | 500 | 9.28 | 4.81 | 14.08 | 4.36 | 1.88 | 6.23 |
| 17 | 700 | 11.53 | 6.07 | 17.60 | 5.42 | 2.37 | 7.79 |
| 18 | 800 | 16.85 | 8.64 | 25.49 | 7.92 | 3.37 | 11.29 |
| 19 | 900 | 18.43 | 9.48 | 27.91 | 8.66 | 3.70 | 12.36 |
| 826 | 326.32 | 166.97 | 493.29 | 153.37 | 65.12 | 218.49 | |
| Depth (cm) | Bulk Density (g/cm3) | % C | Mean C Stock (Mg ha−1) |
|---|---|---|---|
| 0–25 | 0.69 ± 0.08 | 13.33 ± 3.06 | 902.98 ± 159.88 |
| 25–50 | 0.68 ± 0.11 | 13.28 ± 3.20 | 883.94 ± 187.93 |
| 50–75 | 0.76 ± 0.11 | 13.17 ± 3.13 | 976.36 ± 158.27 |
| Biomass (Mg ha−1) | Vegetation Carbon Stock (Mg C ha−1) | Soil Carbon Stock (Mg C ha−1) | Ecosystem Carbon Stock (Mg C ha−1) |
|---|---|---|---|
| 25.96 ± 13.83 | 11.50 ± 6.13 | 921.09 ± 48.80 | 932.59 ± 54.93 |
Disclaimer/Publisher’s Note: The statements, opinions and data contained in all publications are solely those of the individual author(s) and contributor(s) and not of MDPI and/or the editor(s). MDPI and/or the editor(s) disclaim responsibility for any injury to people or property resulting from any ideas, methods, instructions or products referred to in the content. |
© 2025 by the authors. Licensee MDPI, Basel, Switzerland. This article is an open access article distributed under the terms and conditions of the Creative Commons Attribution (CC BY) license (https://creativecommons.org/licenses/by/4.0/).
Share and Cite
Tun, A.W.; Tong, X.; Aye, W.N.; Li, J. Stand Structures and Carbon Storage Potential of Mangroves in Chaungkaphee Protected Public Forest, Tanintharyi Coastal Region, Myanmar. Forests 2025, 16, 554. https://doi.org/10.3390/f16030554
Tun AW, Tong X, Aye WN, Li J. Stand Structures and Carbon Storage Potential of Mangroves in Chaungkaphee Protected Public Forest, Tanintharyi Coastal Region, Myanmar. Forests. 2025; 16(3):554. https://doi.org/10.3390/f16030554
Chicago/Turabian StyleTun, Aung Wunna, Xiaojuan Tong, Wai Nyein Aye, and Jun Li. 2025. "Stand Structures and Carbon Storage Potential of Mangroves in Chaungkaphee Protected Public Forest, Tanintharyi Coastal Region, Myanmar" Forests 16, no. 3: 554. https://doi.org/10.3390/f16030554
APA StyleTun, A. W., Tong, X., Aye, W. N., & Li, J. (2025). Stand Structures and Carbon Storage Potential of Mangroves in Chaungkaphee Protected Public Forest, Tanintharyi Coastal Region, Myanmar. Forests, 16(3), 554. https://doi.org/10.3390/f16030554