Review

A Critical Review of Methods and Techniques Used for Monitoring Deformations in Wooden Panel Paintings

Department of Agricultural, Food, Environmental and Forestry Sciences and Technologies (DAGRI), University of Florence, Piazzale delle Cascine, 18, 50144 Florence, Italy
*
Author to whom correspondence should be addressed.
Forests 2025, 16(3), 546; https://doi.org/10.3390/f16030546
Submission received: 10 February 2025 / Revised: 14 March 2025 / Accepted: 17 March 2025 / Published: 19 March 2025
(This article belongs to the Section Wood Science and Forest Products)

Abstract

:
Wooden panel paintings (WPPs) are among the most significant historical artworks that must be preserved for future generations. Ensuring their long-term conservation requires a comprehensive characterization of their condition, making monitoring an essential process. Thus, the primary objective of this study is to provide a comprehensive overview of the current techniques employed to study support deformations in WPPs, categorizing them into localized and full-field methods. Specifically, we provide information about linear potentiometric transducers, the Deformometric Kit, and Fiber Bragg Grating sensors as techniques that provide information about specific and isolated points on the artwork’s surface. On the other hand, digital image correlation, stereo-correlation, mark-tracking, 3D modeling techniques, and the moiré method, are discussed as techniques that analyze the entire surface or a significant part of the artwork. Each method has advantages and limitations, depending on the type of monitoring needed and the desired information. Nevertheless, these techniques contribute to understanding the behavior of the artworks’ materials under environmental fluctuations or restoration interventions, aiding the development of targeted and effective conservation strategies. Furthermore, this study seeks to evaluate the effectiveness of these methods in various conservation contexts and offers practical guidelines to assist conservators and researchers in selecting the most appropriate approach to support the long-term conservation of these invaluable historical artworks.

1. Introduction

The wooden panel was the primary support for European paintings from ancient times to the 16th century when canvas largely replaced it. As a result, wooden panel paintings (WPPs) are among the most significant historical artworks that need to be preserved for the future. Ensuring the long-term preservation of general historical artworks requires a deep understanding and characterization of their conservation state. From this perspective, monitoring plays a key role, as it provides insights into the behavior of the materials that constitute the artwork, allowing the assessment of their deformation behavior to environmental changes and external actions. Moreover, such knowledge is essential for implementing preventive conservation and determining the optimal environmental conditions for both conservation and exhibition. This is particularly essential for WPPs, which are among the most vulnerable and often precious elements of museum collections and whose behavior is influenced by a variety of factors.
WPPs are structurally complex and are typically described as multilayer systems consisting of a wooden support, canvas, preparation layers, paint layers, and varnish. The wooden support usually comprises several boards joined together with glue—typically casein or animal glue—and reinforced with circular or rectangular hardwood splines or dowels (commonly oak or elm). In some cases, groove-and-tongue joints may also be used [1]. Generally, each board was worked on individually, with greater attention given to the front side intended for painting. Conversely, the back was typically less carefully finished, often left rough after sawing, or partially smoothed using a roughing plane [2]. After being assembled, usually with the wider and higher quality boards in the center, and having adjusted the surface of the edges, the boards were diagonally grooved to ensure the adhesive had a good grip [2]. Additionally, different wood species were chosen as painting substrates, influenced by regional availability, ease of working with the material, and local traditions [1,3]. For example, painters in northern Germany and Holland often used oak (Quercus petraea (Matt.) Liebl.), while those in southern Germany preferred pine (Pinus spp.), fir (Abies alba Mill.), larch (Larix decidua Mill.), linden(Tilia spp.), and ash (Fraxinus spp.) [4]. In Italy, 90% of panel paintings have white poplar (Populus alba L.) as their support [3,5].
According to Cennino Cennini [6], the wooden support underwent a preparatory process before the application of paint layers. First, multiple coats of animal glue were laid down to saturate the wood’s porosity, and then ground layers were applied to create a smooth surface for the paint application. Ground layers usually consisted of animal glue and gesso, though variations included glass, kaolin, and calcium carbonate. In any case, they represent a thicker layer, ranging from 250 μm to 1800 μm [7,8,9]. In earlier artworks, the canvas was applied beneath ground layers to mitigate the effects of the movements caused by humidity fluctuations, thereby reducing stress on the paint layers. The paint was then applied to the prepared surface, and a final layer of varnish was added for protection.
During their greatest diffusion between the 13th and 16th centuries, the structural characteristics of WPPs changed significantly. Early WPPs were generally characterized by solid and stable structures, achieved through material selection and rigorous technical procedures. The boards chosen were typically those cut straight through the central part of the diameter of the trunk tree (radial board), often including the entire width. Special care was taken to remove the pith and juvenile wood and ensure that the resulting boards were, in reality, perfectly radial-cut [2]. Additionally, the side edges were planed down to remove sapwood, which is less durable and susceptible to some fungi and insect attacks [10]. The boards were thick relative to the overall dimensions of the painting to assure stability during climate fluctuations, as well as being straight-grained, with a uniform texture and minimal presence of large knots or other defects. Finally, in some cases such as crucifixes [1], the back side of the panel was painted with materials similar to those used on the front, balancing the moisture absorption of both sides of the panel.
In the 15th century, the dimensions of the wooden support tended to increase and the earlier concept of a general unified construction, with battens and frames intimately connected to the support, was mainly abandoned, resulting in a progressive separation of the various structural elements. The wood selection became less rigorous, and the panels were thinner. Many boards of this period show defects and knots, sometimes of considerable size. The practice of painting the rear surface increasingly fell out of use, as well as the presence of canvas, which was usually applied in narrow strips over defects and along the joint between the boards [2].
By the 16th century, the technique of WPPs started to decline and was gradually replaced by canvas. Broadly, the selection of the wood became less careful, panel thickness was further reduced, and construction techniques became increasingly imprecise. Lower-quality materials, such as tow, started replacing canvas strips when gluing over the more frequent knots to isolate them. Moreover, in general, a reduction in the number and thickness of the ground layers was observed, and a glue primer, along with a colored background, was beginning to be added to make the surface less absorbent. Finally, as WPPs were integrated into monumental altars, the frame gradually lost its structural function and fell out of use [2].
Although efforts have been made to codify both structural and construction techniques, and some denominators were maintained over time, the methods for creating WPPs can still vary significantly depending on the school and the workshop. This has resulted in a wide range of morphological, constructive, and manufacturing diversity [1]. Environmental factors, aging, and human activity can introduce mechanical stresses—some of which may be critical—that compromise the conservation of these objects, leading to permanent deformation and fractures.
It is important to note that each layer of a WPP contributes differently to its overall behavior and stability [9]. In particular, the hygroscopic nature of wood leads to a continuous exchange of moisture with the surrounding environment, producing effects at the molecular and ultrastructural levels, as well as macroscopic deformations. Additionally, because wood is an anisotropic material, it swells and shrinks with humidity variations at different rates along its three main directions—longitudinal (0.2%–0.8%), radial (3%–6%), and tangential (6%–12%) [11,12].
Generally, the deformation that the wooden support undergoes can be either reversible or irreversible. The mechanisms responsible for these deformations have not yet been definitively identified, and several may occur simultaneously [11]. Factors such as wood aging, the panel’s mechanical asymmetry, and compression set can cause irreversible deformations. On the other hand, reversible deformations can occur due to RH variations arising from the hygroscopic asymmetry between the bare wood on the back and the painted surface on the front of the painting coupled with the anatomical cut of the plank [9].
The most common deformations in wooden panels are cupping, arching, curvature, and twisting [11]. Cupping is the curvature of the board along its longitudinal direction, occurring due to the anisotropic shrinking and swelling nature of wood. Arching is the curvature of the board along the transverse direction, generally resulting from the presence of reaction wood, internal growth stresses, or improper seasoning. Curvature is the rotation along the transverse direction, causing longitudinal deformation along one edge; it is often due to internal growth stresses, the presence of reaction wood on the edge, or the use of wood sawn from a curved trunk. Finally, twisting involves a torsional movement along the main direction, typically caused by internal growth stresses, the use of wood sawn from a curved trunk, or the presence of a spiral grain.
Despite the greater thickness of the wooden support, a WPP works as a multilayer system, whose deformations are significantly influenced by the presence of preparation and paint layers, which can reduce or prevent the moisture exchange of the panel with the environment and affect its mechanical behavior. Moreover, a radial board with both faces free to exchange moisture remains flat during the initial and final steady-state phases, as well as during the transient equilibrium phase. On the other hand, when only the back side of the same radial board is free to exchange moisture, because of the presence of paint layers on the front that operate as a moisture exchange barrier, the board tends to cup during the transient equilibrium phase due to the asymmetry of moisture gradients. In the final equilibrium state, the board may either straighten out or exhibit residual deformations, resulting in permanent cupping [13].
Recent studies [9,14,15] have identified the main variables responsible for the deformation dynamics of WPP. These variables are the stiffness of the wood and paint layers, the emissivity of the wood and paint layers, the moisture diffusion within the wood, and the tree ring orientation in the wooden panel. The numerical modeling in refs. [9,14] yielded possible hygro-mechanical behaviors of a generic WPP, including the well-known cases of hygroscopic and mechanical symmetry, maximum hygroscopic asymmetry, and maximum mechanical asymmetry. Thereby, the models revealed the presence of the following five macro-categories of behavior (Figure 1):
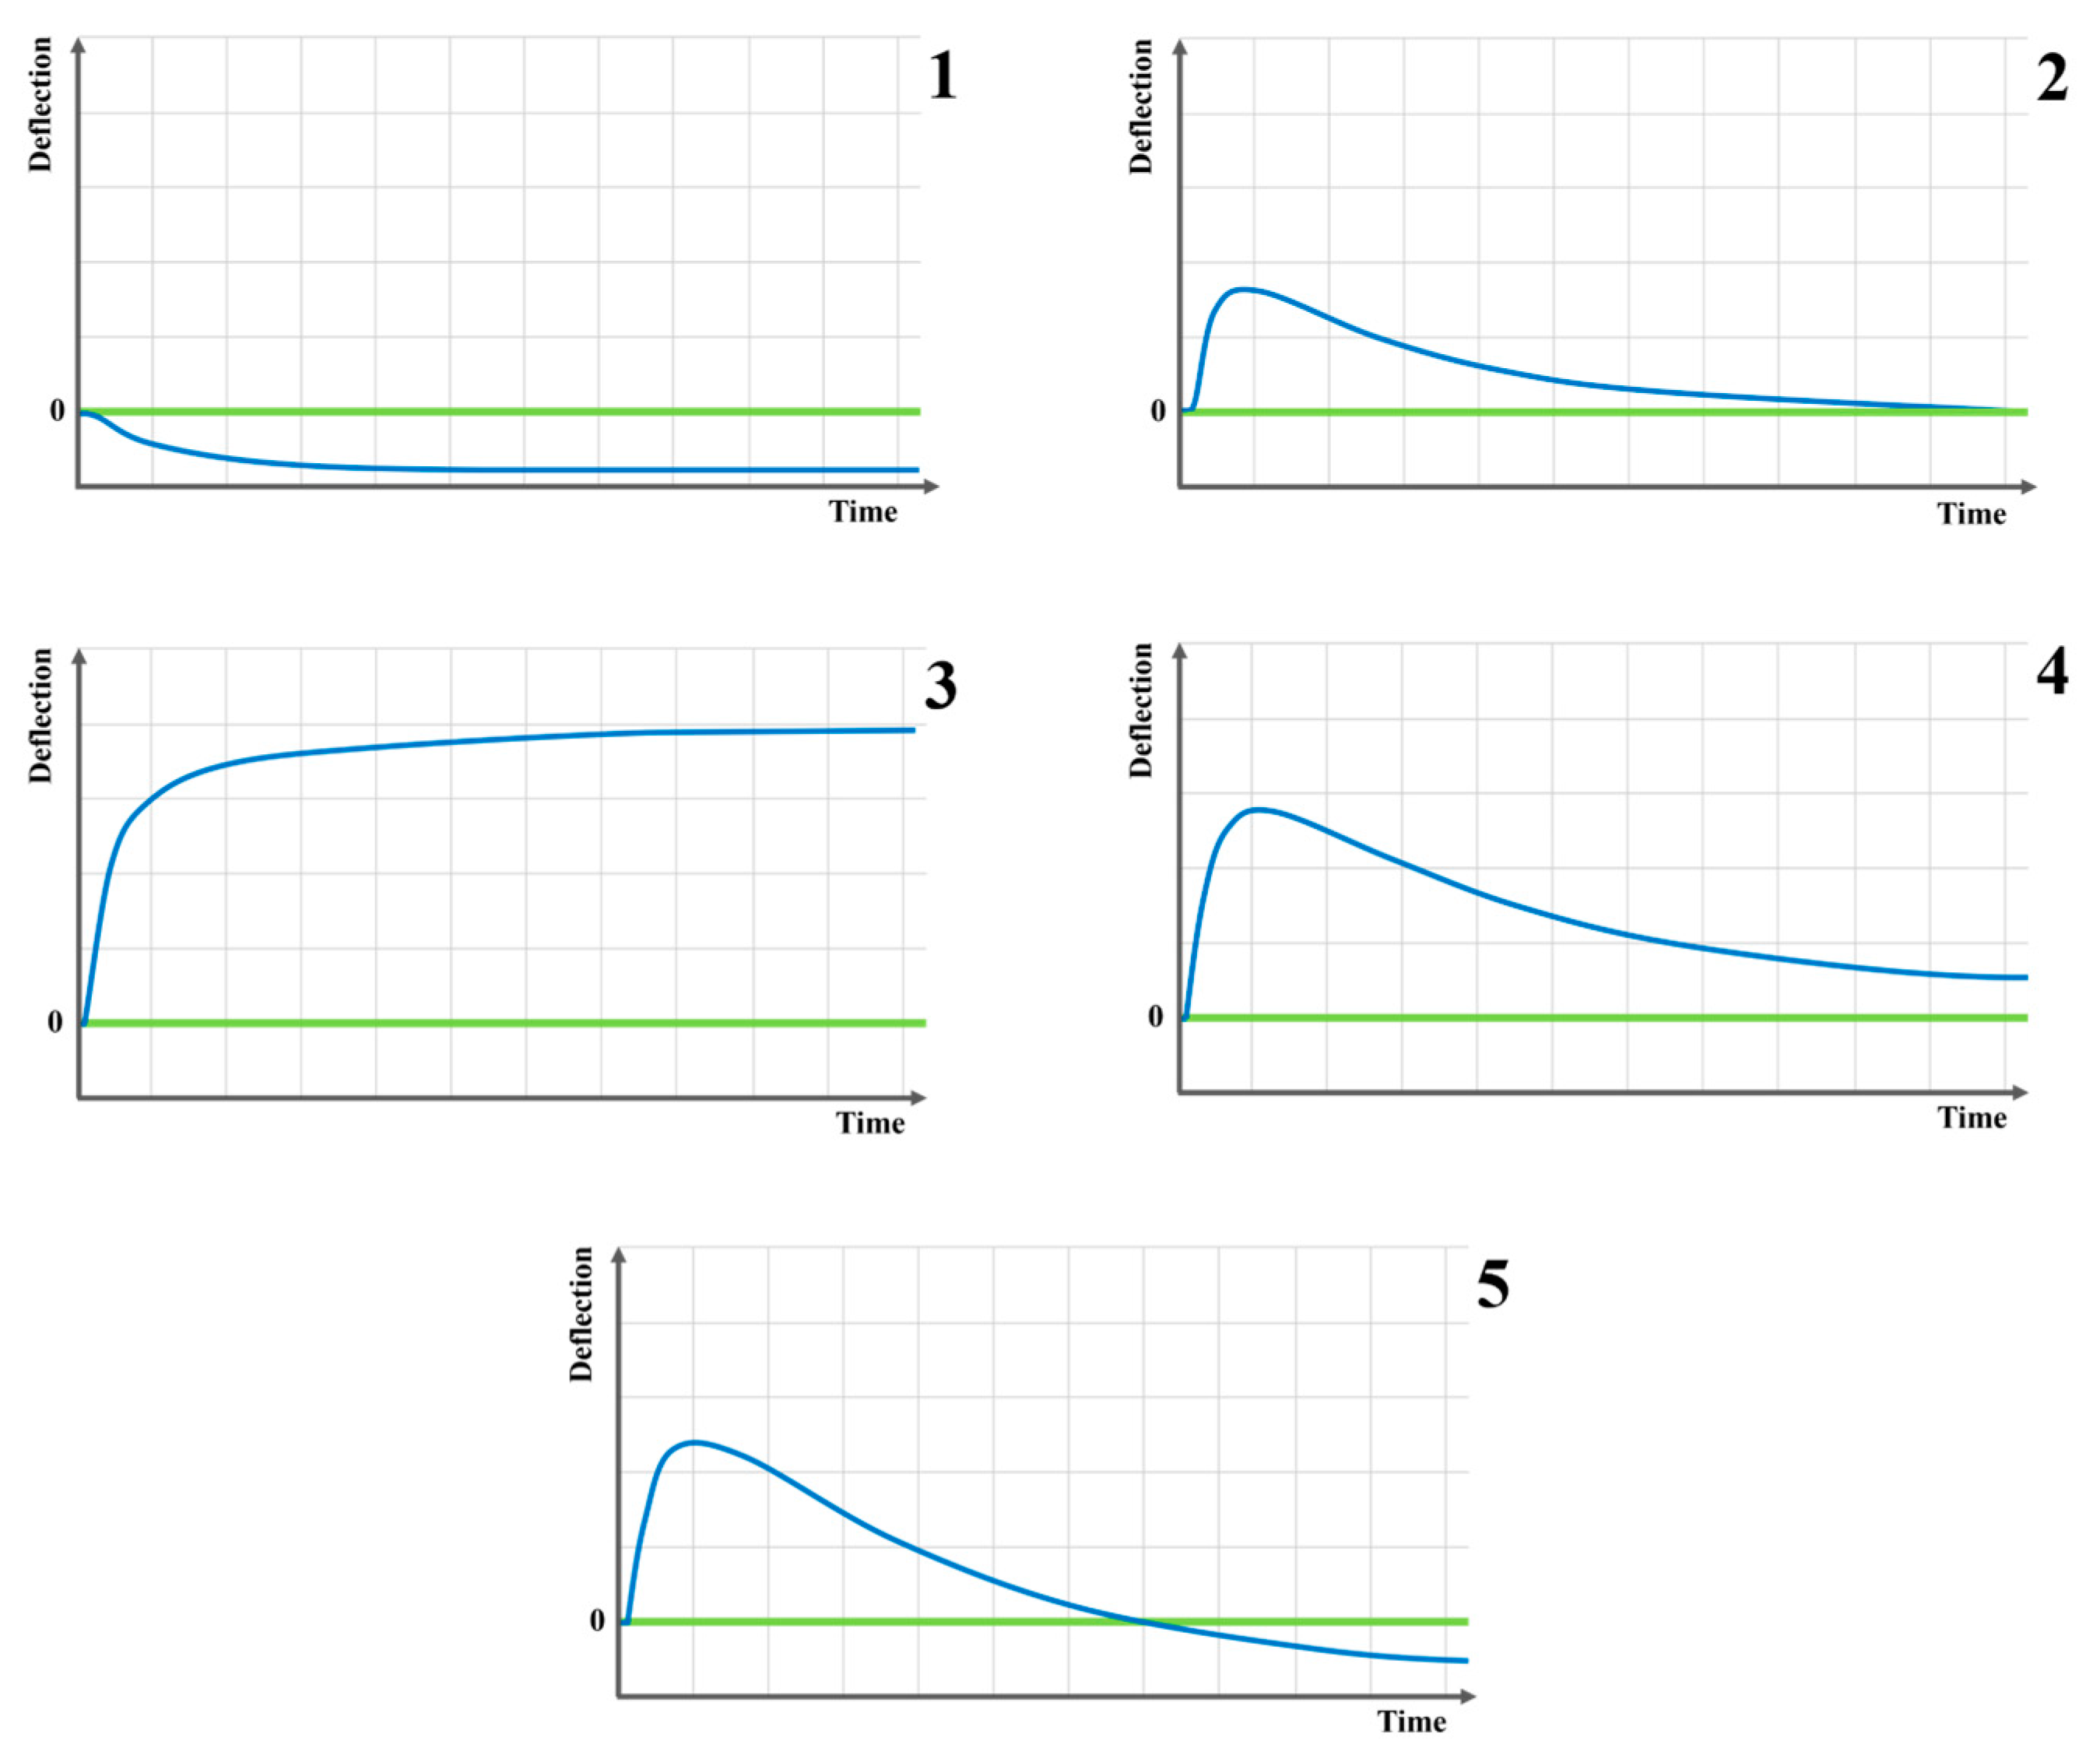
  • Non-flying wood monotonic behavior with asymptotic concave deformation relative to the painted face, typical of WPPs painted on the back face with low-stiffness paint layers;
  • Flying-wood non-monotonic behavior without residual concavity, characteristic of WPPs painted on a radial board with low-to-high stiffness paint layers;
  • Non-flying wood monotonic behavior with asymptotic convex deformation, typical of WPPs painted on a tangential board with high stiffness and low emissivity;
  • Flying-wood-type non-monotonic behavior with asymptotic concave deformation, common in WPPs painted on the back side of a tangential board with low emissivity and stiffness paint layers;
  • Flying-wood-type non-monotonic behavior with asymptotic convex deformation, typical of WPPs painted on a tangential board with low emissivity and stiffness.
WPPs are rarely composed of a single board, and they typically consist of several boards joined together with glue and restraining systems. Consequently, it is necessary to consider how the various components interact with each other to evaluate the assembly’s behavior. As thermo-hygrometric conditions change, elements such as boards, the frame, and crossbeams may mechanically respond to the others’ deformation tendencies creating tensional states that can result in deformations, separations between boards, disconnection of support elements from the panel, and even damage or loss of the paint layer. Crossbeams exhibit flexural behavior, helping to mitigate cupping while preserving the flying wood and non-flying wood dynamics of WPPs [15]. As the panels tend to deform, the crossbeams initially resist movement by static friction, and once the friction threshold is exceeded, this resistance drops sharply, giving way to dynamic friction and allowing smoother movement [15]. In addition, although the crossbeams reduce the overall deformation in WPPs, they can induce additional stresses in the paint layers, especially near the contact points. Indeed, in the initial moments of hygroscopic transients, the back of the panel experiences the greatest stress, which can potentially lead to cracking in tension or plasticization in compression if the transients occur over relatively short periods [15]. As the climatic variation continues, the situation is inverted and the paint layers, due to their stiffness and strength, become the primary responders to the deformation tendencies of the wood. Consequently, although crossbeams help to reduce wood deformation, they may increase the risk of long-term damage to the paint layers [15].
Finally, wood is particularly vulnerable to both aging and biological degradation. Aging refers to the changes in a material’s physical, chemical, and mechanical properties over extended periods of storage or use [16]. In the case of wood, these changes primarily arise from microstructural modifications caused by chemical transformations in its components [16] that may affect density but typically leave the physical or anatomical structure intact, unless biodeterioration occurs [17]. Specifically, aging results in an increase in the content of carbon, hydrogen, and mineral salts, while oxygen and nitrogen levels decrease [18]. This process reduces the number of absorption sites on hemicellulose and amorphous cellulose molecules, as well as the wood’s equilibrium moisture content [19], due to a gradual thermos-oxidative reaction with atmospheric oxygen [20]. Over time, the gradual degradation of hemicelluloses—from the surface layer toward the inner ones—significantly affects the wood’s behavior. This process leads to a reduction in the hygroscopicity of the surface layer [21,22], making it less capable of absorbing moisture compared to the inner ones. The resulting ‘moisture gradient’ across the wood panel can contribute over time to permanent deformation [9]. Moreover, wood exhibits increased strength and stiffness upon aging but reduced toughness [18]. This behavior is attributed to the progressive loss of hemicellulose and cellulose, which are essential for flexibility and tensile strength. Meanwhile, lignin, which remains, enhances compressive strength but offers limited resistance to tension, both parallel and perpendicular to the grain. As a result, the wood becomes more brittle in these directions [18] for traction and bending actions.
Biological degradation includes attacks by wood-eating insects, fungi, and bacteria, which can cause serious deterioration of the wooden support and damage to the painted side. Because humidity facilitates the proliferation and spread, WPPs and wooden artworks in general are highly susceptible to environmental conditions in which they are preserved. The extent of damage depends on how well the objects are protected from moisture, insects, microorganisms, and extraneous compounds [10].
The arguments reported above make it clear that in a WPP there is a close relationship between the wood support and the painted surface, and the various problems affecting the wood support not only affect the physical integrity of the support itself, but also the stability of the painted surface (i.e., the most common visible forms of damage include delamination and cracking at or near the painted surface [23]). This gives rise to a variety of possible alternative behaviors, analogous to a complex system with non-linear and evolving behaviors, which must be assessed on an individual basis [9,14,15], making monitoring essential.
Indeed, the monitoring of WPPs is crucial in preventing problems that may affect not only the wooden support, but also the painted surface. By studying the deformations that a WPP undergoes, it becomes possible to understand the behavior of the materials that make up the artwork, assess their response to environmental changes, and implement preventive measures such as optimal environmental conditions.
The implementation of monitoring by means of IoT solutions [24] also makes it possible to feed digital models (digital twins) with a flow of real-time data, allowing the creation of metaverses of artworks that can be used both for preventive conservation and for optimizing energy consumption in conservation environments.
Monitoring also makes it possible to evaluate the effectiveness of restoration interventions. By comparing the behavior of the artwork before and after restoration, it is possible to determine whether the solutions adopted are effective or require further refinement.
The primary objective of this paper is to provide a comprehensive overview of the current techniques employed to study support deformations in WPPs. By categorizing these techniques into localized and full-field methods, we aim to highlight their respective advantages and limitations in capturing the complex deformation behaviors of WPPs. The first group includes potentiometric transducers (see Section 3.1.), the Deformometric Kit (see Section 3.2.), and Fiber Bragg Grating sensors (see Section 3.3.). These methods gather data from specific, isolated points on the surface of the object, offering detailed but limited information. On the other hand, full-field techniques analyze an entire surface or a significant portion of the object, generating a “map” of the measured quantities; digital image correlation, stereo-correlation, mark-tracking (see Section 4.1.), 3D modeling techniques (see Section 4.2.), and the moiré method (see Section 4.3.) are described. Furthermore, this study seeks to evaluate the effectiveness of these techniques in various conservation scenarios, offering practical guidelines for conservators and researchers in selecting the most appropriate method based on specific application needs. Finally, this article attempts to provide guidelines on selecting the appropriate technique to support the preservation of invaluable historical artworks by providing robust tools and insights for their long-term conservation.

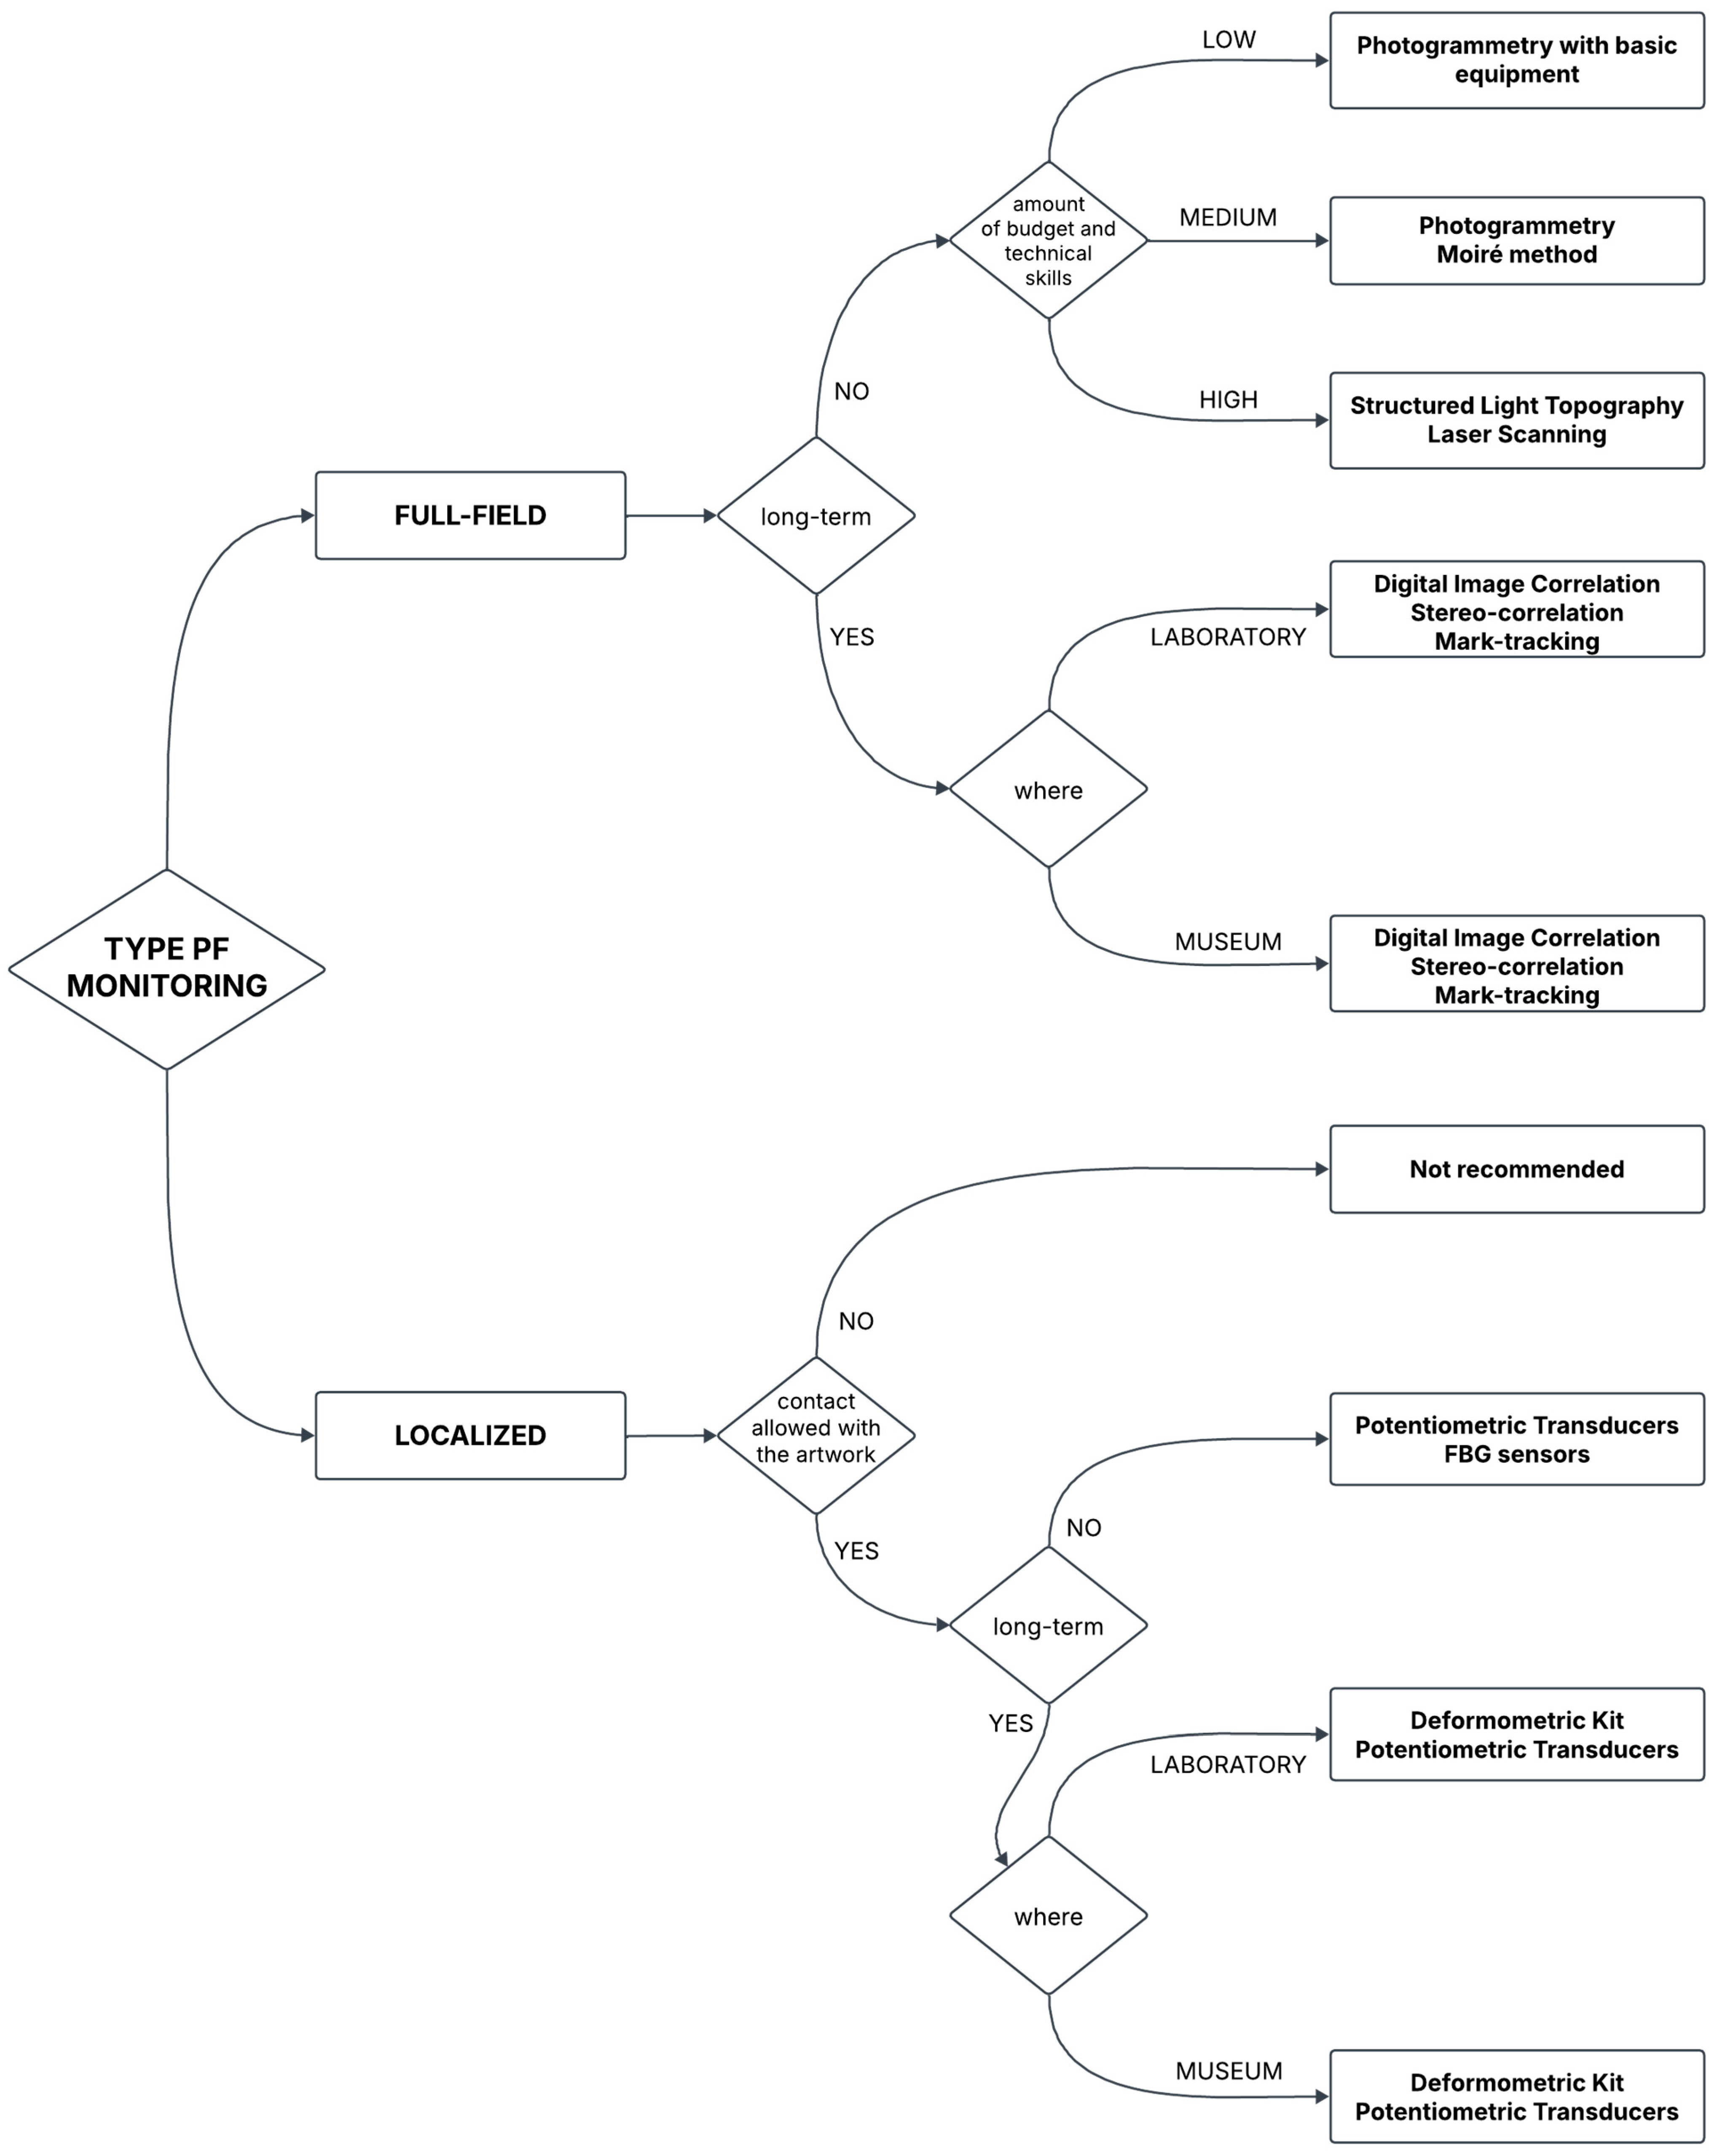
2. Methodological Approach

This paper presents a literature review offering a comprehensive overview of current techniques used to study support deformation in WPPs. The selection of articles followed an iterative exploratory approach rather than a strict systematic protocol.
In the first phase, a broad search was conducted to identify and analyze various techniques available for studying deformations in WPPs. From these, only techniques capable of assessing the deformations of the entire painting were selected, excluding those providing solely superficial information. This selection formed the basis for the second phase, in which the research was refined by focusing on each identified technique. This refinement involved searching for and reviewing all articles and publications describing the use of each technique for monitoring or, more generally, studying deformation in WPPs. Consequently, applications involving other types of artworks—such as paintings on canvas, frescoes, or wooden sculptures—were excluded to maintain a focus on WPPs or their simulacra.
Moreover, analyzing the selected articles enabled a comparative assessment of the different techniques, considering aspects including the type of monitoring performed, their advantages and limitations, real-time data acquisition, and the possibility of generating 3D models.
Finally, it is important to note that some techniques, particularly the Deformometric Kit and Fiber Bragg Grating sensors, have been applied to the study of WPP deformations by individual research groups exclusively. As a result, the literature of those techniques is predominantly authored by the same researchers, reflecting their limited adoption beyond a few research groups.

3. Techniques for Localized Deformations

This section provides an overview of the techniques currently used to investigate localized deformations of the support of WPPs. These methods collect data from specific points on the surface of the object, offering highly detailed but limited information. Specifically, we discuss linear potentiometric transducers in Section 3.1., the Deformometric Kit in Section 3.2., and Fiber Bragg Grating sensors in Section 3.3. In each subsection, we also present applications of these techniques on both historical artwork and simulacra.

3.1. Linear Potentiometric Transducers

A linear displacement transducer is a sensor used to accurately measure an object’s linear position or displacement. It converts linear motion into an electrical signal, which can be used for monitoring, control, or feedback in industrial and scientific applications. Linear displacement transducers come in various types, each based on different technologies and principles. These include devices like linear variable differential transformers (LVDT), which operate using electromagnetic induction; magnetostrictive transducers, which rely on the magnetostrictive effect; capacitive transducers, which detect changes in capacitance; optical encoders, which use light-based technology; eddy current transducers, which apply electromagnetic induction; and potentiometric transducers.
Potentiometric transducers, also called linear potentiometers, measure displacement using a resistive element combined with a sliding contact, known as a slider or wiper. This component moves along the resistive element, causing a change in resistance proportional to its position. Particularly, a typical linear potentiometer consists of a metal-alloy resistance wire wound on a non-conductive substrate, such as ceramic or plastic, referred to as the former. The slider maintains constant electrical contact with the resistive wire and moves along its length. The object whose displacement is being measured is mechanically linked to the slider. As the slider moves, the effective resistance between one end of the wire and the slider changes. This resistance variation produces an output voltage that is linearly proportional to the displacement.
Potentiometric transducers are widely used due to their low cost and low power consumption, making them ideal for applications where simplicity and efficiency are priorities [25].
In 2012, Giorgi Vasari’s “Lapidazione di Santo Stefano” was monitored for one-and-a-half years [25,26,27]. Deformometric monitoring was conducted both before and after the restoration intervention, which aimed to re-establish the panel’s structural integrity. During the study, 12 linear potentiometric transducers (Ds) effectively recorded the slippage between the crossbeams and selected points on the boards, mapped the planking’s slippage, and quantified wood displacement at the cracks. Combined with data from another monitoring technique, the Deformometric Kit (DK, see Section 3.2), the study provided insights into the panel’s behavior under seasonal climatic variations, confirming the effectiveness of the restoration strategies.
In 2016, Cocchi et al. employed potentiometric transducers as part of a monitoring system designed to measure the deformations of both the crossbars and individual springs in an elastic crossbar system developed by the Opificio delle Pietre Dure restoration laboratories [28,29]. The subject of the study was the “Deposizione dalla Croce” by an anonymous 16th-century artist from Abruzzo, which had suffered severe damage in the 2009 earthquake. Over two months, the panel was subjected to controlled climate variations, during which the deformations of the panel, as well as the forces and displacements of the individual springs connecting the crossbars to the panel, were automatically recorded. Thus, the monitoring system, consisting of 19 transducers, facilitated the evaluation of the functionality and performance of existing crossbar systems with springs. Moreover, it was essential to identify potential corrective measures for spring crossbar systems already in use and provide an objective framework for designing elastic crossbar systems for future restoration interventions.
Mazzanti et al. conducted several experimental tests on an accurate structural replica of Caravaggio’s “Medusa” shield to analyze its hygro-mechanical behavior [30]. A specific apparatus, called “Shield Measurement Apparatus” (SMA), was designed to monitor the mock-up’s distortions through the use of five linear potentiometric transducers that allowed the monitoring of both the horizontal and vertical shape changes. The results highlighted the distorted behavior of the mock-up, explaining its tortoise-shell shape and, by extension, the likely behavior of original shields with similar internal structures under environmental variations. Additionally, numerical modeling of the shield’s hygroscopic distortion behavior demonstrated how its spherical shape and the two crossed wood layers amplify anisotropic deformation components, generating large internal stresses that can lead to plasticization and material damage. However, the model highlighted the inherent vulnerability and fragility of such artworks to environmental thermo-hygrometric fluctuations.
Potentiometric transducers were also employed to measure the deformation along two diameters of another shield [31], housed in the Bardini Museum in Florence (inventory no. 408). For more than a year, the monitoring was effective in revealing significant changes in the smaller diameter, while the larger one exhibited only minimal variation.
In 2022, Uzielli et al. introduced a method that offers an in-depth understanding of Leonardo da Vinci’s masterpiece, the “Mona Lisa”. This method enables precise analysis of the artwork’s response to climatic variations, providing objective data on its construction characteristics, as well as its mechanical and hygroscopic behavior. The method and associated equipment utilize miniaturized load cells and potentiometric displacement transducers to simultaneously record the forces acting on the panel and its deformation state, allowing for a continuous assessment of the panel’s response to environmental changes and facilitating the optimization of its conservation. More details on the design of this methodology can be found in refs. [32,33]. Due to its permanent longitudinal curvature, the central part of the Mona Lisa does not touch the crossbeams and the auxiliary frame, which instead constrain the panel only at its top and bottom edges. This configuration allows the panel to move and deform freely both transversely (cupping) and longitudinally (bowing). Thus, to measure these deformations, three potentiometric displacement transducers were installed on the aluminum housing attached to the auxiliary frame (Figure 2). Furthermore, with four load cells installed at the ends of the upper and lower crossbeams and the capacity to induce slight force variations, numerical modeling was carried out to estimate the panel’s actual mechanical properties [34,35]. Despite the fact that the model could not fully capture the hygroscopic behavior of the artwork, it consistently represented the displacements exhibited by the panel under external forces. This allowed for an assessment of the stresses and strains that could arise from changes in the loads or, more broadly, alterations in boundary conditions.
Furthermore, a system of displacement transducers and load cells was used within a measuring apparatus developed by Dionisi Vici et al. [36]. This device was designed to measure cupping, swelling/shrinkage deformations, and the forces exerted by constraints intended to prevent deformations. Specifically, the study examined the mechanical response of two structural replicas of wooden panel paintings subjected to step changes in RH under controlled conditions. One panel was free to deform, while the other was constrained. Additionally, descriptive models of the panel’s mechanical behavior were created by fitting the experimental data to general exponential equations, comprising a “short period” and a “long period” component.
Rachwał et al. [37] employed two displacement sensors and a triangulation laser displacement sensor to monitor a lime-wood panel coated with a gesso layer in one of the galleries of the National Museum of Krawok (Poland). Specifically, the deflection of the panel was measured by tracking the position changes of its central part with the laser sensors, while the displacement sensors verified the symmetrical bending of the panel. The monitoring, which lasted 226 days, also included the recording of temperature and RH. The experimental data were essential for validating the numerical modeling [38] designed to simulate and follow the moisture movement and strain within a generic WPP, enabling the analysis of climatic variations’ impact on the gesso layer.

3.2. Deformometric Kit

Local deformations of WPPs can be measured and monitored with the Deformometric Kit (DK) [39]. The instrument consists of two aluminum columns screwed perpendicular to the wood surface, with the distance between them measured by two potentiometric displacement transducers, each hinged to the columns at fixed distances from the wood surface (Figure 3). To minimize the invasiveness of the DK’s mounting, aluminum columns can be screwed into wooden baseplates, which are then glued to the back of the painting, as performed in [40]. As a result, installed reversibly on the back of the painting, the panel movements are transmitted to the transducers thanks to the aluminum columns; as the panel shrinks or swells, the columns move closer or further apart, and when the panel cups, the columns rotate, changing the angle between the two axes. Thus, the DK enables the study of the board’s cupping tendencies by measuring the elongation of the potentiometric transducers. Moreover, the DK’s baseline is positioned perpendicular to the wood grain, facilitating the board’s cupping angle analysis. Indeed, by combining the signals from the transducers and applying trigonometric formulas (Table 1), changes in the cupping angle ( φ ,   E q u a t i o n   ( 1 ) ), radius of curvature ( r ,   E q u a t i o n   ( 2 ) ) , and baseline lengths at the back (i.e., where the DK is installed) and front of the painting (i.e., a virtual baseline, g ,   E q u a t i o n ( 3 ) ) can be identified [41].
The application of these formulas is based on several assumptions [39]: the deformations and geometric axes of the DK elements are aligned in the same plane, perpendicular to the wood grain; the columns remain perpendicular to the surface at the anchorage points; the board cupping is an arc of a circle; the boards have a constant thickness that does not change over time; during deformation, straight lines in the board’s cross-section remain straight and lines originally perpendicular to the wood surface continue to be perpendicular. While the first three assumptions are generally valid, the last two are less realistic due to wood’s anisotropy and possible variations in thickness. However, the associated errors are small and can be corrected through more complex calculations, if deemed necessary.
The DK can be customized for various needs and requirements in different situations. In its standard configuration, it allows for the measuring of deformations occurring along a 25–30 cm line transverse to the grain. This length is often sufficient for obtaining representative measurements of the panel’s behavior, as well as for gathering information on a specific area with characteristics of interest. The transducers’ outputs are fed into a multi-channel data logger, which records data at regular intervals, typically every 15–30 min for long-term monitoring and every second or minute for short-term monitoring. Usually, a data logger is used to simultaneously record the transducers and the thermo-hygrometric conditions of the surrounding environment (temperature and relative humidity).
The accuracy of DK measurements is influenced by transducer errors and the geometry of the DK itself. To optimize performance, high-precision transducers and data loggers with high accuracy and resolution should be used. Moreover, maintaining a large distance between the two transducers, a small distance between the lowest transducer and the back of the painting, and a large distance between the two aluminum columns enhance DK’s effectiveness.
Finally, the DK is an instrument designed for the continuous monitoring of the deformation dynamics of a WPP, allowing the analysis of the panel’s reactivity, the evolution of cupping over time, and, under certain assumptions, the panel’s deformation close to the device [40]. The primary benefits of this system are its low impact on the paintings, the high sensitivity to dimensional variations, and the quality of the data it provides on both in-plane and out-of-plane changes [42]. However, while the DK is an excellent tool for monitoring a WPP’s response to environmental fluctuations, it has some limitations: it reflects the behavior of the specific board it is mounted on; the soundness and stability of mechanical and electronic connections must be ensured; screws are used for mounting, typically for poplar boards, three stainless steel screws, 3 mm in diameter and 15–20 mm in length are used; and about 15 cm of space is needed behind the painting. In addition, if the baseline intercepts a discontinuity, such as a fracture or the joint between two boards, calculations can still be performed, but it becomes difficult to separate the contributions of support deformation and fracture movements.
The DK has seen several documented applications. The first use occurred in November 1991, when Uzielli et al. conducted a two-year monitoring of Giotto’s “Maestà di Ognissanti” [41]. The DK detected small displacements (less than 0.02 mm) related to relative humidity fluctuations over several days. Additionally, applying geometric formulas revealed panel swelling or shrinking, demonstrating the cupping caused by moisture content gradients within the panel’s thickness. However, this early system could not be self-powered due to the high power consumption [43]. Consequently, in 1999, a new apparatus was developed using a commercial self-powered data logger and potentiometric displacement transducers powered by the same data logger. This system, similar to modern configurations, was first successfully used to monitor the deformations of Daddi’s “Madonna con Bambino e Angeli” (1347) in the Church of Orsanmichele [43].
In 2008, two DKs were installed on the back of the Maltese Maestro Alberto’s “Nativity” [42] to analyze the board’s deformative response in two different parts. The use of DKs was appropriate and effective for quantitatively describing the painting’s reaction to microclimatic variations and for analyzing the different deformometric behavior of the two parts of the painting.
In 2012, six DKs were employed to monitor the structural restoration intervention of Giorgi Vasari’s “Lapidazione di Santo Stefano” for one-and-a-half years [25,26,27]. On this occasion, applying the DKs was extremely effective in capturing minor local deformations and distortions in specific areas, both before and after the intervention. By integrating data from the DKs with measurements obtained from 12 linear potentiometric transducers (see Section 3.1.), researchers were able to analyze the WPP’s behavior during seasonal climatic fluctuations and confirm the efficacy of the restoration strategies.
In the same year, Marcon et al. applied DKs to monitor two replicas of Andrea di Giusto’s triptych “Madonna in trono col Bambino e Santi” (1435) as part of a study on a support system designed to control deformation [44]. The use of DKs enabled continuous monitoring of each panel’s response to humidity changes and facilitated the assessment of the auxiliary support’s effectiveness. Specifically, it demonstrated the system’s capability to significantly reduce panel deformations caused by environmental fluctuations and highlighted the importance of selecting appropriate mechanical parameters for the support to ensure optimal conservation tailored to each specific case.
In 2016, Allegretti et al. [45,46] conducted a long-term monitoring of the 16th-century WPP “The daughters of the Emperor Ferdinand I” by Jakob Seisenegger (1534). For 29 months, the artwork was monitored in its climatically uncontrolled storeroom using three DKs and a differential scale track mass variation. This approach enabled the determination of the support’s deformative tendencies in response to microclimatic fluctuations, revealing partial sorption, hysteresis phenomena, and response delay. Furthermore, the collected data, combined with the analysis of growth rings in the transverse section, enabled the identification of the anisotropic cupping deformation of each panel board. This information guided the design of a new stiffening structure to replace the excessively rigid and potentially damaging previous system.
Two years later, the same researchers installed two DKs on the back of the “Baccanale”, a 17th-century oil painting on oak attributed to the school of Jacob Jordaens [47]. The deformometric monitoring was conducted in a restoration laboratory over 161 days, before and after the restoration intervention. Specifically, this approach enabled the measurement of both in-plane (shrinkage/swelling) and out-of-plane (cupping) deformations of the panel. To further investigate the effect of hygroscopic and mechanical asymmetries identified in the real painting, experiments were carried out in a climate chamber using structural replicas created by the restorer. In particular, the test specimens included a bare panel, a panel with one face sealed with aluminum foil and vinyl glue, and a panel with one face treated with a preparation layer and an oil paint layer. These tests successfully isolated the hygroscopic warping from the mechanical deformation, confirming the observed deformation trends and the positive impact of the restoration intervention.
As part of a project aimed at promoting public understanding of art conservation practices, a study of the hygro-mechanical behavior of the historic WPP “La Saint Trinité couronnant la vierge” (1516) was initiated in 2018 at the Fabre Museum in Montpellier [40]. The panel was monitored with three DKs, with their aluminum columns screwed into wooden baseplates, which were, in turn, glued to undamaged areas on the back of two boards, allowing precise and continuous monitoring of local curvature and deformation for five months, even during movements. Moreover, on this occasion, to study the mechanical response of the painting in terms of curvature and surface strain, the mark-tracking technique was also used (see Section 4.1.). Its results were comparable to those of the DK, although the latter were ten times more accurate than the optical ones.
Additionally, the DK was employed to measure the cupping deformation of wooden panels to confirm the 3D anisotropic viscoelastic numerical model under varying temperatures and RHs [48]. Specifically, four types of spruce wood panels with different boundary conditions were tested, and their cupping during a desorption cycle was recorded. Furthermore, Froidevaux compared [49] the experimental results obtained from the DK and the fringe projection technique (see Section 4.2.2.) with the simulated data from the numerical modeling on both unpainted and painted panels. In all cases, the simulated and experimental deflection values were comparable.
Recently, the DK was employed for long-term monitoring in the Opificio delle Pietre Dure restoration laboratories [9,50]. Six WPPs, from the 15–16th centuries, were equipped with a DK to measure the deformometric behavior under controlled humidity variations in a climatic chamber. In this context, the DKs played a key role in showing the general behavior of WPPs, consisting of an initial phase of rapid and steep deflection followed by a second phase where the curve flattened out. These results were essential in directly calibrating the digital models presented in refs. [9,14,15], enabling the identification of the main variables responsible for the paintings’ behavior and the evaluation of their influence and interaction in determining panel deformation.

3.3. Fiber Bragg Grating Sensors

In recent years, optical fiber sensors (OFSs) have proven useful for investigating deformation and detecting damage in a wide range of engineering structures and materials. Optical fibers consist of two elongated coaxial cylinders of dielectric material: the inner one, called the core, has a higher refractive index than the outer one, called the cladding. In addition, for protection, optical fibers are clad with a sheath of non-optical material, such as metal or plastic. Due to the difference in the refractive indices of the two coaxial cylinders, light is reflected into the core with a minimal loss of intensity, allowing radiation to be transmitted over long distances. OFSs can be made from various materials, such as glass and plastic, though their use is limited to the visible region, or fluorinated glass, which lets them cover the NIR region. However, silica is the most widely used material due to its ability to transmit the full range of UV-Vis-NIR, and OFSs are characterized by refractive index values of 1.475 for cladding and 1.5 for core [51].
The most popular type of OFSs uses Fiber Bragg Grating (FBG) sensors in silica-based fibers, which can be described as intrinsic wavelength-modulated fiber-optic sensors. They consist of a periodic perturbation of the core refractive index of a special UV-sensitive optical fiber, achieved by irradiating the fiber with an intense UV optical pattern [52,53] (Figure 4). When radiation, generated by a broadband source (typically a superluminescent LED emitting in the 40 nm band) is injected into a fiber and interacts with the grating, only radiation in a very narrow band (0.2–0.3 nm) of wavelength is back-reflected, leaving the rest of the band unperturbed.
The Bragg wavelength is calculated as the following:
λ B r a g g = 2 n e f f Λ
where Λ and n e f f are the grating pitch and the effective refractive index of the fiber core, respectively. Any change in the grating pitch or the transmission characteristics of the fiber can cause a shift in the Bragg wavelength. The information is then recorded on the wavelength, with the advantage that multiple gratings with different Bragg wavelengths can be inscribed on the same fiber and interrogated with the same measurement apparatus, providing a nearly distributed measurement.
The two main physical parameters measured by FBG sensors are strain ( ε ) and temperature ( T ). Both modulate the Bragg wavelength as follows:
Δ λ B r a g g λ B r a g g = 1 ρ e ε + ( α Λ α n ) Δ T
where
  • 1 ρ e ε represents the strain contribution to the Bragg wavelength modulation, with ρ e being the photoelastic coefficient accounting for the strain-induced change in the refractive index;
  • ( α Λ α n ) Δ T represents the thermal contribution, where α Λ is the thermal expansion coefficient of the fiber and α n is the thermal modulation of the core refractive index.
The advantages of FBGs for sensing applications are several, including the following: a very high resolution, about 1 μstrain; the possibility of multiplexing for a quasi-distributed measurement configuration by using a single optoelectronic control unit; low invasivity due to the small size of the optical fibers (about 200 μm section for a typical coated fiber); intrinsic safety and immunity to electromagnetic fields; and the ability to continuously monitor the structure. On the other hand, FBGs have some limitations, such as the possibility of grid collapse under conspicuous motion, the fragility that requires care during handling, and especially temperature dependence, known as cross-sensitivity, which demands temperature compensation.
The study of the deformation of WPPs began with a collaboration between the “Istituto di Ricerca sulle Onde Elettromagnetiche Nello Carrara” of the CNR and the Opificio delle Pietre Dure restoration laboratories [54]. Their research aimed to evaluate the applicability of FBG sensors to monitor WPPs subjected to different environmental conditions and restoration interventions. The first application of FBG sensors was conducted on a wooden panel prepared using 15–16th century techniques [55]. During controlled variations in environmental humidity and temperature, FBG sensors effectively detected and quantified deformations in the panel. Specifically, Falciai et al. were able to monitor the deformation of the crossbeam and both the front and back of the painting during different situations. These experiments allowed the demonstration of the impact of crossbeams on the structure of the panel [56]. In addition, the same research group studied a method to assess cupping to avoid issues arising from acting directly on the painted surface [57]. They used two FBG sensors placed at different heights on two supports glued to the back of a panel. By measuring the differential deformation between the two gratings, they could accurately quantify changes in curvature.
FBG sensors were later applied to the back of Fra’ Giovanni Angelico’s “Tabernacolo dei Linaioli” (1433) [57]. In this case, the sensors enabled the monitoring of wood movements during RH fluctuations, especially at some critical points, such as between cracks. In particular, this approach allowed for the precise tracking of both strain and cupping of the WPP.

3.4. Summary of Localized Deformation Measurement Methods

In Table 2 we briefly present the main works involving the methods for measuring localized deformations.

4. Techniques for Full-Field Deformations

This section offers an overview of the techniques currently employed to investigate full-field deformations of the support of WPPs. These methods analyze an entire surface or a significant portion of the object, generating a “map” of the measured quantities. Specifically, we consider digital image correlation, stereo-correlation, and mark-tracking in Section 4.1; 3D modeling techniques in Section 4.2, with a focus on photogrammetry (Section 4.2.1), structured light topography (Section 4.2.2) and laser scanning (Section 4.2.3); and the moiré method in Section 4.3. Each sub-section also includes applications of these techniques on both historical artwork and simulacra.

4.1. Digital Image Correlation, Stereo-Correlation, and Mark-Tracking

Digital image correlation (DIC) is a technique used to measure surface or local deformations in materials or structures by analyzing digital images developed in the 1980s. In the 1990s, it was adapted to facilitate the measurement of three-dimensional surface displacement and, by the end of the millennium, DIC was further extended to include internal measurements using computed tomography scanning systems [60]. The technique involves capturing two or more digital images of an object, either through white-light photographs or speckle patterns generated by laser light. These images, typically recorded electronically and processed with sub-pixel accuracy [61], are analyzed to determine local displacements. For this purpose, the analysis divides the images into a matrix of small interrogation regions.
For displacements greater than one micrometer and when the object’s surface has adequate detail, a simple white-light setup is often sufficient. Resolution depends on the size of the markers on the object, pixel size, and magnification. In many cases, surface features such as the texture, micro-crack patterns, or surface profiles provide the necessary detail, which can be enhanced with oblique illumination. Otherwise, in cases where the surface lacks sufficiently small features, laser illumination can create speckle patterns by scattering light off the rough surface, a method known as digital speckle photography. These laser speckles move with the object and can be tracked similarly to surface features. Due to the coherent superimposition of light scattered from surface irregularities, laser speckle patterns are highly sensitive to minute changes caused by surface processes [62,63].
DIC methods can be classified into the following three types, two-dimensional digital image correlation (2D-DIC), stereo digital image correlation (StereoDIC or 3D-DIC), and volumetric digital image correlation (volumetric DIC or VDC). 2D-DIC uses a single camera to capture images of an object undergoing deformation and displacement along the surface plane. Software algorithms compare these images to determine the in-plane displacements and strains of the object. However, this method faces challenges as in-plane displacement measurements can be affected by out-of-plane displacements and rotations, leading to significant strain measurement errors [60].
StereoDIC, also known as three-dimensional DIC (3D-DIC) was developed in the early-1990s to directly measure surface displacements, deformations, and strains at each point by tracking surface features. To analyze the deformation of an object in all three directions, StereoDIC uses a simple setup, schematically represented in Figure 5, consisting of two stereoscopic cameras positioned at a specific stereo angle to capture images from different viewpoints and a processing unit to analyze the images and compute 3D displacement and strain fields [64]. Some setups may include a video beam projector to enhance contrast and generate a well-defined pattern, improving feature tracking when the natural surface texture is insufficient. It is important to note that the minimum stereo angle at which the cameras should be positioned is determined using the following equation [65]:
α = 2 a r c t g   D 2 W D
where D is the maximum diameter of the lens and WD is the minimum working distance required for focusing.
Thanks to binocular stereovision, it is possible to calculate the 3D coordinates of a physical point by triangulation, provided that the geometry of the stereo rig is known and two image points are matched. Numerous software programs have been developed to calibrate the stereo camera system and perform image correlation. These programs use images of the deformed object from the two stereo cameras to generate accurate 3D metric measurements for points on the surface, leading to full-field 3D surface displacements and surface strain. The main algorithms employed can be divided into two categories, feature matching, which extracts salient primitives like segments or contours, and template matching, which correlates gray levels [66]. This portable and user-friendly technique allows for the accurate measurement of full-field three-dimensional displacements and surface strains on both curved and planar surfaces, across a wide range of scales, including the microscale [60].
In the field of cultural heritage, this technique is particularly valuable as it does not require contact with the artwork. If the original images of the artwork are unsuitable due to excessive contrast in the paint layer, a more appropriate pattern, such as a speckle pattern, can be substituted. This process, known as the “extinction” of the painting, involves taking an initial image and numerically processing it to produce a “negative” image, which is then back-projected onto the panel to counterbalance the original image’s characteristics. The correlation of the images obtained from this virtual speckle pattern allows the 3D position of the measured points to be determined [64].
Furthermore, a mark-tracking technique can be employed to measure out-of-plane displacements and strains. This method enables the measurement of 3D displacements of marks, such as reversible dots, deposed on surfaces. Typically, two CCD cameras are used in a stereoscopic configuration to capture the special evolution of the mark positions. The first step involves calculating the position of each mark relative to a reference point associated with each CCD camera. The displacements of the marks are then tracked simultaneously across both camera viewpoints [67]. This method is useful for monitoring the behavior of a wooden support and its structural integrity over a long period [68].
Volumetric digital image correlation, also known as volumetric DIC or digital volume correlation (DVC), is quite complex and expensive due to the need for specialized illumination sources to obtain full-volume measurements. Typical sources include computed tomography systems, high-energy synchrotron sources—capable of resolving features below 10−6 m, allowing the analysis of materials with voxel sizes of 10−7 m—and magnetic resonance imaging systems for suitable materials. This method examines the interior of optically opaque objects by reconstructing a volumetric pattern that deforms with the object and can be tracked using correlation and matching algorithms [60].
Colmars et al. studied the hygro-mechanical behavior of “Le Couronnement d’Epines”, a 1563 anonymous painting exhibited in the Saint Didier church in Avignon, France [69]. In particular, the painting underwent a two-year monitoring period during which temperature and RH were also recorded. The authors employed the stereo correlation technique for external shape measurements and observed general cupping across all three boards, likely resulting from years of humidity variations. Analysis of the upper board revealed also a general twist, attributed to the grain orientation relative to the board’s length. In addition, the authors were able to present preliminary results from a simulation of the painting’s behavior.
In 2010, Dureisseix et al. measured the shape of the “Baptême du Christ” (Palais du Roure, Avignon, France) during its restoration by coupling 3D stereo-correlation and 3D finite elements [64]. Displacement measurements were taken before and after the removal of the old crossbeams and following the installation of the new ones. A finite element numerical approach was employed to update the structural model and compare experimental results with simulations. The application of the two methodologies enables the determination of the decrease in the residual stresses in the panel after the replacement of the horizontal beams.
Gauvin et al. monitored the wooden painting “Jacob Wrestling with the Angel” (1639) by the Dutch artist Bartholomeus Breenbergh [68] by employing mark-tracking. This technique has been effective in measuring out-of-plane displacements and strains the panel underwent during structural treatment [70]. Specifically, it helped to quantify the maximum panel deflection, as well as reveal the asymmetrical warping of the panel in response to the removal of the crossbeams.
In 2023, Dupre et al. [40] and Jullien et al. [58,59] presented a study on the experimental mechanical response of “La Sainte Trinité couronnant la Vierge” (16th century) in terms of curvature and surface strain. Because of the low contrast and the presence of both dark and bright areas on the painted side of the panel, the mark-tracking technique was chosen for the long-term monitoring of the deformation in a museum setting during hygrometric variations. This monitoring enabled the deduction of stress and strain in the wood and paint layer, the comparison of the panel’s shape in different conditions, and the assessment of the impact of physical elements (the original frame or the cradle on the painting). Additionally, the artwork was monitored using three DKs (see Section 3.2.), which enabled precise and continuous tracking of local curvature and deformations.

4.2. Three-Dimensional Models and Their Comparison

The three-dimensional (3D) modeling process involves acquiring data and creating interactive virtual models. These models are used in various fields such as inspection, navigation, identification, visualization, and animation. In cultural heritage, 3D models are crucial for understanding the shape of an artwork, analyzing its state of conservation, and providing information for restoration. They are essential for digital archiving, enabling the documentation of artifacts, supporting virtual tourism and museums, serving as educational resources, and allowing for interaction without risking damage to the originals. Additionally, 3D models facilitate the localization of mechanical stresses, the quantification of microclimatic variations, such as temperature and humidity, the measurement of surface wear, and the monitoring of shape changes caused by restoration works [71].
Optical 3D measurement techniques offer a non-contact means of capturing object shapes, providing a safer alternative to traditional needle or stylus profilometers. While the latter can measure morphological details in the sub-micrometer range, they represent a risk to fragile objects [72]. Many optical devices used for 3D measurement are derived from industrial metrology. However, the unique characteristics of each artwork—such as irregular shapes, polychromy, and the need for high precision in capturing fine details—often limit the direct applicability of these devices [73]. Although 3D optical techniques are non-invasive and use light to facilitate faster measurements compared to contact probes, their effectiveness can be constrained by surface reflectivity. For instance, uniformly colored and diffuse surfaces are generally easy to measure, while shiny surfaces present significant challenges. Despite recent advancements in 3D scanning technology, its application in cultural heritage remains limited due to the high cost of equipment, insufficient awareness of its potential, high dimensions of data, and the need for trained personnel capable of handling complex 3D models [74].
3D optical techniques are classified based on the type of sensor used, if it is active or passive, depending on whether they require illumination of the object. Active sensors directly provide depth information, which includes the 3D coordinates necessary for network generation. In contrast, passive sensors capture images that require additional processing to extract the 3D object coordinates. Most techniques are active and often need low light levels, which can make them unsuitable for in situ measurements where ambient light conditions cannot be controlled [75].
3D modeling of an object is a complex process that begins with data acquisition and culminates in the creation of a virtual 3D model [75]. The intermediate stage involves converting a point cloud into a triangulated mesh or textured surface. The surface reconstruction process works as follows: given a set of sample points Pi on an unknown surface S, a model with surface S′ is created to approximate S. When using surface triangulation, the exact reconstruction of S is not guaranteed because it relies on a finite set of sample points Pi. Therefore, the accuracy of S′ in approximating S improves with denser sampling. By converting three adjacent points into triangular facets, a range map is created. Then, the object’s shape is obtained by merging these range maps into a continuous 3D model (mesh). This process involves alignment (or registration), merging, simplification, and visualization. First, independent scans, each defined in different coordinate spaces, must be aligned or registered so they are in the same space. This involves selecting at least three common points in each pair of range maps for pairwise alignment. However, the latter can accumulate errors as each scan is aligned, so a global registration approach is often used to minimize distances between all range maps simultaneously. After registration, the scans are merged into a single continuous mesh. Simplification is then applied to make the model manageable for standard computers. Finally, the 3D model may need editing to fix holes and remove noise before it can be fully visualized.
Among the numerous techniques for creating 3D models of artworks, photogrammetry, structured light topography, and laser scanning are the most commonly used.

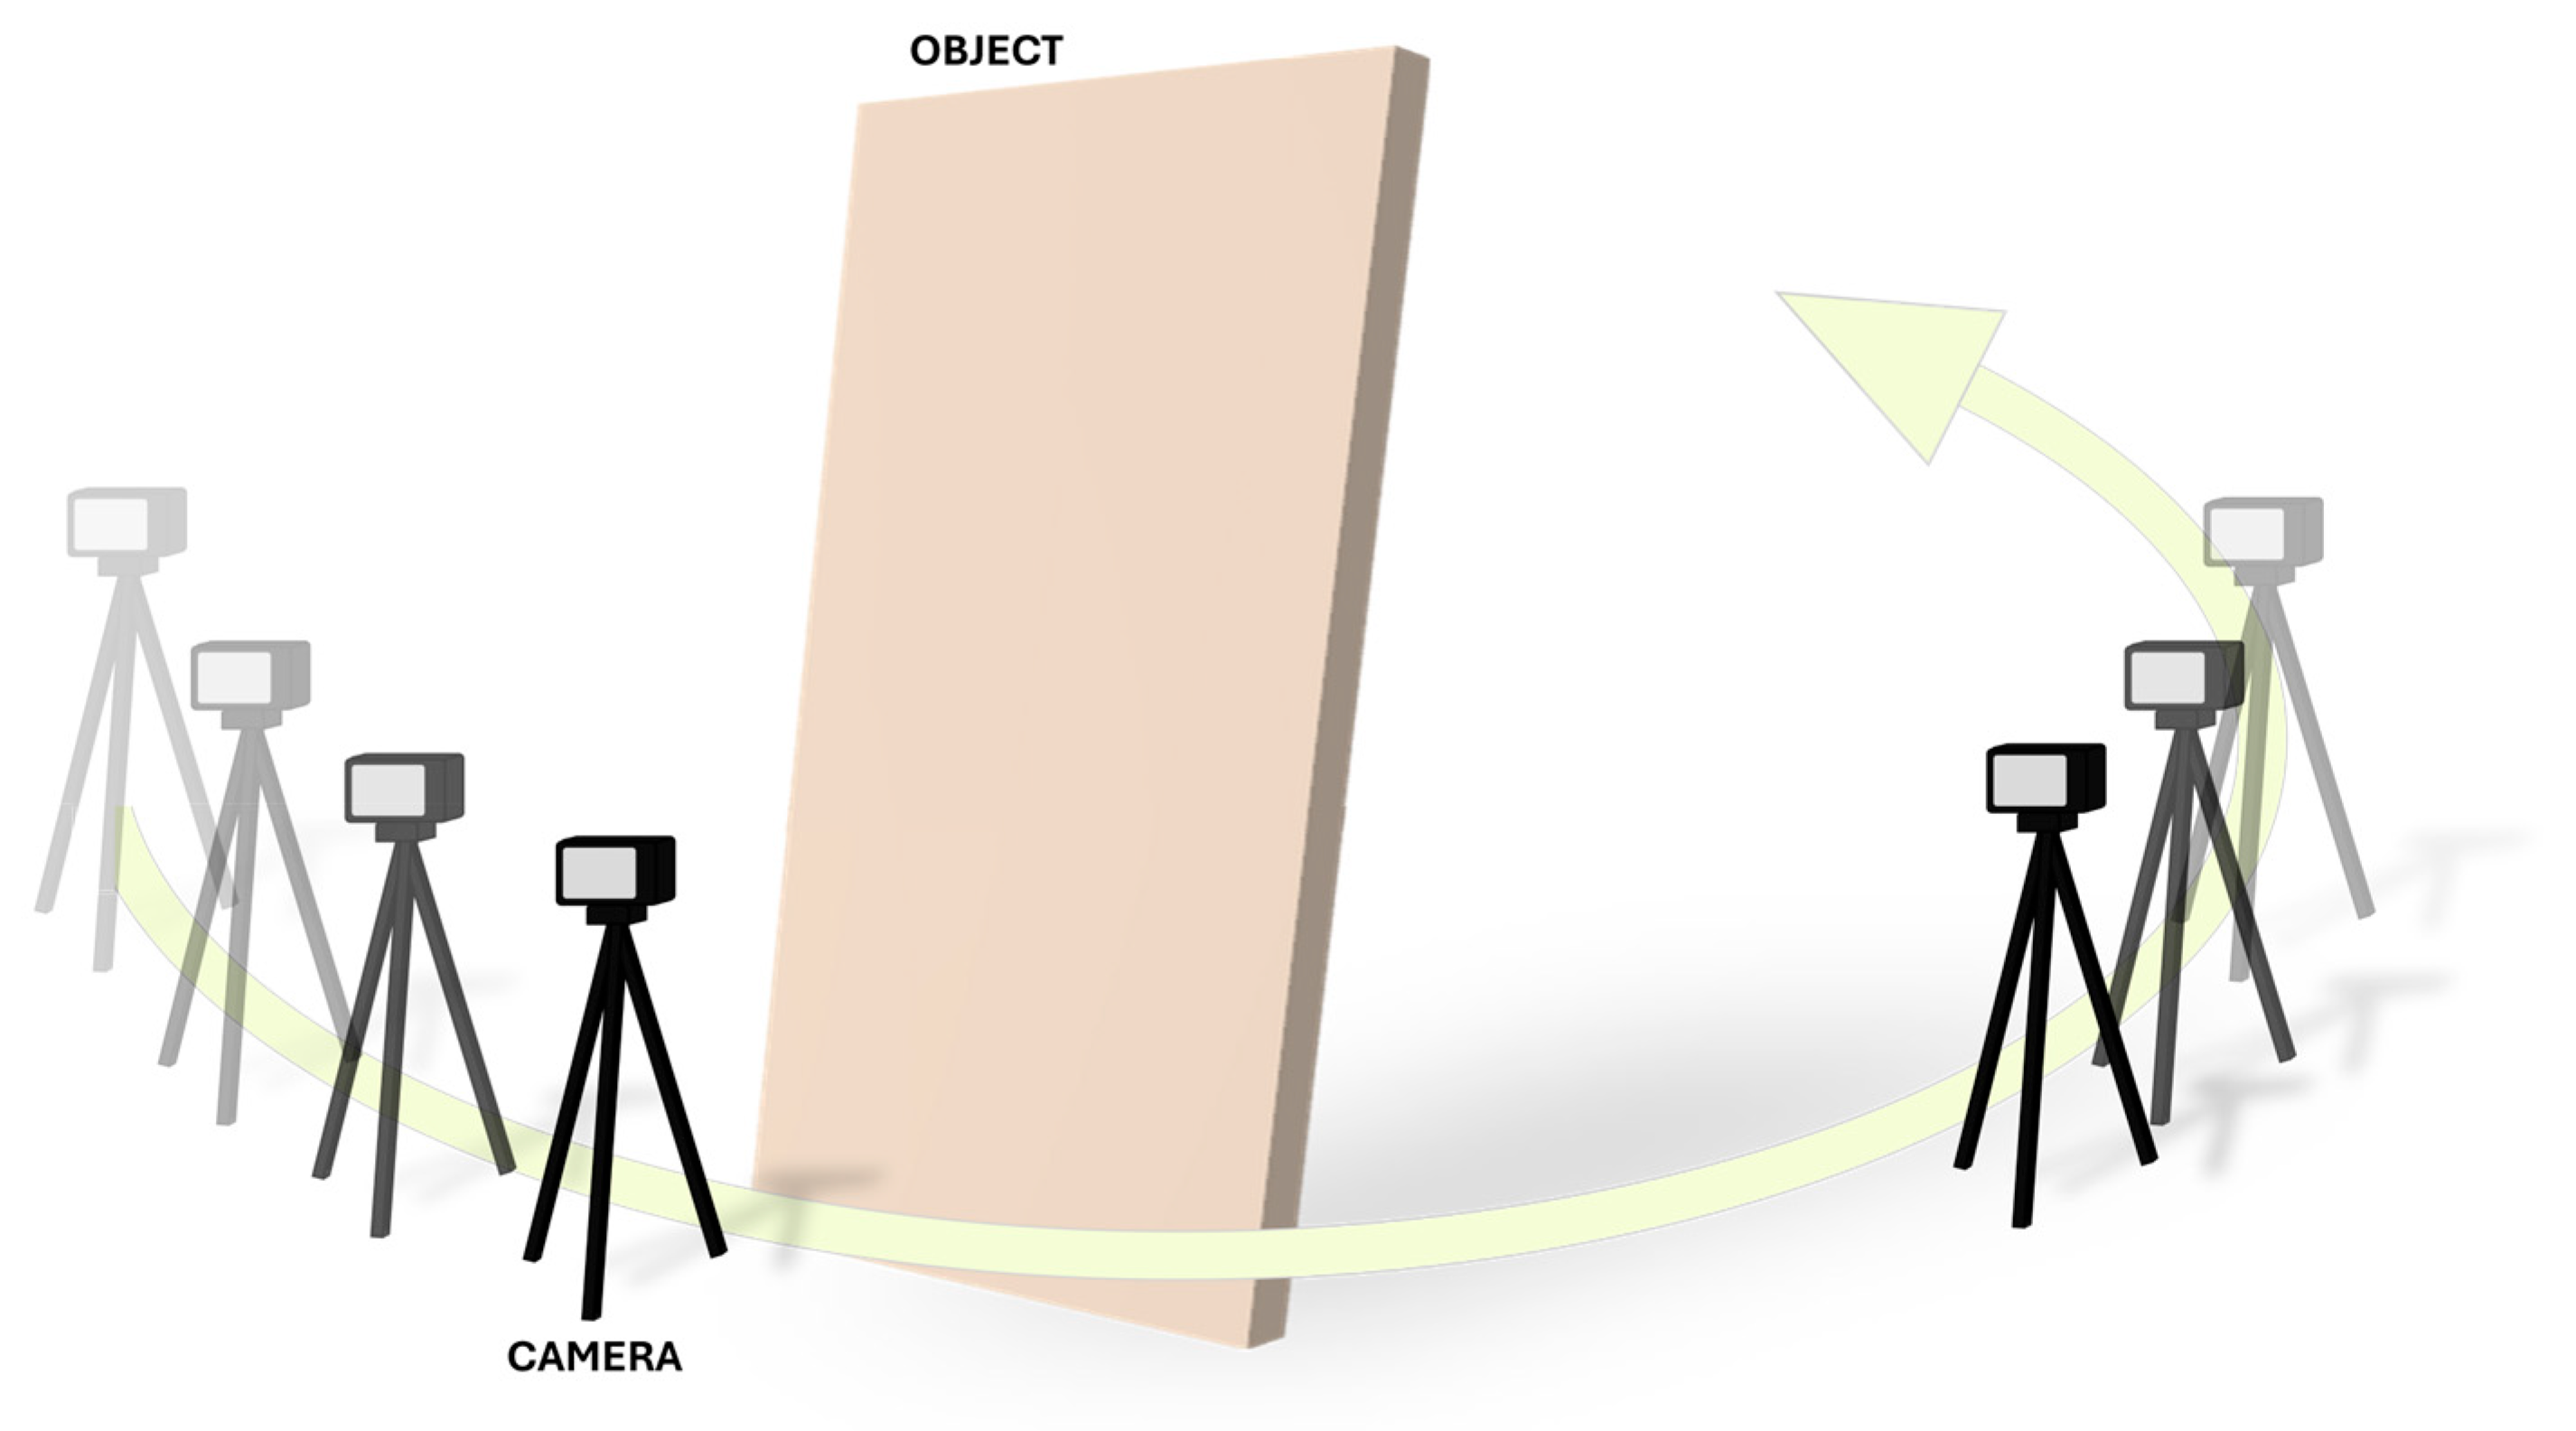
4.2.1. Photogrammetry

Photogrammetry is a remote sensing, non-contact technique that creates 3D models from two-dimensional images. As part of image-based modeling (IBM) techniques, photogrammetry is a passive method that does not require an artificial light source and uses a digital camera as a sensor. It is widely used for image data modeling, providing accurate and detailed 3D information for various applications. It also offers precision and reliability estimates for both known and unknown parameters based on measured image correspondences. Traditionally used for architectural surveys, photogrammetry has also been utilized in cultural heritage for decades to document and monitor the changes in artworks over time. It allows for detailed documentation, archiving in a non-degradable digital format, and multi-temporal analysis which require the object at later times [76,77].
Software specialized in photogrammetric reconstruction automatically creates a 3D model based on the data it receives from a set of images, establishing a geometric relationship between the three-dimensional positions of points in 3D space and their corresponding images in photographs. This process relies on two main types of algorithms, structure from motion (SfM) and dense multi-view 3D reconstruction (DMVR) [78]. SfM algorithms estimate the positions of anchor points between captured frames using metadata from exchangeable image file format (EXIF) files. On the other hand, DMVR algorithms recognize homologous points in successive frames to reconstruct the 3D model. Both methods are essential for generating accurate 3D representations from photogrammetric data.
A key principle in photogrammetry is optical triangulation. In this method, two images (or frames) of the same object are acquired from two different viewpoints, forming a stereoscopic pair. This setup simulates how human stereoscopic vision combines two perspectives to perceive depth. By applying triangulation, distance information is derived from the known baseline (distance between the camera stations) and the angles formed between the baseline and the lines of sight of the object. The camera setup approximates a triangle where the point of interest on the object is the vertex, and the camera positions define the base and angles. By analyzing the camera positions and baseline distance, the distance to the object point can be accurately determined. The acquisition phase is crucial as it determines the quality of the frames used to create the model. As Figure 6 shows, the photogrammetric setup involves capturing multiple images of an object from different viewpoints, typically covering 360°. This process is crucial for the accurate three-dimensional reconstruction of the object. It is important to note that a well-planned survey ensures a usable set of photographs by guaranteeing that the images are of high quality in terms of color, texture, and object size, are not blurred, and cover all parts of the object. Consequently, the texture obtained through photogrammetric modeling is realistic and avoids the creation of a “limitation” texture based solely on a reference image [79].
The photogrammetric workflow generates several possible secondary outputs, such as ortho-mosaics and digital elevation models (DEMs). These outputs provide metric information, with their quality directly dependent on the quality of the preceding digital products [78]. An ortho-mosaic is created through the processes of orthorectification and mosaicking of the input photogrammetric images. The outcome is a scaled, planimetrically corrected image that offers a higher spatial resolution than the individual source images. In contrast, a DEM is a raster image derived by projecting the dense 3D point cloud onto a selected theoretical plane. Each cell in the resulting XY plane holds an elevation value in the Z-axis, making the DEM a 2.5D surface. This theoretical plane can be interrogated to extract elevation data at any point in the image or to perform area and volume analyses.
Robson et al. [80] described the photogrammetric monitoring and surface reconstruction of the historic Westminster Retable, the oldest surviving easel painting in Britain. Specifically, monitoring enabled the study of the panel’s deformometric behavior during environmental fluctuations, providing a valuable tool for conservators to specify the level of environmental control necessary to ensure the artwork’s long-term stability. In addition, they developed a multi-station convergent photogrammetric reconstruction method to create a 3D surface model. This method produced an accurate dense point cloud of the object’s surface, capturing sufficient surface texture and incorporating automatically extracted 3D edge information to model the artwork’s complex geometry.
In 2018, Grifoni et al. [81] introduced a method for constructing and comparing multiband 3D models from images captured with different cameras across various spectral bands. They applied this technique to two WPPs: the “Madonna che allatta il Bambino con Angeli—Annunciazione” by Barnaba da Modena (14th century) and the Sicilian “Madonna con Bambino, e la Pentecoste” (15th century). For the former, 3D models were reconstructed in both RGB and IR bands, while for the latter an additional model was created using UV-VIS fluorescence. The authors then evaluated both quantitative and qualitative differences between the models, demonstrating that morphometrically comparable results can be achieved with different techniques. This innovation provides scientists and conservators with a robust new tool for cross-method comparison of data.
In 2019, Abate introduced an innovative approach using change detection procedures with photogrammetric techniques to monitor and document changes in an 18th-century Byzantine icon housed at the Byzantine Museum Makarios III Foundation in Nicosia, Cyprus [82]. The 3D study focused on evaluating the geometric features of the icon before and after its restoration. Specifically, the proposed digital methodology included a photogrammetric survey, the generation of dense point clouds and orthophotos, the detection of 2D and 3D multi-temporal changes, and the interpretation of the data. While the 2D change detection approach identified modifications limited to two-dimensional space, the application of the 3D algorithm revealed features of the wooden support that were not detectable during the initial visual inspection. Furthermore, by employing shading algorithms and a best-fit plane analysis, deviations from planarity were detected.
Angheluță et al. [83] employed photogrammetry, specifically macro-photogrammetry, to study two wooden icons, one depicting St. Constantine and Helen and the other St. Nicholas. In both cases, 3D digitalization facilitated macro-documentation of damaged areas, including craquelures, paint layers losses, cracks, and blistered surfaces, and detailed records of the icons’ overall deformations.
On the occasion of the exhibition “Masaccio e Angelico. Dialogo sulla verità della pittura” (2022–2023), the Museum of the Basilica of Santa Maria delle Grazie in San Giovanni Valdarno collaborated with the Department of Architecture of the University of Bologna to create a high-resolution digital model of Beato Angelico’s “Annunciazione”. Specifically, Fantini et al. [84] presented a 3D reconstruction method combining techniques with varying depth resolutions. Digital photogrammetry was employed to capture the shape of the wooden frame, while a combination of photometric stereo and gigapixel imaging was used for the painted surface. Photometric stereo, a photoclinometric (‘shape from shading’) imaging technique, reconstructs the shape and surface topography of an object by analyzing shadow variations caused by a rotating light source. This method is simple, fast, cost-effective, and requires minimal equipment, making it suitable for capturing surface optical properties, such as albedo, normal, and height maps [85]. On the other hand, gigapixel imaging was utilized to achieve extremely high-resolution images of the painted parts. The data from the photogrammetry and photometric stereo techniques were merged into a unified 3D model, aligning textured meshes to provide insights into the painting’s deformative state. Additionally, this model serves as a valuable tool for tourists, scholars, and conservators, enhancing understanding of pictorial materials and surface textures [86].
Moreover, in 2023, Grifoni et al. digitized the right panel of the Nocria Triptych (15th century), which suffered significant structural damage after the 2016 Central Italy earthquake [78]. Using 3D close-range photogrammetry, they created accurate models before and after the restoration. In this specific case, the application of photogrammetry allowed for the calculation of the panel’s thickness, quantification of the macro deviations of the wooden support from theoretical flatness through the calculation of the curvature deformation arrow, and evaluation of changes following the replacement of rigid crossbeams with more elastic ones.

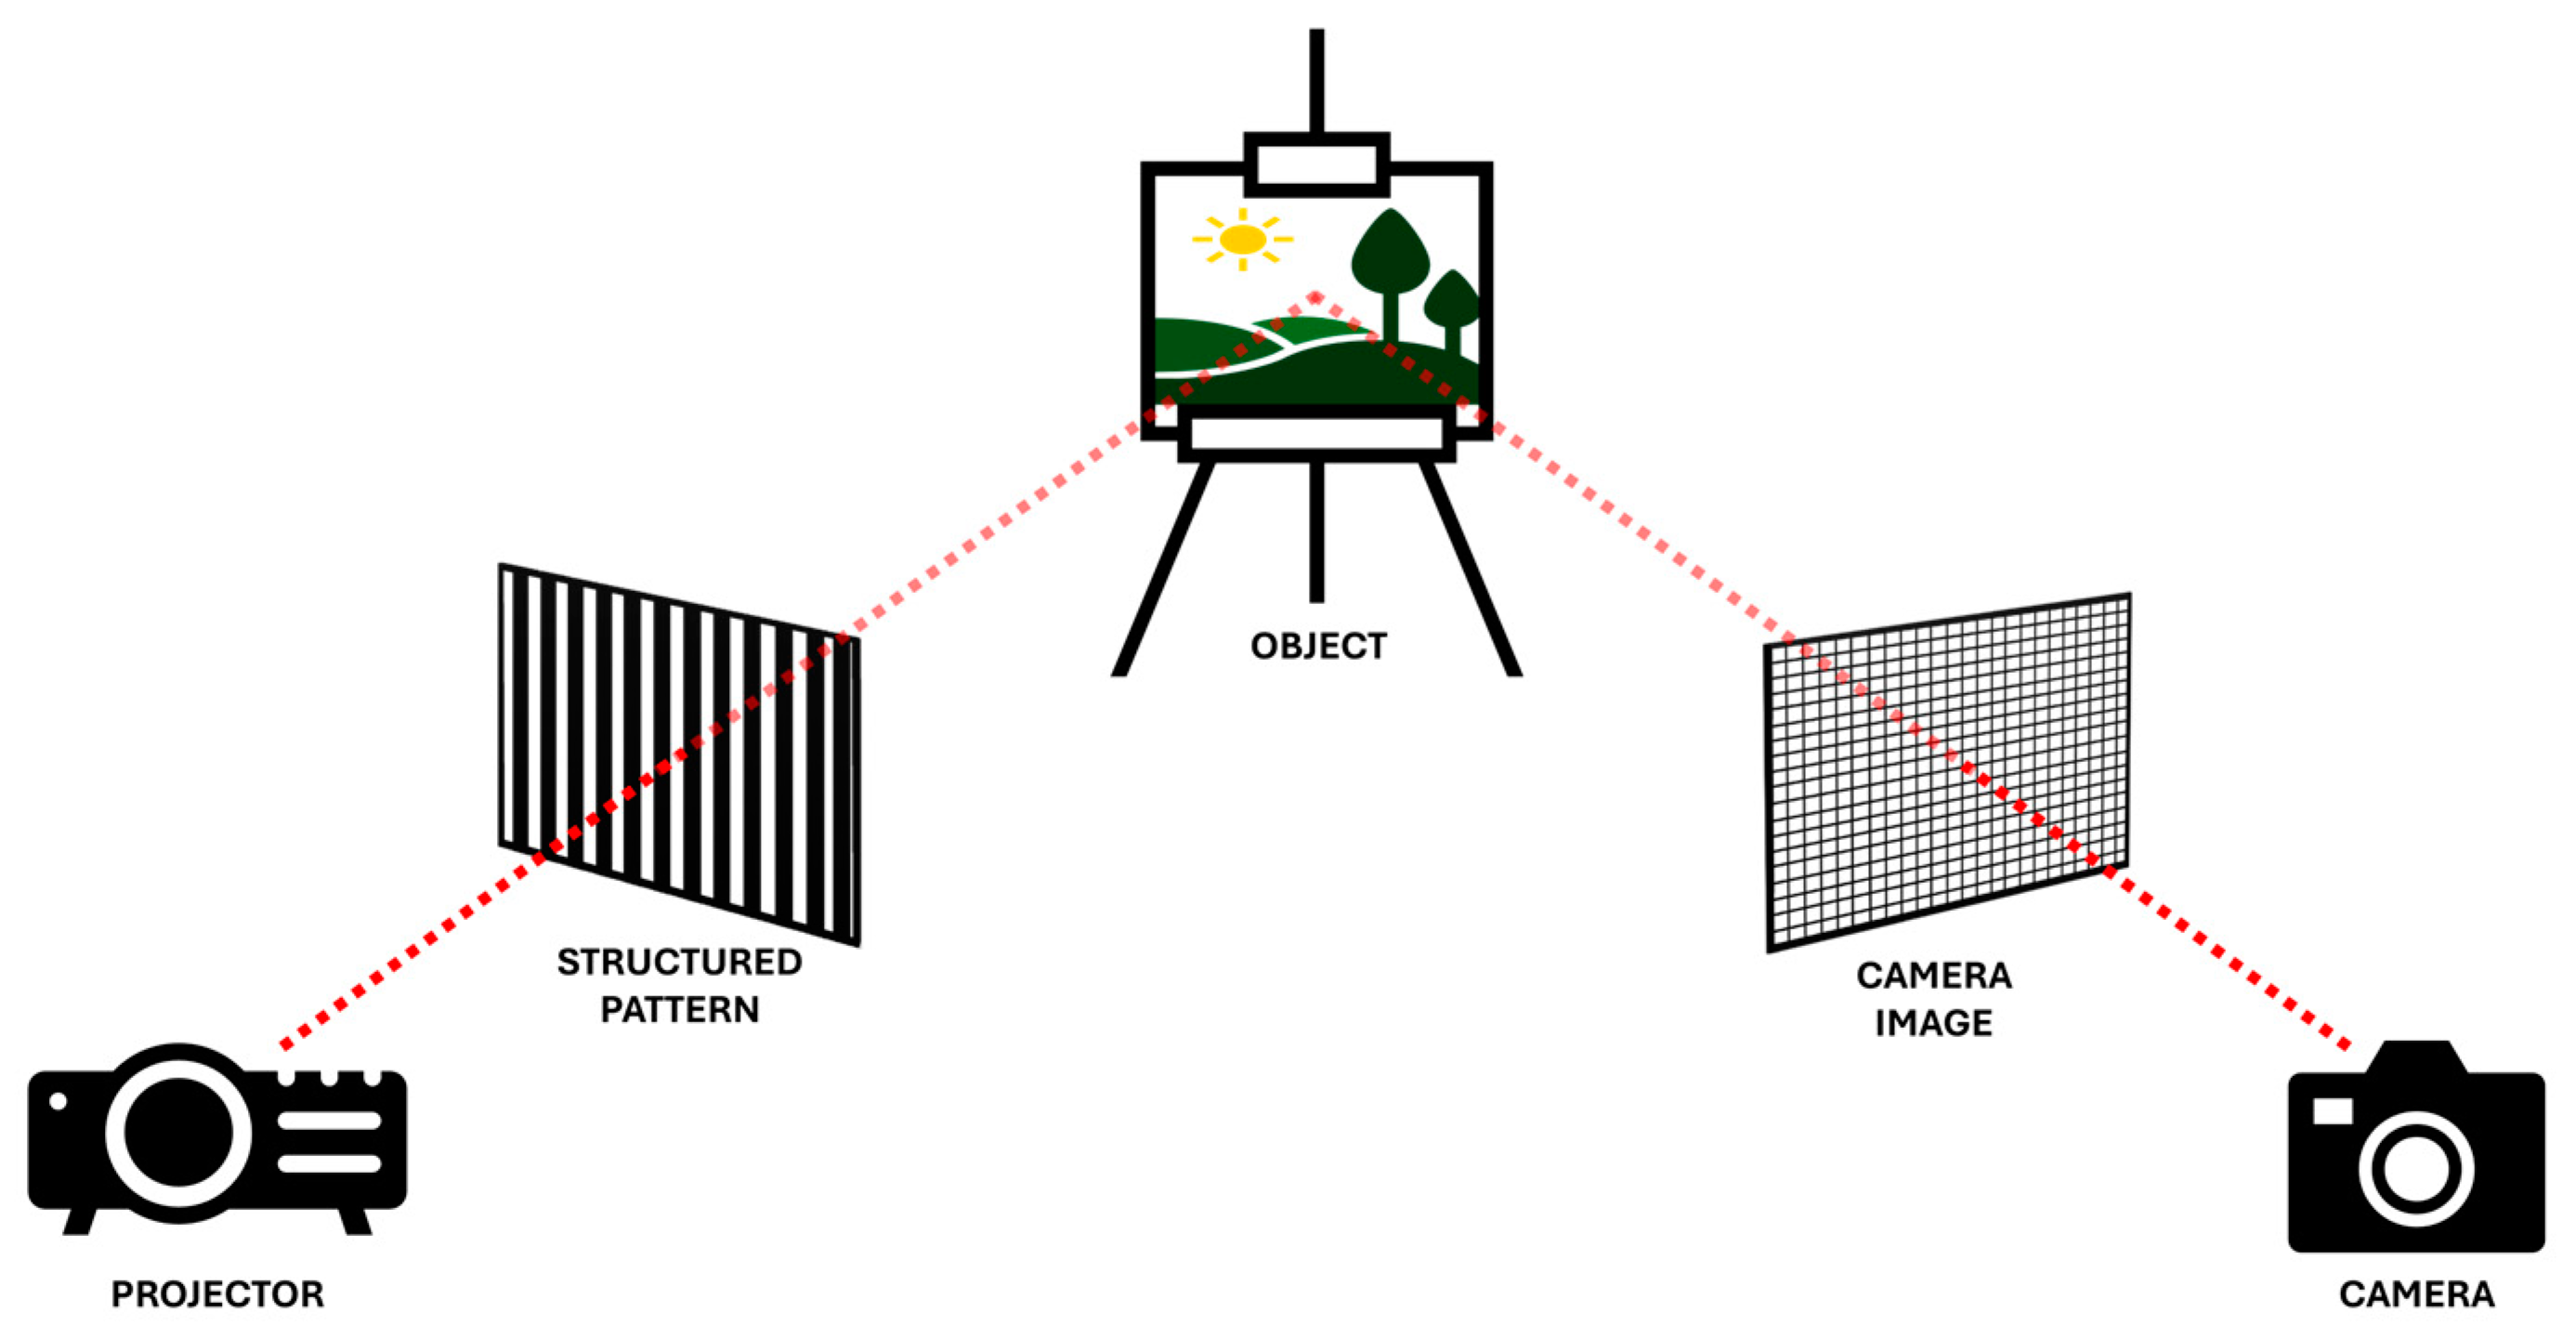
4.2.2. Structured Light Topography

Structured light topography is an active, non-invasive, and non-contact optical technique that enables the three-dimensional measurement of an object by projecting a coded light pattern. The defining characteristic of a structured light system is that it replaces one of the cameras in a stereo vision setup with an active light source, directly solving the correspondence problem [87]. As Figure 7 shows, the system consists of a projector that shines structured patterns onto the object to be scanned and a camera that captures the resulting pattern from another perspective. A processing unit analyzes the captured images to reconstruct the 3D surface of the object. Specifically, a controlled light pattern is projected onto the object, conforming to its surface shape, and the pattern deforms where there are height variations, resulting in distortions at depressions, undulations, and extrusions. A camera, positioned at a known angle relative to the projector, captures images of the deformed pattern, which contain essential depth information encoded within the pattern distortions.
To extract depth information, specialized algorithms analyze how the projected pattern has deformed. Many codification methods exist [88,89], such as ‘binary coding’ and especially ‘Gray coding’. This divides the object into several 2n sections, where n is the number of pattern sequences or fringes. The spatial frequency of the fringes affects both the spatial resolution and the measurement accuracy of the acquired 3D image. Indeed, higher frequencies can produce finer details, while lower frequencies can generate images with a lower spatial resolution. Moreover, by adjusting the line frequency, the accuracy of the imaging system can be optimized for the specific object being analyzed. The resolutions of the projector and camera limit the spatial resolution using binary codes.
Correspondence is then established by analyzing the distortion of the captured structured images with known features projected by the projector. Indeed, once the system is calibrated and the correspondence is known, (x, y, z) coordinates can be reconstructed using triangulation. This is achieved by applying specific trigonometric formulas based on the known distance between the camera and projector, and by calculating the displacement of the projected features.
This kind of system is called “full-field” because the CCD captures the entire measurement area in a single exposure, unlike scanning systems where the light moves across the measurement area.
The structured light technique offers several advantages, including high speed as it is capable of acquiring hundreds of thousands of points in a few minutes, high accuracy thanks to the large amount of data collected, which allows for a precise reconstruction of the object, and portability. However, a significant drawback is that it struggles with high reflectivity or very dark objects, as these characteristics can hinder accurate acquisition. Furthermore, a single scan cannot produce a complete digital model. Multiple scans are required not only to capture the entire object but also to address issues with shaded areas. Indeed, a key limitation of triangulation systems is that some regions may be visible to the projector but not to the camera, and vice versa. This results in lost data in those areas, which can be mitigated by performing multiple scans to integrate the missing points.
In 2002, Guidi et al. [90,91] created a structured light-based model of Leonardo da Vinci’s “Adorazione dei Magi”. This technique enabled a quantitative analysis of the painting’s deformations by comparing the 3D model to a planar reference. Particularly, it revealed a deep depression on the left side of the painting, a deviation from planarity caused by wood bending, and detailed in-depth profiles of the wood’s deformation.
Seventeen years later, Palma et al. used a new structured light-based model from 2015 to compare with the 2002 model, analyzing the panel’s deformation over time [92]. Before the temporal comparison, the authors assessed the deviation from an ideal flat plane, identifying regions with different types and magnitudes of deformation. Moreover, by deforming the 2002 model to align with the 2015 model, they quantified the real deformation and displacement of each point of the painting, highlighting significant modifications introduced during the restoration intervention.
In 2007, Akça et al. [93] employed structured light to digitize and model “Lady Praying” (1575–1599), a wooden painting by an unknown Flemish painter housed in the Louvre Museum. The technique allowed them to detect depth variations ranging from 100 μm to 1 mm and to separate the relief from the background structure by compensating for the painting’s overall shape. Additionally, they quantitatively magnified and visualized the depth information of the relief using shading plots or pseudo colors.
In 2018, Pelagotti et al. [94] conducted a study on Piero di Cosimo’s “Mystical Marriage of Saint Catherine” (15th century) to evaluate the reliability of two different 3D measurement techniques based on structured light. Both methods enabled the assessment of deviations from planarity, the recording of spatial deformations, and the monitoring of the painting’s conservation condition through comparisons of the models with planar references.
Froidevaux [49] utilized structured light topography, specifically the fringe projection technique, and the DK (see Section 3.2.) to measure the deformation of both unpainted and painted wooden panels. Specifically, the fringe projection technique was applied to analyze the shape of a restricted area. A comparison between the experimental results with the simulated data from the numerical modeling revealed a good agreement between the two.
Łukomski et al. [95] investigated changes in mock-up samples of a general WPP using the three different techniques of acoustic emission, time-lapse photography, and structured light topography. Specifically, time-lapse photography was chosen to identify cracks in the decorative layers, acoustic emission to monitor wood fracturing, and structured light topography to detect overall deformation by comparing the object’s shape before and after a humidity shift. These methods were applied simultaneously during the experiments, enabling the evaluation of their sensitivity to climate-induced changes in objects and providing a deeper understanding of the quality of the data collected.

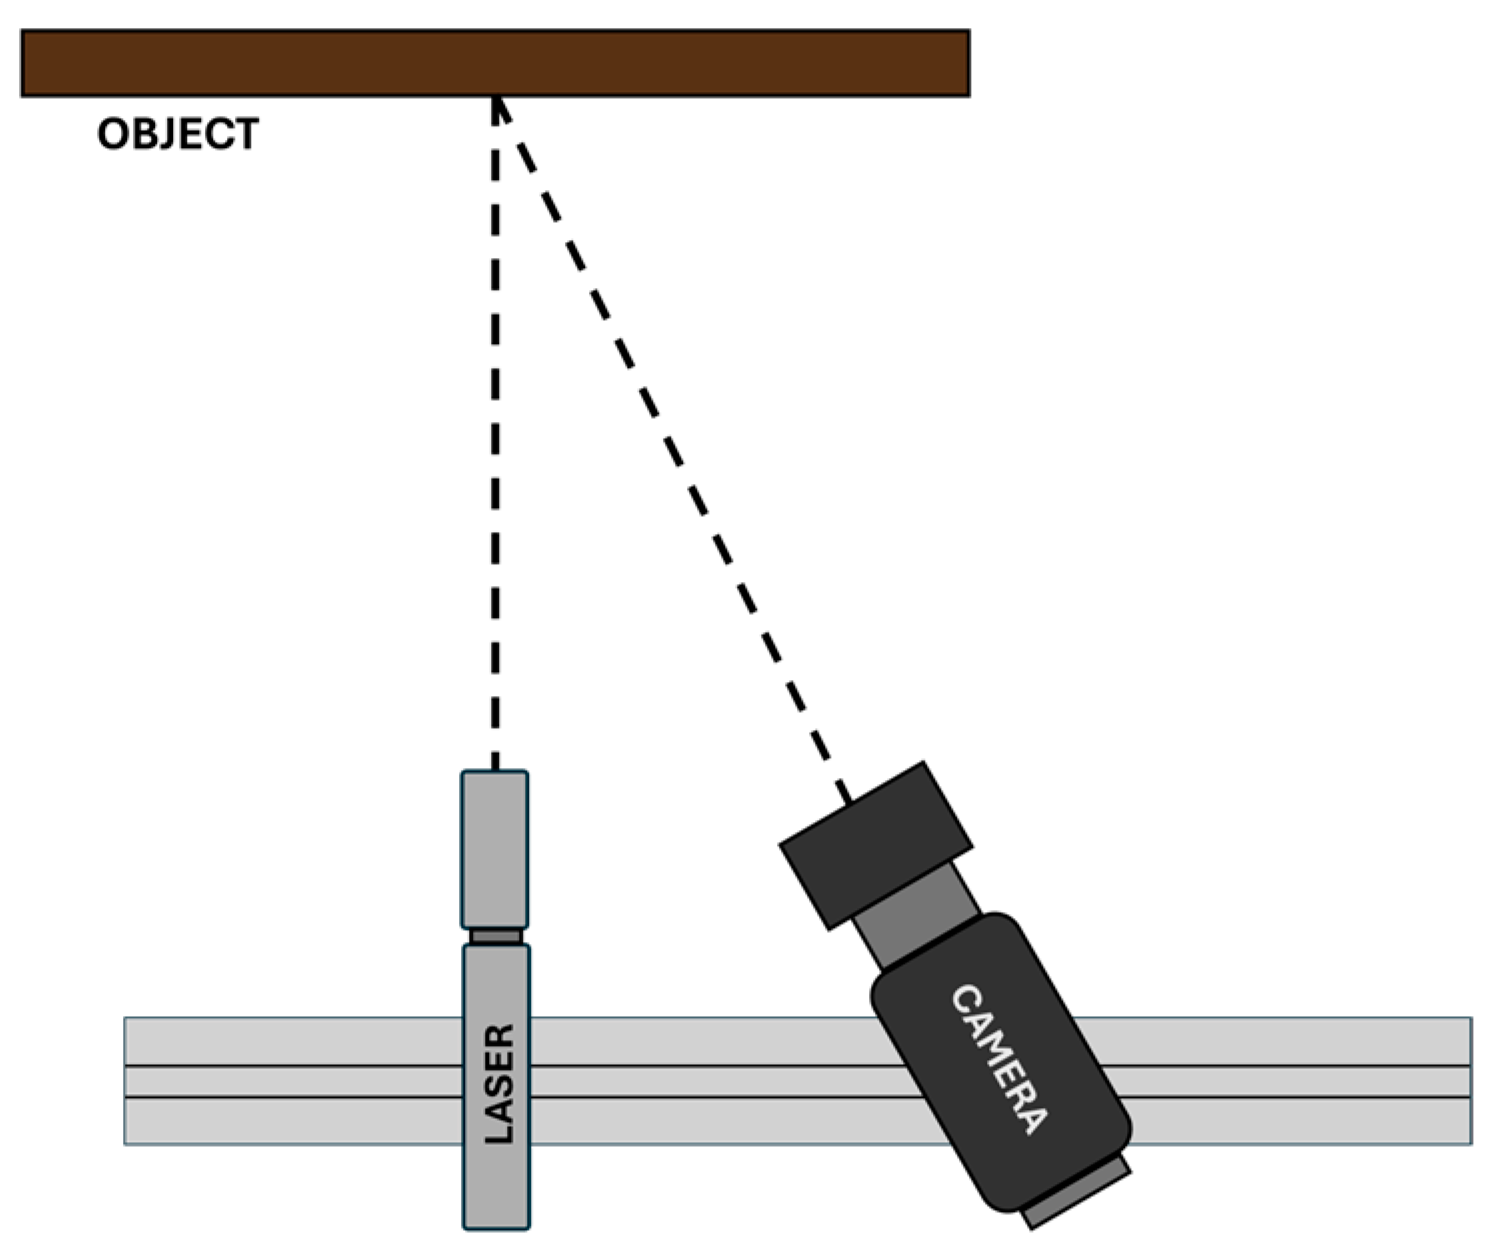
4.2.3. Laser Scanning

Laser Scanning uses a laser beam to precisely measure and capture detailed information about an object’s shape, size, and location. Photons emitted by a transmitter are reflected off the object’s surface. By analyzing the percentage of the reflections to the photosensitive sensor, the device calculates the distance between the scanner and the object. Moreover, laser scanners can capture color information through a camera sensor and determine the intensity of the reflected signal. As a result, the generated point cloud includes not only spatial data but also color (typically RGB) and grayscale values. There are three main types of laser scanners, distinguished by their distance measurement methods, which are time-of-flight scanners, phase-shift scanners, and triangulation scanners [96,97].
Time-of-flight (TOF) scanners measure the time it takes for a laser beam to travel from the emitter to the object and back. The distance ( d ) is calculated using the formula d = u · t 2 , where u represents the speed of the electromagnetic radiation and t is the time taken for the round trip. Although TOF scanners are relatively slow, they can cover large distances. Their measurement accuracy depends on the precision of the time measurement.
Phase-shift scanners calculate the distance between the emitter and the object by measuring the phase shift between the transmitted and reflected waveforms. The accuracy of the phase-shift ranging method is influenced by modulation frequency, signal strength, and ambient conditions. Due to the limited possibilities of emitting strong continuous laser radiation, they are typically used for shorter distances, generally up to a hundred meters. They are characterized by a small beam divergence, enabling the measurement of high-density spatial data with high accuracy.
Triangulation scanners (Figure 8) determine the position of a point on an object’s surface using a laser light and a camera. In a single-camera setup, the emitter directs the laser beam at a specific angle toward the object, and the camera captures the point where the laser interacts with the object. This setup (emitter, camera, and intersection point) forms a triangle, from which the 3D coordinates of the point can be derived through triangulation. Indeed, by knowing the positions of the emitter and camera, as well as the angles of laser emission and detection, trigonometric formulas can be applied to calculate the depth of the spot on the surface. The depth information, along with the scanner’s horizontal and vertical coordinates, enables the reconstruction of the 3D position of each point on the object. Moreover, the emission angle changes with predetermined angular steps, and in most cases, the object is scanned along a single line rather than a single point to speed up data acquisition.
Blais et al. developed a portable, high-resolution 3D color laser scanner optimized for the scanning of paintings. Utilizing an RGB laser source, the device scans a white laser spot across the entire surface of the painting, capturing both its shape and color. Additional details on the instrument are available in ref. [98]. In 2004, the National Research Council of Canada tested the prototype system by scanning three Renoir canvases and the anonymous Spanish panel “Dame en Prière” [99,100]. In the same year, the “Mona Lisa” was 3D scanned to document and accurately measure the distorted shape of the poplar panel. This process also examined surface features, including craquelure in the paint layer, a split in the panel, and areas of surface lacunae [101,102]. These analyses contributed to understanding the painting’s conservation state and Leonardo’s technique.
Barazzetti et al. assessed the conservation state of several paintings, offering valuable insights for further diagnostic applications [103]. Laser scanning was conducted on three paintings by Giorgio Vasari located in the church of Bosco Marengo (Alessandria, Italy). The shape of the first two paintings, “Giudizio Universale” and “Martirio di S. Pietro”, were acquired by using a 3 mm geometric resolution, allowing the identification of any significant deformations on a macro scale by comparing the artworks to an ideal flat plane, such as a uniform edge bending in “Giudizio Universale”. In contrast, the third painting, “Adorazione dei Magi”, underwent a more detailed survey with a 0.3 mm resolution. The deformation of the wooden structure was derived by comparing the 3D model with the ideal plane, revealing a deformation above the medium plane [104].

4.2.4. Application of Different 3D Modeling Techniques

While each 3D modeling technique is described individually and with its specific applications, it is common to employ multiple techniques to gain a comprehensive understanding of an artwork.
In 2007, Pires et al. created 3D models of two monumental paintings by Jorge Alfonso located in the Convento de Cristo in Tomar, Portugal [105]. The two paintings were “Entrance of Christ in Jerusalem” and “Lazarus Resurrection”. The study combined the use of photogrammetry, laser scanning, multispectral analysis, and GISs (geographic information systems) to enhance conservation and restoration practices. Specifically, photogrammetry generated high-detailed orthophotos and 3D models from photographic images, while laser scanning quantified the mechanical deformation and captured reflectance intensity data. Multispectral imaging analyzed various spectral bands of light to identify underdrawings, previous restorations, and pigment compositions, and the GIS facilitated the integration and management of diverse spatial data into a comprehensive documentation database. In particular, photogrammetry and laser scanning efficiently revealed bending in “Entrance of Christ in Jerusalem” and warping in “Lazarus Resurrection”, contributing to a deeper understanding of their structural condition.
In 2014, Abate et al. [106] presented a multi-temporal 3D documentation and monitoring of two wooden paintings: “Saint John the Baptist” by Giacomo Francia (16th century) and a Cretan icon (17th century). The application of photogrammetry and structured light scanning techniques enabled the digitalization of the artworks, the analysis of geometric features, the visualization of stylistic details, the measurement of the shape of the wooden supports, the assessment of deformation, the monitoring of shape changes over the medium/long term period, and the production of high-resolution orthoimages for digitalization, analysis, and restoration purposes. During the study, adopting these techniques displayed the presence of a slight deformation in “Saint John the Baptist”, previously undetectable.
In 2024, Vannini et al. conducted a multitemporal analysis of the central panel of the Nocria Triptych (mentioned before), comparing 3D models created before and after restoration [107]. The pre-restoration model, generated using close-range photogrammetry, revealed significant panel deflection and the near-complete detachment of a painting section. The post-restoration model, obtained using structured light topography, documented the shape changes resulting from the consolidation of the wooden support. However, by comparing the two models, the authors were able to quantify the differences between the pre- and post-restoration states, providing a comprehensive evaluation of the restoration intervention.

4.3. Moiré Method

The moiré method is a technique that exploits the moiré effect, a visual phenomenon resulting from the interference of overlapping gratings and patterns, to measure small displacements, deformations, and changes in surface contours. The system uses two physical or optical gratings with regular patterns, such as lines: one grating acts as the master, while the other serves as a reference. The resulting interference pattern, known as moiré fringes, can be captured and resolved by a CCD camera, revealing detailed contour information [108].
When two identical straight-line gratings are rotated relative to each other by a small angle, dark fringes appear where the lines are offset by half a period, and light fringes appear where the lines align. As the angle between the gratings increases, the spacing between the light and dark fringes decreases. Moreover, if the gratings are not identical, the resulting moiré pattern will not consist of equidistant rectilinear fringes, leading to more complex fringe patterns [109]. The method’s high resolution is achieved because the CCD camera does not need to resolve the individual lines of the gratings themselves, only the resulting moiré fringes. However, achieving high resolution presents challenges, such as the increased implementation complexity and the need for a high-power light source compared to a structured light technique. The typical measurement range of the moiré method is from 1 mm to 0.5 mm with the resolution at 1/10 to 1/100 of a fringe [108].
The moiré method can be categorized into two main types: shadow moiré and projection moiré. Shadow moiré, developed by Meadows [110] and Takasaki [111,112], involves projecting a grid of lines in front of an object using a point light source. The moiré phenomenon occurs by superimposing the grid and the shadow of the object, with the resulting moiré fringes corresponding to the contour lines of the object’s relief [113]. The relief Z at a given x -coordinate can be determined using the following relationship [114]:
Z = k   p x / ( h p + Z ) + ( d x ) / ( h p + Z )
where k represents the order of the fringes or the number of contour lines, d is the distance between the light source and the observer, h p is the distance between the light source and the grating plane (with pitch p ), and h 0 is the distance between the observer and the grating.
A common simplifying assumption in shadow moiré is that the projected and observed rays are parallel. This assumption is valid if the distances h p and h 0 are equal and if the relief Z is small compared to h 0 (which is typically the case when studying small objects). Additionally, the relief is proportional and linear to contour lines, and it can be determined as a function of the phase of the grating obtained through phase shifting:
Z = k p h d = k Z θ 2 π Z
where h = h 0 = h p .
Durelli [115], Pirroda [116], and Théocaris [117,118] developed the moiré projection method to study larger objects. This method involves superimposing two grating images onto the same photographic plate using double exposure. The first image, obtained by projecting a grating onto a reference plane, acts similarly to the master grating in shadow moiré. The second image is produced by projecting the grating onto the object, corresponding to the shadow of the grating used in shadow moiré. With the advent of more user-friendly numerical tools, both images can now be acquired independently and analyzed separately using phase-shifting techniques. Assuming parallel rays, the relief of the object’s surface is proportional to the phase difference between the reference grating and the object grating. Brewer et al. [119] proposed the following formula to determine the relief:
Z = θ 2 π P p r o j tan α
where tan α = d h and P p r o j = p cos α . According to the author, the simplified assumption of parallel rays can be justified only if h = h 0 = h p with the gratings being parallel to the reference plane, the relief is small compared to the observation distance, and the size of the object is small compared to the distance between the light source and the observer.
Although not widely used to study deformation in wooden panel paintings, the moiré method enables high-resolution, non-contact analysis. By projecting the pattern onto the surface and analyzing the resulting moiré fringes, it becomes possible to detect small variations, both in-plane and out-of-plane displacements, as well as surface features.
In 1997, Brewer and Forno presented the application of projection moiré to study deformations of WPPs [119]. Specifically, they focused on in-plane and out-of-plane displacements in two types of panels that shared material and structural characteristics with late-17th and early-18th century Northern European panel paintings. Applying the moiré method allowed the authors to study the impact of cradling during thermo-hygrometric variations. Particularly, it was possible to observe that the un-reinforced panel was able to bend, reducing moisture-induced in-plane strain, while in the cradled one, the warp component was converted into in-plane strain in addition to the humidity-induced strain. Moreover, under varying moisture conditions, cradled panels showed a greater tendency to develop out-of-plane deformations, such as washboarding and cracking.
In 2003, Spagnolo et al. proposed an easily transportable digital projection moiré system for full-field measurement of out-of-plane deformations of cultural heritage objects. More details on the instrument are explained in ref. [120]. Firstly, they conducted preliminary experiments on a model simulating a WPP with the same techniques and materials used in the 12th and 13th century. Secondly, they applied the system to study the WPP “Madonna col bambino, Santi ed Angeli musicanti” from the school of Antonio Solario (1525). In both cases, the method enabled the realization of phase maps and 3D plots, useful for studying and quantifying out-of-plane deformations, including detachments and cracks.
In 2004, Brémand et al. applied the shadow moiré technique to Leonardo da Vinci’s “Mona Lisa” [121]. Specifically, the study aimed to better understand the mechanical effects of the constraints imposed by the flexible frame attached to the back of the painting, as well as the impact of external variation in RH and temperature. Using this methodology, they measured the relief of the painting at different stages, such as when it was removed from its case, when the frame was detached, and after both were reinstalled. Additionally, they were able to calculate a thickness map from the reliefs obtained for the front and back surfaces, which allowed them to create a 3D model of the painting for virtual visualization and computer calculations, and to determine distortion to understand the painting’s behavior over time.

4.4. Summary of Full-Field Deformation Measurement Methods

In Table 3 we briefly present the main works involving the methods for measuring full-field deformations.

5. Comparative Analysis of Deformation Monitoring Techniques

All the techniques described have been applied to study deformations in historical artworks, after testing them on models to evaluate their effectiveness. Some techniques have been more successful than others, leading to greater application in the field and consequently a higher production of related papers. For example, to the author’s knowledge, FBGs have only been used once to study the deformations of a historical WPP, specifically the “Tabernacolo dei Linaioli” [57].
After categorizing the techniques into those that provide localized deformations and those that offer full-field information, this article aims to compare them and provide guidelines for selecting the most suitable tool for a given application. As shown in Figure 9, the discussion will compare the techniques based on monitoring type, the ability to provide surface information, cost, data complexity, data processing difficulty, real-time capability, and the possibility of generating 3D models. Moreover, Figure 10 presents a possible flowchart designed to assist conservators and scientists in selecting the most suitable technique for studying the support deformations of WPPs, based on the type of monitoring required, the available technical skills and budget, and the possibility of direct contact with the artwork.
The first aspect this article focuses on is the type of monitoring these techniques can provide. Indeed, it is possible to distinguish between those that allow long-term monitoring and those that provide information on the deformational state of the artwork at the time of recording.
The first category includes the DK, potentiometric transducers, and FBGs. These techniques enable long-term monitoring, even under varying RH and temperature conditions. They are particularly useful for studying the behavior of a WPP over extended periods, although their use for assessing deformations at a single specific time is limited and generally not recommended. Indeed, unlike optical techniques, these methods are slightly invasive as they require physical contact with the artwork. Furthermore, these techniques provide localized information at the specific points or areas where they are applied. As a result, a comprehensive view offered by full-field techniques is not achieved. However, under their experience and knowledge, restorers may compensate for this limitation by selecting representative areas for mounting, allowing for a more comprehensive overview of the deformation. It is important to consider that the raw data obtained from these techniques require interpretation to extract deformative information. For instance, in the DK, the combination of the transducers’ signals and the application of trigonometric formulas allow the determination of changes in the cupping angle, radius of curvature, and baseline lengths at both the front and back of the painting.
The second category includes all the techniques that provide deformations at the time of recording, such as those that allow 3D models and the moiré method. As described in numerous studies, they can give both qualitative and quantitative information about out-of-plane deformations by comparing them with a reference plane. However, to understand how the artwork has deformed over time—due to restoration, environmental changes, or catastrophic events—it is necessary to create a second model and compare it with the first. Examples include the studies by Grifoni et al. [78] and Vannini et al. [107] on the effectiveness of restoration interventions on the Norcia Triptych, which was severely damaged in the 2006 central Italy earthquake, and by Palma et al. [92] on the deformations that occurred during 13 years on Leonardo da Vinci’s “Adoration of the Magi”. While comparing 3D models helps to quantify shape changes over time, it fails to capture the intermediate states a WPP may experience, such as those caused by humidity fluctuations. However, unlike the first category’s techniques, these methods can also detect and quantify surface deformations or features like cracks, craquelure, detachments, etc., depending on the instrument’s accuracy [122]. They also may serve as tools for authentication, as demonstrated in ref. [123]. Additionally, the 3D models generated by these techniques are essential for digital archiving, documenting artifacts, supporting virtual tourism and museums, and as educational resources.
Moreover, DIC and its evolutions, stereo-correlation, and mark-tracking provide information on the deformation state of the support at the time of acquisition, surface deformations, the ability to make 3D models (with stereo-correlation), and long-term monitoring capabilities. Examples include monitoring by Dureisseix et al. [64] and Gauvin et al. [68] following restoration interventions, and studies by Colmars et al. [69] and Jullien et al. [58,59] on deformation due to environmental conditions.
Another important aspect to consider when applying techniques to study the deformation behavior of WPPs is the location of the monitoring: in a laboratory or in situ. Generally, applying measurement techniques to paintings exhibited in museums is challenging, particularly for long-term monitoring. This is due to the presence of visitors, who may influence the measurement and for whom it is necessary to ensure the artwork remains visible. While all the techniques discussed in this article can be applied in a research or restoration laboratory, only a few are generally suitable to be employed in a museum or exhibition environment—and even then, only in exceptional cases.
Particularly, optical techniques are difficult to use in an exhibition setting because they require specific conditions. For instance, the artificial and uneven lighting in a museum can cause shadows and reflections that degrade the quality of 3D model images. Additionally, active techniques like structured light topography require scans to be conducted in a dark environment. Although individual acquisitions only take seconds, multiple shots are often necessary, requiring either the artwork or the measuring instrument to be moved. This and the size of the equipment demands sufficient space, something which many museums lack, especially due to the flow of visitors. Furthermore, when using lasers or interference techniques such as moiré, precautions must be taken to avoid generating vibrations, which are inevitable in an uncontrolled environment like a museum.
In contrast, potentiometric transducers and the DK, being attached to the artwork, are not affected by such vibrations. The problem with them, however, is different; despite their small size, the DK and transducers demand a space behind the painting which is not always available in exhibition settings. For instance, three potentiometric displacement transducers were installed on the aluminum housing attached to the auxiliary frame of the “Mona Lisa” [32]. In this case, the application was feasible because of the presence of a case in which the artwork is housed.
Finally, using DIC and mark-tracking in a museum setting is also problematic, as these techniques are highly dependent on the specific characteristics of the painting. For instance, DIC requires a certain degree of surface texture to track the movement of small areas by matching local features between images taken under different conditions. This method is not always easy to apply, as demonstrated by the monitoring of “La Sainte Trinité couronnant la Vierge” [58,59], where DIC was not particularly successful, leading to the choice of mark-tracking. However, mark-tracking involves applying black and white dots to the surface of the artwork, which, while fully reversible, can compromise the visibility of the artwork and may not be acceptable in a museum environment.
Other important aspects to consider are cost and data processing, especially in the context of museum applications. Although not directly related, these two aspects are grouped due to their similar trends. Generally, optical techniques tend to be more expensive and involve more complex data processing compared to mechanical techniques. The higher costs are attributed to the need for specialized equipment, such as high-resolution digital cameras, and the software licenses required for data management and processing. In some cases, the software itself constitutes a significant portion of the expense. For instance, in photogrammetry and FBG, while the equipment may not be overly expensive, specific software is needed to create 3D models in the former and to interpret sensor signals in the latter—particularly when handling multiple sensors simultaneously. Unfortunately, the high costs associated with these techniques limit their routine use and make them difficult to implement in museums, which often operate on tight budgets. Additionally, while data acquisition can be relatively quick, the subsequent processing, including the extrapolation of quantitative information or the creation of 3D models, can significantly extend the overall measurement time. The large volumes of data generated can also be challenging for untrained personnel to manage. On the other hand, potentiometric transducers and DKs are cost-effective and, although they also generate substantial data—especially in long-term monitoring—they are straightforward enough for untrained personnel to use.
The complexity of data processing is also linked to the ability to observe data in real-time. In the field of cultural heritage conservation, particularly for WPPs, real-time monitoring of deformation data is increasingly important, especially within the conservation environment. While complex data processing techniques are valuable for assessing the state of conservation at specific points in time and comparing different conservation scenarios, they do not facilitate the continuous, real-time monitoring of deformation behavior. Conversely, techniques with simpler data processing requirements enable significant advancements in conservation by providing real-time data, thus allowing for continuous monitoring of the artwork’s condition. To the best of the author’s knowledge, the only artwork that has been continuously monitored to provide real-time data is the “Mona Lisa” [32].
To conclude this analysis of the different techniques used to study deformations in wooden panel paintings, it is important to highlight that multiple techniques are often employed to examine the behavior of the same artwork. Of interest are the monitoring studies carried out by Dupre et al. and Jullien et al. on the “La Sainte Trinité couronnant la Vierge” [40,58,59] and by Froideveux on simulacra [49], where the DK is combined with an optical technique—mark-tracking in the first case and structured light topography in the second. Although the aims of their research differ, the experimental results from both techniques were found to be comparable.
However, multiple techniques are often used to provide different information on the same artwork. This is the case in the study by Pires et al. [105], where the application of photogrammetry and laser scanning enabled the generation of highly detailed orthophotos and 3D models from photographic images, as well as the quantification of mechanical deformations in two artworks. Similarly, in the case of Giorgio Vasari’s “Lapidazione di Santo Stefano” [25,26,27], the simultaneous use of potentiometric transducers and DKs provided valuable information. Particularly, the former technique was used to study the slippage between the crossbeams and selected points on the panels and quantify wood displacement at the cracks, while the latter captured minor local deformations and distortions in specific areas, both before and after restoration. Additionally, displacement transducers and load cells were incorporated into the same measuring apparatus by Dionisi Vici et al. [36] to assess cupping, swelling/shrinking deformations, and the forces exerted by restraints designed to prevent deformations.
Finally, the case of the Mona Lisa involves both mechanical and optical measurements. The mechanical measurements include the use of displacement transducers and load cells [32,33,34,35] to monitor the cupping and bowing of the panel, aiming to estimate the panel’s mechanical properties through numerical modeling. In the optical category, laser scanning was employed to document and measure the distorted shape of the painting [101,102], while the moiré method was used to assess the relief of the painting in various conditions, allowing the calculation of the thickness map and identification of distortions [121]. However, in this case, these three techniques were applied by different research groups, and their results have never been compared. Lastly, the use and comparison of photogrammetry and structured light topography in refs. [106,107] enabled the evaluation and quantification of shape changes over a medium/long period or following restoration interventions.
Wooden panel paintings are among the most significant historical artworks that must be preserved for future generations. Ensuring their long-term conservation requires a comprehensive understanding and detailed characterization of their condition, making monitoring an essential process. This article outlines the main techniques employed to study support deformation in wooden panel paintings. Each method has its advantages and limitations, depending on the type of monitoring needed and the desired information. Nevertheless, these techniques enable the analysis of deformations experienced by these artworks, enhancing our understanding of the materials’ behavior and their responses to environmental changes or restoration interventions. This knowledge facilitates the implementation of more targeted and effective preventive strategies.

Author Contributions

Conceptualization, C.G., L.R., P.M. and M.F.; writing—original draft preparation, C.G.; writing—review and editing, C.G., L.R., P.M. and M.F.; visualization, C.G.; supervision, M.F. All authors have read and agreed to the published version of the manuscript.

Funding

This research received no external funding.

Data Availability Statement

The original contributions presented in the study are included in the article, further inquiries can be directed to the corresponding author.

Conflicts of Interest

The authors declare no conflicts of interest.

References

  1. Uzielli, L. Historical Overview of Panel-Making Techniques in Central Italy. In The Structural Conservation of Panel Paintings, Proceedings of the Symposium at the J. Paul Getty Museum, Los Angeles, CA, USA, 24–28 April 1995; Getty Conservation Institute: Los Angeles, CA, USA, 1998; pp. 110–135. [Google Scholar]
  2. Castelli, C. Techniques of Construction of Wooden Supports for Painting. In Structural Conservation of Panel Paintings at the Opificio Delle Pietre Dure in Florence: Method, Theory, and Practice; Collana dal restauro agli studi; Edifir Edizioni Firenze: Florence, Italy, 2016; pp. 285–349. ISBN 978-88-7970-792-3. [Google Scholar]
  3. Marette, J. Connaissance Des Primitifs Par L’étude Du Bois. Bull. Monum. 1961, 119-3, 290. [Google Scholar]
  4. Mecklenburg, M.F.; Tumosa, C.S.; Erhardt, W.D. Structural Response of Painted Wood Surfaces to Changes in Ambient Relative Humidity. In Painted Wood: History and Conservation; Dorge, V., Howlett, F.C., Eds.; The Getty Conservation Institute: Los Angeles, CA, USA, 1998; p. 464. [Google Scholar]
  5. Fioravanti, M. Le specie legnose dei supporti: Implicazioni per la conoscenza, la conservazione ed il restauro dei dipinti su tavola. In Conservazione dei Dipinti su Tavola; Nardini: Firenze, Italy, 1994; pp. 83–108. ISBN 978-88-404-4027-9. [Google Scholar]
  6. Cennini, C. Il Libro Dell’arte; Neri Pozza Editore S.p.a.: Vicenza, Italy, 2009. [Google Scholar]
  7. Federspiel, B. Questions About Medieval Gesso Grounds; The Getty Conservation Institute: Los Angeles, CA, USA; University of Leiden: Leiden, The Netherlands, 1995; pp. 58–64. [Google Scholar]
  8. Martin, E.; Sonoda, N.; Duval, A. Contribution à l’étude Des Préparations Blanches Des Tableaux Italiens Sur Bois. Stud. Conserv. 1992, 37, 82–92. [Google Scholar] [CrossRef]
  9. Riparbelli, L. Hygromechanical Behaviour of Wooden Panel Paintings: Classification of Their Deformation Tendencies Based on Numerical Modelling and Experimental Results. Herit. Sci. 2023, 11, 25. [Google Scholar] [CrossRef]
  10. Blanchette, R.A. A Guide to Wood Deterioration Caused by Microorganisms and Insects. In The Structural Conservation of Panel Paintings, Proceedings of the Symposium at the J. Paul Getty Museum, Los Angeles, CA, USA, 24–28 April 1995; Getty Conservation Institute: Los Angeles, CA, USA, 1998; pp. 55–68. [Google Scholar]
  11. Hoadley, R.B. Chemical and Physical Properties of Wood. In The Structural Conservation of Panel Paintings, Proceedings of the Symposium at the J. Paul Getty Museum, Los Angeles, CA, USA, 24–28 April 1995; Getty Conservation Institute: Los Angeles, CA, USA, 1998; pp. 2–20. [Google Scholar]
  12. Uzielli, L.; Fioravanti, M. Il Comportamento Fisico-Meccanico Del Legno Nei Dipinti Su Tavola. In Dipinti su Tavola. La Tecnica e la Conservazione dei Supporti; Edifir: Firenze, Italy, 2000; pp. 37–58. ISBN 978-88-7970-083-2. [Google Scholar]
  13. Uzielli, L. Danni causati ai dipinti su tavola da variazioni termoigrometriche, e loro prevenzione. In Conservazione dei Dipinti su Tavola; Nardini: Firenze, Italy, 1994; pp. 109–149. ISBN 978-88-404-4027-9. [Google Scholar]
  14. Riparbelli, L. Modelling of Hygro-Mechanical Behaviour of Wooden Panel Paintings: Model Calibration and Artworks Characterisation. Herit. Sci. 2023, 11, 126. [Google Scholar] [CrossRef]
  15. Lorenzo, R.; Paola, M.; Thomas, H.; Chiara, M.; Luca, U.; Ciro, C.; Andrea, S.; Luciano, R.; Sandra, R.; Joseph, G.; et al. Exploring the Inner Hygro-Mechanical Behaviour of Historical Panel Paintings: A Novel Approach Using Digital Twins. Herit. Sci. 2024, 12, 27. [Google Scholar] [CrossRef]
  16. Kránitz, K.; Sonderegger, W.; Bues, C.-T.; Niemz, P. Effects of Aging on Wood: A Literature Review. Wood Sci. Technol. 2016, 50, 7–22. [Google Scholar] [CrossRef]
  17. Grabner, M.; Kotlinova, M. Ageing of Wood—Described by the Analysis of Old Beams; Firenze University Press: Braga, Portugal, 2010; pp. 42–46. [Google Scholar]
  18. New, B. The Painted Support: Properties and Behaviour of Wood. In The Conservation of Panel Paintings and Related Objects; NOW: The Hague, The Netherlands, 2014; pp. 19–71. [Google Scholar]
  19. Inagaki, T.; Yonenobu, H.; Tsuchikawa, S. Near-Infrared Spectroscopic Monitoring of the Water Adsorption/Desorption Process in Modern and Archaeological Wood. Appl. Spectrosc. 2008, 62, 860–865. [Google Scholar] [CrossRef]
  20. Kawai, S.; Yokoyama, M.; Matsuo, M.; Sugiyama, J. Research on the Ageing of Wood in RISH; Firenze University Press: Braga, Portugal, 2010; pp. 52–56. [Google Scholar]
  21. Sassoli, M. Characterization of Wood Aging by Means of Volatile Organic Compounds (VOCs) Analysis. Ph.D. Thesis, University of Florence, Firenze, Italy, 2018. [Google Scholar]
  22. García Esteban, L.; Gril, J.; De Palacios De Palacios, P.; Guindeo Casasús, A. Reduction of Wood Hygroscopicity and Associated Dimensional Response by Repeated Humidity Cycles. Ann. For. Sci. 2005, 62, 275–284. [Google Scholar] [CrossRef]
  23. Young, C. The Painted Surface and Interface. In The Conservation of Panel Paintings and Related Objects; NOW: The Hague, The Netherlands, 2014; pp. 75–89. [Google Scholar]
  24. Manfriani, C.; Gualdani, G.; Goli, G.; Carlson, B.; Certo, A.R.; Mazzanti, P.; Fioravanti, M. The Contribution of IoT to the Implementation of Preventive Conservation According to European Standards: The Case Study of the “Cannone” Violin and Its Historical Copy. Sustainability 2021, 13, 1900. [Google Scholar] [CrossRef]
  25. Mazzanti, P.; Marcon, B.; Cocchi, L.; Goli, G.; Riparbelli, L.; Uzielli, L. An Innovative Method Based on In Situ Deformometric Monitoring to Support Decisions for the Structural Restoration of a Historic Panel Painting. Heritage 2024, 7, 4193–4205. [Google Scholar] [CrossRef]
  26. Linda, C.; Giacomo, G.; Paola, M.; Bertrand, M.; Luca, U. The Lapidazione di Santo Stefano by Giorgio Vasari: The Study of the Wooden Support’s Deformations as a Contribution to Restoration and Future Conservation. In Proceedings of the VIth European Symposium on Religious Art, Restoration & Conservation, Florence, Italy, 9–11 June 2014. [Google Scholar]
  27. Uzielli, L.; Cocchi, L. Monitoraggio e analisi dei movimenti del supporto ligneo della Lapidazione di Santo Stefano di Giorgio Vasari. Crit. D’arte 2012, 74, 97–102. [Google Scholar]
  28. Cocchi, L.; Marcon, B.; Goli, G.; Mazzanti, P.; Castelli, C.; Santacesaria, A.; Uzielli, L. Verifying the Operation of an Elastic Crossbar System Applied to a Panel Painting: The Deposition from the Cross by an Anonymous Artist from Abruzzo, Sixteenth Century. Stud. Conserv. 2017, 62, 150–161. [Google Scholar] [CrossRef]
  29. Cocchi, L. Tecniche Avanzate per Lo Studio Del Comportamento Strutturale Dei Dipinti Su Tavola. Ph.D. Thesis, University of Florence, Firenze, Italy, 2013. [Google Scholar]
  30. Mazzanti, P.; Dionisi-Vici, P.; Fioravanti, M.; Cardinali, E.; Mialhe, J.; Togni, M.; Uzielli, L.; Riparbelli, L. The Medusa Parade Shield by Caravaggio: Making Its Structural Replica, Laboratory Testing, and Numerically Modelling Their Hygro-Mechanical Distortion Behaviour. In The Future of Heritage Science and Technologies: Design, Simulation and Monitoring; Lecture Notes in Mechanical Engineering; Springer International Publishing: Cham, Switzerland, 2023; pp. 219–234. ISBN 978-3-031-17593-0. [Google Scholar]
  31. Uzielli, L.; Cardinali, E.; Dionisi-Vici, P.; Fioravanti, M.; Salvioli, N. Structure, Mock-up Model and Environment-Induced Deformations of Italian Laminated Wood Parade Shields from the 16th Century. In Proceedings of the Wood Science for Conservation of Cultural Heritage-Braga 2008: Proceedings of the International Conference, Braga, Portugal, 5 November 2008; pp. 242–248. [Google Scholar]
  32. Uzielli, L.; Dionisi-Vici, P.; Mazzanti, P.; Riparbelli, L.; Goli, G.; Mandron, P.; Togni, M.; Gril, J. A Method to Assess the Hygro-Mechanical Behaviour of Original Panel Paintings, through in Situ Non-Invasive Continuous Monitoring, to Improve Their Conservation: A Long-Term Study on the Mona Lisa. J. Cult. Herit. 2022, 58, 146–155. [Google Scholar] [CrossRef]
  33. Uzielli, L.; Dionisi-Vici, P.; Gril, J. Physical and Mechanical Characterization of the Support. In Mona Lisa Inside the Painting; Abrams: New York, NY, USA, 2006; pp. 43–46. [Google Scholar]
  34. Riparbelli, L.; Dionisi-Vici, P.; Mazzanti, P.; Brémand, F.; Dupré, J.C.; Fioravanti, M.; Goli, G.; Helfer, T.; Hesser, F.; Jullien, D.; et al. Coupling Numerical and Experimental Methods to Characterise the Mechanical Behaviour of the Mona Lisa: A Method to Enhance the Conservation of Panel Paintings. J. Cult. Herit. 2023, 62, 376–386. [Google Scholar] [CrossRef]
  35. Riparbelli, L.; Dionisi-Vici, P.; Dupre, J.-C.; Goli, G.; Jullien, D.; Bremand, F.; Mazzanti, P.; Hesser, F.; Marcon, B.; Togni, M.; et al. Mona Lisa’s Digital Twin: Identifying the Mechanical Properties of the Panel Combining Experimental Data and Advanced Finite-Element Modelling; GDR 3544 Sciences du Bois: Cluny, France, 2018; pp. 231–234. [Google Scholar]
  36. Dionisi Vici, P.; Mazzanti, P.; Uzielli, L. Mechanical Response of Wooden Boards Subjected to Humidity Step Variations: Climatic Chamber Measurements and Fitted Mathematical Models. J. Cult. Herit. 2006, 7, 37–48. [Google Scholar] [CrossRef]
  37. Rachwał, B.; Bratasz, Ł.; Krzemień, L.; Łukomski, M.; Kozłowski, R. Fatigue Damage of the Gesso Layer in Panel Paintings Subjected to Changing Climate Conditions. Strain 2012, 48, 474–481. [Google Scholar] [CrossRef]
  38. Rachwał, B.; Bratasz, Ł.; Łukomski, M.; Kozłowski, R. Response of Wood Supports in Panel Paintings Subjected to Changing Climate Conditions. Strain 2012, 48, 366–374. [Google Scholar] [CrossRef]
  39. Uzielli, L.; Cocchi, L.; Mazzanti, P.; Togni, M.; Jullien, D.; Dionisi-Vici, P. The Deformometric Kit: A Method and an Apparatus for Monitoring the Deformation of Wooden Panels. J. Cult. Herit. 2012, 13, S94–S101. [Google Scholar] [CrossRef]
  40. Dupre, J.-C. Experimental Study of the Hygromechanical Behaviour of a Historic Painting on Wooden Panel: Devices and Measurement Techniques. J. Cult. Herit. 2020, 46, 165–175. [Google Scholar] [CrossRef]
  41. Uzielli, L.; Fioravanti, M.; Casazza, O.; Perucca, G. A Technique for Double-Sided Monitoring the Deformations of the Wooden Supports of Panel Paintings: The Experience of Giotto’s “Maestà Di Ognissanti”. In Proceedings of the 3rd International Conference “ART ‘92”; IEEE Computer Society Press: Washington, DC, USA, 1992; Volume 1, pp. 500–514. [Google Scholar]
  42. Dionisi-Vici, P.; Formosa, M.; Schiro, J.; Uzielli, L. Local Deformation Reactivity of Panel Paintings in an Environment with Random Microclimate Variations: The Maltese Maestro Alberto’s Nativity Case-Study. In Proceedings of the Wood Science for Conservation of Cultural Heritage-Braga 2008: Proceedings of the International Conference, Braga, Portugal, 5 November 2008. [Google Scholar]
  43. Dionisi-Vici, P.; Bucciardini, I.; Fioravanti, M.; Uzielli, L. Monitoring Climate and Deformation of Panel Paintings in San Marco (Florence) and Other Museums. In Proceedings of the Wood Science for Conservation of Cultural Heritage, Florence 2007: Proceedings of the International Conference, Firenze, Italy, 8–10 November 2009. [Google Scholar]
  44. Marcon, B. Mechanical Study of a Support System for Cupping Control of Panel Paintings Combining Crossbars and Springs. J. Cult. Herit. 2012, 13, S109–S117. [Google Scholar] [CrossRef]
  45. Allegretti, O.; Dionisi-Vici, P.; Bontadi, J.; Raffaelli, F. The Case Study of The Daughters of the Emperor Ferdinand I by Jakob Seisenegger, in Trento (Italy): Analytical Hygro-Mechanical Results as a Support in Risk Assessment for Technical Interventions. Appl. Phys. A 2017, 123, 38. [Google Scholar] [CrossRef]
  46. Allegretti, O.; De Vincenzi, M.; Uzielli, L.; Dionisi-Vici, P. Long-Term Hygromechanical Monitoring of Wooden Objects of Art (WOA): A Tool for Preventive Conservation. J. Cult. Herit. 2013, 14, e161–e164. [Google Scholar] [CrossRef]
  47. Allegretti, O.; Bontadi, J.; Dionisi-Vici, P. Climate Induced Deformation of Panel Paintings: Experimental Observations on Interaction between Paint Layers and Thin Wooden Supports. IOP Conf. Ser. Mater. Sci. Eng. 2020, 949, 012018. [Google Scholar] [CrossRef]
  48. Froidevaux, J.; Müller, M.; Kuhnen, R.; Fioravanti, M.; Uzielli, L.; Gril, J.; Navi, P. 3D Modeling of Hydral Deformation of Panel Paintings and Its Confirmation by the Experiments. In Proceedings of the 4th International Conference of COST Action IE0601’Interaction Between Wood Science and Conservation of Cultural Heritage, Florence, Italy, 8–10 November 2007. [Google Scholar]
  49. Froidevaux, J. Wood and Paint Layers Aging and Risk Analysis of Ancient Panel Painting. Ph.D. Thesis, University of Montpellier 2, Montpellier, France, 2012. [Google Scholar]
  50. Castelli, C.; Ciatti, M.; Fioravanti, M.; Frosinini, C.; Gualdani, G.; Manfriani, C.; Mazzanti, P.; Ricciardi, L.; Riparbelli, L.; Rossi, S.; et al. Nuove acquisizioni sul comportamento deformativo di dipinti su tavola. OPD Restauro. 2023, 34, 112–119. [Google Scholar]
  51. Bacci, M. UV-Vis-NIR, FT-IR, and FORS Spectroscopies. In Modern Analytical Methods in Art and Archaeology; Chemical Analysis Series; John Wiley & Sons: New York, NY, USA, 2000; Volume 155. [Google Scholar]
  52. Meltz, G.; Morey, W.W.; Glenn, W.H. Formation of Bragg Gratings in Optical Fibers by a Transverse Holographic Method. Opt. Lett. 1989, 14, 823–825. [Google Scholar] [CrossRef]
  53. Kersey, A.D.; Davis, A.D.; Patrick, H.J.; LeBlanc, M.; Koo, K.P.; Askins, C.G.; Putnam, M.A.; Friebele, E.J. Fiber Gratings Sensors. J. Light. Technol. 1997, 15, 1442–1462. [Google Scholar] [CrossRef]
  54. Falciai, R.; Trono, C.; Lanterna, G.; Castelli, C. Continuous Monitoring of Wooden Works of Art Using FIber Bragg Grating Sensors. J. Cult. Herit. 2003, 4, 285–290. [Google Scholar] [CrossRef]
  55. Jones, J.D.C. Review of Fibre Sensor Techniques for Temperature-Strain Discrimination. In Optical Fiber Sensors; Optica Publishing Group: Washington, DC, USA, 1997. [Google Scholar]
  56. Falciai, R.; Trono, C.; Lanterna, G.; Castelli, C. FBG Sensors for Painted Wood Panel Deformation Monitoring. In Smart Structures and Materials 2003: Smart Sensor Technology and Measurement Systems; SPIE: Bellingham, WA, USA, 2003. [Google Scholar]
  57. Castelli, C.; Falciai, R.; Lanterna, G. Misurazioni non Invasive Delle Deformazioni nei Supporti Lignei. I Primi Dati dal “Tabernacolo dei Linaioli”. OPD Restauro. 2003, 15, 153–160. [Google Scholar]
  58. Jullien, D. Hygromechanical Study of a 16th Century Painted Wooden Panel: In-Situ Experiments to Quantify the Mechanical Effect of the Frame and the Cradle. J. Cult. Herit. 2023, 64, 266–274. [Google Scholar] [CrossRef]
  59. Jullien, D.; Bousvarou, M.; Stepanoff, P.; Dupré, J.C.; Gauvin, C.; Lorenzo, R. Monitoring the Deformation of an Historic Painting on a Wooden Panel (16th Century Panel Painting): Effect of the Frame, the Cradle and Microclimate Variations. In Proceedings of the ICOM-CC 20th Triennial Conference-Working Towards a Sustainable Past, Valencia, Spain, 18–22 September 2023. [Google Scholar]
  60. Sutton, M.A. Experimental Measurements Using Digital Image Correlation Methods: Brief Background and Perspective on Future Developments. J. Eng. Mater. Technol. 2022, 145, 014701. [Google Scholar] [CrossRef]
  61. Hinsch, K.D. Checkup for Aging Artwork—Optical Tools to Monitor Mechanical Behaviour. Opt. Lasers Eng. 2007, 45, 578–588. [Google Scholar] [CrossRef]
  62. Hinsch, K.D.; Gulker, G.; Hinrichs, H.; Joost, H. Artwork Monitoring by Digital Image Correlation. In Lasers in the Conservation of Artworks. LACONA V Proceedings; Springer proceedings in physics; Springer: Berlin/Heidelberg, Germany, 2004; p. 528. ISBN 978-3-540-22996-4. [Google Scholar]
  63. Fricke-Begemann, T. Three-Dimensional Deformation Field Measurement with Digital Speckle Correlation. Appl. Opt. 2003, 42, 6783–6796. [Google Scholar] [CrossRef] [PubMed]
  64. Dureisseix, D. Follow-up of a Panel Restoration Procedure through Image Correlation and Finite Element Modeling. Int. J. Solids Struct. 2011, 48, 1024–1033. [Google Scholar] [CrossRef]
  65. Sarvari, E.; Ahadi, A.; Eggeler, G.; Frenzel, J. An Optimized Stereo Digital Image Correlation Setup Based on Parfocal Zoom Lenses for Full-Field Measurements at 0.5–2× Magnification. Exp. Mech. 2024, 64, 1385–1405. [Google Scholar] [CrossRef]
  66. Garcia, D.; Orteu, J.-J.; Penazzi, L. A Combined Temporal Tracking and Stereo-Correlation Technique for Accurate Measurement of 3D Displacements: Application to Sheet Metal Forming. J. Mech. Work. Technol. 2002, 125–126, 736–742. [Google Scholar] [CrossRef]
  67. Germaneau, A.; Doumalin, P. Experimental Analysis of Mechanical Response of Stabilized Occipitocervical Junction by 3D Mark Tracking Technique. EPJ Web Conf. 2010, 6, 21004. [Google Scholar] [CrossRef]
  68. Gauvin, C.; Krekeler, A. Strain Measurements during Structural Conservation Treatment and the Long-Term Monitoring of a 17th-Century Dutch Panel Painting. In Proceedings of the 18th Triennial Conference, Copenhagen, Denmark, 4–7 September 2017. [Google Scholar]
  69. Colmars, J.; Marcon, B.; Maurin, E.; Remond, R.; Morestin, F.; Mazzanti, P.; Gril, J. Hygromechanical Response of a Panel Painting in a Church, Monitoring and Computer Modeling. In Proceedings of the International Conference on Wooden Cultural Heritage, Evaluation of Deterioration and Management of Change, Hamburg, Germany, 7–10 October 2009. [Google Scholar]
  70. Gauvin, C. Étude Expérimentale et Numérique Du Comportement Hygromécanique d’un Panneau de Bois. Application à La Conservation Des Tableaux Peints Sur Bois Du Patrimoine. Ph.D. Thesis, University of Montpellier, Montpellier, France, 2015. [Google Scholar]
  71. Gambino, M.C.; Fontana, R.; Greco, M.; Pampaloni, E.; Pezzati, L.; Pingi, P.; Cignoni, P.; Scopigno, R. Supporting the Restoration of the Minerva of Arezzo. In Proceedings of the Lasers in the Conservation of Artworks: LACONA V Proceedings, Osnabrück, Germany, 15–18 September 2003. [Google Scholar]
  72. Fontana, R.; Gambino, M.C.; Mazzotta, C.; Greco, M.; Pampaloni, E.; Pezzati, L. High-Resolution 3D Survey of Artworks. In Optical Metrology in Production Engineering; SPIE: Bellingham, WA, USA, 2004. [Google Scholar]
  73. Carcagnì, P.; Daffara, C.; Fontana, R.; Gambino, M.C.; Mastroianni, M.; Mazzotta, C.; Pampaloni, E.; Pezzati, L. Optical Micro-Profilometry for Archaeology. In Optical Methods for Arts and Archaeology; SPIE: Bellingham, WA, USA, 2005. [Google Scholar]
  74. Rocchini, C.; Cignoni, P.; Montani, C.; Pingi, P.; Scopigno, R.; Fontana, R.; Greco, M.; Pampaloni, E.; Pezzati, L.; Cygielman, M.; et al. 3D Scanning the Minerva of Arezzo. In Proceedings of the International Cultural Heritage Informatics Meeting, Milan, Italy, 3 September 2001. [Google Scholar]
  75. Remondino, F.; El-Hakim, S. Image-Based 3D Modelling: A Review. Photogramm. Rec. 2006, 21, 269–291. [Google Scholar] [CrossRef]
  76. Schenk, T. Introduction to Photogrammetry; The Ohio State University: Columbus, OH, USA, 2005. [Google Scholar]
  77. Brutto, M.L.; Garraffa, A.; Pellegrino, L.; Natale, B.D. 3D Mosaic Documentation Using Close Range Photogrammetry. In Proceedings of the 1st International Conference on Metrology for Archaeology, Benevento, Italy, 22 October 2015. [Google Scholar]
  78. Grifoni, E. 3D Multi-Modal Point Clouds Data Fusion for Metrological Analysis and Restoration Assessment of a Panel Painting. J. Cult. Herit. 2024, 66, 356–366. [Google Scholar] [CrossRef]
  79. Obradović, M.; Mišić, S.; Vasiljević, I.; Ivetić, D.; Obradović, R. The Methodology of Virtualizing Sculptures and Drawings: A Case Study of the Virtual Depot of the Gallery of Matica Srpska. Electronics 2023, 12, 4157. [Google Scholar] [CrossRef]
  80. Robson, S.; Bucklow, S.; Woodhouse, N.; Papadaki, H. Periodic Photogrammetric Monitoring and Surface Reconstruction of a Historical Wood Panel Painting for Restoration Purposes. Int. Arch. Photogramm. Remote Sens. Spat. Inf. Sci. 2004, 35, 395–400. [Google Scholar]
  81. Grifoni, E. Construction and Comparison of 3D Multi-Source Multi-Band Models for Cultural Heritage Applications. J. Cult. Herit. 2018, 34, 261–267. [Google Scholar] [CrossRef]
  82. Abate, D. Documentation of Paintings Restoration through Photogrammetry and Change Detection Algorithms. Herit. Sci. 2019, 7, 13. [Google Scholar] [CrossRef]
  83. Angheluță, L.M.; Rădvan, R. Macro Photogrammetry for the Damage Assessment of Artwork Painted Surfaces. ISPRS—Int. Arch. Photogramm. Remote Sens. Spat. Inf. Sci. 2019, XLII-2/W15, 101–107. [Google Scholar] [CrossRef]
  84. Fantini, F.; Gaiani, M.; Garagnani, S. Knowledge and Documentation of Renaissance Works of Art: The Replica of the “Annunciation” By Beato Angelico. ISPRS—Int. Arch. Photogramm. Remote. Sens. Spat. Inf. Sci. 2023, XLVIII-M-2, 527–534. [Google Scholar] [CrossRef]
  85. Bornstein, D. New Dimensions in Conservation Imaging: Combining Photogrammetry and Photometric Stereo for 3D Docum. AICCM Bull. 2023, 44, 148–162. [Google Scholar] [CrossRef]
  86. Gaiani, M. Artworks at Our Fingertips: A Solution Starting from the Digital Replication Experience of the Annunciation in San Giovanni Valdarno. Digit. Appl. Archaeol. Cult. Herit. 2024, 33, e00329. [Google Scholar] [CrossRef]
  87. Akca, D.; Remondino, F.; Novák, D.; Hanusch, T.; Schrotter, G.; Gruen, A. Performance Evaluation of a Coded Structured Light System for Cultural Heritage Applications. In Proceedings of the Videometrics IX, San Jose, CA, USA, 29–30 January 2007; SPIE: Bellingham, WA, USA, 2007. [Google Scholar]
  88. Zhang, S. High-Speed 3D Shape Measurement with Structured Light Methods: A Review. Opt. Lasers Eng. 2018, 106, 119–131. [Google Scholar] [CrossRef]
  89. Bell, T.; Li, B.; Zhang, S. Structured Light Techniques and Applications. In Wiley Encyclopedia of Electrical and Electronics Engineering; Webster, J.G., Ed.; Wiley: Hoboken, NJ, USA, 2016; pp. 1–24. ISBN 978-0-471-34608-1. [Google Scholar]
  90. Guidi, G.; Atzeni, C.; Seracini, M.; Lazzari, S. Painting Survey by 3D Optical Scanning—The Case of Adoration of the Magi by Leonardo Da Vinci. Stud. Conserv. 2004, 49, 1–12. [Google Scholar] [CrossRef]
  91. Guidi, G.; Atzeni, C.; Lazzari, S. 3D Optical Scanning Diagnostics for Leonardo Da Vinci’s “Adorazione Dei Magi” Conservation. In Proceedings of the Fourth International Conference on 3-D Digital Imaging and Modeling 2003, Banff, AB, Canada, 6–10 October 2003. [Google Scholar]
  92. Palma, G. Deformation Analysis of Leonardo Da Vinci’s “Adorazione Dei Magi” through Temporal Unrelated 3D Digitization. J. Cult. Herit. 2019, 38, 174–185. [Google Scholar] [CrossRef]
  93. Akça, D.; Grün, A.; Breuckmann, B.; Lahanier, C. High Definition 3D-Scanning of Arts Objects and Paintings. Opt. 3-D Meas. Technqiues VIII 2007, 2, 50–58. [Google Scholar]
  94. Pelagotti, A.; Uccheddu, F.; Massa, E.; Carfagni, M. Comparing Two 3D Measurement Techniques for Documenting Painted Wooden Panels Surface Deformations on a Real Test Case: “Mystical Marriage of Saint Catherine” by Renaissance Artist Piero Di Cosimo. IOP Conf. Ser. Mater. Sci. Eng. 2018, 364, 012090. [Google Scholar] [CrossRef]
  95. Łukomski, M.; Ziraldo, E.G.; Freeman, A.A.; Cosaert, A.; Taylor, J.; Beltran, V.L. Monitoring Micro-Changes in Wooden Artworks to Support Strategies for Indoor Climate Management; Technical University of Dresden: Dresden, Germany, 2021. [Google Scholar]
  96. Verykokou, S.; Ioannidis, C. An Overview on Image-Based and Scanner-Based 3D Modeling Technologies. Sensors 2023, 23, 596. [Google Scholar] [CrossRef] [PubMed]
  97. Altuntas, C. Triangulation and Time-of-Flight Based 3D Digitisation Techniques of Cultural Heritage Structures. ISPRS—Int. Arch. Photogramm. Remote. Sens. Spat. Inf. Sci. 2021, XLIII-B2-2, 825–830. [Google Scholar] [CrossRef]
  98. Blais, F.; Cournoyer, L. 3D Imaging from Theory to Practice: The Mona Lisa Story. In Proceedings of the Current Developments in Lens Design and Optical Engineering IX, San Diego, CA, USA, 11–12 August 2008; SPIE: Bellingham, WA, USA, 2008. [Google Scholar]
  99. Blais, F.; Taylor, J.; Cournoyer, L.; Picard, M.; Borgeat, L.; Dicaire, L.G.; Rioux, M.; Lahanier, C.; Aitken, G. Ultra-High Resolution Imaging at 50 Μm Using a Portable XYZ- RGB Color Laser Scanner. In Proceedings of the International Workshop on Recording, Modeling and Visualization of Cultural Heritage, Ascona, Switzerland, 22–27 May 2005; NRC: Ascona, Switzerland, 2005. [Google Scholar]
  100. Lahanier, C.; Aitken, G.; Taylor, J.; Blais, F.; Borgeat, L.; Beraldin, J.-A.; Rioux, M.; Breuckmann, B.; Colantoni, P.; Cournoyer, L.; et al. The 2D Multi-Spectral Digitisation and the 3D Modelling of Easel Paintings; National Research Council of Canada: Ottawa, ON, Canada, 2005. [Google Scholar]
  101. Blais, F.; Taylor, J.; Cournoyer, L.; Picard, M.; Borgeat, L.; Godin, G.; Lahanier, C.; Mottin, B. More than a Poplar Plank: The Shape and Subtle Colors of the Masterpiece Mona Lisa by Leonardo. In Proceedings of the Videometrics IX, San Jose, CA, USA, 29–30 January 2007; SPIE: Bellingham, WA, USA, 2007. [Google Scholar]
  102. Blais, F.; Taylor, J.; Cournoyer, L.; Picard, M.; Borgeat, L.; Godin, G.; Lahanier, C. Ultra High-Resolution 3D Laser Color Imaging of Paintings: The Mona Lisa by Leonardo Da Vinci. In Proceedings of the Lasers in the Conservation of Artworks—Proceedings of the International Conference Lacona VII, Madrid, Spain, 17–21 September 2007. [Google Scholar]
  103. Remondino, F.; Rizzi, A.; Barazzetti, L.; Scaioni, M.; Fassi, F.; Brumana, R.; Pelagotti, A. Review of Geometric and Radiometric Analyses of Paintings. Photogramm. Rec. 2011, 26, 439–461. [Google Scholar] [CrossRef]
  104. Barazzetti, L.; Remondino, F.; Scaioni, M.; Brutto, M.L.; Rizzi, A.; Brumana, R. Geometric and Radiometric Analysis of Paintings. ISPRS—Int. Arch. Photogramm. Remote Sens. Spat. Inf. Sci. 2010, 38, 5. [Google Scholar]
  105. Pires, H.; Marques, P.; Henriques, F.; Oliveira, R. Integrating Laser Scanning, Multispectral Imagery and Gis in C&R Documentation Practices: A First Approach Using Two Xvith Century Wood Paintings From Convento de Cristo in Tomar. In Proceedings of the XXI International CIPA Symposium, Athens, Greece, 1–6 October 2007; SPIE: Bellingham, WA, USA, 2007. [Google Scholar]
  106. Abate, D.; Menna, F.; Remondino, F.; Gattari, M.G. 3D Painting Documentation: Evaluation of Conservation Conditions with 3D Imaging and Ranging Techniques. ISPRS—Int. Arch. Photogramm. Remote. Sens. Spat. Inf. Sci. 2014, XL-5, 1–8. [Google Scholar] [CrossRef]
  107. Vannini, E.; Lunghi, I.; Grifoni, E.; Farioli, P.; Ginanni, M.; Santacesaria, A.; Fontana, R. Three-Dimensional Analysis for the Documentation of the Restoration of an Earthquake-Damaged Triptych. Heritage 2024, 7, 2176–2194. [Google Scholar] [CrossRef]
  108. Chen, F.; Brown, G.M.; Way, T.; Song, M. Overview of Three-Dimensional Shape Measurement Using Optical Methods. Opt. Eng. 2000, 39, 10–22. [Google Scholar]
  109. Creath, K.; Wyant, J.C. Moiré and Fringe Projection Techniques. In Optical Shop Testing; Wiley series in pure and applied optics; Wiley: New York, NY, USA, 1992; p. 773. ISBN 978-0-471-52232-4. [Google Scholar]
  110. Meadows, D.M.; Johnson, W.O.; Allen, J.B. Generation of Surface Contours by Moiré Patterns. Appl. Opt. 1970, 9, 942–947. [Google Scholar] [CrossRef]
  111. Takasaki, H. Moiré Topography. Appl. Opt. 1970, 9, 1467–1472. [Google Scholar] [CrossRef]
  112. Takasaki, H. Moiré Topography. Appl. Opt. 1973, 12, 845–850. [Google Scholar] [CrossRef] [PubMed]
  113. Breque, C.; Dupre, J.-C.; Bremand, F. Calibration of a System of Projection Moire! For Relief Measuring: Biomechanical Applications. Opt. Lasers Eng. 2004, 41, 241–260. [Google Scholar] [CrossRef]
  114. Mauvoisin, G.; Brémand, F.; Lagarde, A. Quasi-Heterodyne Shadow Moiré. In Proceedings of the 10th International Conference on Experimental Mechanics, Lisbon, Portugal, 18–22 July 1994; A.A. Balkema: Rotterdam, The Netherlands; Brookfield, VT, USA, 1994; pp. 245–250, ISBN 90 5410 395 7. [Google Scholar]
  115. Durelli, A.J.; Parks, V.J. Moiré Analysis of Strain; Prentice-Hall: Englewood Cliffs, NJ, USA, 1970. [Google Scholar]
  116. Pirroda, L. Shadow and Projection Moiré Technique for Absolute or Relative Mapping of Surface Shapes. Opt. Eng. 1982, 21, 640–649. [Google Scholar] [CrossRef]
  117. Théocaris, P. Isopachic Patterns by the Moiré Method. Exp. Mech. 1964, 4, 153–159. [Google Scholar] [CrossRef]
  118. Théocaris, P. Moiré Fringes in Strain Analysis; Pergamon Press: Oxford, UK, 1969. [Google Scholar]
  119. Brewer, A.; Forno, C. Moiré Fringe Analysis of Cradled Panel Paintings. Stud. Conserv. 1997, 42, 211–230. [Google Scholar] [CrossRef]
  120. Spagnolo, G.S.; Majo, R.; Ambrosini, D.; Paoletti, D. Digital Moire’ by a Diffractive Optical Element for Deformation Analysis of Ancient Paintings. J. Opt. A Pure Appl. Opt. 2003, 5, S146–S151. [Google Scholar] [CrossRef]
  121. Brémand, F.; Doumalin, P.; Dupré, J.-C.; Hesser, F.; Valle, V. Measuring the Relief of the Panel Support without Contact. In Mona Lisa Inside the Painting; Abrams: New York, NY, USA, 2006; pp. 43–46. [Google Scholar]
  122. Lunghi, I.; Vannini, E.; Fovo, A.D.; Sarno, V.D.; Rocco, A.; Fontana, R. A Performance Comparison of 3D Survey Instruments for Their Application in the Cultural Heritage Field. Sensors 2024, 24, 3876. [Google Scholar] [CrossRef]
  123. Buchón-Moragues, F.; Bravo, J.M.; Ferri, M.; Redondo, J.; Sánchez-Pérez, J.V. Application of Structured Light System Technique for Authentication of Wooden Panel Paintings. Sensors 2016, 16, 881. [Google Scholar] [CrossRef]
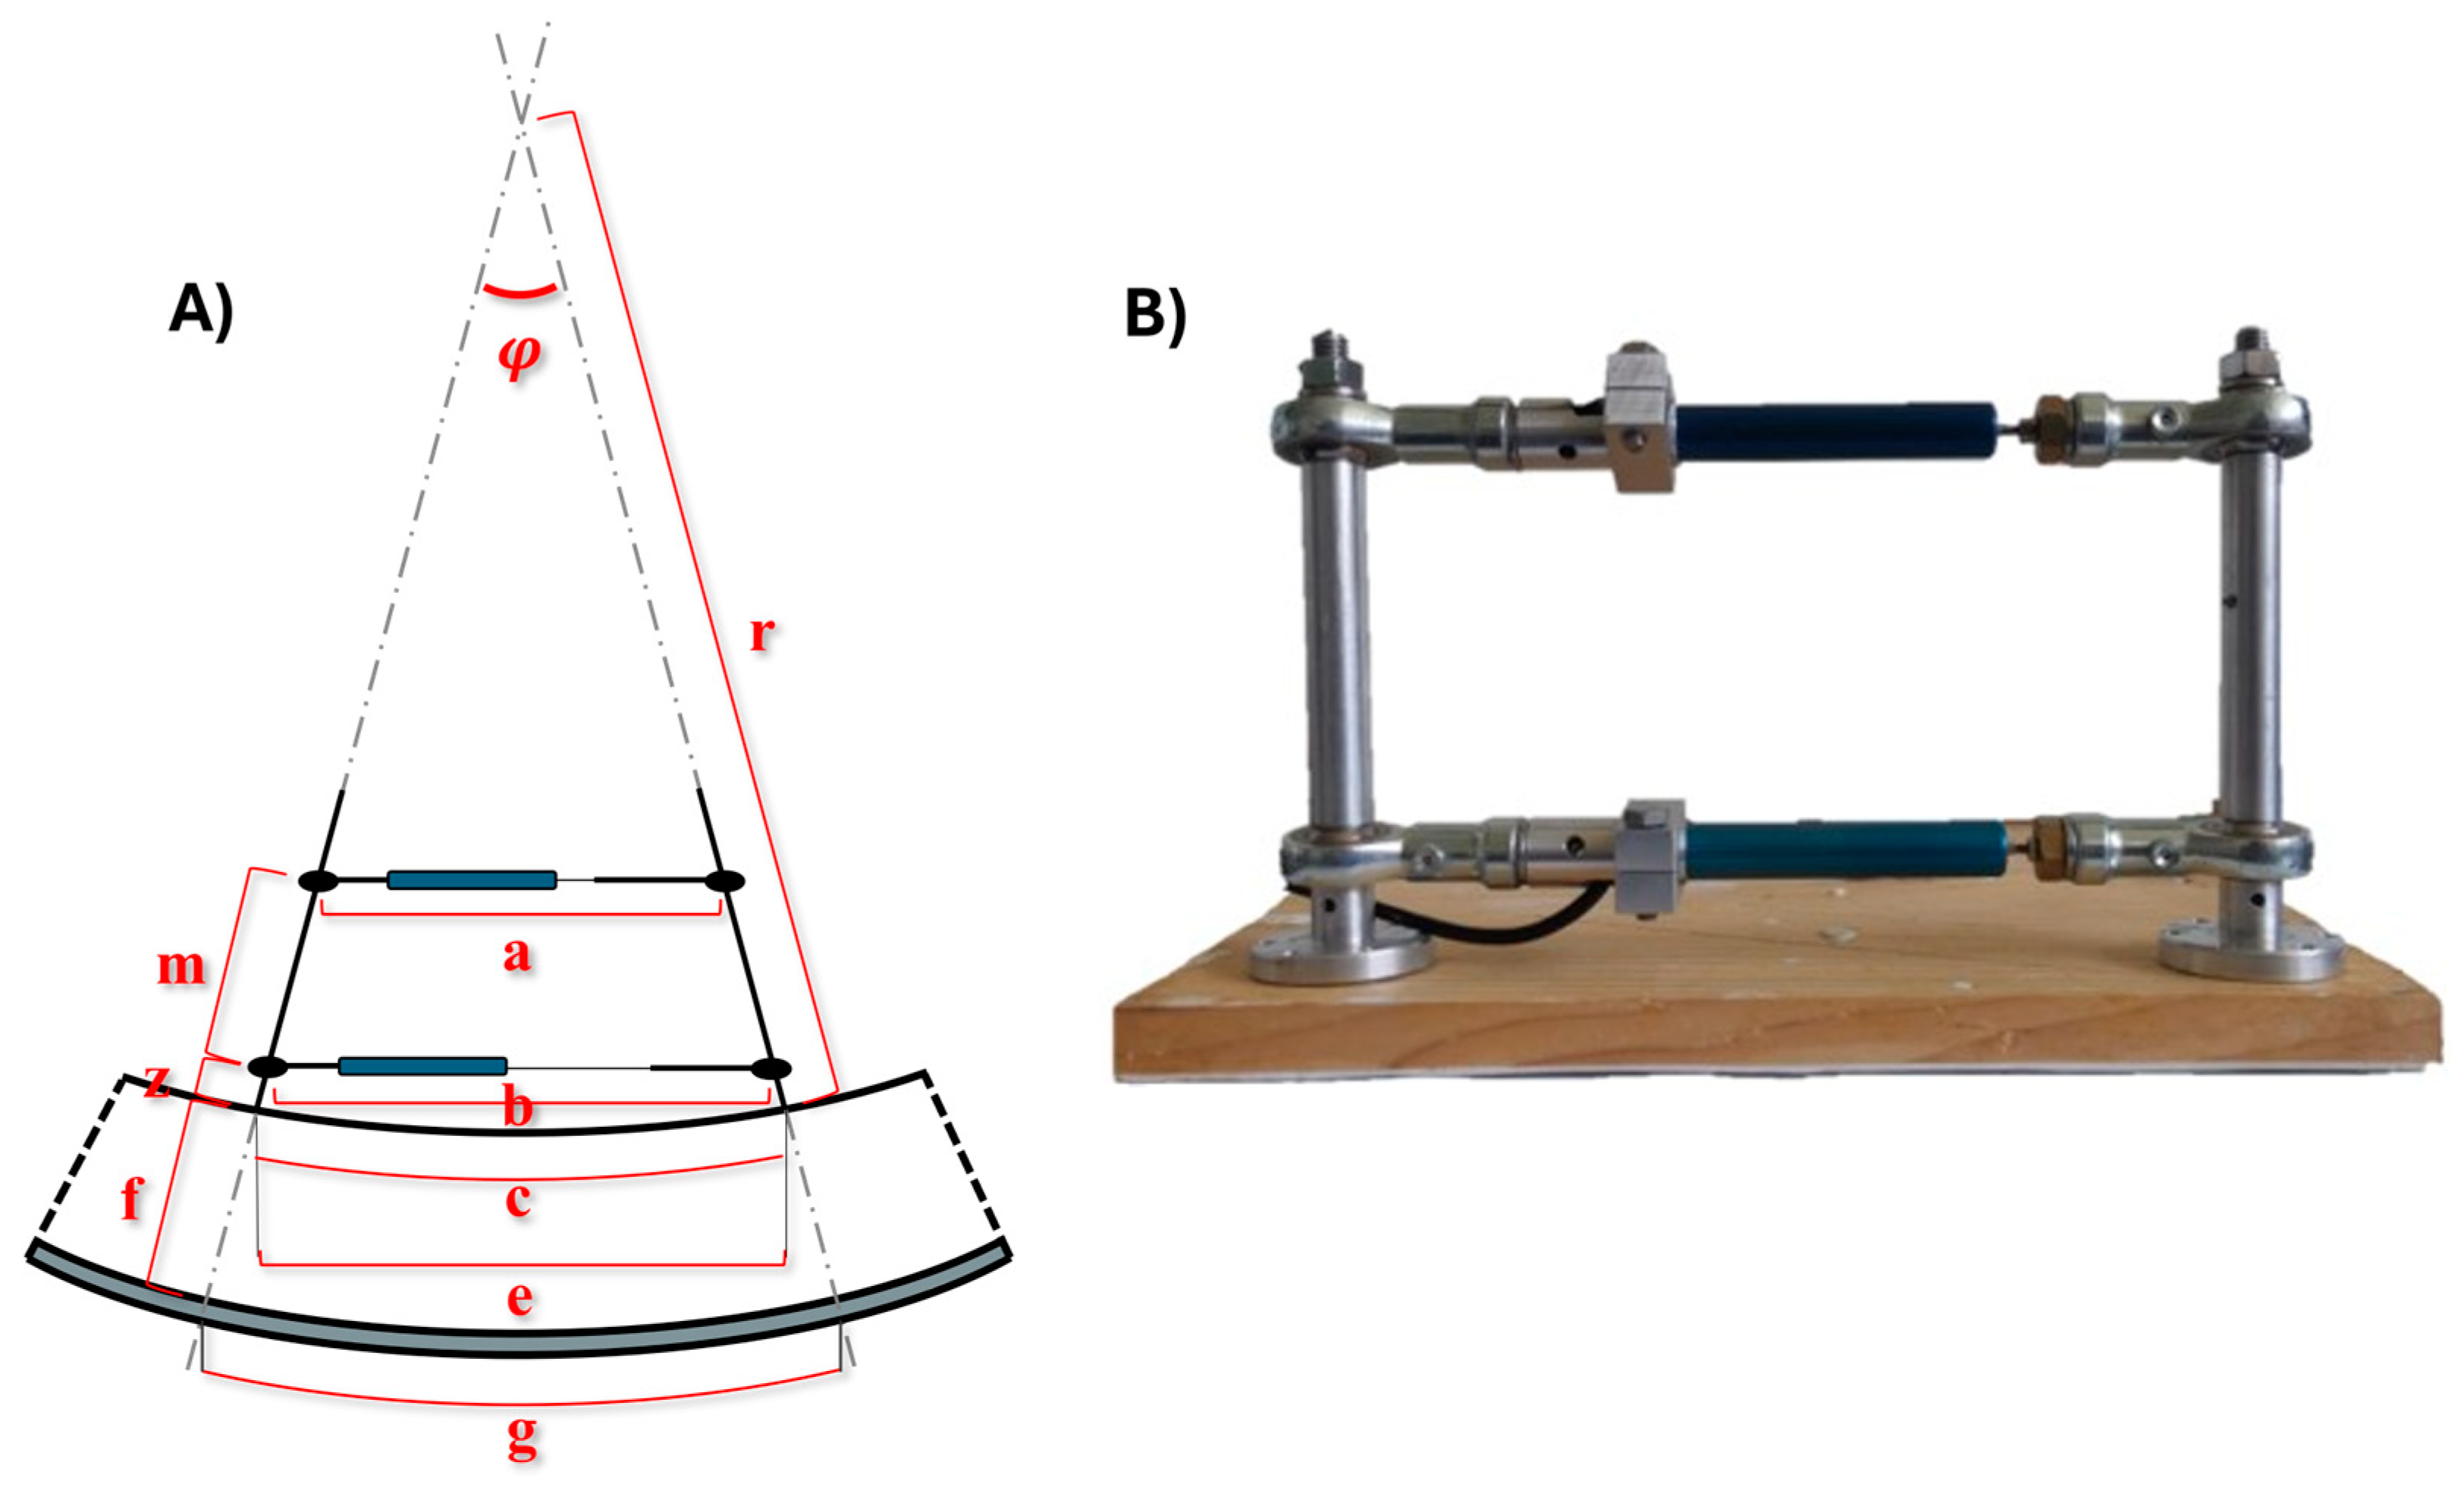
Figure 1. The five macro-categories of the deformation behavior of the WPPs revealed by the model in ref. [9]. In each graph (inspired by ref. [9], the green line indicates no deformation of the painting, while the blue line shows the deflection trend in the five categories: (1) Non-flying wood monotonic behavior; (2) Flying-wood non-monotonic behavior; (3) Non-flying wood monotonic behavior; (4) Flying-wood-type non-monotonic behavior; and (5) Flying-wood-type non-monotonic behavior.
Forests 16 00546 g001
Figure 2. Schematic representation (inspired by ref. [32]) of the position of the three potentiometric transducers installed on the aluminum housing attached to the auxiliary frame of the “Mona Lisa”, here outlined as the wooden support (b) and the painting surface (a).
Forests 16 00546 g002
Figure 3. (A) Schematic diagram (inspired by ref. [39]) of the main geometrical parameters of the DK, in which a is the distance between the axes of the two columns measured at the upper transducers (variable in time); b is the distance between the axes of the two columns measured at the lower transducers (variable in time); c is the length of the baseline, assumed to be an arc of a circle, lying on the back face of the panel and joining the axes of the two columns (variable in time); e is the distance between the axes of the two columns, where they intersect the back face of panel (variable in time); f is the thickness of the wooden panel (assumed constant); g is the length of the virtual baseline on the front face of the panel (assumed to be an arc of a circle); m is the distance between the two transducers (constant); r is the radius of curvature (variable in time); z is the distance between the back of the panel and the lower transducer; φ is the cupping angle between the axes of the two columns. (B) Image providing a clearer view of the instrument.
Forests 16 00546 g003
Figure 4. Schematic representation of an FBG, inspired by ref. [54].
Forests 16 00546 g004
Figure 5. Schematic representation of a general StereoDIC setup (inspired by ref. [65]), consisting of two digital cameras positioned at a specific stereo angle to capture images of the object from different viewpoints and a processing unit that acquires and correlates the images. The representation also includes the indication of the parameters used to calculate the minimum stereo angle required for camera positioning.
Forests 16 00546 g005
Figure 6. Schematic representation of the photogrammetric setup (inspired by ref. [78]), where the object is photographed from multiple angles by a camera, typically covering 360°, to accurately reconstruct it in three dimensions.
Forests 16 00546 g006
Figure 7. Schematic representation of the setup of structured light topography, consisting of a projector that shines a structural pattern onto the object and a camera that captures the resulting pattern from a different perspective.
Forests 16 00546 g007
Figure 8. Schematic representation of a triangulation laser scanning setup, where the laser beam is directed at a specific angle toward the object, and the camera captures the interaction point between the laser and the object.
Forests 16 00546 g008
Figure 9. Comparative overview of the main techniques used to study the support deformations of WPPs, highlighting their differences in monitoring type, cost, data processing complexity, real-time data capability, and the ability to generate 3D models. Specifically, in the ‘Costs’ and ‘Processing Data’ columns, the symbols represent the degree (low, medium, or high) of each characteristic, while in the other columns, a marker indicates the presence of a given ability.
Forests 16 00546 g009
Figure 10. A potential flowchart intended to guide conservators and scientists in identifying the most appropriate technique for analyzing support deformations in WPPs, considering the type of monitoring, the available technical skills and budget, and the possibility of direct contact with the artwork.
Forests 16 00546 g010
Table 1. Equations to calculate the cupping angle, the curvature radius, and the front baseline’s length.
Cupping curvature φ = 2 arcsin b a 2 m [radians](1)
Radius of curvature r = e z e b [mm](2)
Length of the front baseline g = φ ( r + f ) [mm](3)
Table 2. Main works involving the methods for the measurement of localized deformations.
Type of Monitored ObjectArtworkReferencesApplied TechniquesAim
Historical artwork“Lapidazione di Santo Stefano” (Giorgio Vasari)[25,26,27]Displacement transducers and DKAnalyzing seasonal behavior of the panel; confirming the effectiveness of the restoration strategies
Historical artwork“Deposizione dalla Croce” (anonymous 16th-century artist)[28,29]Displacement transducersMeasuring deformations, forces, and displacements of the panel and the elastic crossbar system
SimulacraReplica of “Medusa” shield (Caravaggio)[30]Displacement transducersMonitoring of the horizontal and vertical shape changes
Historical artworkShield (inventory no. 408)[31]Displacement transducersMonitoring of the deformation along two diameters; revealing changes in the dimensions
Historical artwork“Mona Lisa” (Leonardo da Vinci)[32,33,34,35]Displacement transducers and load cellsMonitoring of the cupping and bowing of the panel; estimation of the panel’s mechanical properties through numerical modeling
Simulacra/[36]Displacement transducers and load cellsMonitoring of cupping, swelling/shrinkage deformations, and forces; development of descriptive models of the panel’s mechanical behavior
Simulacra/[37,38]Displacement transducers and laser transducersTracking the deflection of the panel to validate the numerical model
Historical artwork“Maestà di Ognissanti” (Giotto)[41,43]DKDetection of displacements and cupping related to RH variations
Historical artwork“Madonna con Bambino e Angeli” (Daddi)[43]DKMonitoring the deformations
Historical artwork“Nativity” (Maltese Maestro Alberto)[42]DKAnalysis of the board’s deformative response to microclimatic variations
SimulacraReplicas of “Madonna in trono col Bambino e Santi” (Andrea di Giusto)[44]DKMonitoring the panel’s response to humidity change assessing the auxiliary support’s effectiveness
Historical artwork“The daughters of the Emperor Ferdinand I” (Jakob Seisenegger)[45,46]DKDetermination of the support’s deformative tendencies in response to microclimatic fluctuations
Historical artwork“Baccanale” (school of Jacob Jordaens)[47]DKMeasurement of in-plane and out-of-plane deformations
SimulacraStructural replicas of “Baccanale” school of Jacob Jordaens)[47]DKIsolation of the hygroscopic warping from the mechanical deformation
Historical artwork“La Saint Trinité couronnant la vierge” (anonymous 16th-century artist)[40,58,59]DK and mark-tracking techniqueContinuous monitoring of the curvature, deformation, stress, and strain; assessment of the impact of physical elements
Simulacra/[48]DKMeasurement of cupping to confirm the numerical model
Simulacra/[49]DK and fringe projection techniqueComparison of the experimental results with the numerical modeling’s data
Historical artworkSix different WPPs[9,14,15,50]DKLong-term monitoring of deformometric behavior under controlled humidity fluctuations; calibration of digital models; identification of the main variables responsible for a painting’s behavior
Simulacra/[54,56,57]FBG sensorsDetection and quantification of deformations during thermo-hygrometric variations; studying the impact of crossbeams
Historical artwork“Tabernacolo dei Linaioli”[57]FBG sensorsTracking strain and cupping during RH fluctuations
Table 3. Main works involving the methods for the measurement of localized deformations.
Type of Monitored ObjectArtworkReferencesApplied TechniquesAim
Historical artwork“Le Couronnement d’Epines” (16th-century anonymous painter)[69]StereoDICMeasurement of the shape and observation of different deformations (cupping and twist)
Historical artwork“Baptême du Christ” (anonymous artist)[64]StereoDICMeasurement of displacements during the restoration intervention; employment of finite numerical approach to update the structural model
Historical artwork“Jacob Wrestling with the Angel” (Bartholomeus Breenbergh)[68,70]Mark-trackingMeasurement of out-of-plane displacements and strain during structural treatment
Historical artwork“La Saint Trinité couronnant la vierge” (anonymous 16th-century artist)[40,58,59]Mark-tracking and DKContinuous monitoring of the curvature, deformation, stress and strain; assessment of the impact of physical elements
Historical artwork“Westminster Retable”[80]PhotogrammetryStudy of the panel’s deformometric behavior during environmental fluctuations
Historical artwork“Madonna che allatta il Bambino con
Angeli—Annunciazione” (Barnaba da Modena)
[81]PhotogrammetryEvaluation of qualitative and quantitative differences between the models
Historical artwork“Madonna con Bambino, e la Pentecoste” (15th-century anonymous painter)
Historical artwork18th-century Byzantine icon[82]PhotogrammetryDetection of deviations from planarity
Historical artwork“St.Constantine and Helen” and “St. Nicholas” icons[83]Macro-photogrammetryRecords of the overall deformations and macro-documentation of damaged areas
Historical artwork“Annunciazione” (Beato Angelico)[84]PhotogrammetryCapturing the painting’s deformative state
Historical artworkNocria Triptych—right panel (anonymous 15th-century artist)[78]PhotogrammetryCalculation of the panel’s thickness, quantification of the macro deviations, calculation of the curvature arrow, and evaluation of changes after restoration intervention
Historical artwork“Adorazione dei Magi” (Leonardo da Vinci)[90,91]Structured light topographyQuantitative analysis of the painting’s deformations
Historical artwork“Adorazione dei Magi” (Leonardo da Vinci)[92]Structured light topographyAnalysis of the panel’s deformation over seventeen years
Historical artwork“Lady Praying” (anonymous 16th-century artist)[93]Structured light topographyDetection of the painting’s overall shape
Historical artwork“Mystical Marriage of Saint Catherine” (Piero di Cosimo)[94]Structured light topographyAssessment of the deviations from planarity, recording of spatial deformations, and monitoring of the painting’s conservation condition
Simulacra/[49]Fringe projection technique and DKComparison of the experimental results with the numerical modeling’s data
Simulacra/[95]Structured light topographyDetection of the overall deformation by comparison of the object’s shape before and after humidity variations
Historical artwork“Dame en Prière” (anonymous artist)[99,100]Laser scanningCapture of the shape and color of the artwork—one of the first applications of a new instrument
Historical artwork“Mona Lisa” (Leonardo da Vinci)[101,102]Laser scanningDocumentation and measurement of the distorted shape of the painting
Historical artwork“Giudizio Universale”, “Martirio di S.Pietro”, and “Adorazione dei Magi” (Giorgio Vasari)[103,104]Laser scanningIdentification of significant deformation
Historical artwork“Entrance of Christ in Jerusalem” and “Lazarus Resurrection” (Jorge Alfonso)[105]Photogrammetry and laser scanningQuantification of the mechanical deformation
Historical artwork“Saint John the Baptist” (Giacomo Francia)[106]Photogrammetry and structured light topographyMeasurement of the shape of the support, assessment of deformation, monitoring of shape changes over the medium/long term period
Historical artworkCretan icon (17th century)
Historical artworkNocria Triptych—central panel (anonymous 15th-century artist)[107]Photogrammetry and structured light topographyComparison of two models, before and after the restoration intervention; documentation and quantification of the shape changes
Simulacra/[119]Moiré methodStudy the impact of cradling during thermo-hygrometric variations
Simulacra/[120]Moiré methodStudy and quantification of out-of-plane deformations
Historical artwork“Madonna col bambino, Santi ed Angeli musicanti” (school of Antonio Solario)
Historical artwork“Mona Lisa” (Leonardo da Vinci)[121]Moiré methodMeasurement of the relief of the painting in different situations; calculation of a thickness map; determination of distortion
Disclaimer/Publisher’s Note: The statements, opinions and data contained in all publications are solely those of the individual author(s) and contributor(s) and not of MDPI and/or the editor(s). MDPI and/or the editor(s) disclaim responsibility for any injury to people or property resulting from any ideas, methods, instructions or products referred to in the content.

