Abstract
We present our carbon stock estimation method developed for mixed coniferous and deciduous forests in the Hungarian hilly region, covering diverse site conditions. The method consists of four complex steps, integrating traditional field surveys with modern remote sensing and GIS. The first step involves comprehensive field data collection at systematically distributed sampling points. The second step is tree species mapping based on satellite image time series. The third step uses Airborne Laser Scanning to estimate aboveground biomass and derive the carbon stock of roots. The final step involves evaluating and spatially extending field and laboratory data on litter and humus from sampling points using geostatistical methods, followed by aggregating the results for the forest block and individual forest sub-compartments. New elements were developed and implemented into the complex methodology, such as aboveground biomass calculation with voxel aggregation and underground carbon stock spatial extension with EBK regression prediction. Additionally, we examined how the accuracy of our method, designed for a 200 m sampling grid, decreases as the distance between sampling points increases.
1. Introduction
The assessment and monitoring of carbon stock and its changes are of paramount importance for sustainable forest management and global climate change mitigation. Forest ecosystems play a crucial role in carbon sequestration, which has led to increasing attention on accurately measuring various carbon pools, such as aboveground biomass, root systems, litter, and soil. Managed and natural temperate forests in Europe can sequester 2–5 Mg of CO2 per hectare annually. Afforestation programs and sustainable forest management practices have increased carbon uptake. Fast-growing species (pine, poplar) sequester carbon more quickly, and slow-growing trees (oak, beech) store carbon for longer periods. Forest in warmer, humid climates favor higher sequestration rates than forests in cooler or arid regions. Young forest stands have high carbon uptake, mature stands have stable sequestration rates, and old-growth forests serve as long-term carbon reservoirs.
In regions characterized by diverse site conditions, such as forests of the hilly regions of Hungary, conducting efficient yet detailed analysis poses a significant challenge. Modern wall-to-wall remote sensing technologies, including multispectral satellite observations, Airborne Laser Scanning (ALS), and field measurements, provide an opportunity to estimate carbon stocks with greater accuracy and higher spatial resolution. These technologies also enable the identification of relationships between different carbon components, which can then be used to apply geostatistical methods for spatial interpolation. This study aims to present an innovative approach that not only improves carbon stock estimation but also contributes to the spatial optimization of measurement efforts.
The SoilSense Project was established to develop this methodology as part of the Climate Action Plan and was launched in 2023 with the support of the Hungarian Ministry of Agriculture. As an initial step, a model area was designated, and based on the acquired remote sensing datasets, elevation models and related analyses were derived. Additionally, relationships between topography and forest stand parameters were examined [1].
1.1. Review of Tree Species Mapping
An essential step in determining the carbon stock of a forest area is tree species mapping, as different parameters must be applied for each species. This mapping can be conducted through field surveys using sampling or full inventory methods, as well as aerial or satellite remote sensing techniques. Satellite-based tree species mapping can be performed with high accuracy using Sentinel-2 satellite time series, which offers a spatial resolution of 10 m and a temporal resolution of 5 days. Persson et al. [2] conducted tree species classification in the Swedish boreo-nemoral zone using Sentinel-2 datasets and achieved 88% accuracy with the Random Forest classification, emphasizing the importance of selecting optimal spectral bands. Axelsson et al. [3] also conducted research in the boreo-nemoral zone, applying Bayesian inference to temporal data processing. Using the highest-quality Sentinel-2 imagery, they achieved an 87% classification accuracy, demonstrating the effectiveness of probabilistic approaches in tree species mapping. Breidenbach [4] developed a nationwide tree species map for Norway using Sentinel-2 imagery and the Random Forest algorithm. Their approach achieved an accuracy of 79%. Illarionova et al. [5] utilized convolutional neural networks for the hierarchical classification of Sentinel-2 imagery, distinguishing between coniferous and deciduous trees while further refining species-level classification.
1.2. Airborne Laser Scanning
The application of ALS in forestry dates back nearly three decades ago. Early studies demonstrated that this technology could be used for forest stand modeling and the estimation of various stand parameters, such as tree height, canopy diameter, tree volume, and biomass [6,7,8]. Focusing specifically on low-density airborne LiDAR data, Magnussen and Boudewyn [9] estimated tree height and other parameters, emphasizing the potential of large-scale forest surveys.
New methods and approaches have emerged, which, according to Hyyppä et al. [10], can be categorized as follows: the generation of topographic and canopy models, feature extraction approaches (such as crown height distribution and individual tree-based techniques, combinations with aerial photographs, etc.), tree species classification and growth assessment, as well as information extraction based on intensity and waveform data.
Several approaches have been developed for generating topographic and canopy models. In the case of topographic models, examples include strip-based terrain point filtering and averaging [11], adaptive triangle mesh fitting [12,13], morphological filters (a combination of minimum and maximum filters) [14,15], and cloth simulation algorithms [16,17]. For canopy models, methods initially based on a local maximum search [18,19] were introduced, followed by inverse watershed-based techniques [20,21]. Additionally, it is important to mention adaptive k-means clustering [22], graph-based segmentation [23], layer stacking recognition [24], and voxel aggregation-based individual tree detection [1].
Tree volume estimation from low-density point clouds (typically below 20 points/m2) is performed using various models, considering the height of individual trees identified and the size of their canopies. Ullah et al. [25] examined three different models (Multiple Linear Regression, k-Nearest Neighbor, and Support Vector Machine), among which Multiple Linear Regression produced the best results. White et al. [26] applied the Random Forest method to estimate tree volume in coniferous stands. A completely different approach was introduced by Oehmcke et al. [27], who utilized deep learning systems to determine tree volume and aboveground biomass.
1.3. Aboveground Carbon Stock Estimation
The estimation of aboveground carbon stock is a crucial aspect of forest management and climate change research. In forest ecosystems, a significant portion of organic carbon is stored in tree biomass, making its accurate measurement essential.
The estimation of organic carbon stored in Hungarian forest stands has been most extensively studied in the works of Führer et al. [28,29,30,31,32,33,34,35,36]. The estimation of total biomass is based on the relationships between the size and mass of different tree components (trunks, branches, and leaves). These allometric equations allow for the determination of carbon stock based on the tree size data. For assessing the carbon stock of the entire Hungarian forest inventory, data from the National Forest Stand Database [37] were used. This database compiles measurements from a sampling method conducted every ten years on approximately 10% of forest stands in Hungary in accordance with forest management regulations. The estimation of biomass carbon content is based on an absolute dry wood density of 570 kg/m3 for sessile oak (Quercus petraea), Turkey oak (Quercus cerris), and 430 kg/m3 for conifers. The organic carbon content in biomass is assumed to be 49.4% for oak species and 49.8% for conifers [28]. According to Führer [29], the distribution of total dendromass carbon content is 57% in aboveground living trees (trunks, branches, foliage), 41% in roots and stumps, and 2% in foliage. Measurements conducted in Hungarian hornbeam–oak (Carpinus betulus–Quercus petraea) and pine forests gave the following values for aboveground biomass carbon stocks: sessile oak: 189 Mg ha−1, hornbeam–oak forests: 217 Mg ha−1, and Turkey oak: 159–197 Mg ha−1 [30,32]. The organic matter content in dendromass is correlated with site conditions, and its quantity is significantly related to the Forestry Aridity Index (FAI) [30,38].
When estimating the carbon storage of forest stands, standard forest management and planning parameters are typically used to determine the stand volume [39,40,41]. If this tree volume is multiplied by the wood density characteristic of the tree species (which ranges between 0.3 and 0.6 for European tree species) and then by the average carbon content of 0.5 [42] (converting biomass into carbon), a rough estimate of the carbon content of the standing forest stock can be obtained. This carbon stock calculation is typically based on observation plots, forest inventories, or existing growth and yield models [43].
1.4. Carbon Stock in Root Systems
More than 90% of the total root mass is located within the upper 100 cm of the soil in the forests of Hungary. The soil texture greatly influences the fine root (Ø < 2 mm) distribution. The proportion of belowground dendromass relative to the total (both aboveground and belowground) dendromass was obtained (beech forests: 17%; hornbeam–sessile oak forests: 24%; turkey oak forests: 27% [31]).
The quantification of root biomass presents challenges, and most often, it is estimated using allometric equations. These equations give the root biomass based on easily measurable tree parameters, such as the diameter at the breast height (DBH) and tree height. Muukkonen et al. [44] have developed generalized allometric equations for European tree species, including Quercus petraea, Quercus cerris, Pinus sylvestris, and Pinus nigra. These equations allow the estimation of both root biomass and organic carbon content. Typically, roots account for 20%–30% of the total tree biomass, with approximately 50% of this biomass consisting of carbon.
Only a few authors have published functions that allow for the estimation of belowground biomass, specifically for oaks [45,46] and pines [47,48,49,50]. For aboveground biomass ranging between 50 and 150 Mg ha−1, the root-to-stem biomass ratio is 0.32, with a standard error of 0.08 and a range of 0.24–0.50 [50]. In podzol soil, due to the shallow root system, the commonly reported root-to-aboveground biomass ratio of 0.24–0.26 in the literature may decrease to as low as 0.16 [48]. Research conducted on Scots pine (Pinus sylvestris) suggests that biomass functions based on DBH measurements provide a significantly more accurate root mass calculation compared to methods that estimate belowground biomass using the root-to-shoot ratio [50].
1.5. Carbon Content of Forest Litter
Forest litter is an essential component of carbon storage in forests, as it is closely linked to the amount of organic carbon stored in the soil in the form of humus. In the top 5 cm of soil, litter serves as the primary carbon source, while in deeper soil layers, plant roots become the dominant source of carbon [51].
The determination of litter carbon content has been widely documented in numerous publications and is also included in the standardized methodology of the long-term monitoring program for European forests [52,53]. The large-scale quantification of litter mass was conducted using methods commonly applied in the scientific literature. Litter samples collected from sampling sites were analyzed in the laboratory to measure their carbon content.
In Hungarian hornbeam–sessile oak forests, the litter mass in the litter layer accounts for 4% of the total biomass, while in Turkey oak forests, it constitutes 5% [30].
1.6. Soil Humus Content
The carbon stored in the soil plays a crucial role in the carbon cycle of forest ecosystems. In terrestrial ecosystems, the amount of organic carbon present as humus stabilizes within an ecosystem-specific range under the influence of key environmental factors, reaching a steady-state equilibrium when the material cycle becomes stationary. Soil carbon storage in forest ecosystems is particularly significant because a large portion of global soil carbon is found here [38,54]. The primary sources of organic carbon in the soil are aboveground dead organic matter and root biomass, which serve as the main organic inputs to the soil. The amount of carbon stored in the soil is influenced by multiple factors, including tree species composition, site conditions, forest management practices, and historical land use [55,56,57,58,59,60,61].
To estimate the organic carbon content derived from soil humus, the literature suggests using 58% of the humus content as the carbon fraction. However, for mass-based determination, a knowledge of soil bulk density is also required. When bulk density is estimated, equations incorporating soil texture properties are used for the calculation [62,63,64].
1.7. Sampling Network
A complete field survey of a given area is typically not feasible, making sampling networks an essential tool for measurement. These networks allow for sampling and measurement at selected locations, with the results interpolated spatially. Sampling networks can be either systematic (using uniform grid spacing or variable resolution based on homogeneity parameters) or random. In some cases, multi-phase sampling is employed when the spatial variability of parameters is unknown. In general, increasing the number of sampling points improves the accuracy of the estimations and vice versa [65,66,67].
This project, supported by the Hungarian Ministry of Agriculture, aims to improve the accuracy and efficiency of carbon stock estimation methods for Hungarian forests by integrating advanced remote sensing techniques. Although small-scale maps and databases (such as FAO Soil Maps and LUCAS) exist for carbon stock assessment, they are not suitable for daily and forest-compartment-level management decisions, such as species selection, forest regeneration, and silvicultural practices.
2. Materials and Methods
2.1. Project Area Description
The study area of this project is the Dudles Forest, covering approximately 1067 hectares north of Sopron, Hungary (Figure 1). Geographically, it belongs to the Fertőmellék Hills, a gently undulating, low-relief denudation–erosion landscape composed of young Tertiary sedimentary rocks such as sand, gravel, conglomerate, Leitha limestone, and loess. The climate of this area is classified as moderately cool and moderately dry. Key climatic parameters include annual mean temperature: 9.5–9.8 °C, growing season average temperature: 16.0–16.4 °C, annual precipitation: 640–660 mm, and vegetation period precipitation: approximately 390–410 mm. The potential vegetation types in this region include hornbeam–sessile oak forests and Turkey oak forests. However, due to the geological conditions, a significant proportion of the forests are edaphic forest associations. The area is predominantly characterized by the following soil types: Rendzic Leptosol (Loamic, Solimovic), Haplic Luvisol (Arenic, Cutanic), Haplic Luvisol (Loamic, Cutanic), Cambic Calcisol (Arenic), and Cambic Calcisol (Loamic) [68]. Leptosols have only a minor accumulation of humus in the shallow topsoil. In Luvisols, active decay keeps the humus content in a range of 0%–2%. In contrast, Calcisols have the strongest accumulation of humus compared to the former.
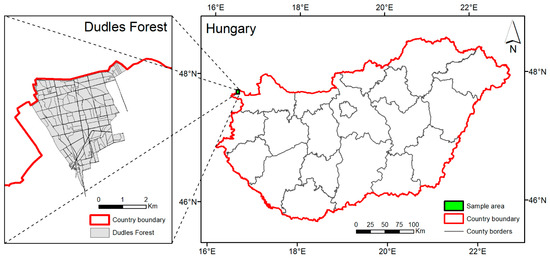
Figure 1.
Location of the Dudles Forest in Hungary.
We chose the Dudles Forest for several reasons. A total of 44% of Hungarian forests are located in hilly regions, and Dudles represents a typical area of this landscape. Therefore, it plays a significant role in domestic carbon sequestration and storage. The site has diverse soil and growth conditions. We can observe that the negative effects of climate change are resulting in the decline of pine forests and scattered deciduous trees in areas with shallower rooting depths.
2.2. Methodology Description
The developed aboveground and belowground carbon stock estimation methodology consists of several consecutive steps. It begins with a field survey, during which dendrometric measurements and sampling are conducted for litter and soil analyses, which are then processed in the laboratory. This is followed by tree species mapping based on satellite imagery, then the processing of airborne LiDAR data, including the derivation of the Digital Elevation Model (DEM), Canopy Height Model (CHM), individual tree crowns, and dendrometric parameters. In the final stage, the determination of aboveground carbon stock, the spatial interpolation of laboratory results, estimation of belowground carbon stock, and the aggregation of the obtained results take place (Figure 2).
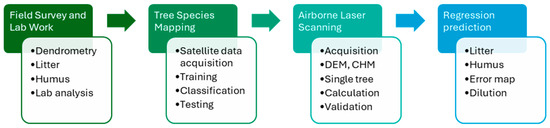
Figure 2.
Methodology for aboveground and belowground carbon stock estimation.
2.3. Field Dendrometric Survey
In the examined forest area, a total of 272 sampling points were designated and permanently marked in a 200 m grid system. Within a 12.61 m radius (500 m2) around each point, trees with a diameter greater than 8 cm were recorded. The diameter at breast height (DBH) was measured using a caliper, tree height was determined with Nikon Forestry Pro (by Nikon, Tokyo, Japan), and tree species and health status were documented. Based on the data collected from the sampling points, the mean diameter (D), mean height (H), tree density per hectare (N), basal area (G), and tree volume (V) were calculated both per species and in total. The field survey data were used for satellite-based tree species mapping, as well as for the calibration and validation of ALS data processing.
2.4. Satellite-Based Tree Species Mapping
The study area is dominated by four tree species: Turkey oak (Quercus cerris), sessile oak (Quercus petraea), Austrian pine (Pinus nigra), and Scots pine (Pinus sylvestris). Tree species mapping was performed using five Sentinel-2 (European Space Agency) satellite images, 10 m resolution spectral bands, and 20 bands in total. The satellite images were captured on 20 March, 29 May, 8 June, 10 July, and 24 August, 2024. From the field sampling points, 81 homogenous sites in terms of tree species composition were selected, with 40 used for training and 41 for testing. The classification was achieved by the QGIS Semi-Automatic Classification Plugin (v8.5.0) and a Random Forest classifier (parameters: trees = 320, split = 10). An accuracy assessment was performed using a confusion matrix based on 41 test areas. The resulting tree species map served as an input for the ALS processing software, which uses tree species information to select an appropriate crown radius–stem diameter and tree volume estimation parameters.
2.5. Airborne Laser Scanning and Processing
The ALS was conducted by Envirosense Ltd. (registered in Debrecen, Hungary) using a Riegl V780II sensor (manufactured by RIEGL Laser Measurement System GmbH, Horn, Austria) from a light aircraft during leaf-off conditions. The average point density was 20 points/m2. For data processing, the latest version of TreeDetect (v1.25.01.12) software (developed by TopoLynx Ltd., registered in Kőszeg, Hungary) was used, which was supplemented aboveground and root carbon stock calculations. The first author of this paper is the developer of the TreeDetect software. A general description of the software is provided in [69]; however, this section focuses on the crown reconstruction and DBH calculation methods.
After determining the elevation and canopy surfaces, the TreeDetect software calculates the occupied voxels within the specified stem and crown the height range as user-defined parameters. These voxels are then vertically aggregated and smoothed using a quartic filter. This process enhances the identification of both tree stems and broadleaf crowns, as it maps the 3D structure of the canopy rather than simply detecting the canopy peaks (Figure 3). On the aggregated and smoothed voxel surface, the software searches for local maxima and merges nearby maxima. The merging distance is a function of a predefined parameter and heights of the maximum points. For larger trees, stem voxel aggregation aids in the single-tree detection process. The program constructs the tree crown polygon iteratively from the highest voxel points downward, continuing the process until there are no more connected unclassified voxels. The crown radius is then determined based on the crown polygon area, and from this, species-specific regression functions are applied to estimate the diameter at breast height (DBH).
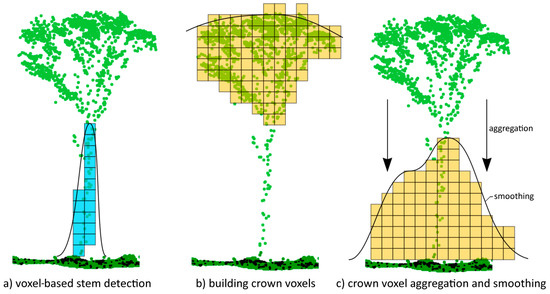
Figure 3.
Explanation of stem and crown detection using voxel aggregation in side view.
The regression relationships were derived from the Hungarian yield tables [70] for the dominant tree species based on stem number and mean diameter data pairs. These strong quadratic relationships (R2 > 0.99) depend on tree species but are independent of yield class (Figure 4). Since the yield table data are smoothed, represent national averages, and apply to a 100% stand density, the relationships need to be scaled based on field data to account for site-specific variations. The crown radius (r) can be calculated from the stem number (N) using the following formula:
where N is the tree counts per hectare and d is the density (tree counts in the sampling point divided by the tree counts in the yield tables).
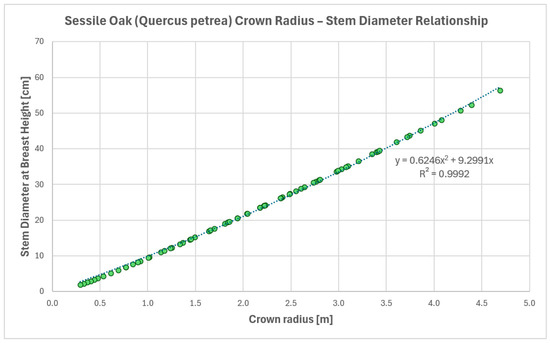
Figure 4.
Relationship between crown radius and diameter at breast height for sessile oak.
After processing the field survey data and the TreeDetect software results, the most suitable parameters were found to be a 4–40 m crown zone, a 3.5 m merging distance, and a density parameter of 0.98. The 6 GB LAS-format point cloud, covering the 1067-hectare study area, was processed by the software on a notebook with an i5 CPU and 16 MB RAM in 4.5 min.
The results included more than 700,000 individual tree positions, crown polygons in vector layers, and raster layers with 0.5 m spatial resolution for the Digital Elevation Model (DEM), Canopy Height Model (CHM), and aggregated voxels. The vector layers store attributes for each tree, including the crown radius, DBH, height, basal area, volume, aboveground and belowground carbon stock, and species classification.
After processing, the aggregated data for the sampling points were compared with the National Forest Stand Database and field dendrometric survey data to assess the accuracy of the ALS-based volume estimation.
2.6. Estimation of Organic Carbon Content in Aboveground Biomass
The estimation of aboveground biomass was based on the total estimated carbon stock of the forest stands. In terms of aboveground biomass, the amount of organic carbon accumulating in the wood biomass is the most significant component, accounting for approximately 80% of the total aboveground biomass [71]. Since the wood density varies among tree species, the amount of incorporated organic carbon also differs. Therefore, literature-based average values were used for each species. For calculations, the following absolute dry wood densities were applied:
- Quercus petraea: 642 kg/m3 (±30) [72,73,74,75,76,77,78];
- Quercus cerris: 640 kg/m3 (±31) [79,80,81];
- Pinus sylvestris: 431 kg/m3 (±87) [82,83,84,85];
- Pinus nigra: 578 kg/m3 (±62) [86,87,88,89,90,91,92,93,94].
The carbon content of aboveground biomass was also derived from data in the literature, considering that the organic carbon content of wood material is approximately 50%. Thus, for Quercus petraea and Quercus cerris, a carbon content of 48.4% was used [95,96], while for Pinus sylvestris and Pinus nigra, 49.7% was applied [97,98].
The amount of aboveground biomass was calculated using the following method:
where
- AGBc: organic carbon content of aboveground biomass [Mg ha−1];
- AGB: the amount of aboveground biomass [Mg ha−1];
- WD: average wood density of tree species [t/m3];
- C%: average organic carbon content of aboveground biomass.
2.7. Determination of Litter Quantity in Characteristic Stands at Sampling Points
The litter quantity was measured for all 272 sampling points. At each designated grid center, as well as 10 m north and south, a 30 cm × 30 cm metal frame was placed on the ground, and the biomass within this 900 cm2 area was collected. The collected samples included the OL (litter horizon), OF (fermentation horizon), and OH (humus horizon) layers. Sampling took place in the summer of 2024 before the leaves fell.
In the laboratory, the samples were dried at 105 °C and weighed to determine their absolute dry mass. To analyze organic carbon content, we created composite samples by averaging every second sample in each row and column, and the organic carbon (C) content was measured using a varioMAX CNS analyser (Elementar Analysensysteme GmbH, Langenselbold, Germany).
To calculate the organic carbon stock of the litter, the measured litter quantity was scaled up to 1 hectare. The total litter biomass per hectare was then multiplied by the carbon percentage determined from laboratory measurements of samples collected at points representing the dominant tree species in the stand. This provided the organic carbon content derived from litter (Mg ha−1) for each sampling point, specific to the dominant tree species in that area.
2.8. Determination of Soil Organic Carbon Content
Soil profiles were excavated at all sampling points. Their profiles were described according to the Hungarian forestry protocol [99] and sampled by horizons down to either the solid bedrock or a depth of 200 cm. Soil types were classified according to the WRB reference groups [100]. Sampling was performed in all cases on soil horizons or layers thinner than 50 cm, and the soil type was identified for each profile.
A subset of 19 soil profiles was selected for detailed laboratory analyses, ensuring the representation of the full spectrum of soil types present in the study area. For these samples, the organic carbon content was determined following the MSZ 21470-52:1983 Hungarian standard [101] (reagents: potassium dichromate sulfuric acid and photometric detection at 590 nm). The pH (H2O) value was measured electrometrically in a 1:2.5 mass ratio suspension, while the soil texture composition was analyzed using the sedimentation method, classifying it into seven fractions (2–0.2 mm; 0.2–0.05 mm; 0.05–0.02 mm; 0.02–0.01 mm; 0.01–0.005 mm; 0.005–0.002 mm; and <0.002 mm).
The laboratory measurement results were used to determine the carbon content of the soil profiles based on the thickness, bulk density, and the organic carbon content of each horizon. The bulk densities of the soil originated from data in the literature [102,103]. For each soil profile, it was assumed that the bulk density and humus content would be consistent within the same soil type. The humus content for each horizon was categorized based on the soil texture and moist soil color estimation [102].
Overall, the total organic carbon content in the humus for each sampling point was estimated with the assumption that soil classified under the same soil type could share the same bulk density and humus content per horizon. In the near future, additional laboratory analyses will be conducted to improve estimation accuracy and refine the results. However, for large-scale organic carbon estimation, the current methodology, within the defined constraints, is considered acceptable.
2.9. Estimation of Carbon Content in Belowground Woody Roots
The quantitative measurement of belowground woody root biomass is highly challenging, requiring significant time and cost, which is why most scientific literature relies on estimation models using various functions. According to data from the literature, root mass is primarily influenced by tree species, tree age, and site conditions. Most studies proportionally relate root biomass to aboveground tree biomass. For the estimation of root biomass, we used literature values specific to Hungary and the dominant tree species in the study area. Based on regional references, the root-to-shoot biomass ratio ranges from 0.25 to 0.35, with a mean value of 0.30 [104]. This means that belowground root biomass is assumed to be 30% of aboveground tree biomass.
2.10. Calculation and Interpolation of Belowground Carbon Stock
To determine the final analytical approach, we first aimed to identify fundamental relationships between the soil type, soil depth, carbon stock stored in soil and litter, the available water capacity in the rooting layer (usable water for plants), and tree productivity (as a factor directly related to aboveground carbon stock) (Figure 5).
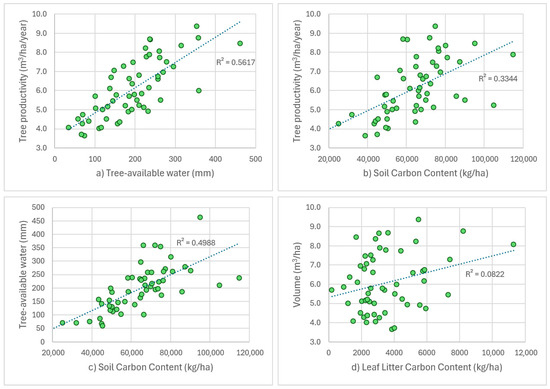
Figure 5.
Correlation analysis of characteristics of Haplic Luvisol (Arenic, Cutanic).
The tree species found in our study area, which has a semi-arid climate, are widely distributed across Europe and play a significant economic role. Their growth is limited by increasing drought periods, though this constraint is also influenced by additional site factors, as described above [105].
Accordingly, we found a moderate direct correlation between the potential water capacity of the rooting layer and tree productivity in certain soil types. In the case of Cutanic Luvisol Arenic, which has a poor water retention capacity and a sandy texture, water availability alone is likely a limiting factor for tree growth. However, in the Cutanic Luvisol Loamic, which has a loamy texture and higher water retention capacity, no such direct relationship was observed.
While tree productivity, which describes the amount of woody biomass produced over time, is a key factor in carbon input to forest soils, long-term soil carbon stock is shaped by decomposition, humus formation, and storage processes that depend on numerous other factors. As a result, soil carbon stock does not exhibit a direct and easily definable relationship with tree productivity, even though a weak correlation was observed in some soil types between soil carbon stock and potential water capacity.
Similarly, no direct correlation was expected between tree productivity and the momentary litter quantity, which fluctuates significantly over time. However, some logical patterns were identified regarding litter accumulation, particularly in relation to topographic conditions, prevailing wind direction, and stand age. The dominant northwest wind and the west-to-east slope gradient corresponded to increasing litter accumulation in the same direction. This pattern was only partially overridden by differences in litter decomposition rates, where needle-leaved stands exhibited slower litter decomposition rates and higher accumulation, whereas broadleaf stands showed faster decomposition rates.
Based on the preliminary findings, we applied spatial interpolation and geostatistical methods to interpolate the values determined at the sampling points. The tested methods included Inverse Distance Weighting (IDW), Radial Basis Function (RBF), Kriging, and Empirical Bayesian Kriging (EBK). Among these, EBK produced the best results, as it allows for partitioning the sampling points into subsets, and within each subset (Figure 6), the procedure selects the most suitable semivariogram through a series of simulations.
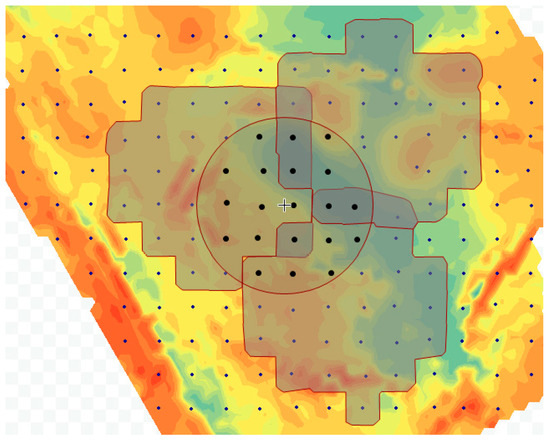
Figure 6.
Example of EBK subsets and assigned points for a central location.
EBK also has a regression prediction variant, which considers additional explanatory raster layers that are expected to correlate with the interpolated values. The final estimations of litter and soil carbon stock maps were generated using this geostatistical method with the following parameters: cumulative variance: 95%, subset size: 50, semivariogram model: exponential, number of simulations: 100, neighborhood size: 25–50, and radius: 1500 m. For the explanatory raster layers, we used elevation, slope, and the Topographic Position Index (TPI) with a radius of 100 m. The method also generated standard error maps, and the interpolated data were compared with measured carbon stock values in humus and litter at the sampling points.
3. Results and Discussion
3.1. Tree Species Mapping
Using Sentinel-2 multispectral satellite images and Random Forest classification, we achieved an 88.9% overall accuracy in distinguishing between the four dominant tree species. This result is comparable to or exceeds the accuracy reported in the cited literature. The classification results and confusion matrix are shown in Figure 7. The species distribution map indicates that the classified tree species closely follows forest compartment boundaries. However, due to their similar spectral properties, sessile oak and Turkey oak exhibit some misclassification, as reflected in the confusion matrix. The early spring satellite imagery significantly aided in the separation of coniferous species. The classification results were subsequently used in airborne LiDAR data processing to refine the estimation of tree structural parameters.
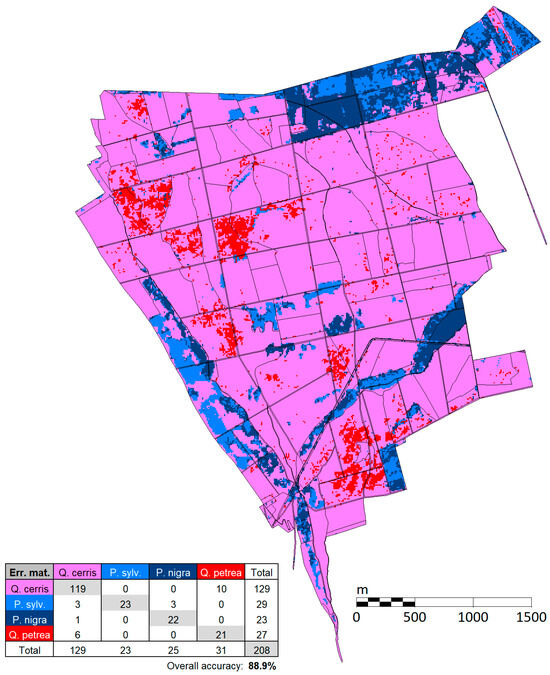
Figure 7.
Results of satellite-based tree species classification and the confusion matrix.
According to the satellite-based tree species classification, the forest stands reflect site conditions, with clear patterns emerging. On the western side of this area, Scots pine (Pinus sylvestris) and Austrian pine (Pinus nigra) plantations were located on a southwest, west-facing hillside with a 15–20° slope characterized by dry conditions. The soil types in this region have developed accordingly. The Calcisols formed on calcareous, loess-rich sand have a high carbonate content, further intensifying drought stress. Consequently, drought-tolerant species with lower water requirements, such as Austrian pine and Scots pine, were planted in these dry soil patches.
In the northern part of the area, compacted conglomerate lies close to the surface, covered by loess-rich sand, resulting in a shallow rooting layer of only 20–30 cm. This has also led to the formation of poor water-holding capacity soil patches, where Scots pine and Austrian pine are similarly established due to their drought tolerance.
The distribution patterns of sessile oak (Quercus petraea) and Turkey oak (Quercus cerris) primarily reflect historical forest management practices. Historical records [106] indicate that hornbeam–sessile oak forests dominated the landscape for centuries due to climatic conditions. However, intensive forest use, particularly the harvesting of valuable sessile oak, has facilitated the spread of Turkey oak. With climate change, the expected shifts in environmental conditions are increasingly aligning with the ecological optimum of Turkey oak, suggesting that Turkey oak may become even more dominant in the future [107].
3.2. Volume Estimation
A comparison between the National Forest Stand Database and the ALS-derived volume estimates at the sampling points resulted in an average absolute deviation of 16.1% (Figure 8). Sampling points where forest utilization occurred in the meantime were excluded from the analysis. The forest stand database is typically derived using mean tree or angle-count sampling methods, which contributes to greater discrepancies between the paired data points (R2 = 0.661).
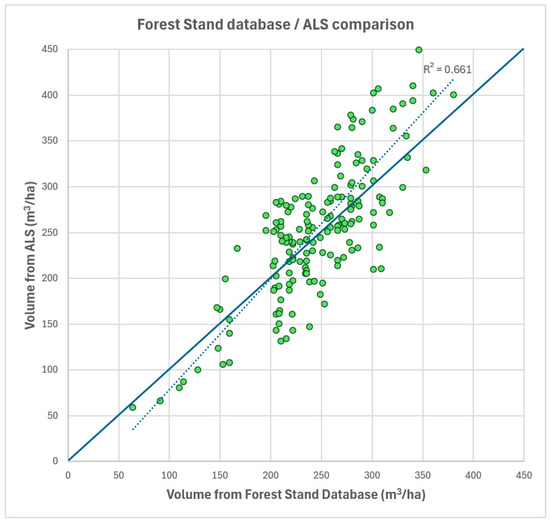
Figure 8.
Comparison of per-hectare tree volume between the National Forest Stand Database and ALS at sampling points.
Based on Figure 8, it is evident that compared to the National Forest Stand Database, ALS tends to estimate higher tree volumes above approximately 220 m3/ha. This discrepancy increases with stand age and the corresponding increase in tree biomass. These results suggest that the actual tree volume in Hungarian forests may be larger than the officially recorded data in the National Forest Stand Database, which is a finding supported by other comparative studies [108].
We also compared field-based individual tree dendrometric measurements with ALS-derived estimates at the sampling points (Figure 9). The average absolute deviation between these datasets was 10.3%, indicating a closer correlation than the comparison with the National Forest Stand Database (R2 = 0.883). The accuracy of the volume estimation exceeded the results reported in the cited literature [25,26,27].
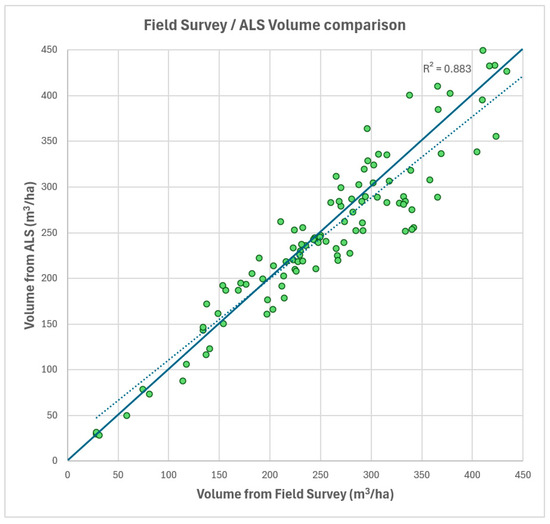
Figure 9.
Comparison of per-hectare tree volume between field measurements and ALS at sampling points.
Figure 9 illustrates that for sampling points exceeding approximately 220 m3/ha, the field survey tends to be lower than ALS-derived estimates. This suggests that in older stands with higher biomass, ALS-based volume estimations may slightly overestimate tree volume.
3.3. Aboveground Carbon Stock Calculation
The ALS processing software generates crown polygons and computes aboveground and root carbon stock as descriptive attributes. These results can be visualized in a GIS software as a thematic individual tree map (Figure 10). The geodatabase stores data for 700,000 single trees, allowing for detailed queries into each tree’s attributes, including carbon stock estimations at both aboveground and root levels.
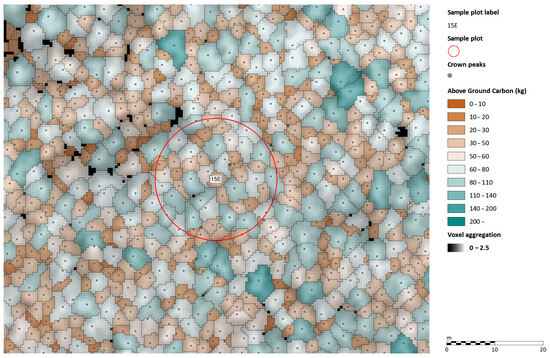
Figure 10.
Detail of a single-tree-based aboveground carbon stock map with a sampling point in the center.
The individual tree data can also be spatially aggregated at the forest sub-compartment level. By dividing the total carbon stock by the area of the sub-compartment and multiplying by 1000, the carbon values can be converted from kilograms to megagrams per hectare (Mg ha−1 C). These results can also be visualized and analyzed in GIS software as thematic maps (Figure 11).
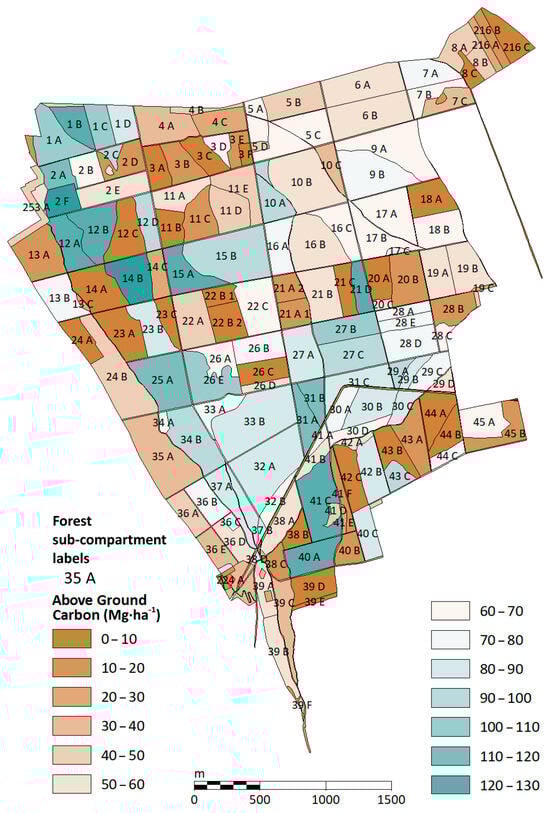
Figure 11.
Aboveground carbon stock aggregated to forest sub-compartments.
Figure 11 illustrates the estimated organic carbon content stored in aboveground biomass, displayed at the forest sub-compartment level. The mosaic pattern of carbon stock clearly reflects forest management practices, which are regulated by the Hungarian Forest Act. The presence of adjacent forest compartments with 0–10 Mg ha−1 of organic carbon next to areas containing 50–80 Mg ha−1 highlights the effect of strip shelterwood cutting, which is visible in the central east–west belt of the map. Additionally, the spatial distribution of carbon stock reveals the regulatory limitations on clear-cutting, which prohibit continuous clear-cut areas exceeding three hectares. Furthermore, the restriction that successive clear-cut areas may only connect at corner points during the regeneration period is also reflected in the mapped carbon stock distribution.
3.4. Belowground Carbon Stock Estimation
After determining the aboveground carbon stock, the next step was to estimate the belowground carbon stock, which consists of three components: roots, litter, and humus. Among these, root biomass was derived from aboveground biomass estimates, while the carbon content in litter and humus was determined from field sampling points. The carbon stock in litter and humus, measured at sampling points, was spatially interpolated using geostatistical methods, specifically Empirical Bayesian Kriging (EBK) regression prediction (Figure 12).
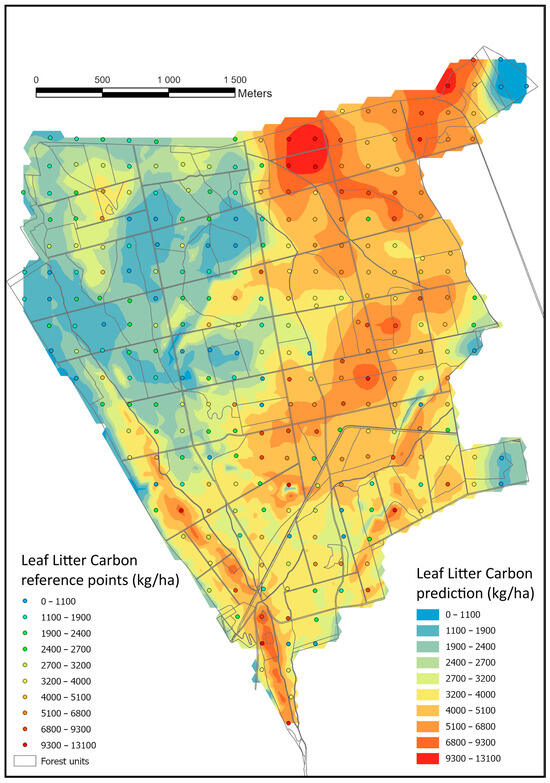
Figure 12.
Sampling points and regression estimation of litter carbon content (kg/ha).
The average carbon content stored in litter per hectare varied by tree species, with higher values observed in coniferous stands, as expected. However, due to the high standard deviations, these differences were not statistically significant (Scots pine: 6.44 ± 3.23 kg/ha; Austrian pine: 6.03 ± 3.46 kg/ha; sessile oak: 3.96 ± 2.39 kg/ha; Turkey oak: 3.24 ± 1.83 kg/ha). In a European comparison [109], the litter carbon stock values determined in this study were well below the European average (22.1 Mg ha−1) and even below the European median (13.8 Mg ha−1). However, considering the fact that litter layers in broadleaf stands primarily consist of only the OL horizon, while coniferous stands also include some OF and OH layers, the litter decomposition is dominated by mull and moder humus types. When compared to European reference values for these humus types (8.0 Mg ha−1 for mull and 19.1 Mg ha−1 for moder humus), the deviation is much smaller. Higher litter accumulation was observed along the dry ridge in the southwestern part of the area and in the northeastern sections under coniferous stands, which aligns with our expectations. The model successfully captured these spatial patterns, accurately reflecting variations in litter carbon stock distribution.
Based on Figure 12, the spatial distribution of litter does not directly correlate with tree biomass. The most striking feature is that the northwestern forest compartments contain the lowest amounts of litter, with less than 1000 kg/ha. This can be attributed to two main factors: many young forest regeneration areas are located in this region, leading to naturally lower litter accumulation, and the prevailing northwestern wind likely transports part of the litter southeastward, redistributing organic material across the landscape. In contrast, sampling points where litter carbon content exceeds 9000 kg C/ha correspond primarily to Scots pine and Austrian pine stands. Under these drier site conditions, organic matter decomposition is slower, resulting in a greater accumulation of organic material. Instead of mull humus formation, the dominant processes in these areas tend to be moder and raw peat humus development, reflecting the slower breakdown of organic matter.
The next step in estimating belowground carbon stock involved the spatial interpolation of the soil carbon content, calculated from the sampling points to the entire study area. This was also performed using the Empirical Bayesian Kriging (EBK) regression prediction method (Figure 13).
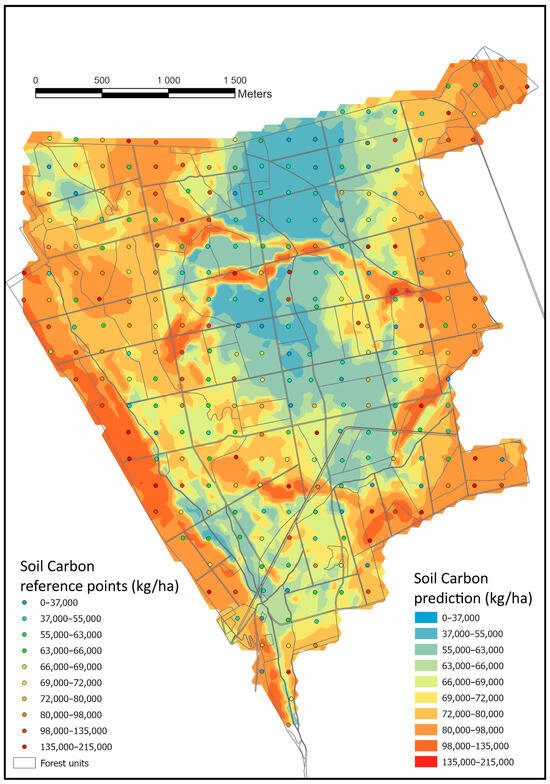
Figure 13.
Sampling points and regression estimation of soil carbon content at 0–200 cm Depth.
Compared to the European average soil carbon stock of 108 Mg ha−1 [109], most of the study area exhibited lower values. Significant differences in soil humus carbon stock were observed between the coniferous and broadleaf stands. However, due to the high standard deviations, no clear trend could be established between the dominant tree species and carbon storage in soil humus (Scots pine: 60.14 ± 36.96 kg/ha; Austrian pine: 82.83 ± 41.69 kg/ha; sessile oak: 80.82 ± 38.04 kg/ha; Turkey oak: 73.62 ± 39.46 kg/ha). The high variance in both litter and carbon stock in the soil is not surprising, as previous large-scale analyses have reported similar findings [52].
The spatial distribution of organic carbon stored in the soil does not align with the litter carbon pattern nor with the aboveground biomass carbon stock. Instead, soil formation processes and humus accumulation play a dominant role in shaping the distribution of soil carbon stock. On the western side of the area, relative soil dryness, caused by higher energy input, led to the formation of a mollic horizon approximately 40 cm thick in the topsoil. Conversely, linear accumulations of organic carbon exceeding 80,000–100,000 kg/ha are found in gullies and erosion-affected areas, likely due to the deposition of humus-rich soil transported by erosion. The eastern part of the study area is adjacent to agricultural lands, where mollic horizons have also developed. Consequently, these soils exhibit significantly higher organic carbon stocks than the Ah and E horizons of Luvisols [110].
A key output of the Empirical Bayesian Kriging (EBK) regression estimation is the standard error maps, which display both the magnitude of estimation errors and their spatial distribution (Figure 14).
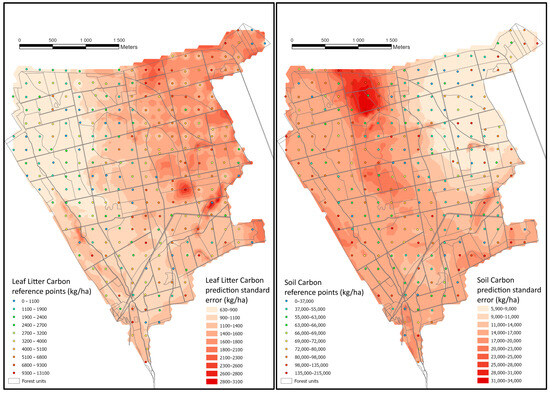
Figure 14.
Standard errors of litter (left) and soil (right) carbon content estimation.
Neither the litter nor the soil carbon stock shows unexpected variability. The standard error maps reflect the combined effects of measurement method uncertainties, laboratory processing variability, and the natural heterogeneity of site conditions around individual sampling points. Previous comprehensive analyses have also highlighted the inherent variability in different forest carbon stock components [52]. A South Korean study found that soil and litter carbon stocks increase with forest age, highlighting the importance of soil carbon for ecosystem resilience [111]. Similarly, Northwestern Russian research confirmed a strong correlation between forest vegetation composition and soil carbon stock, influencing the long-term stability of ecosystems [112].
In Figure 14 (left), the EBK regression estimation error for litter carbon content is shown alongside the measured litter-C values at the sampling points. The smallest estimation errors were observed in the northwestern part of the study area, where most forest regeneration sites are located. In these stands, litter quantity ranges between 0 and 66,000 kg/ha, whereas in older stands, values reach 98,000–215,000 kg/ha. In mature stands aged 80–100 years, forest management activities—such as shrub clearance before shelterwood cutting or the impact of higher densities of wild ungulates—lead to heterogeneous litter distribution, even within structurally homogeneous stands. Future studies should further examine the effects of forest management practices [113,114,115] and wild ungulate populations [116,117] on litter accumulation and decomposition rates. These factors may contribute to higher estimation errors in older stands, where carbon stock variability is naturally greater.
The EBK regression estimation error for soil organic carbon content was highest in forest compartments, whereas the EBK error for litter carbon content was the lowest, particularly in the northeastern part of the study area. While the estimation error for litter carbon reached 20%–30%, the error for the soil carbon content was generally around 10%. This pattern is likely influenced by the fact that shallow-rooted soil in the northeastern forest blocks predominantly supports Scots pine (Pinus sylvestris) and Austrian pine (Pinus nigra) stands. Due to drier soil conditions, organic matter accumulates as raw peat, with slower mineralization and humification rates. Additionally, the topsoil texture in these northeastern forest compartments is predominantly sandy, which is a characteristic that limits humus formation and reduces the formation of organo-mineral complexes [118,119]. As a result, the variability in humus content among sampling points is lower since the absolute amount of humus is smaller, leading to lower estimation errors in soil carbon compared to litter carbon.
Compared to our results related to the EBK method, similar findings were observed in the Western Netherlands, where large-scale groundwater quality data were spatially interpolated using the EBK method. This approach enables a reduction in sampling density while maintaining high accuracy, which further enhances cost efficiency in large-area assessments [120]. A similar conclusion was drawn in South Africa, where EBK was applied to compare annual precipitation and daytime surface temperature data from satellite observations [121], demonstrating the broad applicability of this method across various environmental studies.
3.5. Dilution of Precision
An important aspect of our study was determining the optimal density of the field sampling grid, considering the heterogeneous hilly terrain of Hungarian forest sites. We aimed to assess the sampling density required for accurate data collection and to evaluate how estimation accuracy is affected at different spatial resolutions. To analyze this, we compared the carbon stock estimations at different sampling grid sizes in relation to the 200 m reference grid. Grid sizes of 400, 600, 800, and 1000 m were tested, and examined the decline in accuracy with increased spacing. In the 200 m grid, 272 sampling points were established. The 400 m grid contained 69 points, the 600 m grid had 31 points, the 800 m grid had 18 points, and the 1000 m grid was reduced to only 12 sampling points. For each grid size, we compared three parameters: aboveground biomass carbon stock, humus carbon stock, and litter carbon stock. The coarser grids were created using multiple configurations, and the relative deviations in parameter estimates were averaged to assess the impact of reduced sampling density (Figure 15).
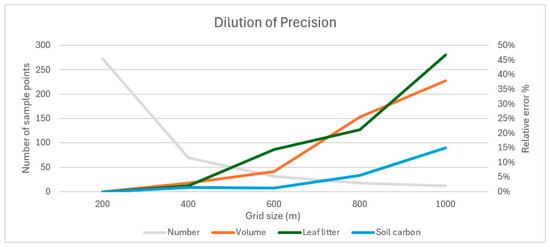
Figure 15.
Dilution of precision relative to the 200 m grid as grid size increases.
As shown in Figure 15, as the grid size increases, the number of sampling points decreases exponentially, leading to an exponential increase in estimation inaccuracy relative to the 200 m reference grid. The averaged results indicate that soil carbon stock estimation is less affected by a reduced sampling density, while tree volume and litter carbon estimates show greater accuracy loss. These findings suggest that different grid densities may be optimal for different carbon stock parameters, and a variable grid approach could improve accuracy when estimating multiple carbon components.
3.6. Comparision with Existing Soil Maps and Databases
We examined several soil maps and soil databases. First, we examined the Soil Atlas of Europe, which is based on the 1 × 1 km European Soil Information System (EUSIS) and the European Soil Database v2 [122]. From this database, 10 points fell within the studied Dudles Forest. The Soil Atlas of Europe classifies the area into a single category: Leptosol. The Global Soil Information System (GLOSIS), and within it, the Global Soil Organic Carbon Map (GSOCM), was developed by the Food and Agriculture Organization (FAO) using country-level databases. The resolution is 1 × 1 km, and the data applies to the top 30 cm of soil. In Hungary, this means that the interpolation was performed based on 1236 points from the Hungarian Soil Information and Monitoring System (TIM) [123,124].
The Harmonized World Soil Database v2.0 is based on the European Soil Database (ESDB). The FAO/UNESCO Soil Map of the World provides a standardized representation of the world’s major soil types at a 1:5,000,000 scale, classifying soils based on their morphology, genesis, and geographic distribution. The DoSoReMi database, operated by the Hungarian Institute of Soil Science, interpolates the TIM points [123] and other sources (such as DEM, land cover, and climatic data) using the regression Kriging method. A LUCAS project is a survey framework used for land use and land cover estimation and can detect soil degradation processes. The sampling method focuses mainly on topsoil (0–20 cm) with an emphasis on agricultural land, making it less suitable for characterizing forest soils. Currently, two LUCAS points are located within Dudles Forest, but neither of these points contains recorded topsoil data.
Compared to the examined databases, the method and results we developed represent a significant advancement in soil organic carbon mapping. Our approach used a 1 m resolution ALS elevation model, and the thematic layers derived from it were used for the spatial interpolation of 200 × 200 m field sampling data, applying EBK regression estimation. This resulted in a database and maps with unprecedented detail, producing a precise spatial pattern. The sampling considered soil data at depths ranging from 0 to 200 cm. In addition to the soil organic carbon content, the results also included estimations of the aboveground biomass, litter, and root carbon stocks. This detailed approach can contribute to the SoilSense project’s objective of supporting forest management decisions at the forest sub-compartment level, especially in the context of climate change.
4. Conclusions
Based on the developed methodology, we are convinced that wall-to-wall satellite-based tree species mapping, combined with airborne LiDAR scanning and 3D crown recognition algorithms, is highly effective for aboveground carbon stock estimation, especially when supported by field-based dendrometric surveys.
To continue the research, we have formulated the following research questions. How can field data collection be accelerated and improved in terms of both dendrometric measurements and soil analysis? To what extent can the number of sampling points be reduced while maintaining accuracy? Is non-systematic sampling more effective than systematic sampling?
The use of terrestrial laser scanning (TLS) has the potential to accelerate or even replace traditional field surveys, and species identification may be feasible from trunk photographs and TLS depth maps.
The flexibility of this methodology—field data collection, remote sensing, and airborne LiDAR scanning—makes it highly adaptable to various ecosystems, particularly in heterogeneous site conditions such as hilly and mountainous landscapes. Sampling density optimization suggests that the 200 m grid can be reduced to 400–500 m with minimal accuracy loss, leading to cost reductions in large-scale assessments.
The Empirical Bayesian Kriging (EBK) method proved highly effective in spatial estimations where high variability existed between sampling points.
Airborne Laser Scanning has proven to be particularly effective for aboveground biomass estimation, while root biomass interpolation also performs well when applying allometric equations. Beyond carbon stock analysis, the developed methodology can be used to assess forest stand structure and produce site classification maps.
The integrated assessment of both aboveground and belowground carbon stocks can support the development of forest management strategies and climate change mitigation efforts. While the relationship between soil and litter carbon stock is less direct, soil carbon plays a crucial role in the long-term stability of forest ecosystems. The method we have developed, which is fundamentally suitable for carbon stock estimation in temperate forests (both deciduous and coniferous), could still be applicable for determining carbon stocks in other ecosystems.
Our next objective is to develop a site classification map, refining site mapping methodologies based on field sampling, laboratory analysis, LiDAR-derived auxiliary layers, and machine learning techniques. Additionally, we aim to establish a non-systematic sampling network supported by remote sensing, which could reduce the number of required field plots and optimize the selection of survey locations, enhancing efficiency and cost-effectiveness.
Author Contributions
Conceptualization, K.C., G.K. and B.H.; methodology, K.C., G.K. and B.H.; software, K.C. and B.S.; validation, K.C., G.K., D.M. and G.V.; formal analysis, B.H.; investigation, K.C., G.K., D.M., N.Á. and G.I.; resources, B.S.; data curation, G.K.; writing—original draft preparation, K.C. and G.K.; writing—review and editing, K.C., G.K., B.H., D.H. and B.S.; visualization, K.C.; supervision, G.I.; project administration, D.M.; funding acquisition, B.H. and G.K. All authors have read and agreed to the published version of the manuscript.
Funding
This research is supported by the Hungarian Ministry of Agriculture, the State Secretariat for Forests and Land Affairs in the frame of Climate Change Action Plan, in the project “Digital Site-mapping and Carbon Stock Assessment in the Forest Soils of Hungary” (EGF/365/2023).
Data Availability Statement
The data that support the findings of this study are available from the corresponding authors upon reasonable request.
Acknowledgments
We thank the colleagues who participated directly and indirectly in this research for their support, especially the forest engineering students in the field measurements, and the university colleagues in the procurement and administrative tasks.
Conflicts of Interest
The authors declare no conflicts of interest.
Abbreviations
The following abbreviations are used in this manuscript:
| GIS | Geographic Information System |
| ALS | Airborne Laser Scanning |
| LiDAR | Light Detection and Ranging |
| DEM | Digital Elevation Model |
| CHM | Canopy Height Model |
| DBH | Diameter at Breast Height |
| WRB | World Reference Base |
| IDW | Inverse Distance Weighting |
| RBF | Radial Basis Function |
| EBK | Empirical Bayesian Kriging |
| TPI | Topographic Position Index |
References
- Szász, B.; Heil, B.; Kovács, G.; Heilig, D.; Veperdi, G.; Mészáros, D.; Illés, G.; Czimber, K. Investigation of the Relationship between Topographic and Forest Stand Characteristics Using Aerial Laser Scanning and Field Survey Data. Forests 2024, 15, 1546. [Google Scholar] [CrossRef]
- Persson, M.; Lindberg, E.; Reese, H. Tree Species Classification with Multi-Temporal Sentinel-2 Data. Remote Sens. 2018, 10, 1794. [Google Scholar] [CrossRef]
- Axelsson, A.; Lindberg, E.; Reese, H.; Olsson, H. Tree Species Classification Using Sentinel-2 Imagery and Bayesian Inference. Int. J. Appl. Earth Obs. Geoinf. 2021, 100, 102318. [Google Scholar] [CrossRef]
- Breidenbach, J.; Waser, L.T.; Debella-Gilo, M.; Schumacher, J.; Rahlf, J.; Hauglin, M.; Puliti, S.; Astrup, R. National Mapping and Estimation of Forest Area by Dominant Tree Species Using Sentinel-2 Data. Can. J. For. Res. 2021, 51, 365–379. [Google Scholar] [CrossRef]
- Illarionova, S.; Trekin, A.; Ignatiev, V.; Oseledets, I. Tree Species Mapping on Sentinel-2 Satellite Imagery with Weakly Supervised Classification and Object-Wise Sampling. Forests 2021, 12, 1413. [Google Scholar] [CrossRef]
- Nilsson, M. Estimation of Tree Heights and Stand Volume Using an Airborne Lidar System. Remote Sens. Environ. 1996, 56, 1–7. [Google Scholar] [CrossRef]
- Næsset, E. Estimating Timber Volume of Forest Stands Using Airborne Laser Scanner Data. Remote Sens. Environ. 1997, 61, 246–253. [Google Scholar] [CrossRef]
- Means, J.E.; Acker, S.A.; Harding, D.J.; Blair, J.B.; Lefsky, M.A.; Cohen, W.B.; Harmon, M.E.; McKee, W.A. Use of Large-Footprint Scanning Airborne Lidar to Estimate Forest Stand Characteristics in the Western Cascades of Oregon. Remote Sens. Environ. 1999, 67, 298–308. [Google Scholar] [CrossRef]
- Magnussen, S.; Boudewyn, P. Derivations of Stand Heights from Airborne Laser Scanner Data with Canopy-Based Quantile Estimators. Can. J. For. Res. 1998, 28, 1016–1031. [Google Scholar] [CrossRef]
- Hyyppä, J.; Hyyppä, H.; Leckie, D.; Gougeon, F.; Yu, X.; Maltamo, M. Review of Methods of Small-footprint Airborne Laser Scanning for Extracting Forest Inventory Data in Boreal Forests. Int. J. Remote Sens. 2008, 29, 1339–1366. [Google Scholar] [CrossRef]
- Kraus, K.; Pfeifer, N. A New Method for Surface Reconstruction from Laser Scanner Data. Int. Arch. Photogramm. Remote Sens. 1997, 32, 80–86. [Google Scholar]
- Axelsson, P. DEM Generation from Laser Scanner Data Using Adaptive TIN Models. ISPRS—Int. Arch. Photogramm. Remote Sens. Spat. Inf. Sci. 2000, 33, 110–117. [Google Scholar]
- Dong, Y.; Cui, X.; Zhang, L.; Ai, H. An Improved Progressive TIN Densification Filtering Method Considering the Density and Standard Variance of Point Clouds. ISPRS Int. J. Geo-Inf. 2018, 7, 409. [Google Scholar] [CrossRef]
- Pingel, T.J.; Clarke, K.C.; McBride, W.A. An Improved Simple Morphological Filter for the Terrain Classification of Airborne LIDAR Data. ISPRS J. Photogramm. Remote Sens. 2013, 77, 21–30. [Google Scholar] [CrossRef]
- Zhang, K.; Chen, S.-C.; Whitman, D.; Shyu, M.-L.; Yan, J.; Zhang, C. A Progressive Morphological Filter for Removing Nonground Measurements from Airborne LIDAR Data. IEEE Trans. Geosci. Remote Sens. 2003, 41, 872–882. [Google Scholar] [CrossRef]
- Cai, S.; Zhang, W.; Liang, X.; Wan, P.; Qi, J.; Yu, S.; Yan, G.; Shao, J. Filtering Airborne LiDAR Data Through Complementary Cloth Simulation and Progressive TIN Densification Filters. Remote Sens. 2019, 11, 1037. [Google Scholar] [CrossRef]
- Li, F.; Zhu, H.; Luo, Z.; Shen, H.; Li, L. An Adaptive Surface Interpolation Filter Using Cloth Simulation and Relief Amplitude for Airborne Laser Scanning Data. Remote Sens. 2021, 13, 2938. [Google Scholar] [CrossRef]
- Hyyppa, J.; Kelle, O.; Lehikoinen, M.; Inkinen, M. A Segmentation-Based Method to Retrieve Stem Volume Estimates from 3-D Tree Height Models Produced by Laser Scanners. IEEE Trans. Geosci. Remote Sens. 2001, 39, 969–975. [Google Scholar] [CrossRef]
- Persson, Å.; Holmgren, J.; Söderman, U. Detecting and Measuring Individual Trees Using an Airborne Laser Scanner. Photogramm. Eng. Remote Sens. 2002, 68, 925–932. [Google Scholar]
- Chen, Q.; Baldocchi, D.; Gong, P.; Kelly, M. Isolating Individual Trees in a Savanna Woodland Using Small Footprint Lidar Data. Photogramm. Eng. Remote Sens. 2006, 72, 923–932. [Google Scholar] [CrossRef]
- Koch, B.; Heyder, U.; Weinacker, H. Detection of Individual Tree Crowns in Airborne Lidar Data. Photogramm. Eng. Remote Sens. 2006, 72, 357–363. [Google Scholar] [CrossRef]
- Lee, H.; Slatton, K.C.; Roth, B.E.; Cropper JR, W.P. Adaptive Clustering of Airborne LiDAR Data to Segment Individual Tree Crowns in Managed Pine Forests. Int. J. Remote Sens. 2010, 31, 117–139. [Google Scholar] [CrossRef]
- Strîmbu, V.F.; Strîmbu, B.M. A Graph-Based Segmentation Algorithm for Tree Crown Extraction Using Airborne LiDAR Data. ISPRS J. Photogramm. Remote Sens. 2015, 104, 30–43. [Google Scholar] [CrossRef]
- Ayrey, E.; Fraver, S.; Kershaw, J.A., Jr.; Kenefic, L.S.; Hayes, D.; Weiskittel, A.R.; Roth, B.E. Layer Stacking: A Novel Algorithm for Individual Forest Tree Segmentation from LiDAR Point Clouds. Can. J. Remote Sens. 2017, 43, 16–27. [Google Scholar] [CrossRef]
- Ullah, S.; Dees, M.; Datta, P.; Adler, P.; Koch, B. Comparing Airborne Laser Scanning, and Image-Based Point Clouds by Semi-Global Matching and Enhanced Automatic Terrain Extraction to Estimate Forest Timber Volume. Forests 2017, 8, 215. [Google Scholar] [CrossRef]
- White, J.C.; Wulder, M.A.; Buckmaster, G. Validating Estimates of Merchantable Volume from Airborne Laser Scanning (ALS) Data Using Weight Scale Data. For. Chron. 2014, 90, 378–385. [Google Scholar] [CrossRef]
- Oehmcke, S.; Li, L.; Revenga, J.C.; Nord-Larsen, T.; Trepekli, K.; Gieseke, F.; Igel, C. Deep Learning Based 3D Point Cloud Regression for Estimating Forest Biomass. In Proceedings of the 30th International Conference on Advances in Geographic Information Systems, Seattle, WA, USA, 1–4 November 2022; Association for Computing Machinery: New York, NY, USA, 2022; pp. 1–4. [Google Scholar]
- Führer, E.; Molnár, S. The Amount of Carbon Stored in the Live Matter in Hungarian Forests (In Hungarian: A Magyarországi Erdők Élőfakészletében Tárolt Szén Mennyisége). Faipar 2003, 51, 16–19. [Google Scholar]
- Führer, E. The Relationship Between Climate Change and Carbon Turnover in Forestry (In Hungarian: A Klímaváltozás És a Szénforgalom Összefüggése Az Erdőgazdálkodásban). 1994. Available online: https://www.epa.hu/00600/00691/00019/10.html (accessed on 30 January 2025).
- Führer, E.; Jagodics, A. Carbon Stocks of Climate-Recording Tree Species. For. Res. 2009, 91, 5–20. (In Hungarian) [Google Scholar]
- Führer, E.; Czupy, G.; Antal, J.K.; Jagodics, A. Root Analysis in Stands of Beech, Hornbeam–Pedunculate Oak and Turkey Oak (In Hungarian: Gyökérvizsgálatok Bükkös, Gyertyános–Kocsányos Tölgyes És Cseres Faállományban). Agrochem. Soil Sci. (Agrokém. Talajt.) 2011, 60, 103–118. [Google Scholar] [CrossRef]
- Führer, E.; Jagodics, A. Carbon Stocks of Climate-Recording Tree Species. “Klíma-21” Füzetek 2009, 57, 43–55. (In Hungarian) [Google Scholar]
- Führer, E.; Járó, Z. Carbon Stock of Hungarian Forests and Its Changes. For. Res. 1989, 79–80, 159–170. [Google Scholar]
- Führer, E.; Mátyás, C. The Role of Forests in Carbon Sequestration and the Impacts of Climate Change (In Hungarian: Az Erdők Szerepe a Szénmegkötésben És a Klímaváltozás Hatásai). Erd. Lapok 2005, 140, 170–172. [Google Scholar]
- Führer, E.; Jagodics, A. Carbon Stocks of Climate Indicator Tree Species. (In Hungarian: A Klímajelző Fafajú Állományok Szénkészlete). For. Res. 1994, 91, 5–20. [Google Scholar]
- Führer, E. Carbon Stock of Hungarian Forests and Its Changes. For. Res. 1994, 84–85, 159–170. [Google Scholar]
- State Forestry Service 2002. Forest Stocks of Hungary (In Hungarian: Állami Erdészeti Szolgálat 2002. Magyarország Erdőállományai). 2001. Available online: https://www.libri.hu/konyv/Magyarorszag-erdoallomanyai-2001-4.html (accessed on 5 February 2025).
- Sedjo, R.A. The Carbon Cycle and Global Forest Ecosystem. Water Air Soil Pollut. 1993, 70, 295–307. [Google Scholar] [CrossRef]
- Mo, L.; Zohner, C.M.; Reich, P.B.; Liang, J.; de Miguel, S.; Nabuurs, G.-J.; Renner, S.S.; van den Hoogen, J.; Araza, A.; Herold, M.; et al. Integrated Global Assessment of the Natural Forest Carbon Potential. Nature 2023, 624, 92–101. [Google Scholar] [CrossRef] [PubMed]
- Köhl, M.; Hildebrandt, R.; Olschofksy, K.; Köhler, R.; Rötzer, T.; Mette, T.; Pretzsch, H.; Köthke, M.; Dieter, M.; Abiy, M.; et al. Combating the Effects of Climatic Change on Forests by Mitigation Strategies. Carbon Balance Manag. 2010, 5, 8. [Google Scholar] [CrossRef]
- Rötzer, T.; Dieler, J.; Mette, T.; Moshammer, R.; Pretzsch, H. Productivity and Carbon Dynamics in Managed Central European Forests Depending on Site Conditions and Thinning Regimes. For. Int. J. For. Res. 2010, 83, 483–496. [Google Scholar] [CrossRef]
- IPCC. Good Practice Guidance for Land Use, Land-Use Change and Forestry/The Intergovernmental Panel on Climate Change; Penman, J., Ed.; Institute for Global Environmental Strategies: Hayama, Japan, 2003; ISBN 978-4-88788-003-0. [Google Scholar]
- Pretzsch, H.; Hilmers, T. Structural Diversity and Carbon Stock of Forest Stands: Trade off as Modified by Silvicultural Thinning. Eur. J. For. Res. 2024. [Google Scholar] [CrossRef]
- Muukkonen, P. Generalized Allometric Volume and Biomass Equations for Some Tree Species in Europe. Eur. J. For. Res. 2007, 126, 157–166. [Google Scholar] [CrossRef]
- Drexhage, M.; Colin, F. Estimating Root System Biomass from Breast-height Diameters. For. Int. J. For. Res. 2001, 74, 491–497. [Google Scholar] [CrossRef]
- Drexhage, M.; Chauvière, M.; Colin, F.; Nielsen, C.N. Development of Structural Root Architecture and Allometry of Quercus petraea. Can. J. For. Res. 1999, 29, 600–608. [Google Scholar] [CrossRef]
- Durkaya, A.; Durkaya, B.; Say, Ş.U. Below-and above Ground Biomass Distribution of Young Scots Pines from Plantations and Natural Stands. Rev. Bosque 2016, 37, 509–518. [Google Scholar] [CrossRef]
- Janssens, I.A.; Sampson, D.A.; Cermak, J.; Meiresonne, L.; Riguzzi, F.; Overloop, S.; Ceulemans, R. Above- and Belowground Phytomass and Carbon Storage in a Belgian Scots Pine Stand. Ann. For. Sci. 1999, 56, 81–90. [Google Scholar] [CrossRef]
- Liepiņš, J.; Lazdiņš, A.; Liepiņš, K. Equations for Estimating Above- and Belowground Biomass of Norway Spruce, Scots Pine, Birch spp. and European Aspen in Latvia. Scand. J. For. Res. 2018, 33, 58–70. [Google Scholar] [CrossRef]
- Neubauer, M.; Demant, B.; Bolte, A. Tree-Based Estimator for below-Ground Biomass of Scots Pine (Pinus sylvestris L.) (In German: Einzelbaumbezogene Schätzfunktionen Zur Unterirdischen Biomasse Der Wald-Kiefer (Pinus sylvestris L.)). Forstarch. Forstwiss. Fachz. 2015, 86, 42–47. [Google Scholar]
- Zhang, Y.; Tang, Z.; You, Y.; Guo, X.; Wu, C.; Liu, S.; Sun, O.J. Differential Effects of Forest-Floor Litter and Roots on Soil Organic Carbon Formation in a Temperate Oak Forest. Soil Biol. Biochem. 2023, 180, 109017. [Google Scholar] [CrossRef]
- Baritz, R.; Seufert, G.; Montanarella, L.; Van Ranst, E. Carbon Concentrations and Stocks in Forest Soils of Europe. For. Ecol. Manag. 2010, 260, 262–277. [Google Scholar] [CrossRef]
- Cools, N.; De Vos, B. Part X: Sampling and Analysis of Soil. In Manual on Methods and Criteria for Harmonized Sampling, Assessment, Monitoring and Analysis of the Effects of Air Pollution on Forests; Thünen Institute of Forest Ecosystems: Eberswalde, Germany, 2020; ISBN 978-3-86576-162-0. [Google Scholar]
- Dixon, R.K.; Solomon, A.M.; Brown, S.; Houghton, R.A.; Trexier, M.C.; Wisniewski, J. Carbon Pools and Flux of Global Forest Ecosystems. Science 1994, 263, 185–190. [Google Scholar] [CrossRef]
- Chiti, T.; Díaz-Pinés, E.; Rubio, A. Soil Organic Carbon Stocks of Conifers, Broadleaf and Evergreen Broadleaf Forests of Spain. Biol. Fertil. Soils 2012, 48, 817–826. [Google Scholar] [CrossRef]
- Schlesinger, W.H. Biogeochemistry: An Analysis of Global Change, 2nd ed.; Academic Press: San Diego, CA, USA, 1997; ISBN 978-0-12-625155-5. [Google Scholar]
- Hyvönen, R.; Ågren, G.I.; Linder, S.; Persson, T.; Cotrufo, M.F.; Ekblad, A.; Freeman, M.; Grelle, A.; Janssens, I.A.; Jarvis, P.G.; et al. The Likely Impact of Elevated [CO2], Nitrogen Deposition, Increased Temperature and Management on Carbon Sequestration in Temperate and Boreal Forest Ecosystems: A Literature Review. New Phytol. 2007, 173, 463–480. [Google Scholar] [CrossRef]
- Landsberg, J.; Sands, P. Physiological Ecology of Forest Production: Principles, Processes, and Models, 6th ed.; Academic Press: Cambridge, MA, USA, 2011; Volume 31, ISBN 978-0-12-3744609. [Google Scholar]
- Whittaker, R.H.; Likens, G.E. Primary Production: The Biosphere and Man. Hum. Ecol. 1973, 1, 357–369. [Google Scholar] [CrossRef]
- Jandl, R.; Lindner, M.; Vesterdal, L.; Bauwens, B.; Baritz, R.; Hagedorn, F.; Johnson, D.W.; Minkkinen, K.; Byrne, K.A. How Strongly Can Forest Management Influence Soil Carbon Sequestration? Geoderma 2007, 137, 253–268. [Google Scholar] [CrossRef]
- Schulp, C.J.E.; Nabuurs, G.-J.; Verburg, P.H.; de Waal, R.W. Effect of Tree Species on Carbon Stocks in Forest Floor and Mineral Soil and Implications for Soil Carbon Inventories. For. Ecol. Manag. 2008, 256, 482–490. [Google Scholar] [CrossRef]
- Ganatsas, P.; Tsakaldimi, M.; Petaloudi, L.-M. Factors Affecting Long-Term Soil Organic Carbon Storage in Greek Forests. Forests 2023, 14, 1518. [Google Scholar] [CrossRef]
- Zolkos, S.G.; Goetz, S.J.; Dubayah, R. A Meta-Analysis of Terrestrial Aboveground Biomass Estimation Using Lidar Remote Sensing. Remote Sens. Environ. 2013, 128, 289–298. [Google Scholar] [CrossRef]
- Martín, M.Á.; Reyes, M.; Taguas, F.J. Estimating Soil Bulk Density with Information Metrics of Soil Texture. Geoderma 2017, 287, 66–70. [Google Scholar] [CrossRef]
- Luo, S.; Xu, L.; Yu, J.; Zhou, W.; Yang, Z.; Wang, S.; Guo, C.; Gao, Y.; Xiao, J.; Shu, Q. Sampling Estimation and Optimization of Typical Forest Biomass Based on Sequential Gaussian Conditional Simulation. Forests 2023, 14, 1792. [Google Scholar] [CrossRef]
- Hetzer, J.; Huth, A.; Wiegand, T.; Dobner, H.J.; Fischer, R. An Analysis of Forest Biomass Sampling Strategies across Scales. Biogeosciences 2020, 17, 1673–1683. [Google Scholar] [CrossRef]
- Li, S.; Quackenbush, L.J.; Im, J. Airborne Lidar Sampling Strategies to Enhance Forest Aboveground Biomass Estimation from Landsat Imagery. Remote Sens. 2019, 11, 1906. [Google Scholar] [CrossRef]
- Dövényi, Z.; Becse, A. Cadastre of Small Towns of Hungary (In Hungarian: Magyarország Kistájainak Katasztere), 2nd ed.; MTA Földrajztudományi Kutatóintézet: Budapest, Hungary, 2010; pp. 347–350. [Google Scholar]
- Czimber, K. Forest Inventory with Aerial Laser Scanning and Near Photogrammetry—First Test Results (in Hungarian: Erdőleltározás Légi Lézeres Letapogatással És Közeli Fotogrammetriával–Első Tesztek Eredményei). In Proceedings of the Theory Meets Practice in GIS Conference, Debrecen, Hungary, 23–24 March 2019; pp. 77–81. [Google Scholar]
- Sopp, L. Volume Calculation Tables (in Hungarian: Fatömeg Számítási Táblázatok); Mezőgazdasági Kiadó: Budapest, Hungary, 1974. [Google Scholar]
- Cudjoe, E.; Bravo, F.; Ruiz-Peinado, R. Allometry and Biomass Dynamics in Temperate Mixed and Monospecific Stands: Contrasting Response of Scots Pine (Pinus sylvestris L.) and Sessile Oak (Quercus petraea (Matt.) Liebl.). Sci. Total Environ. 2024, 953, 176061. [Google Scholar] [CrossRef]
- Molnár, S.; Farkas, P.; Börcsök, Z.; Zoltán, G. Industrial Trees of Our World, Density of Wood (In Hungarian: Földünk Ipari Fái, a Faanyag Sűrűsége); ERFARET: Sopron, Hungary, 2016. [Google Scholar]
- Vavrcik, H.; Gryc, V. Analysis of the Annual Ring Structure and Wood Density Relations in English Oakand Sessile Oak. Wood Res. 2012, 57, 573–580. [Google Scholar]
- Kollmann, F. Technologie des Holzes und der Holzwerkstoffe, 2nd ed.; Springer: Berlin/Heidelberg, Germany, 1951. [Google Scholar]
- Vichrov, V.E. The Structure, Physical and Mechanical Properties of Oak Wood (In Russian: Strojenije i Fiziko-Mechaničeskije Svojstva Drevjesiny Duba); Akademia nauk USSR: Moscow, Russia, 1954. [Google Scholar]
- Gafenco, I.M.; Dinulică, F.; Pleșca, B.-I.; Șofletea, N. Links between Tree Phenology and Wood Traits in Sessile Oak (Quercus petraea (Matt.) Liebl.). Ann. For. Res. 2024, 67, 31–50. [Google Scholar] [CrossRef]
- Zhang, S.-Y.; Owoundi, R.E.; Nepveu, G.; Mothe, F.; Dhôte, J.-F. Modelling Wood Density in European Oak (Quercuspetraea and Quercusrobur) and Simulating the Silvicultural Influence. Can. J. For. Res. 1993, 23, 2587–2593. [Google Scholar] [CrossRef]
- Guilley, E. Wood Density in Sessile Oak (Quercus petraea Liebl.): Modelling of the Within- and Between-Tree Variability; Origin and Non-Destructive Assessment of the «Tree» Effect; Interpretation of the Developed Model with Anatomical Traits. Ph.D. Thesis, Sciences Forestières et Sciences du Bois, National School of Rural Engineering, Water Resources and Forestry, Nancy, France, 14 April 2000. [Google Scholar]
- Komán, S.; Feher, S. Basic Density of Hardwoods Depending on Age and Site. Wood Res. 2015, 60, 907–912. [Google Scholar]
- Petráš, R.; Mecko, J.; Krupová, D.; Pažitný, A. Aboveground Biomass Basic Density of Softwoods Tree Species. Wood Res. 2019, 64, 205–212. [Google Scholar]
- Lo Monaco, A.; Todaro, L.; Sarlatto, M.; Spina, R.; Calienno, L.; Picchio, R. Effect of Moisture on Physical Parameters of Timber from Turkey Oak (Quercus cerris L.) Coppice in Central Italy. For. Stud. China 2011, 13, 276–284. [Google Scholar] [CrossRef]
- Fundova, I.; Funda, T.; Wu, H.X. Non-Destructive Wood Density Assessment of Scots Pine (Pinus sylvestris L.) Using Resistograph and Pilodyn. PLoS ONE 2018, 13, e0204518. [Google Scholar] [CrossRef]
- Mederski, P.S.; Bembenek, M.; Karaszewski, Z.; Giefing, D.F.; Sulima-Olejniczak, E.; Rosińska, M.; Łacka, A. Density and Mechanical Properties of Scots Pine (Pinus sylvestris L.) Wood from a Seedling Seed Orchard. Drewno 2015, 58, 117–124. [Google Scholar] [CrossRef]
- Tomczak, A.; Jelonek, T.; Jakubowski, M. Wood Density of Scots Pine (Pinus sylvestris L.) Trees Broken by Wind. Ann. Wars. Univ. Life Sci.—SGGW 2011, 76, 144–148. [Google Scholar]
- Auty, D.; Achim, A.; Macdonald, E.; Cameron, A.D.; Gardiner, B.A. Models for Predicting Wood Density Variation in Scots Pine. For. Int. J. For. Res. 2014, 87, 449–458. [Google Scholar] [CrossRef]
- Leal, S.; Eamus, D.; Grabner, M.; Wimmer, R.; Cherubini, P. Tree rings of Pinus nigra from the Vienna basin region (Austria) show evidence of change in climatic sensitivity in the late 20th century. Can. J. Res. 2008, 38, 744–759. [Google Scholar] [CrossRef]
- Kostić, S.; Stajić, B.; Milovanović, J. Wood Density Variation of Black Pine (Pinus nigra) in Relation to Tree Growth and Environment. Glas. Šumar. Fak. 2010. [Google Scholar]
- Gryc, V.; Vavrčík, H.; Horáček, P. Wood Density and Mechanical Properties of Black Pine (Pinus nigra) from Different Provenances. 2007. [Google Scholar]
- Moulinier, J.; Barbéro, M.; Quézel, P. Density and Growth Ring Width in Black Pine (Pinus nigra) from Different Sites in Greece. Ann. For. Sci. 2013. [Google Scholar]
- Pichler, P.; Oberhuber, W. Wood Density and Radial Growth of Black Pine (Pinus nigra) in Relation to Climate. For. Ecol. Manag. 2007. [Google Scholar]
- Dias, A.; Gaspar, M.J.; Carvalho, A.; Pires, J.; Lima-Brito, J.; Silva, M.E.; Louzada, J.L. Within- and between-Tree Variation of Wood Density Components in Pinus nigra at Six Sites in Portugal. Ann. For. Sci. 2018, 75, 58. [Google Scholar] [CrossRef]
- Dias, A.; Carvalho, A.; Silva, M.E.; Lima-Brito, J.; Gaspar, M.J.; Alves, A.; Rodrigues, J.C.; Pereira, F.; Morais, J.; Lousada, J.L. Physical, Chemical and Mechanical Wood Properties of Pinus nigra Growing in Portugal. Ann. For. Sci. 2020, 77, 72. [Google Scholar] [CrossRef]
- Piermattei, A.; Campelo, F.; Büntgen, U.; Crivellaro, A.; Garbarino, M.; Urbinati, C. Intra-Annual Density Fluctuations (IADFs) in Pinus nigra (J. F. Arnold) at High-Elevation in the Central Apennines (Italy). Trees 2020, 34, 771–781. [Google Scholar] [CrossRef]
- Moreno-Fernández, D.; Hevia, A.; Majada, J.; Cañellas, I. Do Common Silvicultural Treatments Affect Wood Density of Mediterranean Montane Pines? Forests 2018, 9, 80. [Google Scholar] [CrossRef]
- Thomas, S.C.; Martin, A.R. Carbon Content of Tree Tissues: A Synthesis. Forests 2012, 3, 332–352. [Google Scholar] [CrossRef]
- Castaño-Santamaría, J.; Bravo, F. Variation in Carbon Concentration and Basic Density along Stems of Sessile Oak (Quercus petraea (Matt.) Liebl.) and Pyrenean Oak (Quercus pyrenaica Willd.) in the Cantabrian Range (NW Spain). Ann. For. Sci. 2012, 69, 663–672. [Google Scholar] [CrossRef]
- Węgiel, A.; Polowy, K. Aboveground Carbon Content and Storage in Mature Scots Pine Stands of Different Densities. Forests 2020, 11, 240. [Google Scholar] [CrossRef]
- Lee, J.; Tolunay, D.; Makineci, E.; Çömez, A.; Son, Y.M.; Kim, R.; Son, Y. Estimating the Age-Dependent Changes in Carbon Stocks of Scots Pine (Pinus sylvestris L.) Stands in Turkey. Ann. For. Sci. 2016, 73, 523–531. [Google Scholar] [CrossRef]
- Hungarian State Forest Service. Guide to Forest Management Planning (In Hungarian: Erdőrendezési Útmutató); Hungarian State Forest Service: Budapest, Hungary, 2010.
- IUSSWorking Group WRB World Reference Base for Soil Resources, First Update; FAO: Rome, Italy, 2007.
- MSZ 21470-52:1983; Hungarian Standard 21470-52:1983 Environmental Soil Testing. Determination of Soil Organic Matter Content Based on Standard Methods. Hungarian Standard Association: Budapest, Hungary, 1983.
- Food and Agriculture Organization of the United Nations. Guidelines Soil Description, 4th ed.; FAO: Rome, Italy, 2006. [Google Scholar]
- Panagos, P.; De Rosa, D.; Liakos, L.; Labouyrie, M.; Borrelli, P.; Ballabio, C. Soil Bulk Density Assessment in Europe. Agric. Ecosyst. Environ. 2024, 364, 108907. [Google Scholar] [CrossRef]
- Führer, E.; Csiha, I.; Szabados, I.; Pödör, Z.; Jagodics, A. Aboveground and Belowground Dendromass in a Stand of Turkey Oak (In Hungarian: Egy cseres faállomány föld feletti és föld alatti szerves-anyagának meghatározása). Erd. Közlemények 2014, 4, 109–119. [Google Scholar]
- Vospernik, S.; Heym, M.; Pretzsch, H.; Pach, M.; Steckel, M.; Aldea, J.; Brazaitis, G.; Bravo-Oviedo, A.; Del Rio, M.; Löf, M.; et al. Tree Species Growth Response to Climate in Mixtures of Quercus robur/Quercus petraea and Pinus sylvestris across Europe—A Dynamic, Sensitive Equilibrium. For. Ecol. Manag. 2023, 530, 120753. [Google Scholar] [CrossRef]
- Frank, N. The Dudles Forest in Sopron Was Shaped by Nature and Man. Ph.D. Thesis, Nyugat-Magyarországi Egyetem, Sopron, Hungary, 2001. (In Hungarian). [Google Scholar]
- Illés, G.; Móricz, N. Climate Envelope Analyses Suggests Significant Rearrangements in the Distribution Ranges of Central European Tree Species. Ann. For. Sci. 2022, 79, 35. [Google Scholar] [CrossRef]
- Czimber, K.; Tomor, T.; Burai, P.; Lénárt, C.; Román, A.; Kovács, Z.; Bekő, L.; Nagy, M. First Results of Airborne Laser Scanning, Aerial Hyperspectral and Terrestrial Photogrammetry Based Timber Volume Estimation (in Hungarian: Légi Lézeres, Légi Hiperspektrális És Földi Fotogrammetriai Faállomány-Felmérés Első Eredményei). Erd. Lapok 2020, 155, 82–86. [Google Scholar]
- De Vos, B.; Cools, N.; Ilvesniemi, H.; Vesterdal, L.; Vanguelova, E.; Carnicelli, S. Benchmark Values for Forest Soil Carbon Stocks in Europe: Results from a Large Scale Forest Soil Survey. Geoderma 2015, 251–252, 33–46. [Google Scholar] [CrossRef]
- IUSS Working Group WRB. World Reference Base for Soil Resources. International Soil Classification System for Naming Soils and Creating Legends for Soil Maps, 4th ed.; International Union of Soil Sciences (IUSS): Vienna, Austria, 2022. [Google Scholar]
- Lee, S.; Lee, S.; Shin, J.; Yim, J.; Kang, J. Assessing the Carbon Storage of Soil and Litter from National Forest Inventory Data in South Korea. Forests 2020, 11, 1318. [Google Scholar] [CrossRef]
- Lukina, N.; Kuznetsova, A.; Tikhonova, E.; Smirnov, V.; Danilova, M.; Gornov, A.; Bakhmet, O.; Kryshen, A.; Tebenkova, D.; Shashkov, M.; et al. Linking Forest Vegetation and Soil Carbon Stock in Northwestern Russia. Forests 2020, 11, 979. [Google Scholar] [CrossRef]
- Pérez-Alavez, Y.; Rodríguez-Ortiz, G.; Santiago-García, W.; Campos-Angeles, G.V.; Enríquez-del Valle, J.R.; Martin, M.P. Effect of Thinning Intensity on Litterfall Biomass and Nutrient Deposition in a Naturally Regenerated Pinus pseudostrobus Lind. Forest in Oaxaca, Mexico. J. Sustain. For. 2023, 42, 77–94. [Google Scholar] [CrossRef]
- Han, S.H.; An, J.Y.; Hernandez, J.O.; Yang, H.M.; Kim, E.-S.; Noh, N.J.; Seo, J.M.; Park, B.B. Effects of Thinning Intensity on Litterfall Production, Soil Chemical Properties, and Fine Root Distribution in Pinus koraiensis Plantation in Republic of Korea. Plants 2023, 12, 3614. [Google Scholar] [CrossRef]
- Latterini, F.; Dyderski, M.K.; Horodecki, P.; Picchio, R.; Venanzi, R.; Lapin, K.; Jagodziński, A.M. The Effects of Forest Operations and Silvicultural Treatments on Litter Decomposition Rate: A Meta-Analysis. Curr. For. Rep. 2023, 9, 276–290. [Google Scholar] [CrossRef]
- Pitta-Osses, N.; Centeri, C.; Fehér, Á.; Katona, K. Effect of Wild Boar (Sus scrofa) Rooting on Soil Characteristics in a Deciduous Forest Affected by Sedimentation. Forests 2022, 13, 1234. [Google Scholar] [CrossRef]
- Sütő, D.; Farkas, J.; Siffer, S.; Schally, G.; Katona, K. Spatiotemporal Pattern of Wild Boar Rooting in a Central European Dry Oak Forest. Eur. J. For. Res. 2020, 139, 407–418. [Google Scholar] [CrossRef]
- Dutartre, P.; Bartoli, F.; Andreux, F.; Portal, J.M.; Ange, A. Influence of Content and Nature of Organic Matter on the Structure of Some Sandy Soils from West Africa. Geoderma 1993, 56, 459–478. [Google Scholar] [CrossRef]
- Azlan, A.; Aweng, E.R.; Ibrahim, C.O.; Noorhaidah, A. Correlation between Soil Organic Matter, Total Organic Matter and Water Content with Climate and Depths of Soil at Different Land Use in Kelantan, Malaysia. J. Appl. Sci. Environ. Manag. 2012, 16, 353–358. [Google Scholar]
- Zaresefat, M.; Derakhshani, R.; Griffioen, J. Empirical Bayesian Kriging, a Robust Method for Spatial Data Interpolation of a Large Groundwater Quality Dataset from the Western Netherlands. Water 2024, 16, 2581. [Google Scholar] [CrossRef]
- Krivoruchko, K.; Gribov, A. Evaluation of Empirical Bayesian Kriging. Spat. Stat. 2019, 32, 100368. [Google Scholar] [CrossRef]
- Panagos, P.; Van Liedekerke, M.; Borrelli, P.; Köninger, J.; Ballabio, C.; Orgiazzi, A.; Lugato, E.; Liakos, L.; Hervas, J.; Jones, A.; et al. European Soil Data Centre 2.0: Soil data and knowledge in support of the EU policies. Eur. J. Soil Sci. 2022, 73, e13315. [Google Scholar] [CrossRef]
- Várallyai, G. Soil Data Bases for Sustainable Land Use—Hungarian case study. In Soil Resilience and Sustainable Land Use; Greenland, D.J., Szabolcs, I., Eds.; CAB International: Wallingford, UK, 1993; pp. 469–495. [Google Scholar]
- FAO; ITPS. Global Soil Organic Carbon Map V1.5: Technical Report; FAO: Rome, Italy, 2020. [Google Scholar] [CrossRef]
Disclaimer/Publisher’s Note: The statements, opinions and data contained in all publications are solely those of the individual author(s) and contributor(s) and not of MDPI and/or the editor(s). MDPI and/or the editor(s) disclaim responsibility for any injury to people or property resulting from any ideas, methods, instructions or products referred to in the content. |
© 2025 by the authors. Licensee MDPI, Basel, Switzerland. This article is an open access article distributed under the terms and conditions of the Creative Commons Attribution (CC BY) license (https://creativecommons.org/licenses/by/4.0/).