Abstract
Hardwood has a variety of applications and can be used for low-value products, such as firewood, or for high-value applications, achieving significantly higher prices. Therefore, assessing the quality of raw material is essential for allocating the wood to the most suitable end use. The aim of this study was to explore the use of the photogrammetry technique to determine dimensional characteristics and perform remote visual grading of round oak timber stored at a log yard. The results of the visual classification were then compared with non-destructive acoustic measurements to assess their level of agreement. Based on the point cloud obtained from photogrammetry, logs were classified into three quality groups according to the European standard for round timber grading. The diameter measurements of the logs obtained through the photogrammetry survey were comparable to those taken manually, with an average difference of 0.46 cm and a mean absolute error of 2.1 cm compared to field measurements. However, the log lengths measured from the 3D survey were, on average, 5 cm shorter than those obtained using a measuring tape. The visual classification performed on the 3D reconstruction was based on the evaluation of log size, knots, buckles, and sweep, resulting in 39%, 27%, and 24% of the pieces being grouped into the high-, medium-, and low-quality classes, respectively. Acoustic measurements, performed using both resonance and time-of-flight (ToF) methods, were highly correlated with each other and successfully distinguished the three quality classes only when sweep was excluded from the classification criteria. When curvature was also considered as a parameter for log grading, acoustic velocity only differentiated the lowest quality class from the other two.
1. Introduction
Hardwood has a wide range of uses and applications, from firewood for energy production to higher-value-added processes such as peeling, slicing, and the production of sawn wood for structural use [1]. Selling wood for an intended use significantly impacts its price. Therefore, for optimal resource utilization, assessing its qualitative characteristics is essential [2,3].
This evaluation is most commonly conducted on sawn wood, following rules that assess either its appearance (for furniture or carpentry) or its mechanical properties (for structural use) [4]. However, the qualitative classification of roundwood itself offers numerous advantages, during buying and selling as well as in the processing. Buyers and sellers benefit from an agreed-upon evaluation; buyers gain confidence in the characteristics of the purchased timber, while sellers receive fair compensation [4]. Additionally, sorting roundwood into quality classes reduces the variability within homogeneous groups [5], facilitating processing and increasing efficiency.
The most common method for qualitative evaluation is visual assessment, based on the surface-visible characteristics of round timber. Three primary factors are considered: species, dimensions (length and diameter, typically measured at the smaller end), and the presence of defects [6]. Quantitative characteristics are particularly important for determining the transformation yield and evaluating recoverable volumes [7]. In contrast, defects are features that may reduce or compromise yield or final product performance. These defects include shape irregularities (sweep, crooks and tapering), characteristics such as knots (size and number), epicormic shoots, mechanical damage, shakes, and biotic degradation caused by fungi or insects [4,8]. Studies focused on oak round timber classification have identified curvatures and knots as the most common negative factors [9,10,11], as well as insect holes in certain provenances [10,11].
Visual assessment is the traditional and most widespread non-destructive method used for log grading since it is cheap and accessible, even for small companies. However, it is subjective and depends on personnel expertise [12]. The use of standardized rules can help mitigate subjectivity. The process primarily involves dividing the timber into quality classes, which may be based on intended use. However, there are also standards independent of wood destination, such as the European standard for round wood qualification [13] and guidelines from the United States [14,15] and Canada [16,17].
More recently, visual evaluation methods have expanded to include image analysis and laser or photogrammetric surveys, which generate 3D reconstructions. These techniques have primarily been applied to standing trees [18] to assess stem shape defects [19,20,21], branchiness [22,23], and, in some cases, surface defects [24].
For logs, laser surveys have long been used in sawmills to assess dimensions [12] and shape defects [8], optimizing the sawing process. Some studies have explored the use of laser scanners in sawmills to detect surface defects on round timber [25,26]. To the best of the authors’ knowledge, photogrammetry is not currently used for round timber evaluation in sawmill production lines. At log yards, laser or image analysis have been tested mostly for the size and volume determination of round wood [27,28,29].
Visual grading, however, is limited to externally visible characteristics, such as dimension, shape, and surface-detectable defects. Studies investigating the correlation between visual log grading and the quality of sawn timber obtained from these logs, have often reported disappointing results. Hecker et al. [30] analyzed the relationship between the visual qualification of round softwood timber according to the EN 1927 [31] and the strength grading of sawn timber for structural use, finding only a weak correlation. Similar results have been obtained for oak timber, where the visual grading of round timber had little influence on the yield of boards suitable for construction. Instead, the sawing pattern played a more critical role in improving the yield [32].
Assessing a log’s internal characteristics could provide valuable additional information beyond that detected visually. Internal defects can be predicted using models based on external observations [33]. Alternatively, non-destructive instrumental measurements, extensively and accurately described in [12] for log quality evaluation and in [34] for standing trees and logs, can be used in the field or in the laboratory.
A recently tested and highly accurate technique is computed tomography, but its high cost make it unsuitable for small- to medium-sized enterprises [35,36]. More affordable, rapid non-destructive tools are available for internal quality assessment. Among the most effective are those based on acoustic techniques. These are divided into two methods: time-of-flight (ToF) and acoustic resonance. A comprehensive review and detailed explanation of the methods can be found in [37].
Acoustic measurements have been tested for the pre-classification of round timber intended for sawn structural wood production [38,39,40] and for the direct classification of round timber to be used in construction [41,42]. Other studies have evaluated their effectiveness in distinguishing visually defined quality classes of round timber [43]. However, research particularly in this latter area remains limited, and further studies are needed to assess the effectiveness of these tools as aids in log grading.
This study aimed to test the use of photogrammetric surveys of logs ready for sale at a log yard to determine their dimensional characteristics and enable remote visual grading based on a generated point cloud. Additionally, it aimed to compare visual classification results with non-destructive acoustic measurements to assess their level of agreement.
2. Materials and Methods
2.1. Materials and Field Survey
A total of 160 European oak logs, located in the area of Ticino Park (Vigevano, Italy), that were felled and processed (delimbed and cross-cut), were numbered and surveyed. In the field, the diameters at both ends and the length of each log were measured to the nearest centimeter using a caliper and a metric measuring tape, respectively.
Instrument surveys were conducting using two portable devices, both aimed at determining the wood stiffness. A Microsecond Timer (Fakopp Enterprise Bt, Sopron, Hungary) was used to measure the ToF of the mechanical waves running longitudinally between two transducers. The transducers were inserted into the wood at the cross-cut sections, and three readings were taken per log to derive an average ToF. The acoustic velocity was then calculated as the ratio of the log’s length to its ToF.
Similarly, a resonance-based acoustic method was applied for comparison, as this is a well-established technique for evaluating wood stiffness in logs and sawn timber. An acoustic tool, Hitman HM200 (Fibre-gen, Christchurch, New Zealand), was used to measure and record the velocity of the longitudinal wave generated by a hammer hit on each log.
Following this, a photogrammetry survey was conducted on three batches for a total of 90 logs using an XVS vSLAM 3d Scanner (Stonex, Monza, Italy). The acquired images were processed with XVS Cloud software (version 2.0.1) to generate a 3D point cloud. The point cloud (Figure 1) was then handled and analyzed using open-source software CloudCompare (version 2.12.3) [44].
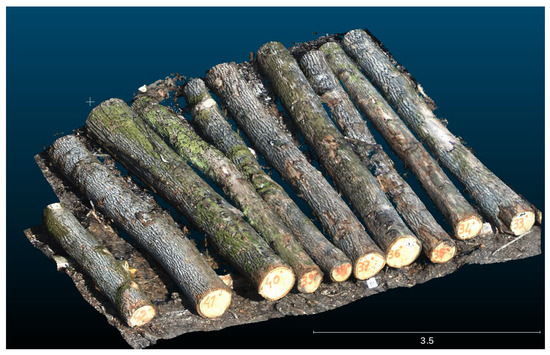
Figure 1.
Example of point cloud originating from the photogrammetry survey (distance in m).
2.2. Analysis
2.2.1. Instrumental Data
Liu et al. [45] modeled acoustic wave propagation in the context of ToF measurements in standing trees, with a transducer distance of 1.2 m. They described the effects of both tree diameter and slenderness on wave behavior. For small diameters (less than 10 cm) and high slenderness (greater than 12), wave propagation was quasi-plane, making the velocity determined by the ToF comparable to that measured using the resonance method. For large dimeters (>40 cm) and low slenderness (<3), the propagation followed a dilatational wave pattern. In intermediate cases, a transition phase was observed, and mathematical models were proposed to adjust the velocity to the resonance-based velocity.
Although the ToF measurement procedure differed from that in the cited paper—as the measurements were conducted from end to end on logs rather than on one side of a standing tree stem—the correction suggested by Liu et al. [45] was still applied.
ToF- and resonance-based velocities were than compared using linear regression analysis, with resonance-based velocity as the dependent variable and the ToF-derived velocity (calculated as the ratio of the ToF to transducer distance) as the independent variable. The coefficient of determination for the linear regression was then computed.
2.2.2. Point Cloud Processing: Virtual Visual Grading
First, log dimensions (diameter and length) were determined in the point cloud and compared with field measurements. To ensure accuracy and avoid alignment errors when measuring distances between points, the longitudinal axis of each log was aligned with one of the Cartesian axes. Once properly positioned, a slice approximately 1 cm thick was cut perpendicular to the log’s axis to serve as a reference for diameter measurements (Figure 2).
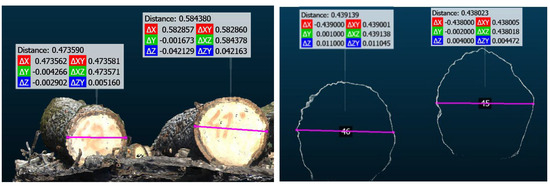
Figure 2.
Determination of log diameters in the point cloud (distance in m).
Qualitative classification was performed according to the European technical standard EN 1316-1 [13]. The standard provides four qualitative classes: A, B, C, and D, with class A being the highest quality. Class D was excluded because it allows the presence of all characteristics without limitation and requires logs to be processable as usable sawn timber.
Among the characteristics listed for quality determination, those used are reported in Table 1 for the first three classes. As for the other characteristics mentioned in the standard, epicormic shoot, spiral grain, eccentric pith, mechanical damage, discoloration, and biological damage were never present. Ring shake or other shakes were not observable due to the high moisture content of the logs, and rate of growth was not discernable due to image resolution limitations.

Table 1.
Visual characteristics used for the qualitative classification in the three first classes according to EN 1316-1 [13].
Knot size was measured as the small axis of the ellipses approximating the knot (Figure 3). The sweep was determined by taking a thin longitudinal slice (1–1.5 cm thick) (Figure 4 and Figure 5). Each log was isolated and observed from various angles by rotating it around its longitudinal axis. The orientation with the greatest curvature was then visually identified. In cases of uncertainty, multiple measurements were taken, and the highest curvature was recorded. To obtain the longitudinal slice, the log’s longitudinal axis was aligned with a Cartesian axis, and the section was cut parallel to it. The sides and angles of the tringle formed by the sweep were measured, and the curvature arrow was calculated using trigonometry (Equation (1)):
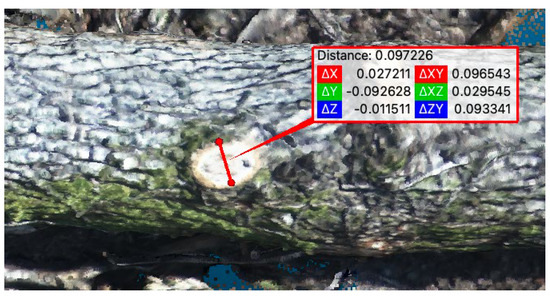
Figure 3.
Measure of the knot size (distance in m).
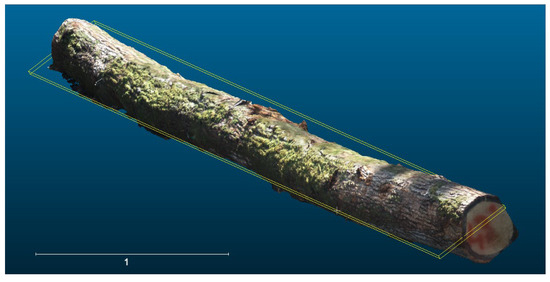
Figure 4.
Slicing of the logs for sweep determination (distance in m).
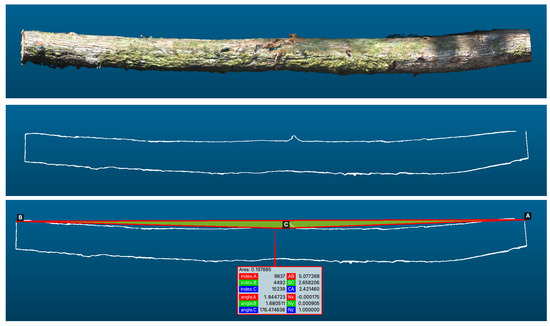
Figure 5.
Passages for sweep determination: log, slice, measure of distances and angles (distance in m).
Refer to Figure 5 for an explanation of the terms in this equation.
2.2.3. Measurement Comparison and Statistical Analysis
The Bland–Altman plot was used to compare field and cloud-based size measurements. This graphical method helps with assessing the agreement between two measurement techniques [46].
Additionally, mean absolute error (MAE), root mean squared error (RMSE), and normalized RMSE (NRMSE) were calculated. A paired Student’s t-test was also performed, with statistical significance set at p < 0.05.
After visual grading, a qualitative class was assigned to each log. The classes were then compared in terms of the wave velocity measured by the two instruments (ToF- and resonance-based). This comparison was performed using analysis of variance, after verifying the normality of the data distribution and the homogeneity of variance.
3. Results
3.1. Acoustic Measurements
Figure 6 presents a comparison of the wave velocity measurements obtained using the ToF- and resonance-based methods, illustrated through scatterplots along with the corresponding linear regression analysis. The results indicate a moderately strong correlation between the two measurements. However, this relationship was significantly strengthened after applying the correction for the dilatation wave mode, as reflected by an increase in the coefficient of determination from 0.61 to 0.74. Consequently, the adjusted values were used for all subsequent analyses.
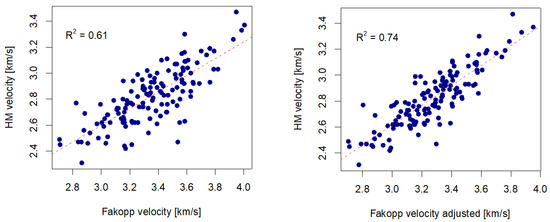
Figure 6.
Linear relationship between the longitudinal wave velocity measured by resonance-based method (HM velocity) and ToF technique (Fakopp), adjusted according to Liu et al. [45] on the right and not adjusted on the left.
The velocity measured using the ToF technique was generally higher than that obtained with the resonance-based method. On average, the ratio between the two was 1.19 for uncorrected ToF values and 1.16 for corrected values.
3.2. Log Size Determination
The logs had an average diameter of 53.3 ± 10.5 cm, a length of 5.4 ± 1.6 m, and a mean slenderness (length-to-diameter ratio) of 10.8. The average volume was 1.2 ± 0.6 m3.
Figure 7 compares the size measurements obtained in the field using traditional methods (caliper and measuring tape) with those derived from the point cloud. On average, a difference of 0.46 cm (0.9%) was observed for log diameter and 5 cm (1.0%) for log length. Diameter measurements from the point cloud were generally consistent with field assessments, with 93% of measurements falling within ±5 cm (±9%) and 65% within ±2 cm (±4%) of the field measurements. The MAE was 2.1 cm, the RMSE was 2.8 cm, and the NRMSE was 0.27. The mean difference was well centered within the agreement interval (red dotted lines), indicating that the point cloud measurements did not exhibit any systematic bias (Figure 7, left). This was further confirmed by a paired Student’s t-test comparing field and photogrammetry-based diameter measurements, which showed no significant difference (p-value = 0.12).
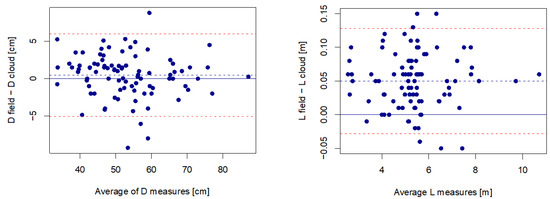
Figure 7.
Bland–Altman plots showing the differences between field measurements and point cloud determinations, plotted against the mean of the two measurements for log diameter (D) and length (L). The red dotted lines represent the lower and upper 95% limits of agreement, while the blue dotted line indicates the mean difference between the measurements.
In contrast, the log length measured in the field was, on average, 5 cm longer than the corresponding values obtained from the point cloud. In the Bland–Altman plot, the zero line was close to the lower limit of the agreement interval, though still within it (Figure 7, right). In this case, Student’s t-test revealed a highly significant difference (p-value < 0.001), indicating a measurement bias. The MAE was 5.5 cm, the RMSE was 6.6 cm, and the NRMSE was 0.05.
3.3. Visual Classification
The visual qualification of the logs resulted in the majority being high-quality logs, with 43% classified as class A. Similar quantities were found in the second and third classes, with 30% in class B and 27% in class C (Figure 8, left). The most relevant characteristic that downgraded the log was the presence and dimension of sound knots (24%). An important role was also played by the overall curvature, which downgraded 15% of the logs from class A to B (Figure 8).
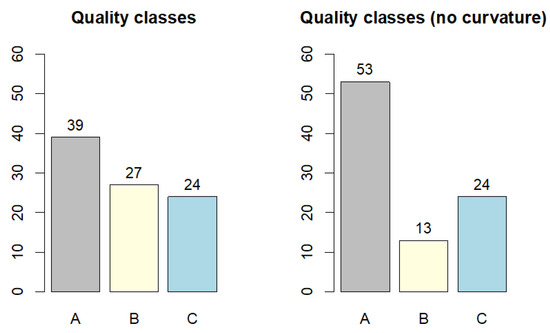
Figure 8.
Results of the visual grading conducted with the point cloud, considering all the characteristics (left) and without taking into account log curvature during grading (right).
The log dimensions and velocity measured in the logs of the three quality classes are reported in Table 2.

Table 2.
Mean and standard deviation of the dimensional characteristics and wave velocity calculated for each quality class (A, B, and C). Different lowercase letters (a, b) indicate significant differences in means (p < 0.05).
Notably, when all the characteristics were considered in the grading, classes A and B did not differ in velocity, with only class C showing significantly lower values (Table 2 and Figure 9, left). However, when log curvature was not taken into account during grading, velocity was effective in differentiating all three classes (Figure 9, right).
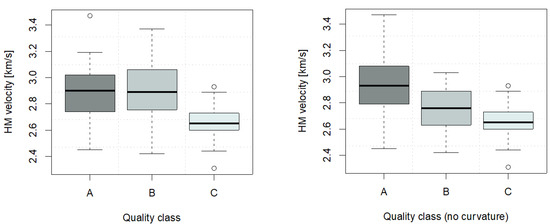
Figure 9.
Velocity of the acoustic wave running longitudinally through the logs for the three visual quality classes. The grading was performed considering all the visual characteristics (left) or not including the log curvature in the qualitative evaluation (right).
Similar results were observed for the ToF measurements, which are not shown here.
4. Discussion
4.1. Using Photogrammetry for the Visual Qualification of Logs
The use of photogrammetry in a log yard was tested for visually assessing round timber, measuring its dimensions, and classifying each log into one of three quality classes.
As a result of the point cloud analysis, the log diameter measurements showed no bias compared to the field survey. The mean absolute error was 2.1 cm, which also accounts for the error caused by the imperfect alignment of the measuring vectors with those used in the field. This mismatch could lead to greater errors, particularly when the cross-sections are not perfectly circular. A previous study using the LiDAR of a mobile phone [27] reported a low MAE of 0.68 cm between the diameters measured with LiDAR and those obtained through manual surveys, but the cited study was conducted on Norway spruce, which has a more circular cross-section than oak logs, and the average diameter was smaller (22 cm versus 53 cm).
In contrast, length determination showed a negative bias, with values obtained from the point cloud analysis being, on average, 5 cm lower than those measured in the field. The measurement of the length of a log is particularly prone to errors when traditional methods are used. A likely explanation for this systematic difference may be the difficulty of keeping the measuring tape straight during field measurements. These differences in length values led to an average overestimation of 3.4% in log volume when based on field measurements.
Visual qualification and log size determination were effectively carried out on the point cloud. Obviously, using photogrammetry, the quality of the images is of major importance, and proper lighting during the survey is crucial: pictures should be taken during daylight but avoiding overexposure or backlighting. However, considering other 3D survey techniques like LiDAR, despite the need for these precautions during image capture, the presence of photos allows for the creation of an RGB point cloud, which makes the visual qualification easier or possible [20,47].
In our sample, the knots were clearly visible because they were usually large, but smaller defects may have been more difficult to spot or may have been misinterpreted. Surface dirt or foreign objects on the logs could also be mistaken for growths. Again, image quality is key.
To give an idea of the time needed for the survey, 80 logs were surveyed in 15 min (about 19 s/log), excluding the time required for the point cloud to be reconstructed by the software. To improve the quality of the point cloud (more details) and achieve higher resolution and data density, it may be necessary to extend these times. A similar study examining the time required to survey round timber using LiDAR (smartphone and a mobile laser scanner (MLS)) reported the following: with the smartphone, an average time of 1.5 min per log was recorded for individual surveys. This decreased when scanning a small group of 4–5 logs (67 s/log) or a medium group of 7–14 logs (42 s/log). The MLS provided the best results in terms of time, averaging 25 s/log for small groups and 19 s/log for larger groups (27–35 logs). Qualitative assessments of the scans were not reported in that study [48].
Obviously, the photogrammetry survey revealed approximately three-fourths of the log surface, but this aligns with the standard practice in industry. In a recent interview with several sawmills, it was revealed that 90% of companies do not typically roll the logs during their evaluation [6].
4.2. Acoustic Measurement and Visual Classification
The acoustic velocity of the waves running longitudinally through the logs, determined using the ToF technique, was in good agreement with the resonance-based measurements. The resonance-based method is usually taken as a reference for the quality estimation of wood, and the correlation between the two was high, with the coefficient of determination being 0.74 after the adjustment prosed by Liu et al. [45]. As expected, the velocity based on ToF measurements was higher than that recorded using the resonance method, and the ratio between the two aligned with previous findings reported in the literature: on average, ranging from 1.15 to 1.31 [37].
Even though the ToF was measured on logs after harvesting (rather than on standing trees), the good agreement between the two techniques suggests the possibility of the early evaluation of standing trees. The main drawback in this case is the short length typically involved in the measurements, which usually does not exceed the first 1.5 m of the stem. Previous studies reported how involving greater lengths in the measurement showed better correlations with the characteristics of the boards produced from the log [49].
Velocity effectively separated the visual quality classes but only for the first two classes when graded without considering log curvature. The presence of knots (large branches) influences the longitudinal propagation of mechanical waves, as they disturb the direction of the wood grain. The larger and more numerous the knots, the lower the velocity of the waves passing through the wood [37]. For this very reason, acoustic velocity is often used for the classification of wood products intended for construction, where the primary focus is on mechanical performance, where knots are a significant downgrading defect [50]. Consequently, lower quality classes with more and larger knots have a lower acoustic velocity.
On the other hand, shape defects, such as sweep, have less or no impact on these instrumental surveys, so a generalized sweep may not significantly reduce the velocity of the stress waves traveling through the timber. However, curvature can be important depending on the final use of the round wood, especially for the processing yield [17,51]. Logs with a pronounced curvature or local crooks are also more likely to contain reaction wood [52], which can result in sawing or drying defects during the subsequent processing phases.
Despite this limitation, acoustic tools are quick as well as easy to use and can provide useful information about wood quality. Similar conclusions were reached by Straže and Novak [43], who conducted acoustic measurements on oak logs prepared for auction, which had previously undergone visual grading.
4.3. Perspectives and Practical Implications
Photogrammetry clouds can effectively replace a field visit by a qualified grader, enabling remote assessments. Photogrammetry surveys require logs to be properly positioned (not stacked) and spaced to view three-fourths of the log surface, which also aligns with the requirements for visual assessments on site. A next implementation should consider the automation of point cloud analysis. Size measurements are already widely practiced in point cloud surveys conducted on standing trees for forest inventory purposes, mainly diameter and stem volume [47], and these techniques could be effectively adopted for logs lying on the ground after harvesting [27,28,29].
The measurement of curvature may prove more challenging. This evaluation has been conducted using LiDAR data in sawmills to properly position logs during sawing to obtain the highest possible yield or to classify curvature as well as sweep types and thus locate internal defects [8,52,53]. In this case, however, the lasers are fixed on the production line, and the logs move through them, so that the log orientation with respect to the reference axes in the three-dimensional cloud is always the same. Here, a greater computational effort appears necessary to first segment the individual logs, orient them properly, and then process them.
Also, the detection and measurement of surface defects could be challenging. Previous research on standing trees [18] may be applied and verified on logs [25,26]. Automating point cloud processing, however, is a key aspect to make the process exploitable at a large scale.
Overall, the application of “virtual” visual grading in timber sales has great potential. In some countries, particularly for species with higher added value, timber auctions are a well-established tradition. Buyers evaluate each piece of round timber individually and offer a price based on its characteristics and the products that can be derived from it. Even outside formal auctions, sales often rely on a buyer’s assessment to determine an appropriate price, aiming to reach an agreement with the seller. A possible approach could be providing a 3D survey to multiple buyers, enabling them to assess the timber remotely. This could expand market opportunities and increase accessibility.
A future challenge, also, is integrating visual assessments, potentially performed on point cloud surveys, with outputs from acoustic or other non-destructive instruments [54], since visual and instrumental assessments appear complementary in some aspects. Visual grading is crucial when the final product prioritizes esthetic qualities, while acoustic grading is more important when mechanical properties are critical.
No significant obstacles are expected in applying both techniques to other wood species. However, visual classification should follow rules specifically established for the species being assessed, while acoustic measurements should be verified and tailored, if necessary, to account for the velocity values specific to each species. Different species may exhibit different characteristics that define their quality. Nonetheless, the instrument survey remains entirely feasible.
5. Conclusions
Using a 3D reconstruction from a photogrammetry survey of logs, both remote dimensional measurements and visual classification into three quality groups proved feasible by analyzing a point cloud.
The quality groups obtained through visual grading were effectively distinguished using acoustic measurements taken on the same logs, using either the ToF- or resonance-based technique. However, complete agreement was only achieved when the classification was based on structural defects, particularly knots. When curvature was included as a parameter in grading, the agreement between the visual and instrumental qualification diminished. Sweep, indeed, is a defect with a low impact on the stress wave velocity but may have an important effect on the further processing of round timber.
The two evaluation techniques (visual and acoustic) can provide complementary information and could be used in combination or weighted depending on the timber’s intended use.
Author Contributions
Conceptualization, M.N. and M.B.; methodology, M.N.; formal analysis, M.N., G.A. and M.V.; writing—original draft preparation, M.N.; writing—review and editing, M.B., G.A. and M.V.; funding acquisition, M.B. All authors have read and agreed to the published version of the manuscript.
Funding
This study was supported by the Agritech National Research Center and received funding from the European Union Next-Generation EU (PIANO NAZIONALE DI RIPRESA E RESILIENZA (PNRR)–MISSIONE 4 COMPONENTE 2, INVESTIMENTO 1.4–D.D. 1032 17/06/2022, CN00000022).
Data Availability Statement
Dataset available upon request from the authors.
Acknowledgments
The authors thank Gabriele Sguazzini of Studio Agroforestale Terra Viva (PV) for the invaluable help during the field surveys.
Conflicts of Interest
The authors declare no conflicts of interest.
References
- Teischinger, A. From Forest to Wood Production—A Selection of Challenges and Opportunities for Innovative Hardwood Utilization. In Proceedings of the International Conference of Hardwood Processing (ISCHP 2017), Lahti, Finland, 25–28 September 2017. [Google Scholar]
- Malinen, J.; Haring, M.; Kilpeläinen, H.; Verkasalo, E. Comparison of Alternative Roundwood Pricing Systems—A Simulation Approach. Silva Fenn. 2015, 49, 1293. [Google Scholar] [CrossRef][Green Version]
- Hassler, C.C.; Grushecky, S.T.; Osborn, L.E.; McNeel, J.F. Hardwood Log Grading in the United States—Part 1: A Historical Perspective. For. Prod. J. 2019, 69, 110–123. [Google Scholar] [CrossRef]
- Carvalho, J.P.F.; Santos, J.A.; Santos, J. Quality Control and Productivity in Oak Timber—From Forest to the Primary Processing. In Proceedings of the Cost Action E53 Conference, Lisbon, Portugal, 22–23 October 2009. [Google Scholar]
- Hassler, C.C.; Osborn, L.E.; Grushecky, S.T.; McNeel, J.F. Hardwood Log Grading in the United States—Part II: United States Forest Service Log Grades and the Hardwood Industry. For. Prod. J. 2019, 69, 124–130. [Google Scholar] [CrossRef]
- Hassler, C.C.; Thompson, J.R.; McNeel, J.F. Hardwood Log Grading in the United States—Part III: An Assessment of the Current Status of Log Grading in the Hardwood Industry. For. Prod. J. 2021, 71, 133–143. [Google Scholar] [CrossRef]
- Havreljuk, F.; Achim, A.; Pothier, D. Predicting Lumber Grade Occurrence and Volume in Sugar Maple and Yellow Birch Logs. For. Sci. 2022, 68, 410–424. [Google Scholar] [CrossRef]
- Gorges, J.; Huber, M.; Sauter, U.H.; Dormann, C.F. Curvature of Logs—Development of and Comparison between Different Calculation Approaches. Forests 2021, 12, 857. [Google Scholar] [CrossRef]
- Gejdoš, M.; Suchomel, J.; Danihelová, Z. Analysis of Qualitative Features of Beech and Oak Trunks as a Determinant of the Quality Assessment. Forests 2021, 12, 15. [Google Scholar] [CrossRef]
- Dumitrascu, A.-E.; Ciobanu, V.D.; Lepadatescu, B. Valorization of Wood Resources for the Cutting of Decorative Veneer in the Context of Sustainable Development of Romanian Forests. BioResources 2013, 8, 4298–4311. [Google Scholar] [CrossRef]
- Musat, E.-C.; Salca, E.-A.; Ciobanu, V.D.; Dumitrascu, A.-E. The Influence of Log Defects on the Cutting Yield of Oak Veneer. BioResources 2017, 12, 7917–7930. [Google Scholar] [CrossRef]
- Ondrejka, V.; Gergeľ, T.; Bucha, T.; Pástor, M. Innovative Methods of Non-Destructive Evaluation of Log Quality. Cent. Eur. For. J. 2021, 67, 3–13. [Google Scholar] [CrossRef]
- EN 1316-1; Hardwood Round Timber—Qualitative Classification—Part 1: Oak and Beech. CEN—European Committee for Standardization: Brussels, Belgium, 2012.
- Bond, B. A Hardwood Log Grading Handbook; The University of Tennessee Institute of Agriculture: Knoxville, TN, USA, 2019; p. 25. [Google Scholar]
- Self, B. Grading Hardwood Trees: A Guide to Identifying Stem Quality in Hardwood Stands; Mississipi State University Extension Service: Mississippi, MS, USA, 2021; p. 8. [Google Scholar]
- Cecil-Cockwell, M.J.L.; Caspersen, J.P. A Simple System for Classifying Sugar Maple Vigour and Quality. Can. J. For. Res. 2015, 45, 900–909. [Google Scholar] [CrossRef]
- Castle, M.; Weiskittel, A.; Wagner, R.; Ducey, M.; Frank, J.; Pelletier, G. Variation in Stem Form and Risk of Four Commercially Important Hardwood Species in the Acadian Forest: Implications for Potential Sawlog Volume and Tree Classification Systems. Can. J. For. Res. 2017, 47, 1457–1467. [Google Scholar] [CrossRef]
- Nocetti, M.; Brunetti, M. Advancements in Wood Quality Assessment: Standing Tree Visual Evaluation—A Review. Forests 2024, 15, 943. [Google Scholar] [CrossRef]
- Mengesha, T.; Hawkins, M.; Tarleton, M.; Nieuwenhuis, M. Stem Quality Assessment Using Terrestrial Laser Scanning Technology: A Case Study of Ash Trees with a Range of Defects in Two Stands in Ireland. Scand. J. For. Res. 2015, 30, 605–616. [Google Scholar] [CrossRef]
- Bauwens, S.; Fayolle, A.; Gourlet-Fleury, S.; Ndjele, L.M.; Mengal, C.; Lejeune, P. Terrestrial Photogrammetry: A Non-destructive Method for Modelling Irregularly Shaped Tropical Tree Trunks. Methods Ecol. Evol. 2017, 8, 460–471. [Google Scholar] [CrossRef]
- Prendes, C.; Canga, E.; Ordoñez, C.; Majada, J.; Acuna, M.; Cabo, C. Automatic Assessment of Individual Stem Shape Parameters in Forest Stands from TLS Point Clouds: Application in Pinus Pinaster. Forests 2022, 13, 431. [Google Scholar] [CrossRef]
- Kędra, K.; Barbeito, I.; Dassot, M.; Vallet, P.; Gazda, A. Single-Image Photogrammetry for Deriving Tree Architectural Traits in Mature Forest Stands: A Comparison with Terrestrial Laser Scanning. Ann. For. Sci. 2019, 76, 5. [Google Scholar] [CrossRef]
- Tomșa, V.R.; Curtu, A.L.; Niță, M.D. Tree Shape Variability in a Mixed Oak Forest Using Terrestrial Laser Technology: Implications for Mating System Analysis. Forests 2021, 12, 253. [Google Scholar] [CrossRef]
- Nguyen, V.-T.; Constant, T.; Kerautret, B.; Debled-Rennesson, I.; Colin, F. A Machine-Learning Approach for Classifying Defects on Tree Trunks Using Terrestrial LiDAR. Comput. Electron. Agric. 2020, 171, 105332. [Google Scholar] [CrossRef]
- Thomas, L.; Mili, L.; Thomas, E.; Shaffer, C.A. Defect Detection on Hardwood Logs Using Laser Scanning. Wood Fiber Sci. 2006, 38, 682–695. [Google Scholar]
- Thomas, L.; Shaffer, C.A.; Mili, L.; Thomas, E. Automated Detection of Severe Surface Defects on Barked Hardwood Logs. For. Prod. J. 2007, 57, 50–56. [Google Scholar]
- Niţă, M.D.; Borz, S.A. Accuracy of a Smartphone-Based Freeware Solution and Two Shape Reconstruction Algorithms in Log Volume Measurements. Comput. Electron. Agric. 2023, 205, 107653. [Google Scholar] [CrossRef]
- Tomczak, K.; Mederski, P.S.; Naskrent, B.; Tomczak, A. Accuracy of Photo-Optical Timber Measurement Using a Stereo Camera Technology. Croat. J. For. Eng. (Online) 2024, 45, 157–167. [Google Scholar] [CrossRef]
- Xu, M.; Chen, S.; Xu, S.; Mu, B.; Ma, Y.; Wu, J.; Zhao, Y. An Accurate Handheld Device to Measure Log Diameter and Volume Using Machine Vision Technique. Comput. Electron. Agric. 2024, 224, 109130. [Google Scholar] [CrossRef]
- Hecker, M.; Ressmann, J.; Becker, G.; Merforth, C. Prognosis of sawntimber quality based on roundwood grading—Comparison of selected national and European grading rules for roundwood and sawntimber. Holz Als Roh- Und Werkst. 2000, 58, 168–176. [Google Scholar] [CrossRef]
- EN 1927; Qualitative Classification of Softwood Round Timber. CEN—European Committee for Standardization: Brussels, Belgium, 2008.
- Riesco Muñoz, G.; Remacha Gete, A.; Gasalla Regueiro, M. Variation in Log Quality and Prediction of Sawing Yield in Oak Wood (Quercus Robur). Ann. For. Sci. 2013, 70, 695–706. [Google Scholar] [CrossRef]
- Drew, D.M.; Downes, G.M.; Seifert, T.; Eckes-Shepard, A.; Achim, A. A Review of Progress and Applications in Wood Quality Modelling. Curr. For. Rep. 2022, 8, 317–332. [Google Scholar] [CrossRef]
- Schimleck, L.; Dahlen, J.; Apiolaza, L.A.; Downes, G.; Emms, G.; Evans, R.; Moore, J.; Pâques, L.; Van Den Bulcke, J.; Wang, X. Non-Destructive Evaluation Techniques and What They Tell Us about Wood Property Variation. Forests 2019, 10, 728. [Google Scholar] [CrossRef]
- Longo, B.L.; Brüchert, F.; Becker, G.; Sauter, U.H. From inside to Outside: CT Scanning as a Tool to Link Internal Knot Structure and External Branch Diameter as a Prerequisite for Quality Assessment. Wood Sci. Technol. 2022, 56, 509–529. [Google Scholar] [CrossRef]
- Gejdoš, M.; Gergeľ, T.; Michajlová, K.; Bucha, T.; Gracovský, R. The Accuracy of CT Scanning in the Assessment of the Internal and External Qualitative Features of Wood Logs. Sensors 2023, 23, 8505. [Google Scholar] [CrossRef]
- Legg, M.; Bradley, S. Measurement of Stiffness of Standing Trees and Felled Logs Using Acoustics: A Review. J. Acoust. Soc. Am. 2016, 139, 588–604. [Google Scholar] [CrossRef] [PubMed]
- Rais, A.; Pretzsch, H.; Van De Kuilen, J.-W.G. Roundwood Pre-Grading with Longitudinal Acoustic Waves for Production of Structural Boards. Eur. J. Wood Prod. 2014, 72, 87–98. [Google Scholar] [CrossRef]
- Simic, K.; Gendvilas, V.; O’Reilly, C.; Harte, A.M. Predicting Structural Timber Grade-Determining Properties Using Acoustic and Density Measurements on Young Sitka Spruce Trees and Logs. Holzforschung 2019, 73, 139–149. [Google Scholar] [CrossRef]
- Balasso, M.; Hunt, M.; Jacobs, A.; O’Reilly-Wapstra, J. Development of a Segregation Method to Sort Fast-Grown Eucalyptus Nitens (H. Deane & Maiden) Maiden Plantation Trees and Logs for Higher Quality Structural Timber Products. Ann. For. Sci. 2022, 79, 9. [Google Scholar] [CrossRef]
- Nocetti, M.; Aminti, G.; Wessels, C.B.; Brunetti, M. Applying Machine Strength Grading System to Round Timber Used in Hydraulic Engineering Works. Forests 2021, 12, 281. [Google Scholar] [CrossRef]
- Brunetti, M.; Aminti, G.; Wessels, C.B.; Nocetti, M. Mixed Visual and Machine Grading to Select Eucalyptus Grandis Poles into High-Strength Classes. Forests 2021, 12, 1804. [Google Scholar] [CrossRef]
- Straže, A.; Novak, K. Quality and Price Gain of European Oak Logs Determined by Visual and Stress Wave Analysis. In Proceedings of the 10th Hardwood Conference Proceedings, Sopron, Hungary, 12–14 October 2022; pp. 62–67. [Google Scholar]
- CloudCompare. 3D Point Cloud and Mesh Processing Software Open-Source Project. Available online: https://www.cloudcompare.org/ (accessed on 1 August 2024).
- Liu, F.; Zhang, H.; Wang, X.; Jiang, F.; Yu, W.; Ross, R.J. Acoustic Wave Propagation in Standing Trees—Part II. Effects of Tree Diameter and Juvenile Wood. Wood Fiber Sci. 2021, 53, 95–108. [Google Scholar] [CrossRef]
- Bland, M.J.; Altman, D.G. Statistical Method for Assessing Agreement between Two Methods of Clinical Measurement. Lancet 1986, 327, 307–310. [Google Scholar] [CrossRef]
- Iglhaut, J.; Cabo, C.; Puliti, S.; Piermattei, L.; O’Connor, J.; Rosette, J. Structure from Motion Photogrammetry in Forestry: A Review. Curr. For. Rep. 2019, 5, 155–168. [Google Scholar] [CrossRef]
- Borz, S.A.; Proto, A.R. Application and Accuracy of Smart Technologies for Measurements of Roundwood: Evaluation of Time Consumption and Efficiency. Comput. Electron. Agric. 2022, 197, 106990. [Google Scholar] [CrossRef]
- Gil-Moreno, D.; Ridley-Ellis, D. Comparing Usefulness of Acoustic Measurements on Standing Trees for Segregation by Timber Stiffness. In Proceedings of the 19th International Nondestructive Testing and Evaluation of Wood Symposium, Madison, WI, USA, 30 September 2015; Ross, R.J., Gonçalves, R., Wang, X., Eds.; United States Department of Agriculture Forest Service, Forest Products Laboratory: Madison, WI, USA, 2015; pp. 378–385. [Google Scholar]
- Nocetti, M.; Pröller, M.; Brunetti, M.; Dowse, G.P.; Wessels, C.B. Investigating the Potential of Strength Grading Green Eucalyptus Grandis Lumber Using Multi-Sensor Technology. BioResources 2017, 12, 9273–9286. [Google Scholar] [CrossRef]
- MacDonald, E.; Mochan, S.; Connolly, T. Validation of a Stem Straightness Scoring System for Sitka Spruce (Picea sitchensis (Bong.) Carr.). Forestry 2009, 82, 419–429. [Google Scholar] [CrossRef]
- Gjerdrum, P.; Warensjö, M.; Nylinder, M. Classification of Crook Types for Unbarked Norway Spruce Sawlogs by Means of a 3D Log Scanner. Holz Als Roh- Und Werkst. 2001, 59, 374–379. [Google Scholar] [CrossRef]
- Edlund, J.; Warensjö, M. Repeatability in Automatic Sorting of Curved Norway Spruce Saw Logs. Silva Fenn. 2005, 39, 265–275. [Google Scholar] [CrossRef][Green Version]
- Wang, X.; Thomas, E.; Xu, F.; Liu, Y.; Brashaw, B.K.; Ross, R.J. Defect Detection and Quality Assessment of Hardwood Logs: Part 2—Combined Acoustic and Laser Scanning System. Wood Fiber Sci. 2018, 50, 310–322. [Google Scholar] [CrossRef]
Disclaimer/Publisher’s Note: The statements, opinions and data contained in all publications are solely those of the individual author(s) and contributor(s) and not of MDPI and/or the editor(s). MDPI and/or the editor(s) disclaim responsibility for any injury to people or property resulting from any ideas, methods, instructions or products referred to in the content. |
© 2025 by the authors. Licensee MDPI, Basel, Switzerland. This article is an open access article distributed under the terms and conditions of the Creative Commons Attribution (CC BY) license (https://creativecommons.org/licenses/by/4.0/).