Article

Interference of Edaphoclimatic Variations on Nondestructive Parameters Measured in Standing Trees

1
Laboratory of Nondestructive Testing (LabEND), School of Agricultural Engineering (FEAGRI), Universidade Estadual de Campinas (UNICAMP), Campinas 13083-875, São Paulo, Brazil
2
Valora Madeira Ltda., Campinas 13083-876, São Paulo, Brazil
3
Sylvamo do Brasil, Mogi Guaçu 13840-970, São Paulo, Brazil
*
Author to whom correspondence should be addressed.
Forests 2025, 16(3), 535; https://doi.org/10.3390/f16030535
Submission received: 10 January 2025 / Revised: 20 February 2025 / Accepted: 26 February 2025 / Published: 19 March 2025

Abstract

:
The diversity of commercial tree planting sites, with their distinct environmental conditions, directly influences tree growth and consequently impacts the wood properties in various ways. However, there is limited research evaluating the impact of these variations in nondestructive testing. Therefore, this study aimed to investigate whether edaphoclimatic variations affect parameters obtained through nondestructive tests conducted on standing trees. To this end, 30 specimens were selected from 3 Eucalyptus sp. clones, aged 1, 3, and 4 years, grown in 2 regions, totaling 540 trees. Tree development was monitored quarterly over 12 months. The tests included ultrasound propagation, drilling resistance, and penetration resistance, and the trees were measured for diameter at breast height (DBH) and height. Among the edaphoclimatic factors evaluated, only temperature and soil water storage differed statistically between the two study regions. The higher temperature and lower soil water storage in region 2 promoted tree growth, with these trees showing greater drilling resistance and higher longitudinal wave velocities. In addition, the influence of climatic factors was evidenced by the variation of wave propagation velocity throughout the year. Periods of lower water availability resulted in higher velocities, while periods of greater precipitation were associated with lower velocities. The research results showed that temperature and soil water storage had significant effects on tree growth (DBH and height), as well as ultrasound wave propagation velocity and drilling resistance.

1. Introduction

Trees are influenced during their growth by climatic variation, forest management practices, and genetic material [1,2,3], which can alter their physical, chemical, anatomical and mechanical characteristics. The impact of edaphoclimatic conditions on wood quality traits has been demonstrated in research on various Eucalyptus sp. hybrids. Environmental variation in precipitation, temperature, and soil characteristics at growing sites have revealed significant changes in tree development, such as diameter and height growth, and in annual mean increment, including basic density [4,5,6,7] anatomical properties [8,9], and the dynamic modulus of elasticity in plantations [4].
Nondestructive testing (NDT) aims to obtain information about the properties of materials, such as physical and mechanical traits, without altering their usability [10]. The advantages of such testing include low cost, efficiency, and the possibility of evaluating structures without removing them [11]. While the use of NDT in analyzing structural wood components is well established, research on standing trees remains a focus of the forestry sector due to the promising results obtained for inferring wood properties [12].
Prominent among NDT methods used to predict wood properties in trees are drilling and penetration resistance measurements, commonly with tools like the resistograph [13,14,15] and Pilodyn [16,17,18]. In addition, acoustic wave propagation methods, which correlate sound transmission velocity in the material with its properties—particularly stiffness—are also widely used, such as ultrasound testing [19,20].
The resistograph can record torque variations corresponding to structural changes in wood cells and the effects of the tree’s growth conditions [21]. These records are presented as drilling resistance, referred to as amplitude, and expressed as a percentage. Pilodyn, in turn, consists of a metal pin driven into the tree with a specific force. The penetration depth of the steel pin into the wood is displayed on the device itself. While it does not provide an estimate of the actual density of the tested wood, it offers a measure of relative density, making it useful for classifying genetic units related to wood density, such as clones, families, seed lots, and provenances [22]. Numerous studies using these tools have yielded satisfactory results, especially in predicting the basic wood density of various clones of the genus Eucalyptus [2,18,23,24].
Ultrasound wave propagation involves equipment that emits waves at frequencies above 20,000 Hz. The wave velocity through the material is determined by measuring the propagation time. The physical and mechanical properties of the material being tested may affect wave propagation. Therefore, this technique is particularly noteworthy for determining and predicting the mechanical properties of materials through testing conducted on standing trees or specimen samples. Inferences about wood quality are also made possible [25,26,27,28,29].
Studies conducted on wood boards to evaluate the effect of moisture on the propagation velocity of acoustic waves showed that above the fiber saturation point (FSP)—the moisture level at which the wood exists in the tree—variations in velocity were gradual and exhibited a curvilinear pattern [30]. On the other hand, a study investigating the effect of seasonal temperature changes on acoustic velocity measured in standing trees indicated that ambient temperature had a significant impact on acoustic velocity when temperatures were below the freezing point [31]. The same study showed that above the freezing point, acoustic velocities became less sensitive to ambient temperature variations.
Thus, considering the potential of nondestructive testing to infer wood properties and the fact that such properties can be influenced by the environmental conditions to which trees are exposed, this study aimed to investigate whether edaphoclimatic variations affect the parameters obtained through nondestructive testing conducted on standing trees. Three clones of Eucalyptus sp., with varying ages, grown in two regions with distinct soil and climate conditions, were selected for the study. The development of the trees was monitored by means of non-destructive tests for a period of 12 months. The results were statistically evaluated to verify the behavior of the dependent variables (test data obtained on standing trees) in relation to the different factors inherent to the sampling used (clone, age, reading, and region), mainly in relation to the location where the trees grew (soil and climate characteristics).

2. Materials and Methods

2.1. Material

A partnership was set up for the development of the research with a company in the pulp and paper sector, which provided three hybrid clones of Eucalyptus grandis W. Hill and Eucalyptus urophylla S.T. Blake grown in two regions (R1 and R2), with basic densities of 0.48 g·cm−3—A, 0.43 g·cm−3—B, and 0.37 g·cm−3—C. The selection of clones for the study was made based on the partner company’s interest in obtaining information about these cultivars. A total of 30 individuals (selected randomly and avoiding specimens located on the edges of the plot) from each clone (A, B, and C), age group (1, 3, and 4 years), and region (R1 and R2) were selected, totaling 540 specimens, which were then monitored for development over a 12-month period.

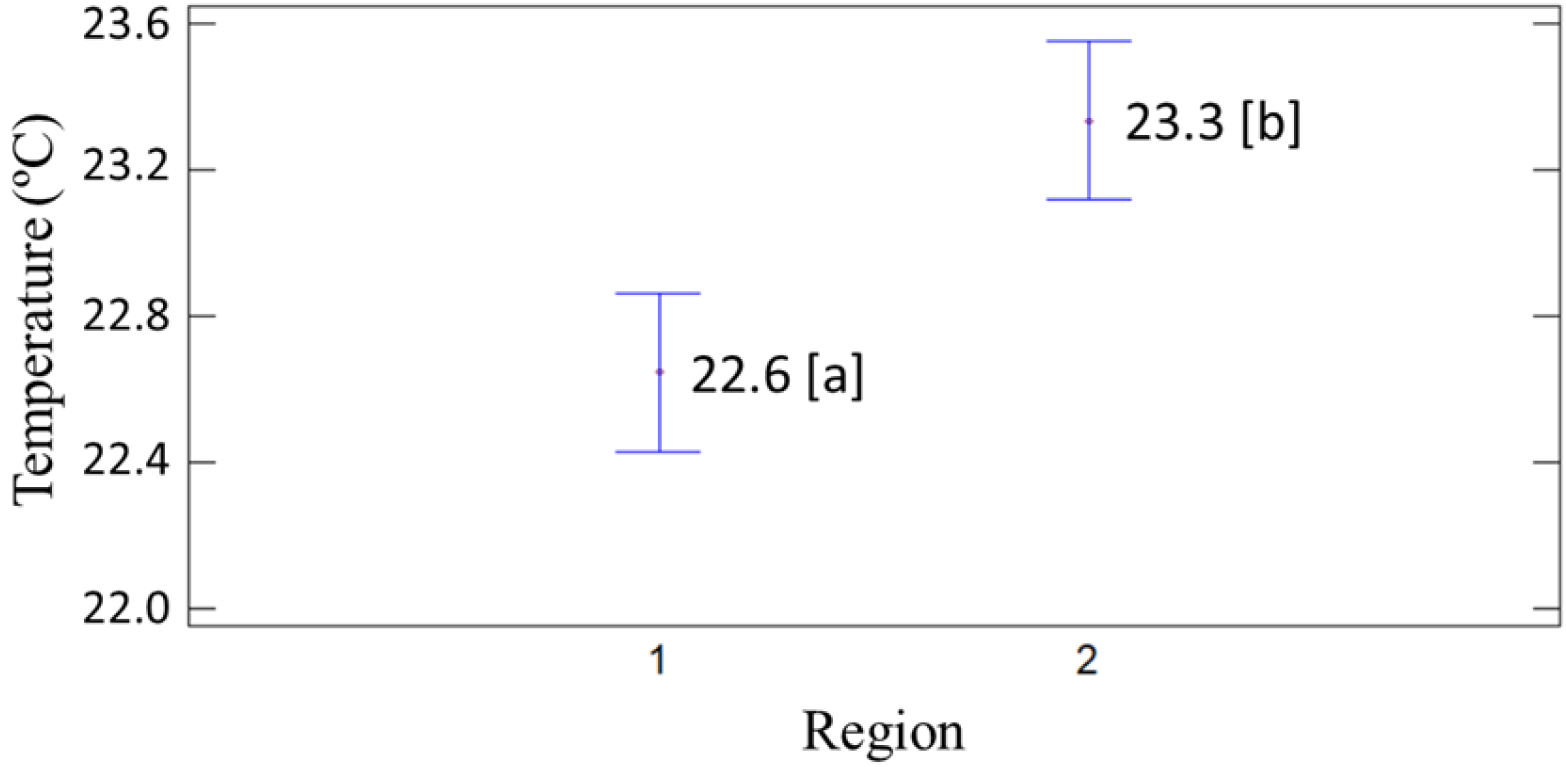
2.2. Region Characterization (R1 and R2)
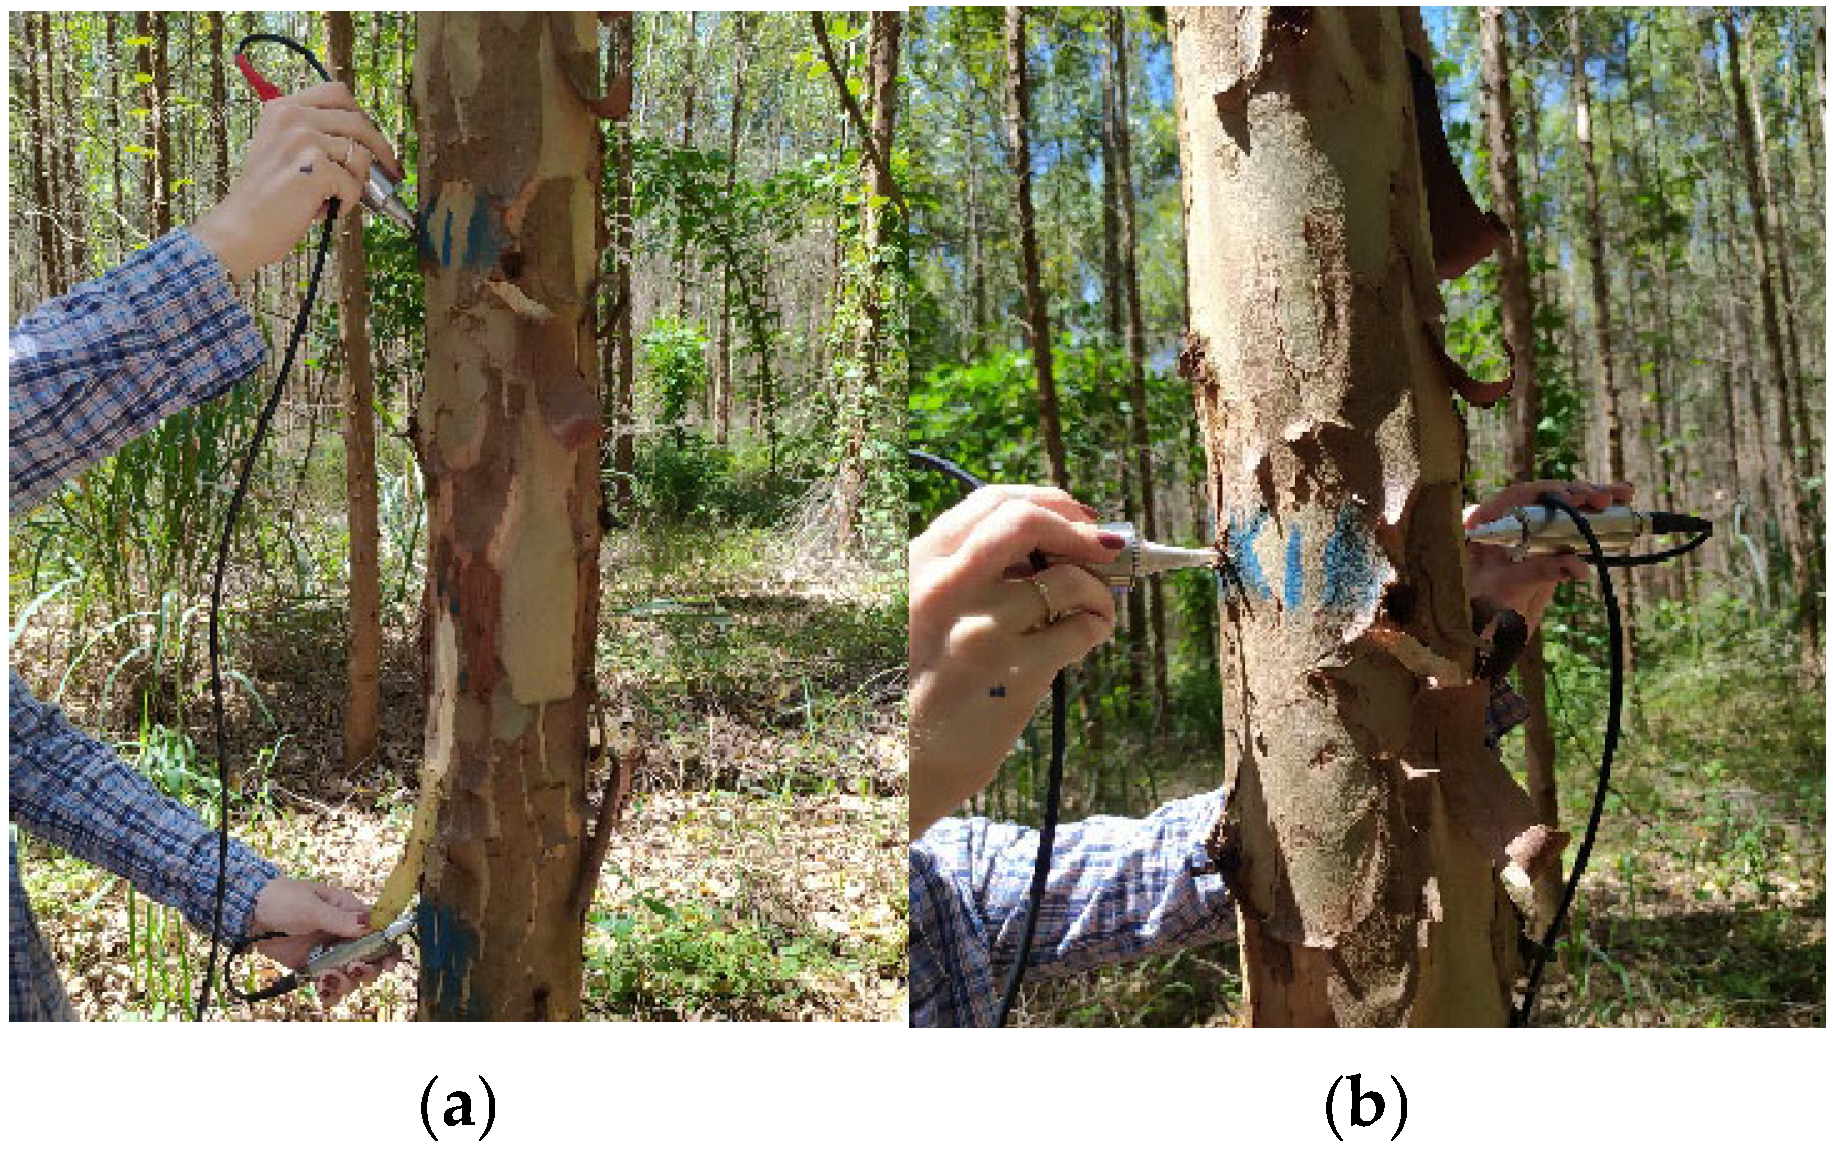
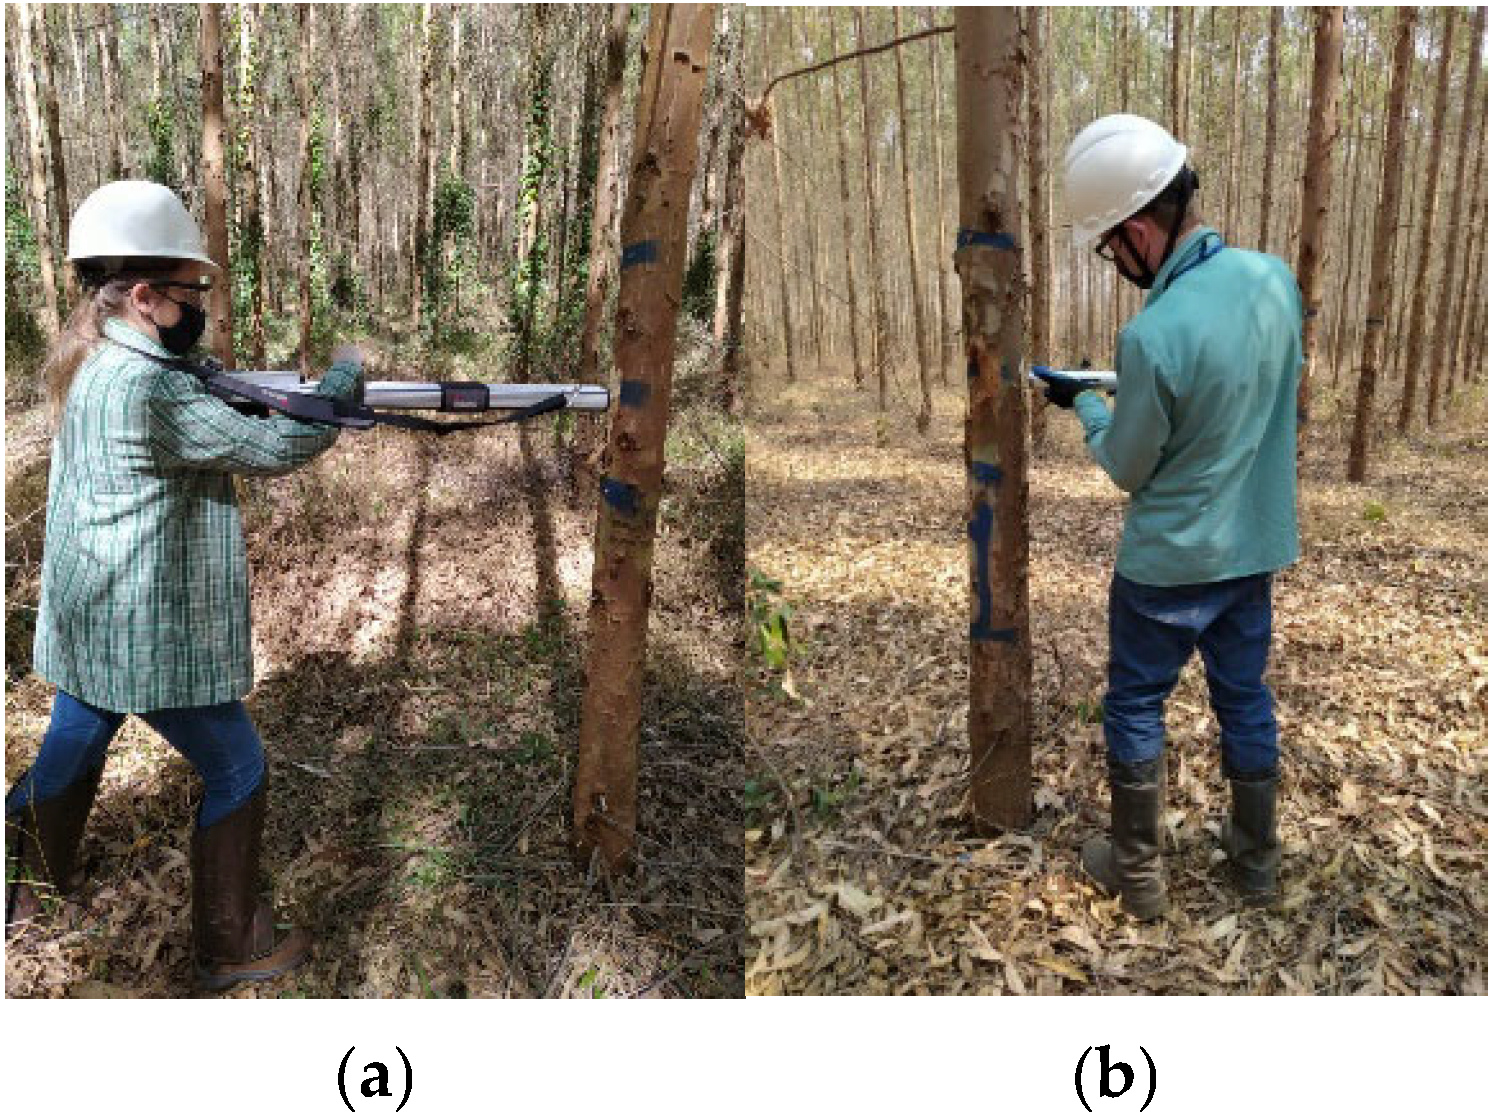
The evaluated individuals were located in two distinct regions (R1 and R2). The first region (R1), near Mogi Guaçu (22.3° S, 46.9° W) in the inland state of São Paulo, has a humid subtropical climate with dry winters and hot summers (Cwa), according to the Köppen classification. In this region, rainfall is significantly distributed throughout the year, with a rainy season from November to March and a dry season between June and August (Figure 1). The predominant soil type is oxisol, typical of tropical and subtropical areas.
The second region (R2) is close to the city of Tambaú (21.7° S, 47.3° W), also in the state of São Paulo. According to Köppen, the climate in this region is humid subtropical with dry winters and mild summers (Cwb), with a rainy season from December to February and a dry season from May to September (Figure 1). The predominant soil type in this region is entisol.
The forestry company associated with the study regularly collects climate data from different sources and provided us with information corresponding to the period of the nondestructive field tests (May 2021 to March 2022). These include mean temperature, monthly accumulated precipitation, global radiation, pressure deficit, actual evapotranspiration, soil water storage, and water deficit.
Considering the acquisition of edaphoclimatic data carried out by the forestry company, it was important to verify whether there was a statistical difference between these parameters in the study regions (R1 and R2), as this would make it possible to justify which of these characteristics could be influencing the non-destructive parameters obtained in the field (dependent variables). In assessing the p-value results for the edaphoclimatic parameters of the two regions, obtained through multivariate variance analysis, it was observed that only mean temperature and soil water storage showed statistically significant differences between the two regions (R1 and R2), as their p-values were below 0.05 (Table 1).
Considering the mean temperature of the two regions during the study period (2021 and 2022), region 2 recorded 23.4 °C, while region 1 recorded 22.7 °C (Figure 2). According to Flores et al. [32], the annual mean temperature required by Eucalyptus grandis, one of the most widely planted species in Brazil, ranges between 15 and 22 °C. Therefore, both regions presented suitable temperature conditions for the growth of the individuals.
Regarding soil water storage, region 1 showed higher values for this parameter (Figure 3). This is attributed to the differences in the typical soil characteristics of each region. In region 1, oxisols are predominant, characterized by smaller particles formed through intense weathering [33]. These finer particles enhance water adhesion to their surface, increasing the soil’s water storage capacity. In contrast, region 2 is dominated by entisols, which are sandier and composed of larger particles (more resistant to weathering). Due to the size of these particles, there is greater water runoff, resulting in a lower water storage capacity [33].

2.3. Field Tests

The selected trees were submitted to ultrasound, drilling resistance, and penetration resistance tests and measured for diameter at 1.30 m from the ground (DBH) and height. In addition, information on edaphoclimatic characteristics (mean temperature, monthly accumulated precipitation, global radiation, pressure deficit, actual evapotranspiration, soil water storage, and water deficit) during the research period was collected. The tests were carried out in May 2021 (reading 1), August 2021 (reading 2), December 2021 (reading 3), and March 2022 (reading 4).
To determine the wave propagation velocity in the trees, an ultrasound test was conducted using an ultrasound device (USLab, Valora Madeira Ltda., Campinas, SP, Brazil) with 45 kHz exponential face transducers. The ultrasound tests were performed using two methods: indirect, with longitudinal orientation and transducers inclined at 45° and positioned on the same side of the trunk (Figure 4a); and direct, with radial orientation and transducers positioned on opposite sides of the trunk (Figure 4b). By using the wave propagation time obtained from the ultrasound device and the distance (D) between the transducers during the test (D = 0.5 for the indirect test and D = DBH for the direct test), it was possible to calculate the wave propagation velocity in the radial orientation (VR) and in the longitudinal orientation (VL) (Equation (1)).
V = D t
In which D is the distance in meters between the transducers during the tests and t is the wave propagation time identified by the equipment in microseconds.
Drilling resistance was obtained by using a resistograph (Resi PD Series 500 IML—Instrumenta Mechanik Labor, Wiesloch, Germany), with diameter measurements taken at perpendicular positions at a height of 1.30 m from the ground, following the methodology described by Isik and Li [34] (Figure 5a). This test yielded the drilling amplitude, which is directly related to the resistance that the wood offers to the penetration of the 3-mm thick needle. Penetration resistance was obtained with the use of the Pilodyn (6J, PROCEQ SA., Schwerzenbach, Switzerland), with two measurements made per tree, one on the north face and the other on the south face (Figure 5b). Unlike the other tests, Pilodyn measurements were only performed in May 2021 (reading 1), August 2021 (reading 2), and March 2022 (reading 4) due to the availability of the equipment.
Tree height was measured by using a hypsometer (Vertex IV, Haglöf, Långsele, Sweden), and diameter growth was monitored with a measuring tape at a height of 1.30 m from the ground (DBH).

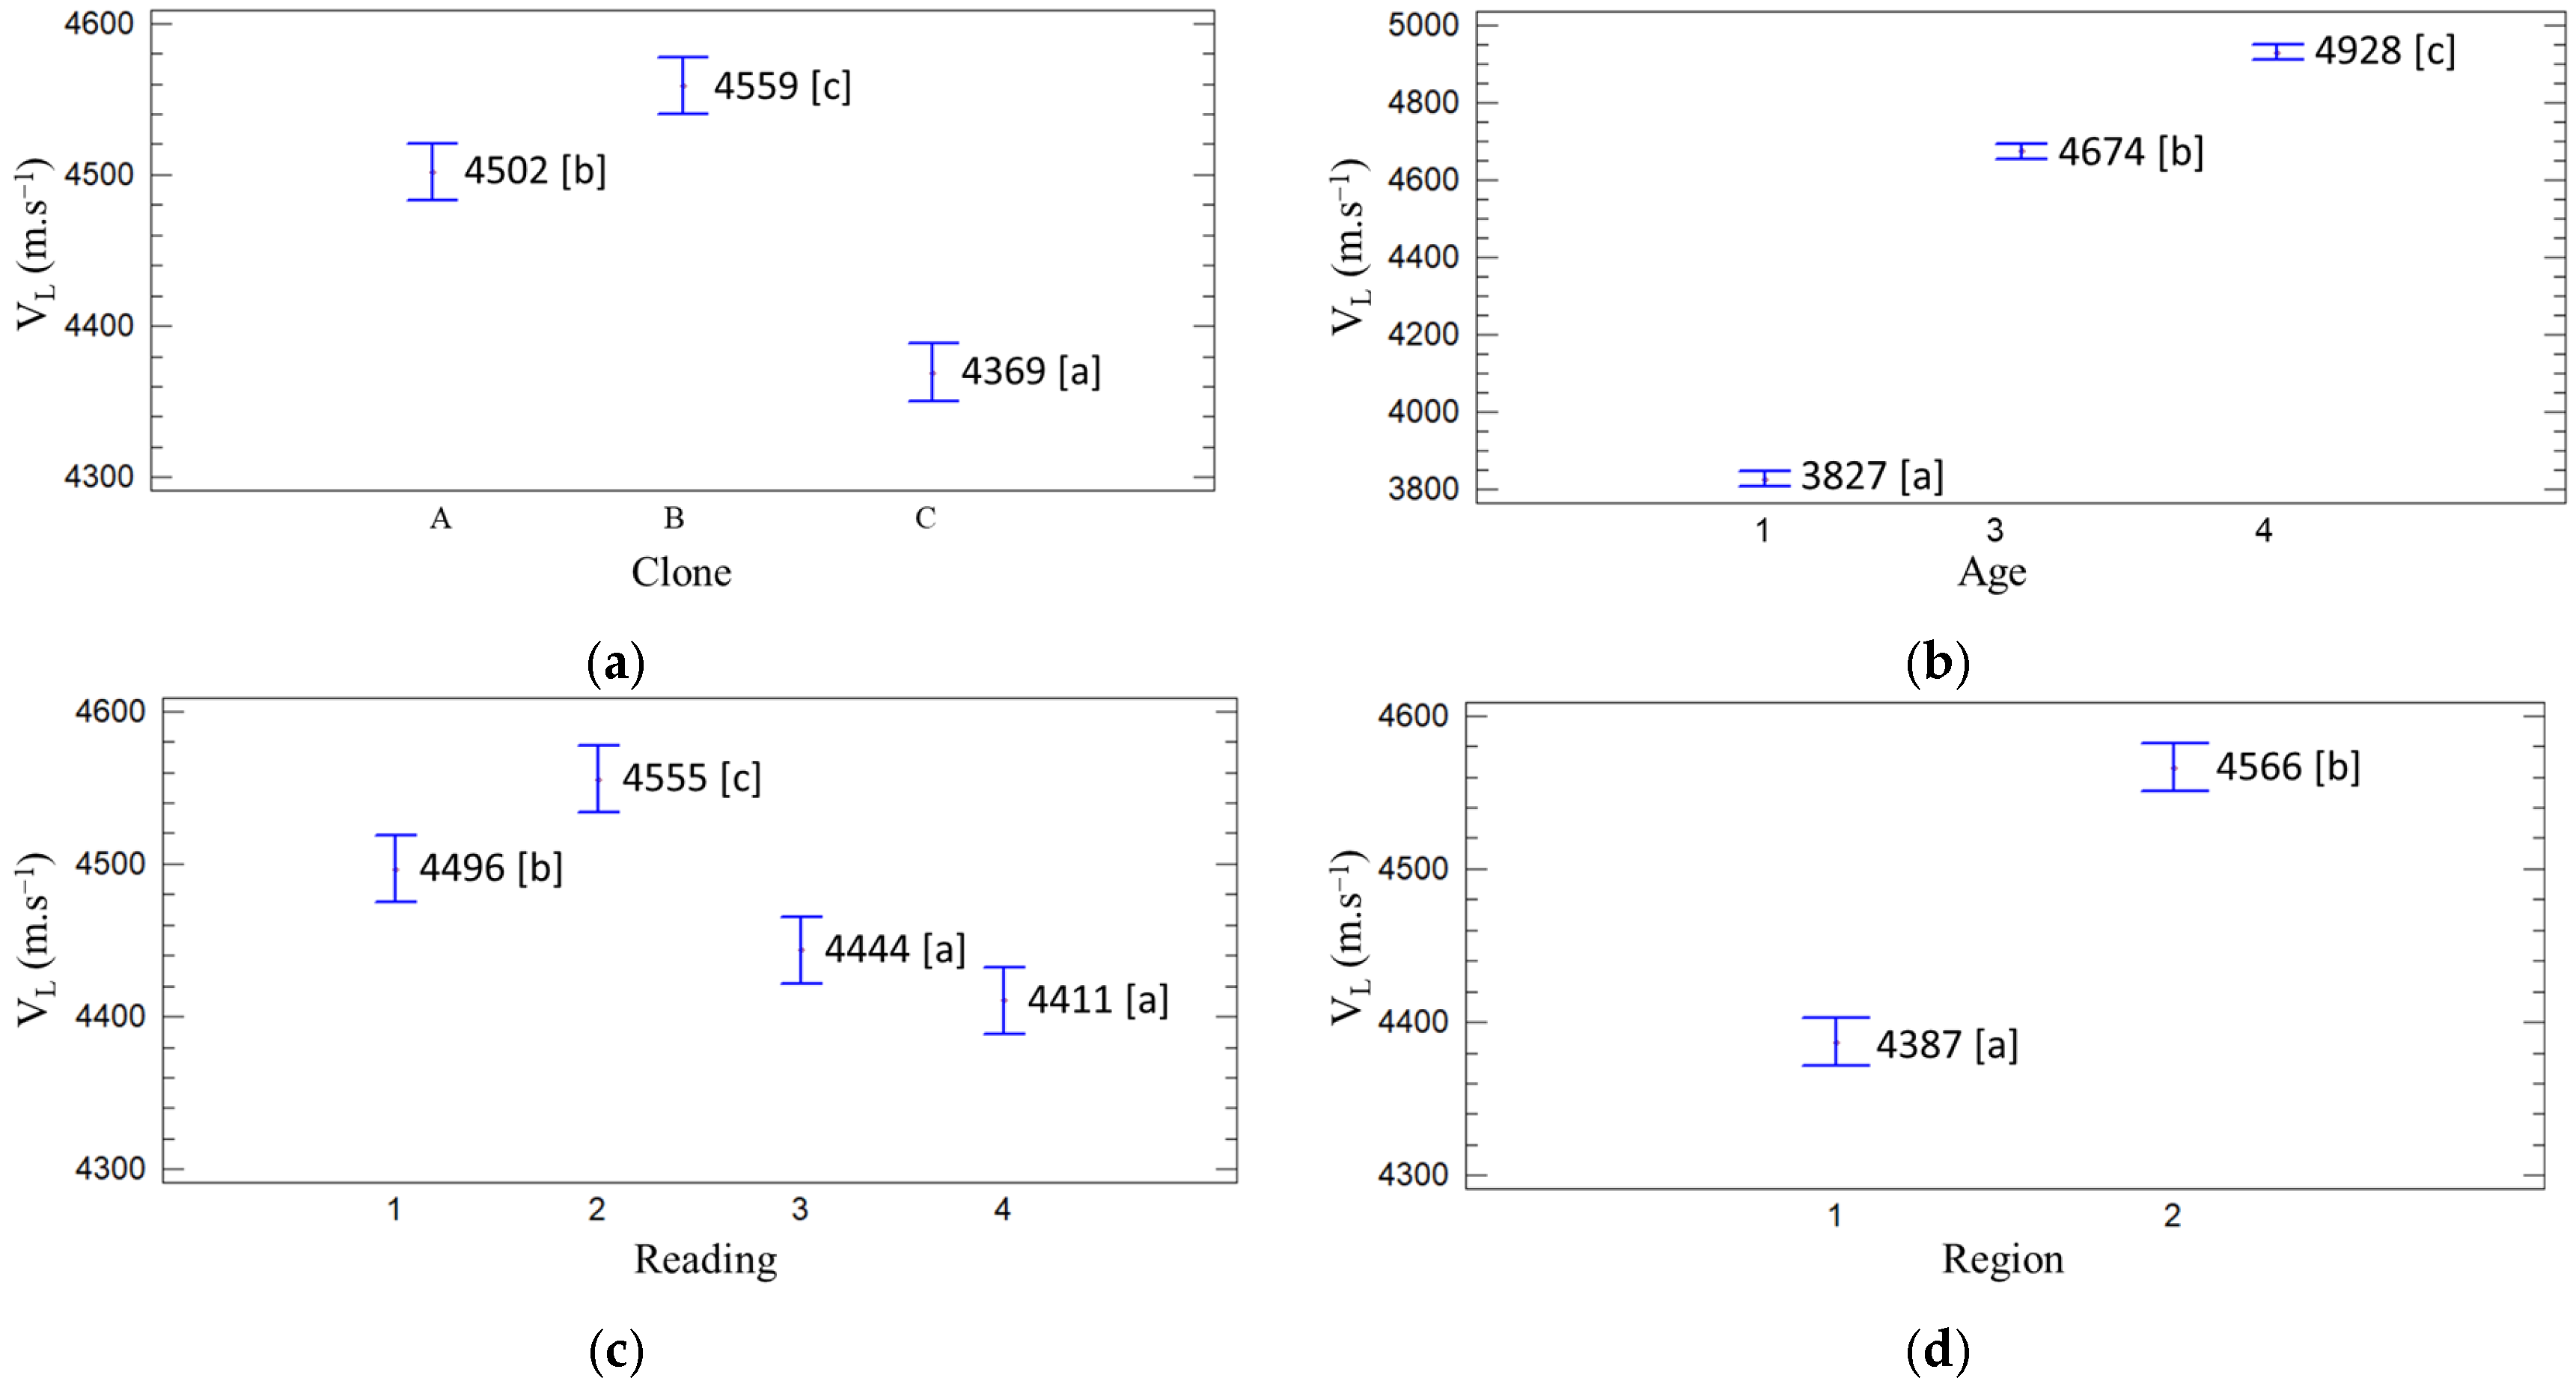
2.4. Analysis of Results

The results obtained from the tests were first evaluated in relation to normality, to ensure the feasibility of using parametric statistics. For data analysis, multivariate ANOVA (MANOVA) was used, which allowed simultaneous analysis of the independent variables (longitudinal and radial velocities, drilling resistance, penetration depth, DBH, and height) in relation to the four factors studied (regions, clones, ages, and readings) in an integrated manner, reducing the risk of type I error, which would be increased in the case of multiple univariate tests (ANOVA). After performing MANOVA, the Multiple Range Test was used to compare the means of the parameters of each factor in relation to each of the dependent variables. This test was used to identify significant differences between the levels of the factors, complementing the results of MANOVA.

3. Results and Discussion

In general, the results of the multivariate analysis of variance, considering each parameter obtained from the field tests (longitudinal velocity, radial velocity, amplitude, penetration depth, DBH, and height) and the different factors (region, clone, age, and reading), showed p-values lower than 0.05. This indicates that there were statistically significant differences in the field parameters concerning the evaluated factors, with 95% confidence.
The results for longitudinal velocity (VL) across the different clones showed that clone B had the highest figure for this parameter, while clone C had the lowest (Figure 6a). When the ultrasound test is performed in the longitudinal orientation, the waves travel in the same direction as the fibers. According to the study by Duong et al. [35], fiber length is positively correlated with velocity, indicating that these clones probably differ in terms of fiber characteristics, with longer fibers leading to higher longitudinal velocity.
Regarding the longitudinal velocity results based on the age of the tested trees, an increase in this parameter’s values was observed with age. The most significant increase occurred between 1 and 3 years (18%), while the lowest increase was between 3 and 4 years (5%—Figure 6b). As the trees grow, the wood develops characteristics of mature tissue, such as longer fibers and thicker cell walls [36], leading to better ultrasound wave propagation and higher velocities [37].
Considering the different longitudinal ultrasound readings taken throughout the year, it was observed that, contrary to expectations, velocity did not increase over time (from reading 1 to reading 4). The velocity values varied according to water availability, as indicated by the volume of precipitation. Reading 2, taken during a period of lower precipitation (August 2021), had the highest mean velocity values, while reading 4, taken during a period of higher water availability (May 2022), showed the lowest velocity values (Figure 6c). In evaluating the mean longitudinal velocity (VLm) values by clone, age, and region, it was found that for the 1-year-old clones, VLm values mostly increased from the first to the fourth reading, except for clone C grown in region 2 (Table 2). Regarding mean percentage differences between the second and fourth readings, for region 1, the longitudinal velocity in the fourth reading was 7.3% lower than in the second reading, while for region 2, this difference was 10.3% (Table 2). According to Bucur [37], water stress exacerbates cavitation issues in the xylem, which supports the study by Peña and Grace [38], who observed a reduction in ultrasound velocity after a period of water stress, attributed by the authors to the effects of cavitation in the xylem cells.
In comparing the longitudinal ultrasound velocities of the trees grown in the two regions, it was observed that, on average, the values of trees from region 1 were 4% lower than those of trees grown in region 2 (Figure 6d). Given that longitudinal velocity is directly related to wood stiffness [37], the edaphoclimatic conditions in region 2 probably favored the increase of this property.
As tree tissue matures over time [36], ultrasound velocities are expected to increase with tree age, as observed for longitudinal velocity (Figure 6b). However, this was not the case for radial velocity (VR) in this study, in which 1-year-old trees showed velocities about 20% higher than 3- and 4-year-old trees. For the latter two ages, a 3% increase in radial velocity was observed (Figure 7). This behavior can be explained by the fact that the theoretical aspects of wave propagation in infinite media were not met for the radial wave propagation test in trees with smaller diameters, such as the 1-year-old specimens, which have an average DBH of 0.068 m.
For propagation to occur in infinite media, the distance between transducers (DBH) should be several times greater than the wavelength (λ). For wood, some researchers [37,39,40] indicated values ranging from 2λ to 5λ for this condition to be met. This required checking the velocity ratio (VR/VL) for the 3- and 4-year-old trees, as VR for the 1-year-old specimens could have been affected. The velocity ratio varied from 0.37 to 0.42 for the different clones, and since the highest ratio would result in higher velocity values, 0.42 was used to predict the radial velocity for the 1-year-old trees (VR = 1608 m·s−1). Thus, it was possible to ascertain that, when using the 45 kHz frequency transducer (f), the wavelength (λ = V/f) for the radial ultrasound test is 0.036 m. In other words, there are fewer than two wavelengths passing through the material, which justifies the very high VR figures in 1-year-old trees. Considering this outcome, the 1-year-old specimens were excluded from the subsequent analyses.
In evaluating radial velocity in the different clones used in the study, we found that the velocities for clone A were 6.7% higher on average than for clone B, while mean radial velocities for clone B were 10.6% higher compared to clone C (Figure 8a). In radial wave propagation, the waves travel through the cell walls, and their thickness is directly related to the propagation velocity of ultrasound waves [37], as well as to wood density [36]. Therefore, the radial velocity results in the different clones align with their respective basic density values (A—0.48 g·cm−3, B—0.43 g·cm−3, and C—0.37 g·cm−3).
Regarding the radial velocities according to the different readings taken throughout the year, they followed the same pattern as the longitudinal velocities, in which the second reading, during the period of greatest water restriction, had the highest mean figures, and the fourth reading, during the rainiest period, had the lowest velocities (Figure 8b). In evaluating the mean radial velocity (VRm) by clone, age, and region, it is observed that in all cases, the velocity in the second reading was higher compared to the fourth reading (positive values for the percentage difference between the second and fourth readings—Table 3). On average, the percentage difference between the second and fourth readings for region 1 showed a 14.7% decrease in radial velocity in the fourth reading compared to the second, while for region 2 this difference was 11.1% (Table 3). Radial velocity was more influenced by variation in wood moisture content than longitudinal velocity (Table 2 and Table 3).
In evaluating the differences in radial velocity of trees grown in the two regions, it was observed that there was no statistically significant difference between the trees grown in regions 1 and 2 (Figure 8c).
Analysis of drilling amplitude shows differences between the clones, with the highest resistance figures associated with clone A (Figure 9a), which also presented higher values for radial velocity and basic density, similar to what was found in other studies [18,23,34].
An increase in tree density is expected over time [36], so older individuals should show higher resistance. Therefore, drilling resistance increased with age and also with the chronological order of the field tests (Figure 9b,c).
In analyzing the difference in the parameter obtained for trees located in the two regions, it was found that the highest values (15% higher) were observed in the specimens from region 2, indicating that these trees have greater drilling resistance [13] (Figure 9d).
In analyzing the penetration depth data according to tree age, it was observed that the younger trees (1 year) had lower penetration depths compared to the 3-year-old trees, with statistically significant difference when compared to the 4-year-old trees (Figure 10). However, basic density would be expected to gradually increase with tree age, resulting in lower penetration depths, as was found in the research by Stackpole et al. [41]. Lower wood stiffness in very young trees may lead to trunk deformations during the Pilodyn impact, which can reduce the penetration depth of the pin. A study using a scleroscope, which operates on the same principle as the penetration test, highlights the importance of securing the wood test specimens to prevent movement during the impact, thereby ensuring the integrity of the data obtained [42]. In light of this result, the 1-year-old specimens were removed from the subsequent analyses.
The penetration depth data showed differences between the clones, with clone A having the lowest figures for penetration depth (8% and 21% lower than clones B and C, respectively—Figure 11a). According to Gouvêa et al. [18], the denser the wood, the lower the penetration depth, meaning that clone A can be considered the densest among the studied clones, followed by clones B and C (Figure 11a). Thus, the result followed the pattern of basic density presented by each clone, similar to the results for radial velocity and drilling resistance (Figure 8a and Figure 9a).
The sequence of readings presented the expected pattern, with decreasing values for penetration depth over time. Therefore, reading 4 (March 2022) showed the lowest figures for this parameter (Figure 11b).
In evaluating the differences in penetration depth for trees grown in the two regions, it was observed that, as with the radial velocity results, there was no statistically significant difference between the trees grown in regions 1 and 2.
In analyzing tree growth in relation to DBH, it was observed that the mean diameter was 15% higher for clone C compared to clones A and B, which showed no statistical difference between them (Figure 12a).
Concerning DBH in relation to tree age, no statistical difference in diameter was found between 3- and 4-year-old individuals, most likely because the tests were conducted on different samples for each age. However, their diameters were approximately 60% higher than the mean DBH of the 1-year-old clones (Figure 12b). The tree diameter measurements, obtained from readings conducted at different times throughout the year, followed the expected pattern, showing a gradual increase in DBH over time. The mean growth during the measurement period was 14%, with the largest increases recorded in the last two readings, approximately 5.5% in each of those periods (Figure 12c).
The difference between regions was significant for diameter growth, with higher DBH values (4.2% higher) found in the trees from region 2. Therefore, edaphoclimatic differences between the regions influenced the growth of these trees (Figure 12d).
As with DBH, tree height growth was greater for clone C compared to clones A and B (17.6% and 7.5%, respectively—Figure 13a). Height behavior by tree age was similar to that observed for DBH. No statistical differences for this parameter were found in specimens aged 3 to 4, whose heights were more than double the height of the 1-year-old clones (Figure 13b). As for the order of the readings, they followed the expected pattern, with an increase in this value throughout the year (Figure 13c). The mean height growth during the measurement period was 16.6%, with the largest increase recorded in the last period, between readings 3 and 4 (9.3%), followed by the previous period, which showed an increase of 5.1%.
Regarding tree height by growing region, it was observed that the trees grown in region 2 were about 3% taller than those from region 1, indicating once again that the differences in edaphoclimatic conditions of the regions influenced tree growth (Figure 13d).
Faster-growing trees show different anatomical and physical characteristics of wood compared to slower-growing trees [43]. Typically, fast-growing trees have low wood density [44], which is influenced by numerous anatomical structures, such as fiber length, lumen diameter, and cell wall thickness [43]. Zobel and Buijtenen [45] mention that there is generally no relationship between fiber length and growth in height and diameter, although studies have reported a connection between faster height growth and longer fibers. Longer fibers were also found in conifers in environments with higher temperatures. Therefore, the higher longitudinal velocities for trees in region 2 (Figure 6d) may be associated with the longer fiber length of trees due to greater height and diameter growth compared to region 1. In addition, as in the studies cited by Zobel and Buijtenen [45], the higher temperature in region 2 (Figure 2) favored the development of trees grown in this area (Figure 12d and Figure 13d).
Regarding resistance parameters, the trees grown in region 2 showed higher drilling resistance, similar to the longitudinal velocity and growth parameters (DBH and height). On the other hand, the growing region of the trees showed no significant influence on penetration resistance. Variations in the resistograph results occur due to changes in the cell structures of the wood and the effects of growth, considering the entire diameter of the tree [21]. In contrast, the penetration depth of the Pilodyn is only related to the structure of the outermost cells of the cambium [22]. Variations in cell structures are also linked to the availability of water in the environment. In the study by Câmara et al. [8], in environments with greater water restriction, the xylem vessels were wider, with thicker walls, but with fewer vessels, contributing to higher basic density [36]. One of the eucalyptus clones evaluated by Rocha et al. [5] showed a statistically significant correlation between basic density and parameters such as temperature, and it was found that the increase in these parameters led to an increase in basic density. Therefore, an environment with lower water availability (Figure 3) and higher temperature (Figure 2) may explain the higher drilling resistance in the trees from region 2.
Considering the influence of the small diameter and low rigidity of very young trees, such as the 1-year-old specimens that were part of the research sample, on the direct ultrasound and depth penetration tests, respectively, it is recommended that these be carried out only on trees over 3 years old.

4. Conclusions

For this study, seven edaphoclimatic conditions present in the two cultivation regions of the clones included in the research were evaluated during the field test period. However, only two of them, temperature and soil water storage, showed statistically significant differences between the locations. Through multivariate analysis of variance, in comparing the results of the parameters across the cultivation regions, it was found that the higher temperatures and lower soil water storage in region 2 favored tree growth, leading to higher drilling resistance and greater longitudinal velocities. In addition, the influence of climatic factors was also evident in the variation of wave propagation velocity readings taken throughout the year. Water availability, indicated by precipitation volume, influenced ultrasound velocity, with higher velocities observed during periods of lower water availability, while lower velocities were obtained during times of higher precipitation. Thus, the influence of edaphoclimatic parameters on tree growth, as well as on ultrasound wave propagation velocity and drilling resistance, was clearly demonstrated. Given that the measurement of tree diameter and height, as well as the ultrasound tests (longitudinal/indirect) and penetration resistance tests used in this research, proved to be sensitive to interference from edaphoclimatic variations among different cultivation locations, these same tests can be applied to other species and regions to detect the effects of such variations on the wood being produced.

Author Contributions

Conceptualization, C.B. and K.F.; methodology, C.B.; formal analysis, C.K.; C.B. and R.L.; resources, C.B. and K.F.; data curation, C.K. and R.L.; writing—original draft preparation, C.K. and C.B.; writing—review and editing, C.K. and C.B.; visualization, R.L. and K.F.; supervision, C.B.; project administration, C.B.; funding acquisition, C.B. All authors have read and agreed to the published version of the manuscript.

Funding

This research was funded by the National Council for Scientific and Technological Development—Brazil (CNPq), grant number 425076/2018-0.

Data Availability Statement

The datasets presented in this article are not readily available due to a confidentiality agreement signed with the partner company. This agreement restricts the disclosure of certain proprietary and sensitive data belonging to the company. Requests to access the datasets should be directed to cinthyab@unicamp.br, and access will be evaluated on a case-by-case basis in compliance with the confidentiality terms.

Acknowledgments

We would like to thank Sylvamo do Brasil for providing research material, especially the collaborators of Forest Research and Fernanda Trisltz Perassolo Guedes. We would like to thank the members of the Non-Destructive Testing Laboratory (LabEND) for their collaboration.

Conflicts of Interest

Author Rafael Lorensani was employed by Valora Madeira Ltda. Author Karina Ferreira was employed by Sylvamo do Brasil. The remaining authors declare that the research was conducted in the absence of any commercial or financial relationships that could be construed as a potential conflict of interest.

References

  1. Câncio, O.N. Qualidade da Madeira de Eucalipto Para Produção de Celulose e sua Influência na Formação de Florestas Industriais. Master’s Thesis, Universidade Federal de Viçosa, Viçosa, Brazil, 2003. [Google Scholar]
  2. De Gomes, A.F. Avaliação das Características da Madeira e da Polpa de Eucalyptus Mediante a Aplicação de Métodos não Destrutivos na Árvore Viva. Master’s Thesis, Universidade Federal de Lavras, Lavras, Brazil, 2007. [Google Scholar]
  3. Foelkel, C. Qualidade da Madeira do Eucalipto—Reflexões Acerca da Utilização da Densidade Básica Como Indicador de Qualidade da Madeira no Setor de Base Florestal. Eucalyptus Online Book & Newsletter. Capítulo 41. 2015. Available online: https://www.eucalyptus.com.br/eucaliptos/PT41_Densidade_Basica_Madeira.pdf (accessed on 25 February 2025).
  4. Balasso, M.; Hunt, M.; Jacobs, A.; O’reilly-Wapstra, J. Characterization of wood quality of Eucalyptus nitens plantations and predictive models of density and stiffness with site and tree characteristics. For. Ecol. Manag. 2021, 491, 118992. [Google Scholar] [CrossRef]
  5. Rocha, S.M.G.; Vidaurre, G.B.; Pezzopane, J.E.M.; Almeida, M.N.F.; Carneiro, R.L.; Campoe, O.C.; Scolforo, H.F.; Alvares, C.A.A.; Neves, J.C.L.; Xavier, A.C.; et al. Influence of climatic variations on production, biomass and density of wood in eucalyptus clones of different species. For. Ecol. Manag. 2020, 473, 118290. [Google Scholar] [CrossRef]
  6. Almeida, M.N.F.; Vidaurre, G.B.; Pezzopane, J.E.M.; Lousada, J.L.P.C.; Silva, M.E.C.M.; Câmara, A.P.; Rocha, S.M.G.; Oliveira, J.C.L.; Campoe, O.C.; Carneiro, R.L.; et al. Heartwood variation of Eucalyptus urophylla is influenced by climatic conditions. For. Ecol. Manag. 2019, 458, 117743. [Google Scholar] [CrossRef]
  7. de Costa, S.E.L.; do Santos, R.C.; Vidaurre, G.B.; Castro, R.V.O.; Rocha, S.M.G.; Carneiro, R.L.; Campoe, O.C.; Santos, C.P.d.S.; Gomes, I.R.F.; de Carvalho, N.F.O.; et al. The effects of contrasting environments on the basic density and mean annual increment of wood from eucalyptus clones. For. Ecol. Manag. 2019, 458, 117807. [Google Scholar] [CrossRef]
  8. Câmara, A.P.; Vidaurre, G.B.; Oliveira, J.C.L.; de Picoli, E.A.T.; Almeida, M.N.F.; Roque, R.M.; Tomazello Filho, M.; Souza, H.J.P.; Oliveira, T.R.; Campoe, O.C. Changes in hydraulic architecture across a water availability gradient for two contrasting commercial Eucalyptus clones. For. Ecol. Manag. 2020, 474, 118380. [Google Scholar] [CrossRef]
  9. Câmara, A.P.; Vidaurre, G.B.; Oliveira, J.C.L.; Teodoro, P.E.; Almeida, M.N.F.; Toledo, J.V.; Dias Júnior, A.F.; Amorim, G.A.; Pezzopane, J.E.M.; Campoe, O.C. Changes in rainfall patterns enhance the interrelationships between climate and wood traits of eucalyptus. For. Ecol. Manag. 2021, 485, 118959. [Google Scholar] [CrossRef]
  10. Pellerin, R.F.; Ross, R.J. Nondestructive Evaluation of Wood, 2nd ed.; Forest Products Society: Madison, WI, USA, 2002. [Google Scholar]
  11. Oliveira, F.R.; Campos, J.A.O.; Sales, A. Ultrasonic measurements in Brazilian hardwood. Mater. Res. 2002, 5, 51–55. [Google Scholar] [CrossRef]
  12. Brashaw, B.K.; Bucur, V.; Divos, F.; Gonçalves, R.; Lu, J.; Meder, R.; Pellerin, R.F.; Potter, S.; Ross, R.J.; Wang, X.; et al. Nondestructive Testing and Evaluation of Wood: A worldwide research update. For. Prod. J. 2009, 59, 7–14. [Google Scholar]
  13. Elissetche, J.P.; Alzamora, R.M.; Espinoza, Y.; Emhart, V.; Pincheira, M.; Medina, A.; Rubilar, R. Wood basic density assessment of Eucalyptus genotypes growing under contrasting water availability conditions. Forests 2024, 15, 185. [Google Scholar] [CrossRef]
  14. Kravetz, C.; Bertoldo, C.; Lorensani, R.M.; Guedes, F.T.P. Influence of edaphoclimatic variations on growth and non-destructive parameters obtained in Eucalyptus sp. Clone trees. In Proceedings of the 23rd International Nondestructive Testing and Evaluation of Wood Symposium, Campinas, Brazil, 17–21 September 2024. [Google Scholar]
  15. Gendvilas, V.; Downes, G.M.; Neyland, M.; Hunt, M.; Harrison, P.A.; Jacobs, A.; Williams, D.; O’reilly-Wapstra, J. Thinning influences wood properties of plantation-grown Eucalyptus nitens at three sites in tasmânia. Forests 2021, 12, 1304. [Google Scholar] [CrossRef]
  16. Mascarenhas, A.R.P.; de Oliveira Corrêa, F.L.; de Melo, R.R.; Sccoti, M.S.V.; de Souza, E.F.M.; Araujo, E.C.G.; Silva, T.C. Uso do Pilodyn para estimativa das propriedades físicas de madeiras produzidas em sistema agroflorestal. In Proceedings of the Anais do VII Workshop de Informação, Dados e Tecnologia, Porto Velho, Brazil, 25–27 June 2024. [Google Scholar]
  17. Ferreira, M.D.; de Melo, R.R.; Tonini, H.; Stangerlin, D.M.; Beltrame, R.; Gatto, D.A.; Mascarenhas, A.R.P. Growth, production and wood quality in integrated crop-livestock-forest and monoculture systems. Rev. Bras. Ciênc. Agrár. 2020, 15, e7928. [Google Scholar] [CrossRef]
  18. de Gouvêa, A.G.; Trugilho, P.F.; Gomide, J.L.; da Silva, J.R.M.; Andrade, C.R.; Alves, I.C.N. Determinação da densidade básica da madeira de eucalyptus por diferentes métodos não destrutivos. Rev. Árvore 2011, 35, 349–358. [Google Scholar] [CrossRef]
  19. Lorensani, R.M.; Palma, S.S.A.; Gonçalves, R. Machine learning algorithms and non-destructive methods for inference properties of planted forest trees. In Proceedings of the 23rd International Nondestructive Testing and Evaluation of Wood Symposium, Campinas, Brazil, 17–21 September 2024. [Google Scholar]
  20. Gonçalves, R.; LorensanI, R.G.M.; Ruy, M.; Veiga, N.S.; Muller, G.; da Alves, C.S.; Martins, G.A. Evolution of acoustical, geometrical, physical, and mechanical parameters from seedling to cutting age in Eucalyptus clones used in the pulp and paper industries in Brazil. For. Prod. J. 2019, 69, 5–16. [Google Scholar] [CrossRef]
  21. Rinn, F.; Schweingruber, F.H.; Schar, E. Resistograph and X-ray density charts of wood comparative evaluation of drill resistance profiles and X-ray density charts of different wood species. Holzforschung 1996, 50, 303–311. [Google Scholar] [CrossRef]
  22. Hansen, C.P. Application of the Pilodyn in Forest Tree Improvement; Series of Technical Notes, 55; DANIDA Forest Seed Centre: Humlebaek, Denmark, 2000. [Google Scholar]
  23. Lima, J.T.; Hein, P.R.G.; Trugilho, P.F.; da Silva, J.R.M. Adequação do Resistograph® para a estimativa da densidade básica da madeira de Eucalyptus. Rev. Madeira Arquitetura Eng. 2006, 18, 12. [Google Scholar]
  24. Gonçalves, F.G.; da Oliveira, J.T.S.; Tomazello Filho, M.; Rezende, G.D.S.P. Estimativa da densidade básica da madeira de um híbrido clonal de Eucalyptus urophylla × Eucalyptus grandis por método não destrutivo. Rev. Cerne 2007, 13, 119–128. [Google Scholar]
  25. Wang, X.; Ross, R.J.; Carter, P. Acoustic Evaluation of Wood Quality in Standing Trees. Part 1. Acoustic Wave Behavior. Wood Sci. Technol. 2007, 39, 28–38. [Google Scholar]
  26. Bertoldo, C.; Gonçalves, R.; Massak, M.V.; Secco, C. Assessment of Wood Quality by Tree Evaluation Using Ultrasound. In Proceedings of the XIII Congresso Florestal Mundial, Buenos Aires, Argentina, 18–23 October 2009. [Google Scholar]
  27. Bertoldo, C.; Gonçalves, R.; Batista, F.; Secco, C.B. Velocity of ultrasonic waves in live trees and in freshly-felled logs. In Proceedings of the 17th International Nondestructive Testing and Evaluation of Wood Symposium, Sopron, Hungary, 14–16 September 2011. [Google Scholar]
  28. Batista, F.A.F. Diferenciação de Clones de Eucalipto Utilizando Ensaio de Propagação de Ondas em Árvores. Master’s Thesis, Faculdade de Engenharia Agrícola, Universidade Estadual de Campinas, Campinas, Brazil, 2012. (In Portuguese with English Abstract). [Google Scholar]
  29. Wang, X. Acoustic Measurements on Trees and Logs: A Review and Analysis. Wood Sci. Technol. 2013, 47, 965–975. [Google Scholar] [CrossRef]
  30. Chan, J.M.; Walker, J.C.; Raymond, C.A. Effects of moisture content and temperature on acoustic velocity and dynamic MOE of radiata pine sapwood boards. Wood Sci. Technol. 2011, 45, 609–626. [Google Scholar] [CrossRef]
  31. Gao, S.; Wang, X.; Wang, L.; Allison, R.B. Effect of temperature on acoustic evaluation of standing trees and longs: Part 2: Field investigation. Wood Fiber Sci. 2013, 45, 15–25. [Google Scholar]
  32. Flores, T.B.; Alvares, C.A.; Souza, V.C.; Stape, J.L. Eucalyptus no Brasil—Zoneamento Climático e Guia Para Identificação, 1st ed.; IPEF—Instituto de Pesquisas e Estudos Florestais: Piracicaba, Brazil, 2016; 448p. [Google Scholar]
  33. Lepsh, I.F. 19 Lições de Pedologia; Oficina de Textos: São Paulo, Brazil, 2011. [Google Scholar]
  34. Isik, F.; Li, B.L. Rapid assessment of wood density of live trees using the Resistograph for selection in tree improvement programs. Can. J. For. Res. 2003, 33, 2426–2435. [Google Scholar] [CrossRef]
  35. Duong, D.V.; Hasegawa, M.; Matsumura, J. The relations of fiber length, wood density, and compressive strength to ultrasonic wave velocity within stem of Melia azedarach. Indian Acad. Wood Sci. 2018, 16, 1–8. [Google Scholar]
  36. Vidaurre, G.B.; da Silva, J.G.M.; Moulin, J.C.; de Carneiro, A.C.O. Qualidade da Madeira de Eucalipto Proveniente de Plantações no Brasil; EDUFES: Vitória, Brazil, 2020; 221p. [Google Scholar]
  37. Bucur, V. Acoustics of Wood, 2nd ed.; Springer: Berlin/Heidelberg, Germany, 2006. [Google Scholar]
  38. Peña, J.; Grace, J. Water relations and ultrasound emissions of Pinus sylvestris L. before, during and after a period of water stress. New Phytol. 1986, 103, 515–524. [Google Scholar] [CrossRef]
  39. Oliveira, F.G.R.; Sales, A.; Lucchette, F.F.; Candian, M. Efeito do comprimento do corpo de prova na velocidade ultrassônica em madeiras (Effect of specimen length on ultrasonic velocity of wood). Rev. Árvore 2006, 30, 141–145. [Google Scholar] [CrossRef]
  40. Trinca, A.J.; Gonçalves, R. Efeito das dimensões da seção transversal e da frequência do transdutor na velocidade de propagação de ondas de ultra-som na Madeira. Rev. Arvore 2009, 33, 177–184. [Google Scholar] [CrossRef]
  41. Stackpole, D.J.; Vaillancourt, R.E.; de Aguigar, M.; Potts, B.M. Age trends in genetic parameters for growth and wood density in Eucalyptus globulus. Tree Genet. Genomes 2010, 6, 179–193. [Google Scholar] [CrossRef]
  42. Soriano, J.; Gonçalves, R.; Bertoldo, C.; Trinca, A.J. Aplicações do método de ensaio esclerométrico em peças de eucalipto saligna sm. Rev. Bras. Eng. Agríc. Ambient. 2011, 15, 322–328. [Google Scholar] [CrossRef]
  43. Dewi, A.P.; Tihurua, E.F.; Wulansari, T.Y.I. Trachea features and fiber dimensions of fast-growing tree: A case study on wood samples from eastern Indonesia. IOP Conf. Ser. Earth Environ. Sci. 2022, 976, 012063. [Google Scholar] [CrossRef]
  44. Nguyen, H.; Firn, J.; Lamb, D.; Herbohn, J. Wood density: A tool to find complementary species for the design of mix species plantations. For. Ecol. Manag. 2014, 334, 106–113. [Google Scholar] [CrossRef]
  45. Zobel, B.J.; Buijtenen, J.P. Wood Variation: Its Causes and Control; Spring Series in Wood Science; Springer: Berlin/Heidelberg, Germany, 1989; 363p. [Google Scholar]
Figure 1. Temperature (T) and precipitation (PPT) from May 2021 to March 2022 for the two growing regions (R1 and R2).
Forests 16 00535 g001
Figure 2. Confidence interval graph means and results of the statistical test comparing means (in brackets) for mean temperature in the two tree growing regions. Note: Different lowercase letters indicate statistically significant differences with 95% confidence level.
Forests 16 00535 g002
Figure 3. Confidence interval graph means and results of the statistical test comparing means (in brackets) for soil water storage in the two tree growing regions. Note: Different lowercase letters indicate statistically significant differences with 95% confidence level.
Forests 16 00535 g003
Figure 4. Ultrasound tests in the longitudinal orientation (transducers positioned on the same side—(a)) and in the radial orientation (transducers on opposite sides—(b)).
Forests 16 00535 g004
Figure 5. Tests conducted with the resistograph (a) and Pilodyn (b).
Forests 16 00535 g005
Figure 6. Confidence interval graphs means and results of the statistical test comparing means (in brackets) for mean longitudinal velocity by clone (a), age (b), reading (c) and growing region (d). Note: Different lowercase letters indicate statistically significant differences with 95% confidence level.
Forests 16 00535 g006
Figure 7. Confidence interval graph means and results of the statistical test comparing means (in brackets) for mean radial velocity by tree age. Note: Different lowercase letters indicate statistically significant differences with 95% confidence level.
Forests 16 00535 g007
Figure 8. Confidence interval graph means and results of the statistical test comparing means (in brackets) for mean radial velocity by clone (a), reading (b), and growing region (c). Note: Different lowercase letters indicate statistically significant differences with 95% confidence level.
Forests 16 00535 g008
Figure 9. Confidence interval graph means and results of the statistical test comparing means (in brackets) for mean drilling amplitude by clone (a), age (b), reading (c), and region (d). Note: Different lowercase letters indicate statistically significant differences with 95% confidence level.
Forests 16 00535 g009
Figure 10. Confidence interval graph for means and results of the statistical test comparing means (in brackets) for penetration depth by tree age. Note: Different lowercase letters indicate statistically significant differences with 95% confidence level.
Forests 16 00535 g010
Figure 11. Confidence interval graphs means and results of the statistical test comparing means (in brackets) for penetration depth by clone (a), reading (b) and region (c). Note: Different lowercase letters indicate statistically significant differences with 95% confidence level.
Forests 16 00535 g011
Figure 12. Confidence interval graphs means and results of the statistical test comparing means (in brackets) for DBH by clone (a), age (b), reading (c), and region (d). Note: Different lowercase letters indicate statistically significant differences with 95% confidence level.
Forests 16 00535 g012
Figure 13. Confidence interval graph means and results of the statistical test comparing means (in brackets) for height by clone (a), age (b), reading (c), and region (d). Note: Different lowercase letters indicate statistically significant differences with 95% confidence level.
Forests 16 00535 g013aForests 16 00535 g013b
Table 1. Results of the variance analysis of edaphoclimatic parameters between the study regions (R1 and R2).
Parameterp-Value
Mean temperature0.01
Monthly accumulated precipitation0.06
Global radiation0.31
Pressure deficit0.06
Actual evapotranspiration0.13
Soil water storage0.01
Water deficit0.28
Table 2. Differences between the fourth and second readings for longitudinal velocity (in %).
Age (Years)Clone—R1Clone—R2
ABCMeanABCMean
1−8.9%−6.3%−4.1%−6.4%−7.1%−4.5%5.6%−2.0%
34.5%7.1%7.9%6.5%7.1%4.1%7.3%6.2%
43.4%11.1%9.6%8.0%16.5%13.8%13.0%14.4%
Mean3.9%9.1%8.7%7.3% *11.8%8.9%10.2%10.3% *
* The means by region were calculated for ages 3 and 4 only, in which the fourth longitudinal ultrasound velocity reading was lower than the first.
Table 3. Percentage differences between the second and fourth readings for radial velocity.
Age (Years)Clone—R1Clone—R2
ABCMeanABCMean
123.4%14.8%18.6%18.9%18.4%7.2%9.2%11.6%
312.8%9.8%16.1%12.9%13.1%1.0%12.7%8.9%
46.8%18.2%11.6%12.2%13.3%16.1%8.8%12.7%
Mean14.4%14.3%15.4%14.7%14.9%8.1%10.2%11.1%
Disclaimer/Publisher’s Note: The statements, opinions and data contained in all publications are solely those of the individual author(s) and contributor(s) and not of MDPI and/or the editor(s). MDPI and/or the editor(s) disclaim responsibility for any injury to people or property resulting from any ideas, methods, instructions or products referred to in the content.

