Article

Evaluation of Compression Wood Incidence Under Different Thinning Regimes in Late Rotation of Pinus taeda

by
Carla Padilla
1,*,†,
Fernando Resquin
2,*,†,
Cecilia Rachid-Casnati
2 and
Andrés Hirigoyen
3
1
Faculty of Agronomy, Universidad de la República (UDELAR), Montevideo CP 11200, Uruguay
2
National Research System of Forestry Production, National Agriculture Research Institute, INIA Tacuarembó, Route 5 km 386, Tacuarembó CP 45000, Uruguay
3
National Research System of Forestry Production, National Agriculture Research Institute, INIA Las Brujas, Ruta 48 km 10, Rincon del Colorado, Canelones CP 90100, Uruguay
*
Authors to whom correspondence should be addressed.
These authors contributed equally to this work.
Forests 2025, 16(12), 1766; https://doi.org/10.3390/f16121766 (registering DOI)
Submission received: 24 October 2025 / Revised: 12 November 2025 / Accepted: 17 November 2025 / Published: 24 November 2025

Abstract

Compression wood (CW) negatively affects the industrial quality of Pinus taeda by causing distortion in sawn boards and is visually characterized by a darker reddish colour. Thinning is considered a key factor influencing its formation, but the reported effects have been inconsistent. This study evaluated CW incidence at final rotation under five thinning regimes: 500-200, 500-325, 800-600-400, 700-450, and 1000-650 trees.ha−1. The defect was assessed on log ends, basal discs, and sawn boards. Although overall CW severity was low, regimes differed significantly. The 500-325 trees.ha−1 regime showed the highest stain and board defects, while the 500-200 trees.ha−1 regime of similar intensity had lower values, indicating that intensity alone does not explain the occurrence of defects. After thinning, CW in growth rings increased and was positively associated with ring width and negatively with stand density index, indicating that reduced competition and accelerated radial growth are linked to higher formation levels. Visible CW staining on log ends was moderately correlated with board defects, indicating its potential as a practical, low-cost indicator of log quality. Thinning affects compression wood through its impact on growth and stand structure. In addition to intensity, timing and the effect of the wind must also be considered. Moderately intensive regimes help minimize defects, although their practical adoption may be limited by commercial priorities.

1. Introduction

Pinus taeda is widely cultivated as a commercial forest species in various regions around the world, valued for its fast growth and suitability for solid wood production. Originally native to the southeastern United States, it has been successfully established in countries such as Argentina, Brazil, Uruguay, Venezuela, China, South Africa, Australia, and New Zealand [1]. The formation of CW has been recorded in South Africa in Pinus taeda plantations in the Mpumalanga and Limpopo provinces [2]. It has also been reported in Brazil, where it is recognized as a factor that compromises wood quality and limits its industrial utilization [3]. Beyond Pinus taeda, the occurrence of compression wood has also been reported in other conifer species cultivated in plantations. For instance, its presence has been documented in Pinus radiata in Chile [4,5], South Africa [6], and New Zealand [7,8]; in Pinus sylvestris in the UK [9] and Spain [10]; and in Pinus nigra in the UK [11,12].
In Uruguay, Pinus taeda is one of the most important forest species in terms of planted area, representing a significant portion of the 128,000 hectares occupied by pine trees, which accounts for 14.3% of the country’s total forested area [13]. Its primary use is for industrial processing to produce solid wood products, mainly intended for export.
These plantations have been developed from genetic material introduced from the United States and South Africa [14], under silvicultural regimes focused on high-quality wood production. A pre-commercial thinning is usually conducted in the early stages, followed by one or two commercial thinnings during the rotation.
Among the various factors affecting the industrial quality of this wood, compression wood is identified as having the most significant negative impact. Based on internal assessments and observations within the Uruguayan forest industry, CW is estimated to cause around a 10% loss of the potential foreign exchange earnings from Uruguay’s pine mechanical transformation sector. Compression wood is a type of reaction wood found in conifer species that exhibits markedly different physical, chemical, and mechanical properties compared to normal wood [15]. One of its most distinctive features is a darker reddish-brown colour (stain), resulting from its highly lignified, thick-walled tracheids [16]. CW causes defects in sawn boards and veneer sheets, such as distortion, cracking, reduced dimensional stability, and lower mechanical strength [17,18,19]. Consequently, it disrupts production processes, causing misalignments and even equipment damage, reducing both yield and final product quality.
CW formation can result from several factors, including wind, growth rate, genetic material, and thinning plays a particularly relevant role. Schweitzer [3] reported that severe thinning has been associated with increased CW formation in Pinus taeda. Similarly, Bamber and Burley [20] suggested that thinning can promote CW development by altering the vertical equilibrium of tree stems. Post-thinning canopy opening encourages lateral crown growth and may induce trunk leaning, both of which are conducive to CW formation. Increased spacing between trees also enhances wind exposure, potentially intensifying this effect. In this context, Cown [21] found that, in Pinus radiata, CW formation was directly related to growth rate increases following thinning. The author proposed that this could be linked to hormonal changes, such as elevated auxin production from crown expansion, or to increased stem oscillation from wind, with both acting as stimuli for reaction wood development.
In contrast, Cameron [11] found that unthinned trees exhibited significantly higher CW incidence, up to three times more, than those that were thinned. His findings indicate that high stand density leads to intense competition for space, prompting trees to prioritize height growth over stem and root development. As a result, CW development in dense stands is believed to be strongly influenced by phototropic movements in response to light competition.
Given CW’s detrimental impact on product quality, a thorough understanding of the factors contributing to its formation is essential. Among silvicultural practices, thinning is one of the main tools used in Pinus taeda management. However, most available studies have focused on other species or planting conditions and have reported differing outcomes regarding the influence of thinning on CW development. This variability across existing studies suggests that certain thinning regimes may be more effective than others in reducing CW formation. Our study design include thinning schemes that considers the contrasting number of suckering trees per hectare and the stages of the crop cycle at which thinning is applied. This allows us to evaluate a wide range of management situations, ultimately providing a comprehensive overview of the effects of these management practices.
Our hypothesis is that different thinning schemes affect compression wood formation due to mechanisms related to growth and competition among individuals. The primary objective of this study was to characterize compression wood formation in Pinus taeda under different thinning regimes and to analyze its relationship with growth parameters under northern Uruguay conditions. The specific objectives were as follows: (i) quantify the CW presence for each of the thinning schemes evaluated; (ii) measure the relationship between CW presence and individual and population growth; and (iii) determine the usefulness of the visual log grading as a predictor of the deformations observed in the boards after sawing.

2. Materials and Methods

2.1. Study Area

The study was conducted in a Pinus taeda thinning trial, located in the Tacuarembó department in northern Uruguay (31°33′22″ S, 55°44′40″ W) (Figure 1). The soils at the site are deep, sandy-textured, highly acidic, and have low natural fertility. According to the USDA soil taxonomy, they are classified as Hapludult and Hapludalf [22]. The distribution of rainfall during the historical period (2002–2025) averaged 1386.8 mm per year. The average temperature was 17.6 °C, with maximum and minimum values of 32.6 °C and 7 °C, respectively. The test site is located in a region where the most frequent and fastest winds come from the northeast to southeast directions with an average speed of 1.9 × 10⁵ and an average maximum speed of 3.2 × 10⁵ m.s−1, respectively [23].
The stand was planted in 1997 using seed from a first-generation seed orchard in Coastal Plain region, Georgia, USA, at an initial density of 1000 trees.ha−1 with a spacing of 4 m between rows and 2.5 m between trees. The stand was pruned five times and ≤40% of the live crown was removed in each intervention.

2.2. Trial Design and Thinning’s Regimes

The thinning trial was installed in the year 2000, when the stand was three years old. A total of 58 square plots of 30 m × 30 m were established using a randomized complete block design with three blocks defined by the initial basal area as follows: Block 1 (>4.47 m2.ha−1), Block 2 (3.96–4.47 m2.ha−1), and Block 3 (<3.96 m2.ha−1) (Figure S1, Supplementary Materials). A total of 19 different thinning treatments were originally implemented in the trial, varying in the number of interventions, timing (ages at which thinning occurred), intensity (final residual stand density), and the interval between successive thinnings.
For this study, five thinning regimes were selected (Table 1) These were chosen because they represent the range of residual stand densities relevant to current silvicultural practices in the Uruguayan forest sector, while the remaining regimes were either operationally impractical or too similar to others in terms of final stand density and thinning regime The number of rows and trees in each of the plots evaluated in this study are described in Table S1, Supplementary Materials.

2.3. Tree Selection and Field Sampling

To ensure a representative sample of tree sizes, individuals were selected based on the diameter at breast height (DBH, cm) distribution within each thinning regime. DBH was measured at 25 years of age for all trees within each plot, and diameter classes were defined for each thinning. Based on the relative frequency of each class, seven trees were selected per plot, following the class proportions established at the thinning regime level. This resulted in a total of 105 trees (21 per thinning regime, 7 per plot) which were manually felled using a chainsaw. After felling, a basal disc (~5 cm thick) was collected from each tree for visual assessment of CW the growth rings, and a 3.5 m log was extracted from the base of the stem for sawing and subsequent evaluation of CW in the resulting boards.

2.4. Visual Analysis of Compression Wood on Log Ends

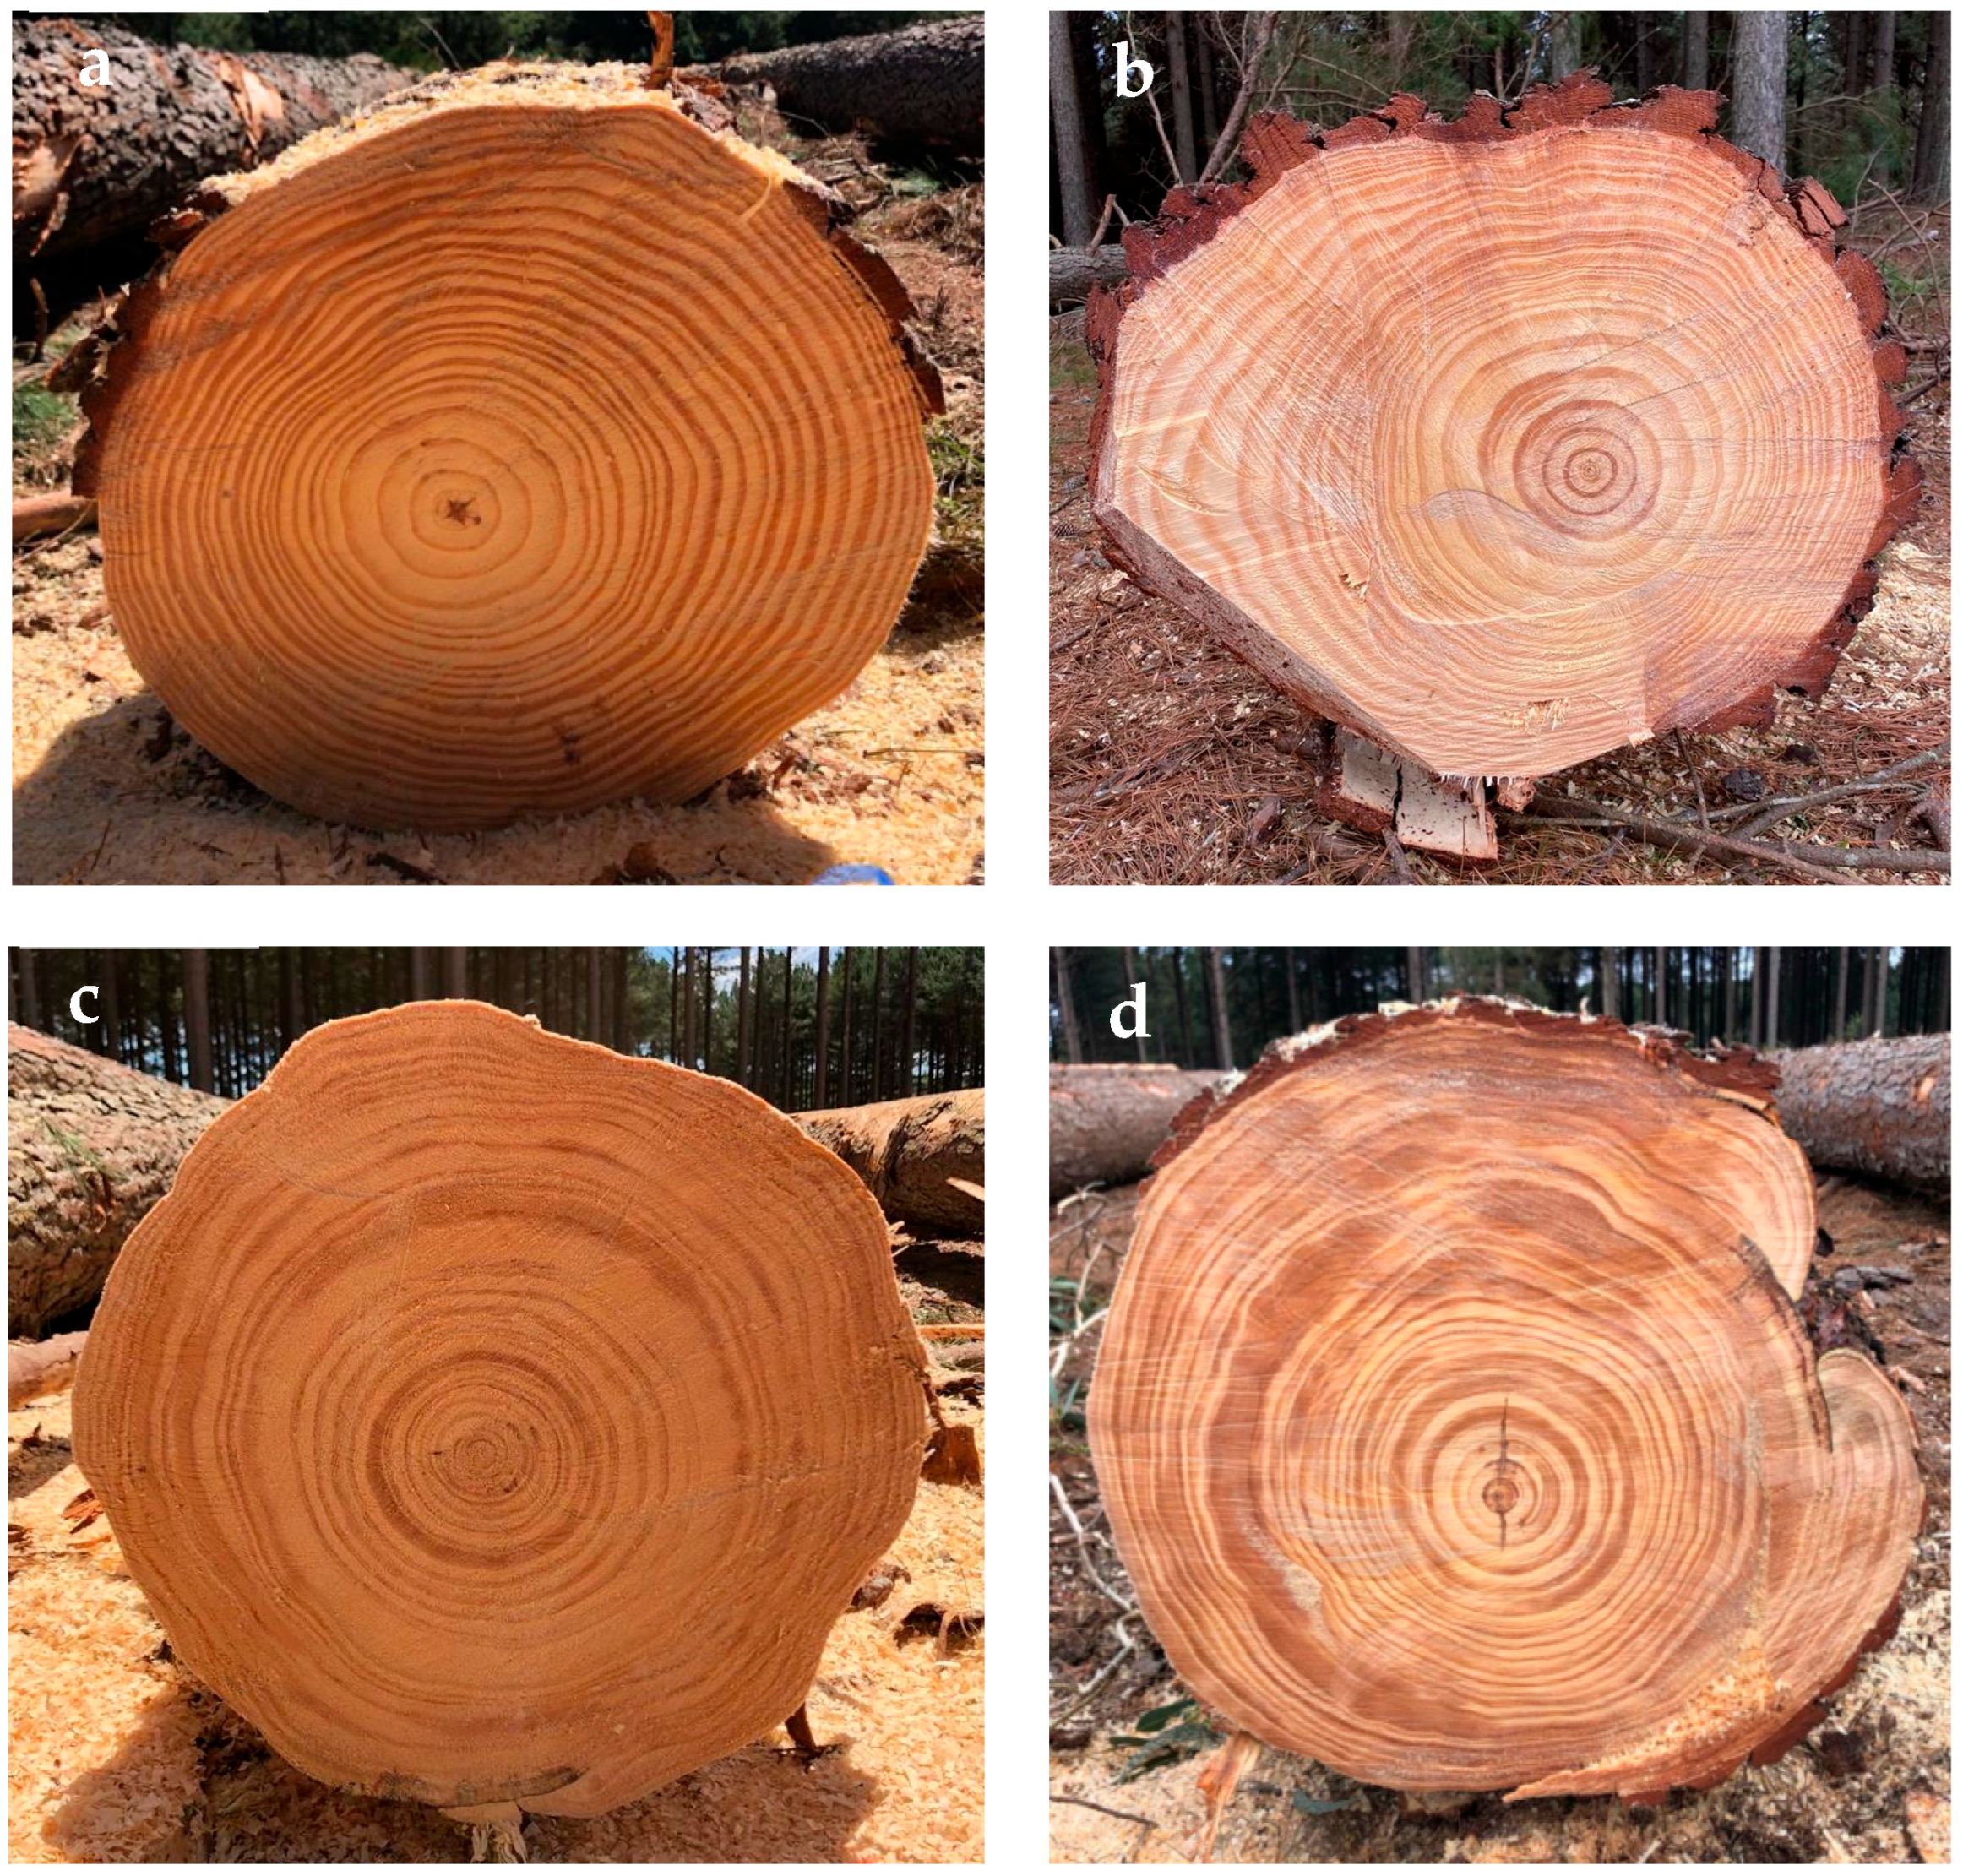
Both ends of each log were visually examined for CW presence and classified on a scale from 0 to 3 based on the proportion of the cross-sectional occupied by the stain (0: absent, 1: <1/3, 2: 1/3–2/3, 3: >2/3) (Figure 2). Each log was assigned a final score, obtained as the average of its two ends (basal and upper). All evaluations were performed by a single trained observer to avoid inter-rater variability, and the scoring procedure was calibrated in previous surveys of >300 trees from the same research project. Similar categorical approaches for visual CW severity have been used in conifer species [24,25]. The use of stain as a proxy for CW has been previously validated for Pinus taeda under similar site and management conditions, where stained areas consistently showed anatomical features of CW (shorter tracheids and thicker cell walls; Table S2, Supplementary Materials), in agreement with published characterizations of CW in conifers [26,27,28].

2.5. Preliminary Sampling for Juvenile–Mature Wood Transition

To determine the juvenile–mature wood transition, fibre length was analyzed in 10 basal discs representing different diameter classes from the study stand Measurements were conducted on earlywood tracheids from successive rings, samples were macerated following Kraus and Arduin protocol [29], and fibre length was measured. The transition ring was defined as the point where fibre-length values showed a clear stabilization trend, indicating the onset of mature wood formation. Based on this change in slope, the transition occurred around ring 11, consistent with previous reports for Pinus taeda [30,31]. This ring was used as the boundary to separate juvenile (inner) and mature (outer) boards during sawing (Figure S2, Supplementary Materials).

2.6. Sawing Methodology

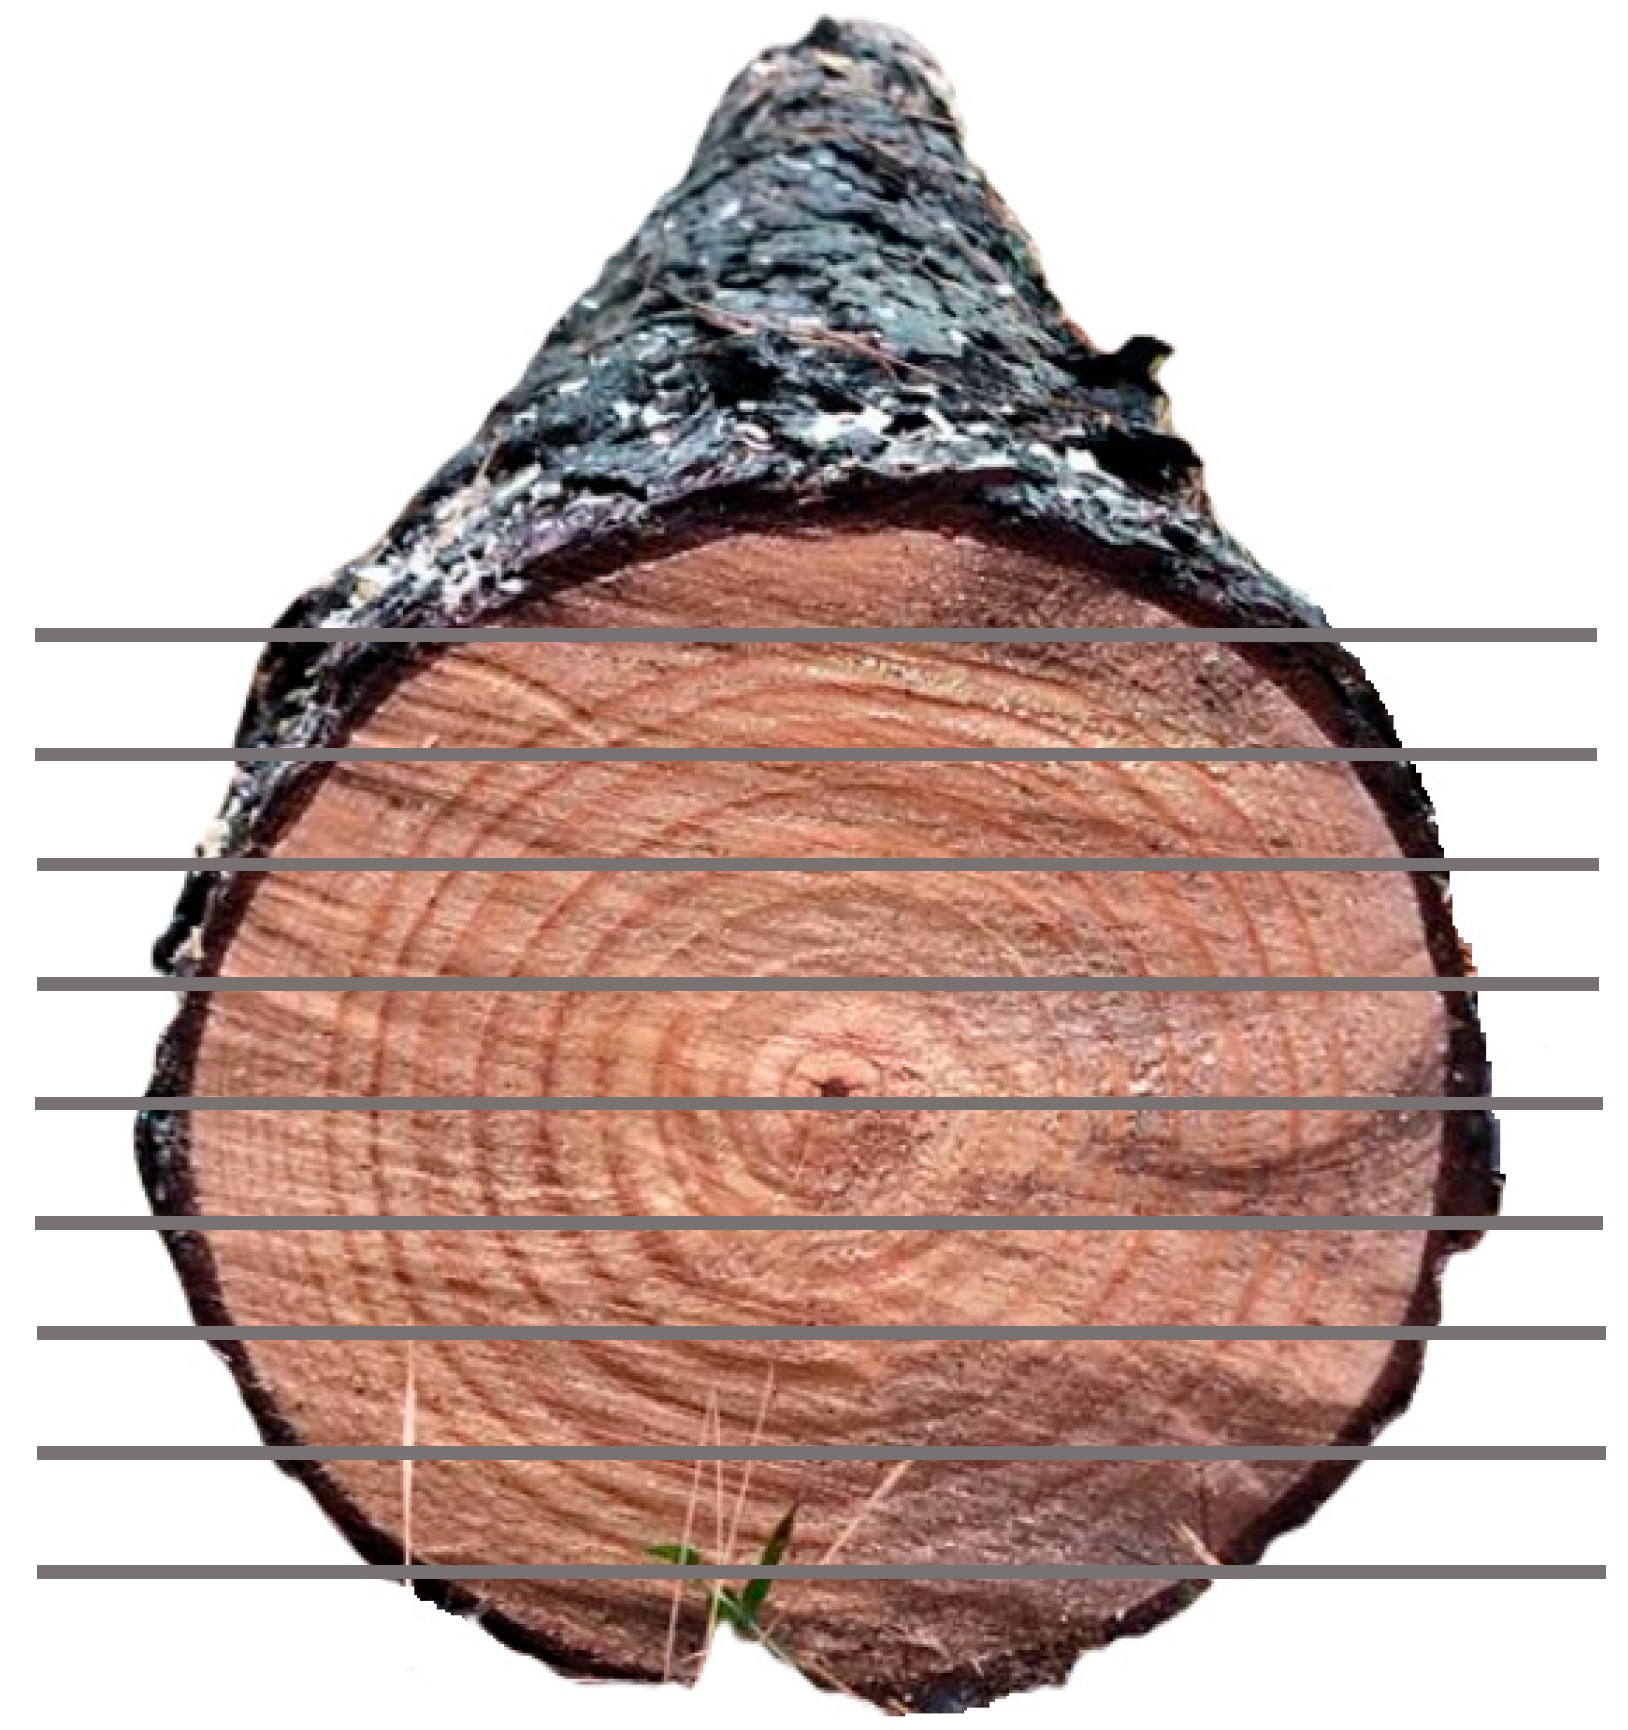
Logs were sawn into 1-inch-thick boards using successive parallel cuts (Figure 3), corresponding to commercial dimensions. Boards were not edged, and therefore retained bark on their sides. From the 105 processed logs, between 9 and 15 boards were obtained per log, yielding a total of 1144 boards for evaluation. During this process, boards originated from the inner zone—expected to contain juvenile wood—were intentionally kept separate from those obtained from the outer zone, where mature wood was expected to be present, based on the estimated transition point determined through preliminary sampling (Section 2.6).

2.7. Visual Analysis of CW in Green Boards

Both faces of each board were visually examined for CW presence and classified on a scale from 0 to 3, based on the proportion of the surface area occupied by visible CW stain (0: absent, 1: <1/3, 2: 1/3–2/3, 3: >2/3). A final score was assigned to each board using the maximum and the average of the two faces.

2.8. Evaluation of Defects in Dried Boards

Boards were dried in a conventional kiln under controlled industrial drying conditions, following a standard softwood drying schedule. After drying, boards were evaluated for crook, bow, and twist, based on the UNIT 1461 standard [32]. Rather than using absolute deformation values, which do not necessarily reflect the board’s industrial usability, each board was classified into one of two practical categories: “with defects” or “without defects”. This classification was based on threshold values provided by a local industrial company, which defines acceptable limits for each type of deformation according to commercial quality requirements (Table S3, Supplementary Materials). These thresholds were developed in accordance with the UNE-EN 14081-1 standard [33] for structural timber grading.

2.9. Visual Analysis of CW in Discs

Basal discs from all selected trees were visually assessed to quantify the presence of CW. Each disc was divided into eight equal sectors by drawing equidistant radii, and CW was evaluated ring by ring. Each sector, defined as the portion of a ring between two consecutive radii, was scored based on the extent of visible stain (0: absent; 0.5: small but clearly identifiable stain; or 1: large and prominent stain).
Ring widths were measured along each radius using a ruler to estimate the area of each sector. These values were used to calculate the CW area per sector by weighting the stained proportion accordingly. Summing the stained sectors yielded the total CW area per ring, which was then expressed as a percentage of the total ring area. These results were used to calculate the average CW percentage per ring across trees within each thinning, and the total CW percentage per disc.
To quantify the post-thinning CW response over time, the area under the curve (AUC) of CW proportion was calculated from ring 9 onward using numerical integration. Therefore, AUC represents the cumulative CW proportion over time, combining both the magnitude and duration of CW formation after thinning.

2.10. Statistical Analysis

As several variables did not meet normality assumptions, non-parametric tests were applied. Kruskal–Wallis tests were used to evaluate the effect of thinning on the proportion of boards with defects, the CW stain score in boards, the CW stain score on log ends, and the CW proportion in growth rings. When significant differences were detected, pairwise comparisons were performed using Dunn’s test, applying a significance level of α = 0.05.
Spearman correlation coefficients (rs) were calculated to explore the relationship between CW incidence at the growth ring level and several dendrometric and silvicultural variables, as well as between the proportion of boards with defects and stained area in rings, and between visual CW scores on log ends and boards with defects. The variables considered were Basal Area (G, m2·ha−1), Stand Density Index (SDI) [34], Stand Age (Age, years), Diameter at Breast Height (DBH, cm), Total Height (Ht, m), Age at Thinning (AgeT, years), Number of Trees per Hectare (N), Ht/DBH ratio (m·cm−1), and Ring Width (Grw, mm). All analyses were performed using InfoStat software version 2020 [34].

3. Results

3.1. Effect of Thinning on Growth and Competition Between Trees

In general, growth and competition results among individuals begin to diverge from age 6 onward, coinciding with the application of the first commercial thinning (Figure 4). Individual growth results (DBH and Ht) across thinning regimes were within expectations, being higher under wider spacings. The Ht/DBH ratio showed that trees under narrower spacings were more slender, since higher competition promoted greater height growth relative to DBH. The greatest change in this relationship is observed after the thinning applied at 9 years of age, and this is the moment from which an increase in the presence of CW begins to be detected. The G exhibited the opposite trend, as this parameter was directly related to stand density. Beyond the early years, the maximum Grw peak occurred after the thinning at age 12, when competition (SDI) was most reduced. Less intensive thinning regimes (1000-650 and 700-450 trees·ha−1) spent most of the rotation under severe competition, while the more intensive regimes (500-200 and 500-325 trees·ha−1) remained under increasing competition. Changes in tree populations across thinning regimes were not proportionally reflected in growth variables, either at the individual or per-hectare level.

3.2. CW Incidence by Thinning Regime

3.2.1. CW Stain on Log Ends

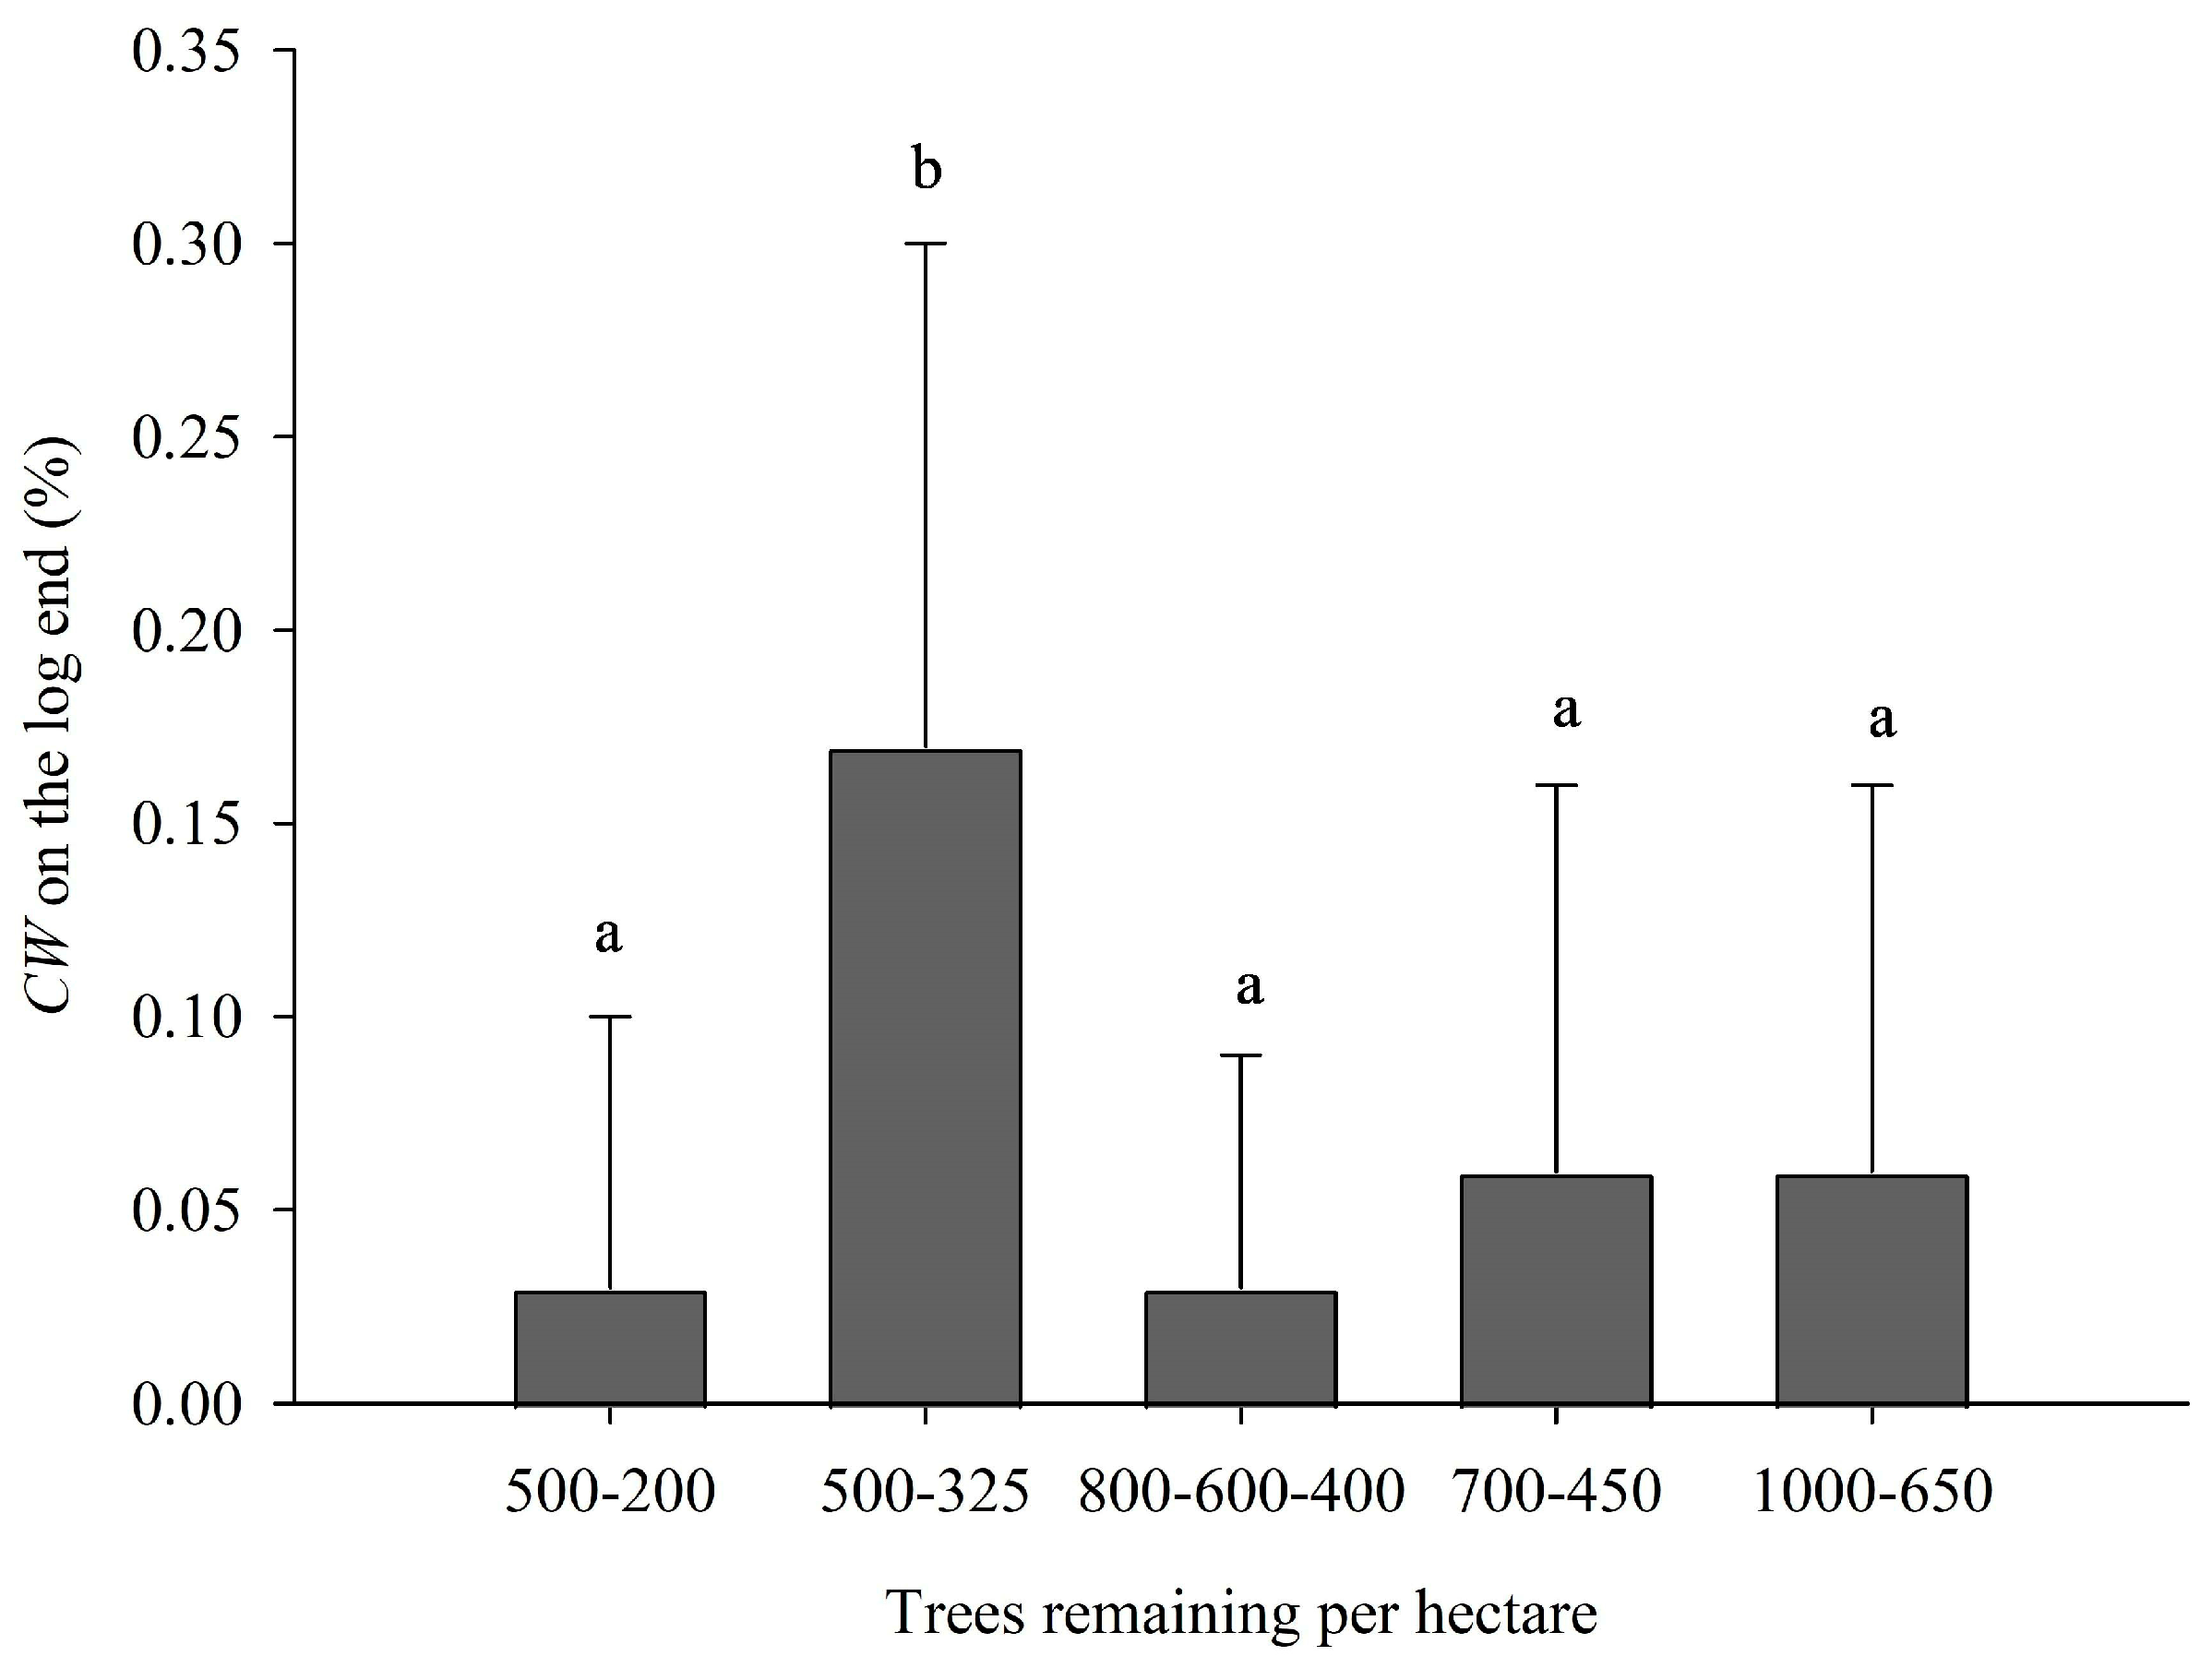
CW presence levels were generally very low across all thinning regimes; however, data analysis indicated significant differences among treatments (H = 14.5, p-value ≤ 0.0001) (Figure 5). The 500-325 trees·ha−1 regime exhibited the highest mean CW stain proportion, significantly greater than the other thinning treatments. No significant differences were detected among the remaining regimes, which showed lower and more uniform values. Among the intensive thinning regimes, only 500-325 trees·ha−1 showed elevated CW stain levels, while 500-200 trees·ha−1 remained comparable to the lighter regimes. Moreover, except for the 500-325 trees·ha−1 regime, both boards and log ends exhibited only a very reduced stained surface.

3.2.2. CW Distribution Across Annual Rings

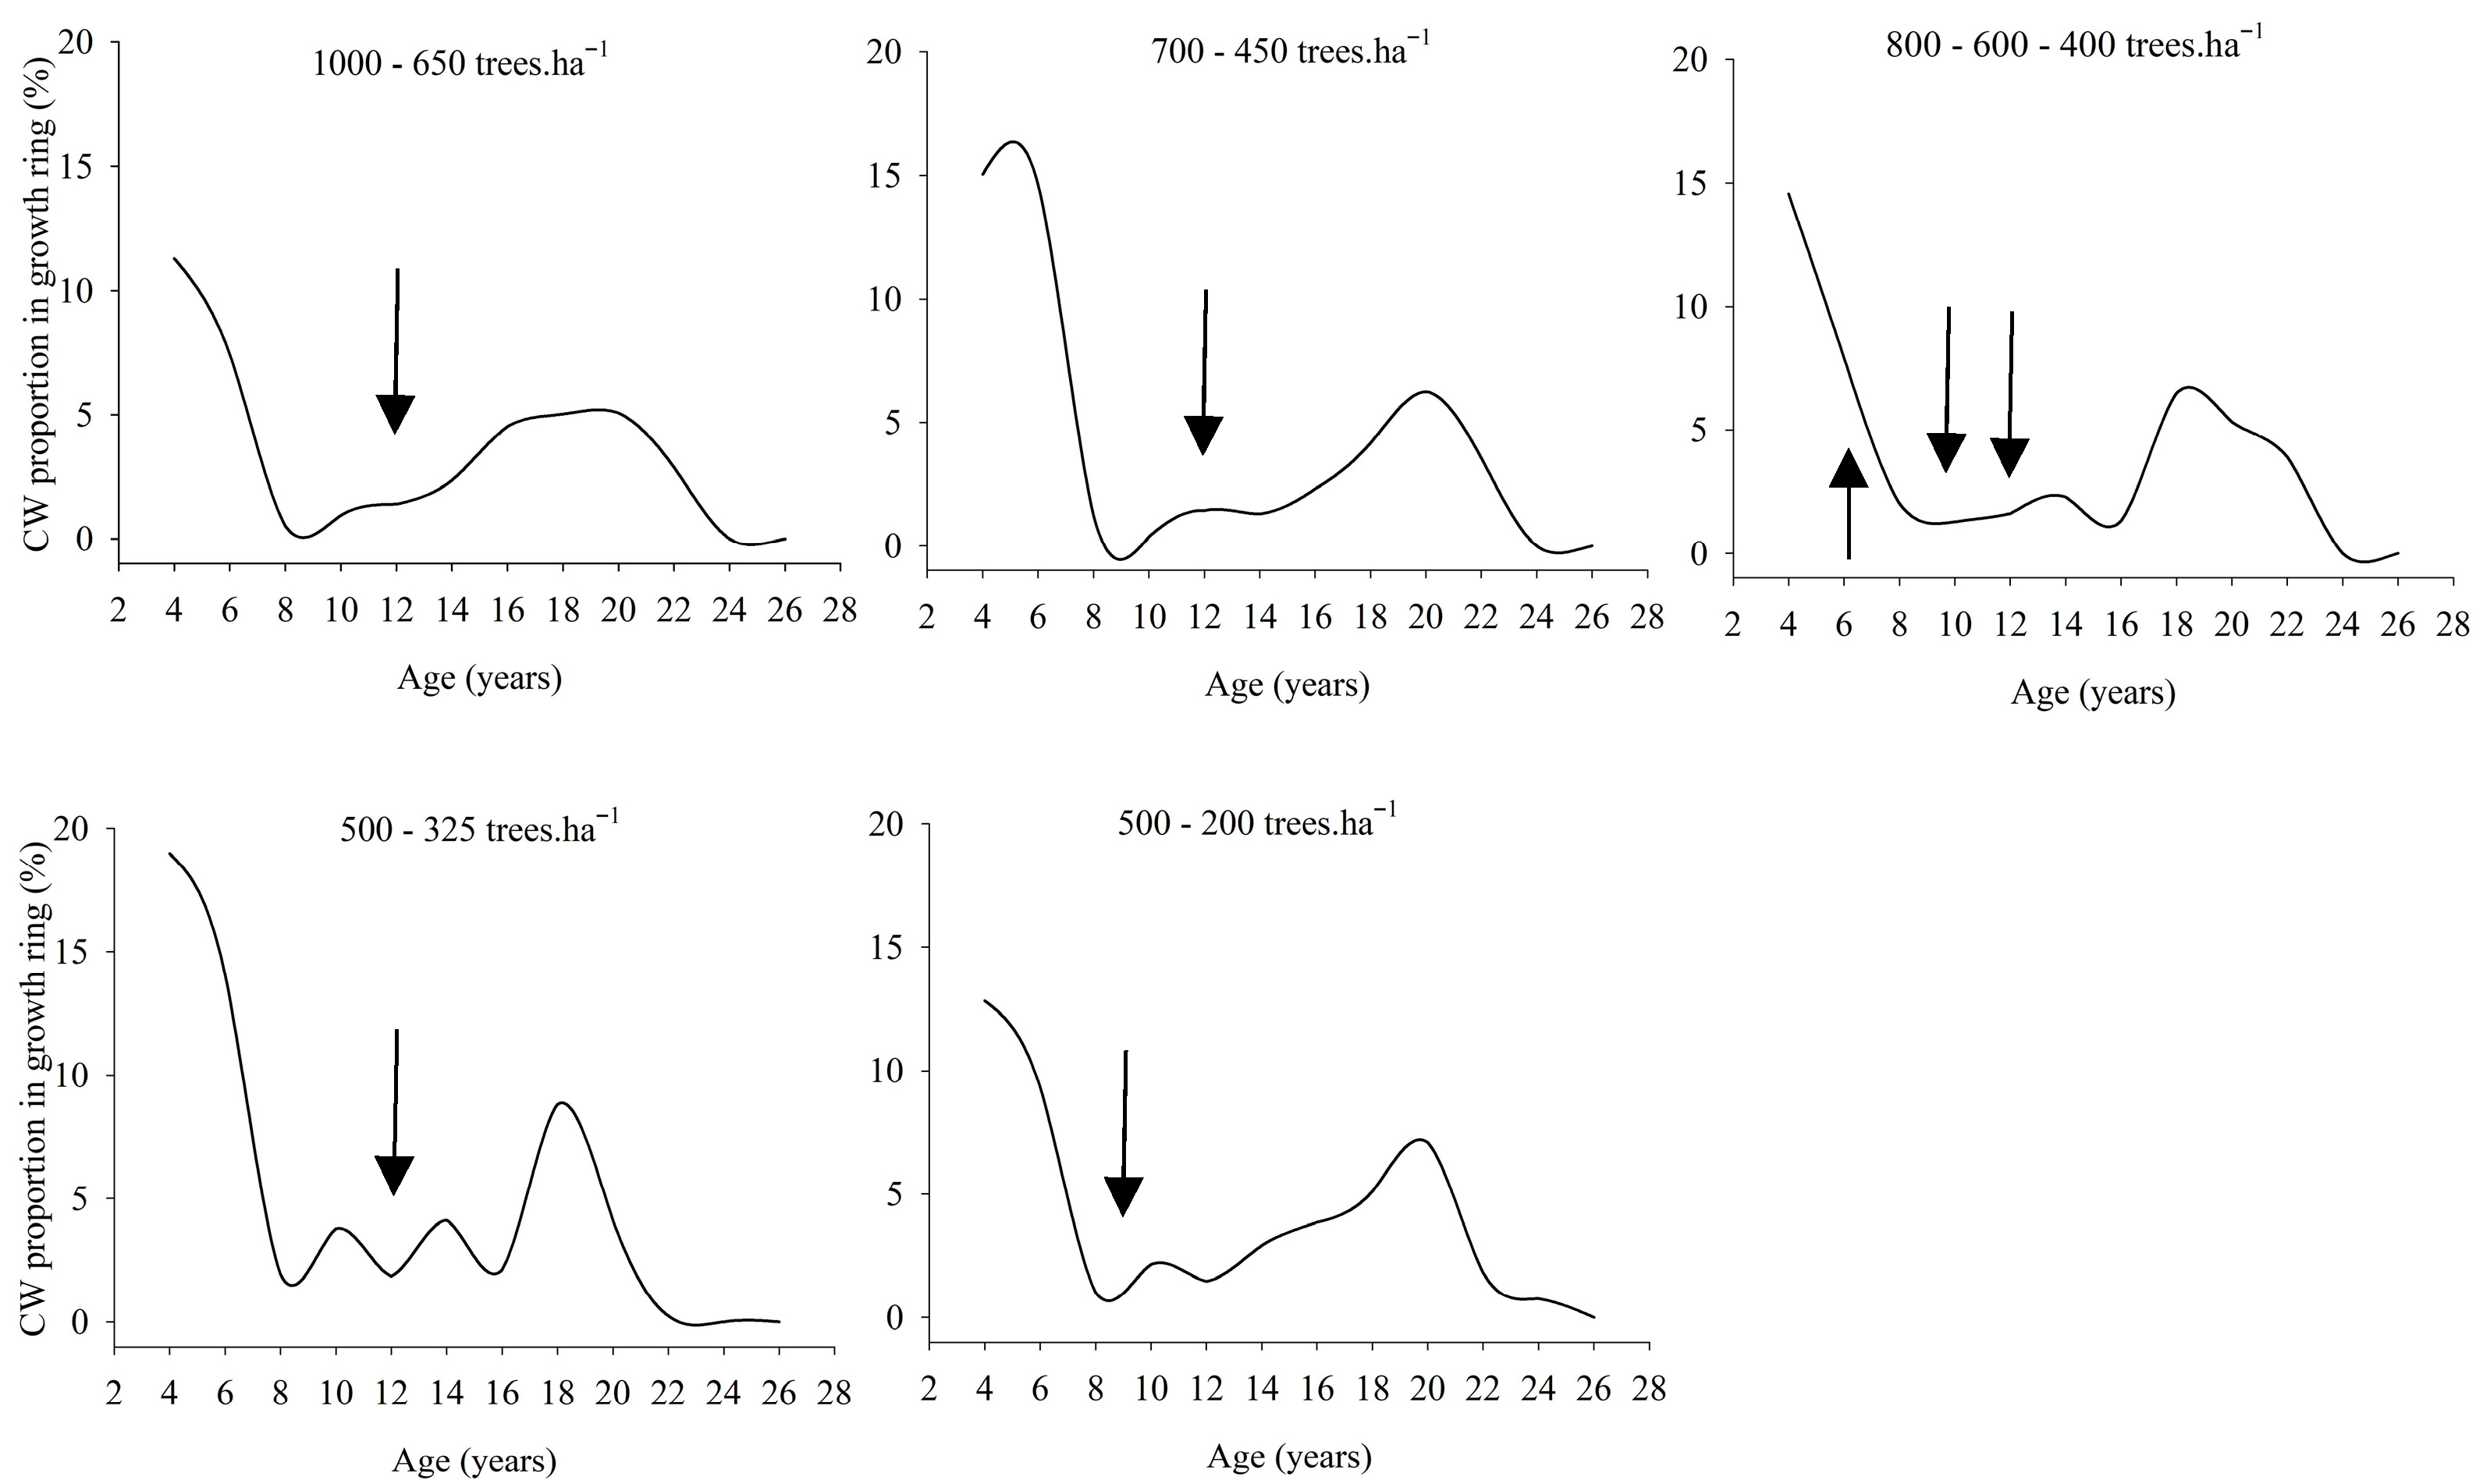
Across all thinning treatments, an increase in CW proportion was observed in the years following thinning response (Figure 6). The magnitude and duration of this increase varied among regimes, but in all cases CW levels declined toward the final stage of the rotation.
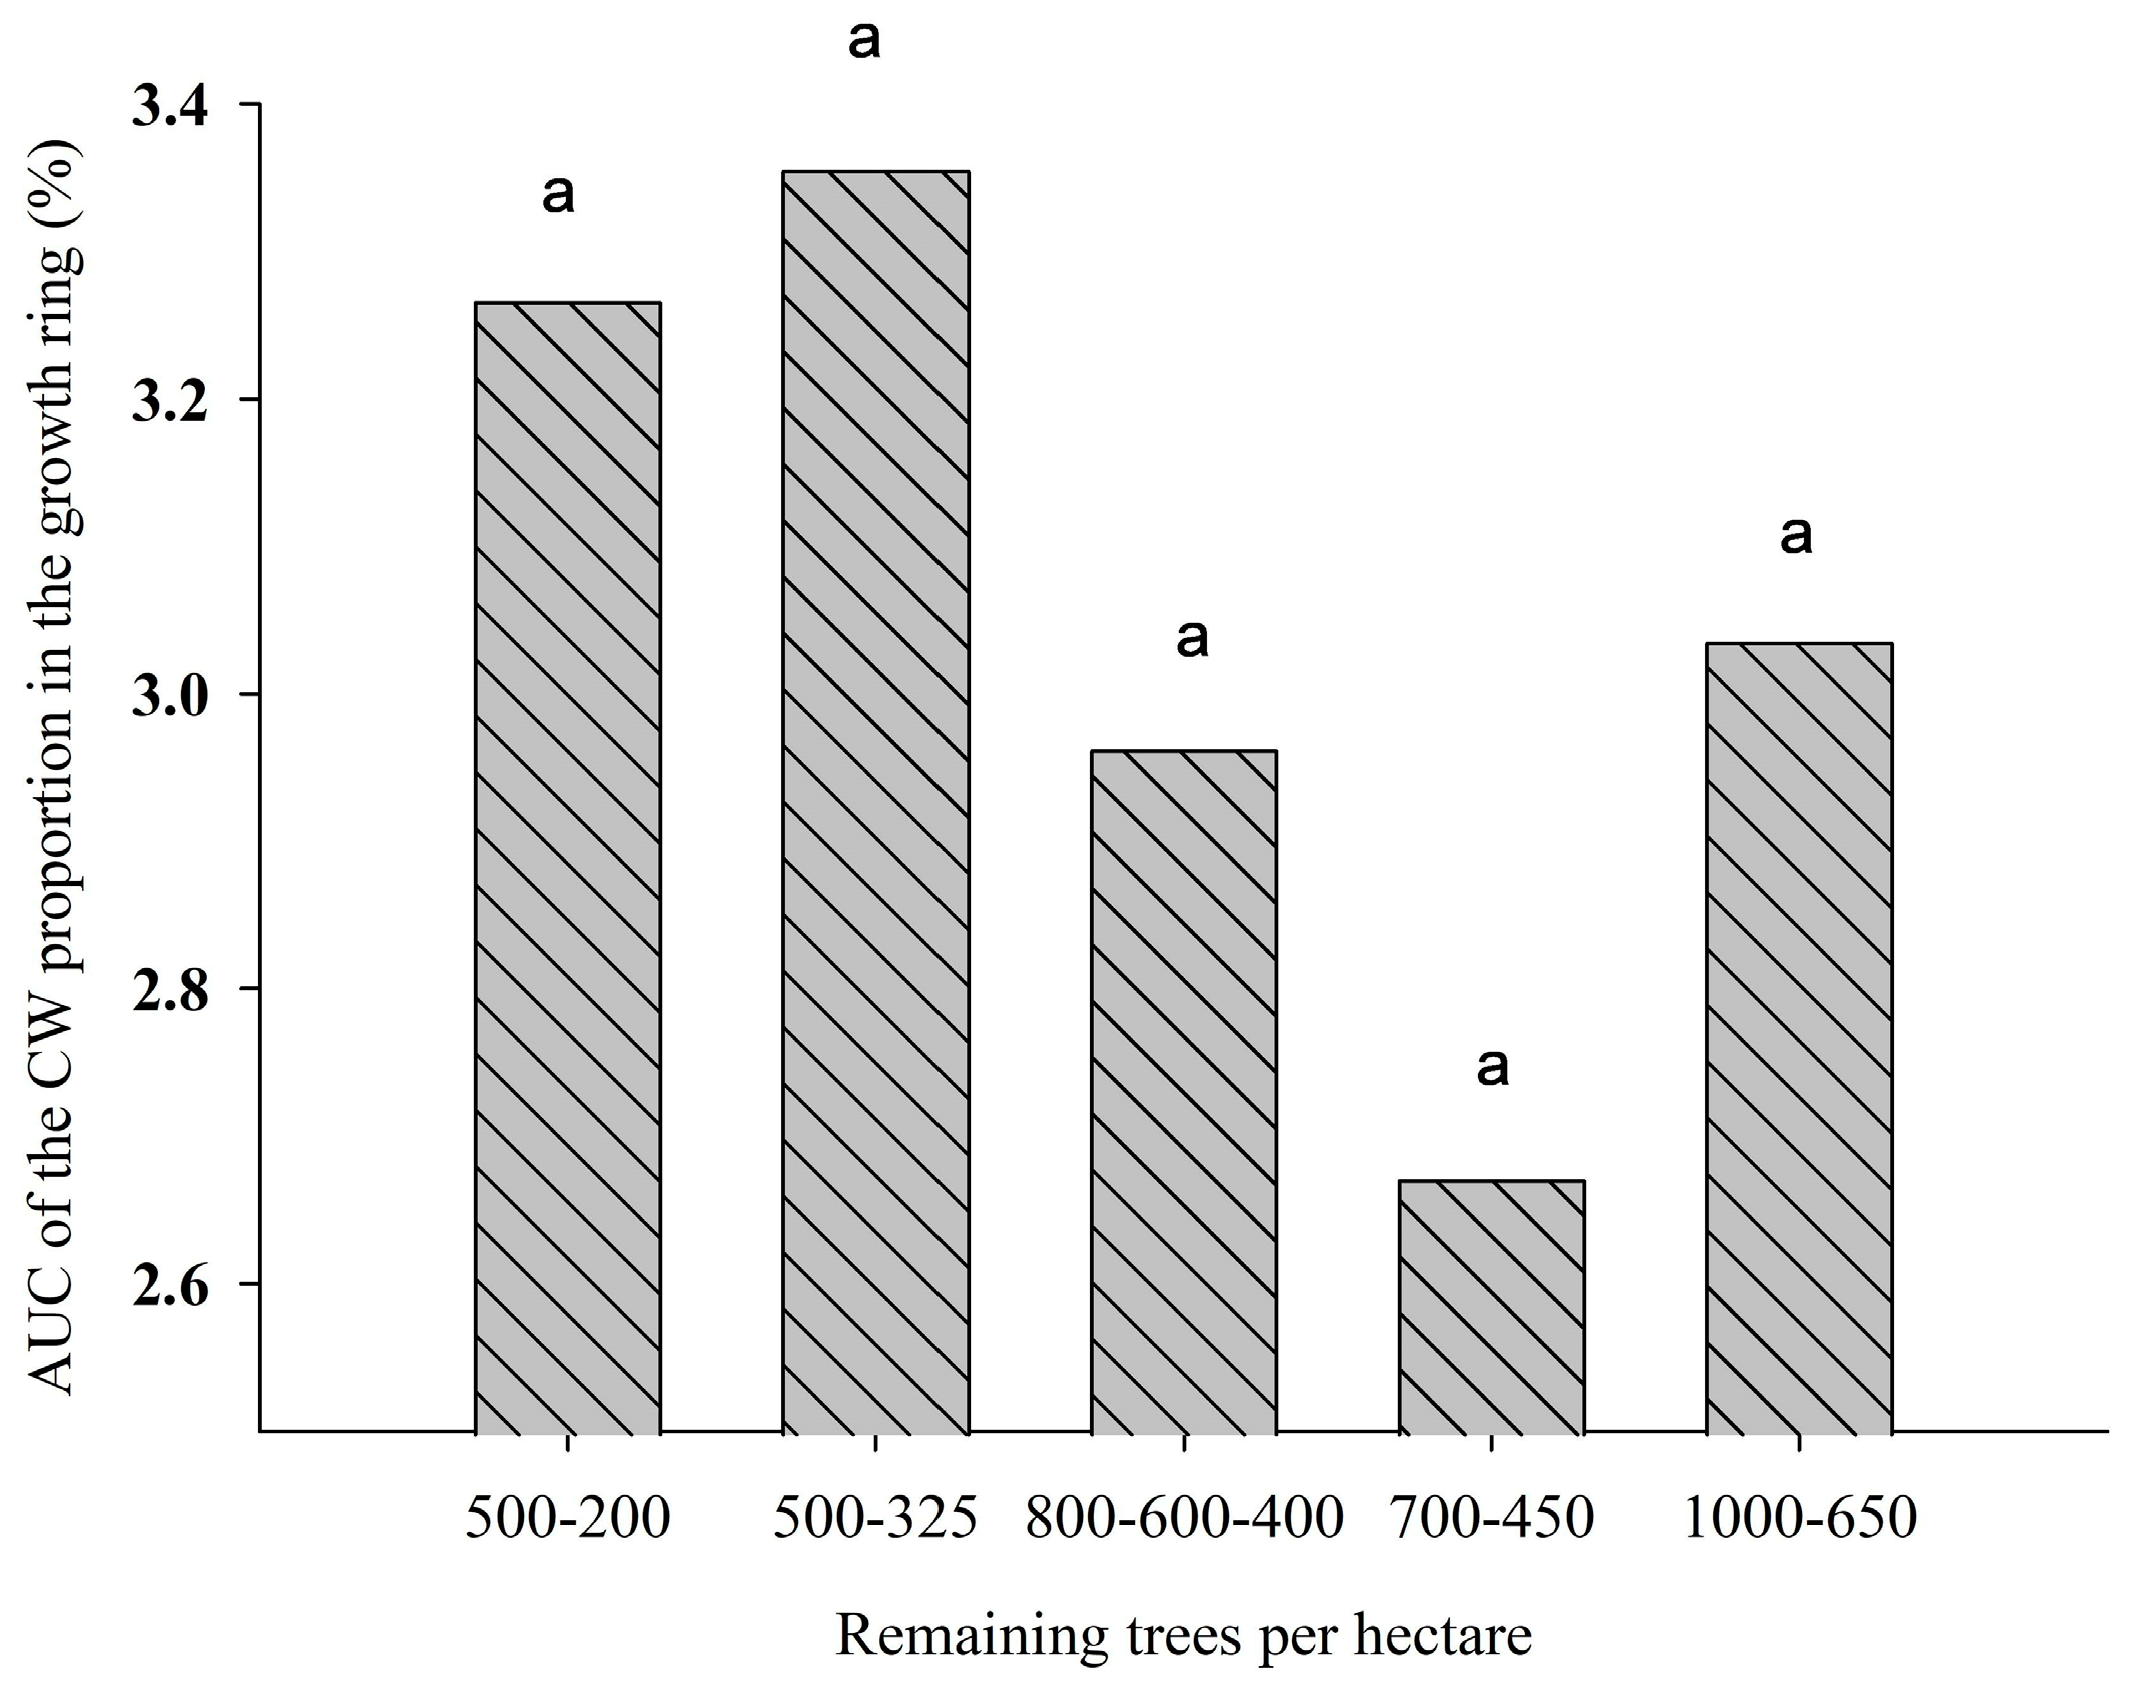
The area under the curve (AUC) of CW proportion, calculated from ring 9 onward to represent the post-thinning period, did not differ significantly among thinning regimes (Figure 7). However, lower mean AUC values were associated with the moderate thinning regimes (800-600-400 and 700-450 trees.ha−1), while both intensive (500-325 and 500-200 trees.ha−1) regimes showed higher values. This was consistent with the log end stain results.

3.2.3. CW Stain in Boards

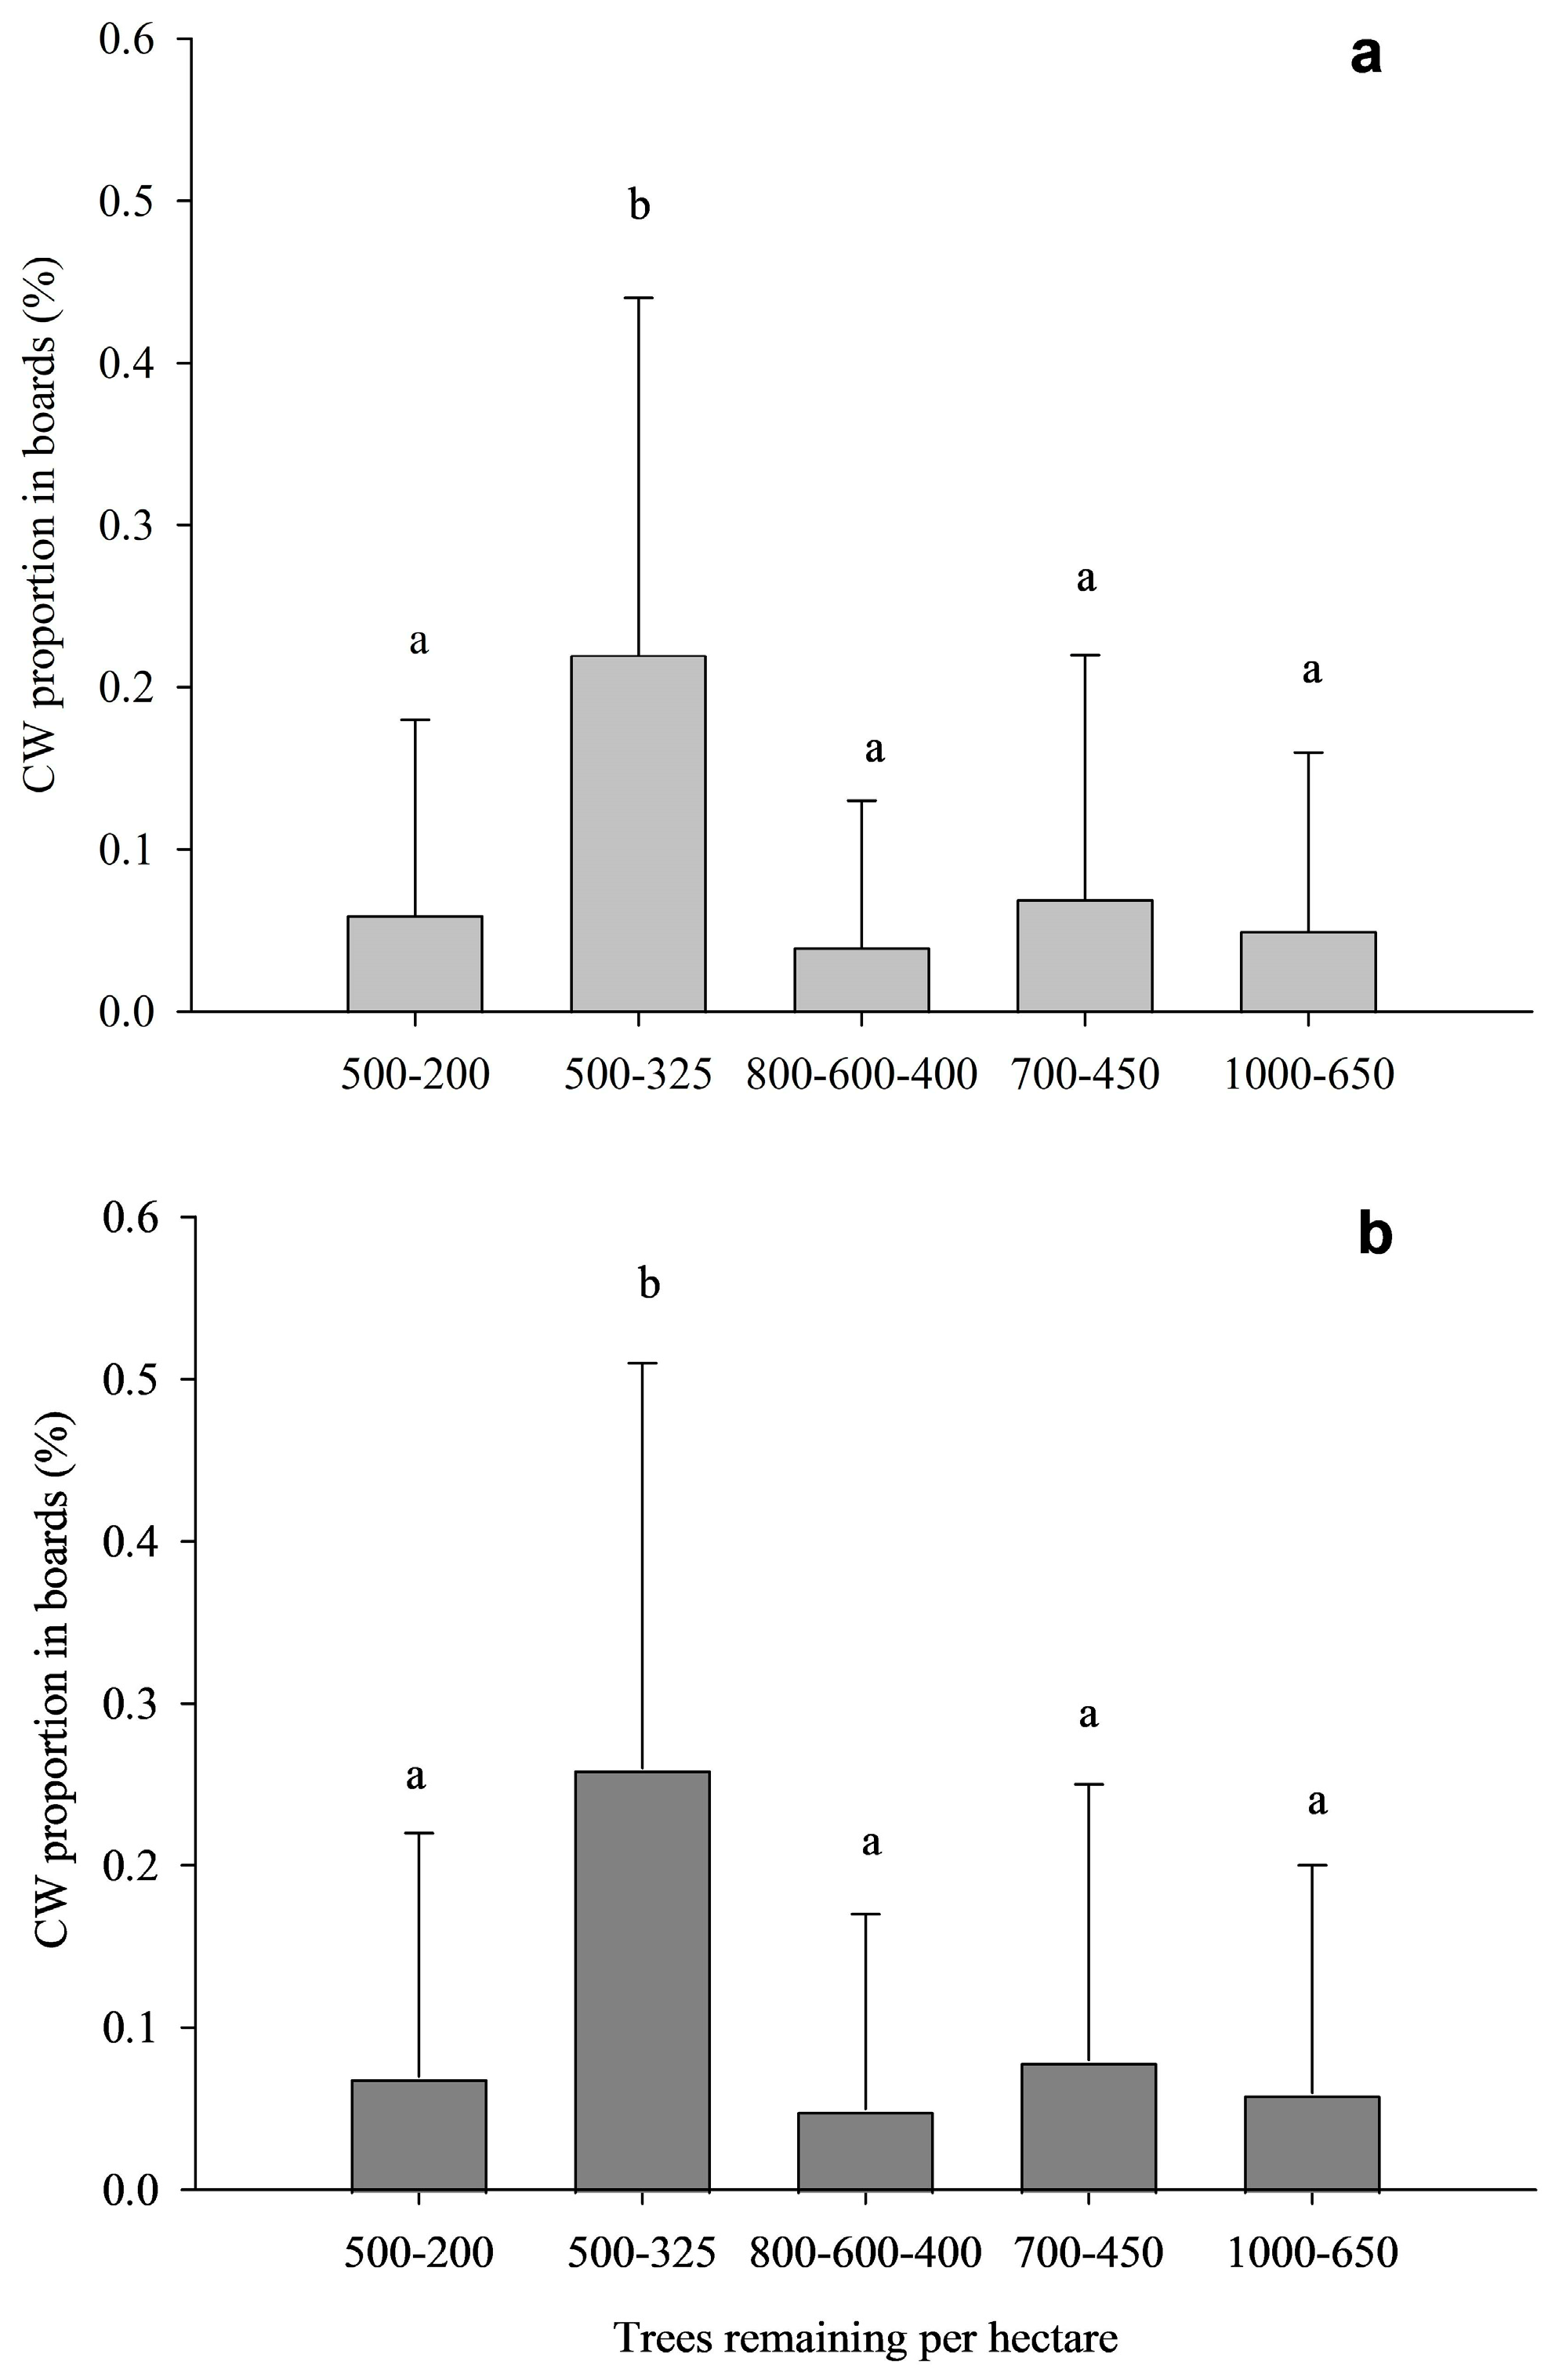
A significant effect of thinning regime was observed on the mean CW stain proportion in boards (Figure 8). Both the average stain across board faces (H = 121.89, p-value ≤ 0.0001) and the maximum (H = 115.27, p-value ≤ 0.0001) yielded consistent results. The 500-325 trees.ha−1 regime showed the highest mean values, significantly greater than all other treatments. No significant differences were found among the remaining thinning regimes.

3.2.4. Board Defects

No significant differences were found in the proportion of boards, with defects between the innerwood (up to ring 11) and outerwood (beyond ring 11) regions (H = 0.79, p-value = 0.37) (Figure 9). The proportion of boards with defects was similar in both radial positions, with relatively high averages and considerable variability in each region.
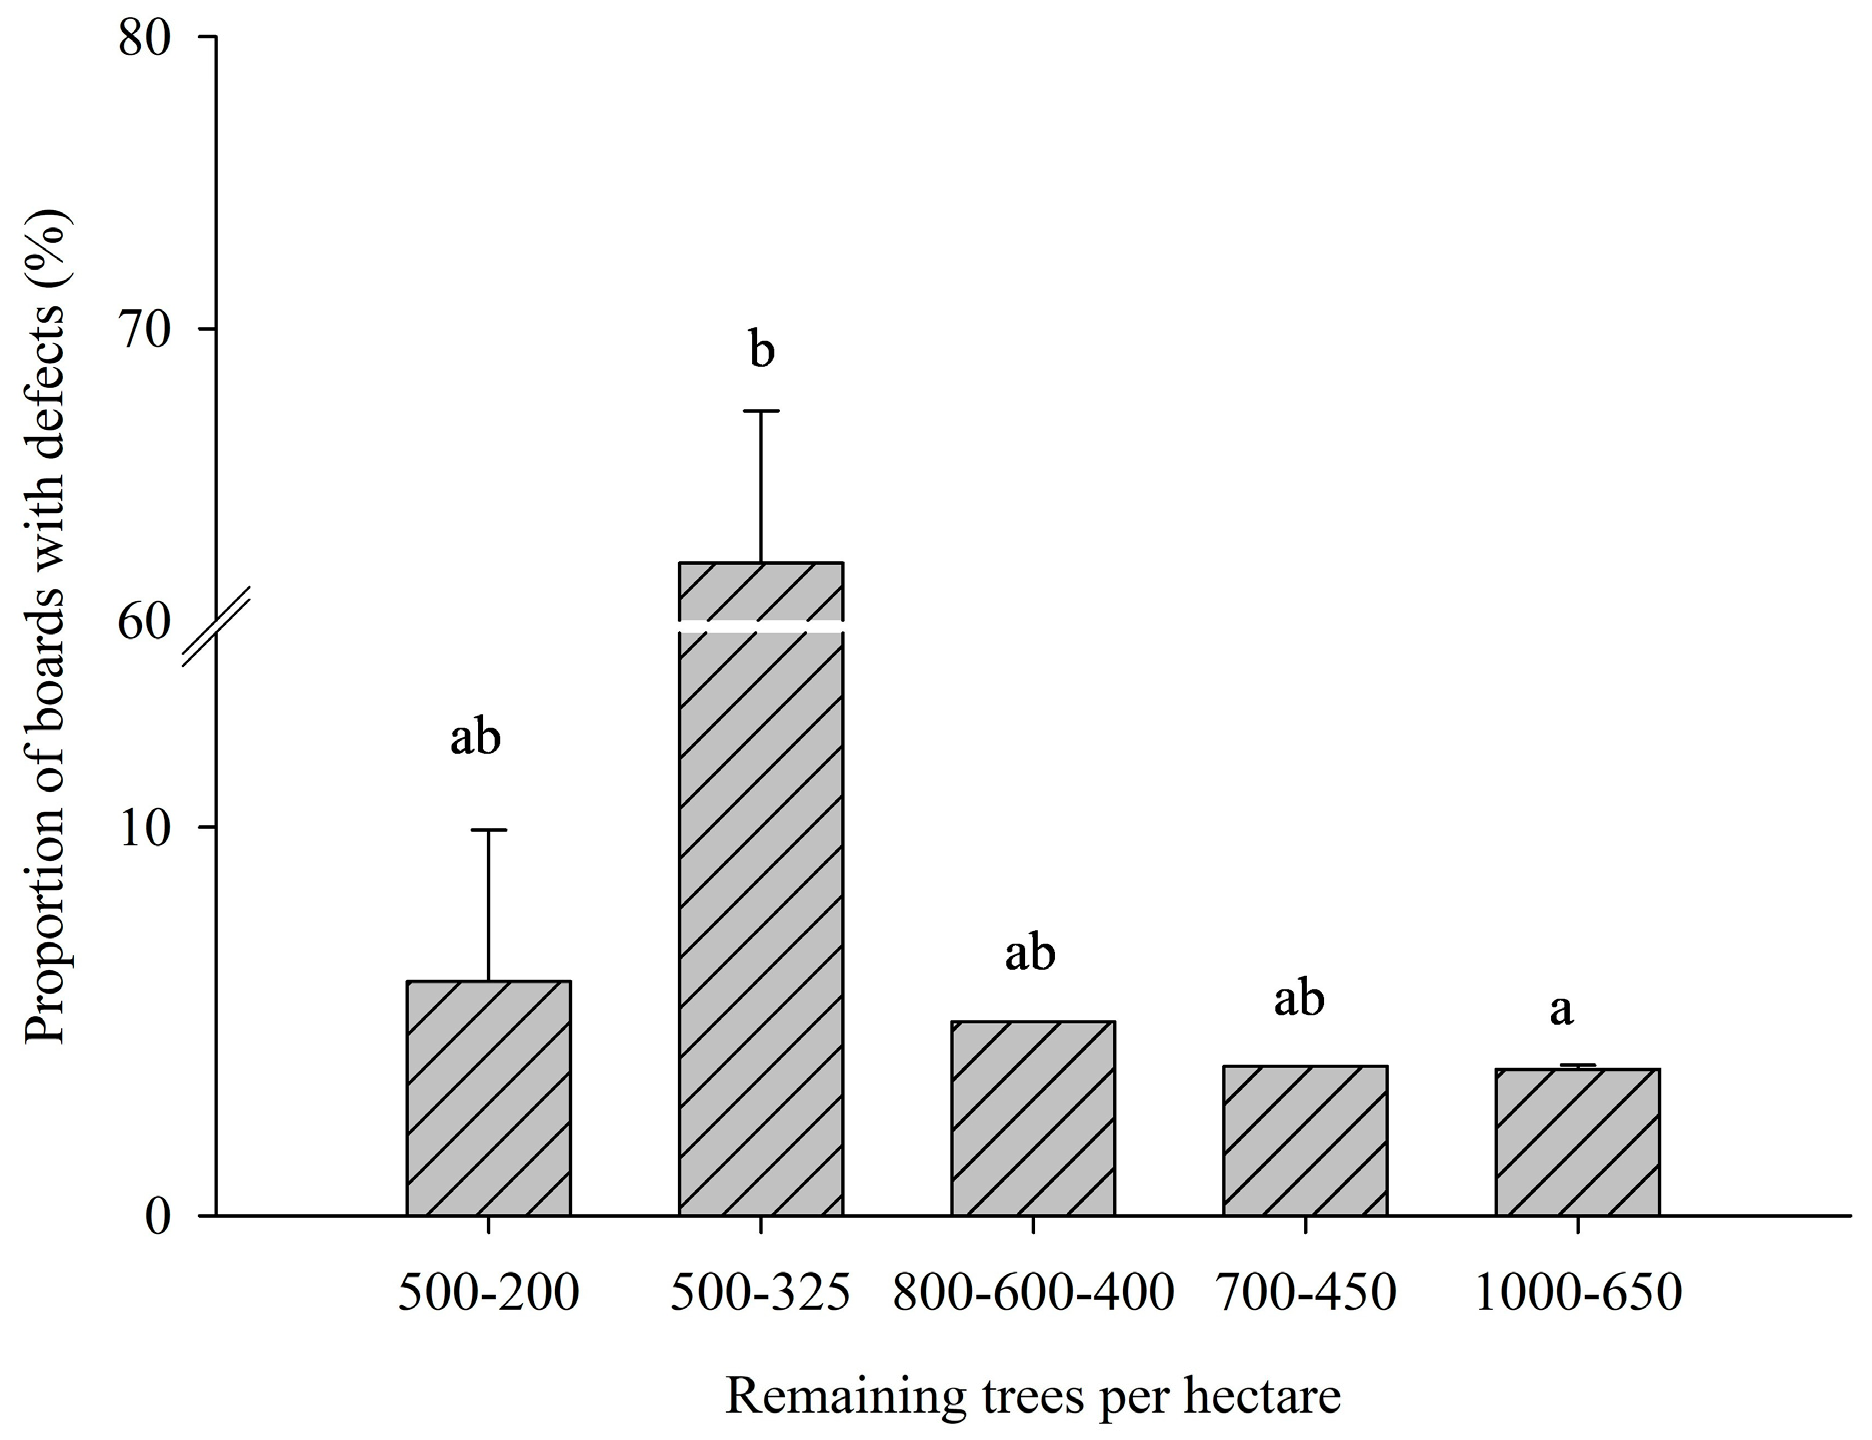
Significant differences were observed in the proportion of boards with defects among the different thinning regimes (H = 12.37, p-value = 0.0148) (Figure 10). The 500-325 trees.ha−1 thinning regime showed the highest mean value (61.9%), significantly higher than all other regimes. It was followed by the 500-200 trees.ha−1 regime, which, although not significantly different from 500 to 325 trees.ha−1, had a much lower proportion (17.6%). The 800-600-400 (13.2%), 1000-650 (10.3%), and 700-450 trees.ha−1 (5.9%) regimes showed lower proportions of defects, with no significant differences among them or compared to the 500-200 regime. The 700-450 trees.ha−1 regime had the lowest proportion of defects and was significantly different from the 500-325 trees.ha−1 regime.
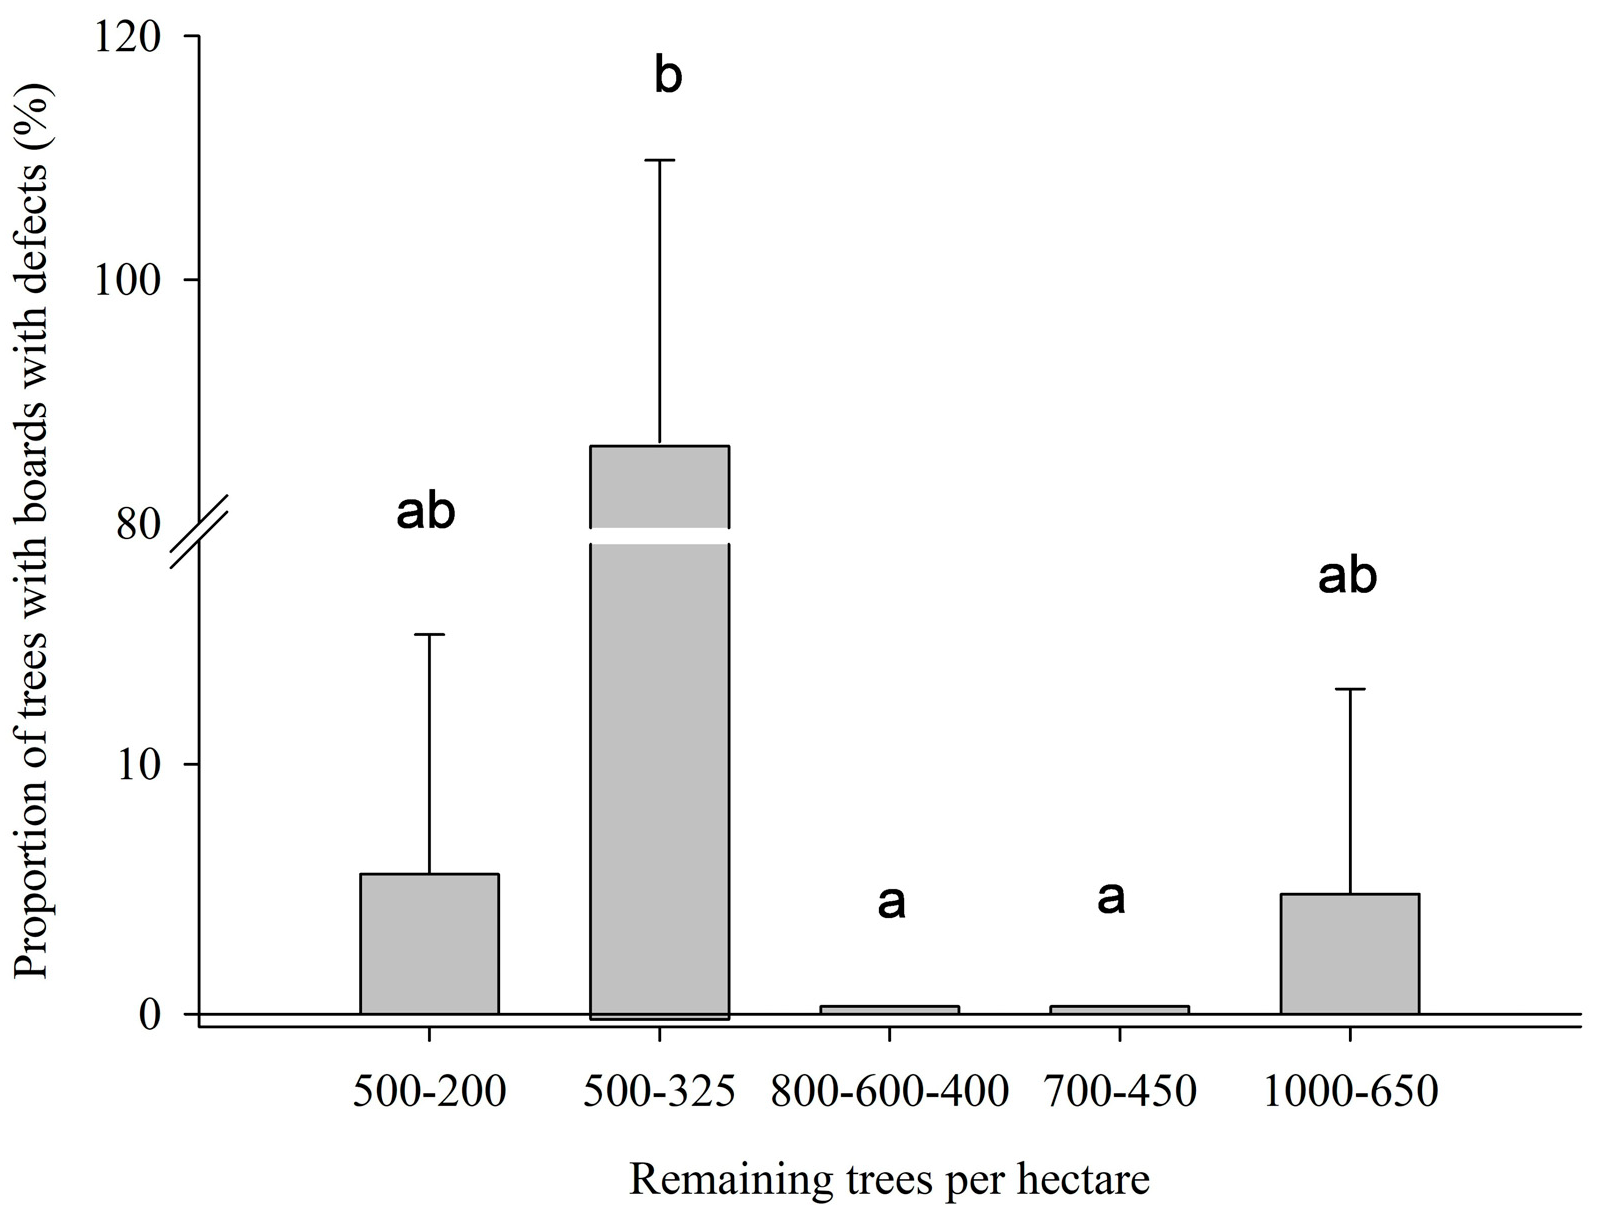
A significant effect of thinning regime was also observed when considering the proportion of trees yielding boards with severe defects, defined as those in which more than 50% of their boards were classified as boards with defects (H = 7.36, p-value = 0.0334) (Figure 11). The mean proportion of such trees also varied across treatments. The 500-325 trees.ha−1 regime again showed the highest incidence, with over 80% of trees affected. In contrast, the remaining thinning treatments exhibited much lower and more homogeneous proportions, particularly under the moderate thinning regimes.

3.3. Relationship of Dasometric and Silvicultural Variables with CW at the Growth Ring Level

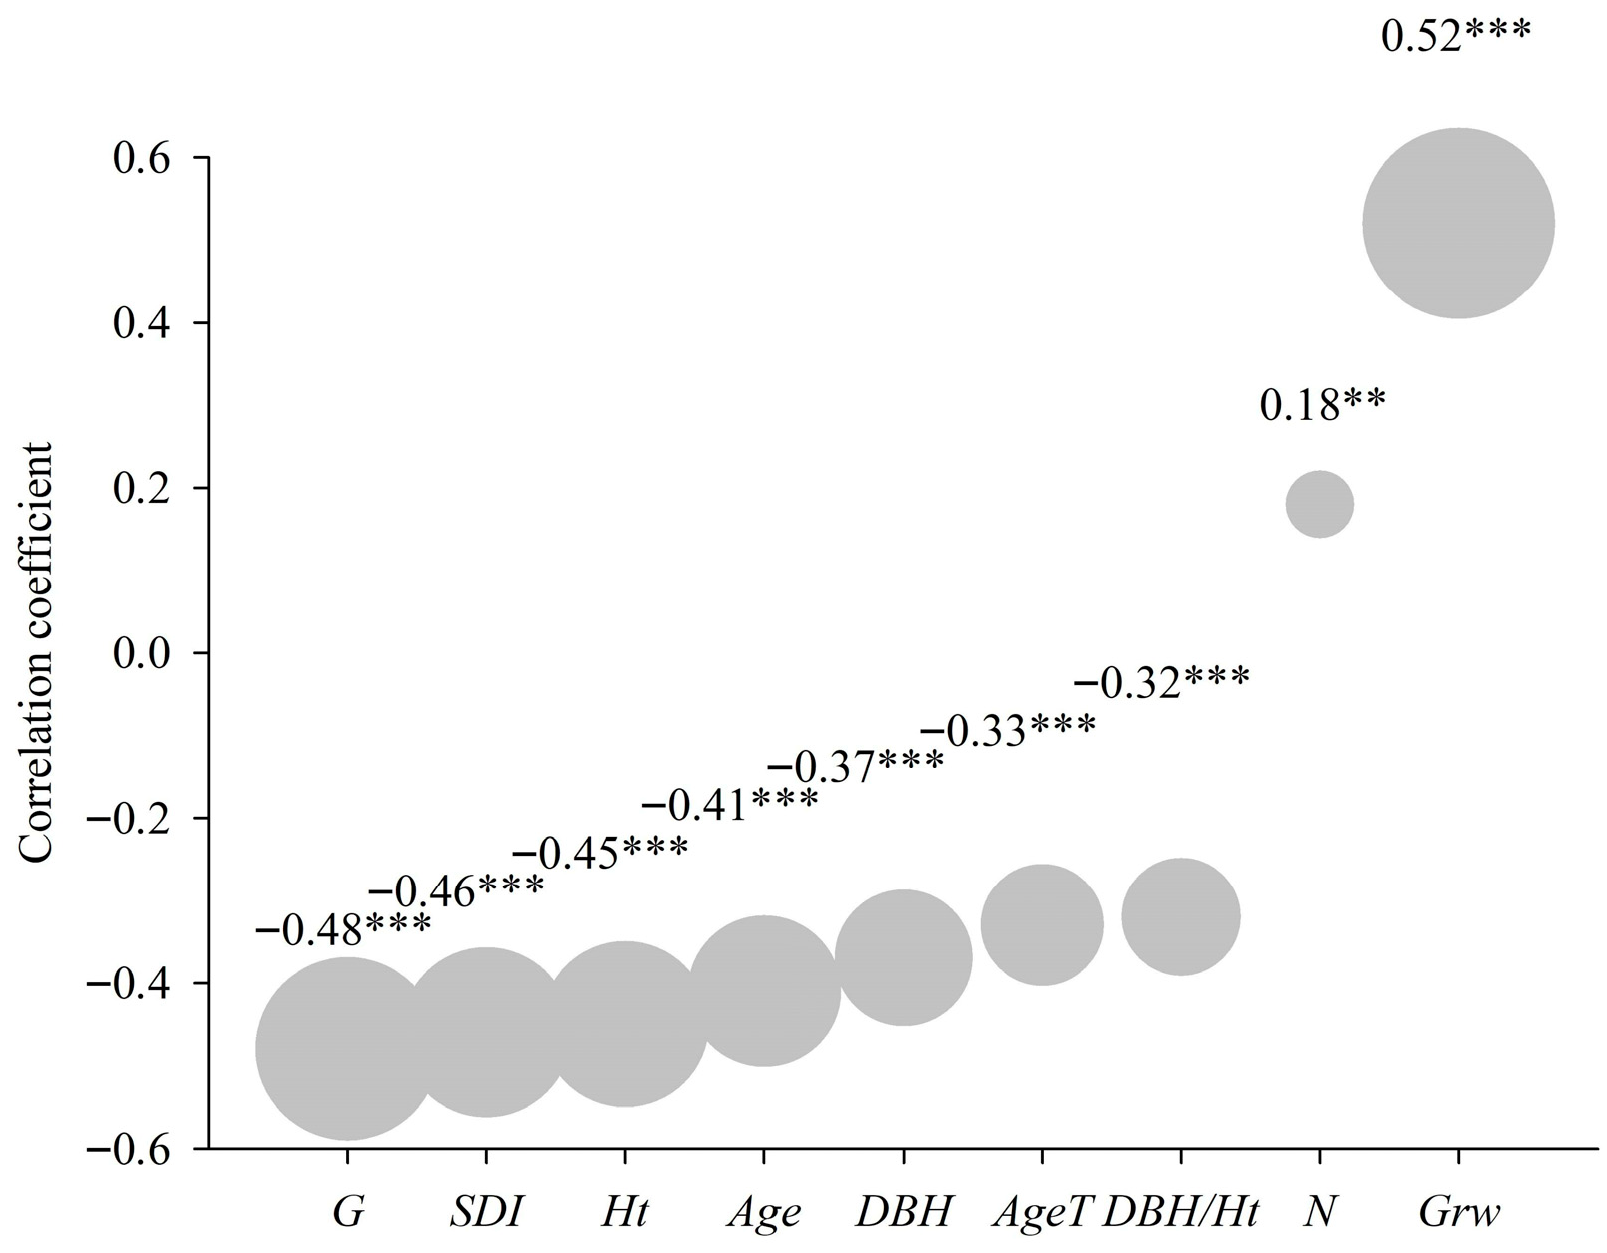
To explore these relationships, the dynamics of stand and dendrometric parameters were analyzed throughout the rotation. Correlation analysis identified notable associations between silvicultural and dendrometric variables and the proportion of CW in basal stem discs (Figure 12). The most pronounced negative associations were found for stand-level variables, such as G, SDI, and Age (Figures S3 and S4, Supplementary Material). In contrast, Grw exhibited the strongest positive correlation (rs = 0.52), indicating a tendency for greater radial growth (reflecting lower inter-tree competition) to be associated with increased CW formation. Other variables, including Age and AgeT, showed moderate negative correlations, while N displayed a weaker but still significant positive relationship. Individual growth variables such as DBH and Ht also showed moderate negative correlations with CW incidence.

3.4. Predictive Value of Visual CW Assessment on Log Ends

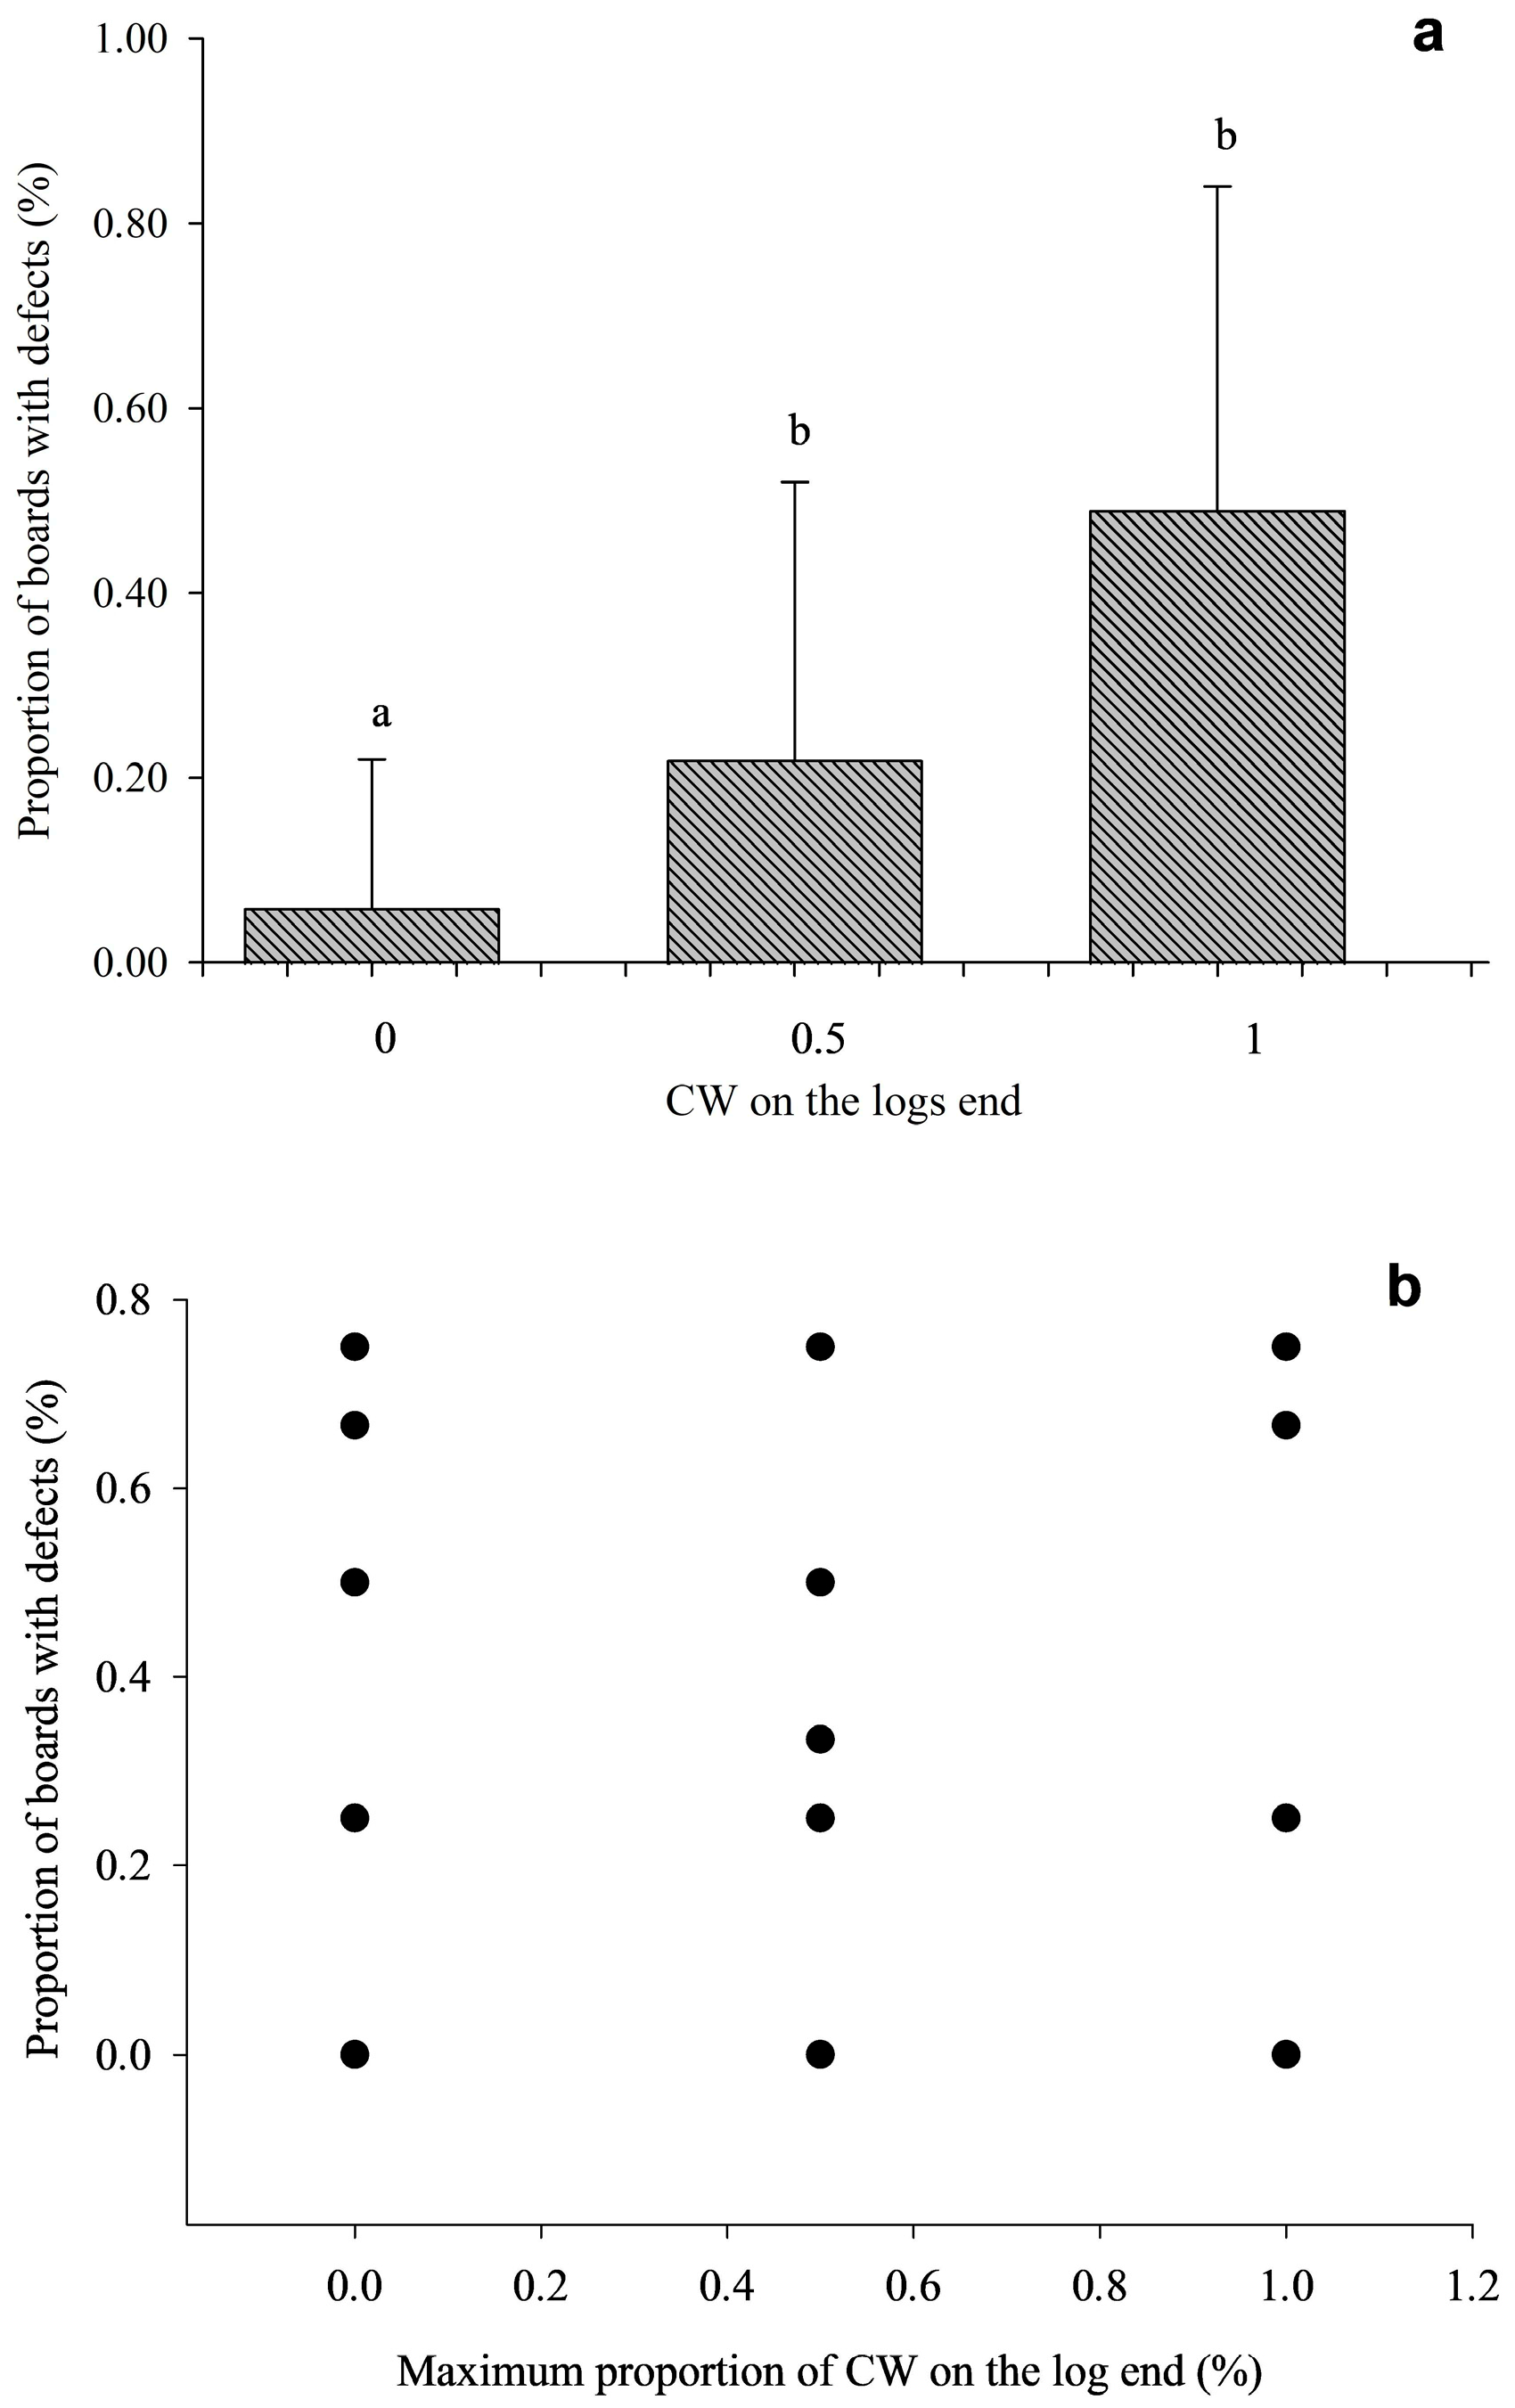
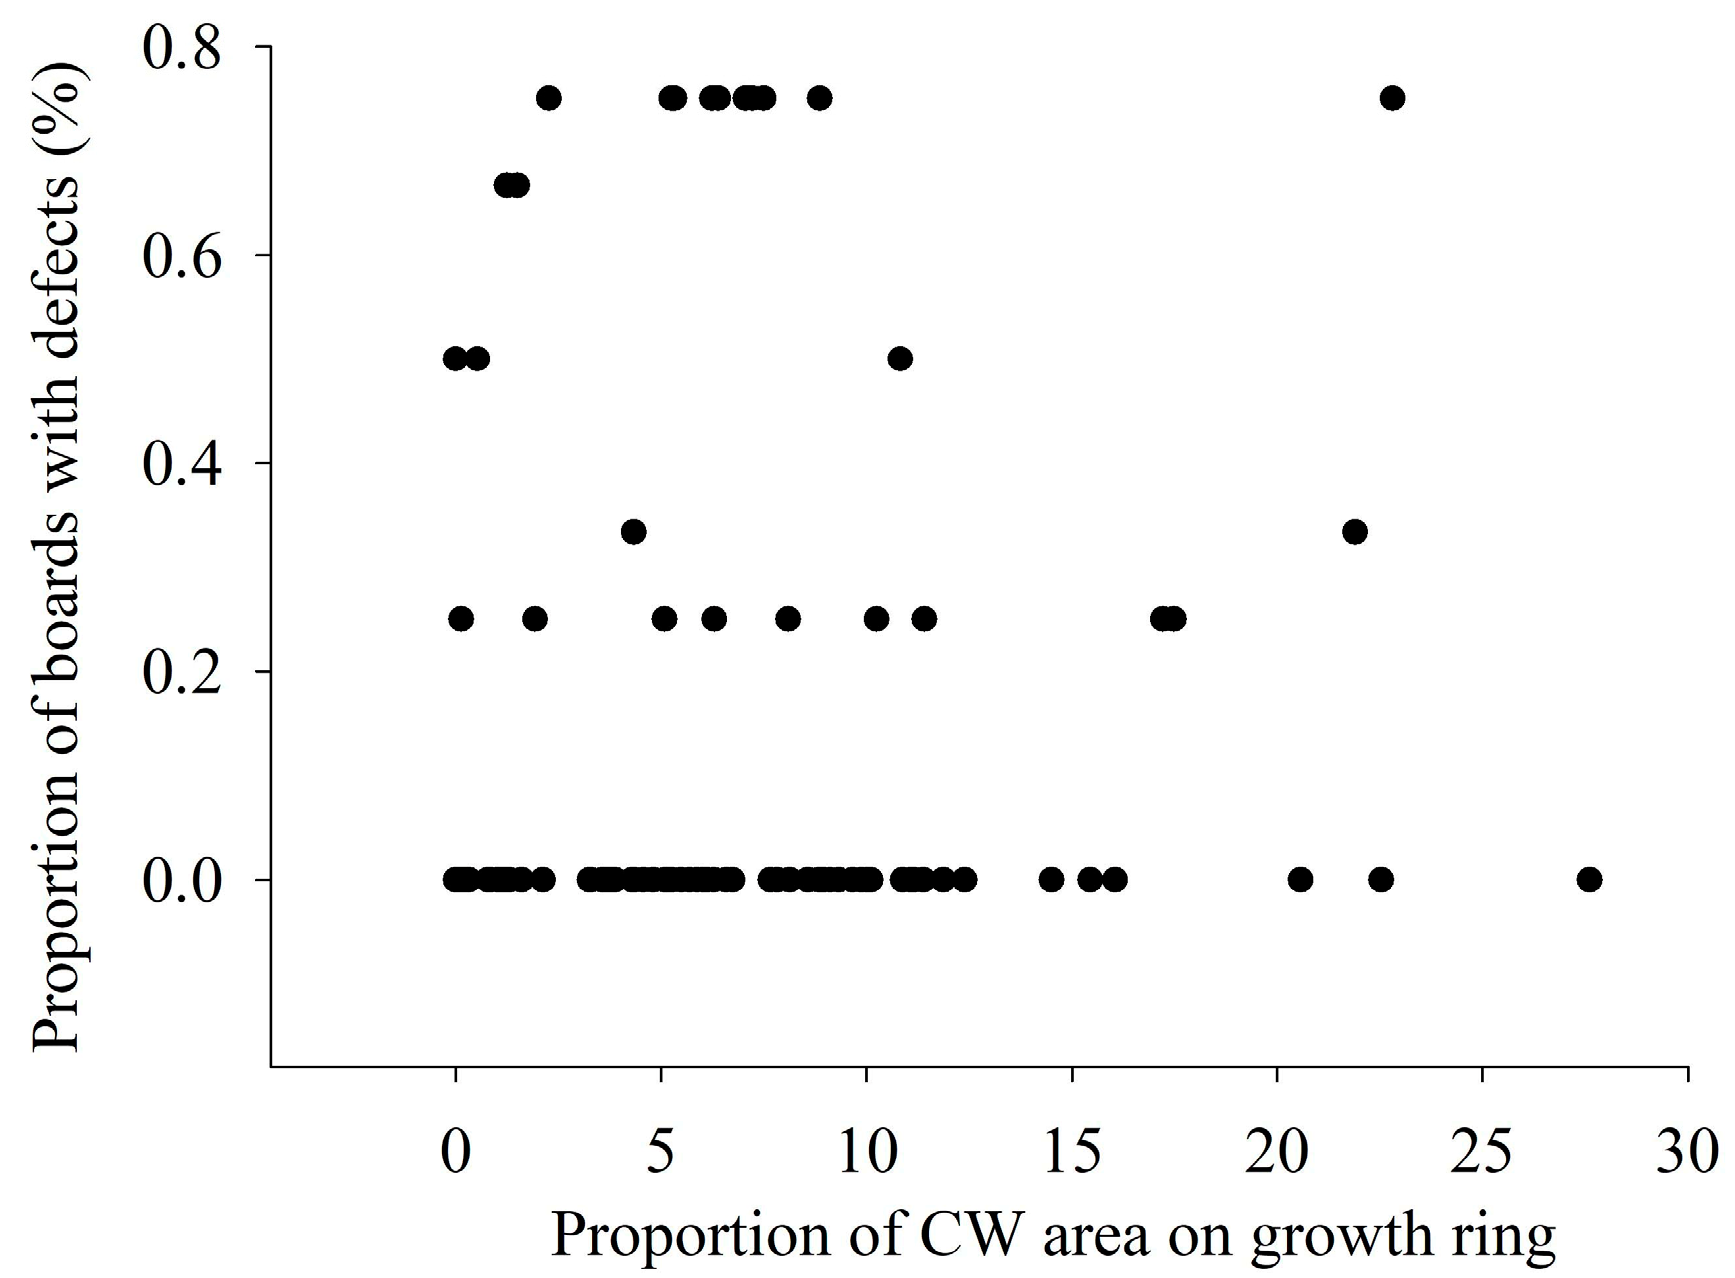
Significant differences were also observed when grouping logs by average CW stain category (0, 0.5, 1) (H = 12.6, p-value < 0.0001) (Figure 13a). Logs classified in categories 0.5 and 1 had higher proportions of boards with defects, while logs in category 0 showed the lowest values. A moderate positive correlation (rs = 0.44, p-value ≤ 0.0001) was found between the CW stain score on log ends and the proportion of boards with defects (Figure 13b). No significant relationship (rs = 0.12, p-value = 0.23) was detected between CW proportion in basal discs and the proportion of boards with defects (Figure 14).

4. Discussion

The results of this study provide new insights into CW development in Pinus taeda plantations under different thinning regimes in northern Uruguay. The findings support the hypothesis that thinning influences CW formation, although the relationship observed between both parameters is not particularly strong. The detection of a low proportion of CW suggests that its association with some silvicultural parameters is of limited magnitude. Thinning is a common management practice in these plantations, which highlights the need to understand its effect on CW formation. Previous studies conducted in the planting areas of Uruguay have shown that the presence of CW generally does not exceed 10% of the total wood volume produced. According to Bendtsen and Senft [35], Pinus taeda is highly susceptible to CW formation, particularly during the early years of growth. At these stages, CW formation occurs simultaneously with juvenile wood [30], although the two wood types differ in their chemical composition and anatomical features and arise from different causes [35]. Therefore, studying CW formation at later stages, coinciding with responses to management interventions such as pruning and thinning, is of particular interest. In general, thinning may affect growth-related variables (which are the primary target of this practice) but also crown structure, branch size, and stem inclination [9]. These factors have been identified as sources of asymmetry in light availability, ultimately causing mechanical imbalances within the stem [36]. In addition, wind exposure plays a role, particularly in stands with wider spacing, where trees are more exposed [37]. For these reasons, it is necessary to examine the relationship between silvicultural parameters and the intensity and timing of CW formation. Identifying management variables that reduce the occurrence of this abnormal wood could have a positive effect on wood quality under these production conditions. Nevertheless, results reported in the literature indicate difficulties in isolating the effect of single variables, as growth conditions strongly interact with site characteristics [38].

4.1. Influence of Thinning on Growth and Competition Among Trees

The effects of thinning were evident across all variables analyzed, which is consistent with evaluations conducted on Pinus taeda, including those from this trial [39,40,41,42]. A fairly strong indirect relationship was observed between the rate of individual tree growth and thinning intensity. The most pronounced changes occurred between years 12 and 15, a period characterized by the lowest levels of competition across all treatments. Up to this stage of the rotation, the more intensive thinning regimes (500-325, 500-200, and 800-600-400 trees.ha−1) achieved G and N values that allowed the growth potential of this species to be maximized. In contrast, the other thinning regimes entered stages of severe competition or “overstocking” from the early years [43]. These differences in site occupancy may reflect varying levels of wind exposure and their possible association with CW formation, which will be analyzed in the following sections.

4.2. Influence of Thinning Intensity and Timing on CW Formation

The low proportion of CW detected across all thinning regimes may be explained by the seed source evaluated in this case (Coastal Plain, USA), since the incidence of this parameter has been reported by several authors [44,45]. The high proportion of CW observed under one of the most intensive thinning regimes (500-325 trees·ha−1) is consistent with previous studies showing that abrupt changes in spacing and canopy structure after thinning. This can destabilize stem posture through crown imbalance or stem inclination, and thereby promote reaction wood formation, particularly under increased wind exposure [5,38]. This thinning regime combines advanced age and a low number of remaining trees, which alters the conditions of competition between individuals, as will be analyzed later.
However, another highly intensive regime (500-200 trees.ha−1) showed a notably lower incidence of CW, suggesting that thinning intensity alone does not fully explain the patterns observed. This could be because in situations of greater competition from neighbouring trees, stems tend to deviate toward areas with increased light availability
The higher levels of CW observed during the early years of growth were not related to the management variables evaluated in this study and, according to Larson et al. [30], are associated with the action of growth-promoting hormones. The temporal distribution of CW in growth rings indicated an increase in CW formation during the years following thinning across all regimes. This pattern suggests that the post-thinning period may represent a critical window for CW development. These results are consistent with numerous studies reporting that CW formation tends to increase in the years following thinning [2,46]. According to some authors, this effect is attributed to elevated levels of indole-3-acetic acid in the cambial region of several conifer species, including pines [47]. These hormonal changes are also associated with wind action, which may be more evident in more intensively thinned stands. Stem curvature due to crown weight in sites frequently exposed to wind has also been reported as a contributing factor [37]. Additionally, some authors have linked stem taper with CW formation, although through mechanisms other than tree population density [48]. Results obtained from a trial of different pruning schemes located near our thinning trial show that CW presence occurs to a greater extent on the side opposite the predominant wind direction in that area (See Figure S5, Supplementary Materials). Records from 2009 onwards of wind direction and speed in the test area show that the most intense and most frequent winds occur from the south–southeast areas [23].
CW levels in the final stages of growth decreased markedly, indicating the disappearance of predisposing factors for its formation regardless of the thinning regime applied. The highest incidence of CW following thinning was detected around ages 18–20, but under the more intensive thinning regimes this effect persisted over longer periods. The reduction in CW presence after the thinning phase is consistent with the findings of Cown [49] and Voorhies [50], who evaluated P. radiata and P. ponderosa, respectively.

4.3. Implications of CW on Product Quality

The results obtained from board defects followed the same trend as the visual observations of CW presence on the log faces. The defects observed in boards containing CW are primarily attributed to greater longitudinal shrinkage compared to normal wood [2,51]. These shrinkage effects, which are more evident after drying, are mainly due to three characteristic features of CW relative to normal wood: (i) a larger microfibril angle in the S2 layer of tracheid walls [52,53], (ii) higher lignin and polysaccharide content [54,55,56], and (iii) greater tracheid wall thickness [57]. Several studies on Pinus radiata have also shown that the microfibril angle can be influenced by spacing, with more intensive thinning leading to an increase in this variable [58,59,60,61]. The increase in CW content can also affect wood properties that have implications for its end use. Results obtained by Diaz-Vaz et al. [4] show that CW has higher basic density values than normal wood, although these differences depend largely on the level of this abnormal wood. This is mainly explained by an increase in the thickness of the tracheid walls, which in turn leads to higher compressive strength values parallel to the grain [62] while simultaneously decreasing the modulus of elasticity due to alterations in the microfibril angle [63], as mentioned previously. Another negative effect of the presence of CW is a reduction in the drying rate of boards in the order of 40 to 100% [64].

4.4. Relationship Between CW and Growth Dynamics

The correlation analysis suggests that CW development may be influenced by a combination of factors related to both tree growth dynamics and stand structure. Although several variables were statistically associated with CW incidence, such as G, SDI, and Grw, most relationships were of moderate strength. The apparent contradiction in the relationship obtained between individual growth rates (obtained with more intensive thinning) and the presence of CW could indicate that the correlation values obtained (−0.45 and −0.37) are not due to a biological cause. Therefore, individual growth rates do not appear to be a relevant factor in the formation of this type of wood. At the time of the second intervention, the 500-200 trees.ha−1 regime (thinned at age 9) was still in a phase of moderate-to-low competition. On the other hand, the 500-325 trees.ha−1 regime (thinned at age 12) had already reached higher competition pressure by the time of intervention. Among all the regimes evaluated, this was the only case where competition level changed from severe to increasing at the time of the second thinning. This was reflected in the change in basal area growth rate, which may help explain the higher presence of CW [65]. According to de Villiers [66], thinning at advanced stages of the rotation tends to result in a high proportion of suppressed trees (due to elevated competition), which are relatively flexible and less stable.
In addition to these variables, other factors, such as wind action—which tends to be more evident under wider spacing—have also been reported to influence CW formation. From the stand managementperspective, this outcome is particularly relevant, as it suggests that moderate or light thinning may help minimize CW formation and its negative impact on product quality.
Among the treatments evaluated in this study, the 500-325 trees.ha−1 regime most closely resembles those applied in commercial practice in terms of rotation timing and residual stand density. From the perspective of yield and wood quality, this regime recorded the highest levels of individual growth, as well as one of the highest levels of CW and board defects. In this regard, the implementation of some intermediate thinning should be considered, for example, around the age of 6, with a remaining population of 650 trees.ha−1. This would prevent a more abrupt change in growth rates and exposure to wind. With a thinning scheme of around 650-450-325 trees.ha−1, it would be possible to achieve high DBH values, which is one of the desired objectives, in addition to a low presence of CW. Implementing additional thinning would increase operating costs, so it would be necessary to analyze the cost–benefit ratio of this type of thinning scheme.

4.5. Value of Visual Assessment on Log Ends

Given the similarity observed in CW stain values at the ends of logs, visual grading does not appear to be sufficiently precise to quantify CW presence in all cases [67]. This limitation is particularly relevant when CW occurs at low to moderate levels, as was the case in this study.
Although the correlation was moderate (rs = 0.44, p value < 0.0001), these findings confirm that external visual cues can serve as effective proxies in operational settings, particularly when more advanced assessments are not feasible. It should be noted, however, that not all trees with severe CW exhibit the characteristic darker staining bands [2]. Based on the results obtained in Uruguay under conditions similar to those of this study, identifying severe levels of CW presence improves the prediction of defects observed after sawing. However, the visual grading of logs is not very accurate as an indicator of the presence of WC in cases of low levels of this type of abnormal wood.

5. Conclusions

CW occurrence in Pinus taeda was influenced by thinning regime and subsequent stand development. Moderate thinning regimes resulted in lower CW-related defects, indicating that thinning can be used as a management tool to improve wood quality. Therefore, operational thinning strategies should be evaluated for their ability to minimize CW occurrence while maintaining diameter growth objectives. Competition conditions, thinning time, and wind exposure are the factors that together have the greatest relationship with the formation of CW. Visible CW stain on log ends can assist in identifying higher-risk logs, but this should be used as a supportive, not exclusive, screening tool. The overall moderate relationships observed confirm that CW is multifactorial, highlighting the need for future research integrating silvicultural context with tree structural (e.g., stem lean and crown asymmetry) and environmental (e.g., wind exposure) factors to better explain CW formation and improve wood quality.

Supplementary Materials

The following supporting information can be downloaded at https://www.mdpi.com/article/10.3390/f16121766/s1, Figure S1. Schematic representation of the distribution of plots in the field; Figure S2. Evolution of mean tracheid length (±SD) across the evaluated age range; Figure S3. Correlation values of the variables Age, Aget, Ht, and N versus the presence of CW in growth rings; Figure S4. Correlation values of the variables G, SDI, Grw, and DBH versus the presence of CW in growth rings, Figure S5. Average CW values in growth rings in each octant based on different pruning schemes; Table S1. Average number of rows and trees per row by block from evaluated plot, Table S2. Average values of wall thickness and length of early- and late-wood tracheids in compression and normal wood. Different letters indicate significant post hoc differences between types of wood at alpha = 0.05 based on a Tukey HSD test; Table S3. Table classification categories based on commercial requirements.

Author Contributions

C.P. and F.R., planned and designed the research, C.P. conducted fieldwork, data elaboration, and analysis through their Master of Science thesis work. C.P. and F.R. wrote the manuscript. F.R., C.R.-C. and A.H. contributed to the analysis of the data. All authors have read and agreed to the published version of the manuscript.

Funding

This study was funded by the National Research Institute of Agricultural Research (INIA) through research project executed from 2002 to date. Currently, this area of research is being funded by the i-FORES project (INIA-FO_35_0_00: Herramientas de información integradas para el manejo silvicultural eficiente y sustentable). The author was also supported by a National Master’s Scholarship (POS_NAC_2020_1_164204) awarded by the National Agency for Research and Innovation (ANII, Uruguay). Additional support was provided through an extension fellowship from the Comisión Académica de Posgrado (CAP).

Data Availability Statement

The data presented in this study are available on request.

Acknowledgments

The authors thank ANII, CAP and INIA for contributing with funding, Cambium and Lumin for their collaboration in the establishment and management of the experimental trial, and to UPM for granting access to the site for field sampling. Thanks to the company Arboreal for their collaboration in drying the boards. We specially thank the researchers Juan Pedro Posse and Daniel Ramirez, for proposing the experiment and providing thegrowth information used in this work.

Conflicts of Interest

The authors declare no conflicts of interest.

References

  1. Gonzalez-Benecke, C.A.; Gezan, S.A.; Albaugh, T.J.; Allen, H.L.; Burkhart, H.E.; Fox, T.R.; Jokela, E.J.; Maier, C.A.; Martin, T.A.; Rubilar, R.A.; et al. Local and general above-stump biomass functions for loblolly pine and slash pine trees. For. Ecol. Manag. 2014, 334, 254–276. [Google Scholar] [CrossRef]
  2. Malan, F.S.; Kassier, W.E. Compression wood in South African-grown Pinus taeda: Extent, causes and economic impact. S. Afr. J. For. 2002, 194, 27–36. [Google Scholar]
  3. Schweitzer, V.R.; Matos, J.L.M.D. Origem do “lenho anormal de compressão” e efeitos sobre a qualidade da madeira de Pinus taeda da Região Serrana de Santa Catarina. Aust. J. Basic Appl. Sci. 2019, 13, 36–45. [Google Scholar] [CrossRef]
  4. Díaz-Vaz, J.E.; Valenzuela, L.; Vera, S. Compression wood in Pinus radiata II: Density and chemical composition. Maderas Cienc. Tecnol. 2009, 11, 123–132. [Google Scholar] [CrossRef]
  5. Lachenbruch, B.; Droppelmann, F.; Balocchi, C.; Peredo, M.; Pérez, E. Stem form and compression wood formation in young Pinus radiata trees. Can. J. For. Res. 2010, 40, 26–36. [Google Scholar] [CrossRef]
  6. Du Toit, A.J. A study of the influence of compression wood on the warping of Pinus radiata D. Don timber. S. Afr. J. For. 1963, 44, 11–15. [Google Scholar]
  7. Burdon, R.D. Compression wood in Pinus radiata clones on four different sites. N. Z. J. For. Sci. 1975, 5, 152–164. [Google Scholar]
  8. Cown, D.J.; McConchie, D.L. Effects of thinning and fertiliser application on wood properties of Pinus radiata. N. Z. J. For. Sci. 1981, 11, 79–91. [Google Scholar]
  9. Low, A.J. A study of compression wood in Scots pine (Pinus sylvestris L.). Forestry 1964, 37, 179–201. [Google Scholar] [CrossRef]
  10. Riesco Muñoz, G.; Soilán Cañas, M.A.; Rodríguez Soalleiro, R. Physical properties of wood in thinned Scots pines (Pinus sylvestris L.) from plantations in northern Spain. Ann. For. Sci. 2008, 65, 507. [Google Scholar] [CrossRef]
  11. Cameron, A.; Thomas, K. Effect of thinning on the development of compression wood in stems of Corsican pine (Pinus nigra L.). Eur. J. For. Res. 2008, 127, 247–251. [Google Scholar] [CrossRef]
  12. Kılıç, A.; Sarıusta, S.E.; Hafızoğlu, H. Chemical structure of compression wood of Pinus sylvestris, P. nigra and P. brutia. J. Bartin Fac. For. 2010, 12, 33–39. Available online: https://www.cabidigitallibrary.org/doi/full/10.5555/20113211773 (accessed on 1 April 2025).
  13. Ministerio de Ganadería, Agricultura y Pesca (MGAP). Superficie Forestal del Uruguay (Bosques Plantados). Available online: https://www.gub.uy/ministerio-ganaderia-agricultura-pesca (accessed on 12 July 2025).
  14. Cattáneo, A.; Metol, C. Mejoramiento Genético Forestal en Uruguay. In Plan Nacional de Investigación Forestal; MGAP-INIA: Montevideo, Uruguay, 2003; pp. 35–49. [Google Scholar]
  15. Duncker, P.; Spiecker, H. Incidence and structural properties of compression wood in European conifers-A review. Forestry 2014, 87, 456–471. [Google Scholar]
  16. Díaz Vaz, O.J.E. Anatomía de Maderas; Universidad Austral de Chile: Valdivia, Chile, 2003. [Google Scholar]
  17. Timell, T.E. Compression Wood in Gymnosperms; Springer: Berlin/Heidelberg, Germany, 1986. [Google Scholar]
  18. Donaldson, L.A.; Singh, A.P. Formation and Structure of Compression Wood. In Cellular Aspects of Wood Formation; Fromm, J., Ed.; Springer: Berlin/Heidelberg, Germany, 2013; pp. 225–256. [Google Scholar] [CrossRef]
  19. Wimmer, R.; Johansson, K. Effects of reaction wood on the performance of wood and wood-based products. In Reaction Wood; Gardiner, B., Barnett, J., Saranpää, P., Gril, J., Eds.; Springer: Berlin/Heidelberg, Germany, 2013; pp. 211–234. [Google Scholar]
  20. Bamber, R.K.; Burley, J. The wood properties of conifers. For. Abstr. 1983, 44, 567–643. [Google Scholar]
  21. Cown, D.J. Effects of severe thinning and growth rate on wood characteristics of Pinus radiata. N. Z. J. For. Sci. 1974, 4, 456–471. [Google Scholar]
  22. Museo Virtual de Suelos. Available online: https://museovirtualdesuelos.net/ (accessed on 12 September 2025).
  23. Instituto Nacional de Investigación Agropecuaria (INIA). GRAS—Banco de Datos Agroclimáticos. Available online: https://www.inia.uy/gras/Clima/Banco-datos-agroclimatico (accessed on 16 October 2025).
  24. Donaldson, L.; Xu, P.; Cairns, T.; Nieuwoudt, M. Quantification of Compression Wood Severity in Tracheids of Radiata Pine (Pinus radiata D. Don) Using Confocal Microscopy and Image Analysis. Wood Sci. Technol. 2009, 43, 557–575. [Google Scholar] [CrossRef]
  25. Duncker, P. Detection and Grading of Compression Wood. In From Science to Quality Products; Springer: Berlin/Heidelberg, Germany, 2010; pp. 155–175. [Google Scholar] [CrossRef]
  26. Wardrop, A.B.; Dadswell, H.E. The nature of reaction wood II. The cell wall organization of compression wood tracheids. Aust. J. Sci. Res. B Biol. Sci. 1950, 3, 1–13. [Google Scholar] [CrossRef]
  27. Wardrop, A.B.; Davies, G.W. The nature of reaction wood VIII. The structure and differentiation of compression wood. Aust. J. Bot. 1964, 12, 24–38. [Google Scholar] [CrossRef]
  28. Côté, W.A., Jr.; Day, A.C.; Kutscha, N.P.; Timell, T.E. Studies on compression wood V. Nature of compression wood formed in the early springwood of conifers. Holzforschung 1967, 21, 180–186. [Google Scholar] [CrossRef]
  29. Kraus, J.E.; Arduin, M. Manual Básico de Métodos em Morfologia Vegetal; Universidade Federal Rural do Rio de Janeiro: Seropédica, Brazil, 1997. [Google Scholar]
  30. Larson, P.R.; Kretschmann, D.E.; Isebrands, J.G. Formation and Properties of Juvenile Wood in Southern Pines: A Synopsis; USDA Forest Service, Forest Products Laboratory: Rhinelander, WI, USA, 2001. [Google Scholar]
  31. Zobel, B.J.; van Buijtenen, J.P. Wood Variation: Its Causes and Control; Springer: Berlin/Heidelberg, Germany, 1989. [Google Scholar] [CrossRef]
  32. Instituto Uruguayo de Normas Técnicas (UNIT). Maderas—Determinación de las Deformaciones: Arqueadura, Encorvadura, Alabeo y Torsión (UNIT 1461); UNIT: Montevideo, Uruguay, 2010. [Google Scholar]
  33. UNE-EN 14081-1:2016+A1:2020; Timber Structures—Strength Graded Structural Timber with Rectangular Cross Section—Part 1: General Requirements. Asociación Española de Normalización (UNE): Madrid, Spain, 2020.
  34. Di Rienzo, J.A.; Casanoves, F.; Balzarini, M.G.; González, L.; Tablada, M.; Robledo, C.W. InfoStat Software, Version 2020; Grupo InfoStat, FCA; Universidad Nacional de Córdoba: Córdoba, Argentina, 2020.
  35. Bendtsen, B.A.; Senft, J. Mechanical and anatomical properties in individual growth rings of plantation-grown eastern cottonwood and loblolly pine. Wood Fiber Sci. 1986, 18, 23–38. [Google Scholar]
  36. Fourcaud, F.; Blaise, P.; Lac, P.; Castéra, P.; De Reffye, P. Numerical modelling of shape regulation and growth stresses in trees: II. Implementation in the AMAPpara software and simulation of tree growth. Trees 2003, 17, 31–39. [Google Scholar] [CrossRef]
  37. Macdonald, E.; Gardiner, B.; Mason, W. The effects of transformation of even-aged stands to continuous cover forestry on conifer log quality and wood properties in the UK. Forestry 2010, 83, 1–16. [Google Scholar] [CrossRef]
  38. Gardiner, B.; Barnett, J.; Saranpää, P.; Gril, J. The Biology of Reaction Wood; Springer: Berlin/Heidelberg, Germany, 2014. [Google Scholar]
  39. Fassola, H.E.; Moscovich, F.A.; Ferrere, P.; Rodríguez, F.A. Evolución de las principales variables de árboles de Pinus taeda L. sometidos a diferentes tratamientos silviculturales en el nordeste de la provincia de Corrientes, Argentina. Ciência Florest. 2002, 12, 51–60. [Google Scholar] [CrossRef]
  40. Crechi, E.; Fassola, H.; Moscovich, F.; Fernández, R.; Friedl, R.; Falher, J. Efecto de la intensidad y oportunidad de raleo en Pinus taeda. In Proceedings of the 2nd Simposio Latino-Americano Sobre Manejo Forestal, Santa Maria, Brazil, 13–14 September 2001; pp. 189–210. [Google Scholar]
  41. Martiarena, R.; Crechi, E.; Von Wallis, M.P.A.; Marquina, J.; Monteoliva, S. Effect of thinning treatment on growth and wood density of Pinus taeda planted in Misiones, Argentina. Ciência Florest. 2014, 24, 655–663. [Google Scholar] [CrossRef]
  42. Uranga, M.L. Modelación de la Respuesta de Pinus taeda a Diferentes Regímenes de Raleo en la Zona Norte del País. Master’s Thesis, Facultad de Agronomía, Universidad de la República, Montevideo, Uruguay, 2017. [Google Scholar]
  43. Pezzutti, R.; Caldato, S.; Schenone, R.; Chrapek, C. Elaboración de un diagrama de manejo de densidad de plantaciones de Pinus taeda para productores forestales. In Proceedings of the XXXIX Jornadas Forestales de Entre Ríos, Concordia, Argentina, 7 November 2020; pp. 1–5. [Google Scholar]
  44. Malan, F.; Kassier, H. Abnormal compression wood in Pinus taeda: A review of current knowledge and proposed future strategy. S. Afr. J. For. 2002, 194, 43–51. [Google Scholar]
  45. Nanayakkara, B.; Lagane, F.; Hodgkiss, P.; Dibley, M.; Smaill, S.; Riddell, M.; Harrington, J.; Cown, D. Effects of induced drought and tilting on biomass allocation, wood properties, compression wood formation and chemical composition of young Pinus radiata genotypes (clones). Holzforschung 2014, 68, 455–465. [Google Scholar] [CrossRef]
  46. Barbour, R.J.; Marshall, D.D.; Lowell, E.C. Managing for wood quality. In Applications of Process Modeling in Forest Management; Springer: Dordrecht, The Netherlands, 2003; pp. 299–336. [Google Scholar] [CrossRef]
  47. Sundberg, B.; Tuominen, H.; Anthony, C.H. Effects of indole-3-acetic acid (IAA) transport. In Plant Growth Substances 1991; Springer: Berlin/Heidelberg, Germany, 1994; pp. 469–476. [Google Scholar]
  48. Van Der Sijde, H.A.; Shaw, M.; Van Wyk, G. Reaction wood in Pinus taeda-A preliminary report. S. Afr. J. For. 1985, 133, 27–32. [Google Scholar] [CrossRef]
  49. Cown, D.J. Comparison of the effects of two thinning regimes on some wood properties of radiata pine. N. Z. J. For. Sci. 1973, 4, 540–551. [Google Scholar]
  50. Voorhies, G. Incidence and severity of compression wood in thinned stands of young-growth ponderosa pine. Ariz. For. Notes 1982, 15, 12. [Google Scholar]
  51. Chen, Q.; Hu, Z.; Chang, H. Micro analytical methods for determination of compression wood content in loblolly pine. J. Wood Chem. Technol. 2007, 27, 169–178. [Google Scholar] [CrossRef]
  52. Donaldson, L.A.; Turner, J.C.P. The influence of compression wood and microfibril angle on the occurrence of distortion in window frames made from Pinus radiata. Holz Roh Werkst. 2001, 59, 163–168. [Google Scholar] [CrossRef]
  53. Xu, P.; Liu, H.; Evans, R.; Donaldson, L.A. Longitudinal shrinkage behaviour of compression wood in radiata pine. Wood Sci. Technol. 2009, 43, 423–439. [Google Scholar] [CrossRef]
  54. Brennan, M.; McLean, J.P.; Altaner, C.M.; Ralph, J.; Harris, P.J. Cellulose microfibril angles and cell-wall polymers in different wood types of Pinus radiata. Cellulose 2012, 19, 1385–1404. [Google Scholar] [CrossRef]
  55. Leonardon, M.; Altaner, C.M.; Vihermaa, L.; Jarvis, M.C. Wood shrinkage: Influence of anatomy, cell wall architecture, chemical composition and cambial age. Eur. J. Wood Wood Prod. 2010, 68, 87–94. [Google Scholar] [CrossRef]
  56. Zhang, M.; Smith, B.G.; McArdle, B.H.; Chavan, R.R.; James, B.J.; Harris, P.J. Dimensional changes of tracheids during drying of Pinus radiata compression woods: A study using variable-pressure scanning electron microscopy (VP-SEM). Plants 2018, 7, 14. [Google Scholar] [CrossRef]
  57. Harris, J.M. Physical properties, resin content, and tracheid length of lodgepole pine grown in New Zealand. N. Z. J. For. Sci. 1973, 3, 263–278. [Google Scholar]
  58. Lasserre, J.P.; Mason, E.G.; Watt, M.S.; Moore, J.R. Influence of initial planting spacing and genotype on microfibril angle, wood density, fibre properties and modulus of elasticity in Pinus radiata D. Don corewood. For. Ecol. Manag. 2009, 258, 1924–1931. [Google Scholar] [CrossRef]
  59. Watt, M.S.; Zoric, B.; Kimberley, M.O.; Harrington, J. Influence of stocking on radial and longitudinal variation in modulus of elasticity, microfibril angle, and density in a 24-year-old Pinus radiata thinning trial. Can. J. For. Res. 2011, 41, 1422–1431. [Google Scholar] [CrossRef]
  60. Grace, J.C.; Evans, R. Impact of thinning and pruning on selected wood properties in individual radiata pine trees in New Zealand. N. Z. J. For. Sci. 2012, 42, 117–129. [Google Scholar]
  61. Erasmus, J.; Kunneke, A.; Drew, D.M.; Wessels, C.B. The effect of planting spacing on Pinus patula stem straightness, microfibril angle and wood density. Forestry 2018, 91, 247–258. [Google Scholar] [CrossRef]
  62. Gindl, W. Comparing mechanical properties of normal and compression wood in Norway spruce: The role of lignin in compression parallel to the grain. Holzforschung 2002, 56, 395–401. [Google Scholar] [CrossRef]
  63. Sonderegger, W.; Mandallaz, D.; Niemz, P. An investigation of the influence of selected factors on the properties of spruce wood. Wood Sci. Technol. 2008, 42, 281–298. [Google Scholar] [CrossRef]
  64. Davis, C.P.; Carrington, C.G.; Sun, Z.F. The influence of compression wood on the drying curves of Pinus radiata dried in dehumidifier conditions. Dry Technol. 2007, 20, 2005–2026. [Google Scholar] [CrossRef]
  65. Barger, R.; Ffolliott, P. Factors affecting occurrence of compression wood in individual ponderosa pine trees. Wood Sci. Technol. 1976, 8, 201–208. [Google Scholar]
  66. de Villiers, A.M. Silvicultural, exploitation and conversion methods that affect timber quality. S. Afr. For. J. 1966, 56, 5–10. [Google Scholar] [CrossRef]
  67. Donaldson, L.A.; Singh, A.P.; Yoshinaga, A.; Takabe, K. Lignin distribution in mild compression wood of Pinus radiata. Can. J. Bot. 1999, 77, 41–50. [Google Scholar]
Figure 1. Geographic location of the experimental site. Regions prioritized for forest plantations (Forests regions) including trial locations at Rivera (red square), according to the National Commission for Agroeconomic Studies of the Land Classification (CO.N.E.A.T.), soils correspond to groups 2, 7, 8 and 9 have an adequate soil fertility for forest plantation.
Forests 16 01766 g001
Figure 2. Categories of compression wood presence: (a) absent, (b) low, (c) moderate, and (d) severe.
Forests 16 01766 g002
Figure 3. Schematic representation of the log sawing system.
Forests 16 01766 g003
Figure 4. Evolution of stand and growth variables under the different thinning regimes. Below the dotted line: Free growth (SDI < 30%), between the dotted and dashed line: increasing competition (30% < SDI < 55%), above the dashed line: fully stocked (SDI > 55%).
Forests 16 01766 g004
Figure 5. Mean CW stain proportion (±SD) by thinning regime. Different letters indicate significant differences between thinning regimes, by means of the Dunn test posteriori of the ANOVA with a probability level of 5%.
Forests 16 01766 g005
Figure 6. Temporal evolution of with CW for each thinning regime. Arrows indicate the timing of thinnings.
Forests 16 01766 g006
Figure 7. Mean AUC of CW for each thinning regime. Different letters indicate significant differences between thinning regimes, by means of the Dunn test posteriori of the ANOVA with a probability level of 5%.
Forests 16 01766 g007
Figure 8. Mean CW stain in boards (±SD) by thinning regime, showing (a) average stain across both faces and (b) maximum stain observed on either face. Different letters indicate significant differences between thinning regimes, by means of the Dunn test posteriori of the ANOVA with a probability level of 5%.
Forests 16 01766 g008
Figure 9. Mean of boards with defects (±SD) of all evaluated logs. Different letters indicate significant differences between thinning regimes, by means of the Dunn test posteriori of the ANOVA with a probability level of 5%.
Forests 16 01766 g009
Figure 10. Mean of boards with defects (±SD) separated by thinning regime. Different letters indicate significant differences between thinning regimes, by means of the Dunn test posteriori of the ANOVA with a probability level of 5%.
Forests 16 01766 g010
Figure 11. Mean of trees with >50% boards with defects (±SD) by thinning regime. Different letters indicate significant differences between thinning regimes, by means of the Dunn test posteriori of the ANOVA with a probability level of 5%.
Forests 16 01766 g011
Figure 12. Correlation coefficients between silvicultural and dendrometric variables and the proportion of CW in growth rings of basal stem discs. Signif. codes: *** p-value between 0 and 0.001; ** p-value between 0.001 and 0.01.
Forests 16 01766 g012
Figure 13. Mean of boards with defects (±SD) by average CW stain category (a) (Different letters indicate significant differences based on a Dunn test, α = 0.05) and correlation between percentage of boards with defects and CW stain level (b).
Forests 16 01766 g013
Figure 14. Relationshipbetween CW in basal stem discs and of boards with defects.
Forests 16 01766 g014
Table 1. Description of the selected treatment.
Thinning
Regime
Initial Density (Trees.ha−1)Target Density after Thinning
(Trees.ha−1)
Last
Density
(Trees.ha−1)
Age (years)Age (years)
3691222
500-2001000500 200 204
500-3251000500 325304
800-600-4001000800600400 393
700-4501000700 450437
1000-6501000 650559
Disclaimer/Publisher’s Note: The statements, opinions and data contained in all publications are solely those of the individual author(s) and contributor(s) and not of MDPI and/or the editor(s). MDPI and/or the editor(s) disclaim responsibility for any injury to people or property resulting from any ideas, methods, instructions or products referred to in the content.