Article

Empirical Relationships of the Characteristics of Standing Trees with the Dynamic Modulus of Elasticity of Japanese Cedar (Cryptomeria japonica) Logs: Case Study in the Kyoto Prefecture

1
Graduate School of Life and Environmental Sciences, Kyoto Prefectural University, 1-5 Shimogamo Hangi-cho, Sakyo-ku, Kyoto 606-8522, Japan
2
Forestry and Forest Products Research Institute, 1 Matsunosato, Tsukuba Ibaraki 305-8687, Japan
*
Author to whom correspondence should be addressed.
Forests 2025, 16(2), 244; https://doi.org/10.3390/f16020244
Submission received: 20 December 2024 / Revised: 22 January 2025 / Accepted: 25 January 2025 / Published: 27 January 2025

Abstract

:
With growing worldwide interest in constructing larger and taller wooden buildings, wood properties, such as the dynamic modulus of elasticity ( M O E d y n ), have become increasingly important. However, the M O E d y n of trees and logs has rarely been considered in forest management because a method for estimating the M O E d y n of logs based on standing tree characteristics has been lacking. Herein, we explored the multiple relationships between the M O E d y n of logs and standing tree characteristics of Japanese cedar (Cryptomeria japonica) such as tree height, diameter at breast height (DBH), and tree age, including the stress-wave velocity of the tree, which is known to be correlated with the M O E d y n of logs. The relationship between the M O E d y n of logs and standing tree characteristics was investigated by considering the bucking position. Different trends between the bottom logs and upper logs were found for all characteristics, showing a multiple trend of tree characteristics with the M O E d y n of logs based on the bucking position. The top three generalised linear mixed models for the prediction of the M O E d y n of logs showed relatively high accuracies when the bucking position was considered as a random effect. Although the contribution of the stress-wave velocity of the tree was relatively high, adding tree age improved the accuracy of the model, and this model was selected as the top model. The model for the bottom log, utilising the stress-wave velocity and age of the tree as explanatory variables, was highly explanatory (R2 = 0.70); however, the best model for upper logs was only moderately explanatory (R2 = 0.44). In addition, tree height and DBH were selected as explanatory variables along with tree age in the second and third models, which suggested the importance of growth rate rather than tree size. Therefore, adding correlates associated to characteristics related to height growth, such as site index, and DBH growth, such as stand density, is expected to improve model accuracy.

1. Introduction

The increase in global demand for wood as a sustainable building material because of ensuing global warming [1] has triggered interest in the expansion of relatively large and high-rise wooden buildings worldwide [2]. Consequently, the mechanical properties of wood, such as its dynamic modulus of elasticity ( M O E d y n ), are of great importance in the evaluation of wood as a structural material. However, in operational forestry, maximising the volume of timber production remains the primary goal of forest management [3], and minimal consideration has been given to improving the quality of logs, such as their M O E d y n .
A probable reason for the lack of consideration of log quality in forest management may be the lack of research that considers the multiple relationships between standing tree characteristics and the M O E d y n of logs. As a result, the development of practical methods for measuring or predicting interesting quality characteristics of logs has been minimal. Various standing tree characteristics have been linked to the M O E d y n of logs in previous studies. The non-destructive testing of standing trees, specifically acoustic velocity measurements, has been shown to correlate with the M O E d y n of logs in many tree species (such as cedar, loblolly pine, and Sitka spruce) [4,5,6,7,8,9]. In addition, it has been demonstrated that the M O E d y n of logs at a height of up to 7.2 m can be estimated by measuring the stress-wave velocity of standing larch trees [10].
The relationships between the M O E d y n of logs and the common characteristics of forest stands or standing trees, such as stand density, diameter at breast height (DBH), and tree height, which provide the basic information required for forest management, have also been investigated in several species. A weak positive correlation between planting density and the M O E d y n of logs has been observed for Japanese cedar (Cryptomeria japonica) and patula pine (Pinus patula) [11,12]. A negative correlation has been confirmed between diameter growth and tree M O E d y n in Japanese cedar [13]. The difference between the maximum and minimum values of M O E d y n is greater in cedar trees with larger volume growth than in those with smaller volume growth within the same stand [14]. The bucking position of the log also impacts the M O E d y n of logs. The M O E d y n of cedar is higher in the second log than that in the bottom log [14,15]. Existing studies have shown that the M O E d y n of logs increases for 11 to 30 years of tree age and then stabilises [16]. In addition, it is known that cedar varieties greatly contribute to the M O E d y n of logs [15]. However, the varieties of cedar in current plantation forests are unknown; therefore, cedar variety cannot be used as a predictor for estimating the M O E d y n of logs.
Although these studies have investigated the relationships between the characteristics of forest stands or standing trees and the M O E d y n of logs, few studies have considered acoustic velocity along with the other commonly analysed characteristics of standing trees to determine their combined relationship with the M O E d y n of logs. To apply the results of previous studies to forest management, it is crucial to determine the multiple relationships of the characteristics of forest stands or standing trees to the M O E d y n of logs. However, samples from large numbers of standing trees from different types of forest stands are required to accomplish such systematic research. In addition, to elucidate the relationship between the characteristics of standing trees and those of the obtained logs, it is necessary to track the standing trees from which the cut logs were obtained, which makes the bucking operations relatively more complicated and time-consuming. Therefore, obtaining a large number of traceable standing trees from a significant number of study sites is difficult, which may be among the main reasons for the lack of a systematised research. Accumulating case studies that track the standing trees from which the cut logs were obtained at different sites may be a steady process but essential to realise forest management considering the producible M O E d y n of logs.
This case study aims to investigate the multiple relationships between the M O E d y n of logs and the characteristics of standing trees that can be measured in forests, such as acoustic velocity and standing diameter, by tracing the standing trees to be cut into logs in a cedar forest stand. The standing tree characteristics considered in this study are those used by forest managers to determine the potential of a stand to produce logs with relatively high M O E d y n before harvesting, which enables more efficient log production and sorting to meet the growing demand for wood. The results of this case study provide a valuable reference for guiding quality-based forest management, which is currently not being conducted, and designing systematic research in future studies.

2. Materials and Methods

2.1. Study Site

The study site was a 45–65-year-old Japanese cedar forest with a stand density of approximately 350 trees/ha, located in Wazuka Town, Kyoto Prefecture, at an altitude of approximately 435 m. The average annual temperature in Kyoto Prefecture in 2023 was 17.4 °C, with the highest temperature of 38.9 °C, and the lowest temperature of −4.0 °C [17]. The annual precipitation in 2023 was 1345 mm [17]. Cedar trees have been planted in the valleys and lower slopes based on their suitability. Although no records show the specific date of forest operations, qualitative thinning is performed periodically. This study assessed a small sample set collected from a single site with limited size, age and site conditions.

2.2. Sampling and Data Collection

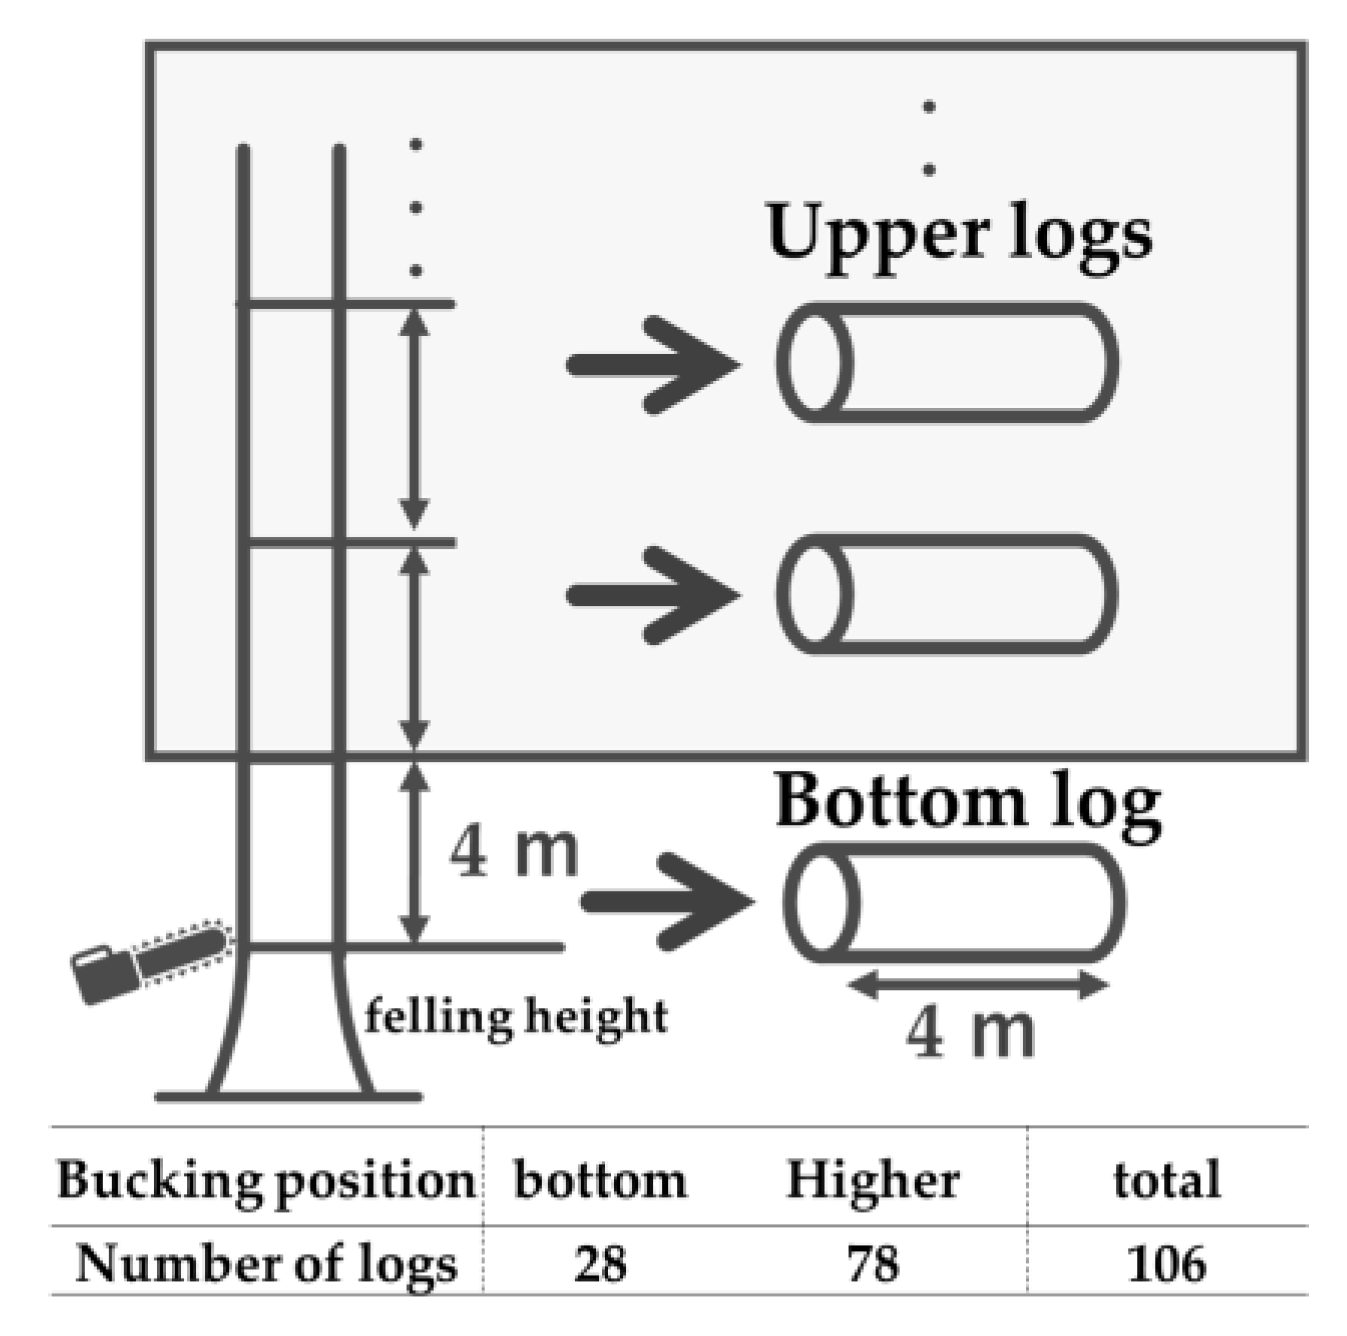
Tree height, DBH, and stress-wave velocity were measured in 28 trees scheduled for thinning in the study area (Figure 1; Table 1). Stress wave velocities along the grain direction of standing timber were measured between breast height (1.2 m) and 1.9 m using FAKOPP (Sopron, Hungary) [18]. After thinning, the thinned trees were cut into 4 m long logs. To track the standing trees from which the cut logs were obtained, the number of the standing tree and the bucking position of each cut log (i.e., the bottom log or upper logs; Figure 2) were recorded on the top end of each log. The bucking position was recorded as Bottom or Upper as a category. The length, top and bottom end perimeters, weight, and characteristic vibrations of each fresh log were also measured (Figure 1; Table 1). Characteristic vibrations were measured using the HG-2020 (ATA, Japan) by striking the wood surface with a hammer [18,19]. In addition, the images of the bottom end of the bottom log were captured, and the number of growth rings was counted to determine the age of the tree (Figure 1; Table 1).
The M O E d y n for each log was calculated using Equation (1), as follows:
E f   G P a =   ( 2 × L × f ) 2 × ρ × 10 9 ,
where Ef is the M O E d y n , L represents the length of the log, f is the characteristic vibration of the log, and ρ represents the density of the log. The density of the fresh log was calculated by dividing the weight by the log volume. The log volume was calculated by multiplying the average cross-sectional area of the top and bottom end by the length.

2.3. Data Analyses

2.3.1. Relationships Between the M O E d y n of the Cut Logs and the Characteristics of Standing Trees
The stress-wave velocities of the 28 standing trees and the M O E d y n of the logs generated from these trees were plotted on a scatter diagram, and the relationship between the two was determined by calculating the regression relationship and its coefficient of multiple determination using the least-squares method. The relationships between the M O E d y n of the logs and the common characteristics of their source standing trees, such as height, DBH, and age, were similarly determined. Based on the observed tendency between each characteristic of the standing trees and the M O E d y n of the logs based on their bucking positions, the approximation formulae and coefficients were calculated for two groups: the bottom logs and upper logs. In addition, p-values were calculated to ascertain whether the coefficient of determination obtained from the approximate equation was significant.

2.3.2. Multiple Relationships Between the M O E d y n of the Cut Logs and the Characteristics of Standing Trees

A generalised linear mixed model (GLMM) was used to elucidate the combined relationship between the M O E d y n of the cut logs and the characteristics of the standing trees. The GLMM was utilised because it enables best-subset selection and the consideration of the random effects of the samples. We used four explanatory variables, namely tree height, DBH, and tree age, which are the key characteristics for tracking tree growth and tree volume, along with stress-wave velocity, which is a known characteristic related to the M O E d y n of logs. The response variable was the M O E d y n of the logs. Random effects were considered for the bucking positions, i.e., the bottom and upper bucking positions. The GLMM analysis was performed using the R (Version 4.4.2) package ‘lme4’ [20], with ‘Gaussian’ as the family and ‘identity’ as the link function. As our objective was to explore the multiple relationships between the characteristics of the standing trees and the M O E d y n of their cut logs, we investigated the most optimal combination of variables for estimating the M O E d y n of logs. All obtained models were ranked based on the lowest to the highest Akaike information criterion (AIC) [21], and nine models were selected up to the model with the largest change in AIC among the ranked models. The R package ‘MuMIn’ was used to select the models. To examine the predictive ability of the top model, the relationship between actual M O E d y n , calculated based on the measurements of the logs, and predicted M O E d y n , calculated using the top model of the GLMM, was quantified using regression analysis in which parameters were estimated using the least-squares method. The coefficient of multiple determination was used as a measure of prediction ability. To understand the accuracy of the predictions, the root mean-squared error (RMSE), which indicates the error from the precise value, was calculated for both the bottom and the upper logs.

3. Results

3.1. Relationships Between the M O E d y n of the Cut Logs and the Characteristics of Standing Trees

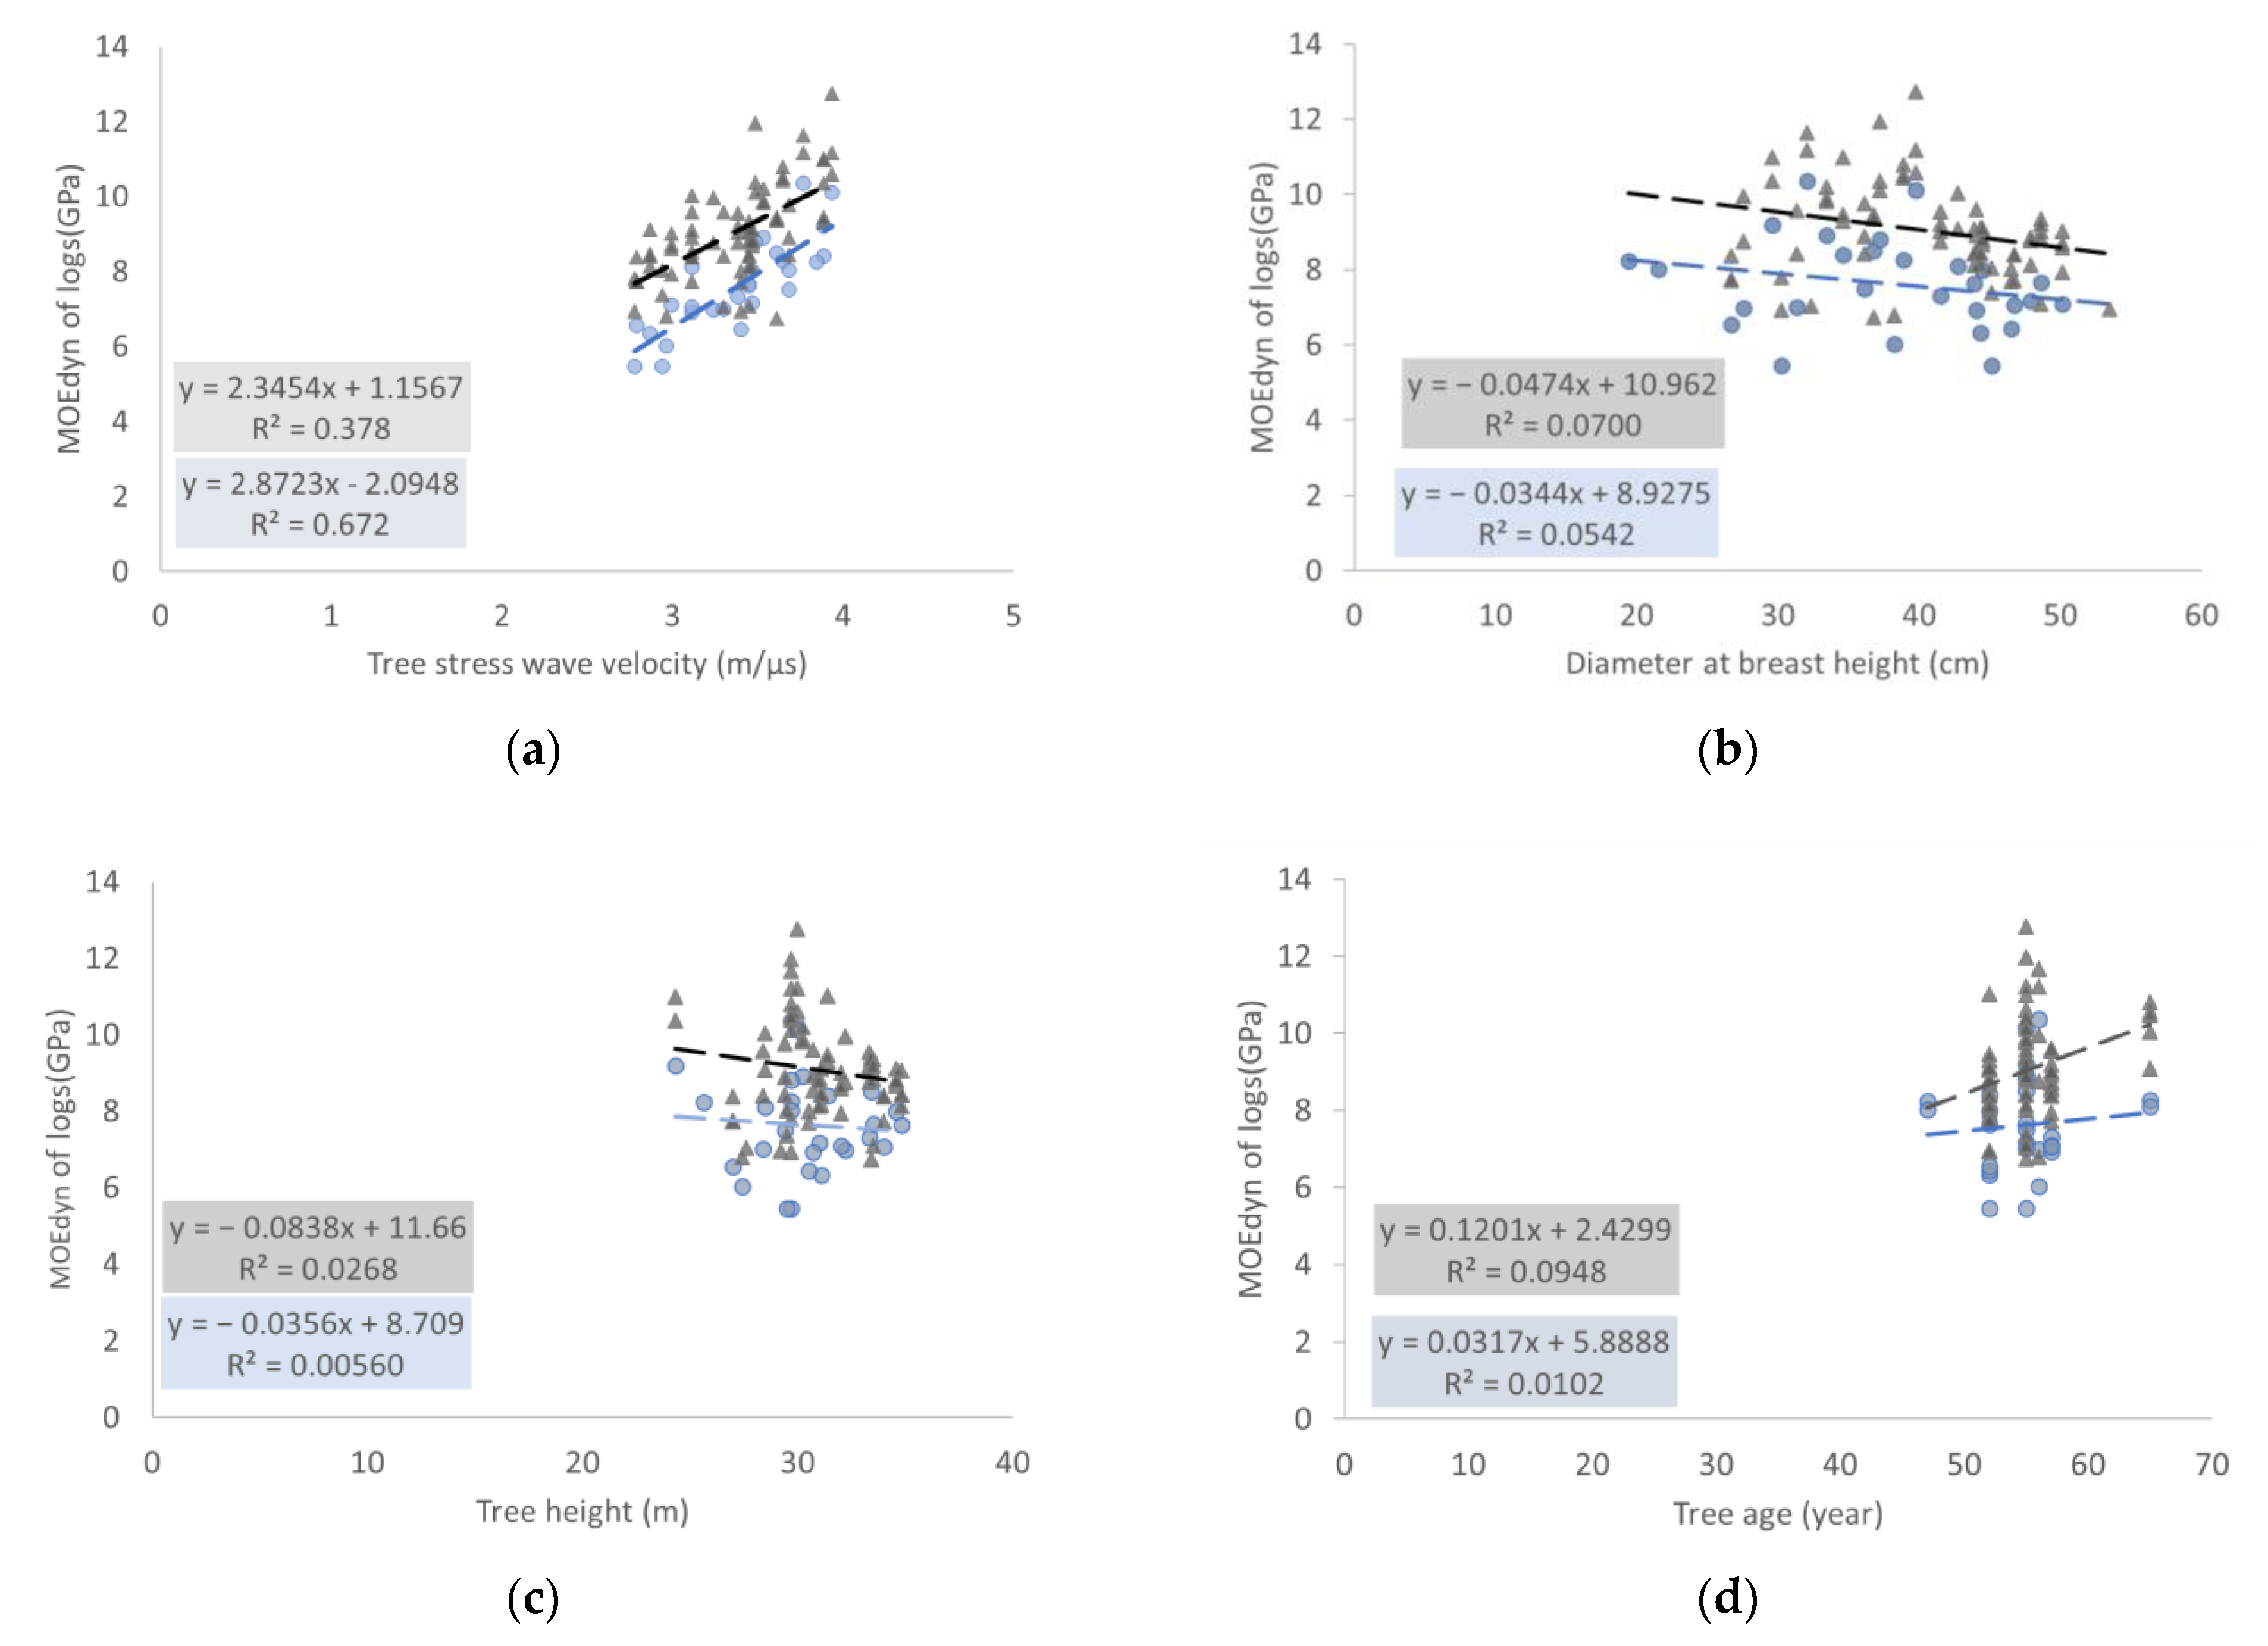
The approximate equation indicating the relationship between the stress-wave velocity of a tree and the M O E d y n of its bottom log (Figure 3a) is as follows:
y = 2.8723x − 2.0948
The coefficient of determination calculated using the approximate Equation (2) was 0.672 (p < 0.01). The approximate equation indicating the relationship between the stress-wave velocity of a tree and the M O E d y n of its upper logs is as follows:
y = 2.3454x + 1.1567
The coefficient of determination calculated using the approximate Equation (3) was 0.378 (p < 0.01).
Figure 3. Relationships between the dynamic modulus of elasticity ( M O E d y n ) of the cut logs and the characteristics of the standing trees from which the logs were obtained: (a) relationship between the M O E d y n of logs and the stress-wave velocity of trees; (b) relationship between the M O E d y n of logs and diameter at breast height; (c) relationship between the M O E d y n of logs and the height of trees; and (d) relationship between the M O E d y n of logs and the age of trees. The data for the bottom log are shown in blue colour and data for the upper logs are shown in grey colour.
Forests 16 00244 g003
A comparison of Equations (2) and (3) revealed no significant difference in the slope for the bottom and upper logs; however, the intercept was observed to be negative and positive for the bottom and upper logs, respectively. The same trend of no difference in the slope of the equations but in the intercept between the bottom and upper logs was also observed in the relationships between the M O E d y n of the cut logs and the DBH (Figure 3b) and heights of their standing trees (Figure 3c). However, in the relationship between the age of a tree and the M O E d y n of their cut logs (Figure 3d), both the slopes and intercepts of the approximate equations exhibited different trends for the bottom and upper logs. As the slope of the bottom log was almost in equilibrium with the x-axis, the value of the intercept for the bottom log was observed to be higher than that for the upper logs, unlike the other standing tree characteristics. The coefficients of determination for the approximate equations expressing the relationships of the M O E d y n of the bottom logs with DBH, tree height, and tree age were 0.0542 (p = 0.233), 0.00560 (p = 0.706), and 0.0102 (p = 0.609), respectively (Figure 3b–d). However, the coefficients of determination for the approximate equations expressing the relationships of the M O E d y n of the upper logs with DBH, tree height, and tree age were 0.0700 (p < 0.05), 0.0268 (p = 0.152), and 0.0948 (p < 0.01) (Figure 3b–d), respectively.

3.2. Multiple Relationships Between the M O E d y n of the Cut Logs and the Characteristics of Standing Trees

The top nine models obtained using the GLMM are listed in Table 2, and the detailed results for the top model are listed in Table 3. For the eight models (A–H) with relatively low AIC, the stress-wave velocity of a standing tree was selected as a variable exhibiting significant positive correlations with the M O E d y n of its logs (Table 2). In the ninth model (I), where ΔAIC increased markedly, the stress-wave velocity of a standing tree was not selected as an explanatory variable. However, tree age and DBH were selected as explanatory variables, which exhibited a significant positive and negative correlation with the M O E d y n of the cut logs, respectively (Table 2). In the top three models (A–C), the age of a tree was invariably selected as the explanatory variable exhibiting a significant positive correlation with the M O E d y n of its logs (Table 2). In addition, the age of the tree was selected as an explanatory variable in models F and I, exhibiting a significant positive correlation with the M O E d y n of its logs (Table 2). DBH was selected as an explanatory variable in models C, F, G, H, and I. A significant negative correlation of DBH with the M O E d y n of the cut logs was found in models C and I, wherein tree age showed a significant positive correlation with the M O E d y n of the cut logs (Table 2). Tree height was selected as the explanatory variable in models B, E, F, and H. However, a significant correlation of the height of a tree with the M O E d y n of its logs was only detected in model B, wherein tree age was selected as the explanatory variable (Table 2).
The prediction equations for the bottom (Equation (4)) and upper logs (Equation (5)) calculated using the top model are as follows:
MOEdyn= 2.56a + 0.09b − 5.78,
MOEdyn = 2.56a + 0.09b − 4.34,
where a represents the stress-wave velocity of their source standing tree, and b is the age of the standing tree.
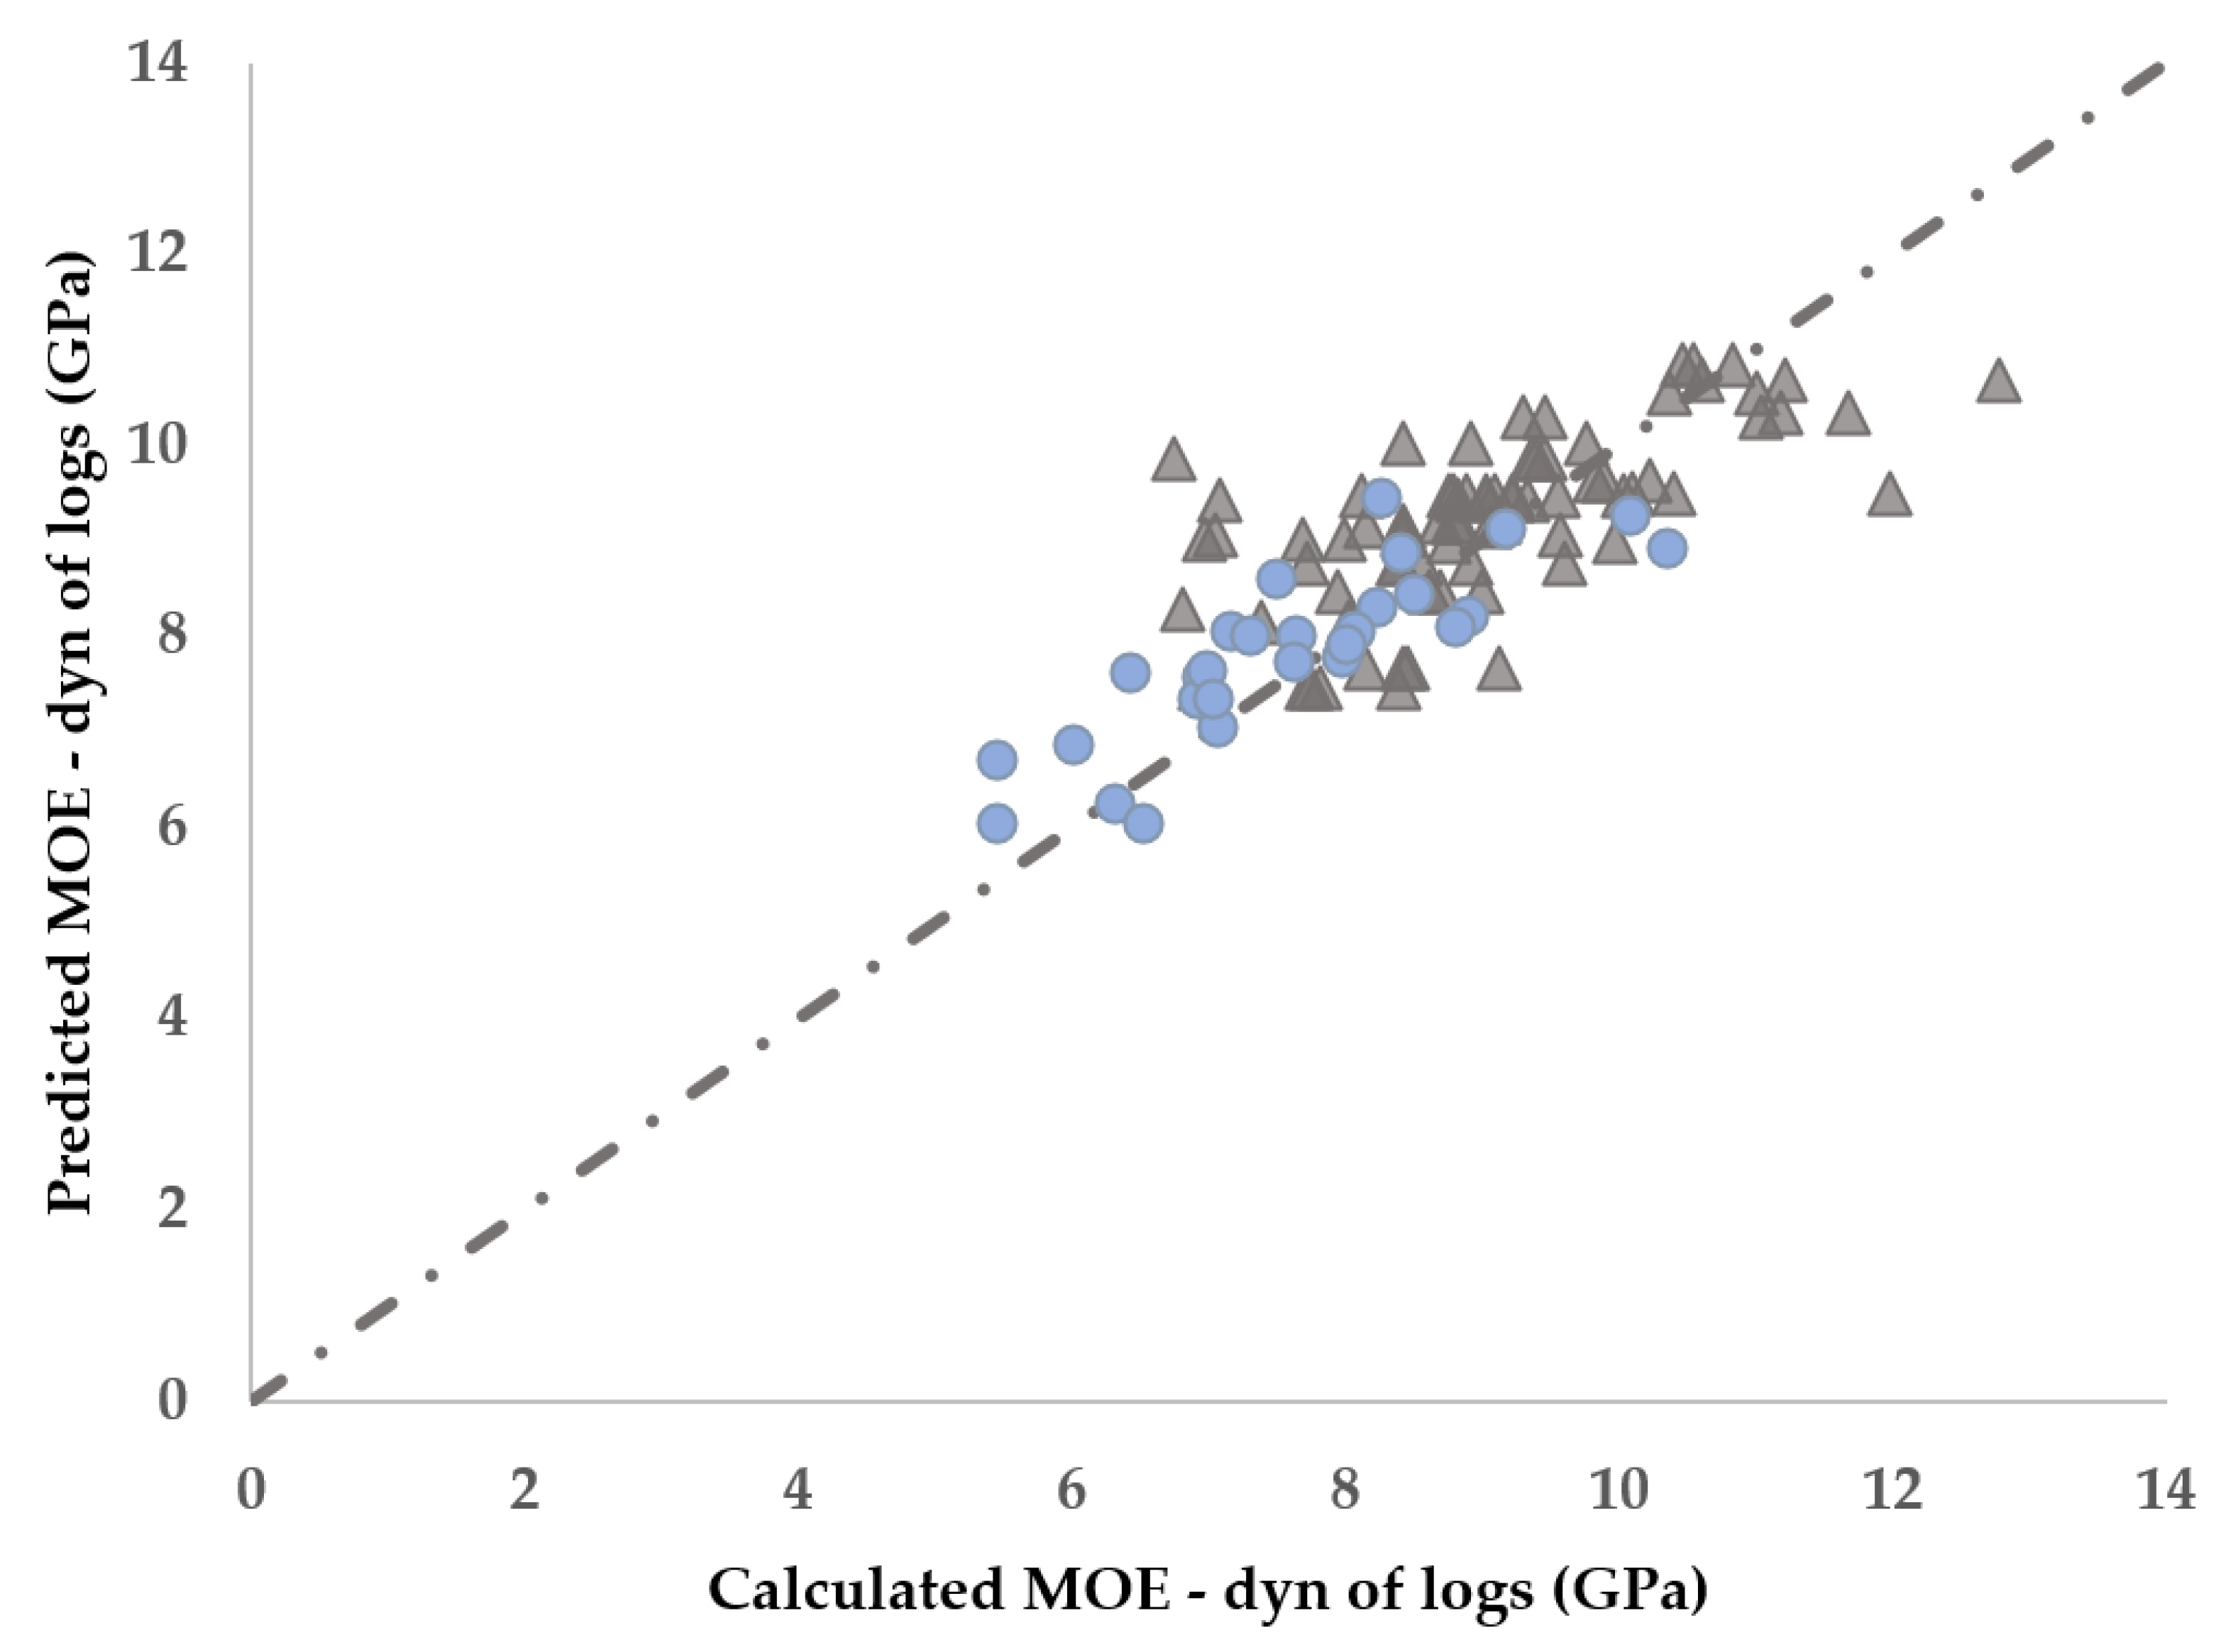
A scatterplot showing the relationship between the actual M O E d y n , calculated using Equation (1), and the predicted M O E d y n , calculated using Equations (4) and (5), is shown (Figure 4). The multiple coefficient of determination between the predicted and actual values of M O E d y n for the bottom log was 0.707, whereas the multiple coefficient of determination between the predicted and actual values of M O E d y n for upper logs was 0.447.
The predicted M O E d y n , calculated using both prediction Equations (4) and (5) based on the bucking position, tended to be overpredicted if the actual M O E d y n was relatively low and underpredicted if the actual M O E d y n was high. However, the scatter plots showed that the prediction for the bottom logs was highly precise, as indicated by the multiple coefficient of determination. In contrast, the predicted M O E d y n of upper logs ranged between 7 and 11 GPa and tended to be overpredicted if the actual M O E d y n was below 7 GPa and underpredicted if the actual M O E d y n was above 11 GPa. The RMSE values were 0.651 for the bottom logs and 0.808 for the upper logs.

4. Discussion

4.1. Relationships Between the M O E d y n of the Cut Logs and the Characteristics of Standing Trees

The relatively high coefficient of determination (0.672) between the M O E d y n of the bottom log and the stress-wave velocity of its standing tree suggests a strong relationship between the stress-wave velocity of a standing tree and the M O E d y n of a log. Previous studies have also reported a correlation between the stress-wave velocity of a tree and the M O E d y n of relatively small specimens of logs [4,7]. However, the coefficient of determination (0.378) for the M O E d y n of upper logs remained relatively low. In Scots pine (Pinus sylvestris), the correlation between stress-wave velocity and the M O E d y n of logs is lower for logs produced from the top of the tree trunk [22], which is consistent with the tendency observed for cedar in this study. The M O E d y n of Japanese cedar logs differs depending on their bucking position, which is influenced by the difference in microfibril angle (MFA) and basic density [14] and is higher for the second log than for the bottom log [14,15]. It has been shown that M O E d y n relates to moisture content [23], wood type, such as juvenile wood, where higher a MFA is observed than in mature wood [24], and discontinuities such as cracks [23]. These factors might cause the difference of M O E d y n of the bottom log and upper log. It is necessary to investigate trends for each bucking position between M O E d y n and the above characteristics in the future. Our results indicate that tree stress-wave velocity and M O E d y n are highly correlated in the bottom log, where the tree stress-wave velocity was measured. However, the correlation between M O E d y n and tree stress-wave velocity tended to decrease for upper logs. In addition, different tendencies between the bottom and upper logs were found for the relationships of M O E d y n with tree height, DBH, and tree age, although the correlation for the upper logs was relatively low. The results indicate that the relationships between the characteristics of standing trees and the M O E d y n of the logs obtained from these trees vary depending on the vertical bucking positions (bottom or upper bucking positions) of the obtained logs. In particular, the trend for the bottom logs differed significantly from that for the upper logs, suggesting that this variation must be considered when evaluating the producible M O E d y n of logs prior to harvesting.
Tree height, DBH, and tree age showed weak correlations with the M O E d y n of the cut logs (Figure 3). It has been shown that the M O E d y n of logs increases for 11 to 30 years of the age of a standing tree and then stabilises [17]. However, in this study, no relationship was observed between the age of a standing tree and the M O E d y n of its cut logs, likely because the cedar trees were more than 47 years old, and the M O E d y n values of the cut logs were stable in all stands. Moreover, no relationship was observed between the M O E d y n of the standing trees and the heights of these trees; however, a negative correlation of the M O E d y n of standing trees with DBH has been reported in a study by Teraoka et al. [14]. Thus, we expected no relationship between the height of a standing tree and the M O E d y n of its cut logs but a negative correlation with DBH. However, the M O E d y n of logs did not show any correlation with tree height or DBH. In the study by Teraoka et al. [14], the investigated trees were from a stand planted in the same year. Therefore, a difference in DBH suggests a difference in the growth rate. In contrast, in this study, tree age varied from 47 to 65 years. Thus, the difference in DBH was not equal to the difference in growth rate, which suggests that the characteristic that correlates with the M O E d y n of logs is not the value of DBH but its growth rate.

4.2. Multiple Relationships Between the M O E d y n of the Cut Logs and the Characteristics of Standing Trees

The top eight models (A–H) selected tree stress-wave velocity as a variable, and the ninth model (I), wherein tree stress-wave velocity was not selected, showed a relatively large increase in ΔAIC (Table 2), which suggests that the tree stress-wave velocity is an important characteristic for predicting the M O E d y n of logs, as shown in previous studies [25]. Tree age was selected as the explanatory variable in the top three models with the lowest AIC values and exhibited a significant positive correlation with the M O E d y n of logs (Table 2). It is known that the M O E d y n of logs increases with the number of annual rings [26], indicating the importance of the number of annual rings, which is strongly related to tree age, in determining the M O E d y n of logs. The relationship between the actual value of the M O E d y n of cut logs and the stress-wave velocity of the standing tree from which these logs were obtained (Figure 3a) showed a relatively high multiple coefficient of determination for the approximation equation (0.672); therefore, the stress-wave velocity of a standing tree itself seemed to be sufficient for predicting the M O E d y n of the bottom log. However, the models that incorporated standing tree characteristics, including DBH and tree height, exhibited reduced AIC (Table 2). In particular, as shown in Table 2 and Table 3, the models that added stress-wave velocity and tree age as variables resulted in the lowest AIC.
In models wherein DBH and tree height were selected as explanatory variables, tree stress-wave velocity and tree age were selected as explanatory variables (models B and C). These models had lower AIC values than those of models without tree age (models E and G). Moreover, the DBH and tree height variables of these models were significantly negatively correlated with the M O E d y n of logs (Table 2), unlike models without tree ages. This finding suggests the importance of the year of growth for the measured height and DBH. Thus, the growth rates of tree height and DBH contributed to estimating the M O E d y n of the logs. It is known that stand density, such as planting density and tree thinning, can affect the growth rate of DBH [3]. The height growth rate is strongly related to the site index, which is a characteristic of site productivity, and is evaluated based on the mean height of the dominant trees at a reference age [27]. The relationship between the M O E d y n of logs and the site index has been reported for loblolly pine, where both the modulus of elasticity and the modulus of rupture of relatively small specimens obtained from logs decreased with increasing site index [28]. In addition, the site index is known to be strongly correlated with site conditions such as topography, soil deposition type, and rock type. Cedar trees have been shown to grow faster in concave topographies with colluvial deposits [29]. Therefore, it is necessary to elucidate the relationship between the M O E d y n of logs and the indicators related to tree height and DBH growth rates. In particular, stand density, such as planting density and thinning, related to the DBH growth rate, site index, and site conditions related to tree height growth need to be investigated.
The accuracy of the top model based on the multiple coefficient of determination of the relationship between the actual and estimated M O E d y n of logs (Figure 4) was relatively high for the bottom log. Therefore, the M O E d y n of the bottom log can be predicted with relatively high accuracy based on tree stress-wave velocity and tree age. However, the predicted values for the M O E d y n of the upper logs are concentrated in a narrow range and could not be precisely predicted (Figure 4), indicating that further variables are needed in addition to tree stress-wave velocity, age at harvest, and harvest location. In addition to the indicators related to tree height or DBH growth rates, as mentioned above, it may be necessary to consider variables such as canopy information that have been correlated with M O E d y n [30,31]. Recent advances in LiDAR survey technology have made it possible to acquire data on canopy information [30,31,32]. Therefore, it is necessary to elucidate the relationship between detailed tree information and M O E d y n , which was difficult to obtain prior to the advent of LiDAR. If the M O E d y n of logs can be predicted with relatively high accuracy from these characteristics of tree growth such as site index, planting density, and canopy information, it may be possible to promote forest management which can produce logs with high log M O E d y n to meet the requirements of the construction sector.
In the future, efforts should be made not only to predict M O E d y n , but also to predict the static modulus of elasticity ( M O E s t a ) of end products based on the characteristics of standing trees in the forest [33]. It has been found that the M O E s t a values differ depending on the radial position of a log, from which the sample is taken, although the species is different from that of cedar [34]. It has also been found that there is a correlation between the M O E d y n of the log and the M O E s t a of the product [35]. Therefore, research investigating the spatiotemporal pattern of M O E s t a and M O E d y n throughout the entire production process from standing tree to logs and from logs to end products might be necessary in the future.

5. Conclusions

In this study, we examined the relationship between the M O E d y n of logs and standing tree characteristics (tree stress-wave velocity, tree height, DBH, and age) considering the bucking position. The relationship between the M O E d y n of logs and each characteristic showed different trends between the lower and higher bucking position logs. The results indicate that the M O E d y n of logs is particularly susceptible to the effects of tree stress-wave velocity and bucking position.
The M O E d y n of the bottom logs could be predicted with relatively high accuracy using tree stress wave velocity and tree age, the top model derived from GLMM; however, the M O E d y n of upper logs could not be predicted with the same degree of accuracy. The actual contribution of the tree stress-wave velocity was relatively high compared with that predicted using the models derived from the GLMM. However, adding the tree age variable improved the accuracy of the model. In addition, tree height and DBH were selected in the top three models, along with tree age, suggesting the importance of growth rate rather than size. Therefore, it is expected that adding characteristics related to tree height growth, such as the site index, and characteristics related to DBH growth, such as stand density, will enable the prediction of the M O E d y n of logs with relatively high accuracy.

Author Contributions

Investigation, K.H., Y.N., M.N. and K.N.; Writing—original draft, K.H.; Writing—review & editing, Y.N., M.N., K.K. and K.N.; Funding acquisition, K.N. All authors have read and agreed to the published version of the manuscript.

Funding

This study was supported by JSPS KAKENHI Grant Number 23K05470.

Data Availability Statement

The data underlying this article cannot be shared publicly because of the need to protect the privacy of individuals who participated in the study.

Acknowledgments

We thank everyone at Shigasato Moriei Co. Ltd. for their cooperation with the survey.

Conflicts of Interest

The authors declare no conflict of interest.

References

  1. Loss, C.; Tannert, T.; Tesfamariam, S. State-of-the-art review of displacement-based seismic design of timber buildings. Constr. Build. Mater. 2018, 191, 481–497. [Google Scholar] [CrossRef]
  2. González-Retamal, M.; Forcael, E.; Saelzer-Fuica, G.; Vargas-Mosqueda, M. From trees to skyscrapers: Holistic review of the advances and limitations of multi-storey timber buildings. Buildings 2022, 12, 1263. [Google Scholar] [CrossRef]
  3. Barrette, J.; Achim, A.; Auty, D. Impact of intensive forest management practices on wood quality from conifers: Literature review and reflection on future challenges. Curr. For. Rep. 2023, 9, 101–130. [Google Scholar] [CrossRef]
  4. Ikeda, K.; Arima, K. Quality evaluation of standing trees by a stress-wave propagation method and its application II. Evaluation of sugi stands and application to production of sugi (Cryptomeria japonica D. Don) structural square sawn timber. JWRS 2000, 46, 189–196. [Google Scholar]
  5. Moore, J.R.; Lyon, A.J.; Searles, G.J.; Lehneke, S.A.; Ridley-Ellis, D.J. Within- and between-stand variation in selected properties of Sitka spruce sawn timber in the UK: Implications for segregation and grade recovery. Ann. For. Sci. 2013, 70, 403–415. [Google Scholar] [CrossRef]
  6. Butler, M.A.; Dahlen, J.; Eberhardt, T.; Montes, C.; Antony, F.; Daniels, R. Acoustic evaluation of loblolly pine tree- and lumber-length logs allows for segregation of lumber modulus of elasticity, not for modulus of rupture. Ann. For. Sci. 2017, 74, 20. [Google Scholar] [CrossRef]
  7. Schimleck, L.; Dahlen, J.; Apiolaza, L.A.; Downes, G.; Emms, G.; Evans, R.; Moore, J.; Pâques, L.; Van den Bulcke, J.; Wang, X. Non-destructive evaluation techniques and what they tell us about wood property variation. Forests 2019, 10, 728. [Google Scholar] [CrossRef]
  8. Wessels, C.B.; Malan, F.S.; Rypstra, T. A review of measurement methods used on standing trees for the prediction of some mechanical properties of timber. Eur. J. For. Res. 2011, 130, 881–893. [Google Scholar] [CrossRef]
  9. Bucur, V. A Review on Acoustics of Wood as a Tool for Quality Assessment. Forests 2023, 14, 1545. [Google Scholar] [CrossRef]
  10. Tumenjargal, B.; Ishiguri, F.; Takahashi, Y.; Nezu, I.; Baasan, B.; Chultem, G.; Aiso-Sanada, H.; Ohshima, J.; Yokota, S. Predicting the bending properties of Larix sibirica lumber using nondestructive-testing methods. Int. Wood Prod. J. 2020, 11, 115–121. [Google Scholar] [CrossRef]
  11. Tsushima, S.; Koga, S.; Oda, K.; Shiraishi, S. Effects of initial spacing on growth and wood properties of Sugi (Cryptomeria japonica) cutting cultivars. JWRS 2006, 52, 196–205. [Google Scholar] [CrossRef]
  12. Justin, E.; Anton, K.; David, M.; Drew, C.; Brand, W. The effect of planting spacing on Pinus patula stem straightness, microfibril angle and wood density. For. Int. J. For. Res. 2018, 91, 247–258. [Google Scholar] [CrossRef]
  13. Teraoka, Y.; Takata, K.; Koga, S. Use of trunk-MOE of Japanese cedar as forestry management information. JFP 2001, 35, 21–29. [Google Scholar] [CrossRef] [PubMed]
  14. Kijidani, Y.; Kitahara, R. Variation of wood properties with height position in the stems of Obi-Sugi cultivars. JWRS 2009, 55, 198–206. [Google Scholar] [CrossRef]
  15. Tsushima, S.; Koga, S.; Oda, K.; Shiraishi, S. Growth and wood Properties of Sugi (Cryptomeria japonica) cultivars planted in the Kyushu region. JWRS 2005, 51, 394–401. [Google Scholar] [CrossRef]
  16. Hiraiwa, T.; Ishiguri, F.; Endo, R.; Takeyama, F.; Tanabe, J.; Kameyama, Y.; Ohno, H.; Takashima, Y.; Iizuka, K.; Yokota, S. Wood properties of Sanbu-Sugi Cultivar of Sugi (Cryptomeria japonica D. Don) planted in Chiba Prefecture. Japan. J. Soc. Mater. Sci. 2014, 63, 635–640. [Google Scholar] [CrossRef]
  17. Japan Meteorological Agency Transport and Tourism. Annual Climate Data for Kyoto Prefecture for the Year 2023. Available online: https://www.data.jma.go.jp/obd/stats/etrn/view/annually_s.php?prec_no=61&block_no=47759&year=2023&month=&day=&view= (accessed on 16 July 2024).
  18. Wang, X. Acoustic measurements on trees and logs: A review and analysis. Wood Sci. Technol. 2013, 47, 965–975. [Google Scholar] [CrossRef]
  19. Gallego, A.; Ripoll, M.A.; Timbolmas, C.; Rescalvo, F.; Suarez, E.; Valverde, I.; Rodríguez, M.; Navarro, F.B. Modulus of elasticity of I-214 young poplar wood from standing trees to sawn timber: Influence of the age and stand density. Eur. J. Wood Prod. 2021, 79, 1225–1239. [Google Scholar] [CrossRef]
  20. Bates, D.; Mächler, M.; Bolker, B.; Walker, S. Fitting Linear Mixed-Effects Models Using lme4. J. Stat. Softw. 2015, 67, 1–48. [Google Scholar] [CrossRef]
  21. Akaike, H. A New Look at the Statistical Model Identification. In Selected Papers of Hirotugu Akaike; Parzen, E., Tanabe, K., Kitagawa, G., Eds.; Springer Series in Statistics; Springer: New York, NY, USA, 1974. [Google Scholar] [CrossRef]
  22. Lindström, H.; Reale, M.; Grekin, M. Using non-destructive testing to assess modulus of elasticity of Pinus sylvestris trees. Scand. J. For. Res. 2009, 24, 247–257. [Google Scholar] [CrossRef]
  23. Arriaga, F.; Wang, X.; Íñiguez-González, G.; Llana, D.F.; Esteban, M.; Niemz, P. Mechanical Properties of Wood: A Review. Forests 2023, 14, 1202. [Google Scholar] [CrossRef]
  24. Watanabe, H.; Tsutsumi, J.; Kojima, K. Studies on juvenile wood. II: Distribution of specific compressive strength and specific compressive Young’s modulus in Sugi (Cryptomeria japonica D. Don) stems. J. Soc. Mater. Sci. 1964, 10, 125–130. [Google Scholar]
  25. Wang, X. Recent advances in nondestructive evaluation of wood: In-forest wood quality assessments. Forests 2021, 12, 949. [Google Scholar] [CrossRef]
  26. Nakatani, H.; Kato, A.; Hasegawa, M.; Aiura, H.; Iijima, Y. Structural mechanics study on the damage of tree stems caused by accumulating in the Crown III. Distribution of mechanical properties in tree stem. J. Toyama For. For. Prod. Res. Cent. 1988, 1, 25–33. [Google Scholar]
  27. Mitsuda, Y.; Ito, S.; Sakamoto, S. Predicting the site index of sugi plantations from GIS-derived environmental factor in Miyazaki Prefecture. J. For. Res. 2007, 12, 177–186. [Google Scholar] [CrossRef]
  28. Antony, F.; Jordan, L.; Schimleck, L.R.; Clark, A., III; Souter, R.A.; Daniels, R.F. Regional variation in wood modulus of elasticity (stiffness) and modulus of rupture (strength) of planted loblolly pine in the United States. Can. J. For. Res. 2011, 41, 1522–1533. [Google Scholar] [CrossRef]
  29. Nagashima, K. Forest management based on site suitability: A case study of Odai Town, Mie Prefecture. In Landscape Ecology for Sustainable Society; Hong, S.K., Nakagoshi, N., Eds.; Springer: Tokyo, Japan, 2017; pp. 181–196. [Google Scholar]
  30. Kuprevicius, A.; Auty, D.; Achim, A.; Caspersen, J. Quantifying the influence of live crown ratio on the mechanical properties of clear wood. Forestry 2013, 86, 361–369. [Google Scholar] [CrossRef]
  31. Amarasekara, H.; Denne, M.P. Effects of crown size on wood characteristics of Corsican pine in relation to definitions of juvenile wood, crown formed wood and core wood. Forestry 2002, 75, 51–61. [Google Scholar] [CrossRef]
  32. Diószegi, G.; Molnár, V.E.; Nagy, L.A.; Enyedi, P.; Török, P.; Szabó, S. Testing treecbh in Central European forests: An R package for crown base height detection using high-resolution aerial laser-scanned data. Forestry 2024, 31, cpae044. [Google Scholar] [CrossRef]
  33. Lim, W.; Park, H.-C.; Park, S.; Seo, J.-W.; Kim, J.; Ko, D.W. Modeling Tree Mortality Induced by Climate Change-Driven Drought: A Case Study of Korean Fir in the Subalpine Forests of Jirisan National Park, South Korea. Forests 2025, 16, 84. [Google Scholar] [CrossRef]
  34. Auty, D.; Achim, A. The relationship between standing tree acoustic assessment and timber quality in Scots pine and the practical implications for assessing timber quality from naturally regenerated stands. Forestry 2008, 81, 475–487. [Google Scholar] [CrossRef]
  35. Madhoushi, M.; Daneshvar, S. Predicting the static modulus of elasticity in eastern cottonwood (Populus deltoides) using stress wave non-destructive testing in standing trees. Eur. J. Wood Prod. 2016, 74, 885–892. [Google Scholar] [CrossRef]
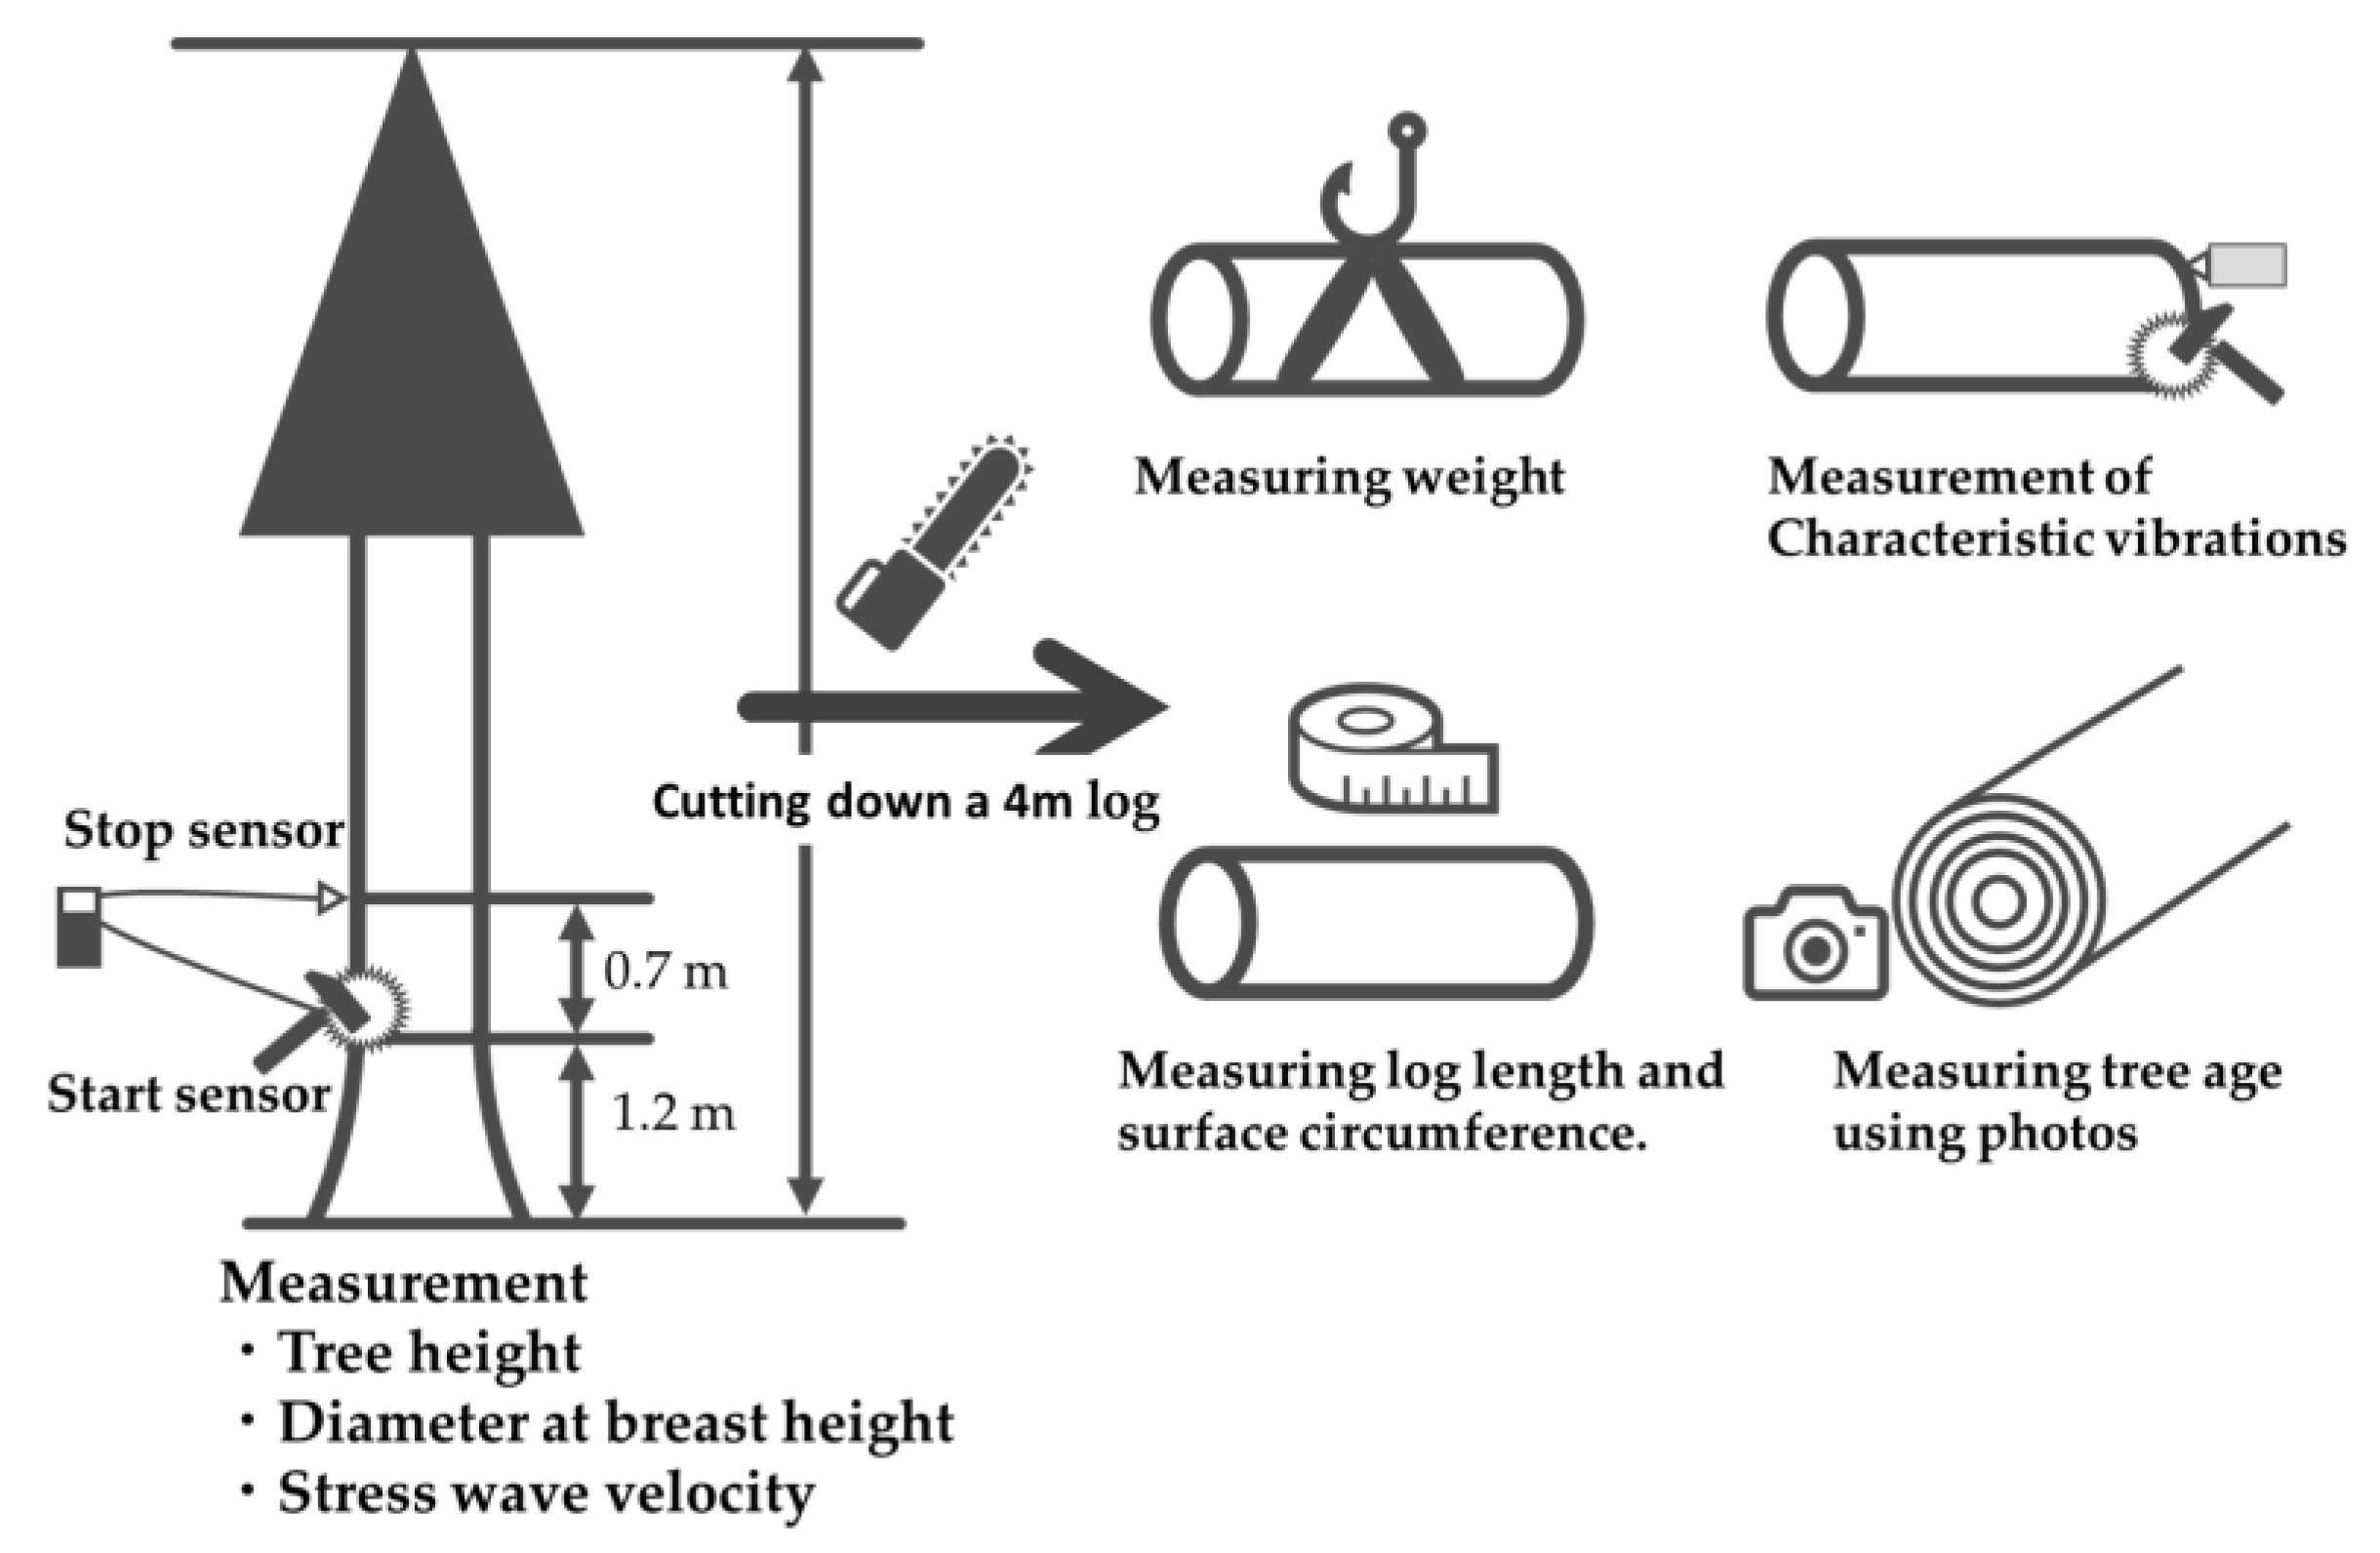
Figure 1. Schematic diagram depicting the methodology used for acquiring data for the characteristics of standing trees scheduled for thinning and the cut logs of these trees after their thinning.
Forests 16 00244 g001
Figure 2. Schematic illustration of the bucking positions and number of logs generated based on the bucking positions.
Forests 16 00244 g002
Figure 4. Relationships between the actual M O E d y n of the cut logs, calculated using Equation (1), and the predicted M O E d y n of the same logs, calculated using the developed model (Equations (4) and (5)). The data for the bottom log are shown in blue circles and data for the upper logs are shown in grey triangles.
Forests 16 00244 g004
Table 1. Statistical data for the characteristics of standing trees scheduled for thinning and the cut logs of these trees after their thinning.
Mean ± SERange
TreeStress-wave velocity (m/μs)3.38 ± 0.342.78–3.93
DBH (cm)37.8 ± 8.1319.5–50.2
Tree height (m)30.4 ± 2.5124.3–34.8
Tree age (year)54.8 ± 3.8247.0–65.0
Log M O E d y n (GPa)8.47 ± 0.865.46–12.8
Density   of   the   log   ( kg / m 3 )736 ± 70.3574–914
Characteristic vibration (Hz)412 ± 29.1336–478
Note: Number of trees and logs: 28 and 106. Abbreviations: SE, standard error; DBH, diameter at breast height; M O E d y n , dynamic modulus of elasticity.
Table 2. Results of the generalised linear mixed models.
Model RankAICΔAICEstimated Coefficients (Standard Error)
InterceptTree Stress-Wave VelocityTree AgeDBHTree Height
A2850.00−5.06 **
(1.74)
2.56 **
(0.248)
0.0870 **
(0.0246)
B2883.00−2.79
(2.07)
2.57 **
(0.145)
0.0826 **
(0.0243)
−0.0668 *
(0.0334)
C2883.10−4.16 *
(1.76)
2.42 **
(0.248)
0.0991 **
(0.0245)
−0.0286 *
(0.0116)
D2904.37−0.299
(1.16)
2.56 **
(0.262)
E2926.422.03
(1.56)
2.58 **
(0.257)
−0.0772
(0.0349)
F2949.18−3.41
(2.10)
2.46 **
(0.253)
0.0948 **
(0.0254)
−0.0228
(0.0146)
−0.0275
(0.0416)
G29610.870.74
(1.34)
2.48 **
(0.266)
−0.0192
(0.0122)
H30014.862.06
(1.58)
2.55 **
(0.268)
−0.00595
(0.0147)
−0.0674
(0.0427)
I35368.034.27
(2.00)
0.112 **
(0.0339)
−0.0526 **
(0.0157)
Note: Model A: M O E d y n ~ Tree stress-wave velocity + Tree age + (1|bucking position); Model B: M O E d y n   ~ Tree stress-wave velocity + Tree age + Tree height + (1|bucking position); Model C: M O E d y n ~ Tree stress-wave velocity + Tree age + DBH + (1|bucking position); Model D: M O E d y n ~ Tree stress-wave velocity + (1|bucking position); Model F: M O E d y n ~ Tree stress-wave velocity + Tree age + DBH + Tree height + (1|bucking position); Model F: M O E d y n ~ Tree stress-wave velocity + Tree age + DBH + Tree height + (1|bucking position); Model G: M O E d y n ~ Tree stress-wave velocity + DBH + (1|bucking position); Model H: M O E d y n ~ Tree stress-wave velocity + DBH + Tree height + (1|bucking position); and Model I: M O E d y n   ~ Tree age + DBH + (1|bucking position). Abbreviations: AIC, Akaike information criterion; DBH, diameter at breast height; M O E d y n , dynamic modulus of elasticity. ** p < 0.01, * p < 0.05.
Table 3. Results of the top generalised linear mixed model.
Fixed EffectsRandom Effects
Top ModelAICR2 Fix.R2 Ran.Estimated Coefficients (Standard Error)
InterceptTree Stress-Wave VelocityTree AgeSD
A2850.3140.723−5.06 **
(1.74)
2.56 **
(0.248)
0.0870 **
(0.0246)
0.720
Note: Model formula: M O E d y n   ~ Tree stress wave velocity + Tree age + (1|bucking position). ** p < 0.01. Abbreviations: AIC, Akaike information criterion; SD, standard deviation; M O E d y n , dynamic modulus of elasticity.
Disclaimer/Publisher’s Note: The statements, opinions and data contained in all publications are solely those of the individual author(s) and contributor(s) and not of MDPI and/or the editor(s). MDPI and/or the editor(s) disclaim responsibility for any injury to people or property resulting from any ideas, methods, instructions or products referred to in the content.