Article

Identification of Hiking Target Groups Based on Physical Fitness Levels in Forest Environment

by
Jana Hlaváčová
1,
Mário Molokáč
2 and
Dana Tometzová
2,*
1
Department of Academic Sports, Institute of Languages, Social Sciences and Academic Sports, Technical University of Košice, Letná 9, 042 00 Košice, Slovakia
2
Department of Geo and Mining Tourism, Faculty of Mining, Ecology, Process Control and Geotechnologies, Institute of Earth Resources, Technical University of Košice, Letná 9, 042 00 Košice, Slovakia
*
Author to whom correspondence should be addressed.
Forests 2025, 16(11), 1728; https://doi.org/10.3390/f16111728
Submission received: 29 September 2025 / Revised: 4 November 2025 / Accepted: 9 November 2025 / Published: 14 November 2025
(This article belongs to the Special Issue Forest Recreation and Tourism)

Abstract

This study examines hiking within the context of active lifestyle trends, with a particular focus on the implications of physical limitations for its implementation in forest environments. The primary objective is to analyze how hiking offerings can be adapted to account for varying physical constraints that influence the selection and accessibility of forest landscapes. Special emphasis is placed on the intersection of forest-based recreation and geotourism, as both natural settings provide not only opportunities for physical activity but also unique geological and ecological values that shape visitor experience. The research emphasizes the role of physical fitness as a key factor in segmenting hiking participants, introducing it as a measurable parameter for categorization. To achieve this, the study applies quantitative methods, including motor ability tests, physical fitness assessments, somatic measurements, and verification of tourist categorization. Statistical analyses employed include descriptive statistics of performance values, two-sample t-tests, and Pearson’s correlation coefficients. The framework for designing hiking experiences highlights the importance of integrating forest trails and geotourism sites into accessible tourism planning. This approach demonstrates the potential benefits of incorporating physical fitness considerations into hiking development, ultimately enhancing accessibility, inclusivity, and safety in forest and environments.

1. Introduction

In recent years, geotourism has gained momentum as a vital and expanding segment of sustainable tourism, largely driven by a global shift toward nature-based recreation, environmental consciousness, and meaningful travel experiences. This form of tourism emphasizes the interpretation and preservation of geological heritage, offering visitors authentic interactions with the natural landscape. According to recent forecasts, the global geotourism market—valued at over USD 700 billion in 2024—is expected to grow to nearly USD 960 billion by 2029, with an estimated annual growth rate between 5.4% and 6.4% [1,2].
Specialized tourism represents those forms of tourist activities whose primary goal involves participation in activities that require specific abilities, skills, and knowledge, as well as the use of specialized equipment. The essence of all such forms lies in closeness to nature, combined with the regeneration of mental and physical strength and the improvement of physical fitness. Specialized tourism has an educational and exploratory dimension, as it enables contact with different environments in terms of nature, culture, and society [3]. The goal of these forms of tourism is the development of spiritual wealth, mental resilience, and physical fitness, together with the strengthening of human health. These are all tourist stays that involve active movement, primarily walking, and exploration of the natural and cultural–historical attractions of the visited place [4].
Geotourism, as a form of sustainable tourism, is a synergistic concept that connects all geographical and geological elements to create a travel experience that is richer than the sum of its parts and attracts visitors with a variety of interests [3]. According to Dowling [5] geotourism is a sustainable form of tourism focused primarily on geological features. It supports the appreciation and preservation of natural and associated heritage, which brings benefits to local communities. According to Kerekeš [6], geotourism can also be characterized as active walking or hiking in rural areas with suitable climatic and landscape conditions. The basis of geotourism, or geological tourism, is the exploration of the Earth’s development, mediated by active experience of geologically interesting landscapes with significant geological heritage [7].
A geotourist, as an environmentally conscious traveller, engages in active walking while visiting geosites and geotopes that represent the geological and cultural development of the landscape. Educational trails, geotourist routes, and interpretive panels allow visitors to gain new knowledge about geological processes and features, while simultaneously engaging in physical recreation and environmental learning [8,9].
By staying in an attractive forest environment, geotourism is closely linked to hiking as a form of specialized tourism, providing both recreational and educational benefits [10].
The forest environment plays a particularly important role in this context. Forested landscapes are among the most popular settings for geotourism because they combine geological diversity with aesthetic, ecological, and health-promoting functions. Forest ecosystems often overlay areas of high geodiversity, such as karst formations, volcanic fields, or mountain ridges, and serve as natural laboratories for understanding geomorphological processes [11,12].
Moreover, forests provide a restorative environment that enhances psychological well-being, reduces stress, and promotes physical activity [13]. The multisensory experience of forests—visual, acoustic, and olfactory—enhances visitors’ connection with nature and deepens their appreciation of both geological and biological diversity. As such, forest-based geotourism not only contributes to environmental education but also to sustainable health and recreation, aligning with current trends toward low-impact, experience-based tourism [14].
In recent years, forest environments have increasingly been recognized not only as ecological systems but also as spaces that deliver significant cultural ecosystem services, including recreation, mental restoration, and opportunities for physical activity. Forest-based recreation gained remarkable importance during and after the COVID-19 pandemic, as people sought accessible outdoor environments that supported both health and social well-being [15,16].
Within this broader context, forest bathing (shinrin-yoku) has emerged as a distinctive form of mindful tourism that emphasizes multisensory engagement with the forest atmosphere to promote psychological and physiological benefits [17,18]. Such experiences illustrate how forest environments can be positioned as core components of sustainable tourism planning, linking recreational value with conservation and ecosystem-service functions [19]. Integrating these perspectives expands the scope of geotourism toward a more holistic “forest-based geotourism,” where geological and ecological values jointly contribute to visitor well-being and destination sustainability.
According to the definition, geotourism is a form of tourism with a special interest in geology and the terrain of the landscape in a natural environment. It promotes tourism at geosites, exploration of geological objects and processes, and the protection of geodiversity [4]. One of the most accessible ways to explore a destination is hiking, which allows geotourists to discover geologically attractive sites through visits to geological locations, geotrails, viewpoints, and geo-activities. Hiking is therefore also popular among tourists who not only enjoy walking but are also interested in nature, natural resources, and authentic local experiences [3].
Hiking represents one of the most accessible forms of physical activity, suitable for all age categories. Each individual can adjust the intensity of exertion to their own abilities, physical performance, and current health status. This form of active recreation has long been recognized not only for its recreational value but also for its positive effects on health, stress reduction, and overall mental well-being [20,21]. Hiking forms an important part of the travel industry, and its various forms—such as walking tourism, high-altitude hiking, or mountaineering—are commonly offered as part of destination and outdoor recreation products [22,23].
Given the diversity of natural conditions and the requirements for specific skills and knowledge, Matlovičová [4] distinguished individual types of tourism—such as hiking, ski tourism, or cycling tourism—according to the demands on knowledge and behavior in natural environments where these activities occur.
Building on these observations, the present study seeks to address an essential yet underexplored aspect of forest-based geotourism—how objectively measurable indicators of physical fitness relate to tourists’ real-world behavior and trail selection. Despite the increasing academic attention to forest-based recreation and geotourism, a fundamental research gap remains concerning the relationship between objectively measurable physical fitness and the actual selection of hiking trails within forest environments. It is not yet clear to what extent individual fitness levels influence visitors’ preferences and decision-making when choosing routes, nor how strongly this factor interacts with other variables such as motivation, prior experience, or perceived risk [21,24,25].
Therefore, the main objective of this study is to highlight the role of physical fitness as a key determinant in the segmentation of hiking participants and to introduce it as a quantifiable parameter for their categorization. By establishing a measurable framework for assessing tourists’ physical preparedness, this research aims to contribute to the development of more inclusive, adaptive, and safety-oriented approaches to geotourism and forest-based recreation.

2. Theoretical Background

2.1. Methodologies for Measuring Physical Fitness in Natural Environments

In recent years, the assessment of physical fitness in natural environments has become an essential methodological focus in research on outdoor recreation and hiking. Traditional laboratory-based evaluations often lack ecological validity when studying populations engaged in field-based activities. Consequently, researchers have increasingly relied on portable, reliable, and ecologically relevant field tests that can be administered under real-world outdoor conditions [26,27]. These field-oriented methods allow a more authentic evaluation of the physiological responses and physical abilities actually required for hiking and other outdoor activities.
In this study, the Ruffier Functional Test, the UNIFIT test, and Motor Skills Testing of Physical Fitness were used to assess cardiorespiratory endurance, functional capacity, and coordination directly in the field environment. The Ruffier Functional Test (RFT) provides an estimate of cardiovascular adaptability based on heart rate changes before and after a standardized set of squats, enabling a quick assessment of recovery ability and circulatory efficiency [28,29]. It is particularly suited to field conditions because it requires minimal equipment, can be performed on any flat surface, and has shown good reliability in estimating aerobic capacity and overall cardiovascular response [30,31]. Moreover, studies confirm that Ruffier Index results correlate significantly with VO2max and overall endurance capacity, making the test a valid screening tool for assessing fitness among recreational athletes and physically active populations in non-laboratory environments [31,32].
The UNIFIT test is another versatile and standardized tool that allows for the multidimensional assessment of physical fitness components—such as endurance, strength, flexibility, and speed—under school, community, and outdoor field conditions [33,34]. Designed for large-scale youth and adult populations, UNIFIT can be administered with minimal equipment, facilitating its adaptation to natural environments where electricity or laboratory instruments are unavailable. Its structure enables the testing of individuals or groups directly in parks, forests, or sports grounds, making it particularly suitable for ecological studies of fitness and physical activity in nature [35,36]. In outdoor or hiking-related research, UNIFIT provides a comprehensive overview of overall fitness and physical readiness, while maintaining comparability across participants and age groups. For example, the endurance subtests (e.g., 1 km run or shuttle run) and flexibility or coordination tasks can be effectively conducted on flat outdoor terrain without compromising reliability [34,37].
Complementary motor skills tests—including balance, coordination, and agility assessments—add another dimension to understanding physical competence. These components are especially relevant for hiking and trail-based activities, where uneven surfaces and changing gradients demand a high degree of postural control and adaptability [26,27]. Together, these field tests allow for a realistic, multidimensional characterization of fitness in outdoor contexts, bridging the gap between laboratory accuracy and ecological relevance.
While this study primarily utilized the Ruffier Functional Test, UNIFIT, and motor skills assessments, other field-based options are also suitable for evaluating fitness in natural settings. Submaximal field walking tests, such as the Six-Minute Walk Test (6MWT) or the Rockport One-Mile Walk Test (RFWT), have shown strong correlations with directly measured VO2max and can be performed with minimal instrumentation [37,38].These walking protocols, together with the growing use of wearable sensors and mobile applications, provide additional opportunities for accurately quantifying physical performance during real outdoor activity [27]. However, the Ruffier and UNIFIT tests remain advantageous in ecological studies because they require less space and equipment, allowing for standardized and reproducible measurements even in remote field locations.

2.2. Analysis of Tourism Target Groups

Tourism is shaped mostly by the interests of its participants. It is influenced by a combination of internal and external factors and motives, which evoke over the course of an individual’s life cycle and are largely determined by the person’s social and economic status at a given time [39,40].
In the context of geotourism, segmentation as a marketing tool involves dividing consumers into relatively homogenous groups based on shared characteristics, with the aim of clearly identifying and effectively reaching the target market. This process enables the tailoring of products and services to the specific preferences and needs of each segment.
Palátková [41] identifies clear relationships between the type of tourism—weather defined by its form of by a specific destination—and the social profile of the participants. One commonly applied approach in market segmentation is the socio-economic JICNARS method (Joint Industry Committee for Newspaper Advertising Research), as presented by Horner and Swarbrooke [42]. This method classifies consumers based on income, education, occupation, and other socio-economic variables that influence behaviour in the tourism market.
Given that geotourism activities can be undertaken at different stages of life, segmentation by family life cycle is also relevant. Seaton and Bennet [43] regard this approach as strategically important for both planning and marketing, as each stage of the life cycle affects per capita spending as well as requirements for accommodation, food services, and supplementary activities. These factors subsequently inform the design of an optimal tourism product in terms of pricing, content, and promotional strategy.
Psychographic segmentation offers another useful perspective by examining personality traits and motivational drivers through tourists’ attitudes and preferred activities. Seaton and Bennet [44] distinguish between two primary tourist types: the psychocentric tourist, characterized by cautious, risk-averse, and conservative behaviour, and the allocentric tourist, who seeks novelty, adventure, and exploration. Stynes [45] expands on these profiles, noting that many tourists exhibit traits from both categories. Cohen’s typology [46] identifies five tourist types based on the nature of experiences sought: recreational, diversionary, experiential, experimental, and existential. Similarly, Long [47] proposes a seven-group classification, while Gonzales and Bello [48] define five key lifestyle-based consumer groups. Ryglová [49] differentiates between tourists, day-trippers, and visitors as distinct categories of participants in tourism.
Geographic segmentation—based on a visitor’s origin or place of residence—provides another layer of classification. Kiráľová [50] identify three primary visitor groups, while the ACORN method (A Classification of Residential Neighborhoods) offers a widely used system built on the principle that residential environments shape distinct consumer profiles across multiple variables [51].
Behavioural segmentation is also applicable. Goeldner and Brent [52], for example, classify tourists according to behavioural patterns and the type of tourism product sought, resulting in categories such as ecotourists, convention tourists, cultural tourists, spa tourist, and business tourists.

2.3. Target Group in Geotourism

In essence, the primary focus of geotourism participants is the observation of geological forms and processes, alongside the acquisition of new knowledge about them. Through appropriate interpretation, geotourism has the capacity to provide a degree of fulfilment to virtually every geotourist.
Hose [53] classifies geotourists according to their expectations and the satisfaction they derive from visiting specific geosites into two principal categories: educational geotourists, whose primary motivation is learning, and recreational geotourists, who seek leisure and enjoyment.
Grant [54] further differentiates geotourists based on their level of education in geology and related sciences into six distinct groups: geo-expert, geo-specialist, geo-amateur, interested visitor, informed visitor, and uninformed visitor.
From the standpoint of visitor satisfaction—an essential prerequisite for the long-term sustainability and viability of geotourism—Molokáč et al. [55] identifies five key target groups within the sector. While the core content of geotourism activities remains grounded in natural and geological features, contemporary approaches to its development emphasize the need to adapt offerings to the diverse profiles of tourists. This includes consideration not only of their specific interests but also of their physical capabilities [56].
For geotourists, one of the key considerations when selecting a specific geotourism destination is the accessibility of the site, particularly the route leading to it. Another significant factor influencing destination choice is the visitor’s physical capacity. In this regard, information on the difficulty level of trails plays an essential role in decision-making. Geotourism encompasses far more than leisurely walks in nature, it frequently involves hiking in challenging terrain, ascending peaks, and traversing landscapes with diverse geological and environmental obstacles [57]. Careful assessment of the physical fitness levels of different tourist groups is therefore crucial to design activities that are not only safe but also enjoyable and rewarding [58]. Less demanding activities—such as short nature walks or visits to geosites—require minimal physical exertion [59]. Moderate hikes, including longer routes with some technical elements, remain accessible to the majority of tourists [60]. In contrast, highly demanding and physically intensive activities, such as a mountain ascent, extended hikes in difficult terrain, or other strenuous challenges, necessitate a high level of physical preparedness [61].
A lack of sufficient information can lead to excessive fatigue, increased risk of injury, or failure to complete the selected route—either fully or partially—thereby diminishing the visitor experience.
When planning geotourism itineraries, it is important to consider the factors that influence tourists‘ physical capabilities. These include:
  • Age and health status—These directly impact endurance and the capacity to engage in physically demanding activities. Older visitors or those with health limitations may find it difficult to complete more challenging routes [62].
  • Level of regular physical activity—Tourists accustomed to regular exercise generally possess greater stamina and are more capable of undertaking demanding hikes or excursions [63].
  • Terrain and environmental conditions—Geotourism trails range from gentle walks to strenuous climbs. Weather conditions, such as rainfall or high temperatures, can further affect tourists’ ability to complete a route [64].
  • Motivation and purpose of visit—Some tourists are driven by an interest in nature, while others are motivated by geological phenomena. The underlying motivation often determines the type and intensity of physical activity they are willing to undertake [65].

3. Materials and Methods

The objective of this study was to develop a new categorization of tourists based on their level of physical fitness and to adapt the existing geotourism offer to the capabilities and physical limitations of distinct target groups. The overarching aim was to design a model that would allow for more precise targeting of geotourism products, considering the actual physical abilities of visitors. To obtain relevant data, standardized methods for measuring and testing physical performance were employed, enabling an objective evaluation of the individual limits of research participants.

3.1. Somatometric Measurements

Body height was measured using a fixed HR-001—Portable Stadiometer (Tanita Corp., Tokyo, Japan) mounted on a vertical wall, with an accuracy of 0.1 cm. Body weight was assessed using an OMRON VIVA BF-222T personal scale (OMRON Healthcare, Co., Ltd., Kyoto, Japan), accurate to 0.1 kg. These measurements were subsequently used to calculate the Body Mass Index (BMI), providing an index for the classification of participants‘ body composition [66,67,68].

3.1.1. Motor Skills Testing of Physical Fitness

The physical fitness of study participants was assessed using the UNIFIT Test, a standardized tool designed for individuals aged 6 to 60 years. The test enables the evaluation of motor abilities and physical performance across the adult population, including older age groups. It is structured as a unified instrument with a universal testing framework applicable across age categories and genders. For assessment of aerobic endurance, the UNIFIT Test provides multiple alternatives that consider the participant’s age, current level of fitness, and the specific conditions under which testing is conducted [64].
The core of the UNIFIT test combines general motor assessments with a selective test reflecting the typical motor abilities of a given age period. The general motor tests include:
  • T1: Standing long jump.
  • T2: Sit-up test.
  • T3.a: 12 min run (endurance assessment for individuals aged 10–20 years).
  • T3.b: 2 km walk (endurance assessment for individuals over 20 years of age).
Only one endurance evaluation alternative (T3.a or T3.b) is required, allowing the test to be adapted to the real capabilities and age of participants.

3.1.2. Ruffier Functional Test

The Ruffier Functional Test is a straightforward and reliable method for assessing the functional state of the cardiovascular system and the body’s readiness for physical exertion. The evaluation is based on heart rate measurements, providing an objective indicator of an individual’s current level of physical conditioning. This assessment offers a dependable overview of cardiovascular health and the body’s capacity to manage physical load. The calculated index delivers valuable insights into each participant’s overall fitness level [69].
Drawing on quantitative analysis, a categorization of tourists according to their physical fitness level was developed. The validity of this classification was subsequently tested under real-world conditions using a selected geotourism offer. Filed testing was carried out as part of practical, on-site research activities.
The UNIFIT and Ruffier tests were selected for their benefits:
  • They are standardized and scientifically verified.
  • They provide a comprehensive picture of fitness by measuring several motor abilities rather than focusing on a single area.
  • They are simple to implement and do not require complex equipment.
  • They allow comparison with established norms, as results are comparable by age and gender.
  • They are applicable across different age categories.
  • They support prevention and early intervention, as identifying deficiencies in physical fitness can lead to recommendations for appropriate physical activity or training.

3.1.3. Field Walking

The proposed categorization of tourists based on physical limitations was verified through the application of a geotourism model in Slovakia, adapted to reflect real environmental and logistical conditions. In designing the verification process, a route was selected that would be suitable both for the targeted visitor groups and for effective monitoring during the field evaluation [70,71].
The test hiking route was in the forest park between Alpinka and Bankov, in the vicinity of Košice, Slovakia. The route measured 2 km in length with an elevation gain of 180 m (Figure 1). Its selection was determined by the prevailing research conditions and the restrictions imposed during the COVID-19 pandemic. This route provided an appropriate setting for the flexible verification of the proposed tourist categorization based on physical fitness, under real-world conditions during the years 2020–2021.
Participants completed the route in small groups of five to ten individuals, with identical conditions ensured for each group. The trail passed through a forested landscape, with calm weather, dry ground, and no precipitation. Prior to commencing the hike, participants were instructed to proceed at their own pace. In the event of a rest stop, they were required to complete a record sheet indicating the duration of the break and the reason for it (e.g., thirst, hunger, fatigue, injury, or nature observation).
Geotourism features included in the itinerary:
  • Technical heritage site: Bankov Mine, historically used for magnesite extraction.
  • Natural heritage sites: Studnička Spring and St. John of Nepomuk Spring.

3.2. Characteristics of the Research Sample

The research sample consisted of 240 male and female participants aged 10–60 years, residing in Košice. All participants completed all segments of the testing and engaged in sports activities exclusively on a recreational basis. The average age was 31.49 years, with an average height of 170 cm and an average body weight of 65.6 kg.
A total of 40 participants were included in the study, divided into six age-based groups:
-
Group 1 (G1): 10–14 years (22 males, 18 females); mean age 12.04 years, mean height 155.63 cm, mean body weight 44.27 kg, mean BMI 18.10.
-
Group 2 (G2): 15–20 years (19 males, 21 females); mean age 16.9 years, mean height 173.55 cm, mean body weight 65.03 kg, mean BMI 21.08.
-
Group 3 (G3): 21–30 years (21 males, 19 females); mean age 25.18 years, mean height 175.6 cm, mean body weight 71.1 kg, mean BMI 22.91.
-
Group 4 (G4): 31–40 years (20 males, 20 females); mean age 35.28 years, mean height 172.72 cm, mean body weight 69.36 kg, mean BMI 23.11.
-
Group 5 (G5): 41–50 years (19 males, 21 females); mean age 45.0 years, mean height 172.45 cm, mean body weight 73.43 kg, mean BMI 24.65.
-
Group 6 (G6): 51 years and older (21 males, 19 females); mean age 54.55 years, mean height 171.62 cm, mean body weight 71.56 kg, mean BMI 24.24.

Research Sample Selection

Participant selection was conducted using a purposive (intentional) sampling method based on predefined inclusion criteria. Respondents were eligible for participation if they met the following conditions:
-
Age range: between 18 and 60 years, representing the active working-age population, which also constitutes the demographic most frequently engaged in hiking and geotourism activities.
-
Adequate physical fitness: participants were in good general health, without serious musculoskeletal or chronic conditions that could influence performance on physical fitness tests or pose safety risks during field activities.
-
Voluntary participation: participants expressed willingness to complete the entire research process, including both laboratory and field-testing components.
All participants were thoroughly informed about the aims, procedures, and methodology of the study, including potential risks and the voluntary nature of their participation. Each participant provided written informed consent, confirming that they understood the study requirements and agreed to the processing of their personal data in accordance with applicable ethical and legal standards (e.g., GDPR).
This sampling strategy was designed to reflect the practical requirements of research focused on physical fitness and geotourism behavior, while minimizing the risk of excluding relevant participant subgroups. Although the selection was non-random, it ensured a representative sample of recreationally active individuals with varying levels of physical conditioning. This approach facilitated effective analysis of the relationship between physical performance and preferences for terrain-based tourist routes. A detailed breakdown of the testing segments is presented in Table 1.
Quantitative testing of participants was performed between September 2020 and October 2021. Somatometric measurements and the Ruffier Functional Test were conducted in the gymnasium at Ferka Urbánka St., within the premises of the Technical University of Košice. In the same location, motor skills were assessed using the standing long jump and sit-up tests. The 2 km walk and 12 min run were performed on tartan-surfaced athletics track at the Technical University’s stadium in Košice. The field test, consisting of a walk in natural forested terrain, was carried out on a pre-selected hiking route in the vicinity of Košice, leading towards Bankov. The route was 2 km in length with an elevation gain of 180 m. Participants carried no additional load and were instructed to record in log sheets the timing, duration, and reason for any breaks (e.g., fatigue, injury, nature observation). All measurements were conducted within the defined timeframe according to participants‘ availability, ensuring that each group was tested under identical meteorological conditions.

3.3. Statistical Analysis

Data analysis was performed using SPSS Statistics 19 and Microsoft Excel 2016. Data was presented in the form of pivot tables. An independent two-sample t-test was applied to compare the means of two independent groups [72,73].
In our research, we compared the mean differences in total scores between age-adjacent groups. These represent independent samples. The prerequisite for using two-sample t-test was assumption of data normality. The level of significance was set at 5%. The Pearson correlation coefficient was used to assess the strength of dependence. Using Pearson’s correlation coefficient (r), we determined, at the 5% significance level, whether a positive (+) or a negative (-) dependence existed between internal factors influencing the decision-making process of the respective target groups:
  • Body mass index (BMI);
  • Motor abilities;
  • Physical fitness.
All outputs were presented in both tabular and graphical form, including box plots, scatter plots, pie charts, and bar charts.
Based on the study’s objective—to develop a new categorization of tourists according to physical fitness and adapt the existing geotourism offer to physical limitations—the following hypotheses were formulated:
H1: 
Age-adjacent groups of tourists will display similar results in physical fitness tests.
H2: 
The time required to complete a walk in natural terrain will differ significantly between the newly formed groups of tourists.
H3: 
The strongest correlation will be between physical fitness (measured using Ruffier Functional Test) and performance in the terrain walk.
An independent two-sample t-test was used to test these hypotheses. We presented all the outputs in the form of tables and graphically, using box plots, scatter plots of dependence.

4. Results

4.1. Somatometric Measurements and BMI

In Group 1, no cases of overweight were recorded, which was also confirmed by the average BMI for the group (18.1). Overweight was observed in Group 2 in two males (aged 17—BMI 25.1; aged 19—BMI 28.3). The remaining participants in this group had a normal BMI (18.6–24.5), with the group average being 21.25. An identical number of overweight individuals (7) was recorded in both Groups 3 and 4. Obesity Grade 1 was documented in Group 4 in two males. BMI tended to increase with age: in Groups 5 (41–50 years) and 6 (51–60 years), the mean values were at the threshold between normal weight and overweight (G5—24.65; G6—24.24). These findings support the conclusions of Hlavoňová, Hedvábny and Kalina [74], who in their 2011–2013 study on adult physical activity observed that average obesity indicators increase with age regardless of gender. According to Sigmund, Dostálová, and Sigmundová, this is explained by the fact that younger age categories engage in regular physical activity [75].

4.2. Motor Ability Testing—UNIFIT Test

H1: 
Age-adjacent groups of tourists will display similar results in physical fitness tests.
Participants ‘motor abilities were assessed using the UNIFIT Test, which evaluates individual strength, endurance, and speed capabilities. To analyse differences in motor abilities between age-adjacent groups, the two-sample t-test was applied. This test was used to compare the mean motor ability values between the following age groups:
  • Group 1 (10–14 years) ↔ Group 2 (15–20 years);
  • Group 3 (21–30 years) ↔ Group 4 (31–40 years);
  • Group 5 (41–50 years) ↔ Group 6 (51–60 years).
The t-test enabled the assessment of whether statistically significant differences existed in motor abilities between these age groups.
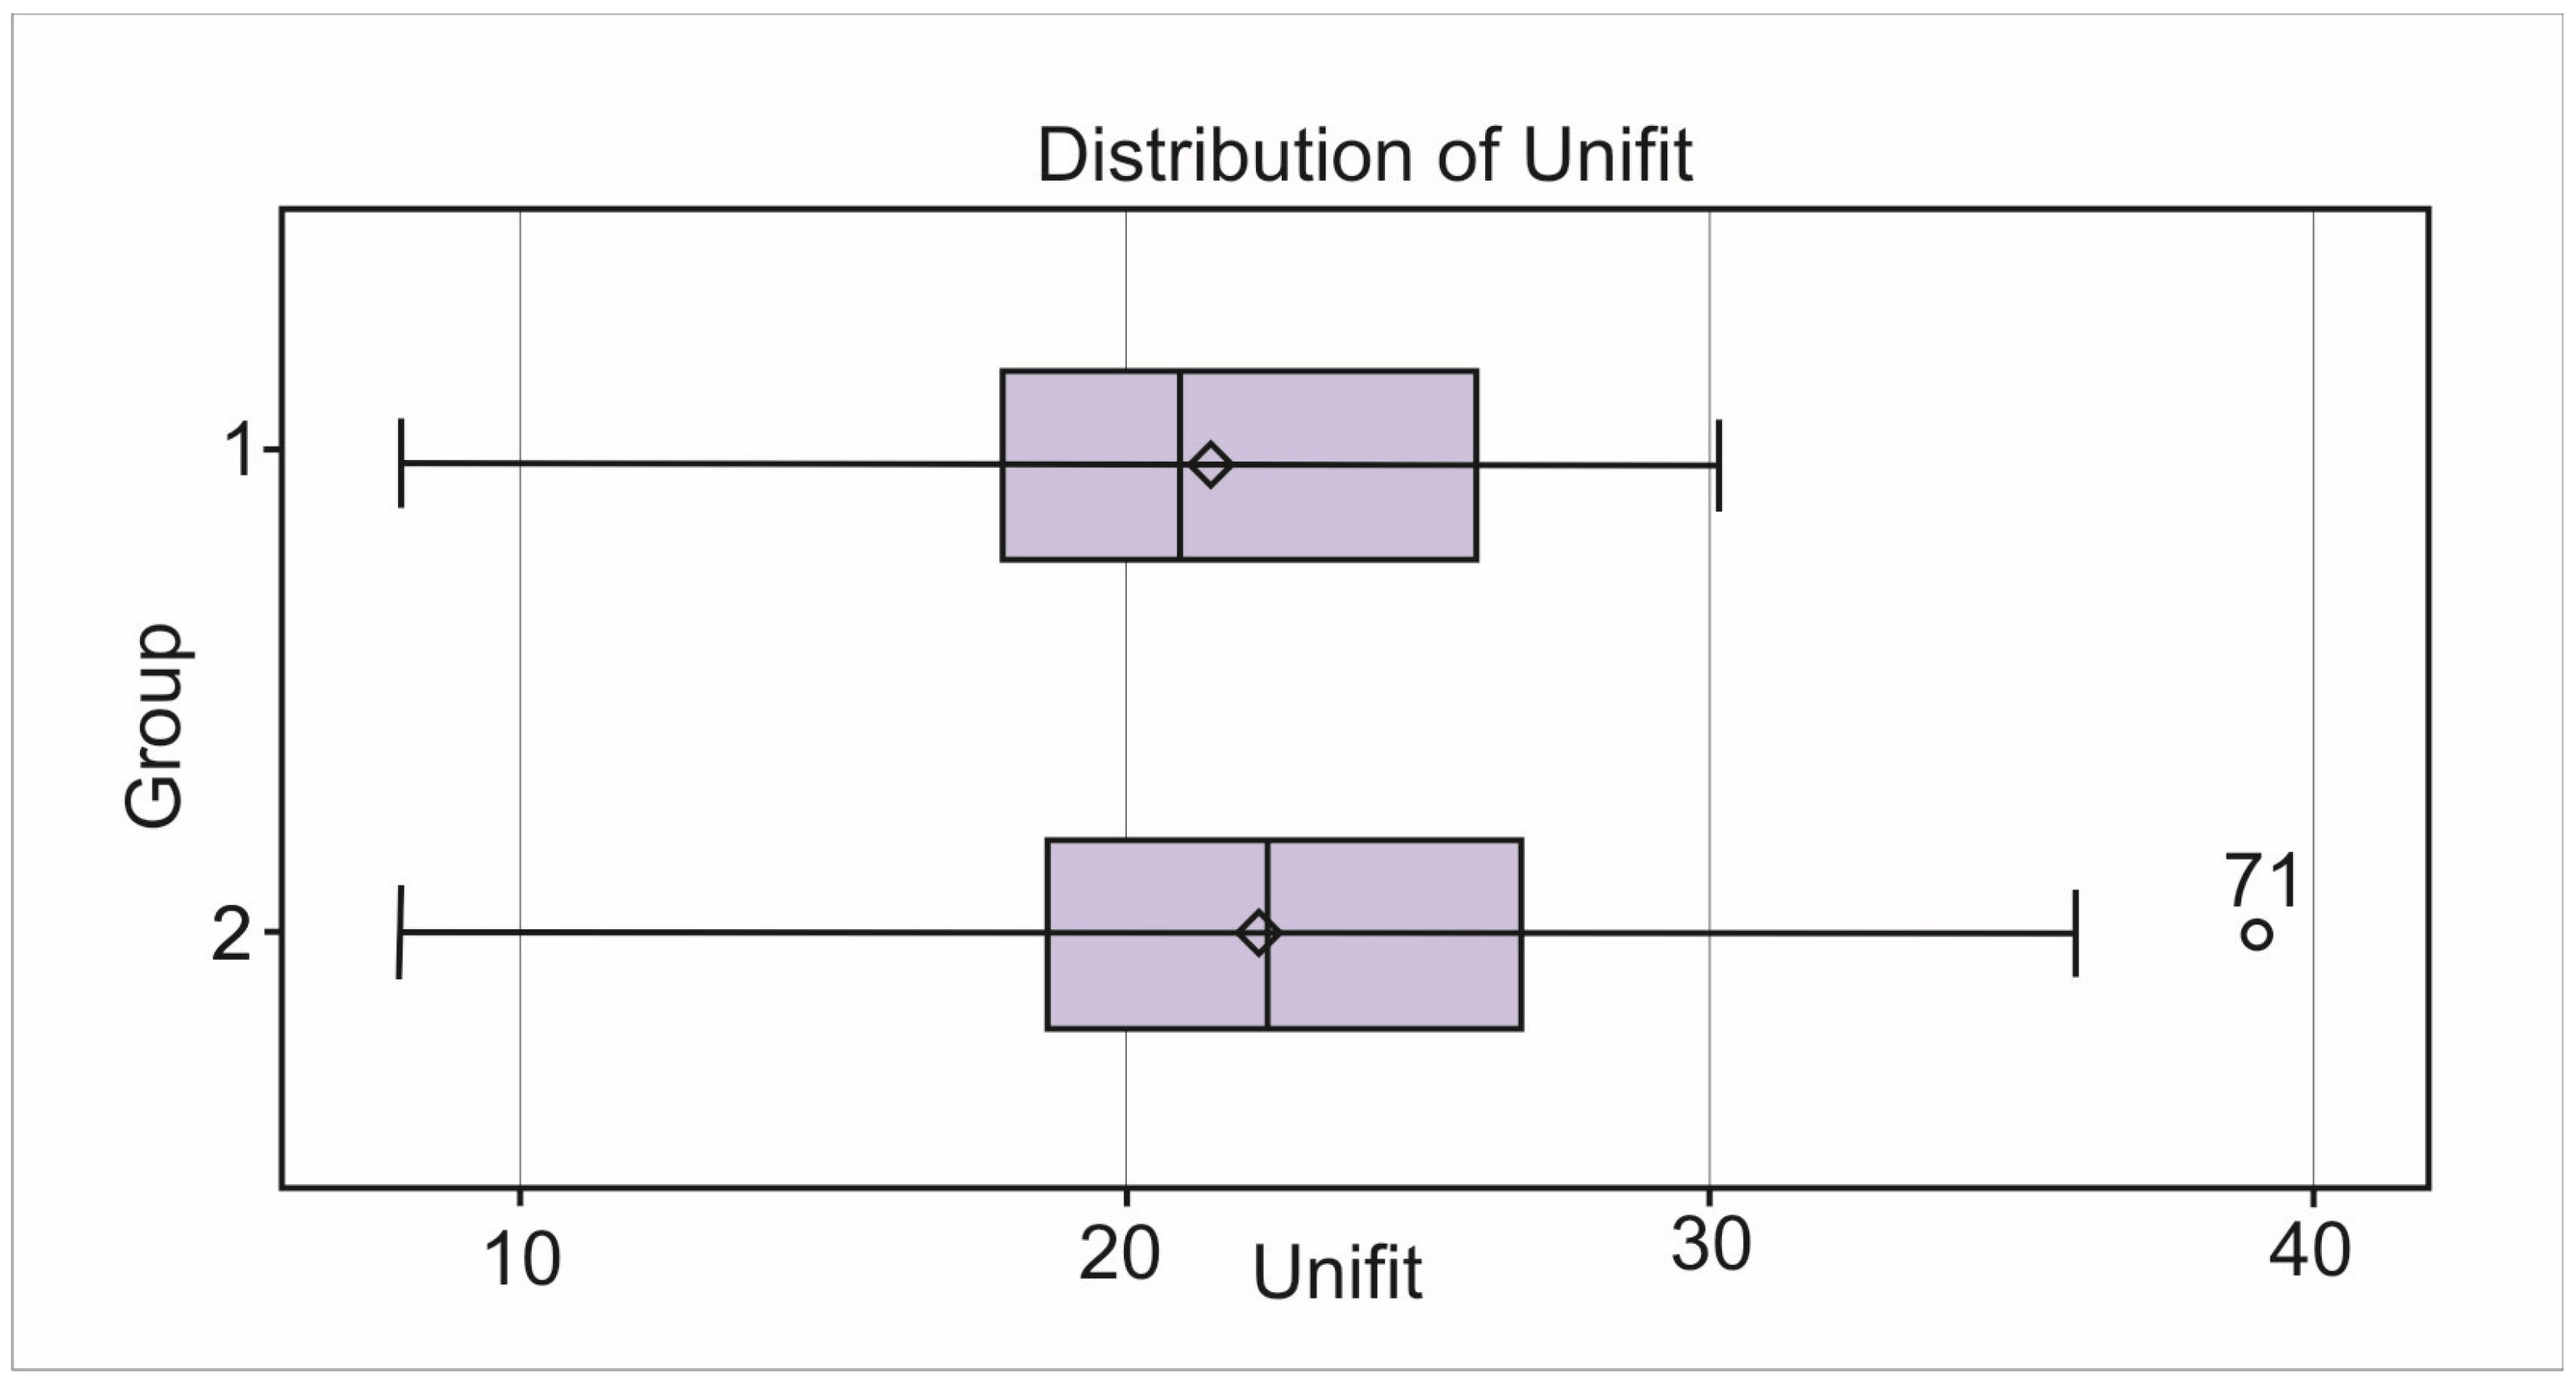
The graphical distribution of achieved performances in Group 1 and Group 2 is presented in Figure 2, offering a visual overview of the performance spread in both groups and providing a clearer understanding of differences in motor abilities between these age categories.
Three tested individuals in Group 1 achieved significantly above-average performance (scoring 30 points). In this group, four individuals had significantly below-average performance, while 12 participants demonstrated above-average performance (7 men and 5 women). The average score for the entire group was 21.53, representing an average level of performance.
In Group 2, four tested individuals achieved significantly above--average performance (two16-year-olds and two 17-year-olds), while, similarly to Group 1, 11 participants had above-average performance (7 men and 4 women). The average score for this group was 22.3, also indicating an average performance level for the group.
Analysis of the research results showed that between Group 1 and Group 2, regarding the level of motor skills (measured using Unifit Test), there was no statistically significant difference at the 5% significance level (p = 0.05). The p-value (p = 0.58) indicates that the differences in motor skills between these groups are not statistically relevant, and therefore no significant distinction between the groups can be confirmed for evaluated parameters.
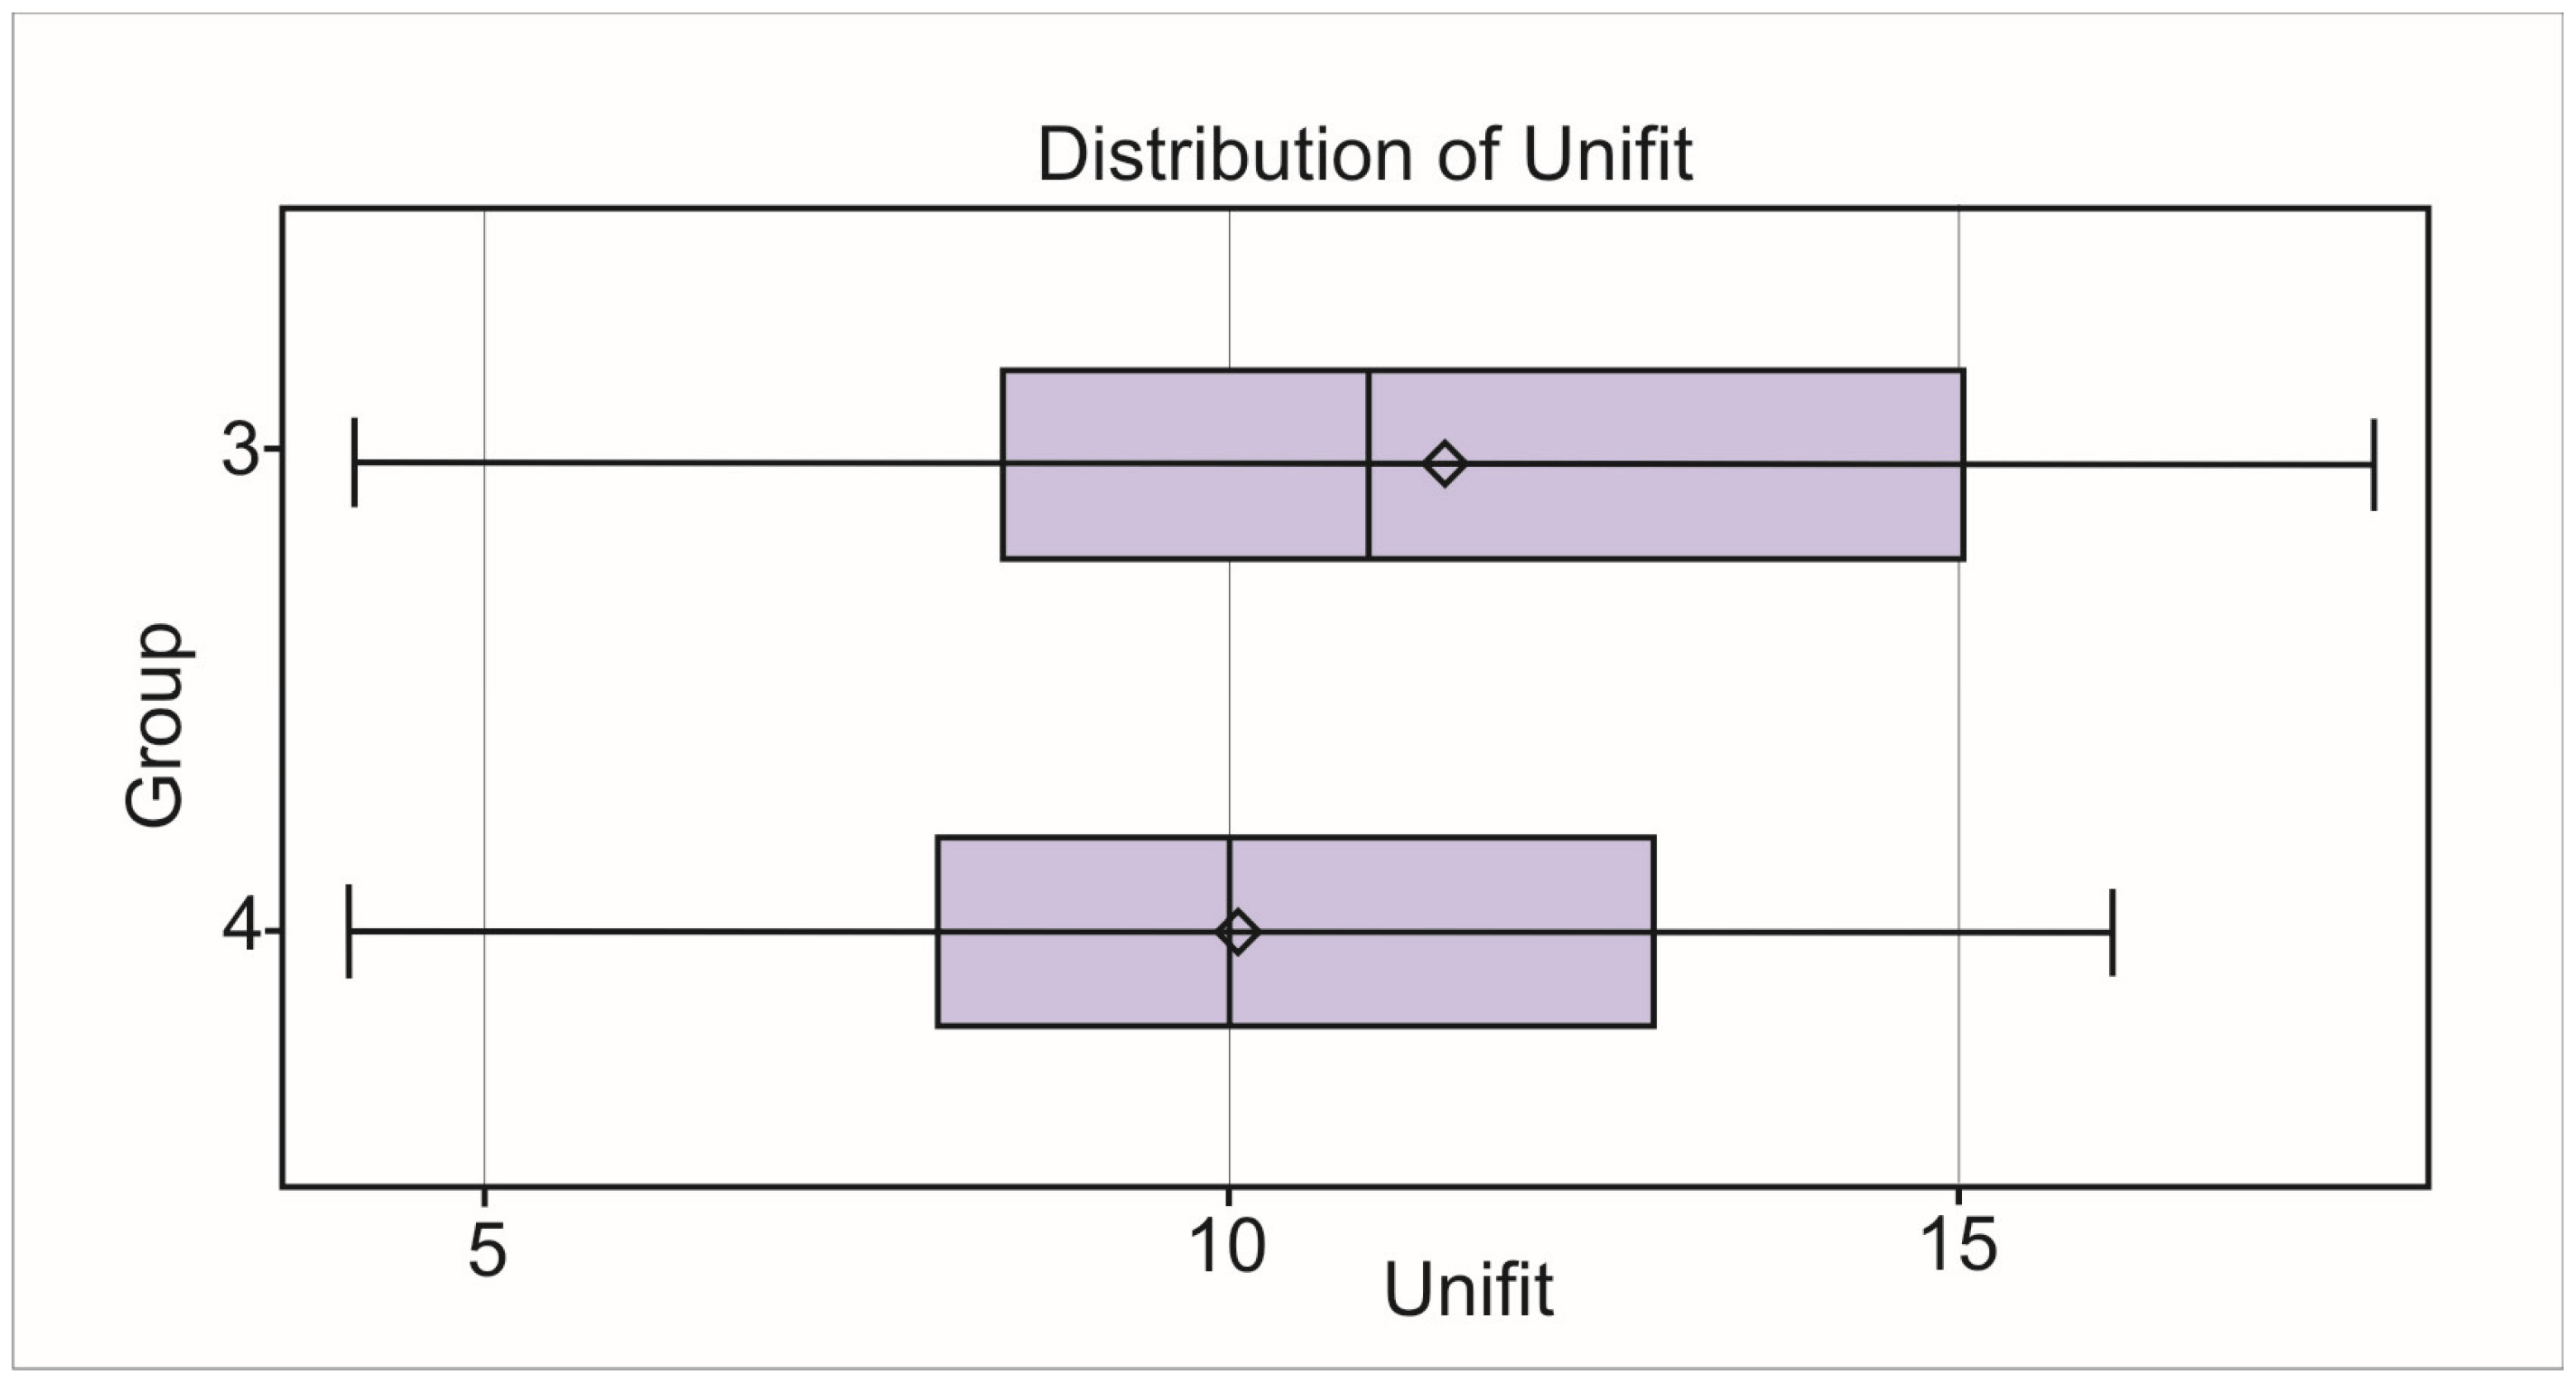
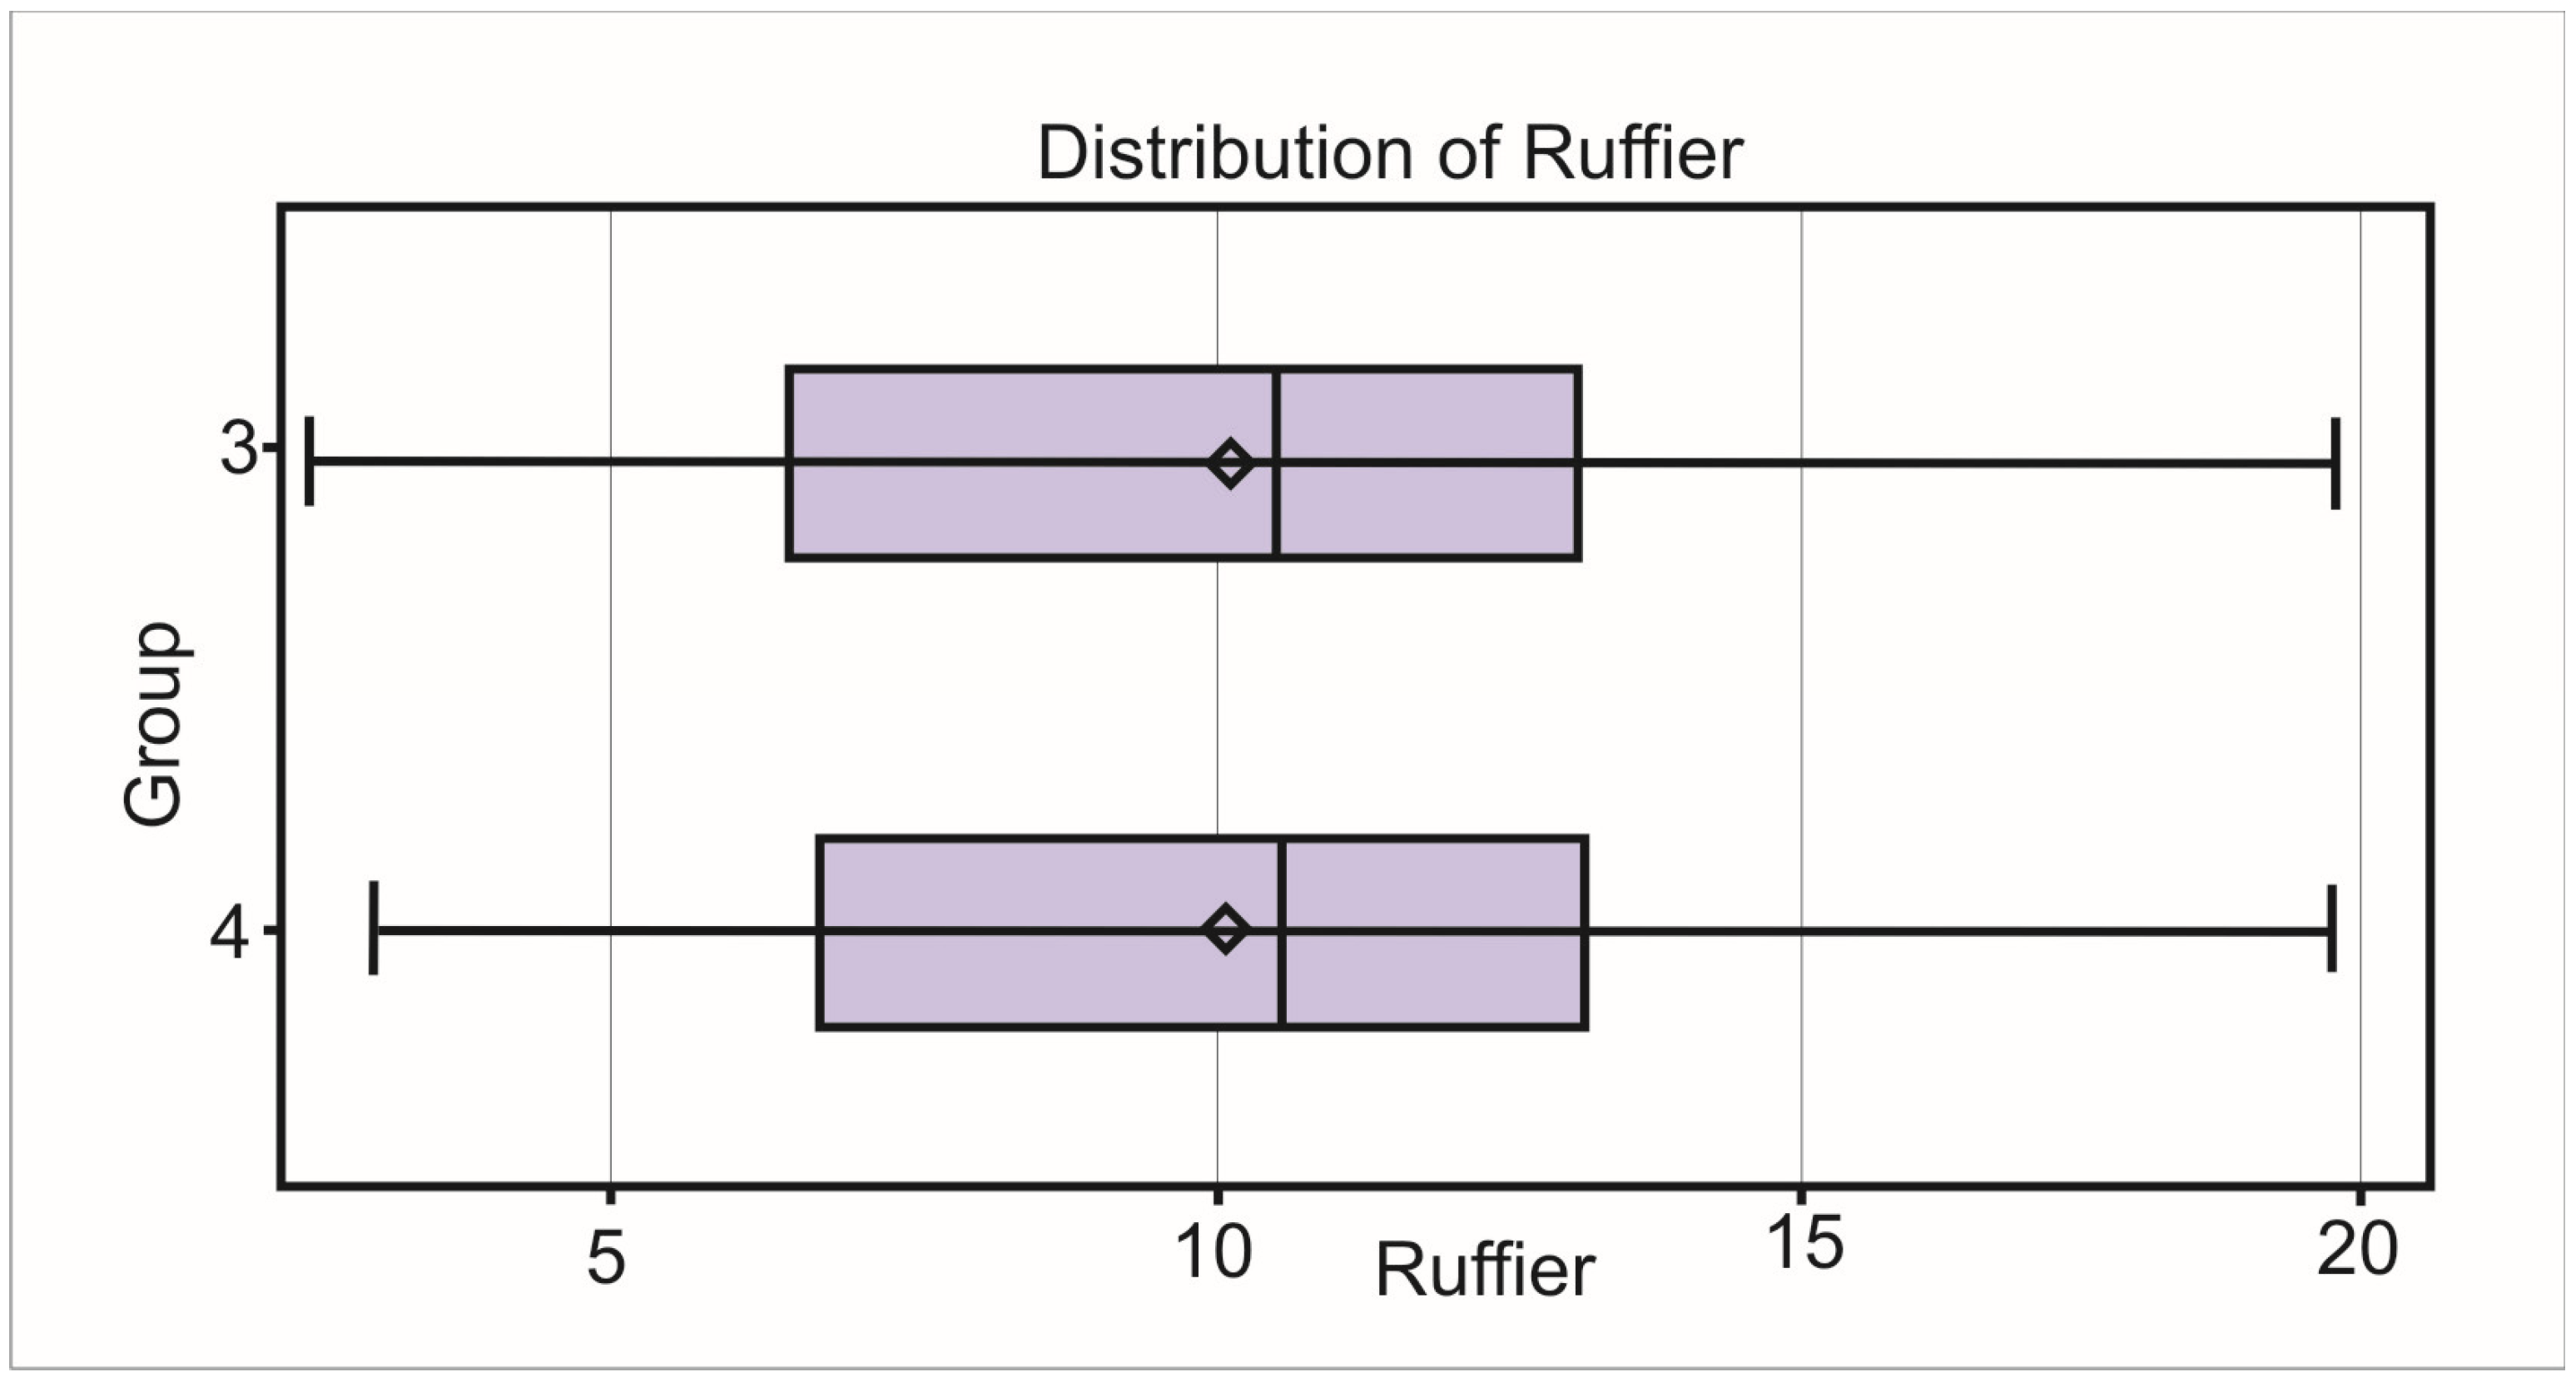
A graphical comparison of performance distribution between Group 3 and Group 4 (Figure 3) shows that Group 3 had an overall average of 11.48 points, indicating average performance. Similarly, Group 4 had an overall average of 10.05 points, also representing average performance. Above-average performance was achieved by 8 individuals in Group 3 (3 men, 5 women) and 9 individuals in Group 4 (5 men, 4 women).
Comparing the data between Group 3 and Group 4, no significant changes were observed in the Unifit Test parameters at the 5% significance level (p = 0.05), with a p-value of p = 0.08. In both groups, several individuals showed significantly below-average performance: in Group 3, 5 to 6 individuals had below-average results, while in Group 4, this applied to 6 individuals.
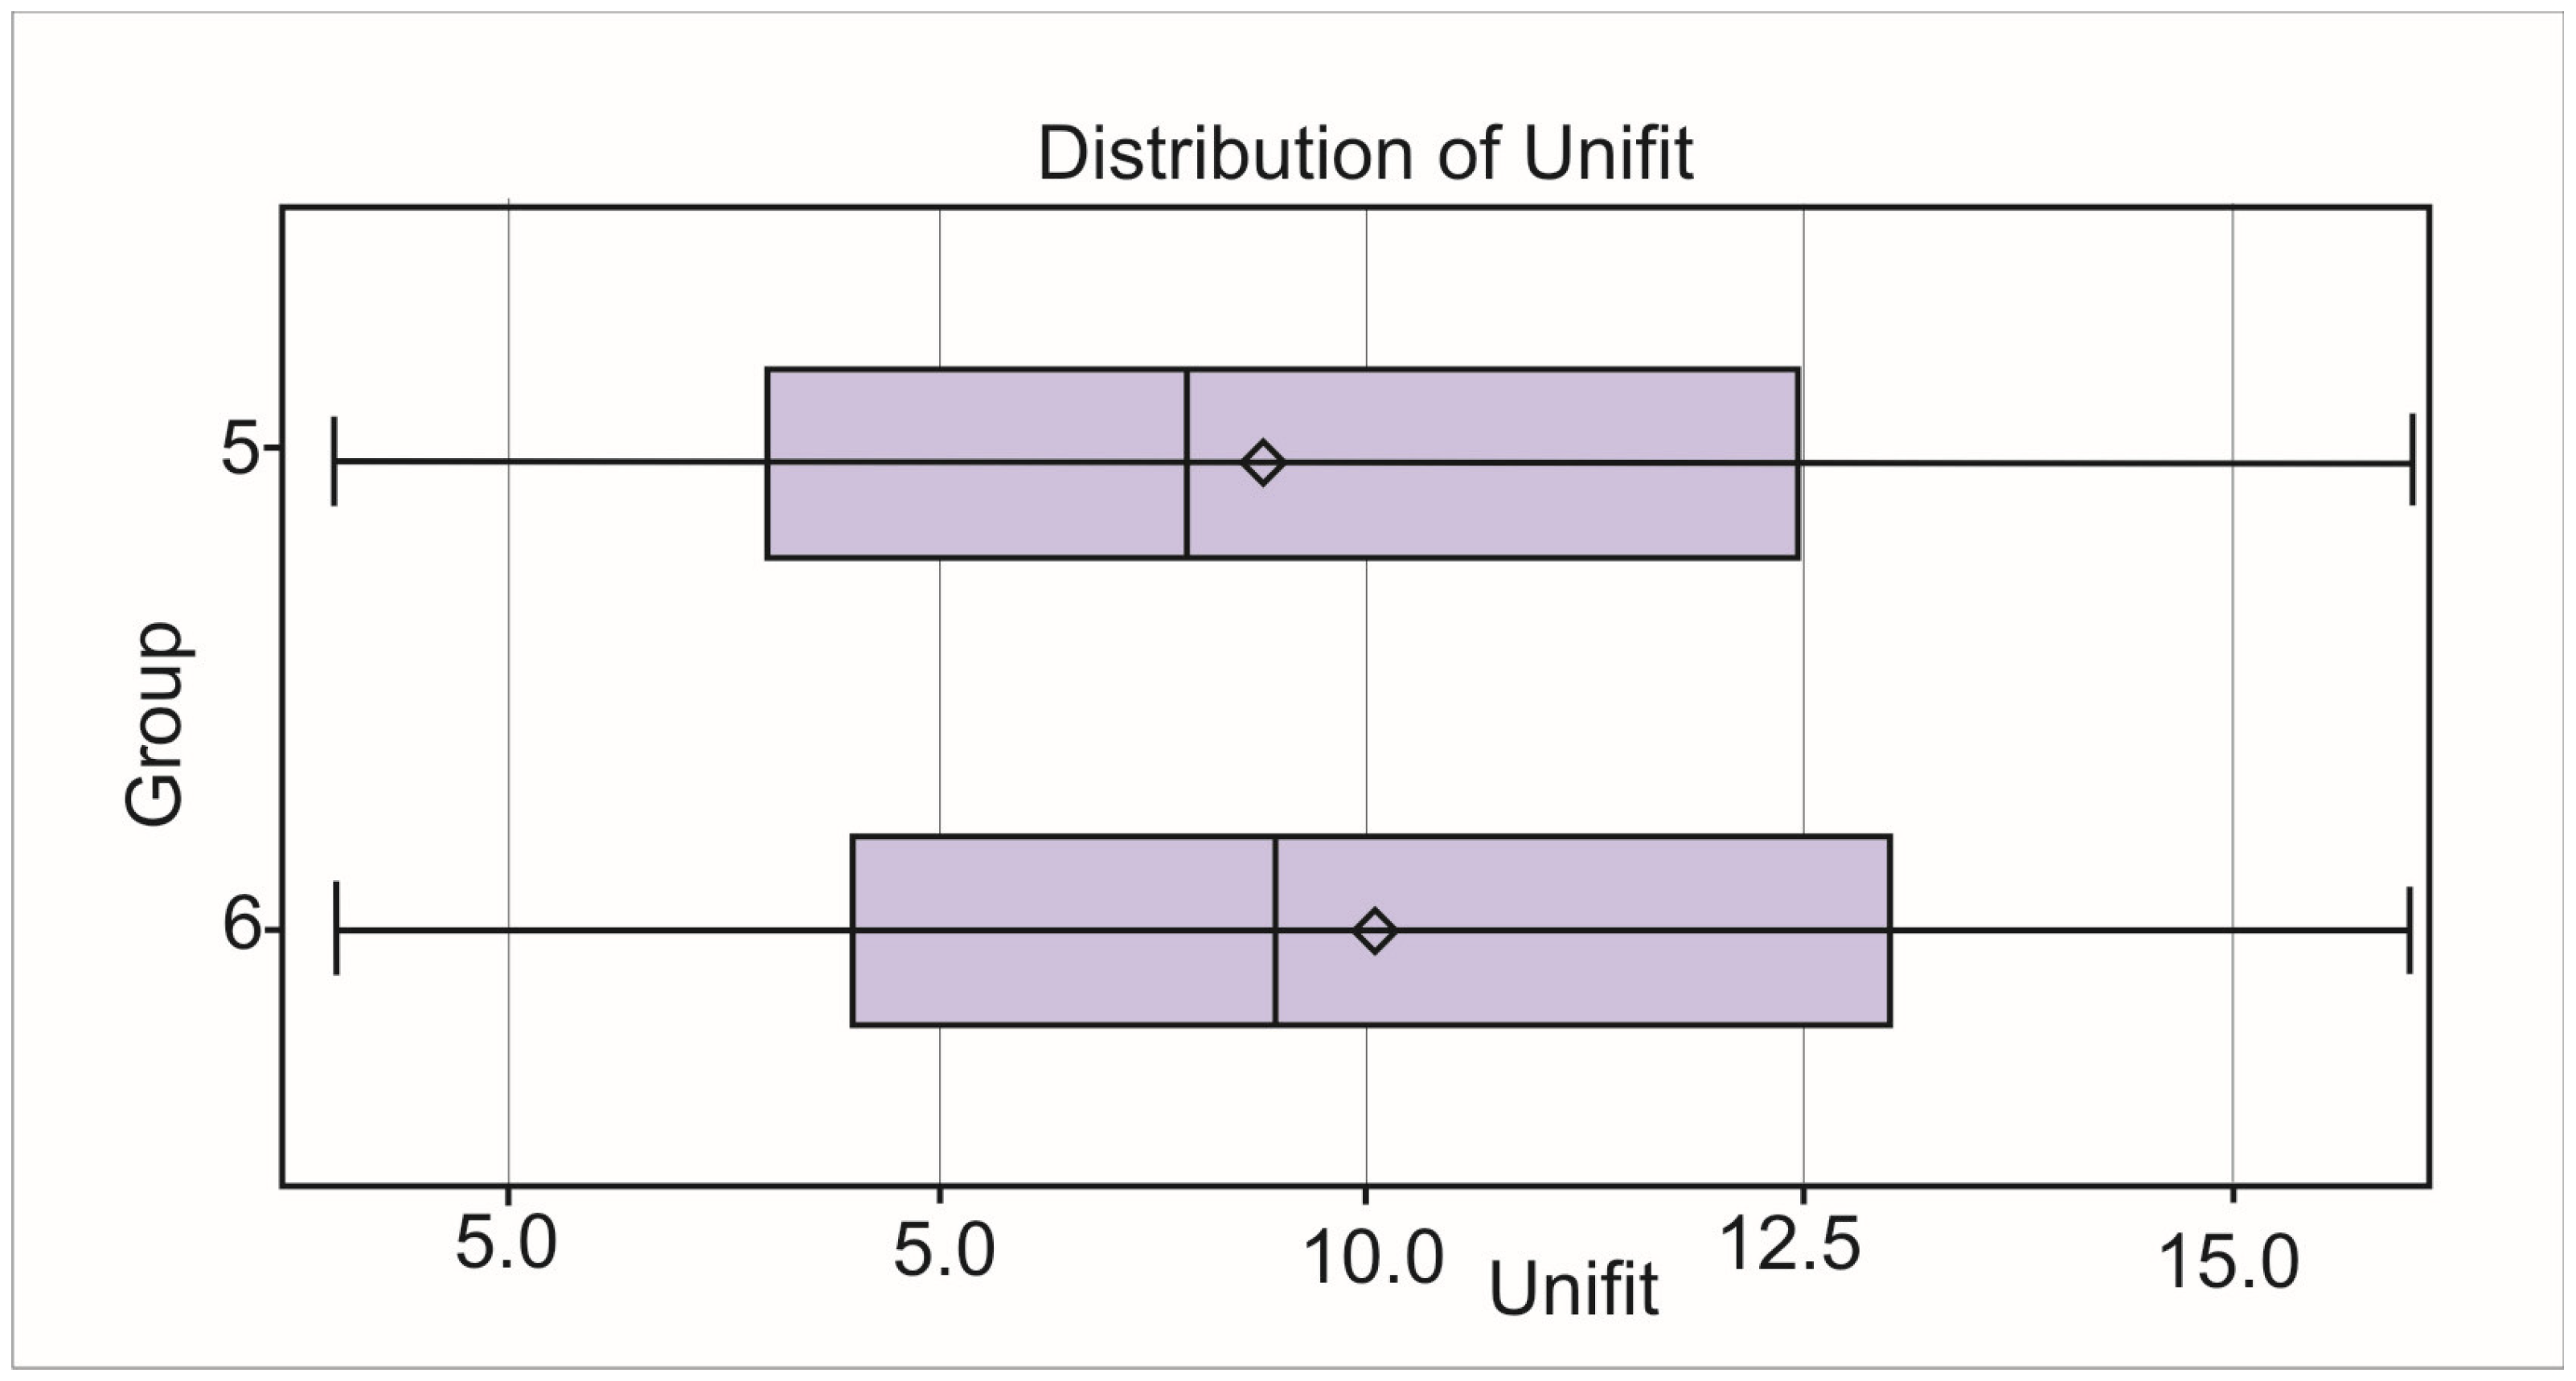
Only one man and one woman in Group 5, and one man and two women in Group 6, achieved significantly above-average performance. In both groups, several individuals showed significantly below-average performance: in Group 5, 5 to 6 individuals had below-average results, while in Group 6, this applied to 6 individuals. The graphical representation of performance in Groups 5 and 6 (Figure 4) shows lower average performance values (G5—9.43 points; G6—10.02 points) compared to the previously mentioned age groups.
Quantitative findings regarding the level of motor skills (measured using the Unifit Test) did not show statistical significance at the 5% level (p = 0.05) even between Group 5 and Group 6 (p = 0.41)

4.3. Physical Fitness Testing—Ruffier Functional Test

Physical fitness, measured using the Ruffier functional test, provided data on functional state of the cardiovascular system and the body’s readiness for physical exertion across different age groups. The resulting index indicates the fitness level of each participant—the lower the numerical value, the better the fitness.
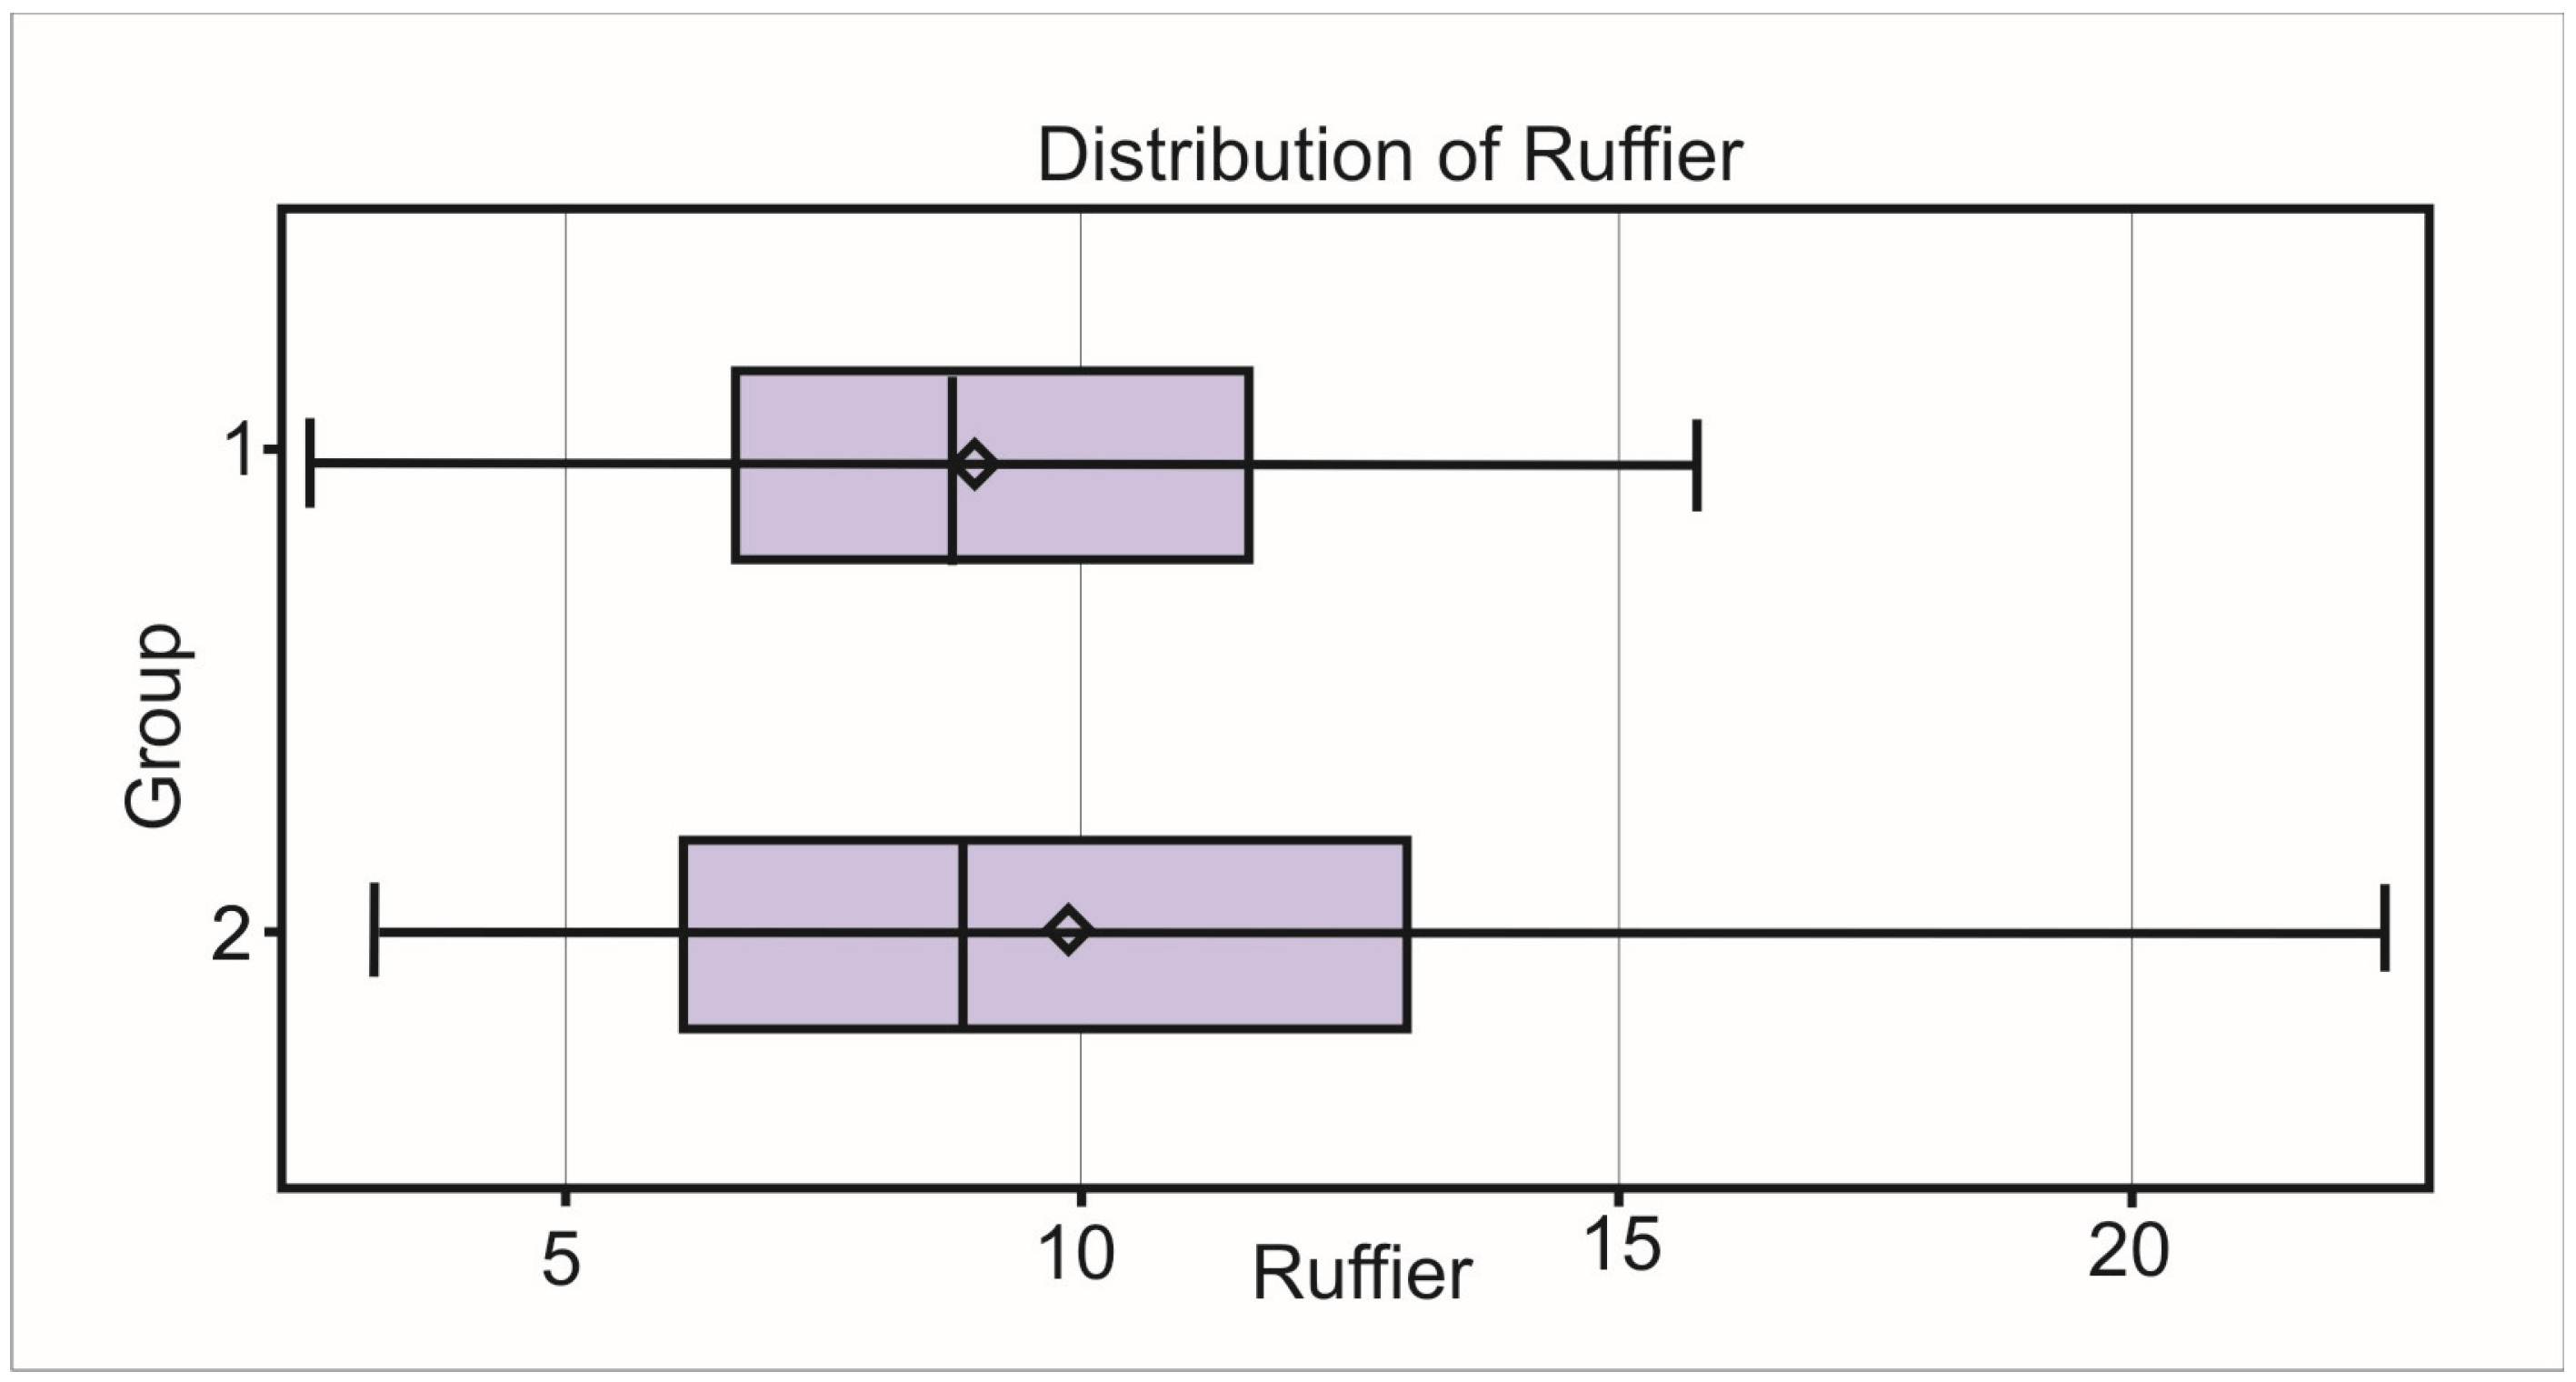
In Group 1, the average Ruffier index was 8.89, indicating average fitness. The average for men was 8.72 and for women 9.1. The maximum value (15.8) and minimum value (2.6) were both recorded in men (ages 12 and 10).
In Group 2, women had a higher average index value (10.9) compared to men (8.59). The best fitness (index 3.2) and the poorest fitness (index 15.8) were again observed in men (ages 15 and 17) (Figure 5).
The analysis results showed that no statistically significant difference was found between Group 1 and Group 2 in Ruffier functional test at the 5% significance level (p = 0.33). This indicates that differences in cardiovascular fitness between these two age groups are not statistically significant.
The graphical representation of the Ruffier functional test results in Figure 6 show that the average fitness index in Group 3 reached 10.23, which was 0.06 points higher than that in Group 4, where the average was 10.17. The maximum index value (19.6) was recorded in both groups. The minimum index value was lower in Group 3 (2.4) than in Group 4 (2.8), indicating slightly better individual results in Group 3.
When comparing the differences in the mean values of the Ruffier functional test index between Group 3 and Group 4, no statistically significant difference was found at the 5% significance level (p = 0.95). This result indicates a high degree of similarity in the functional state of the cardiovascular system between the two age groups.
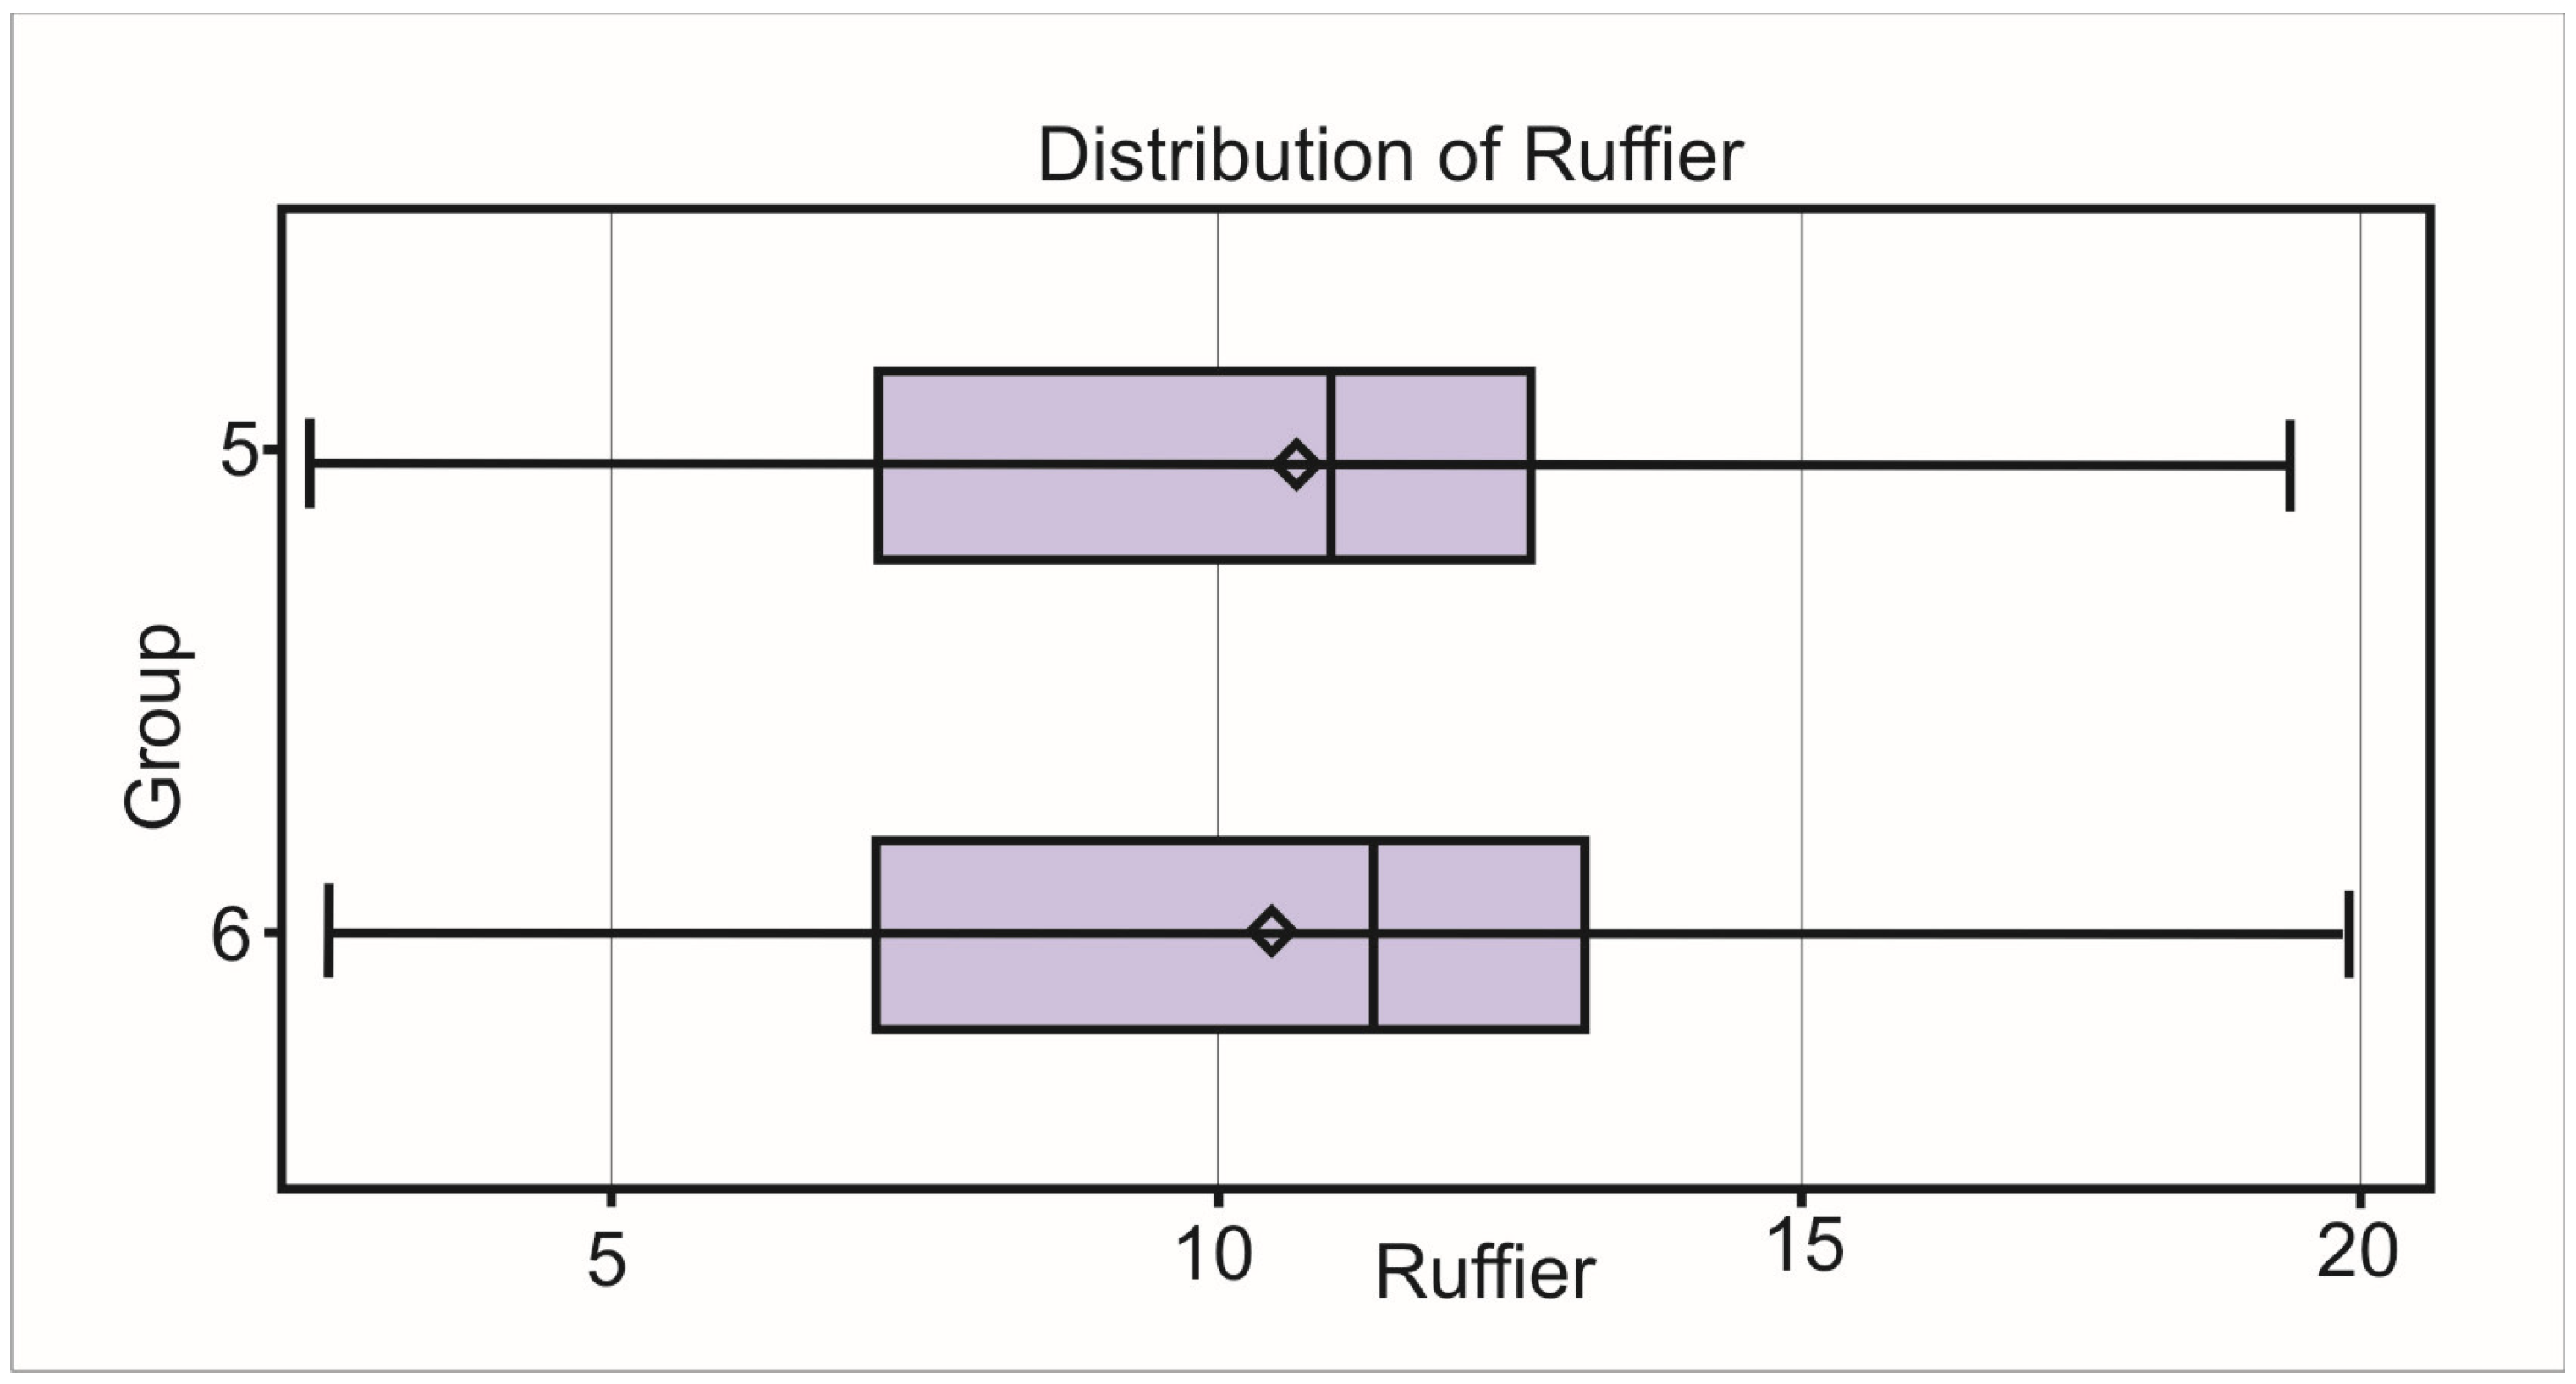
The best fitness (index 2.8) was recorded in Groups 5 and 6 in women aged 41 and 52 years. The average fitness index was 10.86 in Group 5 and 10.68 in Group 6, indicating a comparable level of physical readiness across both age categories. Very poor fitness was observed in 7 tested individuals in Group 5 and 6 individuals in Group 6. The lowest fitness, with an index of 20.2, was recorded in a 56-year-old woman (Figure 7).
For the Ruffier functional test index between Group 5 and 6, no statistically significant difference was observed at the 5% significance level (p = 0.84). This result suggests that the level of cardiovascular fitness in these age groups was statistically comparable.
Analysis of the research results showed to a high degree that age-similar groups exhibit comparable physical fitness outcomes. No statistically significant difference was found either in the motor skills test (Unifit Test) or in the physical fitness test (Ruffier functional test) between Groups 1 and 2, 3 and 4, and 5 and 6. These results confirm Hypothesis 1, which assumed that age-similar groups would achieve comparable results. Based on the above findings, we propose the following categorization of tourists according to physical fitness:
  • G1—good physical fitness.
  • G2—average physical fitness.
  • G3—poor physical fitness.

Verification of the Proposed Geotourist Categorization

H2: 
The time limit for completing the walk in the field will differ significantly between the newly formed groups of tourists.
During the route, no breaks were recorded in any case. We believe the tourist did not need to stop due to the length and elevation of the route, which was also confirmed during personal interviews at the end of the route, where some of them stated that they managed their need to drink while walking and did not need to stop
Data analysis showed differences between the newly formed groups. The average walking time in the field (18.64 min) for tested individuals in G1 (good physical fitness) was 1.89 min better than in G2 (average fitness) (Table 2). Differences in times between the groups were observed both in the lowest performances and in the best performances, where the difference between the best performances of G1 and G2 was 2.5 min.
Tested individuals in group G2 with average fitness (20.52 min) had a 1.71 min better time than G3 (poor fitness), whose average time was 22.23 min (Table 3). The performance difference between groups G2 and G3 was reflected in a 2 min longer time to complete the route, both in the best and worst performances within the groups.
Differentiation in the times achieved for field walking between groups created based on physical limits was confirmed as statistically significant (Table 2 and Table 3). Significant differences at the 5% significance level were found between the group with good fitness and the group with average fitness (p < 0.001); as well as between the group with average fitness and the group with poor fitness (p < 0.001).
In percentage terms, the differences in completion times were: 10% between the good and average fitness groups, 10% between the average and poor fitness groups, and 20% between the good and poor fitness groups.
These results support Hypothesis 2, which predicted a significant difference in time performance between physical fitness categories.
H3: 
The strongest correlation will be between physical fitness (measured using Ruffier functional test) and performance in field walking.
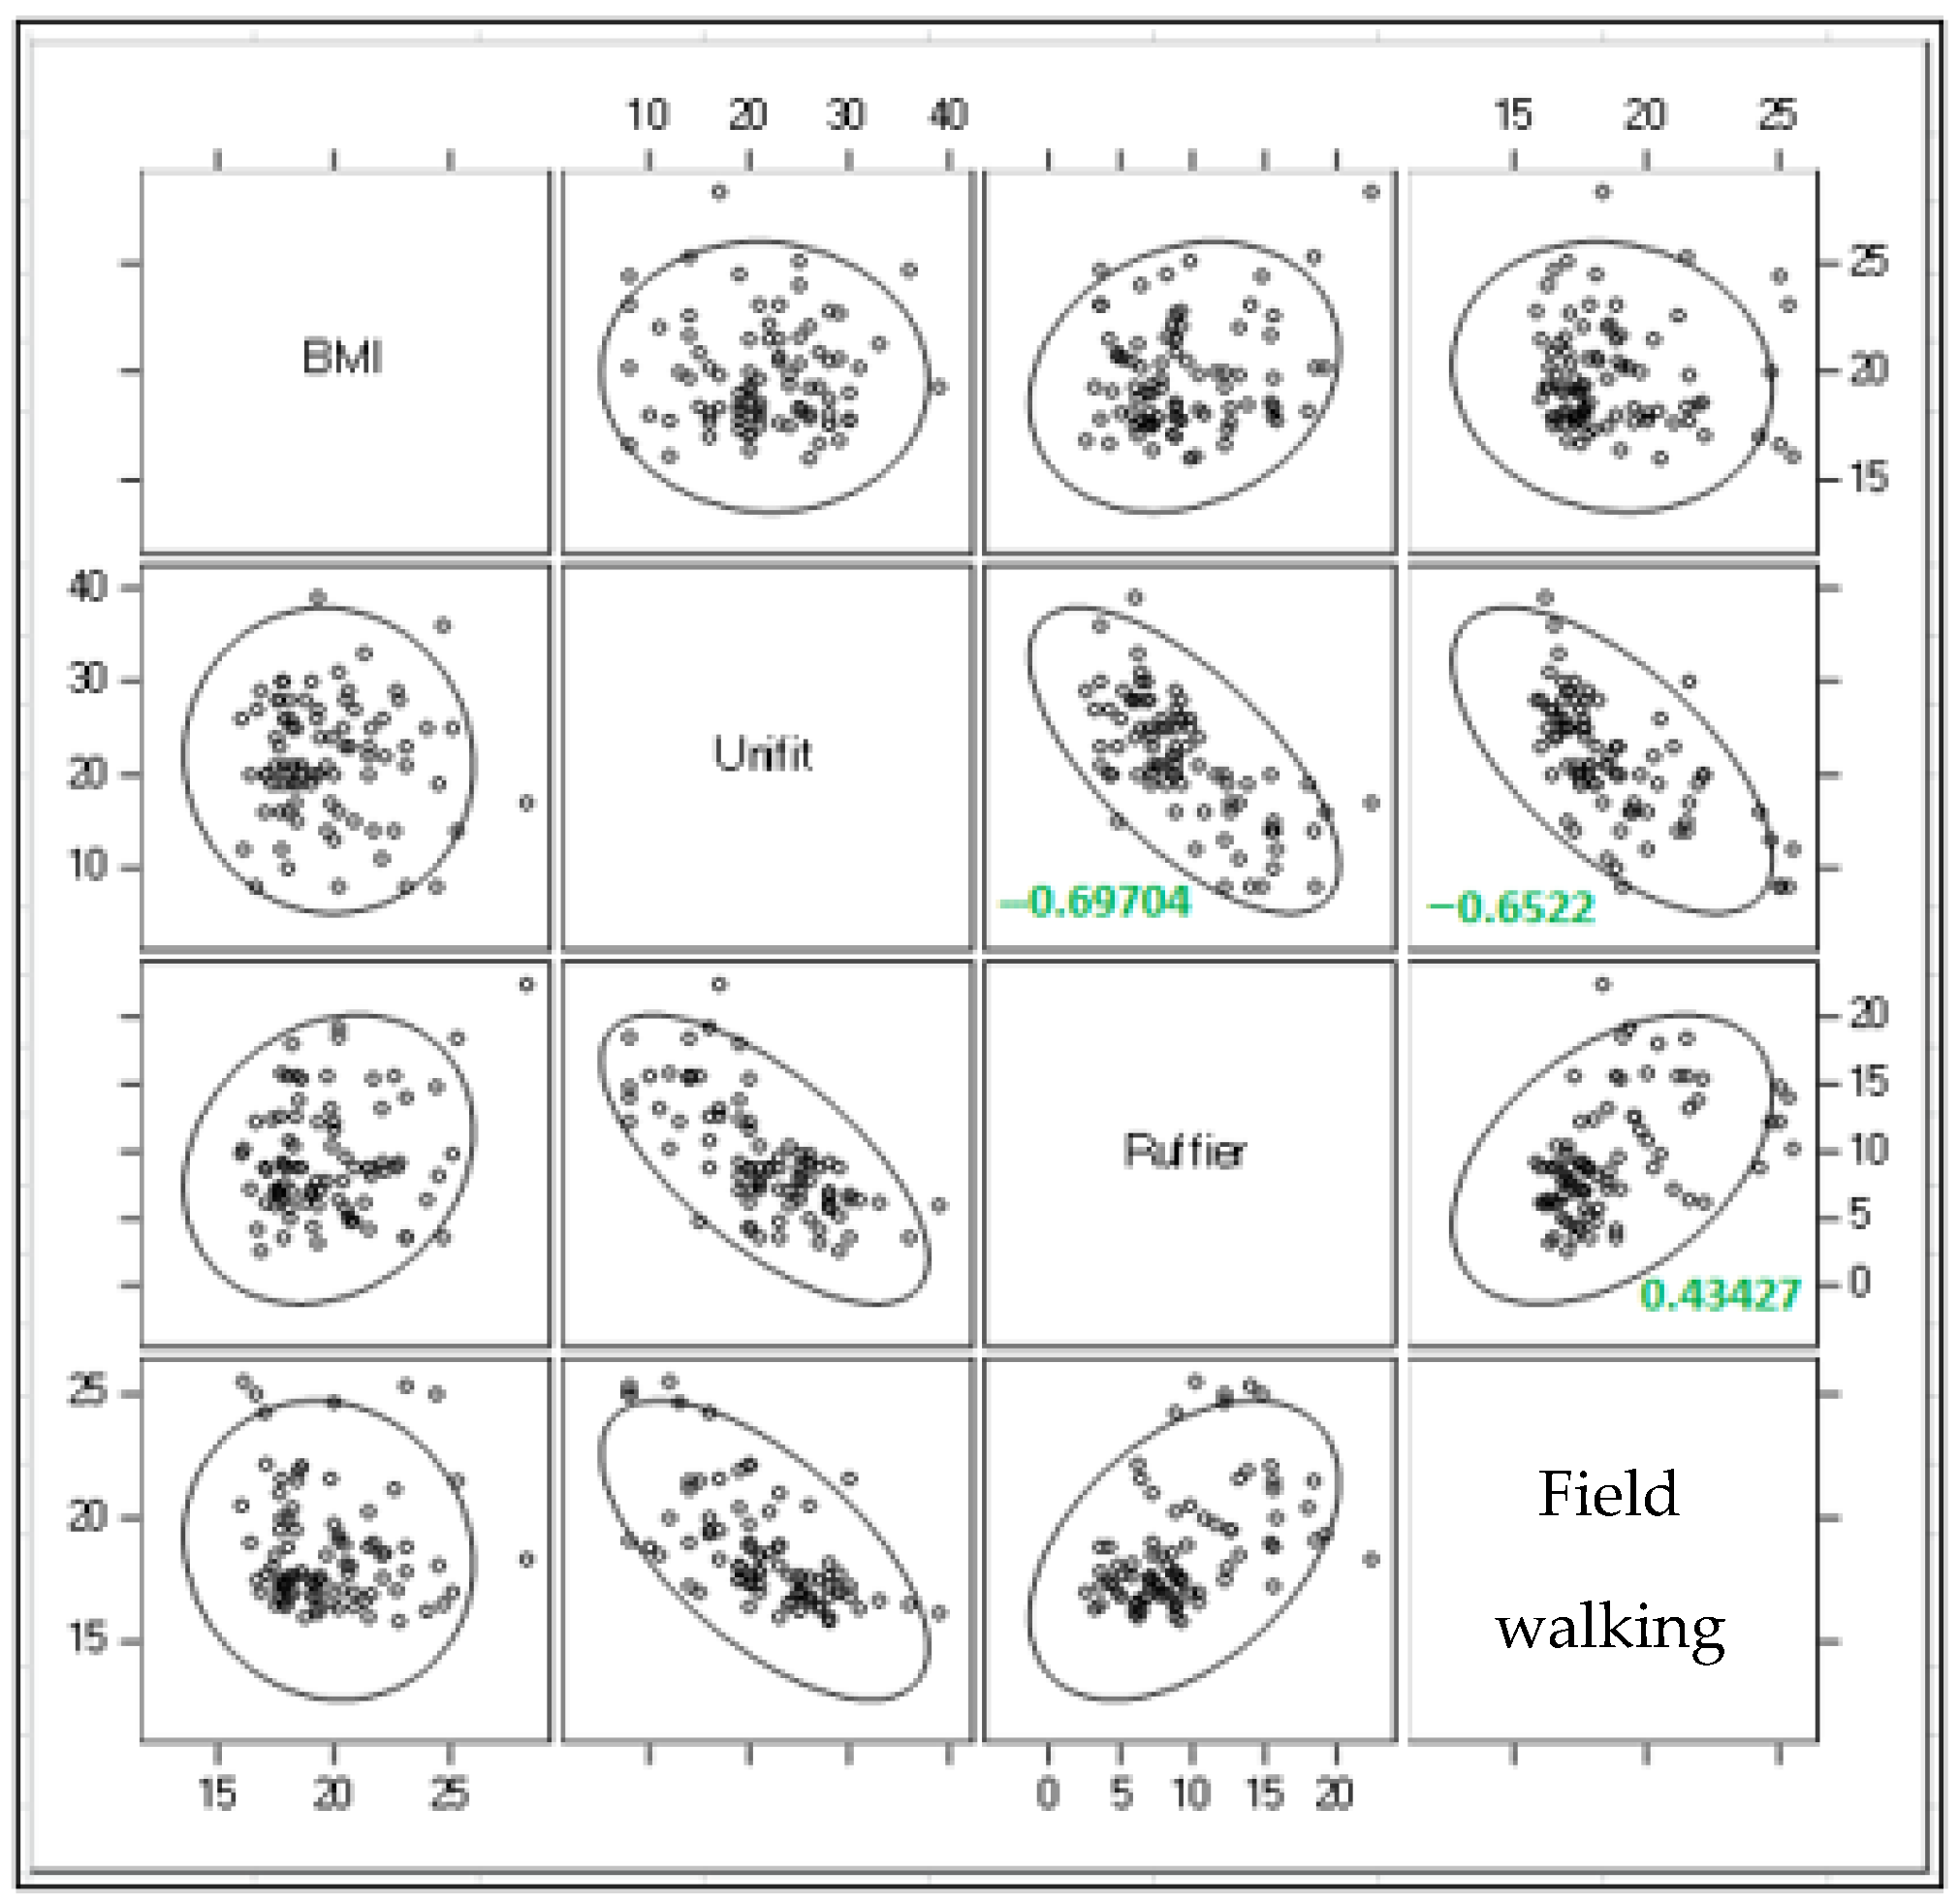
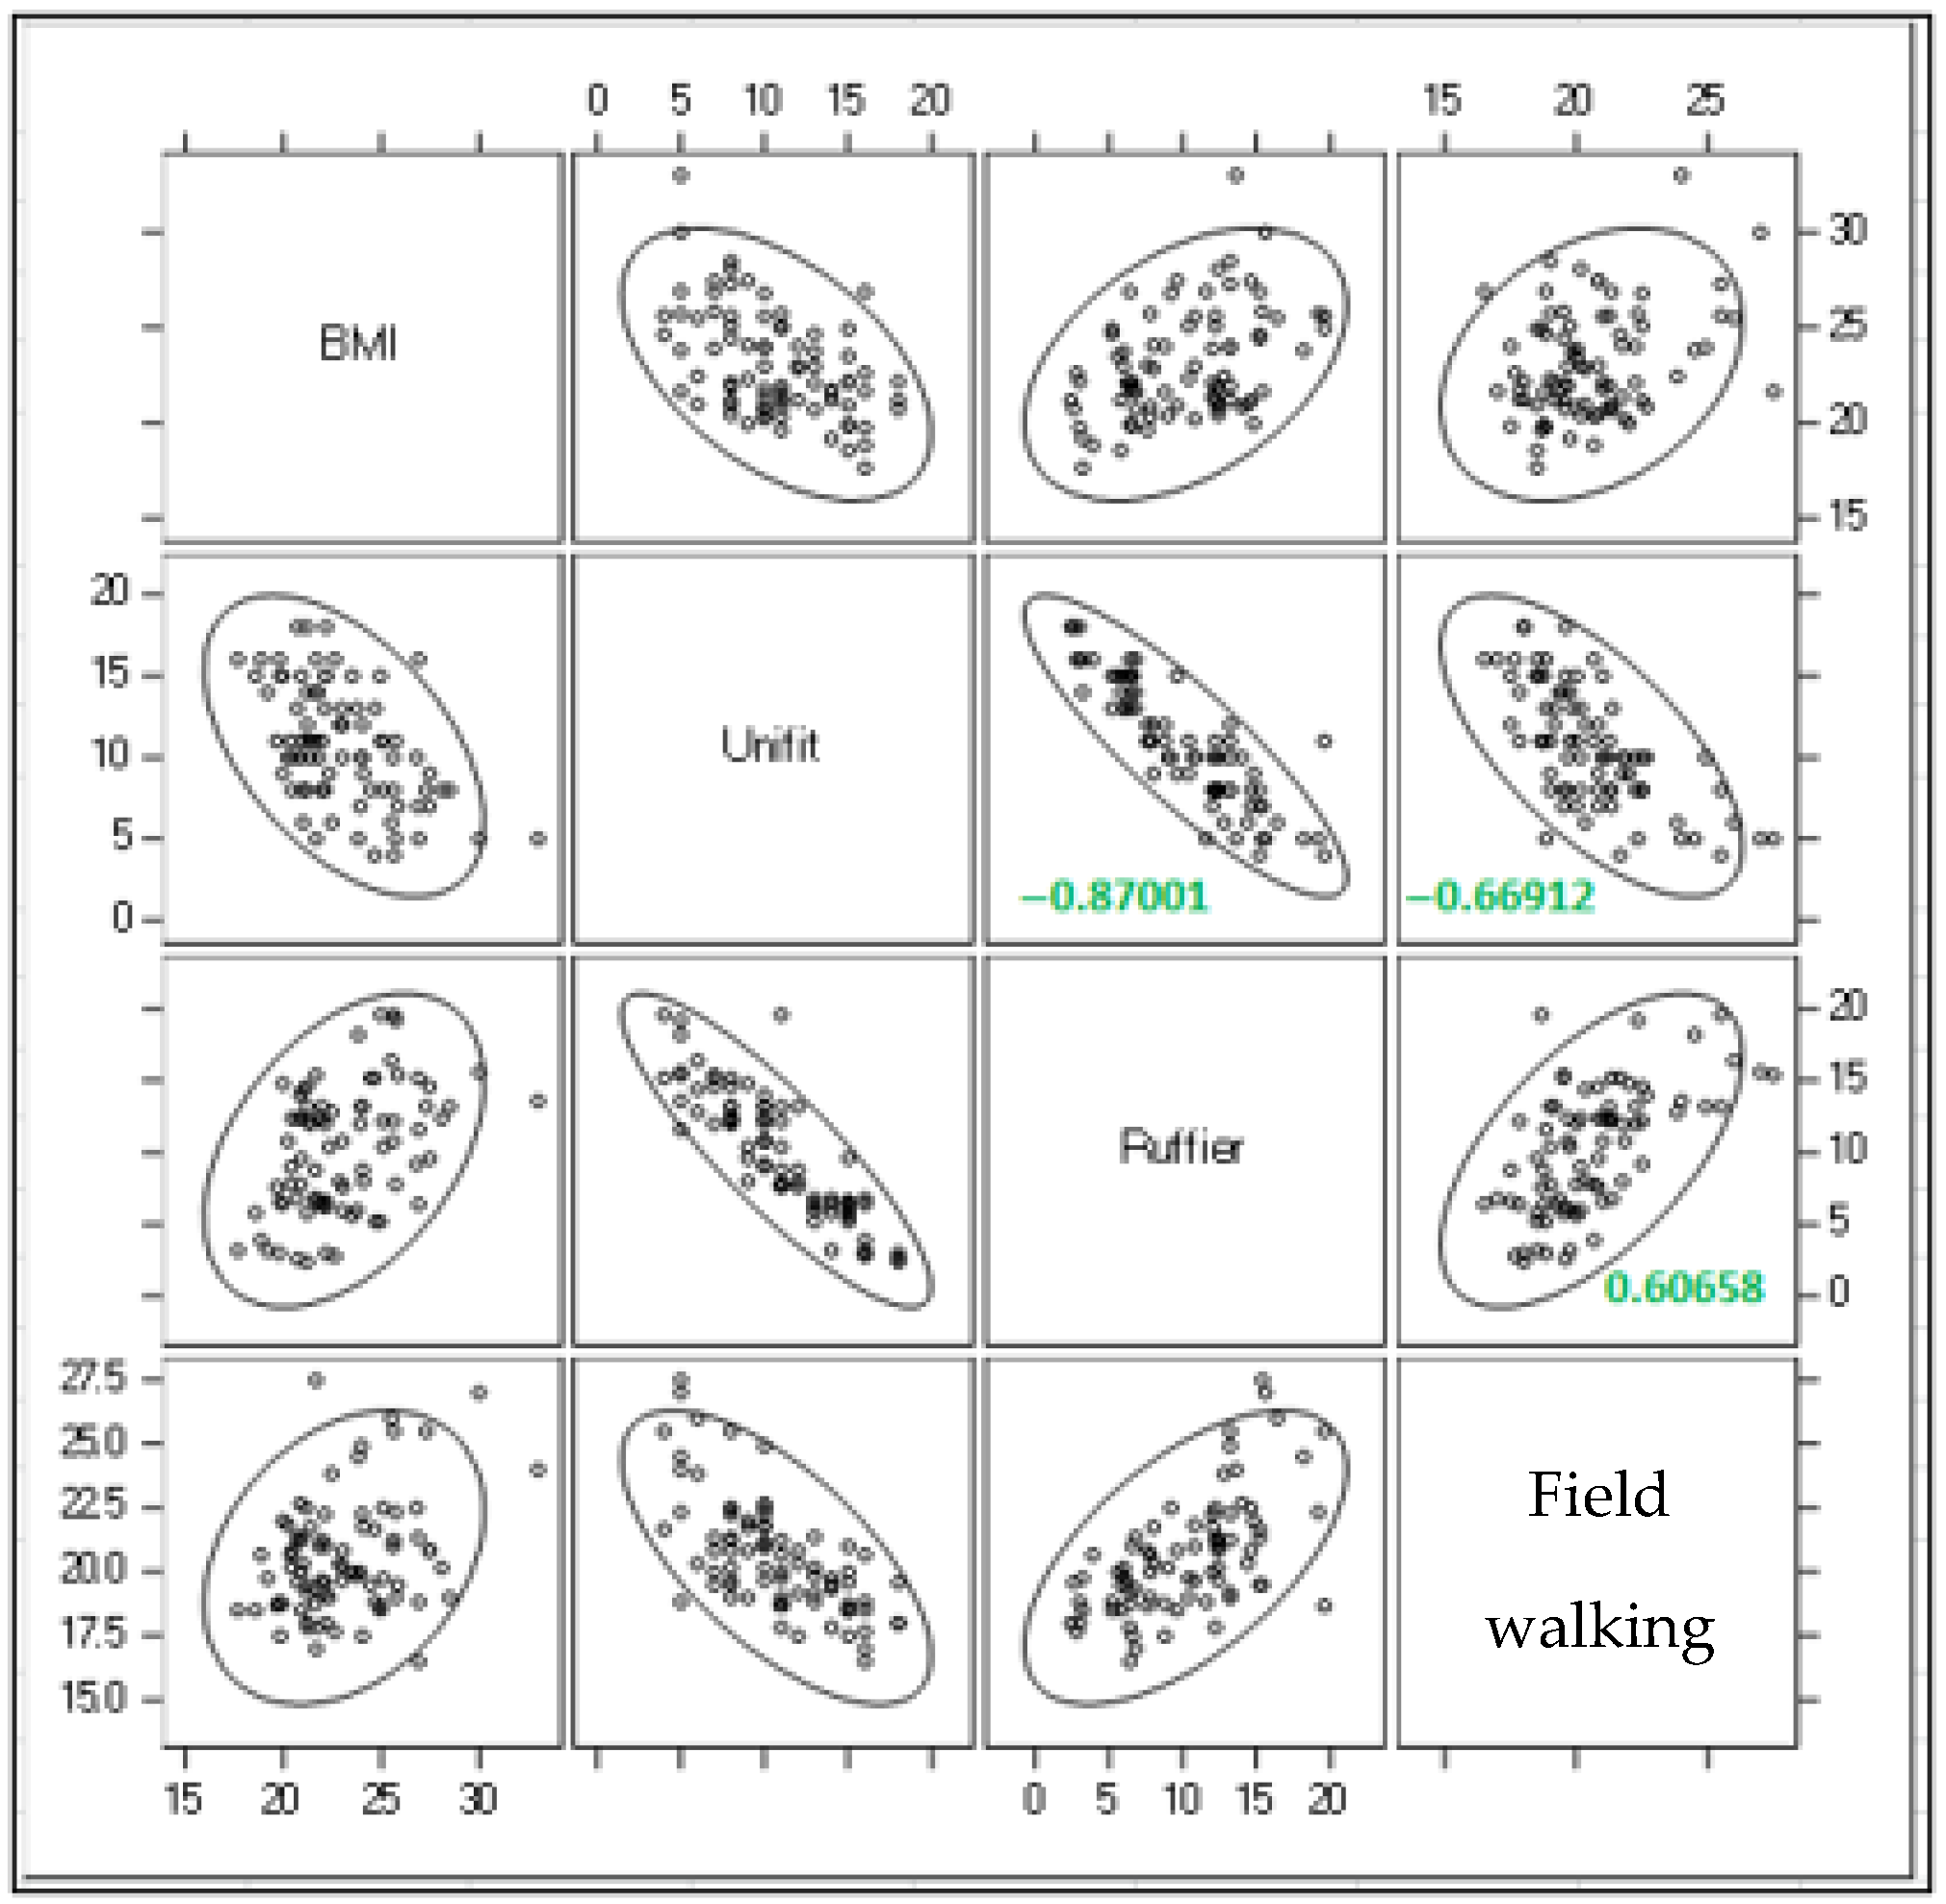
To assess the dependencies among selected internal factors influencing physical fitness (BMI, Unifit test results and Ruffier functional test results) and field walking performance, the Pearson correlation coefficient was used. Dependences between individual variable pairs were visualized using a matrix of scatterplots. Figure 8, Figure 9 and Figure 10 (scatterplot matrices with 95% confidence ellipses for groups G1, G2, and G3) show only those correlation coefficients that were statistically significant, i.e., indicating the existence of a significant relationship between a specific pair of variables. For the remaining pairs, no statistically significant dependence was found.
In all analysed groups, a statistically significant relationship was confirmed between the Unifit test results and field walking performance, as well as between Ruffier functional test results and field walking. These findings support the claim that physical fitness directly influences performance in geotourism activities.
Graphical analysis suggested that in group G1 (good physical fitness), the dependency between factors was lower in groups G2 (average) and G3 (poor physical fitness). For the field walking test, a positive correlation with Ruffier test results was observed at r = 0.43, indicating that a higher Ruffier index (poorer fitness) was associated with a longer time to complete the route. For the Unifit test, a negative correlation of r = −0.65 was found, indicating that a lower number of points in the Unifit test (i.e., lower level of motor abilities) was associated with a longer time required to complete the field walk (Figure 8).
The dependencies between individual factors of physical fitness were most pronounced in G2 (average physical fitness). As shown in Figure 9, with increasing values of the Ruffier functional test (i.e., worsening fitness), Unifit test results decreased, reflecting a decline in motor ability levels. This pattern of indicators represents overall lower physical fitness, which also manifests in longer times required to complete field walking.
In group G2, a higher correlation was observed between the Ruffier test and field walking performance (r = 0.60), which is significantly higher compared to group G1 (good physical fitness), where the dependency was at r = 0.17. This difference indicates a stronger influence of cardiovascular readiness on field performance in individuals with average fitness.
The dependencies between individual factors of physical fitness became more pronounced with increasing age, indicating that older individuals show greater differences in performance across the various tests. As illustrated in Figure 10, in group G3 (poor physical fitness), the strongest dependency was observed between BMI, the Unifit test, the Ruffier test, and field walking performance. In this group, with increasing age and higher body weight, motor performance declined, and the functional condition of the body worsened, which manifested in longer times required for field walking.
Analysis of the results revealed a negative correlation between the Ruffier test and the Unifit test in all groups. In groups G2 (average physical fitness) and G3 (poor physical fitness), the same correlation of r = −0.87 was observed (Figure 9 and Figure 10). This correlation indicates that lower fitness values in the Ruffier test are associated with lower levels of motor abilities in the Unifit test, resulting in poorer test performance and longer times required for field walking.
The dependencies between field walking and the Unifit test, as well as between field walking and the Ruffier test, are detailed in Table 4. The most significant influence on field walking performance was observed in the Unifit test, where negative correlation of −0.81 was found in group G3 (poor physical fitness). This correlation indicates that the worse the result in the Unifit test, the longer the participants needed to complete field walking.
When comparing the dependency between field walking and the Ruffier test, the highest correlation was observed in group G3 (poor physical fitness) with a value of 0.76, indicating that lower physical fitness (reflected by worse values in the Ruffier test) has a significant impact on performance in the field walking test.
The analysis of results showed a dependency in every observed group between the factor of physical fitness (Ruffier functional test) and field walking. This relationship was present in all groups, indicating that better fitness (according to the Ruffier test results) leads to better performance in the field walking test.
However, the strongest dependency was demonstrated between the Unifit test and field walking in all observed groups, suggesting that motor performance, measured by the Unifit test, had a stronger influence on field walking performance than physical fitness alone measured by the Ruffier test. This finding contradicts Hypothesis 3, which assumed that the strongest dependency would be between the Ruffier test and field walking.

5. Discussion

The evaluation of dependency analyses between internal factors—specifically body mass index (BMI), motor abilities (measured by the Unifit test), and physical fitness (measured by the Ruffier functional test)—highlights their critical role in the decision-making process when selecting appropriate hiking routes. Based on both the analytical results and the practical implementation of these tests, this study proposes the application of simple home—or self-assessment tools, such as the Ruffier functional test, as a practical method for tourists to evaluate their current fitness level. This test, which is effective for assessing cardiovascular readiness and can be administrated without specialized equipment, provides reliable data that directly relate to performance in hiking conditions. By incorporating such easily accessible testing, tourists are empowered to select hiking routes that correspond to their actual fitness capacities, thereby improving both safety and overall experience.
Developing geotourism offerings that explicitly consider tourists‘ physical capabilities represent a strategic approach to aligning recreational opportunities visitor satisfaction but also to safeguarding health and preventing potential risks. As Nekouie [76] emphasizes, trails characterized by asphalt or rocky surfaces with minimal elevation changes facilitate accessible and enjoyable nature experiences with limited physical strain. Furthermore, our findings align with prior research, emphasizing that moderately challenging routes with gentle inclines and minor geological features, which require occasional breaks and careful attention, are suitable for tourists with average fitness levels [77]. Conversely, more demanding hikes, such as mountain summits or trails that focus on detailed exploration of geological formations and natural phenomena, necessitate higher levels of physical fitness [78].
To optimize visitor satisfaction and safety, the suitability of a trail for specific tourist groups should be clearly communicated at the outset. This approach mitigates the risks associated with misjudging one’s physical capacity: overestimation may lead to fatigue, inability to complete the route, or the need for external assistance, while underestimation may result in premature termination of the hike and underutilized recreational potential.
Ultimately, a nuanced understanding of tourists’ physical capabilities and motivations is essential for effective destination planning, ensuring both positive visitor experience and sustainable development [79].
An inaccurate appraisal of one’s physical limits may also compromise the initial motivation of tourists undertaking a hiking excursion [80].
The integration of physical fitness assessments into geotourism frameworks offers clear benefits for both tourists and destinations. For tourists, access to trails adapted to their fitness level enhances decision-making, reduces the risk of injury, and promotes more comfortable and enjoyable hiking experiences [81,82]. By avoiding routes that exceed their physical capabilities, visitors are able to focus more fully on appreciating natural and geological features, thereby deepening engagement and satisfaction [9,10]. Moreover, personalized trail recommendations can serve as a motivational tool that encourages tourists to gradually improve their fitness in order to undertake more challenging routes, creating a positive feedback loop between physical preparedness and participation in outdoor activities [8,83].
For destinations, incorporating indicators of physical fitness into planning processes enables more precise alignment of trail design with the abilities of different visitor groups [5,84]. This supports targeted development and strategic resource allocation, ensuring that tourism infrastructure is both inclusive and efficient. Diversifying the offer to accommodate a wide spectrum of physical abilities also allows destinations to reach a broader audience, thereby increasing overall visitation while maintaining accessibility [4]. From a sustainability perspective, distributing tourists across trails of varying difficulty helps prevent the overuse of specific areas, reduces ecological pressure, and promotes more balanced environmental management [85,86].
The role of digital technologies in this process is particularly noteworthy. Traditional trail markings and conventional guidance systems often provide generalized estimates of hiking durations, failing to account for individual variability. By contrast, digital platforms that incorporate user-specific data enable the generation of highly personalized recommendations. Contemporary tools such as MOVE have already demonstrated considerable precision in this regard, as confirmed by recent validation studies emphasizing the importance of accurate, individualized time and effort estimations in mountain tourism safety management [87].
The integration of physical preparedness into geotourism design ultimately yields a dual benefit: it enhances both the inclusiveness and safety of visitors while simultaneously supporting the sustainable development of destinations. The segmentation of tourists according to fitness parameters creates opportunities to adapt existing geotourism infrastructure to the diverse needs of visitors [88]. This approach not only improves the experiential quality of visits but also lays the foundation for developing a structured network of geotourism trails, particularly within geoparks, where recreational activities can be effectively combined with educational and conservation objectives [89].
Nevertheless, the study has several limitations that should be considered. The sample was limited to specific age groups and regional participants, which may reduce the generalizability of the findings to broader or international populations. The field walking tests were conducted under controlled conditions that may not fully capture range of environmental challenges encountered on actual forest hiking trails. Additionally, self-selection bias may have been present, as participants volunteered for testing, potentially overrepresenting more motivated or physically capable individuals. Physical fitness is also subject to temporal variation, and single-point assessment may not reflect long-term trends or seasonal fluctuations.

6. Conclusions

The findings of this study indicate that age-homogeneous groups exhibited similar levels of physical fitness, confirming Hypothesis 1. This observation provided a basis for the creation and validation of a new categorization of tourists according to physical fitness under practical conditions. Hypothesis 2 was also supported, as statistically significant differences in time limits for terrain walking among the newly formed fitness-based groups clearly highlighted the varying physical capacities of different categories of tourists. When examining the relationship between internal factors of physical fitness—including BMI, motors skills, and overall physical fitness—and performance in terrain walking, the strongest correlation was observed between the Unifit test and terrain walking. However, Hypothesis 3, which predicted the strongest dependency between the Ruffier test and terrain performance, was not confirmed. These findings suggest that motor performance, as measured by the Unifit test, may have a stronger influence on hiking performance than overall physical fitness alone, as measured by the Ruffier test.
In practical terms, the study supports the use of simple home-based fitness assessments, such as the Ruffier functional test, which can serve as a useful decision-making tool for tourists in selecting trails appropriate to their current physical condition. The study also proposes a segmentation of tourists based on physical fitness levels-good, average, and weak—which allows for the adaptation of geotourism offerings to account for the physical limits of different target groups, thereby enhancing inclusivity and safety.
Future research should aim to expand the sample, include longitudinal assessments, and integrate additional performance and behavioural indicators to strengthen the applicability of the findings across diverse geotourism contexts.
The study provides tourists with a simple, home-based tool for assessing their own physical fitness, which they can use before selecting a hiking route. The Ruffier functional test is particularly suitable for this purpose, serving as a useful decision-making tool that helps tourists choose trails and routes appropriate to their current physical condition. Such testing and route selection increase both safety and enjoyment during hiking, as individuals with lower fitness levels are less likely to attempt overly demanding routes.
Although the Ruffier test is considered a practical tool for home use, motor fitness measured by the UNIFIT test has a stronger influence on actual field performance. This implies that, for accurate assessment of performance on hiking trails, a more comprehensive evaluation of motor abilities should be considered, particularly in professional or research contexts.
For tourism service providers, the study offers a framework for adapting and targeting their offerings through the segmentation of tourists based on physical fitness levels into three categories: good, average, and lower fitness. This segmentation enables organizations to tailor their geotourism products to the physical capabilities and limitations of specific target groups.

Author Contributions

Conceptualization, J.H. and M.M.; methodology, J.H. and M.M.; formal analysis, M.M. and D.T.; investigation, J.H.; resources, J.H.; data curation, M.M.; writing—original draft preparation, J.H.; writing—review and editing, D.T.; visualization, D.T.; supervision, M.M. All authors have read and agreed to the published version of the manuscript.

Funding

This research received no external funding.

Institutional Review Board Statement

This study was carried out following the Ethical Code for Research Involving Human Participants and was approved by the Ethics Committee of the Technical University of Košice. All individuals were thoroughly informed about the purpose, methodology, and possible risks of participation and provided their written informed consent prior to inclu-sion. The research involved only non-invasive procedures (Ruffier Functional Test, UNIFIT test, and Motor Skills Testing) and complied with the principles of the Declaration of Helsinki. All data were collected and analyzed anonymously, and the research did not pose any risk to participants’ health or safety.

Informed Consent Statement

Informed consent was obtained from all subjects involved in the study.

Data Availability Statement

Data are available from the corresponding author upon reasonable request.

Conflicts of Interest

The authors declare no conflicts of interest.

References

  1. Market Data Forecast. Available online: https://www.marketdataforecast.com/market-reports/geotourism-market (accessed on 15 July 2025).
  2. Boley, B.B.; Nickerson, N.P.; Bosak, K. Measuring geotourism: Developing and testing the geotraveler tendency scale (GTS). J. Travel Res. 2011, 50, 567–578. [Google Scholar] [CrossRef]
  3. Kotlíková, H. Nové Trendy v Nabídce Cestovního Ruchu, 1st ed.; Grada: Praha, Czech Republic, 2013; p. 208. [Google Scholar]
  4. Matlovičová, K.; Klamár, R.; Mika, M. Turistika a Jej Formy; Grafotlač Prešov, Prešovská Univerzita: Prešov, Slovakia, 2015. [Google Scholar]
  5. Dowling, R.K. Global Geotourism—An Emerging Form of Sustainable. Tour. Czech J. Tour. 2013, 2, 59–79. [Google Scholar] [CrossRef]
  6. Kerekeš, J. Vidiecky Turizmus a Agroturizmus v Regiónoch Turizmu; 1000 kníh: Bratislava, Slovakia, 2019; p. 243. [Google Scholar]
  7. Gibson, H. Leisure and later life: Past, present and future. Leis. Stud. 2004, 23, 203–218. [Google Scholar] [CrossRef]
  8. Šambronská, K.; Matušíková, D.; Šenková, A.; Kormaníková, E. Geoturism and its sustainable products in destination management. Geoj. Tour. Geosites 2023, 46, 262–270. [Google Scholar] [CrossRef]
  9. Bussard, J.; Reynard, E. Geotourism and interpretation of geomorphology in mountain tourism: The case of UNESCO Swiss Alps Jungfrau-Aletsch. J. Alp. Res. 2022, 110, 1. [Google Scholar] [CrossRef]
  10. Ólafsdóttir, R.; Tverijonaite, E. Geotourism: A systematic literature review. Geosciences 2018, 8, 234. [Google Scholar] [CrossRef]
  11. Kubalíková, L. Assessing geotourism resources in forested landscapes: A case study from the Czech Republic. Resources 2019, 8, 150. [Google Scholar] [CrossRef]
  12. Rodrigues, J.; Oliveira, R.; Brilha, J. Geodiversity and forest ecosystems: Interactions for sustainable geotourism. Environ. Earth Sci. 2022, 81, 76. [Google Scholar]
  13. Li, Q. Forest bathing: Nature therapy for health and well-being. Environ. Health Prev. Med. 2022, 27, 17. [Google Scholar] [CrossRef]
  14. Mao, P.; Wang, S.; Li, W. Forest-based tourism and visitor well-being: Integrating ecosystem services and experiential benefits. Sustainability 2023, 15, 3479. [Google Scholar]
  15. Bamwesigye, D.; Fialova, J.; Kupec, P.; Yeboah, E.; Łukaszkiewicz, J.; Fortuna-Antoszkiewicz, B.; Botwina, J. Urban Forest Recreation and Its Possible Role throughout the COVID-19 Pandemic. Forests 2023, 14, 1254. [Google Scholar] [CrossRef]
  16. Poehler, P.; Bachinger, M. Recreation in Forests: Implications from the COVID-19 Pandemic. In Sustainable Tourism: Frameworks, Practices, and Innovative Solutions; Springer International Publishing: Cham, Switzerland, 2024; pp. 79–104. [Google Scholar]
  17. Farkic, J.; Isailovic, G.; Taylor, S. Forest bathing as a mindful tourism practice. Ann. Tour. Res. Empir. Insights 2021, 2, 100028. [Google Scholar] [CrossRef]
  18. Paletto, A.; Notaro, S.; Sergiacomi, C.; Di Mascio, F. The Economic Value of Forest Bathing: An Example Case of the Italian Alps. Forests 2024, 15, 543. [Google Scholar] [CrossRef]
  19. Peng, J.; Li, J.; Peng, L.; Zhang, Y. Forest Ecosystem Conservation Through Rural Tourism and Ecosystem Services: A Systematic Review. Forests 2025, 16, 1559. [Google Scholar] [CrossRef]
  20. Yue, W.; Lin, L.; Xiaotong, Z. Influence of El Niño events on sea surface salinity over the central equatorial Indian Ocean. Environ. Res. 2020, 182, 109097. [Google Scholar] [CrossRef] [PubMed]
  21. Mayer, K.; Lukács, A. Motivation and mental well-being of long-distance hikers: A quantitative and qualitative approach. Heliyon 2021, 7, e06960. [Google Scholar] [CrossRef]
  22. Hall, C.M.; Page, S.J. The Geography of Tourism and Recreation: Environment, Place and Space, 4th ed.; Routledge: London, UK, 2014. [Google Scholar]
  23. Cooper, C.; Fletcher, J.; Fyall, A.; Gilbert, D.; Wanhill, S. Tourism: Principles and Practice, 4th ed.; Pearson Education: Harlow, UK, 2008. [Google Scholar]
  24. Ng, S.-L.; Hsu, M.-C. Motivation-Based Segmentation of Hiking Tourists in Taiwan. Tour. Hosp. 2024, 5, 1065–1082. [Google Scholar] [CrossRef]
  25. Carvache-Franco, M.; Carvache-Franco, W.; Víquez-Paniagua, A.G.; Carvache-Franco, O.; Pérez-Orozco, A. The role of motivationsin the segmentation of ecotourism destinations: A study from Costa Rica. Sustainability 2021, 13, 9818. [Google Scholar] [CrossRef]
  26. Rowley, T.W.; Cho, C.H.; Swartz, A.M.; Cho, Y.; Strath, S.J. Validation of walking and stepping tests to predict maximal oxygen uptake. PLoS ONE 2022, 17, e0264110. [Google Scholar] [CrossRef]
  27. Pires, I.M.; Marques, G.; Garcia, N. Development of technologies for monitoring the six-minute walk test: A systematic review. Sensors 2022, 22, 581. [Google Scholar] [CrossRef]
  28. Bautmans, I.; Lambert, M.; Mets, T.; De Bruin, E.D. The six-minute walk test in community dwelling elderly: Influence of motivation and learning effect. J. Rehabil. Med. 2004, 36, 85–88. [Google Scholar]
  29. Umiastowska, D.; Kupczyk, T. Application of the Ruffier test in field assessment of physical fitness among physically active adults. J. Phys. Educ. Sport 2021, 21, 314–321. [Google Scholar]
  30. Nowak, M.; Mańka, A.; Król, H. The Ruffier test as an indicator of cardiovascular efficiency in youth physical education. Polish J. Sport Tour. 2019, 26, 28–33. [Google Scholar]
  31. Drid, P.; Figlioli, F.; Tabben, M.; Krstulović, S.; Erčulj, F. Relationship between the Ruffier test and aerobic fitness indicators in athletes: A field-based validation study. Int. J. Environ. Res. Public Health 2022, 19, 8709. [Google Scholar]
  32. Marques, A.; Gaspar de Matos, M.; Carreiro da Costa, F. Physical fitness and health indicators in adolescents: Field-based testing validity. Eur. J. Public Health 2020, 30, 525–531. [Google Scholar]
  33. Weiglein, L.; Herrick, J.; Kirk, S.; Kirk, E. The 1-mile walk test is a valid predictor of VO2max and is reliable in healthy adults. Mil. Med. 2011, 176, 669–673. [Google Scholar] [CrossRef] [PubMed]
  34. Sallis, J.F.; Bull, F.; Guthold, R.; Heath, G.W.; Kelly, P. Progress in physical activity research and surveillance: Implications for fitness testing in schools and communities. Lancet Glob. Health 2021, 9, e1263–e1274. [Google Scholar]
  35. Kudlacek, M.; Frömel, K.; Svozil, Z. Monitoring physical fitness in adolescents: The UNIFIT test battery. Acta Gymnica 2016, 46, 59–68. [Google Scholar]
  36. Nagy, E.; Vincze, F.; Csányi, T. Validity and reliability of UNIFIT test battery in assessing youth physical fitness. J. Hum. Kinet. 2022, 82, 65–76. [Google Scholar]
  37. Lunt, H.; Roake, J.; Sainsbury, R. Validation of the one-mile walk test for VO2max prediction in a military cohort. Mil. Med. 2013, 178, 753–759. [Google Scholar] [CrossRef]
  38. Mekritthikrai, N.; Phattharasupakun, N.; Intharawichian, N. Concurrent validity of a new mobile application for the six-minute walk test. Heliyon 2023, 9, e17251. [Google Scholar] [CrossRef]
  39. Čuka, P. Základy Teórie, Metodológie a Regionalizácie Cestovného Ruchu, 1st ed.; Vydavateľstvo Prešovskej Univerzity v Prešove: Prešov, Slovakia, 2011. [Google Scholar]
  40. WHO. Global Recommendations on Physical Activity for Health. World Health Organization: Geneva, Switzerland, 2010. Available online: https://www.who.int/publications/i/item/9789241599979 (accessed on 15 July 2025).
  41. Palátková, M. Marketing Destinace Cestovního Ruchu; Grada Publishing: Praha, Czech Republic, 2006. [Google Scholar]
  42. Horner, S.; Swarbrooke, J. Consumer Behaviour in Tourism, 2nd ed.; Butterworth-Heinemann: Oxford, UK, 2007. [Google Scholar]
  43. Seaton, A.V.; Bennett, M.M. The Marketing of Tourism Products: Concepts, Issues and Cases, 1st ed.; International Thomson Business Press: London, UK, 1996. [Google Scholar]
  44. Seaton, A.V.; Bennett, M.M. The Marketing of Tourism Products: Concepts, Issues and Cases, 3rd ed.; Thomson Learning: London, UK, 2004. [Google Scholar]
  45. Stynes, D.J. Marketing Tourism. J. Phys. Educ. Recreat. Danc. 1983, 54, 43–46. [Google Scholar] [CrossRef]
  46. Cohen, E. A phenomenology of tourist experiences. Sociology 1979, 13, 179–201. [Google Scholar] [CrossRef]
  47. Long, L. Culinary Tourism; University Press of Kentucky: Lexington, KY, USA, 2003. [Google Scholar]
  48. Gonzales, A.M.; Bello, L. The construct „lifestyle” in market segmentation: The behavior of tourist consumers. Eur. J. Mark. 2002, 36, 51–56. [Google Scholar] [CrossRef]
  49. Ryglová, K. Cestovní Ruch. Soubor Studijních Materiálů, 3rd ed.; Key Publishing: Ostrava, Czech Republic, 2009. [Google Scholar]
  50. Kiráľová, A. Marketing Destinace Cestovního Ruchu, 1st ed.; Ekopress: Praha, Cyech Republic, 2003. [Google Scholar]
  51. Frain, J. Introduction to Marketing, 4th ed.; EMEA: London, UK, 1999. [Google Scholar]
  52. Goeldner, C.H.; Brent, R. Tourism: Principles, Practices, Philosophies, 11th ed.; Wiley: Toronto, ON, Canada, 2009. [Google Scholar]
  53. Hose, T.A. Towards a history of geotourism: Definitions, antecedents and the future. In The History of Geoconservation; Burek, C.V., Prosser, C., Eds.; Geological Society of London: London, UK, 2008; pp. 37–60. [Google Scholar]
  54. Grant, C. Towards a typology of visitors to geosites. In Proceedings of the Second Global Geotourism Conference, Making Unique Landforms Understandable, Mulu, Sarawak, Malaysia, 17–20 April 2010. [Google Scholar]
  55. Molokáč, M.; Alexandrová, G.; Kobylanska, M.; Hlavňová, B.; Hronček, P.; Tometzová, D. Virtual Mine-educational model for Wider Society. In Proceedings of the ICETA 2017, 15th International Conference on Emerging eLearning Technologies and Applications, Stará Lesná, Slovakia, 21–22 November 2019. [Google Scholar]
  56. Tavallaee, S.; Asadi, A.; Abya, H.; Ebrahimi, M. Tourism planning: An integrated and sustainable development approach. Manag. Sci. Lett. 2014, 4, 2495–2502. [Google Scholar] [CrossRef]
  57. Farsani, N.T. Sustainable Tourism in Geoparks through Geotourism and Networking. Available from ProQuest Dissertations & Theses Global. 2012. Available online: https://core.ac.uk/download/pdf/15570619.pdf (accessed on 15 July 2025).
  58. Frey, M.L. Geotourism—Examining Tools for Sustainable Development. Geosciences 2021, 11, 30. [Google Scholar] [CrossRef]
  59. Štrba, Ľ.; Kolačkovská, J.; Kudelas, D.; Kršák, B.; Sidor, C. Geoheritage and Geotourism Contribution to Tourism Development in Protected Areas of Slovakia—Theoretical Considerations. Sustainability 2020, 12, 2979. [Google Scholar] [CrossRef]
  60. Wolf, I.; Hagenloh, G.; Croft, D. Visitor monitoring along roads and hiking trails: How to determine usage levels in tourist sites. Tour. Manag. 2012, 33, 16–28. [Google Scholar] [CrossRef]
  61. Mitten, D.; Overholt, J.R.; Haynes, F.I.; D’Amore, C.C.; Ady, J.C. Hiking: A Low-Cost, Accessible Intervention to Promote Health Benefits. Am. J. Lifestyle Med. 2016, 12, 302–310. [Google Scholar] [CrossRef]
  62. Bouchard, C.; Blair, S.N.; Haskell, W.L. Physical Activity and Health: An Evidence-Based Approach to Practice, 2nd ed.; Human Kinetics: Champaign, IL, USA, 2012. [Google Scholar]
  63. Frömel, K.; Kudláček, M.; Groffik, D. Tourism and Physical Activity Preferences: Development and Sustainability Strategy. Sustainability 2020, 12, 8824. [Google Scholar] [CrossRef]
  64. Verbos, R.; Altschuler, B.; Brownlee, M. Weather Studies in Outdoor Recreation and Nature-Based Tourism: A Research Synthesis and Gap Analysis. Leis. Sci. 2017, 40, 533–556. [Google Scholar] [CrossRef]
  65. Allan, M. Toward a Better Understanding of Motivations for a Geotourism Experience: A Self-Determination Theory Perspective. Ph.D. Thesis, Edith Cowan University, Perth, Australia, 2011. [Google Scholar]
  66. Mandzáková, M. Úvod do Športovej Antropológie, 1st ed.; Belianum, Vydavateľstvo Univerzity Mateja Bela: Banská Bystrica, Slovakia, 2023. [Google Scholar]
  67. Kouchi, M.; Hanihara, K. An analysis of errors in somatometric research. J. Anthropol. Soc. Nippon 1981, 89, 493–504. [Google Scholar] [CrossRef]
  68. Stříbrná, L.; Kopecký, M.; Matějovičová, B.; Charamza, J. Body mass index a image těla u českých a slovenských studentek na vysoké škole. Slov. Antropológia 2017, 20, 48–52. [Google Scholar]
  69. Měkota, K. Unifit Test (6-60); Univerzita Palackého: Olomouc, Czech Republic, 1995; p. 108. [Google Scholar]
  70. Ruffierova Funkčná Skúška. Available online: https://trenujeme.sk/ruffierova-funkcna-skuska?srsltid=AfmBOopIlb4unFrgR4EOa33GIhvzjoyBfscbWUv7i4O3Ai9LlCwa0wxU (accessed on 12 July 2025).
  71. Molokáč, M.; Kršák, B.; Sidor, C. Models for mapping tourists (regarding surrounding). e-Rev. Tour. Res. 2016, 13, 550–560. [Google Scholar]
  72. Országhová, D. Študijné výsledky z matematiky a ich analýza pomocou t-testu Study outcomes of mathematics and their analysis using t-test. Forum Stat. Slovacum 2012, 3, 103–108. [Google Scholar]
  73. Kim, T.K. T test as a parametric statistic. Korean J. Anesthesiol. 2015, 68, 540–546. [Google Scholar] [CrossRef]
  74. Hlavoňová, D.; Hedvábný, P.; Kalina, T. Vliv věku, pohybové aktivity a dosaženého vzdělání na vybrané ukazatele obezity u dospělé populace ČR. In Vybrané Aspekty Zdatnosti Dospělé Populace České Republiky; Cacek, J., Grasgruber, P., Hlavoňová, D., Eds.; Masarykova Univerzita: Brno, Czech Republic, 2014; pp. 65–84. [Google Scholar]
  75. Sigmund, M.; Dostálová, I.; Sigmundová, D. Celkové a segmentální zastoupení tělesného tuku u žen pohybově aktivních a inaktivních ve věku adultus. Česká Antropol. 2013, 60, 35–40. [Google Scholar]
  76. Nekouie Sadry, B. The future of geotourism. In The Geotourism Industry in the 21st Century, 1st ed.; Apple Academic Press: Waretown, NJ, USA, 2020. [Google Scholar]
  77. Martini, G. Geological heritage and geo-tourism. In Geological Heritage: Its Conservation and Management; Barettino, D., Wimbledon, W.A.P., Gallego, E., Eds.; Instituto Tecnologico Geominero de Espana: Madrid, Spain, 2000; pp. 147–156. [Google Scholar]
  78. Pralong, J.P. Geotourism: A new Form of Tourism utilising natural Landscapes and based on Imagination and Emotion. Tour. Rev. 2006, 61, 20–25. [Google Scholar] [CrossRef]
  79. Geiger, K.; Sers, S.; Buday, L.; Wäsche, H. Why hikers hike: An analysis of motives for hiking. J. Sport Tour. 2023, 27, 315–329. [Google Scholar] [CrossRef]
  80. Mykletun, R.J.; Oma, P.; Aas, P. When the hiking gets tough: “New adventurers” and the “extinction of experiences”. J. Outdoor Recreat. Tour. 2021, 36, 100450. [Google Scholar] [CrossRef]
  81. Chhetri, P.; Arrowsmith, C.; Jackson, M. Determining hiking experiences in nature-based tourist destinations. Tour. Manag. 2004, 25, 31–43. [Google Scholar] [CrossRef]
  82. Elands, B.H.M.; Lengkeek, J. The tourist experience of out-of-home leisure and travel. Landsc. Urban Plan. 2012, 105, 7–14. [Google Scholar] [CrossRef]
  83. Lee, J.; Scott, D. Measuring environmentally responsible behavior among college students: Validity and reliability. J. Interpret. Res. 2004, 9, 5–20. [Google Scholar]
  84. Migoń, P. Geoheritage and geotourism. A European perspective. Geologos 2018, 24, 173–174. [Google Scholar] [CrossRef]
  85. Newsome, D.; Moore, S.A.; Dowling, R.K. Natural Area Tourism: Ecology, Impacts and Management, 2nd ed.; Channel View Publications: Bristol, UK, 2012. [Google Scholar]
  86. Reynard, E.; Giusti, C. The Landscape and the Cultural Value of Geoheritage; Reynard, E., Brilha, J., Eds.; Elsevier: Amsterdam, The Netherlands, 2018. [Google Scholar]
  87. Vecchiato, M.; Borasio, N.; Scettri, E.; Franzoi, V.; Duregon, F.; Savino, S.; Ermolao, A.; Neunhaeuserer, D. Are Suggested Hiking Times Accurate? A Validation of Hiking Time Estimations for Preventive Measures in Mountains. Medicina 2025, 61, 115. [Google Scholar] [CrossRef]
  88. Pál, M.; Albert, G. Digital cartography for geoheritage: Turning an analogue geotourist map into digital. Proc. ICA 2019, 2, 96. [Google Scholar] [CrossRef]
  89. Fassoulas, C.; Nikolakakis, E.; Staridas, S. Digital Tools to Serve Geotourism and Sustainable Development at Psiloritis UNESCO Global Geopark in COVID Times and Beyond. Geosciences 2022, 12, 78. [Google Scholar] [CrossRef]
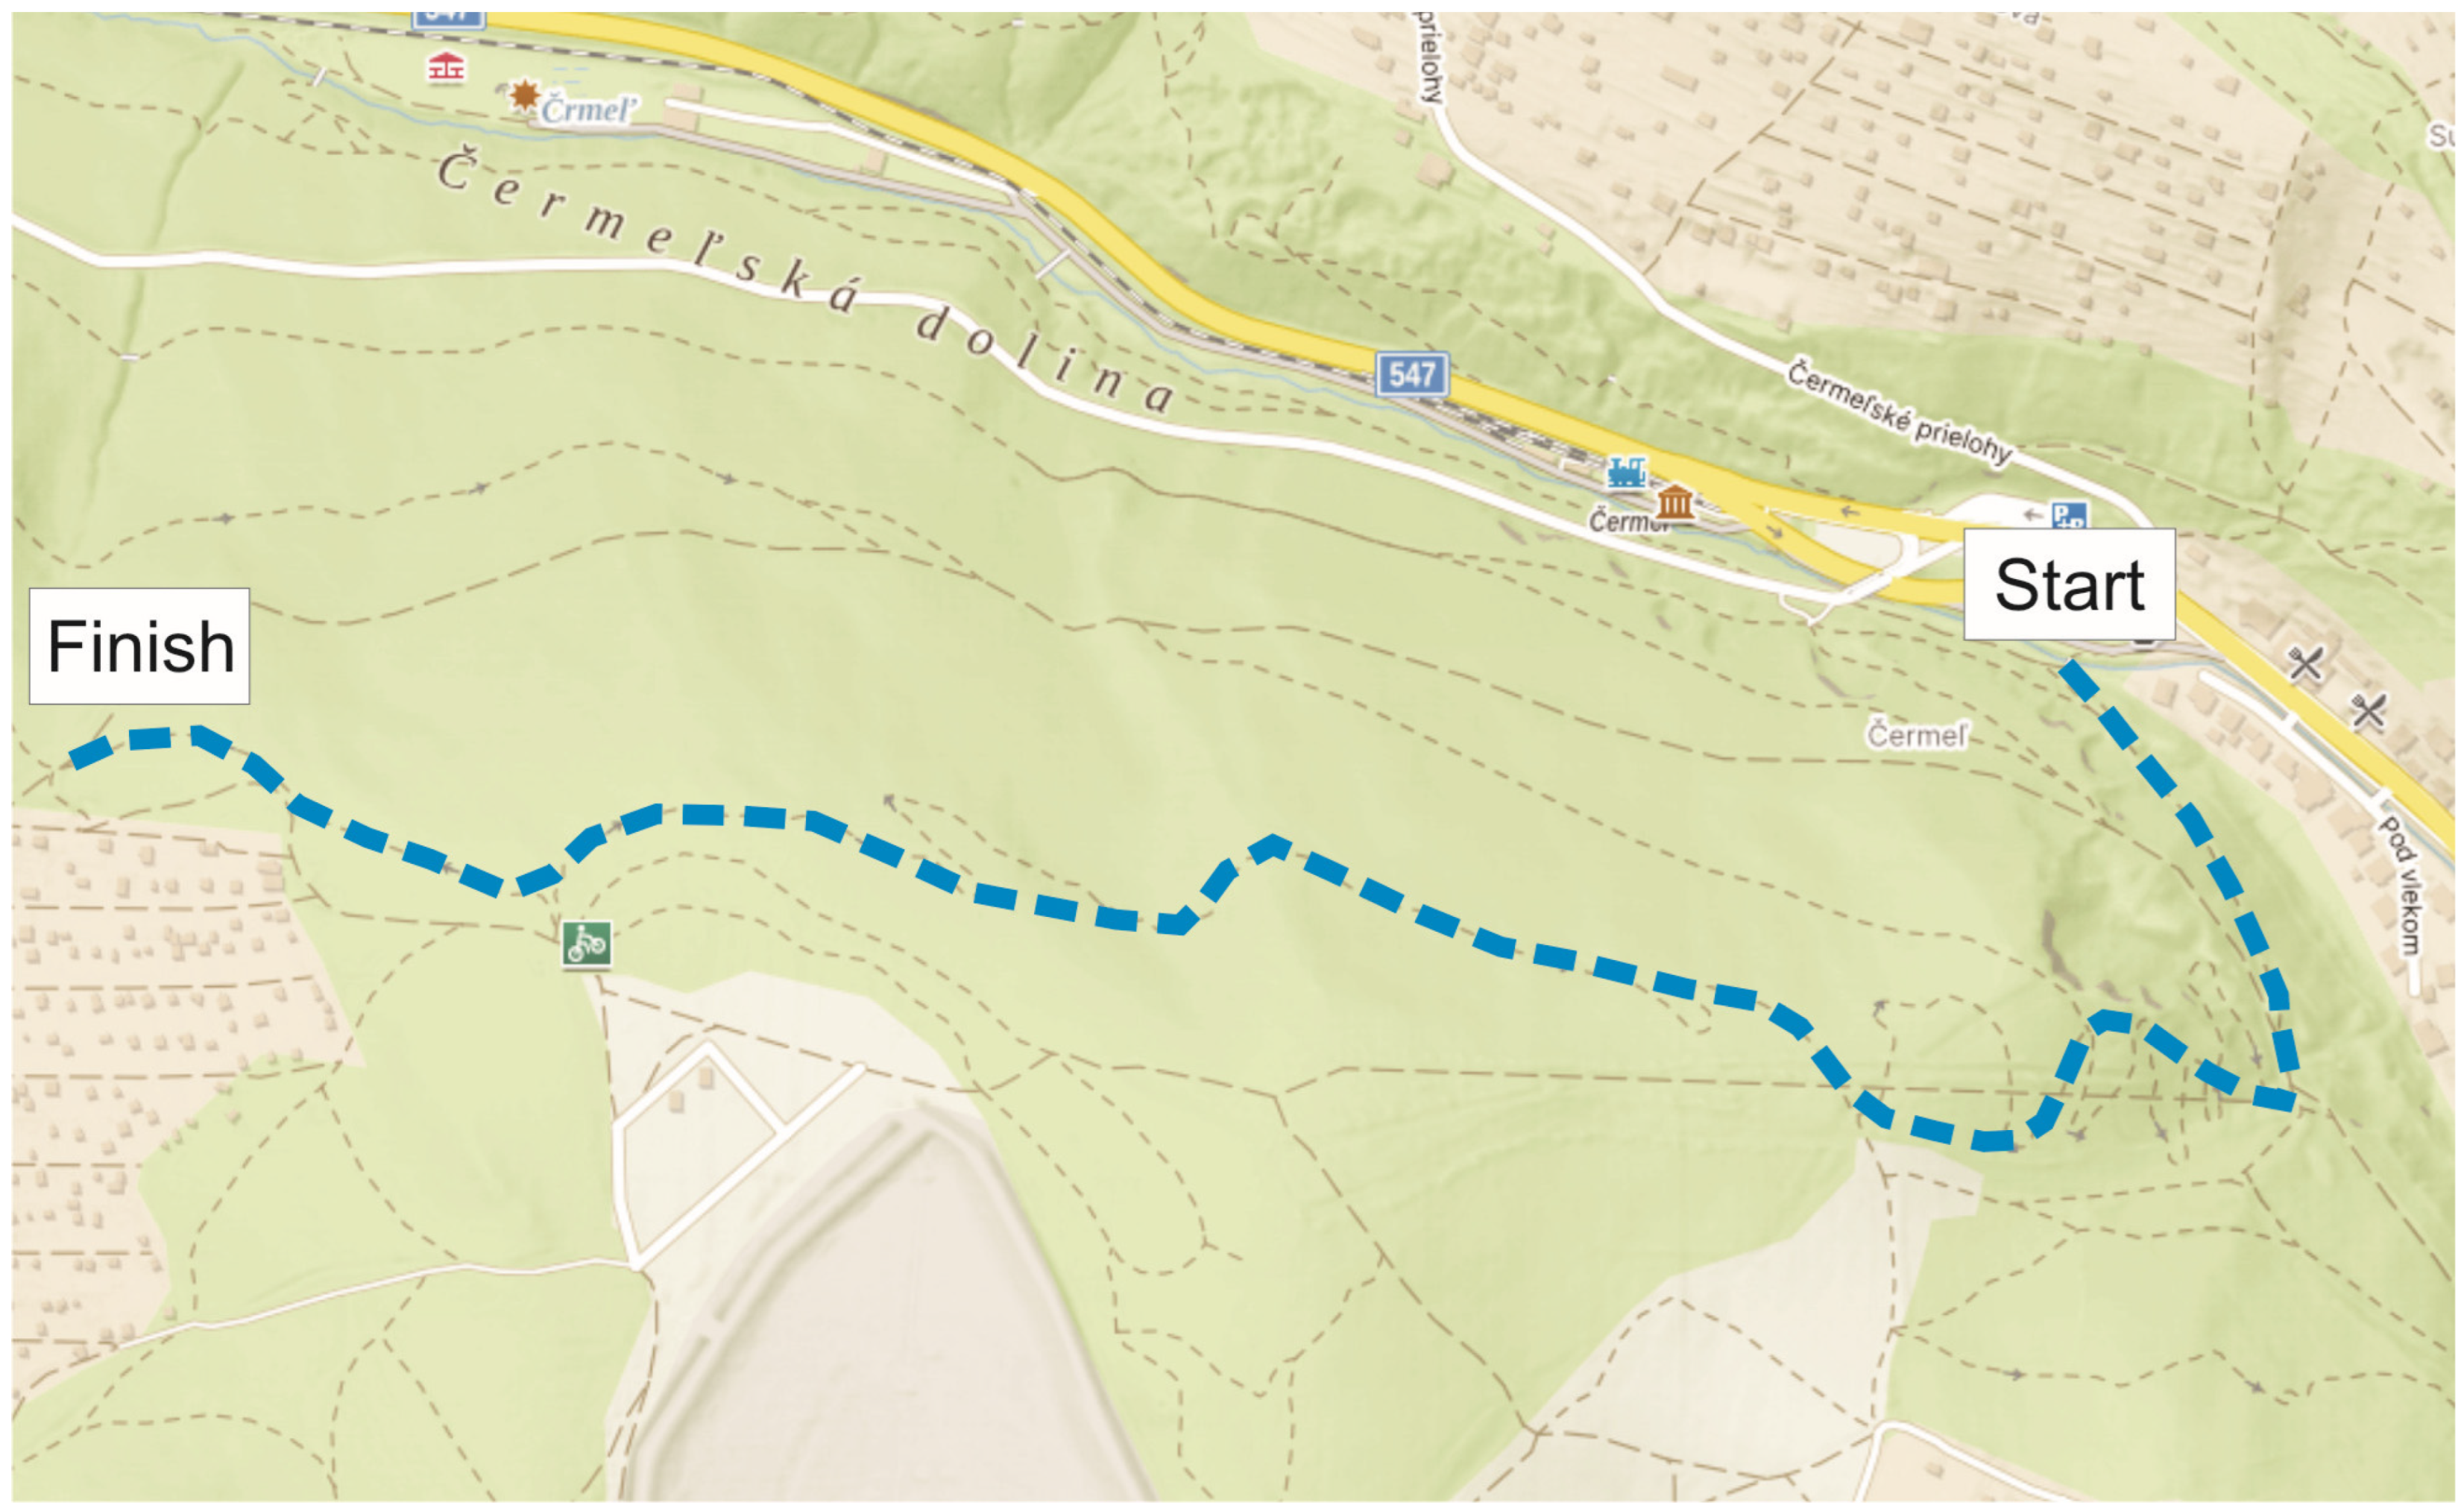
Figure 1. Hiking route Alpinka—Bankov forest park.
Forests 16 01728 g001
Figure 2. Unifit Test—Results of the Two-Sample t-Test (G1, G2).
Forests 16 01728 g002
Figure 3. Unifit Test—Results of the Two-Sample t-Test (G3, G4).
Forests 16 01728 g003
Figure 4. Unifit Test—Results of the Two-Sample t-Test (G5, G6).
Forests 16 01728 g004
Figure 5. Ruffier Test—Results of the Two-Sample t-Test (G1, G2).
Forests 16 01728 g005
Figure 6. Ruffier Test—Results of the Two-Sample t-Test (G3, G4).
Forests 16 01728 g006
Figure 7. Ruffier Test—Results of the Two-Sample t-Test (G5, G6).
Forests 16 01728 g007
Figure 8. Scatterplot matrix of dependencies with 95% confidence ellipse—G1. Source: own processing.
Forests 16 01728 g008
Figure 9. Scatterplot matrix of dependencies with 95% confidence ellipse—G2. Source: own processing.
Forests 16 01728 g009
Figure 10. Scatterplot matrix of dependencies with 95% confidence ellipse—G3. Source: own processing.
Forests 16 01728 g010
Table 1. Detailed overview of testing segments.
Testing
Segment
Test/ActivityLocationMeasured Ability/Parameter
Somatometric measurementsHeight, weight, BMITechnical University Gymnasium Košice, Somatic parameters
Functional cardio-vascular testRuffier testTechnical University Gymnasium Košice,Cardiovascular response to load (pulse, recovery)
Motor skills—UNIFITStanding long jumpTechnical University Gymnasium Košice,Explosive strength of the lower limbs
Sit-ups
(30 s)
Technical University Gymnasium Košice,Trunk muscle strength
Endurance tests2 km walkTartan track, Technical University StadiumAerobic endurance
12 min run (Cooper test)Tartan track, Technical University StadiumAerobic capacity, endurance
Field testWalking in a natural environmentHiking trail Bankov (Košice surroundings)Practical endurance and adaptation to natural terrain
Table 2. Field Walking: Results between Groups G1 and G2.
Two-Sample t-Test: Field Walking
GroupNMeanMinimumMaximumVariancet ValuePr > |t|
G1 (good fitness)8018.6415.8325.55.32−5.14<0.001
G2 (average fitness)8020.5316.527.55.5
Table 3. Field Walking: Results between Groups G2 and G3.
Two-Sample t-Test: Field Walking
GroupNMeanMinimumMaximumVariancet ValuePr > |t|
G2 (average fitness)8020.5216.527.55.5−4.38<0.001
G3 (poor fitness)8022.2318.7529.26.63
Table 4. Pearson correlation coefficients of Unifit, Ruffier, and field walking tests in groups G1, G2, G3.
Pearson Correlation Coefficients, N = 80/S
Prob > |r| Under H0: Rho = 0
GroupTestTest
UnifitRuffier
G1 (good physical fitness)Field walking−0.65
<0.0001
0.43
<0.0001
G2 (average physical fitness)Field walking−0.66
<0.0001
0.60
<0.0001
G3 (poor physical fitness)Field walking−0.81
<0.0001
0.76
<0.0001
Disclaimer/Publisher’s Note: The statements, opinions and data contained in all publications are solely those of the individual author(s) and contributor(s) and not of MDPI and/or the editor(s). MDPI and/or the editor(s) disclaim responsibility for any injury to people or property resulting from any ideas, methods, instructions or products referred to in the content.