Article

Interactive Visualizations of Integrated Long-Term Monitoring Data for Forest and Fuels Management on Public Lands

1
Center for Geospatial Analytics, North Carolina State University, Raleigh, NC 27695, USA
2
Parks, Recreation and Tourism Management, North Carolina State University, Raleigh, NC 27695, USA
*
Author to whom correspondence should be addressed.
Forests 2025, 16(11), 1706; https://doi.org/10.3390/f16111706 (registering DOI)
Submission received: 9 October 2025 / Revised: 2 November 2025 / Accepted: 6 November 2025 / Published: 9 November 2025
(This article belongs to the Special Issue Long-Term Monitoring and Driving Forces of Forest Cover)

Abstract

Adaptive forest and fire management in parks and protected areas is becoming increasingly complex as climate change alters the frequency and intensity of disturbances (wildfires, pest and disease outbreaks, etc.), while park visitation and the number of people living adjacent to publicly managed lands continues to increase. Evidence-based, climate-adaptive forest and fire management practices are critical for the responsible stewardship of public resources and require the continued availability of long-term ecological monitoring data. The US National Park Service has been collecting long-term fire monitoring plot data since 1998, and has continued to add monitoring plots, but these data are housed in databases with limited access and minimal analytic capabilities. To improve the availability and decision support capabilities of this monitoring dataset, we created the Trends in Forest Fuels Dashboard (TFFD), which provides an implementation framework from data collection to web visualization. This easy-to-use and updatable tool incorporates data from multiple years, plot types, and locations. We demonstrate our approach at Rocky Mountain National Park using the ArcGIS Online (AGOL) software platform, which hosts TFFD and allows for efficient data visualizations and analyses customized for the end user. Adopting interactive, web-hosted tools such as TFFD allows the National Park Service to more readily leverage insights from long-term forest monitoring data to support decision making and resource allocation in the context of environmental change. Our approach translates to other data-to-decision workflows where customized visualizations are often the final steps in a pipeline designed to increase the utility and value of collected data and allow easier integration into reporting and decision making. This work provides a template for similar efforts by offering a roadmap for addressing data availability, cleaning, storage, and interactivity that may be adapted or scaled to meet a variety of organizational and management use cases.

1. Introduction

Climate uncertainty poses significant challenges for present and future natural resource management and land stewardship. Though the onset, speed, and magnitude of climate-induced ecological change will vary by ecosystem, forested ecosystems may be particularly susceptible to climate change due to the direct impacts of seasonal temperatures and precipitation on tree growth, with longer life cycles limiting quick adaptations, and the increased proliferation of pests and diseases that thrive in warmer climates with more susceptible host trees [1,2]. However, it is difficult to predict how climate pressures will shape any given forested landscape because of the numerous and interacting stochastic processes in both space and time that influence forest succession trajectories [3,4]. Climate change, through both immediate and longer-term effects, may alter tree species’ current range by necessitating shifts to higher latitudes or elevations, or preventing native tree regeneration within the current range [5,6]. Additionally, direct human intervention such as forest product demand, trade agreements, and national policies may also indirectly alter the structure and function of forests through the creation of different management or market incentives (e.g., carbon credits, timber demand) [7,8,9]. Generally, the effects of climate change and other pressures can be categorized as pulse or press events; pulse events are abrupt disturbances (floods, wildfires, clearcuts, etc.), while press events occur over longer durations (droughts, rising temperatures, changes in fire suppression policy, etc.) [10].
Pulse disturbances in forested ecosystems can vary in frequency, duration, and spatial extent. Pulse events include wildfires, such as the outbreak of extreme wildfires across western North America in 2020 [11]; invasion of forest pests, such as Mountain pine beetle and Emerald ash borer [12,13]; pathogen transmission, such as Sudden Oak Death and Dutch Elm Disease [14,15]; and windthrow, such as the blowdown of forest stands in 2024, during Hurricane Helene [16]. Press disturbances, such as longer trends in shifting precipitation and temperature regimes that alter ecohydrology, may be realized over time horizons of decades to centuries [17,18]. When natural and human-induced pulse and press events co-occur across local to regional spatial scales, it can alter forest succession trajectories, as well as management objectives and tradeoffs. For example, a healthy timber stand may be designated for selective logging in 20 years. However, if this stand experiences a sequence of press and/or pulse events, such as prolonged drought which increases susceptibility to pest infestation, which in turn increases fuel loadings and wildfire risk, managers may reevaluate the intended use of this stand and consider new options. Monitoring ecosystem changes related to press or pulse events provides a benchmark of observed change to inform management decisions.
Tracking and understanding trends in both immediate and delayed forest change is critical because forests provide a host of global to local ecosystem services [19], including biodiverse habitats [20], carbon storage [21], recreational amenities, improved human health [22], and water security and cycling [23]. These ecosystem services have wide-ranging effects and interconnect across multiple spatial and temporal scales. Monitoring data helps to quantify the interactions and feedbacks between a changing environment and the impact on forest ecosystem services [24,25]. Monitoring data are essential to making sound, science-based management decisions and are foundational to successful adaptive resource management strategies [26].

1.1. Long-Term Monitoring for Adaptive Forest Management

Understanding forest responses to climate change begins with establishing baseline conditions, which require long-term in situ monitoring. In situ monitoring is a single but imperative facet of quantifying forest responses to climate change, as plot-based measurements provide the finest scale information about forest change and environmental forcings [27]. There is wide consensus that long-term, plot-based monitoring provides great value to the scientific and resource management communities by identifying and quantifying drivers and responses of ecosystem change, revealing trends in long-term processes, generating data for model development, and providing evidence at management and policy relevant scales [28].
International collaborations, such as the Forest Global Earth Observatory and the Food and Agriculture Organization of the United Nations, along with numerous national and state agencies, recognize the utility of long-term ecological monitoring. Collectively, these groups have implemented and funded a variety of monitoring efforts, and have sought to integrate these data into various frameworks for adaptive ecological management [25,29]. For example, the Resist–Adapt–Direct Framework, commonly known as RAD, provides a systematized framework by which resource managers can approach climate-related resource management decisions. RAD often relies on monitoring data as the first line of detection for both abrupt (pulse) and gradual (press) ecosystem changes, and monitoring data continues to support decision makers throughout the lifecycle of management decisions, as the decision to Resist, Adapt, or Direct change may evolve as new data become available [30,31]. In the United States, the National Park Service (NPS) relies on science and long-term monitoring to inform adaptive resource management in a variety of ecosystems [32]. The Inventory & Monitoring (I&M) Program within the NPS collects data on many different ‘vital signs’ for species, habitats, landscapes, and abiotic factors that help indicate the health of an ecosystem [33]. Systematic long-term monitoring stations and field protocols are implemented at more than 240 park locations to collect data on more than 30 categories of vital signs [34].
Here, we focus on long-term monitoring data and protocols for wildland fire and forest management. In 1998, long-term field monitoring plots were established throughout the park system and a set of monitoring protocols were designed, by which the NPS Fire Ecology Program is mandated to collect, analyze, and interpret fire effects and forest monitoring data for program evaluation and management [35]. The NPS Fire Ecology monitoring program tracks the effects of prescribed fire treatments over many years, and the long-term data collection at these plots has also captured other forest disturbances and management actions. These NPS forest and fuels monitoring data are used for a variety of purposes, such as to evaluate the degree to which treatment objectives are accomplished, to detect and track resource trends, and to identify specific research needs. These forest management data are used to answer questions, such as the following:
  • How effective is a specific treatment in reducing fuel loads and achieving desired vegetation conditions?
  • Which plots need initial or additional fuel treatments?
  • What type of fuel treatment is required?
  • How might fuel treatments interact with climate change to realize different vegetation communities?
Answering these questions has become increasingly important for wildfire mitigation as public land managers seek to understand where the areas of greatest cross-boundary risk to adjacent communities occur and proactively mitigate risk via fuels reduction. [36]. These monitoring data plots are sited to maximize representativeness of the surrounding forests, which means these plot-level data may serve as a building block for scaling fuels reduction insights beyond their individual or collective plot locations [35].
Despite the realized benefits of long-term monitoring programs within the NPS and other federal agencies, support for long-term ecological monitoring often faces barriers due to the scientific premium placed on novel methods or questions and technologies applied over larger spatial extents [37,38]. Funding for in situ long-term monitoring efforts, particularly from public sources, faces opposition due to high personnel costs and time lags before data and findings become available [27,39]. Alternatives, such as monitoring environmental change remotely from satellites or other instruments, can improve the frequency of observations, expand study extents, and reduce personnel costs, but remote monitoring alone is rarely able to provide the fine-scale information obtained through plot-based observations and may require that the same field data be used for calibration and validation. While essential to adaptive management, a common shortcoming of long-term monitoring programs is limited data availability [28]. Often, data are only available through a single organization’s database, with limited access to other stakeholders (e.g., science partners, other agencies). This presents two main sticking points. First, monitoring efforts are—at least in part—publicly funded, which suggests that the increased availability of publicly funded data should be prioritized. Second, siloed data makes it more difficult to integrate new, complementary data structures and/or add data that could extend coverage (spatial or temporal). More openly available data helps to alleviate these challenges by making it easier to leverage and gain insights from integrated data sources, assess data gaps or needs, and improve overall quality assurance due to a greater number of users vetting the data [40,41].
Limited field monitoring programs and siloed data repositories make it difficult to successfully integrate long-term monitoring data and insights into accessible formats of use to fire managers. Our academic research team worked collaboratively alongside resource managers at Rocky Mountain National Park (RMNP) to address the issues of data availability and integration of long-term monitoring data into adaptive forest management decision making through the development of the Trends in Forest Fuels Dashboard (TFFD). This work leverages existing NPS long-term forest and fire fuels monitoring data in an intuitive dashboard that allows ready access to forest monitoring data, provides automated analyses, and allows fire managers to integrate outputs into management practices and reporting to help steward valuable, public forest resources.

1.2. The Colorado Front Range and Rocky Mountain National Park

Rocky Mountain National Park (RMNP) exemplifies a protected landscape experiencing a variety of climate-exacerbated changes. These interconnected changes, such as increased wildfire risk, pest infestations, and altitudinal and seasonal ecosystem shifts, are often linked to sustained periods of warmer, drier conditions, and challenge decision makers as they implement resource management strategies today that are designed to manage future conditions under climate uncertainty [42]. Located in the Colorado Front Range, RMNP covers more than 1000 km2, and park elevation spans 2000 vertical meters (2316 to 4436 m). The large area and range of elevations mean RMNP is home to a variety of terrestrial and aquatic ecosystems, including montane, subalpine, alpine, and glacial ecosystems that comprise the headwaters of major river systems, such as the Colorado and the Cache la Poudre Rivers. Average seasonal high temperatures (summer: 20 °C (68 °F), winter: 3.8 °C (39 °F)) vary with elevation, while mean annual precipitation varies from west (50.67 cm. (19.95 in.)) to east (33.27 cm. (13.10 in.)). RMNP’s mean annual temperature has increased by 1.7 °C (3.4 °F) over the last century, with projected increases of 3.3 to 6.7 °C (6 to 12 °F) by the end of this century [43].
Ninety-five percent of RMNP is designated wilderness to be permanently protected from human impacts, but the remaining five percent of lands are easily accessible by vehicle and see millions of visitors each year. In 2024, more than 4 million people visited RMNP [44], and the park is surrounded almost entirely by publicly accessible lands managed by the US Forest Service (Figure 1). The Colorado Front Range area attracts ever growing numbers of amenity migrants, who often settle in the wildland urban interface (WUI). Between 1990 and 2020, the number of housing units in Colorado’s WUI increased by 88%, and as of 2020, more than 40% of all the states’ housing units are in the WUI [45]. With anticipated increases in visitation and the growth of neighboring gateway communities, the need for public land stewardship and clearly defined forest management plans is critical, particularly in terms of fuels management and potential wildfire spread from public to private lands.
The scale and rate of spread of past disturbances (pine beetle outbreaks, wildfires, etc.) presents a challenge to resource managers when compared to the available resources and viable forest management actions (prescribed fire, thinning, etc.) at their disposal. Between 2000 and 2019, nearly every watershed in the park experienced greater than 50% mortality of pine tree species due to either mountain pine beetles or other varieties of bark beetles, while wildfires have burned nearly 25% of the park and the surrounding USFS lands in the last four decades (Figure 1). Comparatively, a much smaller fraction of RMNP and adjacent public lands have experienced any type of forest management treatment; this is not for a lack of management within and adjacent to the park, but rather, it is due to a spatial scale mismatch that is a common discrepancy between landscape-scale disturbances and the management actions that alter forested landscapes [46].
There is a need to strategically treat more forested acres to promote and sustain fire-adapted and resilient landscapes, as wildfire risk increases substantially with greater extents of dead or weakened trees from beetle infestations and limited fuel reduction treatments. Wildfire risk and susceptibility to beetle kill varies throughout the park by dominant tree species and ecosystem type; however, RMNP ranks the condition of its subalpine ecosystems, particularly forest structure and composition, as ‘Warrants Moderate Concern’, with a high confidence that the subalpine forest condition is in decline due to the direct and indirect impacts of climate change [47]. Our understanding of the current state of subalpine forests relies on the existence of long-term monitoring data, and so continuing to collect and analyze these data is critical for the future of climate-adaptive forest management within RMNP.

1.3. Objectives

The Trends in Forest Fuels Dashboard (TFFD) will help resource managers at RMNP to identify locations with high fuel loads that are good candidates for implementing prescribed fire and mechanical fuel treatments. Managers will also be able to map and identify, within these plots, fuel load and vegetation community composition changes observed during the past two decades. Insights may then be complemented with additional information, such as park-wide vegetation or fire history spatial data, to highlight areas of the landscape that may exhibit similar conditions for fuels reduction planning and monitoring outcomes. This work demonstrates integrating field data observations, interim storage and data processing, and custom-made visualizations that use enterprise-scale GIS tools for decision support. The three main objectives are to (1) develop an interactive dashboard that can easily incorporate future data into analyses and be shared, (2) co-create the dashboard interface such that visuals and information readily inform management decisions, including location and timing of future treatments, and can be used to estimate post-treatment effects on vegetation communities, and (3) identify the status and trends of vegetation communities post-prescribed fire and fuels treatments. Through improved access to these data, along with custom and modifiable visualizations and summaries, TFFD will help to facilitate the asking and answering of new resource management research questions, understanding progress toward current management benchmarks, and supporting future science-based forest and fire effects management decisions. Our approach translates to other data-to-decision making workflows where custom visualizations are often the final steps in a pipeline designed to increase the utility and value of collected data and allow easier integration into required reporting and data-backed decision making. This work provides a template for similar efforts by offering a roadmap for addressing data availability, cleaning, storage, and interactivity that may be adapted or scaled to meet a variety of organizational and management use cases.

2. Dashboard Development

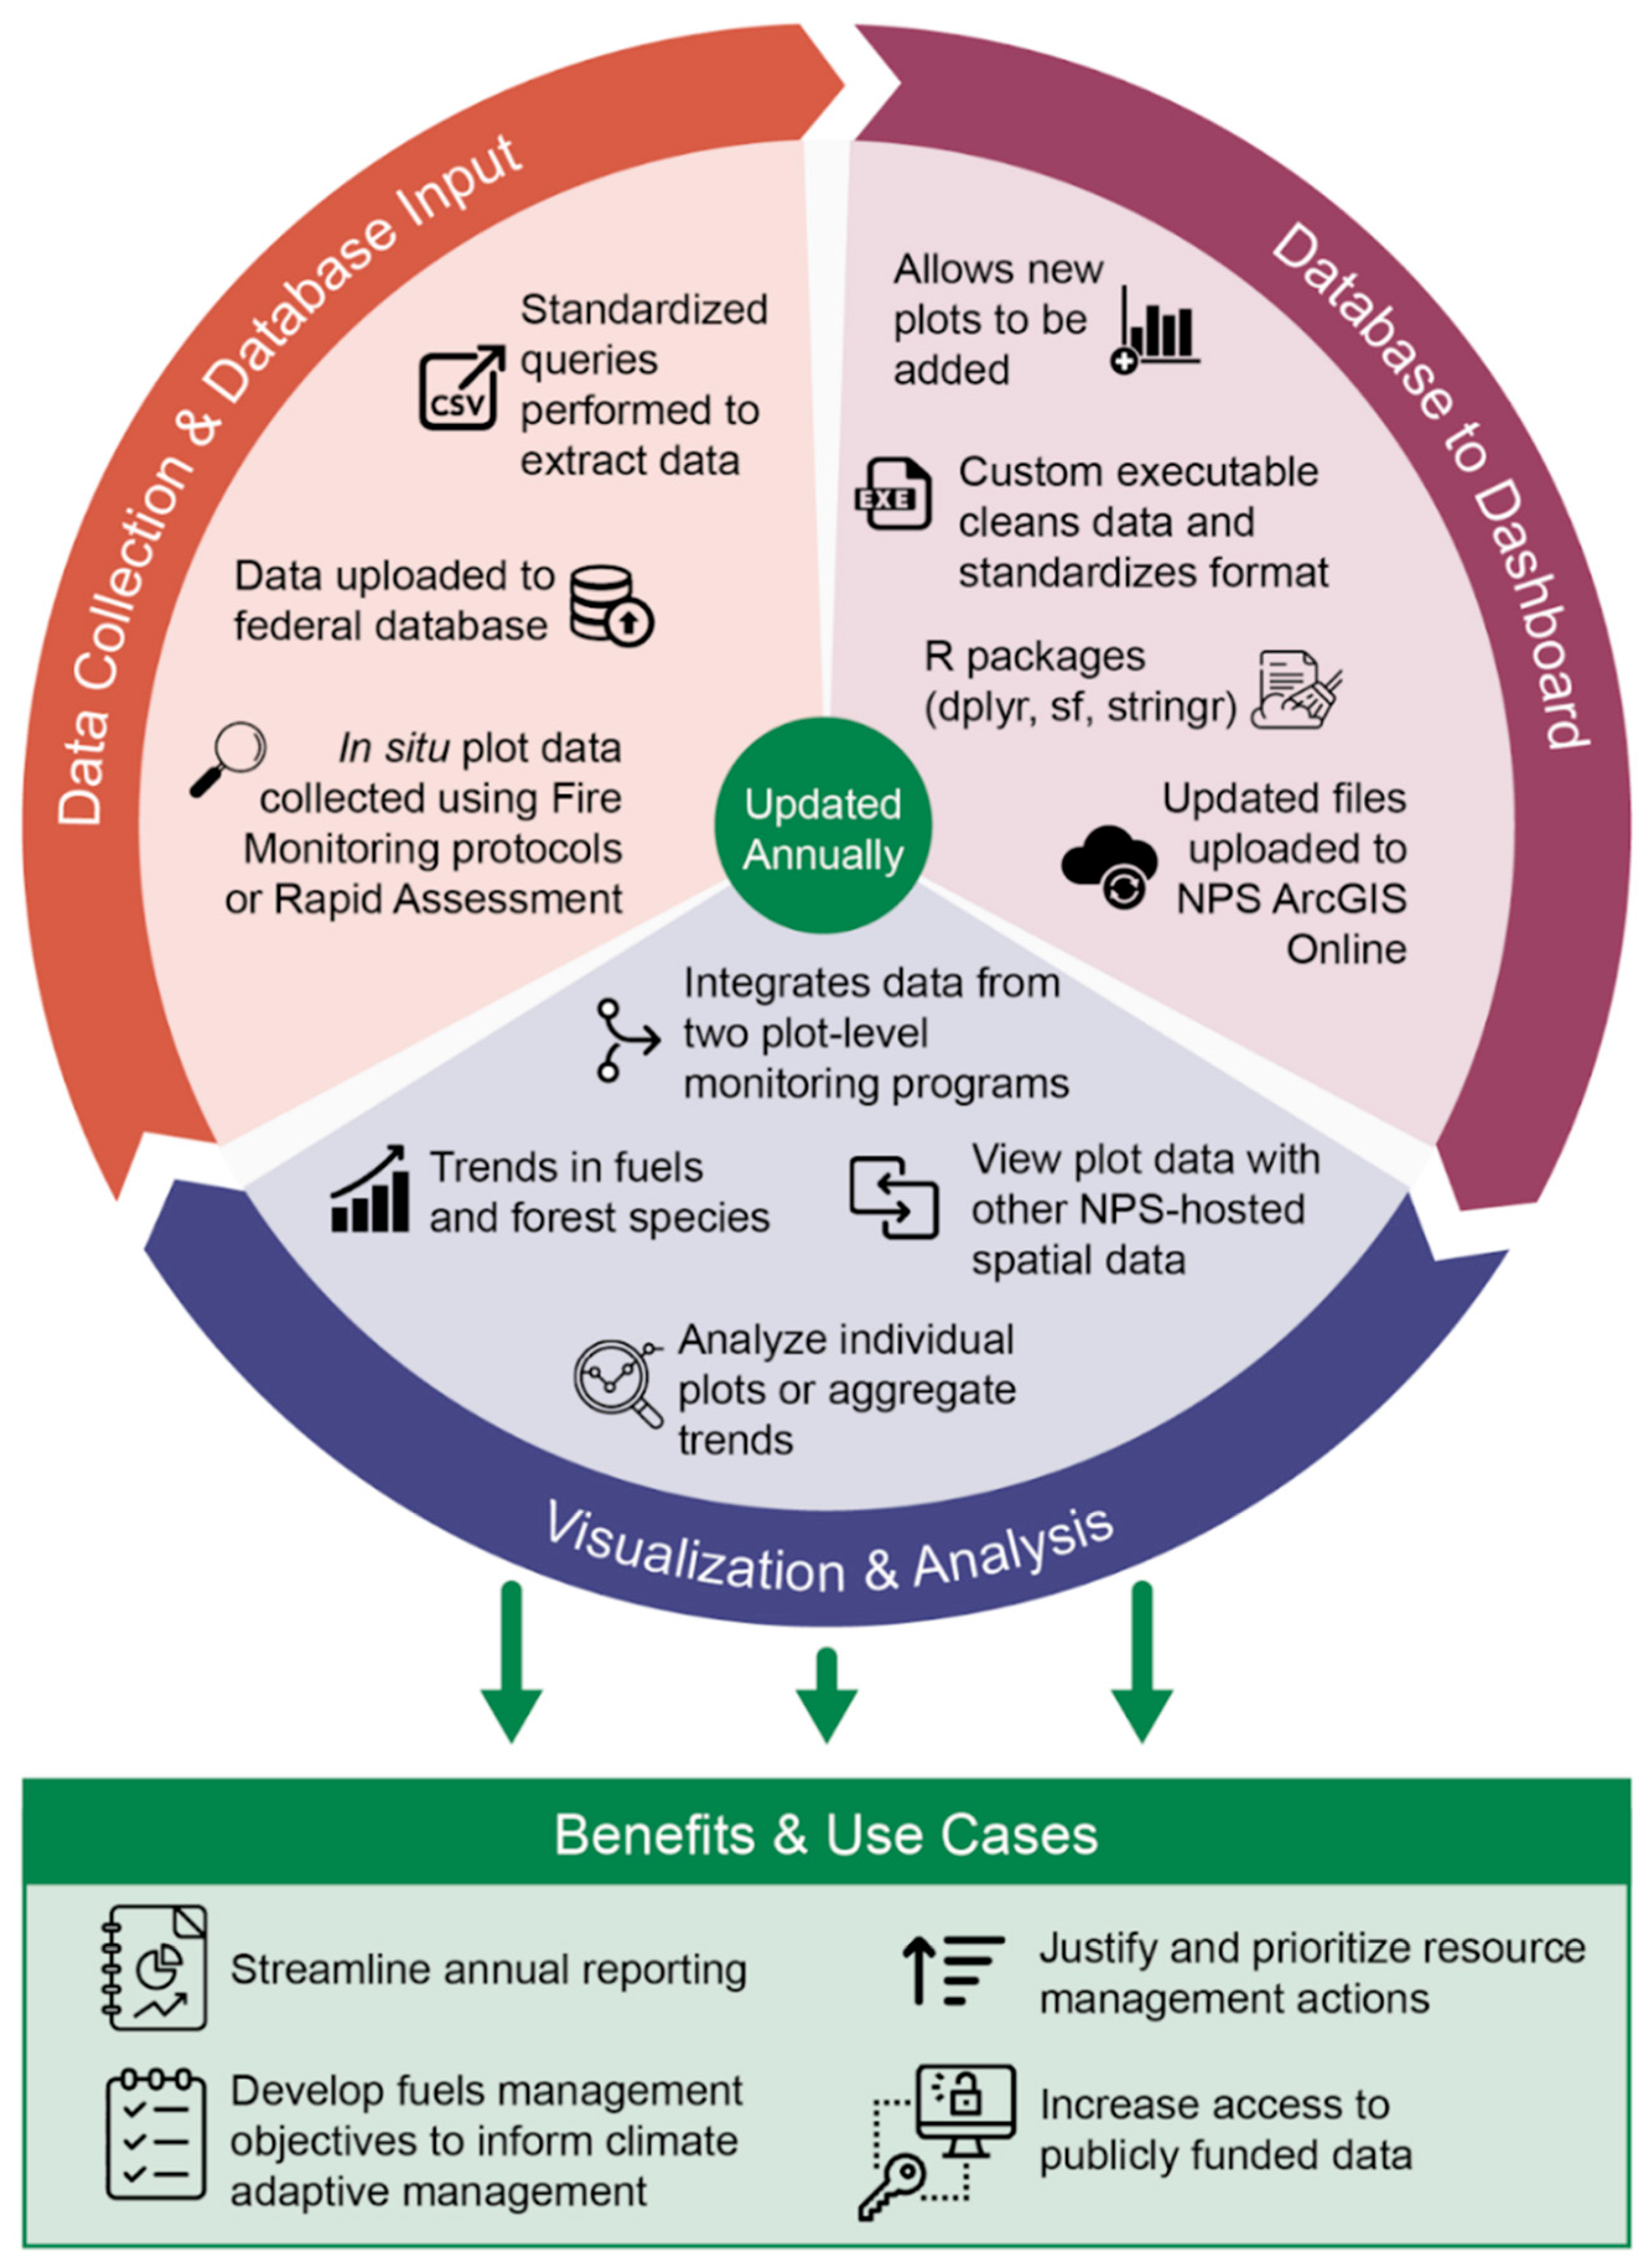
The Trends in Forest Fuels Dashboard (TFFD) is a web-enabled platform built with ESRI ArcGIS Online (AGOL) Experience Builder that provides a simple and effective way to curate, calculate, and visualize field conditions. The collaborative process of platform development consisted of three main components: understanding data curation, data cleaning, and processing needs; development of metrics, benchmarks, and visualizations; and integrating all components into a web platform. The dashboard meets the needs of natural resource managers by providing access to management-relevant data such that users can quickly report on the most recentstatus of individual or multiple field plots and explore multi-year data without the need to manually perform extensive calculations or data manipulation. Users interact with both spatial and tabular data. The dashboard shows the spatial locations of the monitoring plots, and users can add additional management-relevant spatial data layers (detailed vegetation maps, infrastructure, administrative units, etc.), while multiple pages of widgets grouped by data collection type display custom graphics and the corresponding tabular data. The data underlying the dashboard are processed and inputted into the dashboard through an automated and modifiable-as-needed workflow, such that the dashboard can be annually updated as additional field data are collected (Figure 2).

2.1. Data Collection and Processing Dashboard Inputs

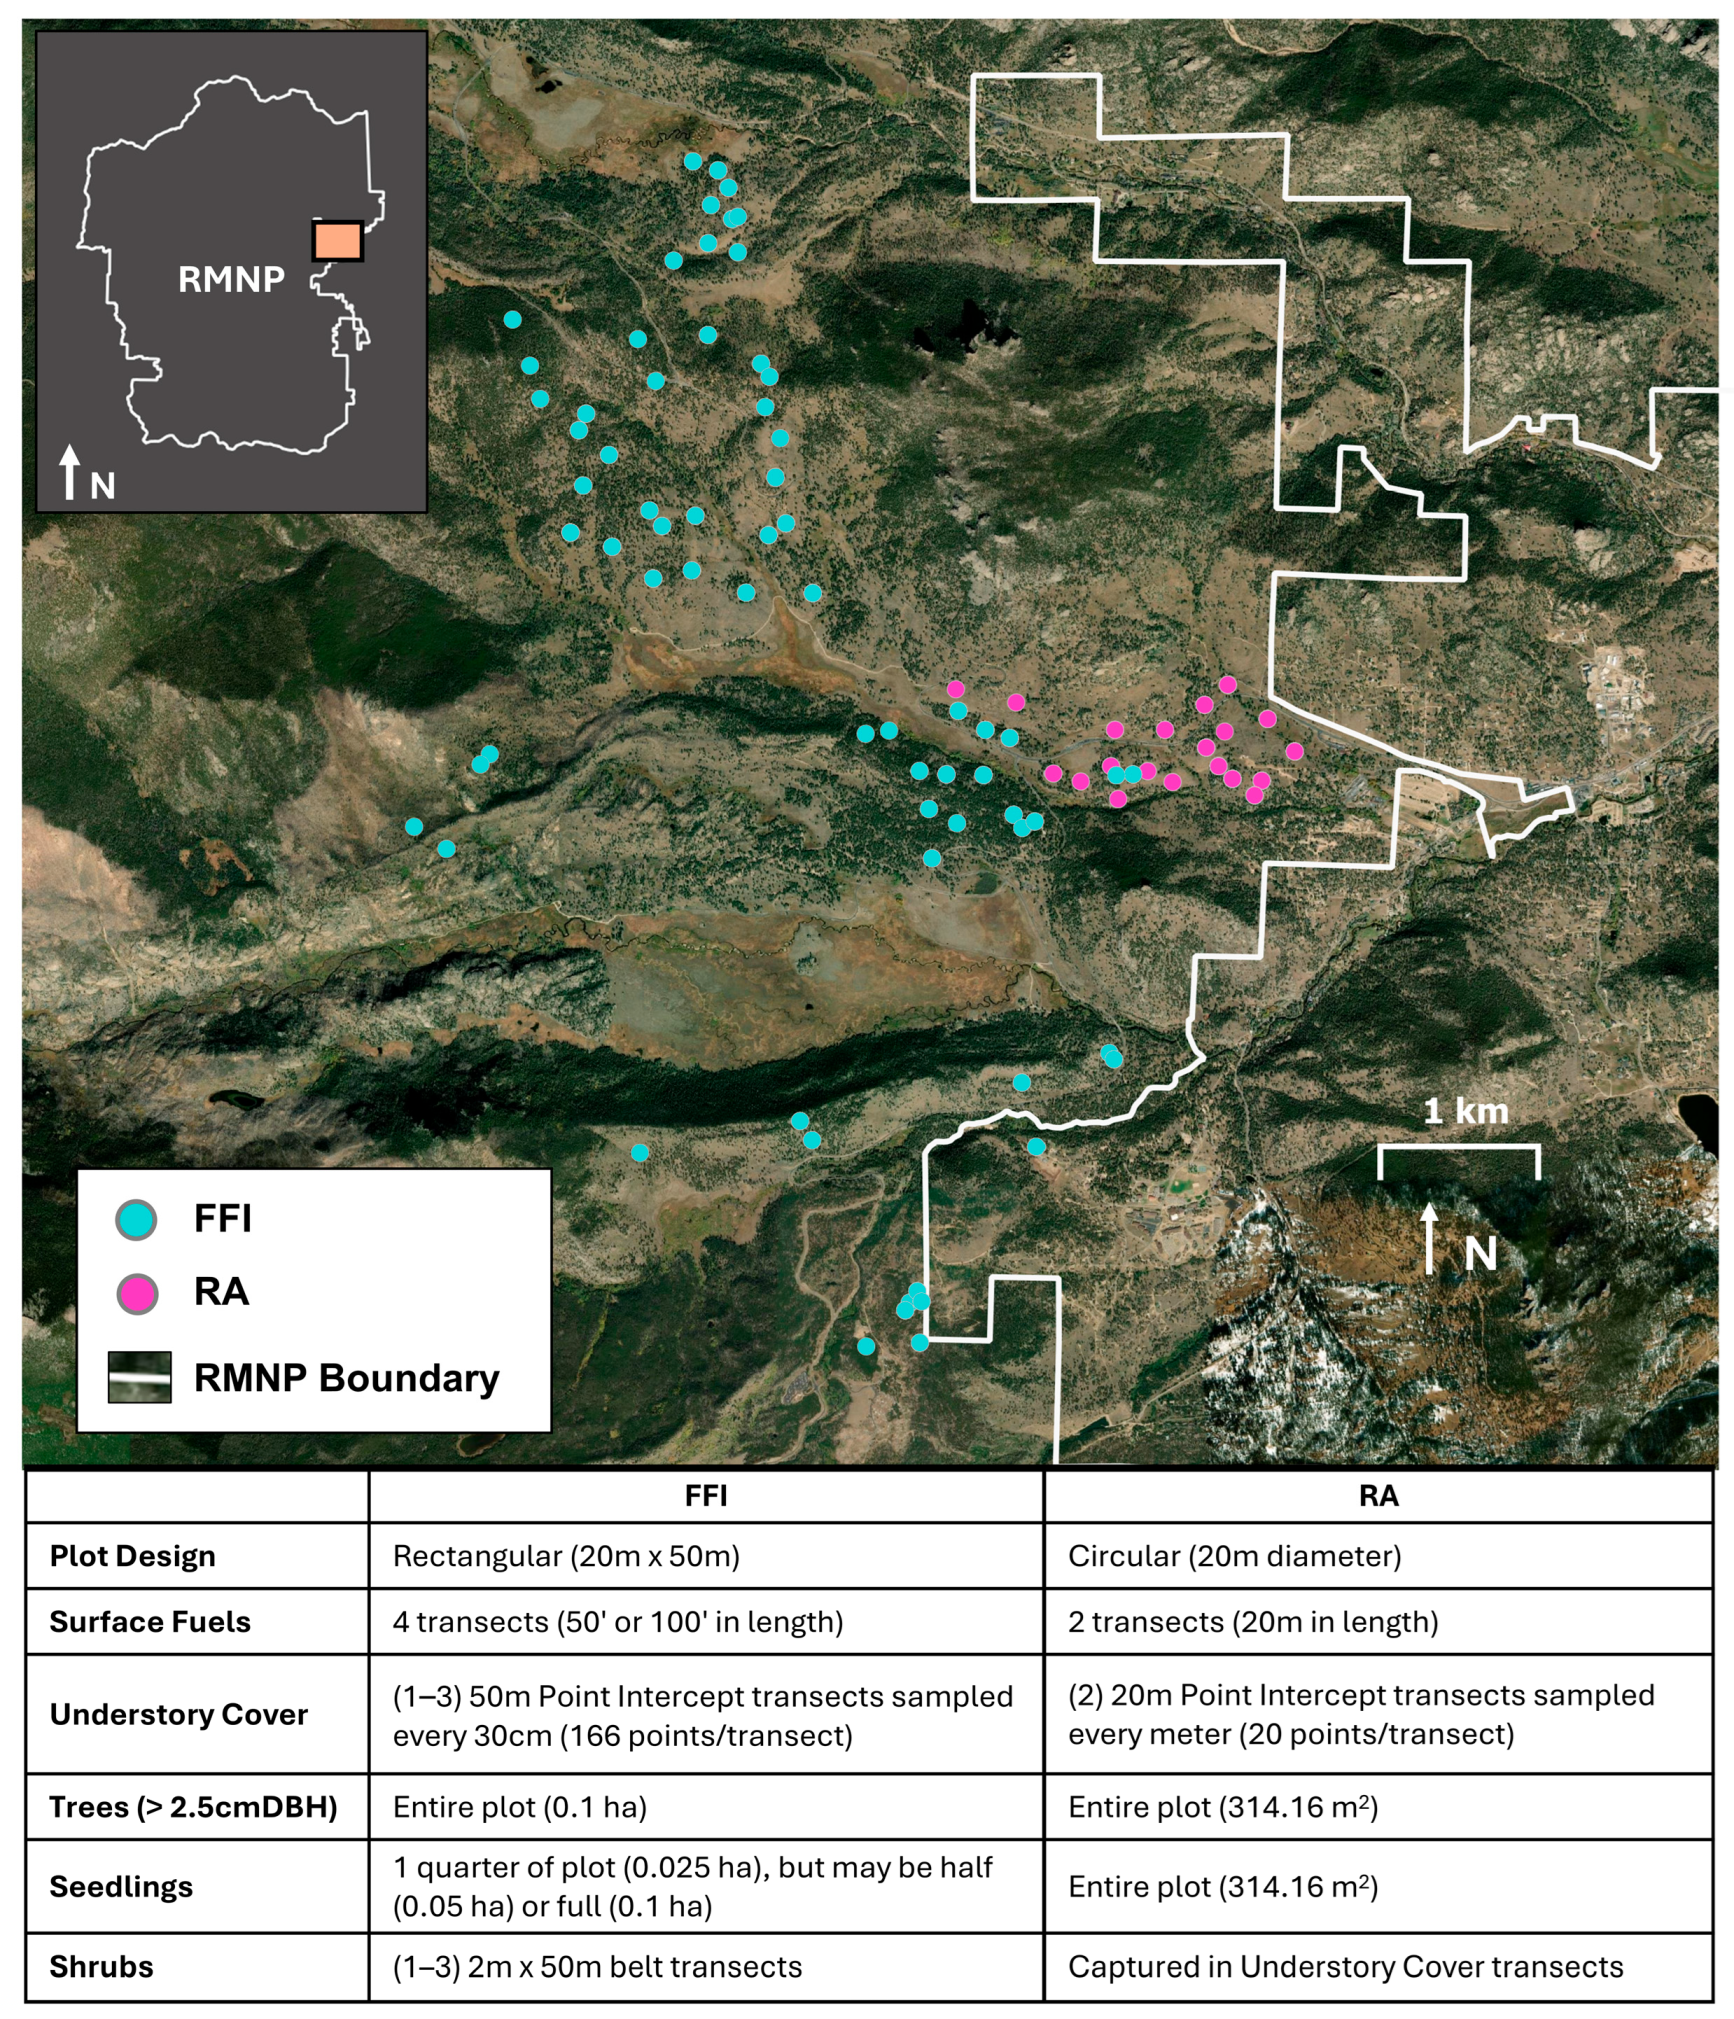
The data collected at RMNP long-term monitoring plots are collected for either the Fuels and Fire Effects (FFI) or the Rapid Assessment (RA) monitoring programs (Figure 3). The FFI program supports congressionally mandated federal land management practices that require an understanding of the effects of prescribed fire on fuels and forest species. The FFI program, administered at numerous locations managed by the National Park Service, supports adaptive management of forested ecosystems by providing historical monitoring data on fire effects. The RA program monitors a wide array of forest treatments and disturbances beyond prescribed fires, as use of non-fire treatments continues to increase throughout the National Park Service. The RA plots provide an easier-to-establish plot data collection protocol that can be implemented in less time following a treatment or disturbance. As of 2025, the dashboard contains more than 600 observations, including all historical monitoring data for all plots from 1998 to 2025. Of those 88 plots, 39 have never burned, 39 have burned once, and 4 have burned twice, with 14 plots having been monitored for thinning treatments. Currently, all data are updated annually and housed in a national database (Feat-Firemon Integrated) with limited accessibility. A strength of TFFD is the ability to integrate the information collected at all 89 long-term monitoring plots in RMNP into a more accessible, actionable, and web-based format (Figure 2).
Data collected include detailed information on fuel load, vegetation structure, and vegetation composition to evaluate the degree to which fuel treatments meet short- and long-term management objectives, and more generally, track vegetation change within plots. Plots are 20 m × 50 m (FFI) or of 20 m diameter (RA) and sampling follows protocols found in the National Park Service’s Fire Monitoring Handbook [35]. The main difference between FFI and RA plots are the structure of the sampling events; FFI sampling is determined by the occurrence of prescribed fire and regular intervals post-fire, while RA plots do not rely solely on prescribed fire events to determine sampling frequency, and instead, can be established at any point in time to capture ecological events of interest. At RMNP, plots under FFI sampling protocols belong to one of the following five vegetation classes: Artemisia tridentata ssp. (ARTR, mountain sagebrush), Pinus contorta (PICE, lodgepole pine), Pinus ponderosa (PIPO, ponderosa pine), Pinus contorta with Pinus ponderosa and Pseudotsuga menziesii (PICM, lower montane mixed conifer), and <40% canopy cover Pinus ponderosa (PIPS, ponderosa pine savannah). For consistency with the National Park Service, from hereon, these are designated as ‘monitoring types’, which are determined by the dominant vegetation when the plot was established.
The data collected for both FFI and RA plots include data on the herbaceous layer (species, live/dead status, soil substrate in the absence of vegetation), shrub density (species, count of individuals by species, live/dead status, age class), trees with >2.5 cm DBH (species, live/dead status, DBH, and if damaged, possible cause), tree seedlings with <2.5 cm DBH (species, height, count of individuals by species), and dead and downed woody fuels (count by diameter size class (0–0.25”, 0.25–1”, 1–3”), diameter for every particle > 3”, litter and duff depth). All species are flagged as native or non-native. Each data collection is time stamped with the day it occurred and the ‘Monitoring Status’ which reflects the number of burns (or treatments) that have occurred in that plot and the length of time that has elapsed since the most recent burn. For example, ‘02PostYear05’ indicates that two burns have occurred in that plot and the observation period is five years following the second burn.
A series of user-defined database queries are required to extract information from the Feat-Firemon Integrated (FFI) Database. With RMNP staff, we drafted a user guide to standardize the execution of these queries to a series of .csv files. The user guide provides instructions on the FFI database queries and output formats, steps to update the dashboard, and descriptions of two additional .csv files that contain QAQC outputs (i.e., summary statistics, data inconsistencies, etc.) from the data processing that users should review before proceeding with the dashboard update. Data processing and standardized cleaning then merge all data files into a single dataset before being uploaded to ArcGIS Online (AGOL) Experience Builder as a Feature Layer.

2.2. Database to Dashboard

Collaborating with park staff to develop the dashboard revealed the main priorities to assure the workflow from field data-to-visualization would allow for seamless data updates and new plot locations to be added, while minimizing the time and effort required of park staff to maintain this tool. In total, more than fifteen meetings were held with park staff and researchers to collaboratively design the dashboard based on current and anticipated needs. The Feat-Firemon Database is updated annually with data collected in the field, and so, the dashboard needs to be able to incorporate all newly collected data and any modifications to existing data. The Feat-Firemon database structure is relatively stable such that pre-defined queries export all records over the observation period into .csv format. The .csv is then placed in a local project folder with a data cleaning executable written in the R programming language that relies on the common packages dplyr [48], stringr [49], and sf [50]. After these scripts are executed, a cleaned output spatial layer is produced for upload as a Feature Layer to AGOL. Within the local project folder, an editable .csv separate from all other data contains monitoring plot IDs and locations. As new plots are added to the monitoring program at RMNP, plot IDs and spatial locations can be added to this .csv that is then joined with the forest fuels data during processing.
Automated data cleaning produces the same .csv file structure, such that the single AGOL Feature Layer is immediately operational within the dashboard. Basic QAQC summary information is produced alongside the updated data, including information such as the number of new plot IDs, any new classes introduced into data fields, or records with missing data. This summary allows NPS staff to identify any format discrepancies in the updated data that would be incompatible with the existing dashboard data. All AGOL data used in the dashboard and the dashboard itself must be stored in a ‘Shared Update’ AGOL group, meaning all users within the group require an NPS or NPS-partner AGOL account to access and modify data. To support inter-organizational partnerships, collaborators may be granted an NPS partner account. Challenges with direct access to the Feat-Firemon database prevented the use of cloud-based or more automated download protocols. In turn, we opted to continue using manually queried exports from the Feat-Firemon database, as it reduces dependency on ESRI-based software and storage infrastructure, which could negatively impact the long-term sustainability and maintenance of the dashboard if certain features were to be deprecated or no longer available for use on NPS AGOL enterprise accounts.

2.3. Dashboard Visualizations and Analysis

The primary goal of the dashboard visualizations and analyses is to increase the utility of this extensive long-term monitoring dataset and assure that relevant data summaries are available to inform forest management decisions. With the proper credentials, the dashboard can be readily shared through a web link, which increases accessibility while protecting source data. The visualizations and analyses build off existing, required annual reports created for the NPS Fire Ecology Program, so future annual reports should consume less time by using the automatically updated visualizations directly from the dashboard. The dashboard integration of both the FFI and RA plots also eliminates the task of data cleaning and processing by automating integration and analyses (Figure 2). Collaborative dashboard development meant taking special care to incorporate visuals and analyses that are of use to a wide array of park staff and extensive iteration of all dashboard elements following feedback. For example, the analyses necessary for annual reporting may differ from the day-to-day information needed by a fuels technician when planning fuel reduction treatments. This variability in uses cases and possible end users necessitated the inclusion of three main elements in the dashboard: (1) the ability to view data in the aggregate, by fuel type, and by selected or individual plots; (2) the ability to overlay additional AGOL web-hosted spatial reference data (treatment boundaries, wildfires, etc.) with plot locations; and (3) the ability to navigate between tabs (pages) that focus on different data types (fuel loads, species composition, etc.).

2.3.1. Total Fuels

Total fuel load (tons/acre) provides a baseline metric for tracking plot fuel loads and a reference point for potential fire intensity and spread. Total fuel load is a sum of all fuels in the plot including litter, duff, 1-hr, 10-hr, 100-hr, and 1000-hr fuels. The ‘Total Fuels’ tab of the dashboard allows resource managers to quickly see trends by monitoring type in the aggregate (average, dark lines) and for individual plots (lighter lines; Figure 4). For example, if a fuels management objective is to reduce total fuel loading by 50% or maintain at desired levels one year following the entry burn, the user could quickly see that this objective, on average, is met for PIPO and PICM plots but not for ARTR, PIPS, or PICE (Figure 4). This demonstrates why plots are separated by monitoring type, because average pre- and post-burn fuel loads differ considerably across monitoring types; the average pre-burn total fuels for PICM plots (~21 tons/acre) is more than four times greater than that of ARTR plots (5 tons/acre). Therefore, management objectives are tailored according to monitoring type and time since burn. Data are collected and displayed in imperial units for consistency and manager ease of use.
Across the five monitoring types, PICM (mixed conifer) plots have the highest average fuel loadings (dark purple line), five to ten years following a single prescribed fire, meaning these plots may be prioritized for additional fuel treatments of either thinning or prescribed fire to reduce fuels (Figure 4). Dashboard users can also see no PICM plots have been burned twice (light purple lines), limiting the available data to develop data-driven objectives for fuel conditions following a second burn. Intuitively visualizing the number of data points for a given monitoring type at different monitoring statuses is an important aspect of designing and revising management objectives, as the number of observations is directly related to the expected uncertainty of fuel load outcomes across plots. Generally, it is difficult to communicate fuel loading at every monitoring status for every plot in a static report because the visuals simply become overcrowded, so the typical data visualization requires data to be aggregated in some way (box plot, bar plot, etc.). However, reviewing a single average value or even a box plot often oversimplifies the noisy and variable nature of fuel load data within a single plot and across plots. The interactivity of the dashboard allows all plot data points to be displayed, and the user to filter and further select by plot type for easier visualization. The dashboard increases the utility of these data from their typical static form in a report or presentation because it allows users to easily track the behavior of an individual plot or group of plots through time that would otherwise be masked by or skewed by aggregate summary statistics.

2.3.2. Fuel Classes

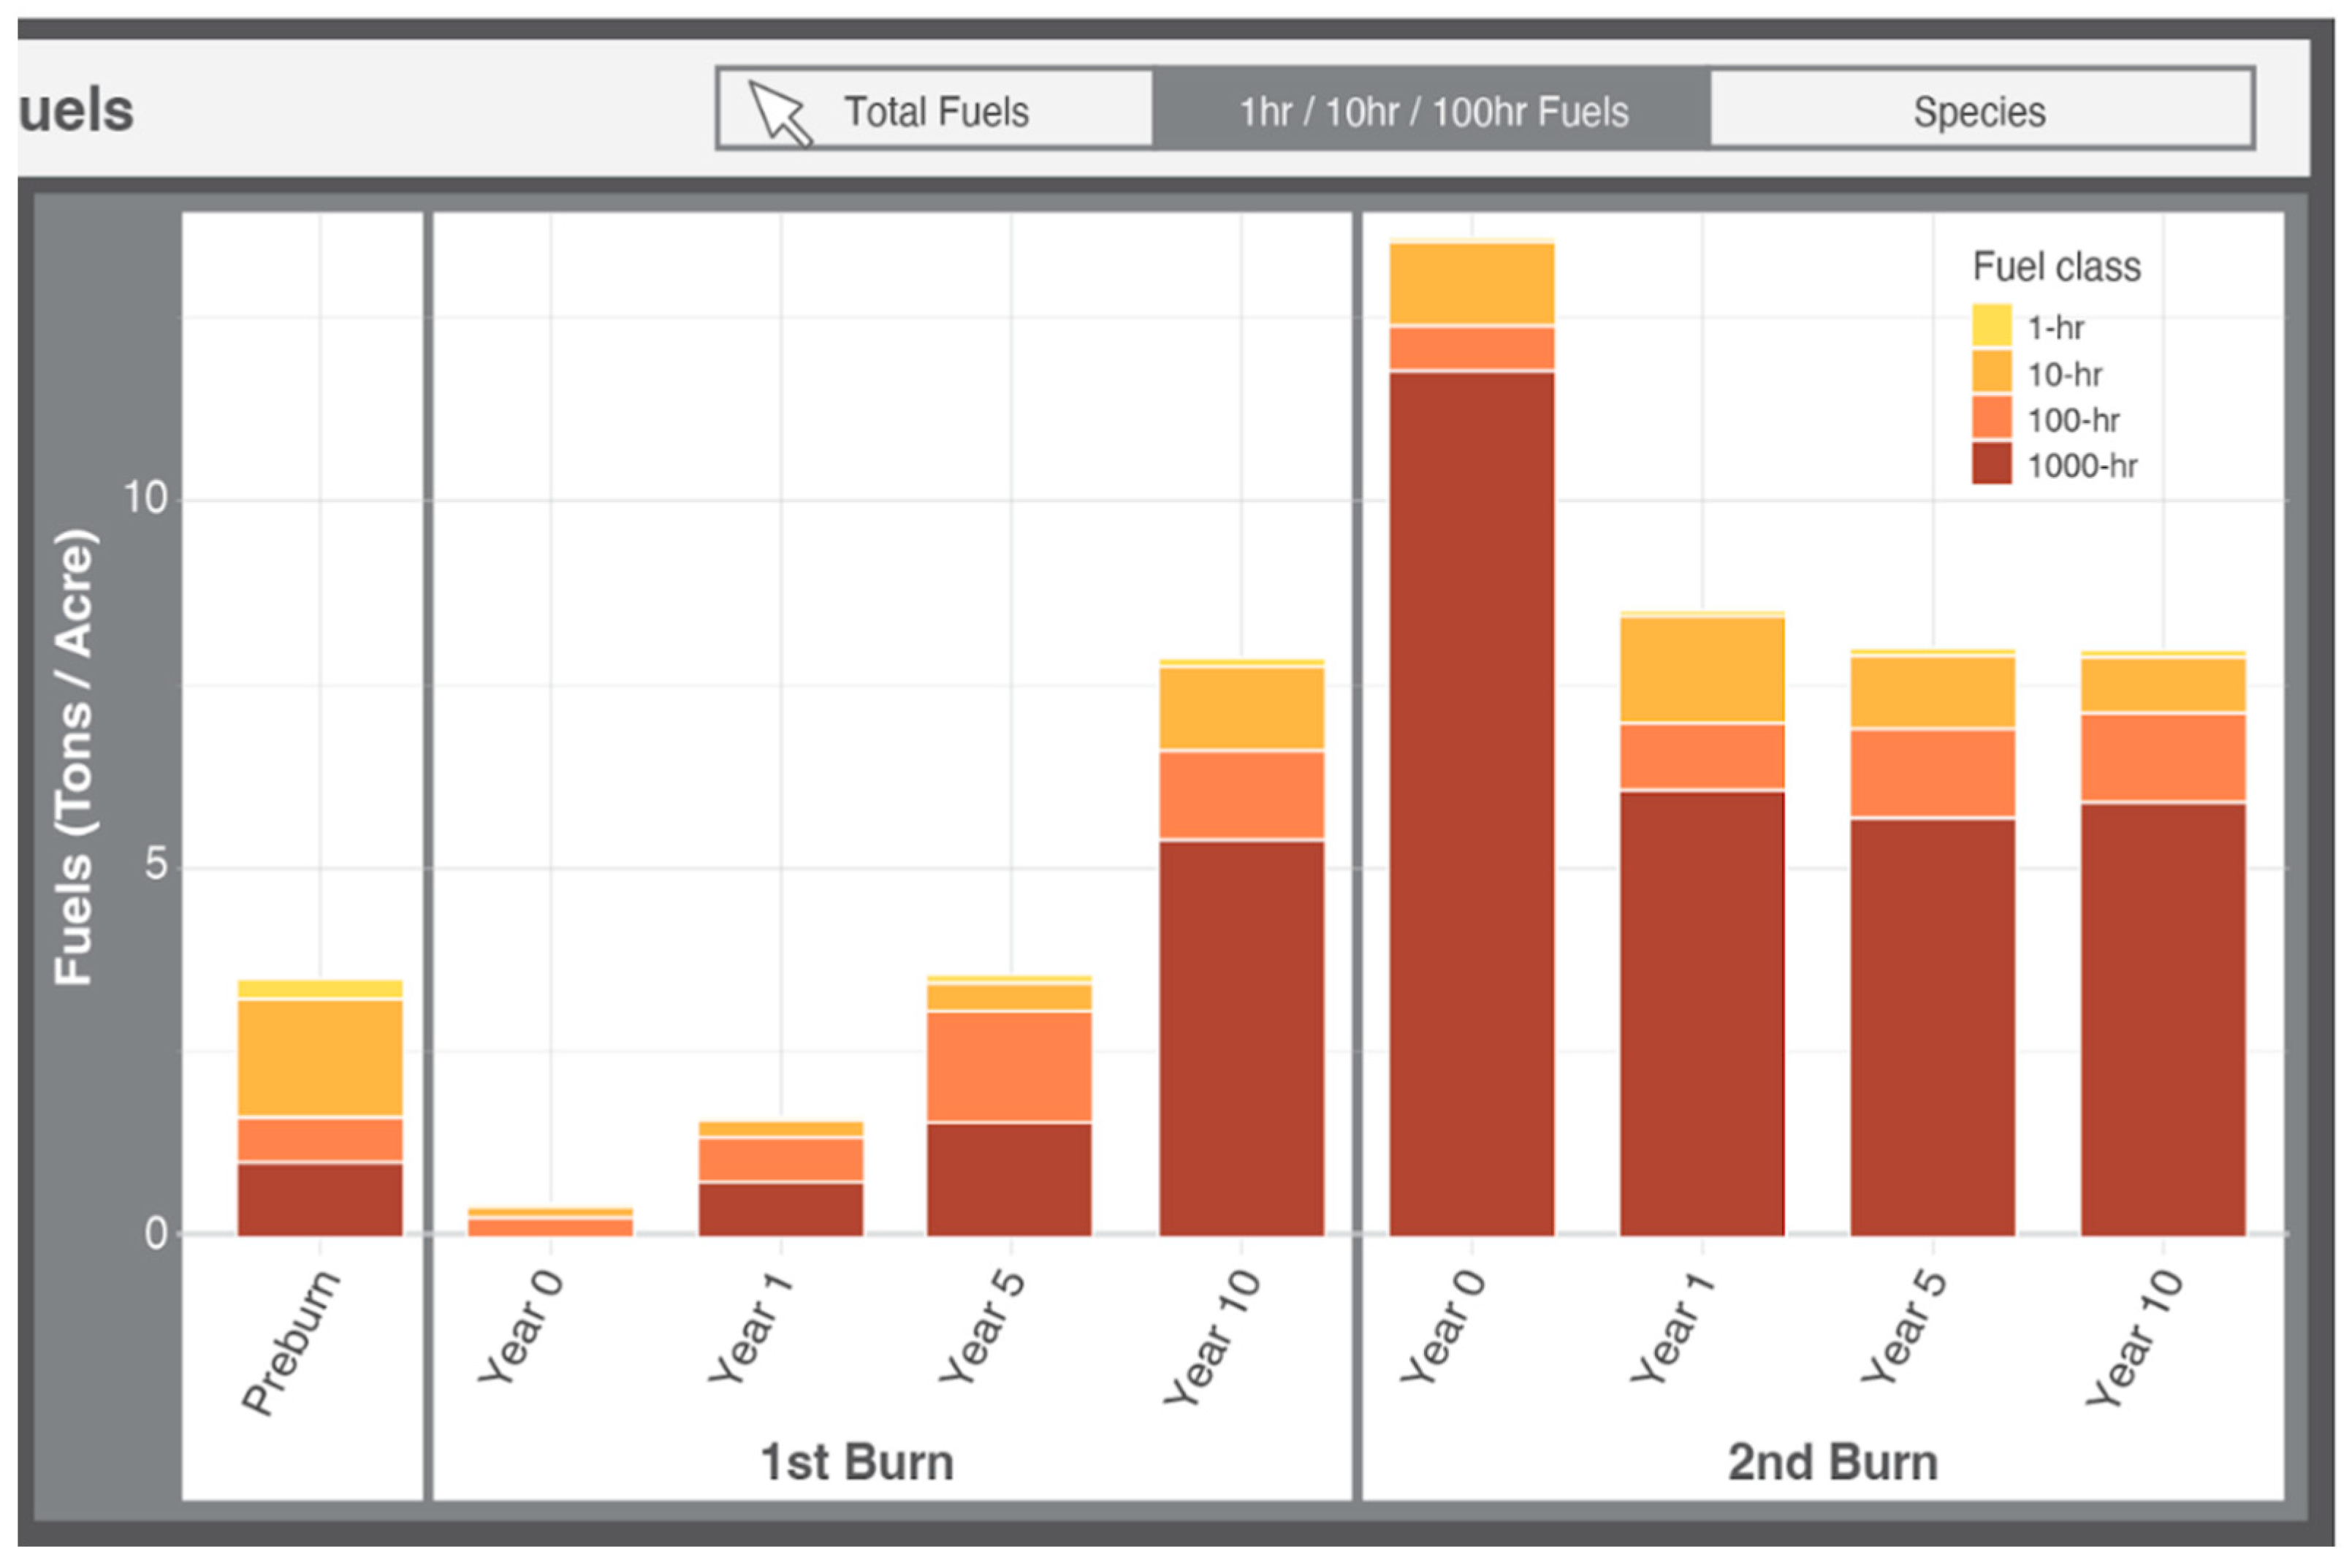
In addition to total fuels, comprehensive fuels management planning requires understanding the proportion of 1-hr (<0.25-inch diameter), 10-hr (0.25–1 inch diameter), 100-hr (1–3 inches diameter), and 1000-hr (>3 inches) fuels within a plot. Generally, litter and duff are minimally present in these systems, and so, these categories are not included as individual components of the dashboard to support fuels management decisions but are represented in total fuels (Figure 4). Across the plots, 10-hr, 100-hr, and 1000-hr fuels tend to dominate (Figure 5).
All fuel classes generally increase with time since the first burn, but fuel loads respond more variably to the second burn. For instance, 1-hr fuels, composed of the finest fuels such as pine needles, often do not exceed a half ton per acre at any monitoring status and, for this example, are nearly eliminated following a single burn (Figure 5). Each burn typically reduces 1-hr fuel loads to a minimum immediately post-burn, but rarely do fuel classes decrease to zero. A proportion of 10-hr, 100-hr, and 1000-hr fuels are typically not consumed during prescribed fires, and in this example, 1000-hr fuel loads increase immediately post-burn and remain elevated above pre-burn and post-entry burn levels (Figure 5). This presents an important consideration for managers, as second burns may result in more variable fuel class outcomes, including increases in total fuel loading, that require revising management objectives that were originally designed for entry burns and/or additional targeted fuels mitigation contingent on fire severity in locations that have burned more than once. Dashboard users may also examine these data by monitoring type or any selection of plots, which provides aggregated insights for specified areas of RMNP and allows them to understand which plots or monitoring types may deviate from expected behavior within different fuel classes. For example, the amount of each individual fuel class and relative proportions at each post-burn monitoring status depends largely on fire severity and provides important context for fuels management planning.

2.3.3. Species Composition by Forest Vegetation Layer

Forest species composition is also collected within these long-term monitored plots. Forest composition data includes trees, shrubs, and herbaceous species; 13 tree and 325 herbaceous species have been recorded in over 28 years of data collection in RMNP. Tree species are recorded across different size-age classes (mature (2.5 cm DBH) or young (<2.5 cm DBH)) and trees and shrubs are documented as live or dead [35]. Herbaceous species data are collected as a fraction of ground cover. The forest species data complements fuel measurement data in two main ways. First, different forest species are associated, on average, with greater or less fuel loading (e.g., PICM-dominated plots have more total fuels than ARTR plots; Figure 4), and so, understanding past and present species composition and response to fire allows resource managers to estimate future composition. Second, proportion of living and dead biomass by species and age class helps quantify the anticipated immediate contributions to fuel loads from fire (i.e., previous fires resulted in some proportion of mortality of a species that may contribute to dead and downed fuels), and it can also indirectly capture species-specific impacts from other disturbances (e.g., bark beetle).
Species composition data is viewed on a per plot basis, given the considerable variability in trees and ground cover, even within the same monitoring type. For each monitoring status for a given species, the basal area of mature (reproductive age) trees and the numbers of living and dead young trees are tallied and shown. The nine most prevalent ground covers are shown, with additional ground covers grouped into ‘other’ (Figure 6). This example dashboard view provides an in-depth review of a single plot, though these data can be visualized in the aggregate to better understand broader patterns in species composition post-fire.
In a representative plot (PIPO10), ponderosa pine and Douglas fir made up a relatively equal proportion of pre-burn young trees, and both species experienced high mortality rates (~50%) following the entry burn (Figure 6). The relative proportion of young, dead trees for both species continued to increase up to the second year following the entry burn, with more dead trees than live trees. Two years following the entry burn, young, live Douglas firs decline to zero and are not observed again (n = 3) until year 10 post-entry burn. Young ponderosa pines follow a similar trajectory but do not ever disappear and rebound (n = 6) in the fifth year post-entry burn. Regenerating young ponderosa pines then considerably outnumber Douglas firs in year 10 (~10:1) and year 15 (~14:1). The same general patterns are observed following the second burn, though both ponderosa pines and Douglas firs regenerate faster (by year 5) and in greater numbers compared to the entry burn (Douglas fir: 3 versus 0, ponderosa pine: 55 versus 4). Regeneration following the second burn strongly favors ponderosa pines, which require only 10 years to reach the same counts observed 15 years following the entry burn. There is less diversity among mature tree species in PIPO10 than either young trees or ground cover, which is consistent with the expected composition of western montane mid- and overstory [51,52]. After the immediate effects of the entry burn, basal area by species varies relatively little. Accompanying aerial imagery from the dashboard web map suggests this plot may contain areas of more open ponderosa savannah with lower fuel loads, where prescribed fire may have a lesser effect on fire-adapted overstory trees (Figure 6).
The nine dominant ground cover types comprise >75% of the plot prior to the entry burn and less than <50% 10 years following the second burn (Figure 6). Despite this decline, the relative proportions of the nine most common ground cover types remain similar across monitoring statuses, with the notable exceptions of decreased litter and increased wood. Decreased litter composition is a function of litter being consumed during a fire, though, litter can often ‘rebound’ within a few years. The persistent reduction in litter is likely attributable to the more open ponderosa savannah monitoring type that generally produces and maintains less litter than other monitoring types. As litter decreases following two fires, the proportion of wood increases, which may bed indicative of small tree post-fire mortality or branches lost from large trees that contribute to increased 1-hr and 10-hr fuels. This information combined with live/dead counts in mature and young trees and the fuel loading information could suggest where thinning or pile burning may be necessary for additional fuels reduction.
Creating standard visualizations for long-term plot-level data requires an understanding of the data structure and collection methods to avoid misrepresenting the data. For example, both young and mature trees do not display any trees in year 0 following the second burn; however, there are trees present in the monitoring statuses directly before and after. Here, a zero value indicates no data were collected at this monitoring status, but within these data, it is possible that a zero value is a true measurement of tree count or basal area, and not an absence of data. So, complementary to the dashboard, there is a user guide that documents these important concepts for accurate data interpretation. Even with rigorous database QAQC and documentation, errors still occur; though, making these monitoring data accessible for use and analysis through the dashboard may help to detect and decrease future errors. We are working alongside resource managers to flag inconsistent or erroneous data and then either remove the appropriate records during the automated QAQC or develop a method to estimate data values when needed.

3. Forest Management with TFFD

Using the TFDD for resource management in RMNP presents four main benefits: (1) custom visualizations help to streamline annual reporting by reducing the amount of time NPS staff spend on data formatting and generating graphics; (2) collaboratively developed summary statistics facilitate planning and justification of resource management actions by enabling quick comparisons of plot conditions and fuel and species outcomes from prior treatments; (3) aids in the development and refinement of climate-adaptive management actions given the long-term data available across a variety of monitoring types; and (4) increases partner and collaborator access to publicly funded data beyond users who are familiar with database queries and data processing (Figure 2). We designed the dashboard for a range of uses, from supporting the design of adaptive forest management planning to communicating fuel trends that may be used to substantiate management decisions and requesting funding. Furthermore, this dashboard complements the invaluable experience of resource managers and can help to perpetuate and share local and institutional knowledge. As eventual agency turnover occurs, a standardized, shareable dashboard provides a consistently maintained tool that can quickly summarize observational insights to help scale adaptive management, such as the pre- and post-conditions of fuel loading and forest conditions relative to fire, thinning, and other disturbance events.
These monitoring plots are designed to be representative samples of their surrounding forested landscapes, and so the information and inferences gained from the dashboard extend beyond that of an individual or group of plots to managing the continuum of different forest conditions across the landscape. The monitoring plots and their longitudinal forest fuels and species data provide the finest resolution information regarding outcomes of prescribed fire use and forest succession in RMNP. While fire effects are highly variable, this data can be used alongside other federal data sources and remotely sensed information to further understand past and expected forest change in response to prescribed fire and other environmental factors. Below are several example use cases.
The relative proportions of 1-hr, 10-hr, 100-hr, and 1000-hr fuels can serve as an important indicator of broader forest dynamics beyond that of fire effects (Figure 5). Rapid Assessment plots, for which monitoring does not solely revolve around prescribed fire occurrence, may have several (i.e., five or six) pre-burn or post-treatment measurements allowing fuel managers to track fuel class behavior through time, independent of fire. These scenarios present opportunities to link plot-based fuel class data to broader forest conditions. For example, monitoring plots affected by mountain pine beetles may offer empirical observations of fuel class loadings through the multiple stages of beetle infestation. Mortality due to pine beetles is expected to subsequently increase surface fuels as the time-since-outbreak increases; however, surface fuel class dynamics vary based on the severity of an outbreak, monitoring type, and other disturbances [53]. These long-term, in situ observations provide a baseline for the variability in how beetle outbreaks may affect surface fuels, and ultimately, can assist in assessing fire risk and spread as inputs to fire models simulating different weather and fuel conditions.
In addition to informing simulation-based fire spread models, these plot-level data are broadly useful for calibrating and validating remotely sensed data, such as lidar or satellite observations. For example, linking aerial observations of beetle mortality or prescribed fire with plot-level data allows managers to quantify the anticipated fuel loading and mortality outcomes based on aerial surveys that can cover larger spatial extents than plot-based monitoring protocols (Figure 4 and Figure 5). In the case of satellite observations, tree mortality and fuel loading post-fire (prescribed fire or wildfire) can be coupled with Difference Normalized Burn Ratio (dNBR) to develop relationships between satellite-observed dNBR values and plot-level outcomes (Figure 6) [54,55]. Field-based observations are imperative for understanding ecosystem composition when few or no remote sensing products or alternative data collection methods can capture the same information. This is often true when observing ecosystem composition, particularly of forest under- or midstory species, as these are difficult to glean from most readily available remotely sensed products.
Available field data to characterize understory and midstory information is critical for landscape-scale fuels management. Data collection to better quantity fire effects and forest successional patterns has implications for wildfire risk to public safety, invasive species management, and overall ecological function. Fire and fuels managers work to plan, execute, and assess fuels treatments (burning, thinning, spraying, etc.) and are mandated to adaptively manage public lands while prioritizing public safety and ecological function. For example, limiting overstory mortality is a common objective of prescribed fire treatments for which the ‘Species’ panel of the dashboard (Figure 6) allows managers to distill years’ worth of data across multiple plots and burns to quickly assess the success or failure rate of this objective. High overstory mortality rates can lead to increased surface fuel loads in the near-term, and long-term, higher total fuel loads occur due to dead and downed trees. If the rate of overstory mortality is consistently too high (across multiple plots, monitoring types, and burns), this may warrant revising the management objectives or altering parameters of the treatment (timing, seasonality, preparation, etc.), as increasing fuel loads can directly contribute to increased wildfire risk. These data facilitate adaptive planning for where and how fuel treatments should occur on the landscape, as these objectives are designed to maximize safety, ecosystem function, and long-term investment in public lands.

3.1. Support for Adaptive Management

NPS is mandated to adaptively manage public resources, and therefore must establish objectives or benchmarks and evaluate progress and landscape outcomes relative to those objectives. Consistent, reliable monitoring data are necessary to evaluate and adjust management objectives for adaptively stewarding public resources. The adaptive management process includes six phases—Assess, Design, Implement, Monitor, Evaluate, and Adjust—and this dashboard helps facilitate the Monitor, Evaluate, and Adjust steps within this cycle [56]. Continued development of the dashboard will allow managers to spatially assess where treatments met or did not meet established objectives. The evaluation and relative success rate of a given treatment may lead to a revised objective. For example, managers can shorten or extend the time horizon over which an objective must be met (e.g., following a single or multiple burns), identify when new objectives and their respective benchmarks are needed (e.g., when to shift from entry burn to maintenance burn objectives), increase or decrease a benchmark value for a given objective (e.g., tons per acre of fuels) relative to observed data, or change how data categories are aggregated to measure objectives (e.g., developing unique objectives for individual invasive species versus all invasives in aggregate). Monitoring is essential for understanding the effectiveness of treatments, but it is equally critical for avoiding unintended or adverse ecosystem impacts [57]. In short, adaptive fire and fuels management practices at RMNP benefit from this long-term fuel and forest dataset for monitoring, evaluating, and adjusting management strategies.
Rocky Mountain National Park has developed adaptive management plans for a variety of resources and their respective disturbances, including bark beetles, elk and vegetation, exotic plants, fire, recreation, and vegetation restoration. Each of these interconnected aspects of ecosystem management are susceptible to both pulse and press events and require baseline in situ data observations before, during, and after an event. The data under-pinning the dashboard are immediately useful for tracking pulse event outcomes, such as those from wildfire or windthrow that would alter mature and young tree composition and fuel loading, while it may take years or even decades for these data to help resolve the impacts from press events, such as drought, that may affect longer-term mortality and regeneration trends. Specifically, in the case of beetle infestations, patterns of mortality and fuel loading change through time and may vary based on forest community and condition [53].
The RMNP in situ long-term monitoring effort to support adaptive fire and fuels management is not operating in isolation. Adjacent to RMNP, more than 50 USFS Forest Inventory and Analysis (FIA) plots exist along with 21 plots monitored by the Colorado Forest Restoration Institute and additional plots monitored by the Colorado Front Range Collaborative Forest Landscape Restoration Project [58,59,60]. While integrating data across observational protocols is challenging, it is important we work to leverage commonalities across available in situ data, from local to regional scales. Together, field-based observations are a critical component of adaptive management and inform how we resist, adapt, or direct future change.

3.2. Improvements, Limitations, and Future Use

Possible dashboard improvements are highlighted below; however, this work has some important limitations. The 80+ monitoring plots do not represent the entirety of the park and offer a small network of observations, compared to what may be optimal for landscape-scale decision making. Additionally, these plots are exposed to numerous environmental factors (e.g., wind, drought, insects, disease) beyond the treatment of prescribed fire or thinning, so isolating the effects of treatments on fuel and forest trends is impossible. Having a larger number of plots on the ground could help us tease out specific effects. Finally, attributes that characterize a treatment (e.g., fire intensity) are not included, as these are not yet available in a standardized format within the FFI database. Acknowledging these limitations, we designed the dashboard to be updated as plots are added and additional information on environmental and treatment characteristics are further integrated into decision making.
The dashboard is shareable both within RMNP and with external collaborators, allowing other NPS divisions, such as interpretation and education and outreach, the opportunity to leverage these data. As FFI and RA monitoring programs exist at numerous NPS-managed locations, a logical extension of this effort at RMNP would be to scale the data integration and dashboard design to include nearby sites. A regional pilot including nearby parks, such as the Dinosaur National Monument, could serve as the foundation for a nationally hosted dashboard; however, improvements to database access and infrastructure improvements would likely be necessary to support a national dashboard. Namely, a national-scale dashboard would require upgrading the data updates and integration, such as using AGOL’s Data Pipeline workflows [61]. An upgraded AGOL workflow could support more efficient database-to-dashboard updates, limit human-introduced errors, and allow data to be incorporated from both local and cloud-based data sources on a predetermined schedule. The web-based Data Pipeline interface minimizes the amount of coding needed to automate workflows, and the ability to schedule tasks and updates would reduce the time from field data collection to management insights. Decreasing the lag time between when field data are collected and made available could increase the relevance and use of this long-term monitoring dataset for a variety of decision support applications.
An important consideration for future development using the AGOL Data Pipeline is the reliance on AGOL’s continued support of these different features and technologies for data integration and any incompatibilities that may emerge between direct linkages of federal databases to external data workflows. Important considerations for the tradeoffs and limitations of scaling up the dashboard include weighing the capability and complexity of the system with the commitment to continued maintenance and sustained support for the product and user base. Even without incorporating more parks and scaling up, RMNP staff can easily gain additional utility from the current dashboard as all data inputs and configuration are modifiable by any NPS-affiliated AGOL account granted permissions to access the dashboard. The opportunity to add or modify functionality within the dashboard means the ability to include new visualizations for annual reporting or incorporate additional data related to the long-term monitoring plots so that this tool can evolve with the needs of the end users.

4. Conclusions

The collaborative development of the TFFD and the on-demand data visualizations designed to support required management and reporting helps NPS staff to capitalize on the value of the FFI and RA for long-term monitoring programs. Through improved availability and interactivity with these data, along with the ability to modify and customize summaries, TFFD will assist resource managers to maximize the utility of available fuels and forest composition data. Here, we demonstrate the unique contribution of long-term ecological monitoring data and the importance of coupling these data with complementary, custom tools to support the range of decision-making questions facing practitioners charged with adaptively managing public lands. This can serve as a template for other scientists and managers tasked with streamlining the data-to-decision making workflow that is foundational to informed decision making.

Author Contributions

Conceptualization, K.J. and J.V.; data curation, K.J.; funding acquisition, J.V.; investigation, K.J.; methodology, K.J. and J.V.; project administration, K.J. and J.V.; resources, J.V.; software, K.J.; supervision, K.J. and J.V.; visualization, K.J.; writing—original draft, K.J.; writing—review and editing, K.J. and J.V. All authors have read and agreed to the published version of the manuscript.

Funding

This work was funded by the US National Park Service through the Cooperative Task Agreement ‘Rocky Mountain National Park Assessment of Fire-Effects Monitoring’ (P23AC00790-00).

Data Availability Statement

The raw data supporting the conclusions of this article will be made available by the authors upon request.

Acknowledgments

We sincerely thank the Rocky Mountain National Park staff, Nate Williamson, Hilary Rollins, Shawn Wignall, Christina Fossum, Christopher Kopek, and Lisa Baron, for their time and guidance. We thank Justin Shedd at the National Park Service for facilitating data sharing and other technical assistance. We thank Kate Dean-McKinney, Melissa Gold, and Shannon Jones for their efforts and invaluable assistance with figure design. The findings and conclusions in this publication are those of the authors and should not be construed to represent any official U.S. Government determination or policy.

Conflicts of Interest

The authors declare no conflicts of interest.

References

  1. Forzieri, G.; Girardello, M.; Ceccherini, G.; Spinoni, J.; Feyen, L.; Hartmann, H.; Beck, P.S.A.; Camps-Valls, G.; Chirici, G.; Mauri, A.; et al. Emergent vulnerability to climate-driven disturbances in European forests. Nat. Commun. 2021, 12, 1081. [Google Scholar] [CrossRef]
  2. Roshani; Sajjad, H.; Kumar, P.; Masroor, M.; Rahaman, M.H.; Rehman, S.; Ahmed, R.; Sahana, M. Forest Vulnerability to Climate Change: A Review for Future Research Framework. Forests 2022, 13, 917. [Google Scholar] [CrossRef]
  3. Baker, W.L. Longterm response of disturbance landscapes to human intervention and global change. Landsc. Ecol. 1995, 10, 143–159. [Google Scholar] [CrossRef]
  4. Blanco, J.A.; Lo, Y.-H.; Kimmins, J.P.; Weber, A. Highlighting Complex Long-Term Succession Pathways in Mixed Forests of the Pacific Northwest: A Markov Chain Modelling Approach. Forests 2021, 12, 1770. [Google Scholar] [CrossRef]
  5. Aitken, S.N.; Yeaman, S.; Holliday, J.A.; Wang, T.; Curtis-McLane, S. Adaptation, migration or extirpation: Climate change outcomes for tree populations. Evol. Appl. 2008, 1, 95–111. [Google Scholar] [CrossRef]
  6. Maharjan, S.K.; Sterck, F.J.; Raes, N.; Zhao, Y.; Poorter, L. Climate change induced elevational range shifts of Himalayan tree species. Biotropica 2023, 55, 53–69. [Google Scholar] [CrossRef]
  7. Benner, J.; Lertzman, K. Policy interventions and competing management paradigms shape the long-term distribution of forest harvesting across the landscape. Proc. Natl. Acad. Sci. USA 2022, 119, e2208360119. [Google Scholar] [CrossRef] [PubMed]
  8. Augustynczik, A.L.D.; Gusti, M.; Deppermann, A.; Nakhavali, M.A.; Jia, F.; Di Fulvio, F.; Havlík, P. Adapting forest management to climate change impacts and policy targets in the EU: Insights from the coupled GLOBIOM/G4M-i3PGmiX model. One Earth 2025, 8, 101313. [Google Scholar] [CrossRef]
  9. Murphy, B.A.; Rollinson, C.R.; Dietze, M.C.; Staudhammer, C.L.; VonHedemann, N.R.; Schultz, C.A.; Kleindl, W.J.; Desai, A.R. Insights Into Nature-Based Climate Solutions: Managing Forests for Climate Resilience and Carbon Stability. J. Geophys. Res. Biogeosci. 2025, 130, e2024JG008391. [Google Scholar] [CrossRef]
  10. Ratajczak, Z.; D’Odorico, P.; Collins, S.L.; Bestelmeyer, B.T.; Isbell, F.I.; Nippert, J.B. The interactive effects of press/pulse intensity and duration on regime shifts at multiple scales. Ecol. Monogr. 2017, 87, 198–218. [Google Scholar] [CrossRef]
  11. Ren, L.; Yang, Y.; Wang, H.; Wang, P.; Yue, X.; Liao, H. Widespread Wildfires Over the Western United States in 2020 Linked to Emissions Reductions During COVID-19. Geophys. Res. Lett. 2022, 49, e2022GL099308. [Google Scholar] [CrossRef]
  12. Mitton, J.B.; Ferrenberg, S.M. Mountain Pine Beetle Develops an Unprecedented Summer Generation in Response to Climate Warming. Am. Nat. 2012, 179, E163–E171. [Google Scholar] [CrossRef] [PubMed]
  13. Herms, D.A.; McCullough, D.G. Emerald Ash Borer Invasion of North America: History, Biology, Ecology, Impacts, and Management. Annu. Rev. Entomol. 2014, 59, 13–30. [Google Scholar] [CrossRef]
  14. Alexander, J.; Lee, C.A. Lessons Learned from a Decade of Sudden Oak Death in California: Evaluating Local Management. Environ. Manag. 2010, 46, 315–328. [Google Scholar] [CrossRef]
  15. Harwood, T.D.; Tomlinson, I.; Potter, C.A.; Knight, J.D. Dutch elm disease revisited: Past, present and future management in Great Britain. Plant Pathol. 2011, 60, 545–555. [Google Scholar] [CrossRef]
  16. Ansari, R.A.; Esimaje, T.; Ibrahim, O.M.; Mulrooney, T. Analysis of Forest Change Detection Induced by Hurricane Helene Using Remote Sensing Data. Forests 2025, 16, 788. [Google Scholar] [CrossRef]
  17. Turner, M.G.; Baker, W.L.; Peterson, C.J.; Peet, R.K. Factors Influencing Succession: Lessons from Large, Infrequent Natural Disturbances. Ecosystems 1998, 1, 511–523. [Google Scholar] [CrossRef]
  18. Dale, V.H.; Joyce, L.A.; Mcnulty, S.; Neilson, R.P.; Ayres, M.P.; Flannigan, M.D.; Hanson, P.J.; Irland, L.C.; Lugo, A.E.; Peterson, C.J.; et al. Climate Change and Forest Disturbances. BioScience 2001, 51, 723. [Google Scholar] [CrossRef]
  19. Brockerhoff, E.G.; Barbaro, L.; Castagneyrol, B.; Forrester, D.I.; Gardiner, B.; González-Olabarria, J.R.; Lyver, P.O.; Meurisse, N.; Oxbrough, A.; Taki, H.; et al. Forest biodiversity, ecosystem functioning and the provision of ecosystem services. Biodivers. Conserv. 2017, 26, 3005–3035. [Google Scholar] [CrossRef]
  20. Lindenmayer, D.B. Forest Wildlife Management and Conservation. Ann. N. Y. Acad. Sci. 2009, 1162, 284–310. [Google Scholar] [CrossRef]
  21. Sedjo, R.; Sohngen, B. Carbon Sequestration in Forests and Soils. Annu. Rev. Resour. Econ. 2012, 4, 127–144. [Google Scholar] [CrossRef]
  22. Bachinger, M.; Mattivi, A.; Hilmer, P.; Karim, A.A. Recreation in Forests: Implications for Tourism Product Development Based on the Analysis of Terpenes in Two Forest Types. In Nature-Based Tourism and Wellbeing; Niccolini, F., Barborak, J.R., Azara, I., Michopoulou, E., Cavicchi, A., Eds.; CABI: Wallingford, UK, 2024; pp. 158–173. ISBN 978-1-80062-139-8. [Google Scholar]
  23. Tague, C.L.; Moritz, M.; Hanan, E. The changing water cycle: The eco-hydrologic impacts of forest density reduction in Mediterranean (seasonally dry) regions. WIREs Water 2019, 6, e1350. [Google Scholar] [CrossRef]
  24. Ferretti, M.; Gessler, A.; Cools, N.; Fleck, S.; Guerrieri, R.; Jakovljević, T.; Nicolas, M.; Nieminen, T.M.; Pitar, D.; Potočić, N.; et al. Perspectives: Resilient forests need joint forces for better inventorying and monitoring. For. Ecol. Manag. 2024, 561, 121875. [Google Scholar] [CrossRef]
  25. Ferretti, M.; Fischer, C.; Gessler, A.; Graham, C.; Meusburger, K.; Abegg, M.; Bebi, P.; Bergamini, A.; Brockerhoff, E.G.; Brunner, I.; et al. Advancing forest inventorying and monitoring. Ann. For. Sci. 2024, 81, 6. [Google Scholar] [CrossRef]
  26. Lindenmayer, D.B.; Lavery, T.; Scheele, B.C. Why We Need to Invest in Large-Scale, Long-Term Monitoring Programs in Landscape Ecology and Conservation Biology. Curr. Landsc. Ecol. Rep. 2022, 7, 137–146. [Google Scholar] [CrossRef]
  27. Lindenmayer, D.B.; Likens, G.E. The science and application of ecological monitoring. Biol. Conserv. 2010, 143, 1317–1328. [Google Scholar] [CrossRef]
  28. Lindenmayer, D.B.; Likens, G.E.; Andersen, A.; Bowman, D.; Bull, C.M.; Burns, E.; Dickman, C.R.; Hoffmann, A.A.; Keith, D.A.; Liddell, M.J.; et al. Value of long-term ecological studies. Austral Ecol. 2012, 37, 745–757. [Google Scholar] [CrossRef]
  29. Anderson-Teixeira, K.J.; Davies, S.J.; Bennett, A.C.; Gonzalez-Akre, E.B.; Muller-Landau, H.C.; Joseph Wright, S.; Abu Salim, K.; Almeyda Zambrano, A.M.; Alonso, A.; Baltzer, J.L.; et al. CTFS -Forest GEO: A worldwide network monitoring forests in an era of global change. Glob. Change Biol. 2015, 21, 528–549. [Google Scholar] [CrossRef]
  30. Schuurman, G.W.; Cole, D.N.; Cravens, A.E.; Covington, S.; Crausbay, S.D.; Hoffman, C.H.; Lawrence, D.J.; Magness, D.R.; Morton, J.M.; Nelson, E.A.; et al. Navigating Ecological Transformation: Resist–Accept–Direct as a Path to a New Resource Management Paradigm. BioScience 2022, 72, 16–29. [Google Scholar] [CrossRef]
  31. Williams, B.K.; Brown, E.D. Managing ecosystems with resist–accept–direct (RAD). Methods Ecol. Evol. 2024, 15, 796–805. [Google Scholar] [CrossRef]
  32. Bennetts, R.; Chambers, N.; Comiskey, J.; James, K.; Lawler, J.; Legg, K.; Matthews, E.; Mazzu, L.; Ohms, R.; Schreier, C.; et al. Integration of Science and Park Management: A Framework for Partnership; National Park Service: Fort Collins, CO, USA, 2016. [Google Scholar]
  33. Fancy, S.G.; Bennetts, R.E. Institutionalizing an effective long-term monitoring program in the US National Park Service. In Design and Analysis of Long-Term Ecological Monitoring Studies, 1st ed.; Gitzen, R.A., Millspaugh, J.J., Cooper, A.B., Licht, D.S., Eds.; Cambridge University Press: Cambridge, UK, 2012; pp. 481–497. ISBN 978-0-521-19154-8. [Google Scholar]
  34. National Park Service. Most Common Vital Signs. 2025. Available online: https://www.nps.gov/im/monitoring.htm (accessed on 16 September 2025).
  35. USDI National Park Service. Fire Monitoring Handbook; Fire Management Program Center, National Interagency Fire Center: Boise, ID, USA, 2003; p. 274. [Google Scholar]
  36. Downing, W.M.; Dunn, C.J.; Thompson, M.P.; Caggiano, M.D.; Short, K.C. Human ignitions on private lands drive USFS cross-boundary wildfire transmission and community impacts in the western US. Sci. Rep. 2022, 12, 2624. [Google Scholar] [CrossRef]
  37. Lovett, G.M.; Burns, D.A.; Driscoll, C.T.; Jenkins, J.C.; Mitchell, M.J.; Rustad, L.; Shanley, J.B.; Likens, G.E.; Haeuber, R. Who needs environmental monitoring? Front. Ecol. Environ. 2007, 5, 253–260. [Google Scholar] [CrossRef]
  38. Murray, D.L.; Krebs, C.J. Editorial: Long-term monitoring in ecology and evolution: Establishing a sound baseline to help inform our future. Front. Ecol. Evol. 2024, 12, 1469489. [Google Scholar] [CrossRef]
  39. Lindenmayer, D. Why is long-term ecological research and monitoring so hard to do? (And what can be done about it). Aust. Zool. 2018, 39, 576–580. [Google Scholar] [CrossRef]
  40. Ramachandran, R.; Bugbee, K.; Murphy, K. From Open Data to Open Science. Earth Space Sci. 2021, 8, e2020EA001562. [Google Scholar] [CrossRef]
  41. McCord, S.E.; Pilliod, D.S. Adaptive monitoring in support of adaptive management in rangelands. Rangelands 2022, 44, 1–7. [Google Scholar] [CrossRef]
  42. Schoennagel, T.; Veblen, T.T.; Romme, W.H. The Interaction of Fire, Fuels, and Climate across Rocky Mountain Forests. BioScience 2004, 54, 661. [Google Scholar] [CrossRef]
  43. Daly, C.; Halbleib, M.; Smith, J.I.; Gibson, W.P.; Doggett, M.K.; Taylor, G.H.; Curtis, J.; Pasteris, P.P. Physiographically sensitive mapping of climatological temperature and precipitation across the conterminous United States. Int. J. Climatol. 2008, 28, 2031–2064. [Google Scholar] [CrossRef]
  44. National Park Service. Summary of Visitor Use By Month and Year (1979–Last Calendar Year), Integrated Resource Management Applications. 2025. Available online: https://irma.nps.gov/Stats/SSRSReports/Park%20Specific%20Reports/Overnight%20Stays%20(1979%20-%20Last%20Calendar%20Year)?Park=ROMO (accessed on 10 August 2025).
  45. Radeloff, V.C.; Helmers, D.P.; Mockrin, M.H.; Carlson, A.R.; Hawbaker, T.J.; Martinuzzi, S. The 1990–2020 Wildland-Urban Interface of the Conterminous United States—Geospatial Data, 4th ed.; Forest Service Research Data Archive: Fort Collins, CO, USA, 2022. [Google Scholar] [CrossRef]
  46. Cumming, G.S.; Cumming, D.H.M.; Redman, C.L. Scale Mismatches in Social-Ecological Systems: Causes, Consequences, and Solutions. Ecol. Soc. 2006, 11, art14. [Google Scholar] [CrossRef]
  47. National Park Service. State of the Park Report for Rocky Mountain National Park; National Park Service: Washington, DC, USA, 2017. [Google Scholar]
  48. Wickham, H.; François, R.; Henry, L.; Müller, K.; Vaughan, D. dplyr: A Grammar of Data Manipulation. 2023. Available online: https://CRAN.R-project.org/package=dplyr (accessed on 9 September 2025).
  49. Wickham, H. stringr: Simple, Consistent Wrappers for Common String Operations. 2023. Available online: https://CRAN.R-project.org/package=stringr (accessed on 9 September 2025).
  50. Pebesma, E.; Bivand, R. Spatial Data Science: With Applications in R; Chapman and Hall/CRC: Boca Raton, FL, USA, 2023. [Google Scholar] [CrossRef]
  51. Hagmann, R.K.; Franklin, J.F.; Johnson, K.N. Historical structure and composition of ponderosa pine and mixed-conifer forests in south-central Oregon. For. Ecol. Manag. 2013, 304, 492–504. [Google Scholar] [CrossRef]
  52. Stephens, S.L.; Lydersen, J.M.; Collins, B.M.; Fry, D.L.; Meyer, M.D. Historical and current landscape-scale ponderosa pine and mixed conifer forest structure in the Southern Sierra Nevada. Ecosphere 2015, 6, 1–63. [Google Scholar] [CrossRef]
  53. Simard, M.; Romme, W.H.; Griffin, J.M.; Turner, M.G. Do mountain pine beetle outbreaks change the probability of active crown fire in lodgepole pine forests? Ecol. Monogr. 2011, 81, 3–24. [Google Scholar] [CrossRef]
  54. Picotte, J.J.; Cansler, C.A.; Kolden, C.A.; Lutz, J.A.; Key, C.; Benson, N.C.; Robertson, K.M. Determination of burn severity models ranging from regional to national scales for the conterminous United States. Remote Sens. Environ. 2021, 263, 112569. [Google Scholar] [CrossRef]
  55. Ross, C.W.; Loudermilk, E.L.; Flanagan, S.A.; Snitker, G.; Hiers, J.K.; O’Brien, J.J. Wildfire Severity Reduction Through Prescribed Burning in the Southeastern United States. Sustainability 2025, 17, 6230. [Google Scholar] [CrossRef]
  56. Willliams, B.K.; Szaro, R.C.; Shapiro, C.D. Adaptive Management: The U.S. Department of the Interior Technical Guide; Adaptive Management Working Group; U.S. Department of the Interior: Washington, DC, USA, 2009. [Google Scholar]
  57. Hutto, R.L.; Belote, R.T. Distinguishing four types of monitoring based on the questions they address. For. Ecol. Manag. 2013, 289, 183–189. [Google Scholar] [CrossRef]
  58. Gray, A.; Brandeis, T.; Shaw, J.; McWilliams, W.; Miles, P. Forest Inventory and Analysis Database of the United States of America (FIA). Biodivers. Ecol. 2012, 4, 225–231. [Google Scholar] [CrossRef]
  59. Aplet, G.H.; Mckinley, P.S. A portfolio approach to managing ecological risks of global change. Ecosyst. Health Sustain. 2017, 3, e01261. [Google Scholar] [CrossRef]
  60. Morici, K.M.; Wolk, B.H.; Cheng, A.S.; Cannon, J.B.; Williams, E.C.; Caggiano, M.D.; Brown, H.; Hoffman, C.M. Colorado Wildfire Risk Reduction Grant Final Report; Colorado Forest Restoration Institute, Colorado State University: Fort Collins, CO, USA, 2019; p. 23. [Google Scholar]
  61. ESRI Introduction to ArcGIS Data Pipelines. ArcGIS Data Pipelines. 2025. Available online: https://doc.arcgis.com/en/data-pipelines/latest/get-started/about-data-pipelines.htm (accessed on 10 August 2025).
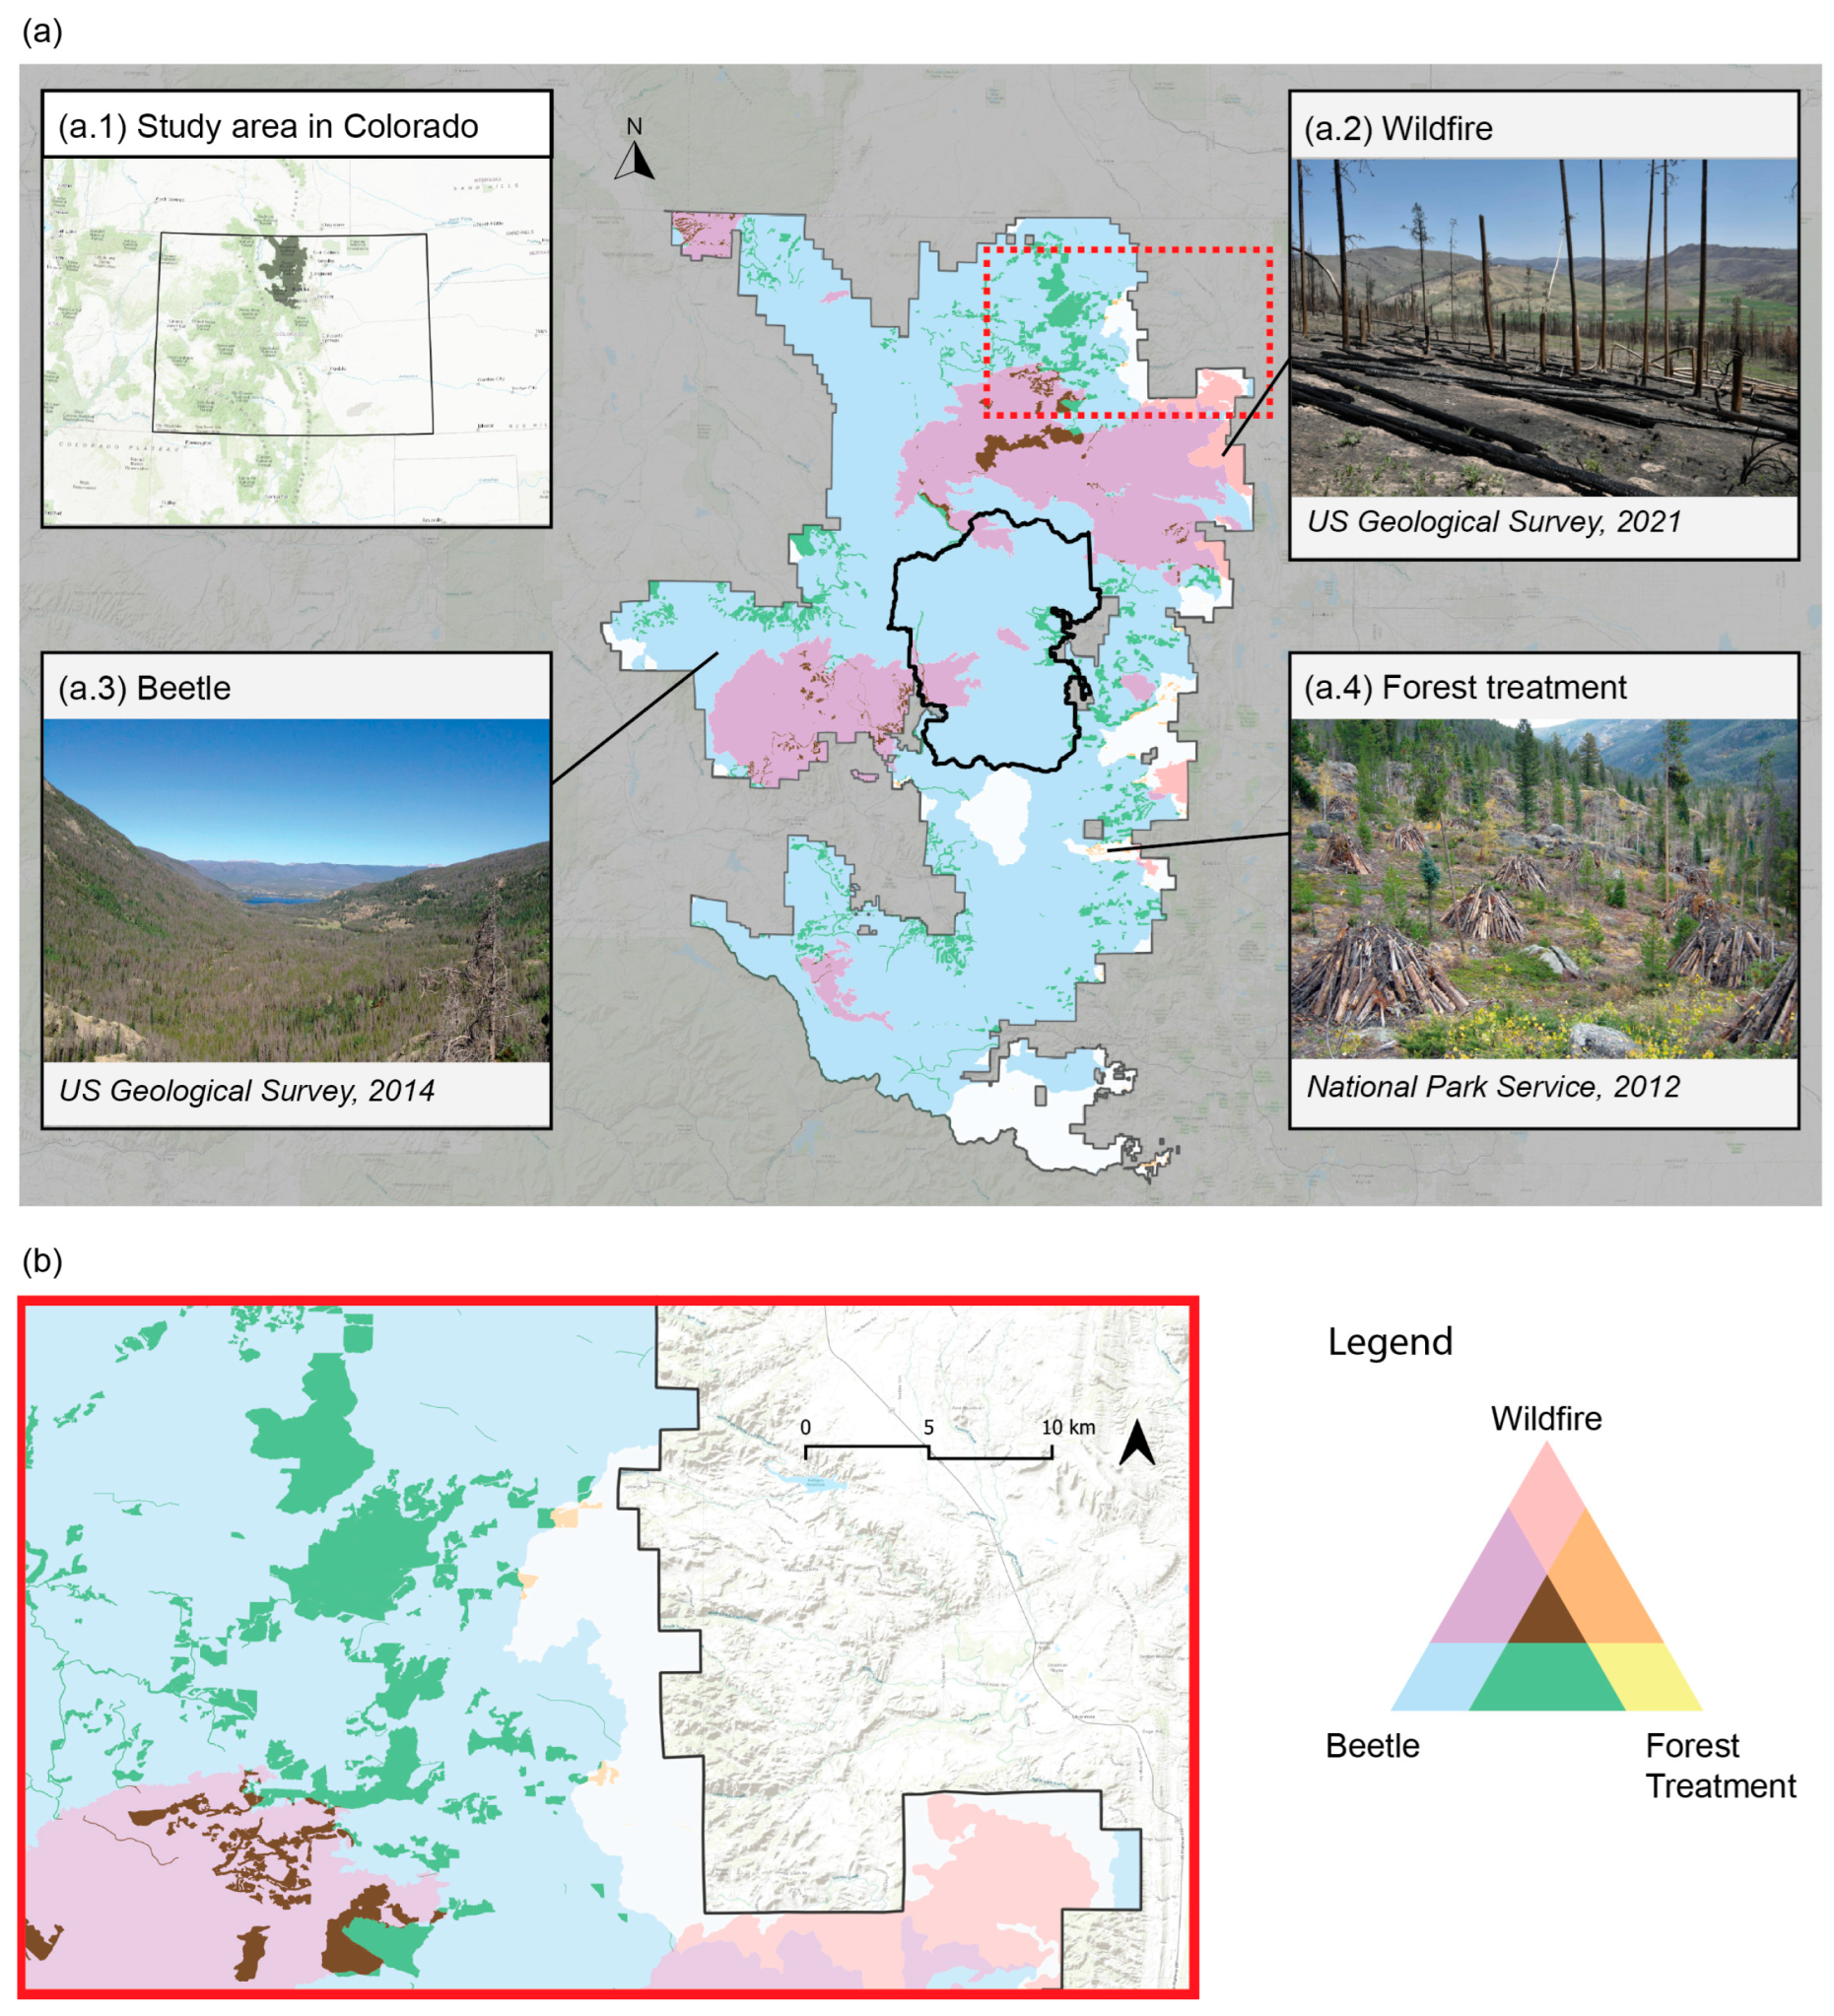
Figure 1. Study area boundary (gray line) includes Rocky Mountain National Park (black line) and all adjacent lands managed by the US Forest Service in the state of Colorado ((a.1) Sources: Esri, HERE, Garmin, Intermap, increment P Corp., GEBCO, USGS, FAO, NPS, NRCAN, GeoBase, IGN, Kadaster NL, Ordnance Survey, Esri Japan, METI, Esri China (Hong Kong), ©OpenStreetMap contributors, and the GIS User Community, Esri, 2025a). This landscape regularly faces wildfire (a.2) and beetle mortality (a.3) and is subject to forest treatments, such as prescribed fire and thinning) (a.4). The tricolor legend shows these events and their interactions (pink: only wildfire, orange: wildfire and forest treatment, yellow: only forest treatment, green: forest treatment and beetle, purple: wildfire and beetle, brown: all), and the inset shows a more detailed view of the spatial patterns (b). Wildfire boundaries taken from Monitoring Trends in Burn Severity (MTBS, 1988-present), beetle mortality extent from the US Department of Agriculture’s identification of watersheds with greater than 50% stand mortality (2000–2019) from either mountain pine or western bark beetle, and forest treatment boundaries selected from accomplished treatments in the Integrated Interagency Fuels Treatment Database (2003–2024).
Forests 16 01706 g001
Figure 2. Iterative workflow displaying the components needed to update the dashboard web platform from recently collected field data. Data Collection and Database Input includes the NPS field monitoring and data upload protocols; Database to Dashboard includes the flexible dashboard design and custom scripts needed to support dashboard maintenance and updates; and Visualization and Analysis refers to the automated creation of data visualizations and graphics necessary for effective natural resource decision making. Four main benefits and improved use cases emerge from this iterative and updatable field-to-visualization workflow.
Forests 16 01706 g002
Figure 3. Location of fire effects (FFI, blue) and Rapid Assessment (RA, pink) plots near the eastern boundary (white) of Rocky Mountain National Park. Forest fuels monitoring data collected in the FFI and RA plots are similar, though the plot design and transects differ slightly. RA plots offer quicker, more flexible data collection protocols beyond prescribed fires to include treatments such as thinning. RA plots also extend coverage of the monitoring network further east toward the gateway community of Estes Park, CO.
Forests 16 01706 g003
Figure 4. Example dashboard interface displaying total fuels (tons/acres) by monitoring status (number of burns and time since last burn) and forest monitoring plot type. Mean total fuels (bold lines) are compared to total fuel observations for every plot (top right). Tabular data for the graphed plot (bottom right) are shown alongside a map of all plot locations, colored by monitoring type (bottom center). The graph and table update based on the fuel type and plot ID selected (top left), while summary statistics of mean and median fuels sorted by monitoring type remain static (bottom left).
Forests 16 01706 g004
Figure 5. Screenshot of dashboard panel showing fuel class data for a single, representative plot. Fuel classes are divided into 1 hr, 10 hr, 100 hr; and 1000 hr fuels (tons/acre) at each monitoring status.
Forests 16 01706 g005
Figure 6. Example dashboard interface displaying counts of young tree species (top center) and basal area of mature tree species (bottom center), categorized by burn monitoring status for a single plot in the zoomed map (top right). Percent ground cover (bottom right) displays proportion of the top nine most prevalent ground cover types with additional minority ground cover types grouped into ‘Other’. The graphs and map update based on the plot ID selected (left). Legend species abbreviations: PIPO (Pinus ponderosa; ponderosa pine), PSME (Pseudotsuga menziesii; Douglas fir), PICO (Pinus contorta; lodgepole pine), PIFL2 (Pinus flexilis; limber pine), ARLU (Artemisia ludoviciana; sagewort or sagebrush), BARE1 (bare ground), CAREX (Carex spp.; sedges), KOMA (Koeleria macrantha; junegrass), LITT1 (litter), MUMO (Muhlenbergia montana; mountain muhly), PUTR2 (Purshia tridentata; antelope bitterbrush), ROCK1 (rock), WOOD1 (wood).
Forests 16 01706 g006
Disclaimer/Publisher’s Note: The statements, opinions and data contained in all publications are solely those of the individual author(s) and contributor(s) and not of MDPI and/or the editor(s). MDPI and/or the editor(s) disclaim responsibility for any injury to people or property resulting from any ideas, methods, instructions or products referred to in the content.