Article

Climate-Change Impacts on Distribution of Amazonian Woody Plant Species Key to Conservation, Restoration and Sustainable Use in the Colombian Amazon

by
Uriel G. Murcia-García
1,*,†,
Armando Sterling
2,*,†,
Jeferson Rodríguez-Espinoza
1,
José A. Carrero-Rincón
1,
María I. Acosta-Salinas
1 and
Carlos H. Rodríguez-León
2
1
GIS and Remote Sensing Laboratory, Research Group on Environmental Information Management, Land Zoning, Ecological Restoration, and Climate Change in the Colombian Amazon, Models of Functioning and Sustainability Program, Amazonian Scientific Research Institute SINCHI, Bogotá D.C. 111711, Colombia
2
Research Group on Environmental Information Management, Land Zoning, Ecological Restoration, and Climate Change in the Colombian Amazon, Models of Functioning and Sustainability Program, Amazonian Scientific Research Institute SINCHI, Florencia 180001, Colombia
*
Authors to whom correspondence should be addressed.
These authors contributed equally to this work.
Forests 2025, 16(11), 1640; https://doi.org/10.3390/f16111640
Submission received: 4 September 2025 / Revised: 18 October 2025 / Accepted: 24 October 2025 / Published: 27 October 2025
(This article belongs to the Special Issue Modeling of Forest Dynamics and Species Distribution)

Abstract

Climate change poses growing threats to Amazonian biodiversity, yet species-specific responses remain poorly understood, particularly in the Colombian Amazon. This study assessed the potential distribution and habitat suitability of eight woody plant species—Euterpe precatoria (Mart.) A.J.Hend., Mauritia flexuosa L.f., Oenocarpus bataua Mart., Minquartia guianensis Aubl., Cedrela odorata L., Virola elongata (Benth.) Warb., Theobroma grandiflorum (Willd. ex Spreng.) Schum. and Thebroma cacao L.—under a baseline period (1970–2000) and future climate projections for mid- (2041–2060) and late-century (2061–2080) periods, using two Shared Socioeconomic Pathways (SSP245 and SSP585). Species distribution models (SDMs) integrated bioclimatic, edaphic, and topographic predictors and were spatially intersected with Special Management Areas. Results revealed contrasting responses among species. M. flexuosa, E. precatoria, O. bataua, V. elongata, M. guianensis and T. cacao retained over 95% of their baseline suitable habitat and even expanded into new regions, reflecting broad climatic resilience under both future scenarios. In contrast, C. odorata experienced moderate contractions, losing 8.7% of their current ranges under SSP585 by 2080. The most vulnerable species was T. grandiflorum, projected to lose up to 27% of its current suitable habitat under the most pessimistic scenario. Overall, losses were mainly concentrated in the natural fractions of Indigenous Reserves and National Natural Parks. These findings underscore the heterogeneous responses of Amazonian species to climate change and highlight the need for adaptive conservation and management strategies. Protecting climate refugia, promoting ecological connectivity, and incorporating climate-resilient species into restoration programs will be critical to maintaining biodiversity, ecosystem services, and local livelihoods in the Colombian Amazon under future climates.

1. Introduction

The Amazon biome harbors the largest tropical forest on the planet and plays a crucial role in biodiversity conservation and the regulation of the global climate system [1,2]. This region hosts approximately 16,000 tree species [3], accounting for about 13% of all individual trees estimated globally [4,5]. This biodiversity provides fundamental resources such as food, medicines, and sources of income for local communities, thereby reinforcing the importance of its conservation [6,7].
Climate change constitutes one of the main threats to biodiversity globally [8,9,10,11]. Changes in temperature, precipitation, and the frequency of natural disasters are key factors in this transformation [12]. By 2023, the global mean near-surface temperature had risen 1.45 °C ± 0.12 above pre-industrial levels (1850–1900) [1]. Even with the commitments made under the Nationally Determined Contributions (NDCs) at the global level, if current trends persist, it is unlikely that global warming will remain below 2 °C by the end of the 21st century [13,14]. A +1.5 °C scenario could place between 3% and 14% of terrestrial species at very high risk of extinction, whereas a +3 °C increase could raise this risk by up to tenfold [13].
In the Amazon region, climate change follows the global trend and is recognized as the main driver of biodiversity transformation [15]. Over the past four decades, mean temperature has increased by 1.02 °C ± 0.12 [16], with monthly maximum temperatures rising between 0.04 °C and 0.06 °C [17]. Precipitation has shown significant variations in its geographic distribution, magnitude, and duration, with decreases toward the east and increases in the western zone, accompanied by a rise in the frequency and intensity of extreme events [18]. Climate projections indicate a warmer and drier Amazon in the future, especially in the eastern, southern, and central regions, thereby increasing the risk of a “savannization” process and the crossing of a critical ecological threshold (or tipping point for forest stability), exacerbated by the effects of deforestation [19,20]. Because tropical forests respond slowly to rapid climatic changes, their adaptive potential is severely compromised [21].
By 2018, the Amazon had lost nearly 14% of its natural cover (87 million hectares, Mha) and an additional 17% (103.6 Mha) showed signs of degradation [22]. Although the annual rate of forest loss has decreased over the past three decades, fragmentation has increased, with greater losses of small patches with <50 hectares (ha), an 8.82% reduction in forest remnants, and a 3.33% increase in perforated forests [23]. Climate change and land-use change act synergistically, amplifying biodiversity risks [14,24], potentially reducing the habitat suitability of key species by up to 45% under extreme scenarios [25] and decreasing Amazonian tree species richness by as much as 58% by 2050 [26].
The Colombian Amazon, covering 48 Mha (6% of the biome), harbors about 50% of the country’s vascular plant diversity [27,28] and is located within one of the regions exhibiting the highest tree densities of the biome [29]. Climate projections under the Shared Socioeconomic Pathway 2–4.5 (SSP2–4.5) scenario indicate a temperature increase of 1–4 °C and a 10%–30% rise in precipitation, with marked seasonal and spatial variability [30]. Currently, 41.45 Mha maintain natural cover, while 4.88 Mha have been transformed (10.1%), with annual deforestation rates between 89,000 and 176,000 ha over the past two decades [31].
In the Colombian Amazon, 93.42% (45.14 Mha) is under some form of legal protection that restricts land-use change, including reserves, national parks, sanctuaries, indigenous territories, or forest reserves [31]. The country is advancing a national anti-deforestation policy based on community forestry, agroforestry, and the bioeconomy, implemented in 22 forest development hubs (i.e., designated areas that promote forest-based development and management). However, this strategy does not yet integrate species management criteria based on their current habitat distribution or projected changes under climate scenarios. Complementarily, Colombia has committed to restoring 753,000 ha between 2022 and 2026 through a large-scale multifunctional restoration approach, prioritizing the Amazon as a strategic territory [32]. However, there remains a significant gap in species distribution modeling: only 50% of species have modeled habitats, most of them lacking projections under future climate scenarios [33].
In this regard, species distribution models (SDMs) are essential tools to correlate environmental variables (e.g., bioclimatic, topography factors, soil factors, and energy availability) with occurrence records, allowing projections of habitat suitability under different climate change scenarios, and providing key inputs for conservation and restoration planning [34,35,36].
Within this framework, the present study aimed to assess the effects of climate change on the potential distribution and habitat suitability of eight woody plant species from the Colombian Amazon, considering both the baseline period (1970–2000) and future scenarios. These species were selected to represent a broad spectrum of ecological strategies, habitat preferences, and socioeconomic importance across the region, rather than predefined sensitivity classes. Specifically, the selection criteria included: (1) wide geographic distribution across the Amazon Basin, allowing for robust modeling across environmental gradients; (2) contrasting ecological and functional traits that may result in different responses to climatic change (e.g., moisture-dependent hardwoods versus broadly tolerant palms); (3) representation of different threat categories according to the International Union for Conservation of Nature (IUCN), ensuring conservation relevance; (4) sufficient and reliable bioclimatic and occurrence information for accurate model calibration; and (5) ecological and socioeconomic significance for conservation, restoration, and sustainable use in the Colombian Amazon (Supplementary Table S1). These include late-successional timber trees (Minquartia guianensis Aubl., Cedrela odorata L., Virola elongata (Benth.) Warb.), palms of bioeconomic interest (Euterpe precatoria (Mart.) A.J.Hend., Mauritia flexuosa L.f., Oenocarpus bataua Mart.), and food- and cosmetic-use species of intermediate succession (Theobroma grandiflorum (Willd. ex Spreng.) Schum., Theobroma cacao L.), which together represent 22.35% of seedlings used in restoration programs in the region between 2021 and 2023 (https://siatac.co/visor-de-restauracion-ecologica/, accessed on 13 May 2025).
Previous studies have shown significant habitat contractions for T. cacao under minimal changes in extreme precipitation [37,38,39], as well as variability in productivity and survival associated with climatic variability in M. flexuosa [40]. For O. bataua, modeling conducted in Loreto, Peru, using the Bioclim algorithm implemented in DIVA-GIS projected a reduction of up to 54.77% in potential distribution area under future climate scenarios [41]. For C. odorata, both radial growth sensitivity to climatic variables [42] and niche modeling [43,44] have highlighted risks, but also potential opportunities for range expansion into areas projected to become more climatically suitable under future scenarios. For E. precatoria, studies have reported evidence of climatic resilience in terms of sustained fruit production under variable precipitation regimes [45]. By contrast, T. grandiflorum, M. guianensis, and V. elongata remain understudied with respect to their climatic tolerances, adaptive capacity, and projected distribution shifts, despite their structural importance in Amazonian forests.
Identifying species projected to retain or expand climatically suitable areas with higher probability of occurrence will help optimize restoration and conservation programs, enhance ecosystem resilience, promote sustainable use informed by future agroclimatic suitability, and strengthen public policies grounded in scientific evidence. This study addresses this need by providing a detailed analysis of the potential responses of representative woody plant species to different climate scenarios, offering key insights to guide conservation, restoration, and sustainable use strategies in the Colombian Amazon.

2. Materials and Methods

2.1. Species Occurrence Data Acquisition and Processing

Data on the georeferenced occurrences (1970–2024) of M. guianensis, C. odorata, V. elongata, E. precatoria, M. flexuosa, O. bataua, T. grandiflorum and T. cacao were obtained from the Global Biodiversity Information Facility database (GBIF, https://www.gbif.org/, accessed on 12 May 2025) and the Colombian Amazonian Herbarium database (COAH, https://sinchi.org.co/coah/, accessed on 13 May 2025). The data were filtered using the R package CoordinateCleaner v2.0-6 [46] to remove: (i) records with missing or zero coordinates; (ii) geographic duplicates; and (iii) points located in administrative centroids, botanical gardens, institutions, urban areas, large water bodies, or the GBIF headquarters. Species names were validated against the platform Tropicos (https://www.tropicos.org/, accessed on 13 May 2025). To reduce sampling bias, a spatial—thinning algorithm implemented in spThin v0.2.0 [47] retained a single record within every 1 km radius (Supplementary Table S2). Because true absences were unavailable, three pseudo-absences were generated per presence following the environmentally informed buffer method of Barve et al. [48]. Specifically, 20 km exclusion buffers were drawn around each presence to avoid pseudo-absences in areas that are environmentally similar but potentially under-sampled. Candidate background pixels were then randomly sampled outside the buffers using prevalence-based sampling, and environmental values were extracted with terra v1.7-71 [49]. The modelling domain encompassed the entire Amazon Basin (82° W–42° W; 20° S–10° N), hereafter referred to as “Pan-Amazonia”, in order to capture regional climatic and edaphic gradients relevant to the target woody plant species. Model projections and interpretations were subsequently clipped to the Colombian Amazon (77.67° W–66.85° W; 4.23° S–4.95° N) [50].

2.2. Environmental Predictors

30 environmental variables were used for SDMs, as follows: 19 bioclimatic variables were obtained from WorldClim 2.1 climatology (1970–2000—30 arc-second ~1000 m resolution) (https://www.worldclim.org/, accessed on 15 May 2025) [51]; 4 topographic variables (elevation, slope, aspect, and hillshade) were derived from NASADEM (1 arc-second ~30 m) (https://www.earthdata.nasa.gov/, accessed on 15 May 2025), and up-scaled using bilinear interpolation; and 7 soil properties (clay, sand, and silt content, bulk density, pH, organic carbon, and organic carbon density, averaged across 0–5, 15, 30, and 60 cm depths at 250 m resolution) were obtained from SoilGrids250m v2.0 (https://soilgrids.org/, accessed on 15 May 2025) [52] and resampled to 1 km by averaging. All rasters were projected to WGS84, aligned to identical grids, and masked to the Colombian Amazon using GDAL 3.8.1 [52]
Predictors were centered and scaled, and then filtered through a two-step collinearity procedure: variance inflation factor (VIF ≤ 10) computed with the usdm package (v2.1-7) [53], and pairwise Pearson correlations (r ≤ 0.90). In each correlated pair, we removed the variable with lower ecological interpretability until all criteria were satisfied. The final species-specific sets comprised 18 predictors, 17 of which were shared across taxa (aspect, bdod, bio_2, bio_3, bio_4, bio_13, bio_14, bio_15, bio_18, bio_19, clay, hillshade, ocd, phh2o, silt, slope, soc), and one climatic slot that differed—BIO5 for seven species and BIO8 for T. grandiflorum. Per-species correlation matrices are provided in Supplementary Figure S1.

2.3. Species Distribution Modelling Framework

Models were implemented in R 4.5.0 [54] with sdm v1.1-8 [55] and custom scripts. The dataset was randomly split into 70% training and 30% testing while preserving prevalence. Four algorithms were tuned: (i) Generalized Additive Models (GAM)—cubic regression splines with k = 4 knots per smooth term (mgcv v1.9-1) [56]; (ii) Boosted Regression Trees (BRT)—learning rate = 0.01, tree depth = 3, 1000 trees, fivefold internal CV (gbm v2.1-8) [57]; Maximum Entropy (MaxEnt)—β-multiplier = 1.5, feature classes = LQHP (dismo v1.3-16) [58]; and Random Forest (RF)—1000 trees, mtry = ⌊√p⌋ (randomForest v4.7-1.1) [59]. Algorithm hyperparameters were tuned via grid search to maximize the mean area under the receiver operating characteristic curve (AUC) across five Monte Carlo repetitions.
We assessed three cross-validation strategies using the R package blockCV: random k-fold, spatial blocking, and environmental clustering (k-means on standardized predictors). The spatial blocking routine in blockCV requires specifying a block size, which we derived separately for each species by estimating the empirical spatial autocorrelation range from Moran’s I correlograms based on 5000 randomly sampled model residuals. The first non-significant distance bin was taken as the spatial range and used as the block side length (median ≈50 km across species). Using this block size, we implemented a 5-fold cross-validation for each strategy with comparable fold balance. Conceptually, random CV evaluates interpolation ability, spatial blocking assesses spatial transferability, and environmental clustering tests model generalization across environmental space.
Algorithm ensemble and thresholding. For each SSP (2041–2060; 2061–2080), we first constructed a single ensemble-mean climate stack by taking the cell-wise arithmetic mean across seven CMIP6 GCMs selected for their AR6 performance over Amazonia. Each algorithm (MaxEnt, RF, BRT/GBM, GAM) generated one continuous suitability surface using this ensemble-mean climate plus static edaphic/terrain predictors. We then binarized each algorithm’s surface with its Youden-optimized threshold (sensitivity + specificity − 1, estimated from spatial block-CV) and computed the algorithm ensemble as a performance-weighted committee average of the binary maps, with weights (AUC − 0.5)2 (normalized) [60]. A cell was deemed suitable when the weighted vote ≥ 0.75; with equal weights and four algorithms, this corresponds to a 3/4 supermajority, but here, it should be interpreted as a weighted supermajority.
Future projections were derived from WorldClim downscaled CMIP6 ensemble data for the periods 2041–2060 and 2061–2080, under two shared socioeconomic pathways (SSPs), including SSP2-RCP4.5 (SSP245) and SSP5-RCP8.5 (SSP585) scenarios. Seven general circulation models (GCMs) (ACCESS-CM2, EC-Earth3-Veg, HadGEM3-GC31-LL, IPSL-CM6A-LR, MIROC6, MPI-ESM1-2-HR, UKESM1-0-LL), selected based on AR6 performance over the Amazon [8,61], were treated as an ensemble. For each SSP, we computed the GCM-ensemble mean by taking the cell-wise arithmetic average of suitability across the seven GCM projections (i.e., consensus by mean). The resulting raster represents the central tendency of climate projections. Ensemble binary maps for each SSP were compared with the baseline climatology (1970–2000) to generate four-class delta suitability maps: consistently unsuitable (00), gain (01), loss (10), and consistently suitable (11). Class-wise area and percentages were calculated using the function terra::expanse() [49].

2.4. Analysis of Special Management Areas Under Climate Modeling Scenarios

We analyzed the results of species distribution models for eight woody plant species under climate change scenarios SSP245 and SSP585 for the periods 2041–2060 and 2061–2080, focusing on their projected distributions within Special Management Areas (SMAs) and across habitat condition categories (natural vs. intervened) in the Colombian Amazon. Spatial data were obtained from the Territorial Environmental Information System of the Colombian Amazon (SIAT-AC) (https://siatac.co/, accessed on 30 July 2025). The SMAs including National Natural Parks (NNP), Indigenous Reserves (IR), National Natural Reserves (NNR), and the Law 2 Forest Reserve (L2FR) available at National Unified Registry of Protected Areas (RUNAP) (https://runap.parquesnacionales.gov.co/, accessed on 10 August 2025), and National Land Agency (ANT) (https://data-agenciadetierras.opendata.arcgis.com/, accessed on 11 August 2025). A GIS-based overlay analysis using delta maps was conducted for each climate change scenario [62].

3. Results

3.1. Occurrence Data Retrieval and Filtering

A total of 102,463 occurrence records were initially retrieved for the eight Amazonian woody plant species (Supplementary Table S2). After cleaning, 55,089 records (53.8%) were flagged, yielding 47,374 clean records for subsequent analyses (Figure 1). The highest initial number of records was found for O. bataua (55,024) and E. precatoria (28,886), while M. guianensis and V. elongata showed the lowest totals (2936 and 2991, respectively). Filtering flagged a substantial proportion of records for O. bataua (97.2%) and M. flexuosa (86.5%), mainly due to duplicates, while T. cacao and C. odorata retained the largest clean datasets (2961 and 7661, respectively).
After 1 km spatial thinning, the number of records available for model calibration ranged from 202 (T. grandiflorum) to 1588 (E. precatoria). Species with initially abundant datasets, such as M. flexuosa and O. bataua, experienced sharp reductions, retaining only 1441 and 1049 records, respectively. In contrast, species with fewer initial records, such as V. elongata and M. guianensis, retained a relatively high proportion of usable occurrences (1034 and 610, respectively).
Overall, duplicates represented the main source of data loss, followed by records from urban areas and biodiversity institutions. Despite these reductions, the final thinned datasets ensured a robust and spatially independent sample for species distribution modeling.

3.2. Overall Cross-Validation Performance

Across the eight species and four algorithms, average discrimination under spatially random folds was high (AUC = 0.866 ± 0.052; TSS = 0.613 ± 0.090; n = 160). As expected, accounting for spatial and environmental structure reduced performance: environmental clustering yielded AUC = 0.731 ± 0.110 and TSS = 0.400 ± 0.217 (n = 152), while spatial clustering produced AUC = 0.698 ± 0.102 and TSS = 0.359 ± 0.193 (n = 161). These drops quantify the inflation that purely random splits can induce and confirm the need to report spatially explicit validation (Supplementary Figure S2). Species-level performance, pooled across algorithms and cross-validation strategies, is summarized by mean AUC and TSS (Table 1).

3.3. Algorithmic Performance and Trade-Offs

Pooled across species and validation strategies, Random Forest (RF) had the highest average discrimination (AUC = 0.778; TSS = 0.473), followed by BRT (AUC = 0.768; TSS = 0.455) and MaxEnt (AUC = 0.765; TSS = 0.461). GAM trailed slightly (AUC = 0.752; TSS = 0.443) but achieved the highest specificity on average (0.781), evidencing a conservative tendency (fewer false positives) at the cost of sensitivity (0.662) (Table 2).
Decision thresholds optimized by Youden’s index differed by algorithm: MaxEnt tended to require the highest thresholds on average (0.387 ± 0.185), followed by RF (0.264 ± 0.113), with BRT and GAM lower (≈0.22). Practically, MaxEnt produced more conservative binary maps (smaller predicted prevalence) for the same probability surface.
These patterns suggest RF’s resilience to complex, non-linear interactions for most taxa, with BRT competitive where responses are steep but structured, and MaxEnt advantageous for M. flexuosa, a species whose ecology (wetland/floodplain affinity) may be captured well by presence-only likelihood and feature flexibility.

3.4. Robustness to Spatial/Environmental Partitioning

Relative to spatially random folds, per-species performance drops under spatial or environmental clustering were informative: (i) Largest sensitivity to spatial clustering (ΔAUC vs. spatial_random): E. precatoria (−0.238), C. odorata (−0.198), M. guianensis (−0.183). (ii) Largest sensitivity to environmental clustering: M. flexuosa (ΔAUC = −0.206), V. elongata (−0.192), O. bataua (−0.172). (iii) Most robust species overall: T. cacao (ΔAUC ≈ −0.065 to −0.143; ΔTSS ≈ −0.067 to −0.233), retaining comparatively high discrimination under clustered CV. These deltas provide a transparent measure of how much each model relies on spatial autocorrelation and niche redundancy; they should be considered when interpreting absolute AUC/TSS values.

3.5. Cross-Species Synthesis of Variable Importance

The per-species variable-importance figures consistently highlight hydro-climatic seasonality and edaphic fertility/acidity among the leading predictors (Supplementary Table S3; Figures S3–S10). In particular, precipitation seasonality (Bio15) and precipitation of the driest month (Bio14), together with soil organic carbon and soil pH, repeatedly rank among the top predictors across RF and BRT runs. This pattern is ecologically consistent in the northwestern Amazon, where seasonal water limitation and soil chemistry shape forest composition. Although the relative ranks vary by species, these two predictor families dominate the response surfaces underlying the ensemble models.

3.6. Habitat Suitability for Baseline and Future Periods

Habitat suitability for both baseline and future periods is presented in Table 3 and Figure 2, Figure 3, Figure 4, Figure 5, Figure 6, Figure 7 and Figure 8 for E. precatoria, O. bataua, M. flexuosa, V. elongata, M. guianensis, C. odorata, T. cacao and T. grandiflorum. Across all species, the baseline period (1970–2000) shows broad areas of suitable habitat within the Colombian Amazon. The following subsections describe the species-specific responses to climate change for these eight species.

3.6.1. E. precatoria

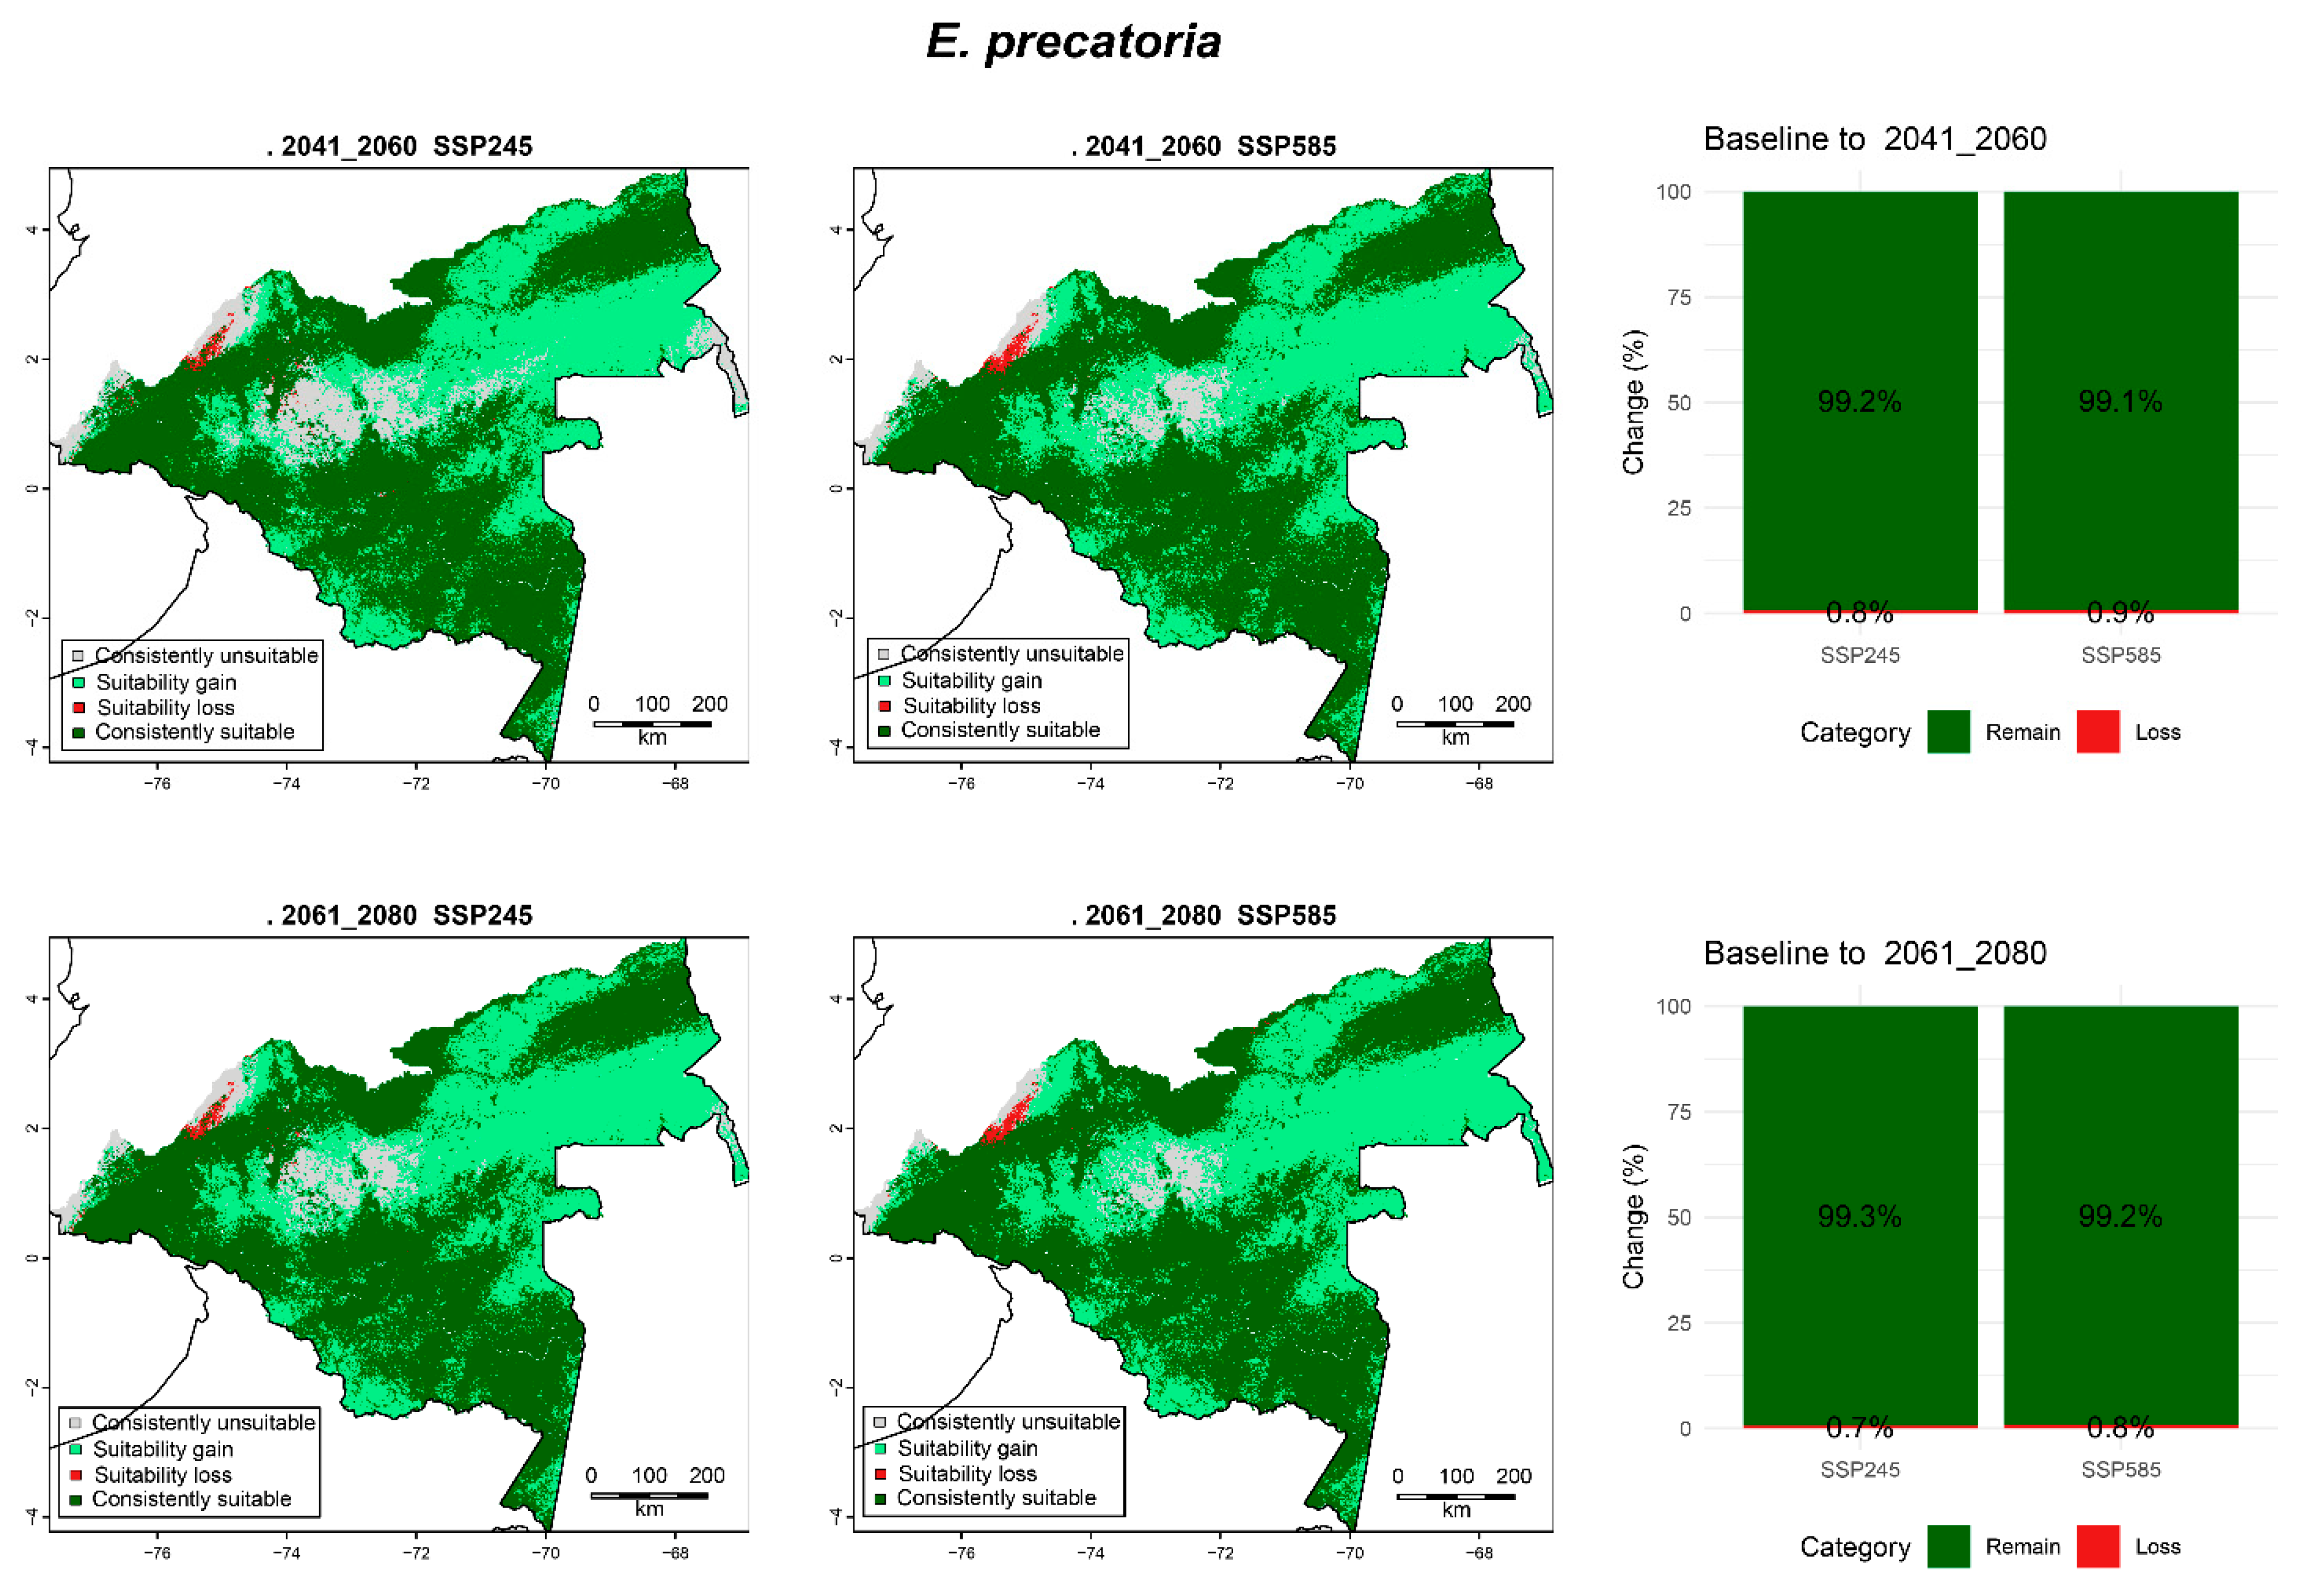
Habitat suitability for E. precatoria remained highly stable across both scenarios and periods (Table 3; Figure 2). More than 99% of the baseline suitable area (1970–2000) persisted under SSP245 and SSP585, with only 0.7%–0.9% projected as losses. Spatially, consistently suitable areas were distributed throughout most of the Colombian Amazon, particularly across the central–western sector adjacent to the Andean foothills. Minor contractions were detected at the northern and southern margins of the range—mainly in drier lowland sectors near the transition to savanna and deforested zones—while small suitability gains appeared in the northwestern region under both future scenarios.
Overall, E. precatoria exhibited broad spatial persistence and high climatic resilience, maintaining continuous areas of suitable habitat even under the most extreme late-century scenario (2061–2080, SSP585), with minimal spatial contraction. In all future scenarios, habitat suitability losses for this species were very low (<0.3 Mha; <0.5%) (Supplementary Figure S3).

3.6.2. O. bataua

For O. bataua, habitat suitability remained broadly stable across both scenarios and time periods (Table 3; Figure 3). Over 99% of the baseline suitable area persisted under SSP245 and SSP585 for 2041–2060, with losses below 1%. Consistently suitable areas extended across most of the Colombian Amazon (99.4% under SSP245 and 98.3% under SSP585), particularly throughout the central and southwestern regions. Moderate gains were projected along the northwestern fringe near the Andean foothills and interfluvial zones, whereas very low contractions (1.7%) appeared at the northeastern and southern margins of the distribution, especially under SSP585 by 2061–2080.
Overall, O. bataua exhibited high climatic resilience and spatial continuity, maintaining extensive and well-connected suitable habitats under all scenarios. Even under the most pessimistic projections (late-century SSP585), losses remained minor (≤1.7%), indicating a strong potential for long-term persistence (Supplementary Figure S4).

3.6.3. M. flexuosa

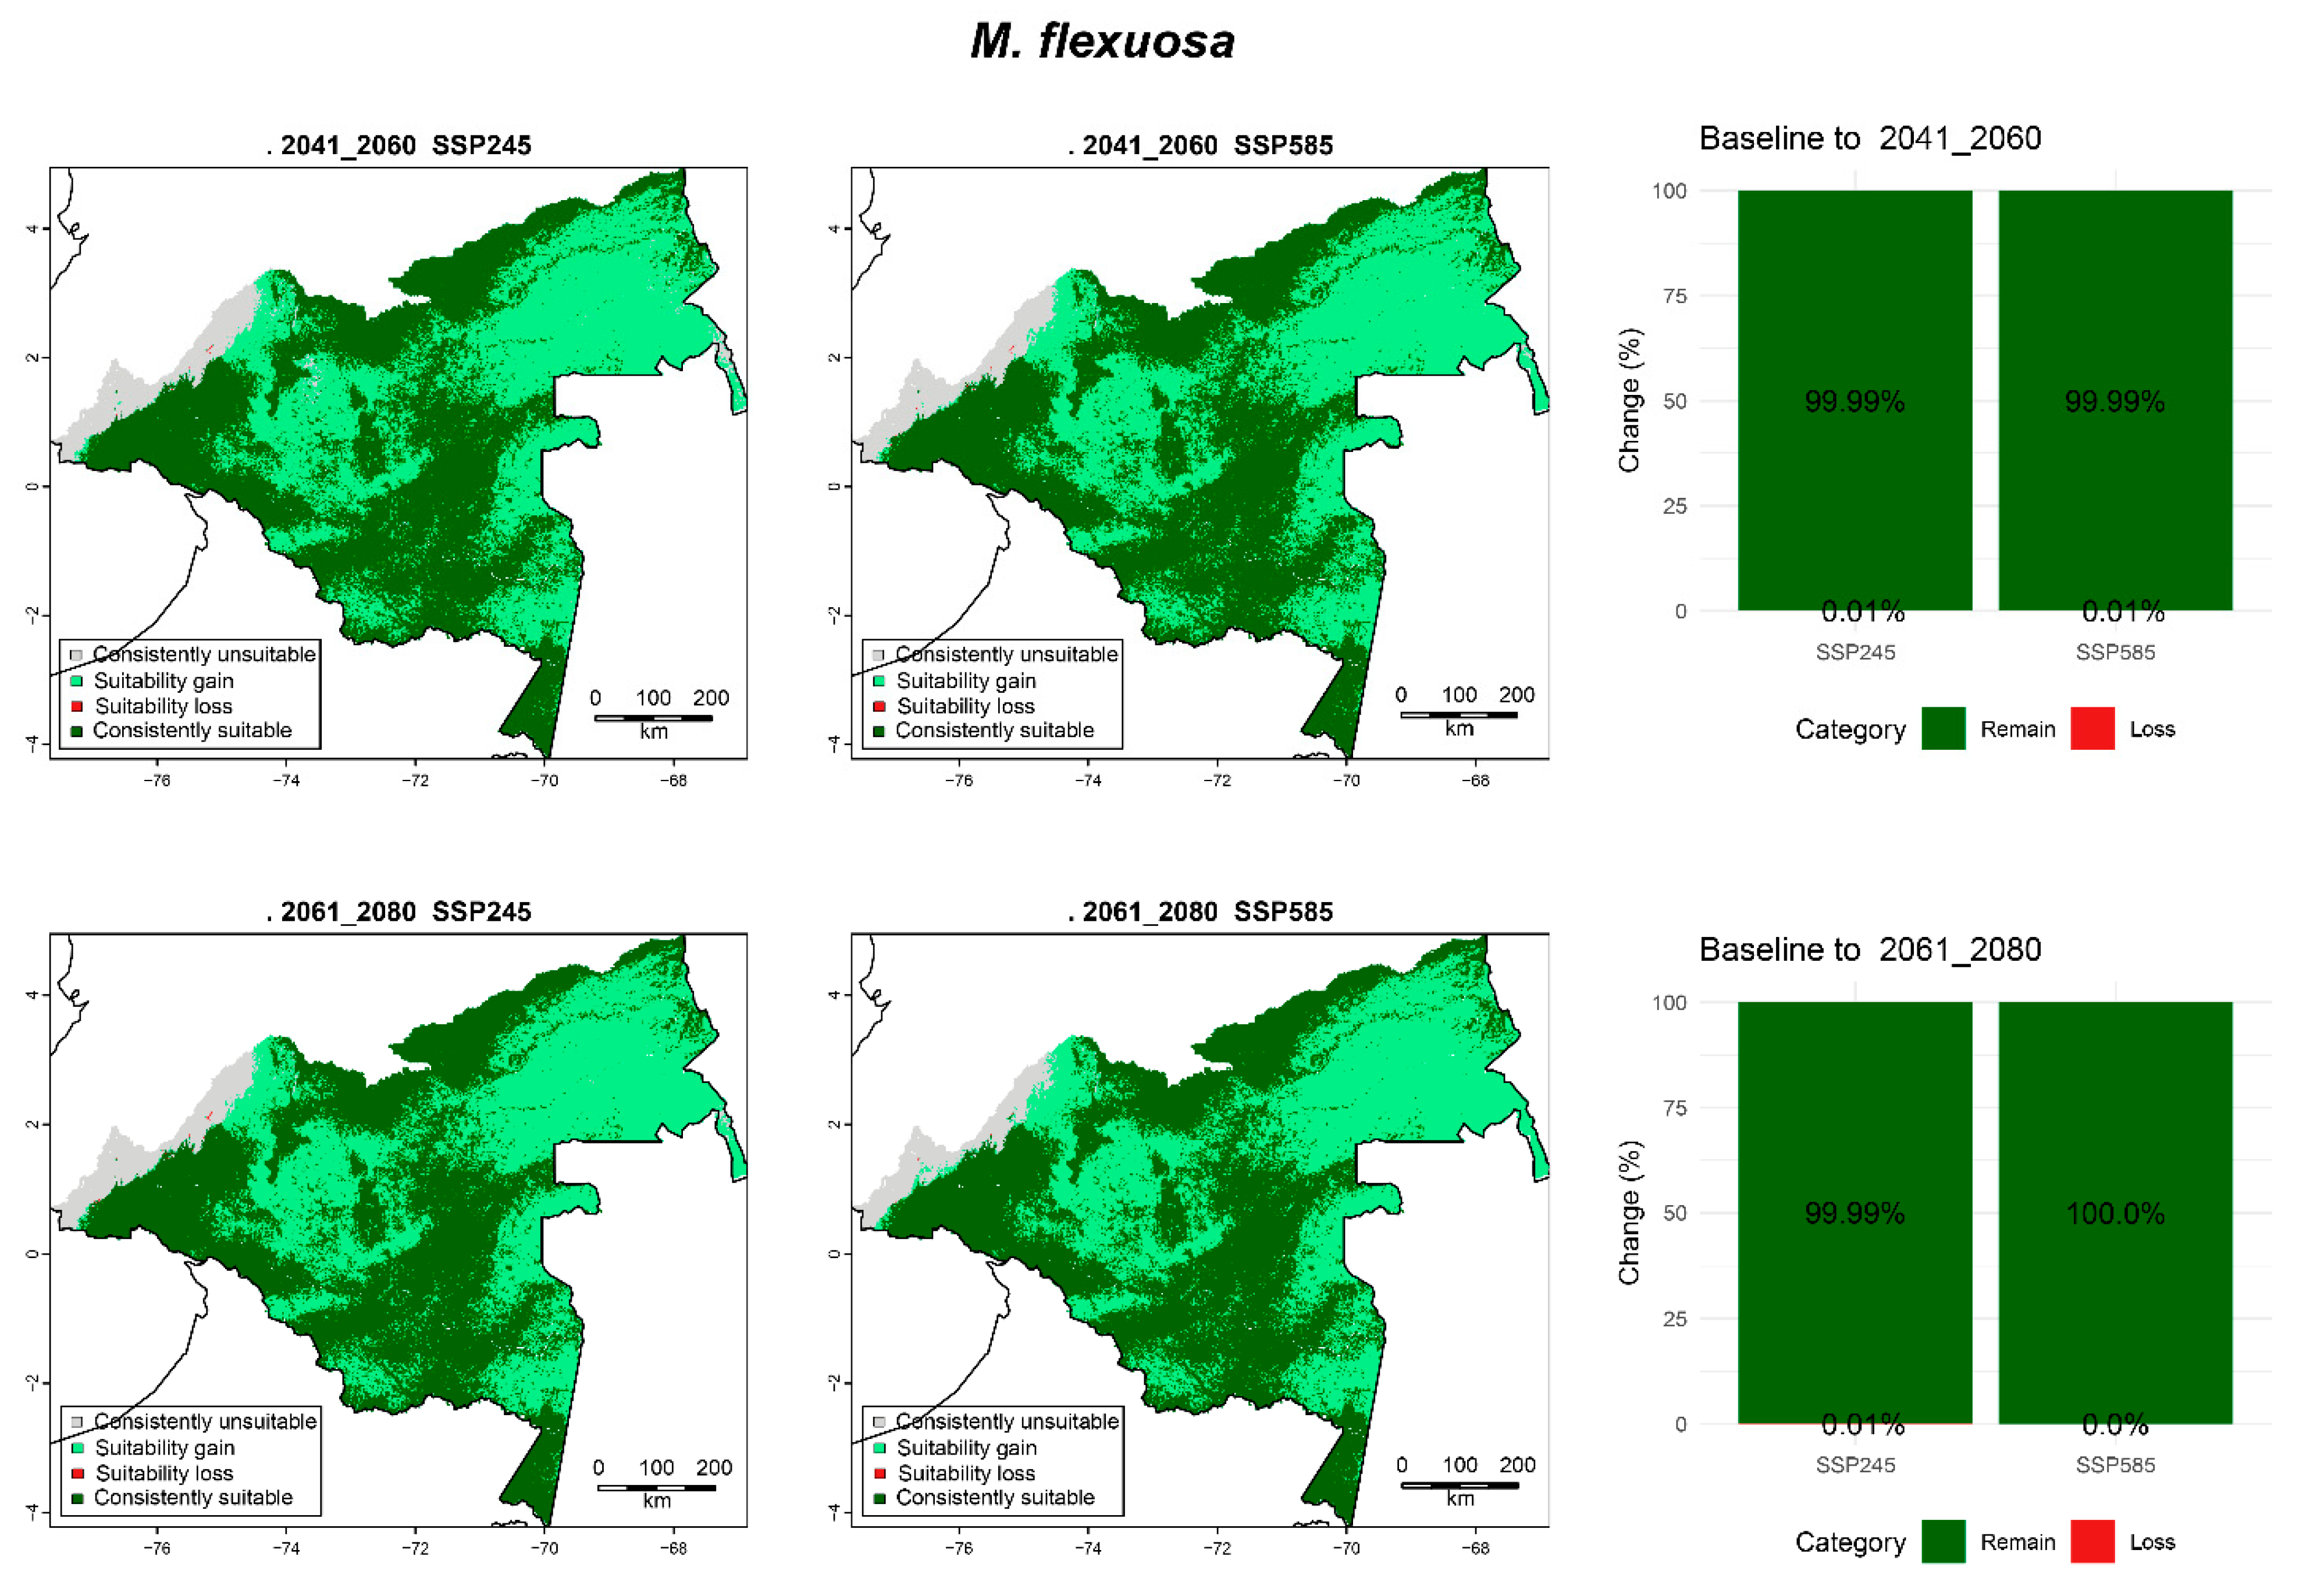
In the case of M. flexuosa, projections indicated consistently high persistence of habitat suitability across all scenarios and periods (Table 3; Figure 4). Under SSP245, 99.99% of baseline suitable area was retained for both 2041–2060 and 2061–2080, while under SSP5-8.5, the entire baseline suitable area (100%) persisted through the late-century period (2061–2080). Consistently suitable zones covered most of the Colombian Amazon, with particularly high continuity across the interfluvial plains. Slight expansions of suitable habitat were observed in the northwestern and central regions, particularly near the Andean–Amazon foothills, while only negligible reductions occurred at the southern fringe under SSP585.
Overall, M. flexuosa exhibited a high climatic stability and broad spatial persistence, maintaining extensive, well-connected suitable areas under all projections. Suitability losses remained very low under all future projections (<0.02 Mha; <0.03%) (Supplementary Figure S5).

3.6.4. V. elongata

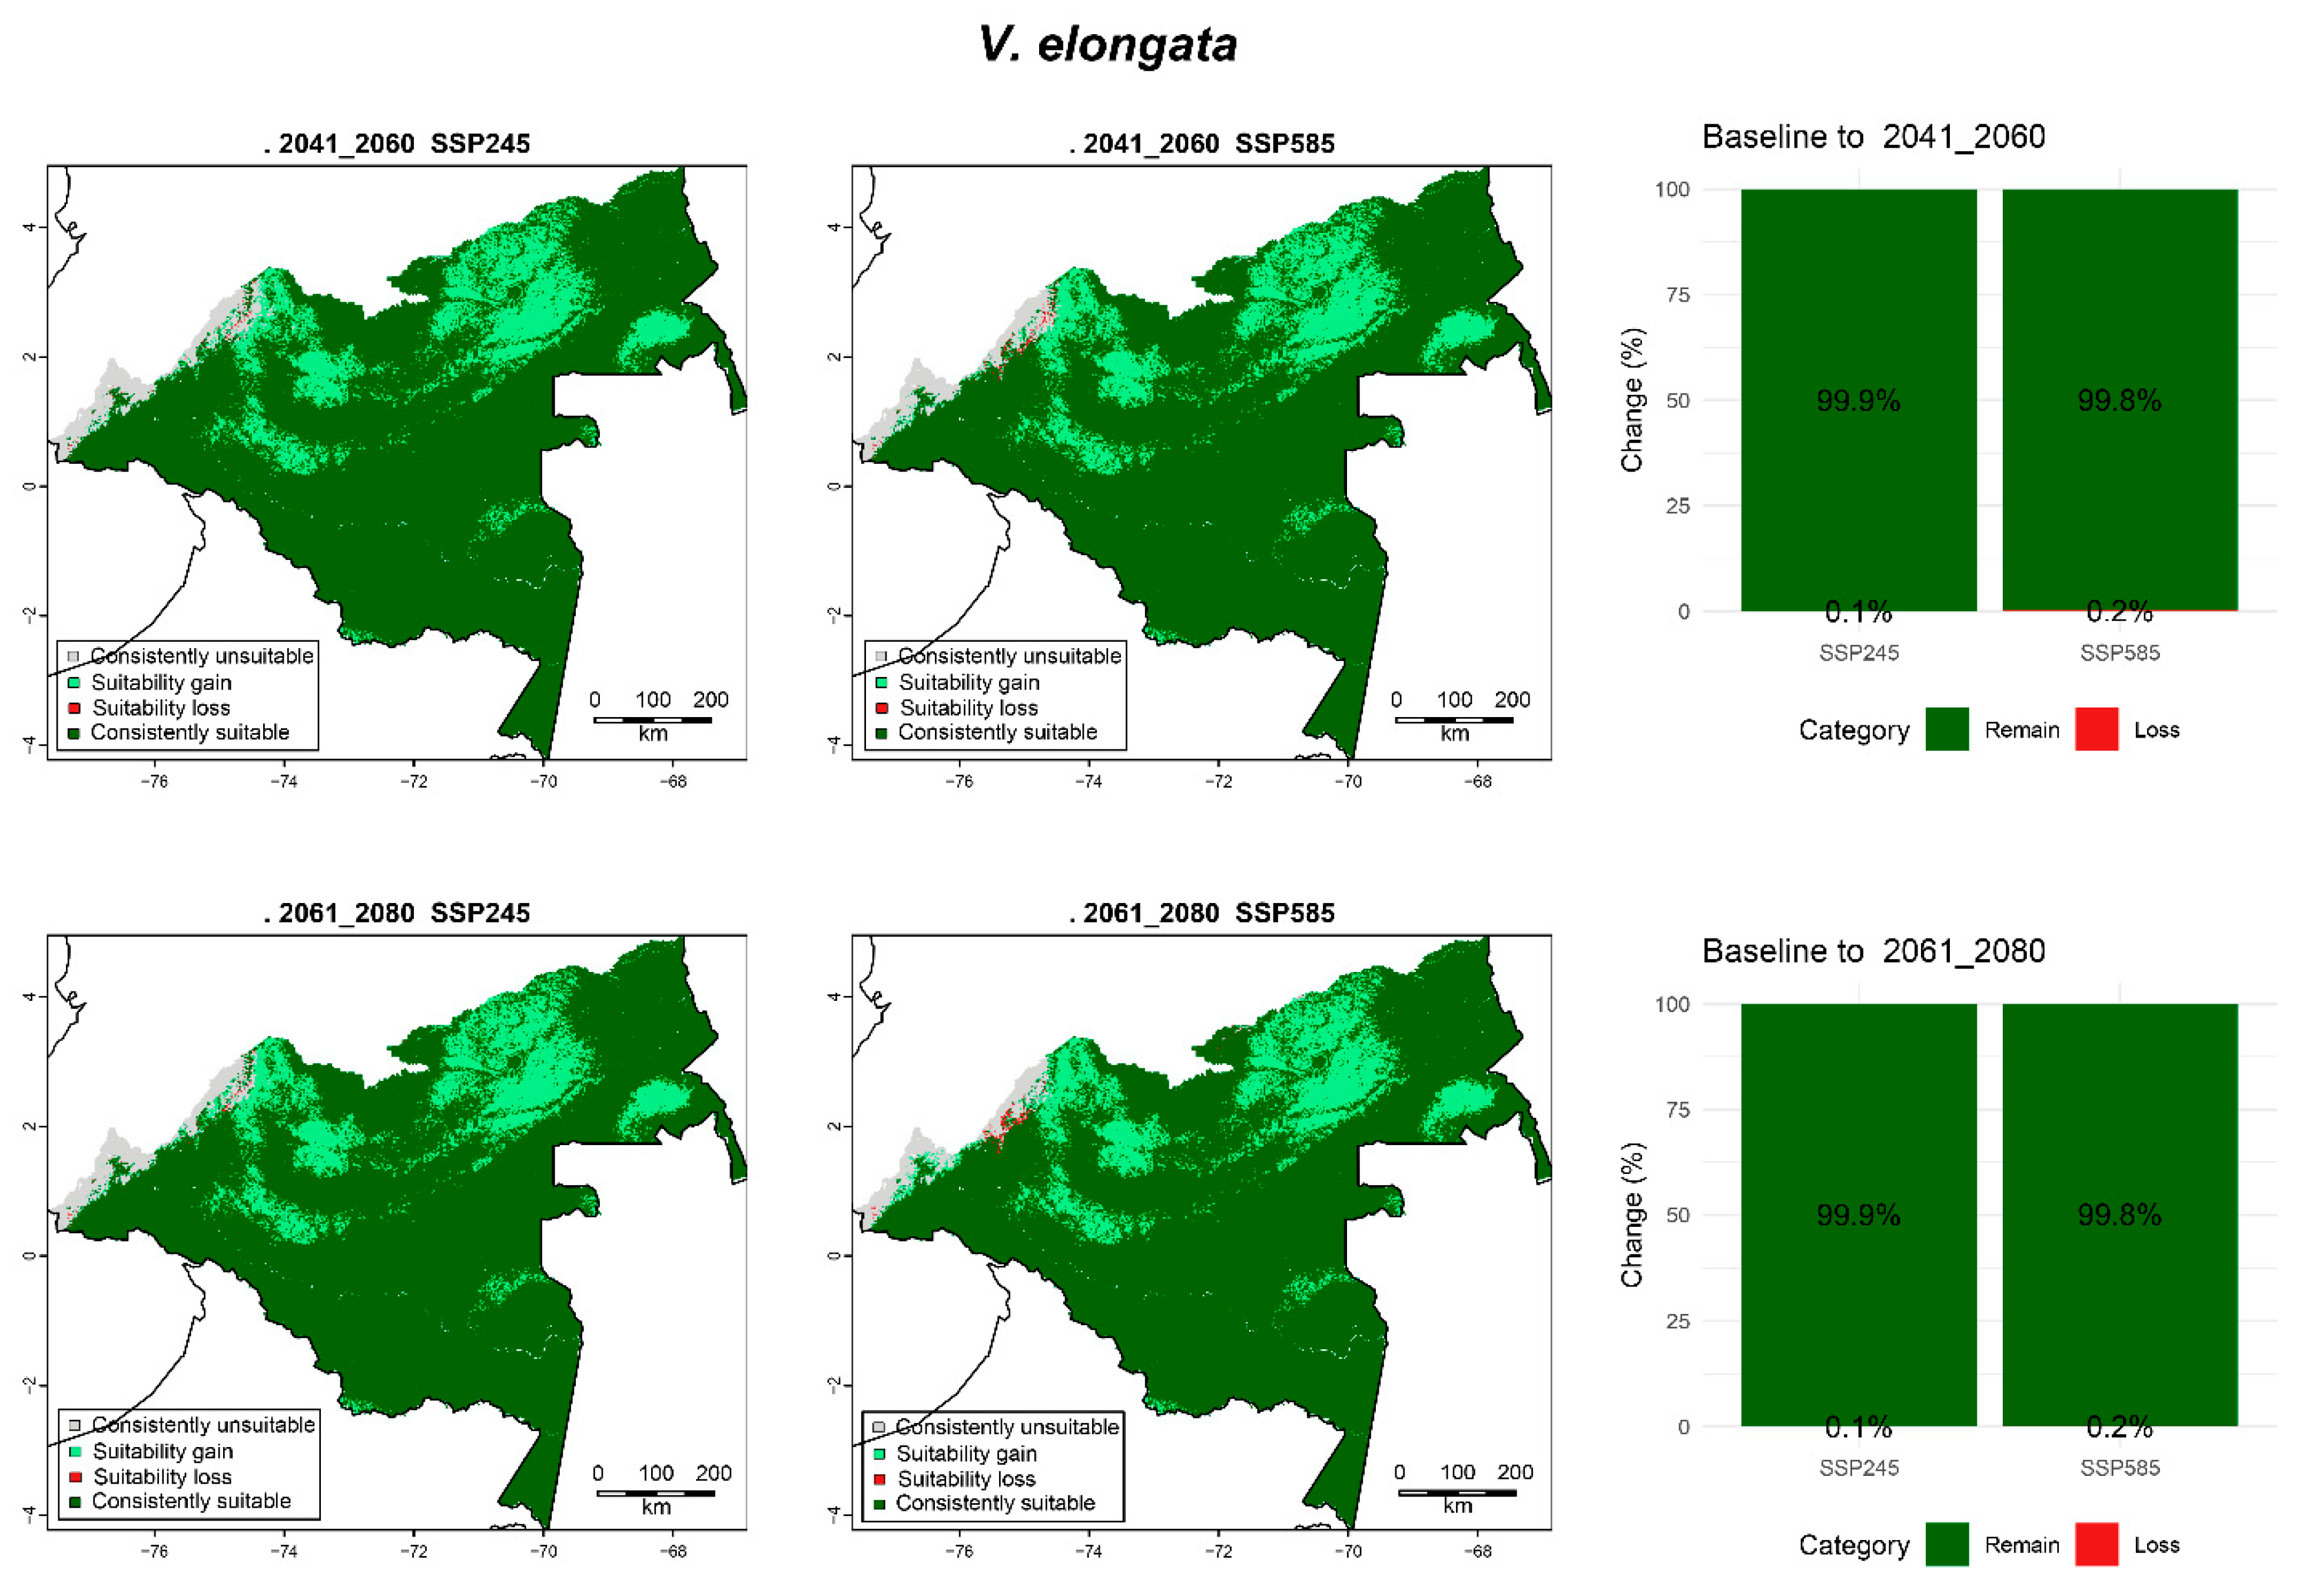
For V. elongata, projections revealed remarkable spatial stability across all scenarios and time periods (Table 3; Figure 5). Under both SSP245 and SSP585, more than 99.8% of baseline suitable area persisted through mid- and late-century periods, with losses remaining negligible (≤0.2%). Consistently suitable habitats were broadly distributed throughout the Colombian Amazon, particularly across central and southern regions, while moderate suitability extended toward the Andean foothills and interfluvial zones. Minor contractions appeared at the northern and southwestern margins under SSP585, whereas slight expansions were observed in the central–eastern lowlands. These subtle spatial shifts suggest a stable but slightly redistributed climatic niche.
Overall, V. elongata demonstrates high climatic robustness and spatial persistence, maintaining extensive, well-connected suitable areas across all projections. In all future scenarios, habitat suitability losses for this species were very low (<0.11 Mha; <0.3%) (Supplementary Figure S6). The negligible magnitude of predicted losses indicates a very low vulnerability to future climate change compared with more sensitive taxa.

3.6.5. M. guianensis

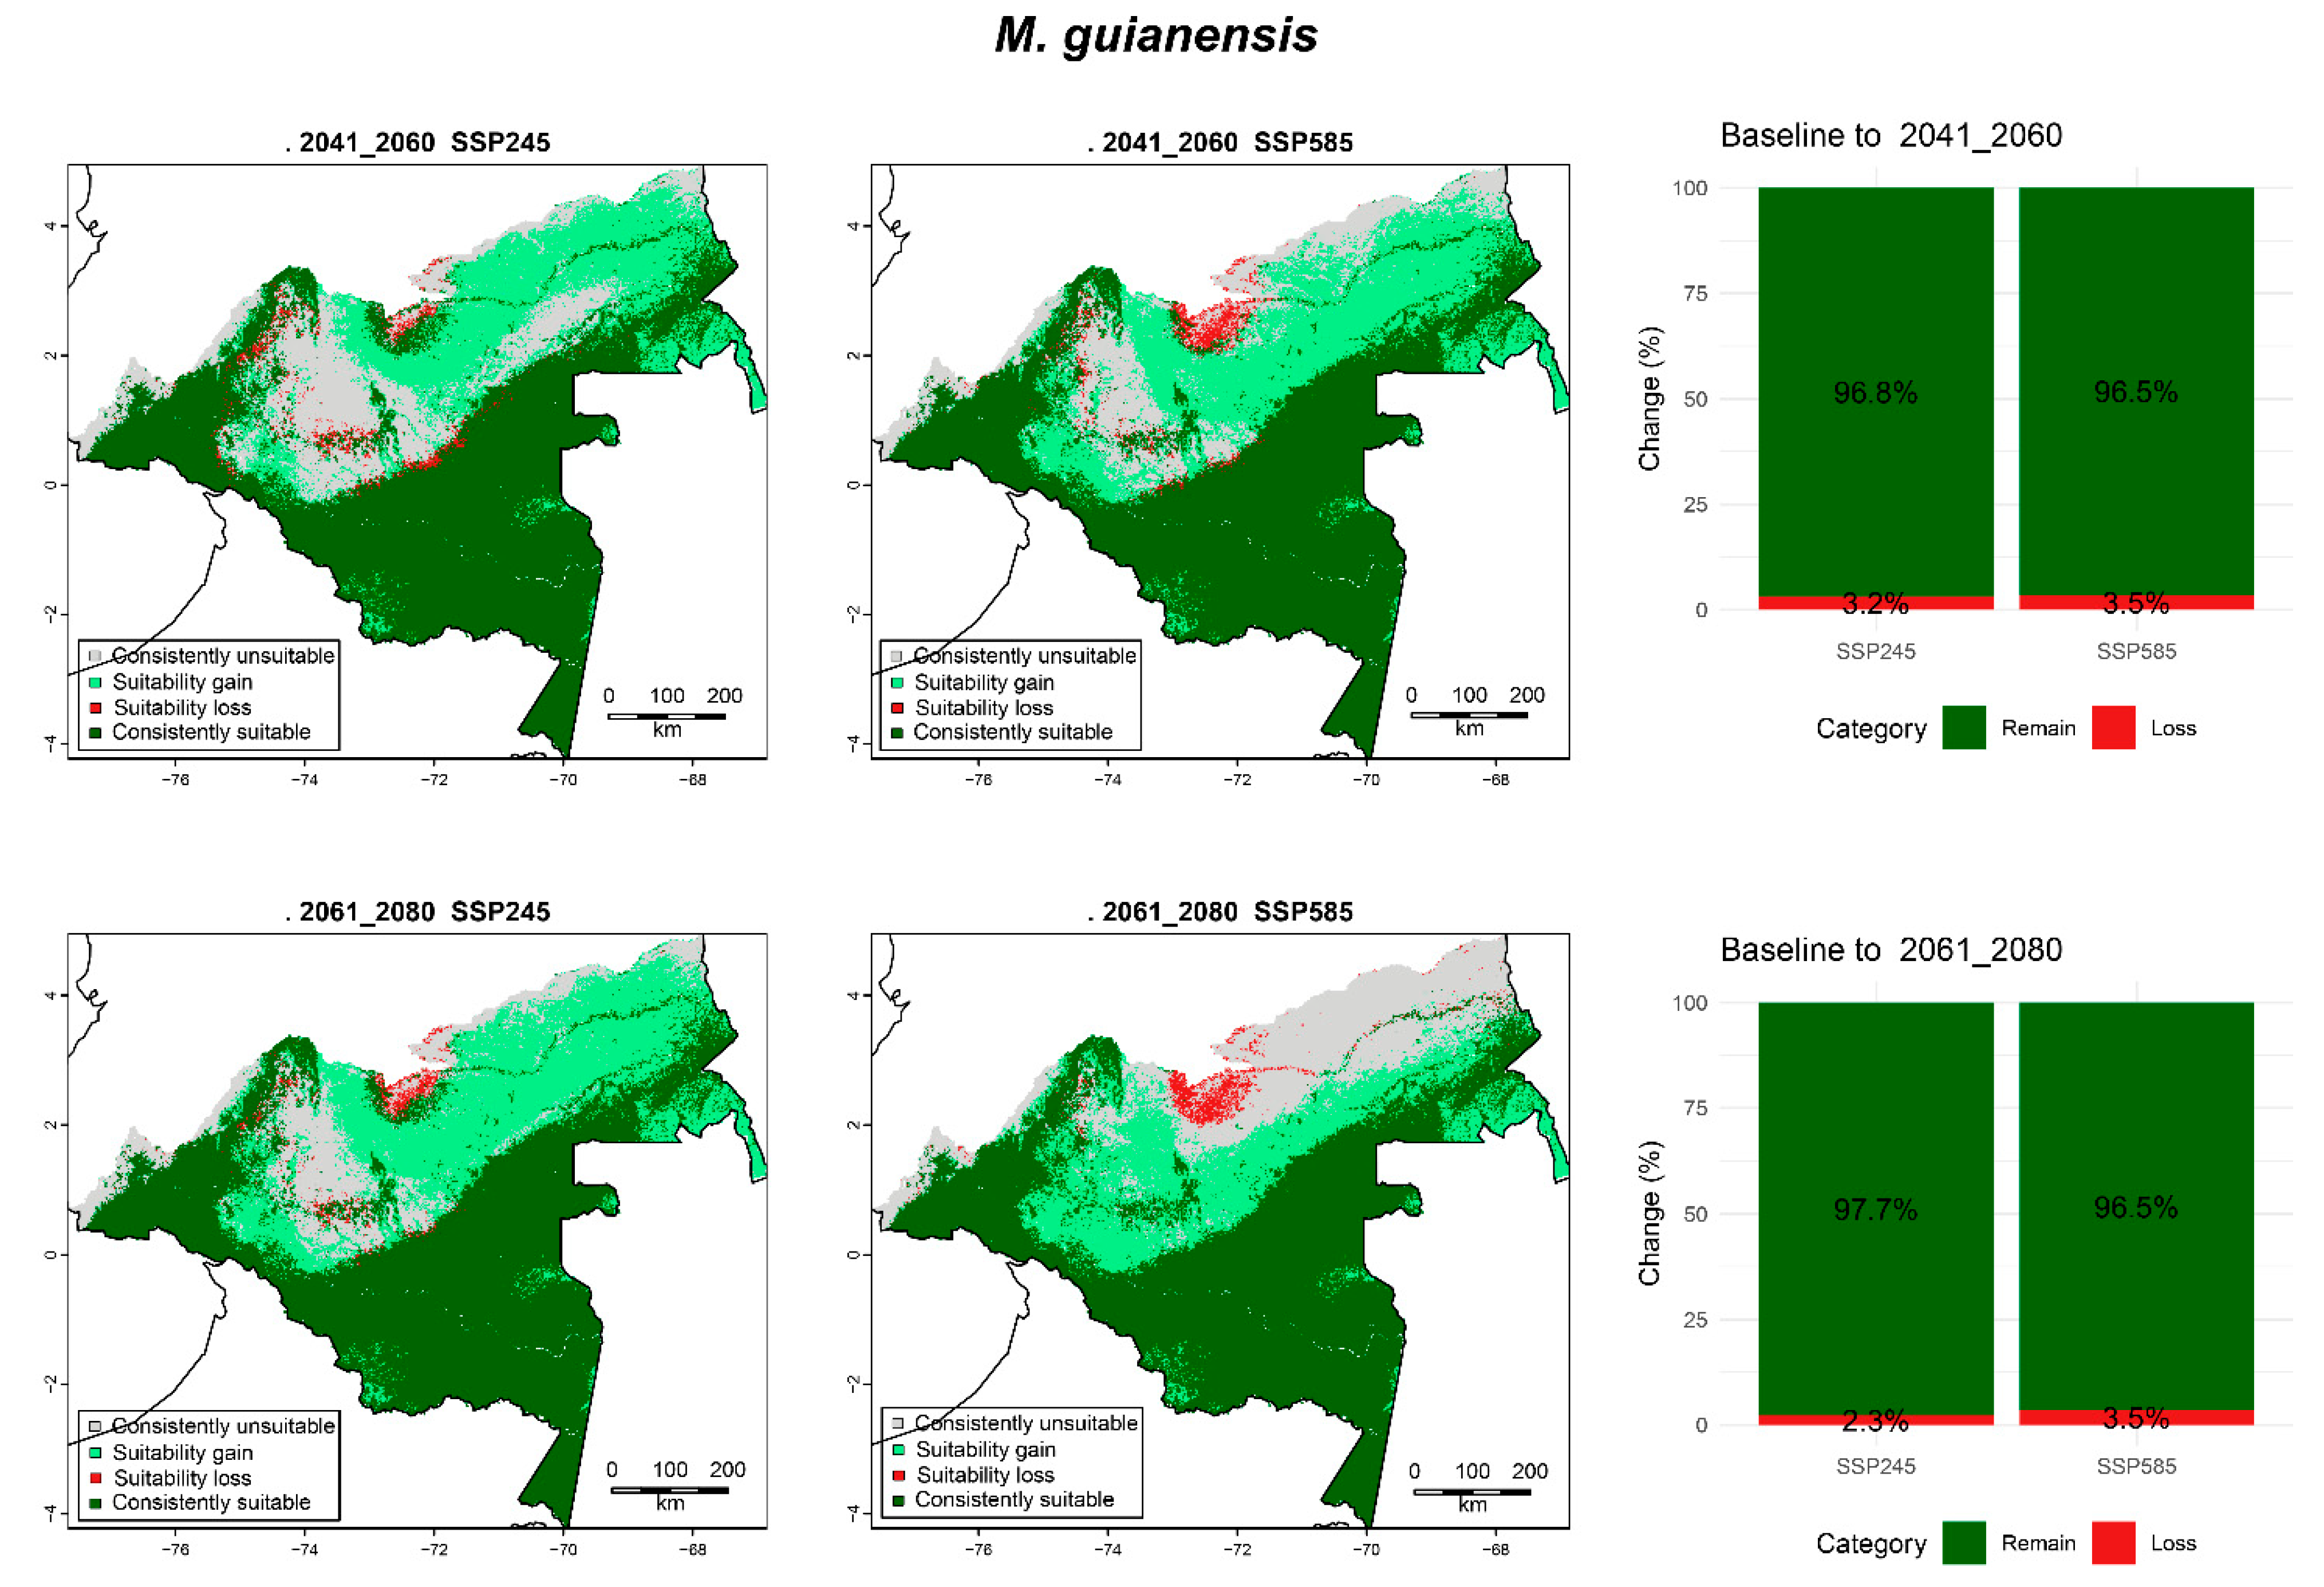
For M. guianensis, future projections indicated low but spatially structured reductions in habitat suitability across future scenarios (Table 3; Figure 6). By 2041–2060, persistence of baseline suitable areas remained high (96.8% under SSP245 and 96.5% under SSP585), yet losses increased to 3.2%–3.5%, mainly concentrated across the northern and northeastern regions of the Colombian Amazon. Toward 2061–2080, suitable areas persisted mainly in the central and southwestern Amazon, where moderate gains were projected under both scenarios, partially offsetting the contractions observed in the north. Under the high-emission scenario (SSP585), losses reached up to 3.5%, reflecting a gradual north-to-south shift in suitability. Overall, M. guianensis exhibited relatively high persistence but minimal spatial retraction toward the south-central Amazon under SSP585. Suitability losses were low under all future projections (<1 Mha; <2%) (Supplementary Figure S7).

3.6.6. C. odorata

Projections for C. odorata revealed a moderate spatial contraction of suitable habitats, particularly under the high-emission scenario (Table 3; Figure 7). During the mid-century period (2041–2060), suitable areas persisted mainly across the western Amazon and foothill regions, while losses appeared in the northern and eastern regions under both SSP245 and SSP585. By the late century (2061–2080), these reductions intensified, especially under SSP585, where habitat suitability declined by nearly 9%, indicating progressive range retraction toward the southwestern Amazon. Although isolated suitability gains were projected in central and western zones, these failed to offset the pronounced losses along the northern and eastern distribution margins. Overall, C. odorata showed moderate sensitivity to climate change, with persistent but spatially shrinking suitable areas under future conditions. Suitability losses increased slightly toward the late century (~0.5 Mha; ~1%) (Supplementary Figure S8).

3.6.7. T. cacao

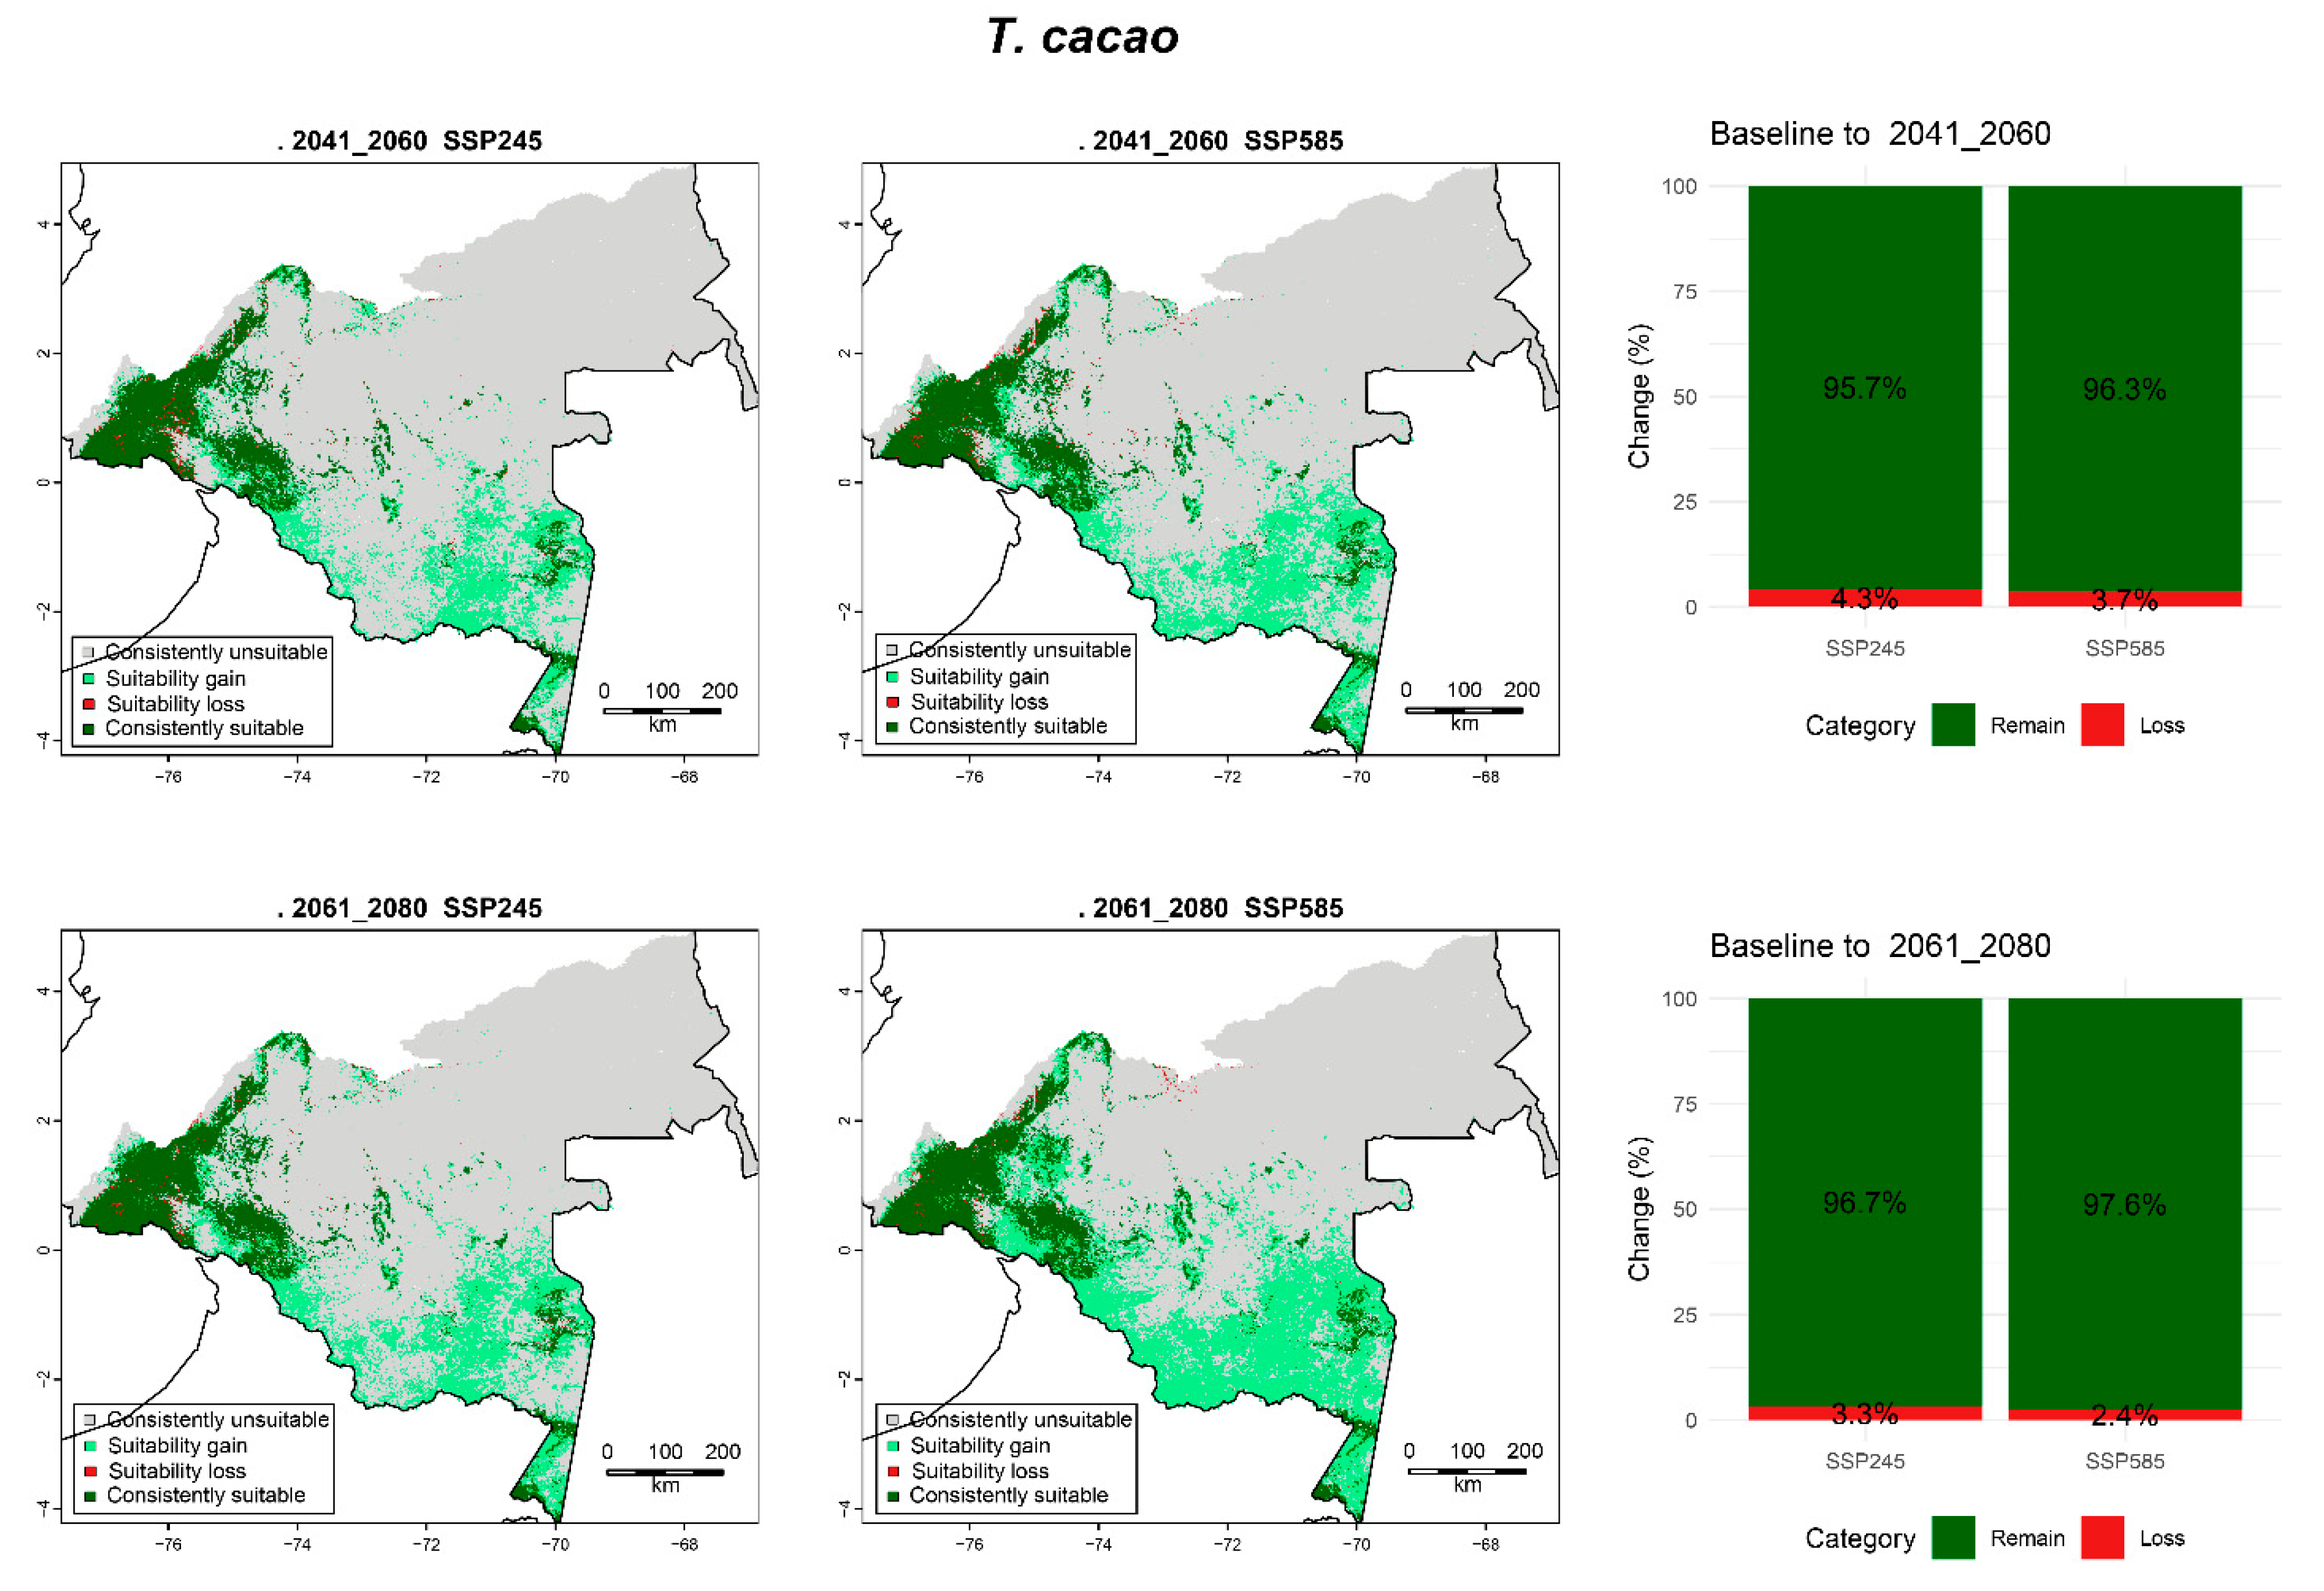
For T. cacao, projections suggested a relatively stable habitat suitability with slight variations across scenarios and periods (Table 3; Figure 8). Suitable areas persisted mainly across the western and central Amazon, where climatic conditions remained favorable, while minor contractions appeared along northern and eastern margins. By 2041–2060, persistence of baseline suitable area was 95.7% under SSP245 and 96.3% under SSP585, with losses of 4.3% and 3.7%, respectively. Toward 2061–2080, persistence improved slightly to 96.7% (SSP245) and 97.6% (SSP585), while losses declined to 3.3% and 2.4%. Suitability gains were observed across the western Amazon, partially compensating for losses concentrated in the northern and eastern portions of the distribution.
Overall, T. cacao exhibited low reductions in climatic suitability, maintaining most of its baseline habitat under both mid- and late-century projections, with only minor contractions under future climate scenarios. In all future scenarios, habitat suitability losses for this species remained below 0.3 Mha (<0.5%) (Supplementary Figure S9).

3.6.8. T. grandiflorum

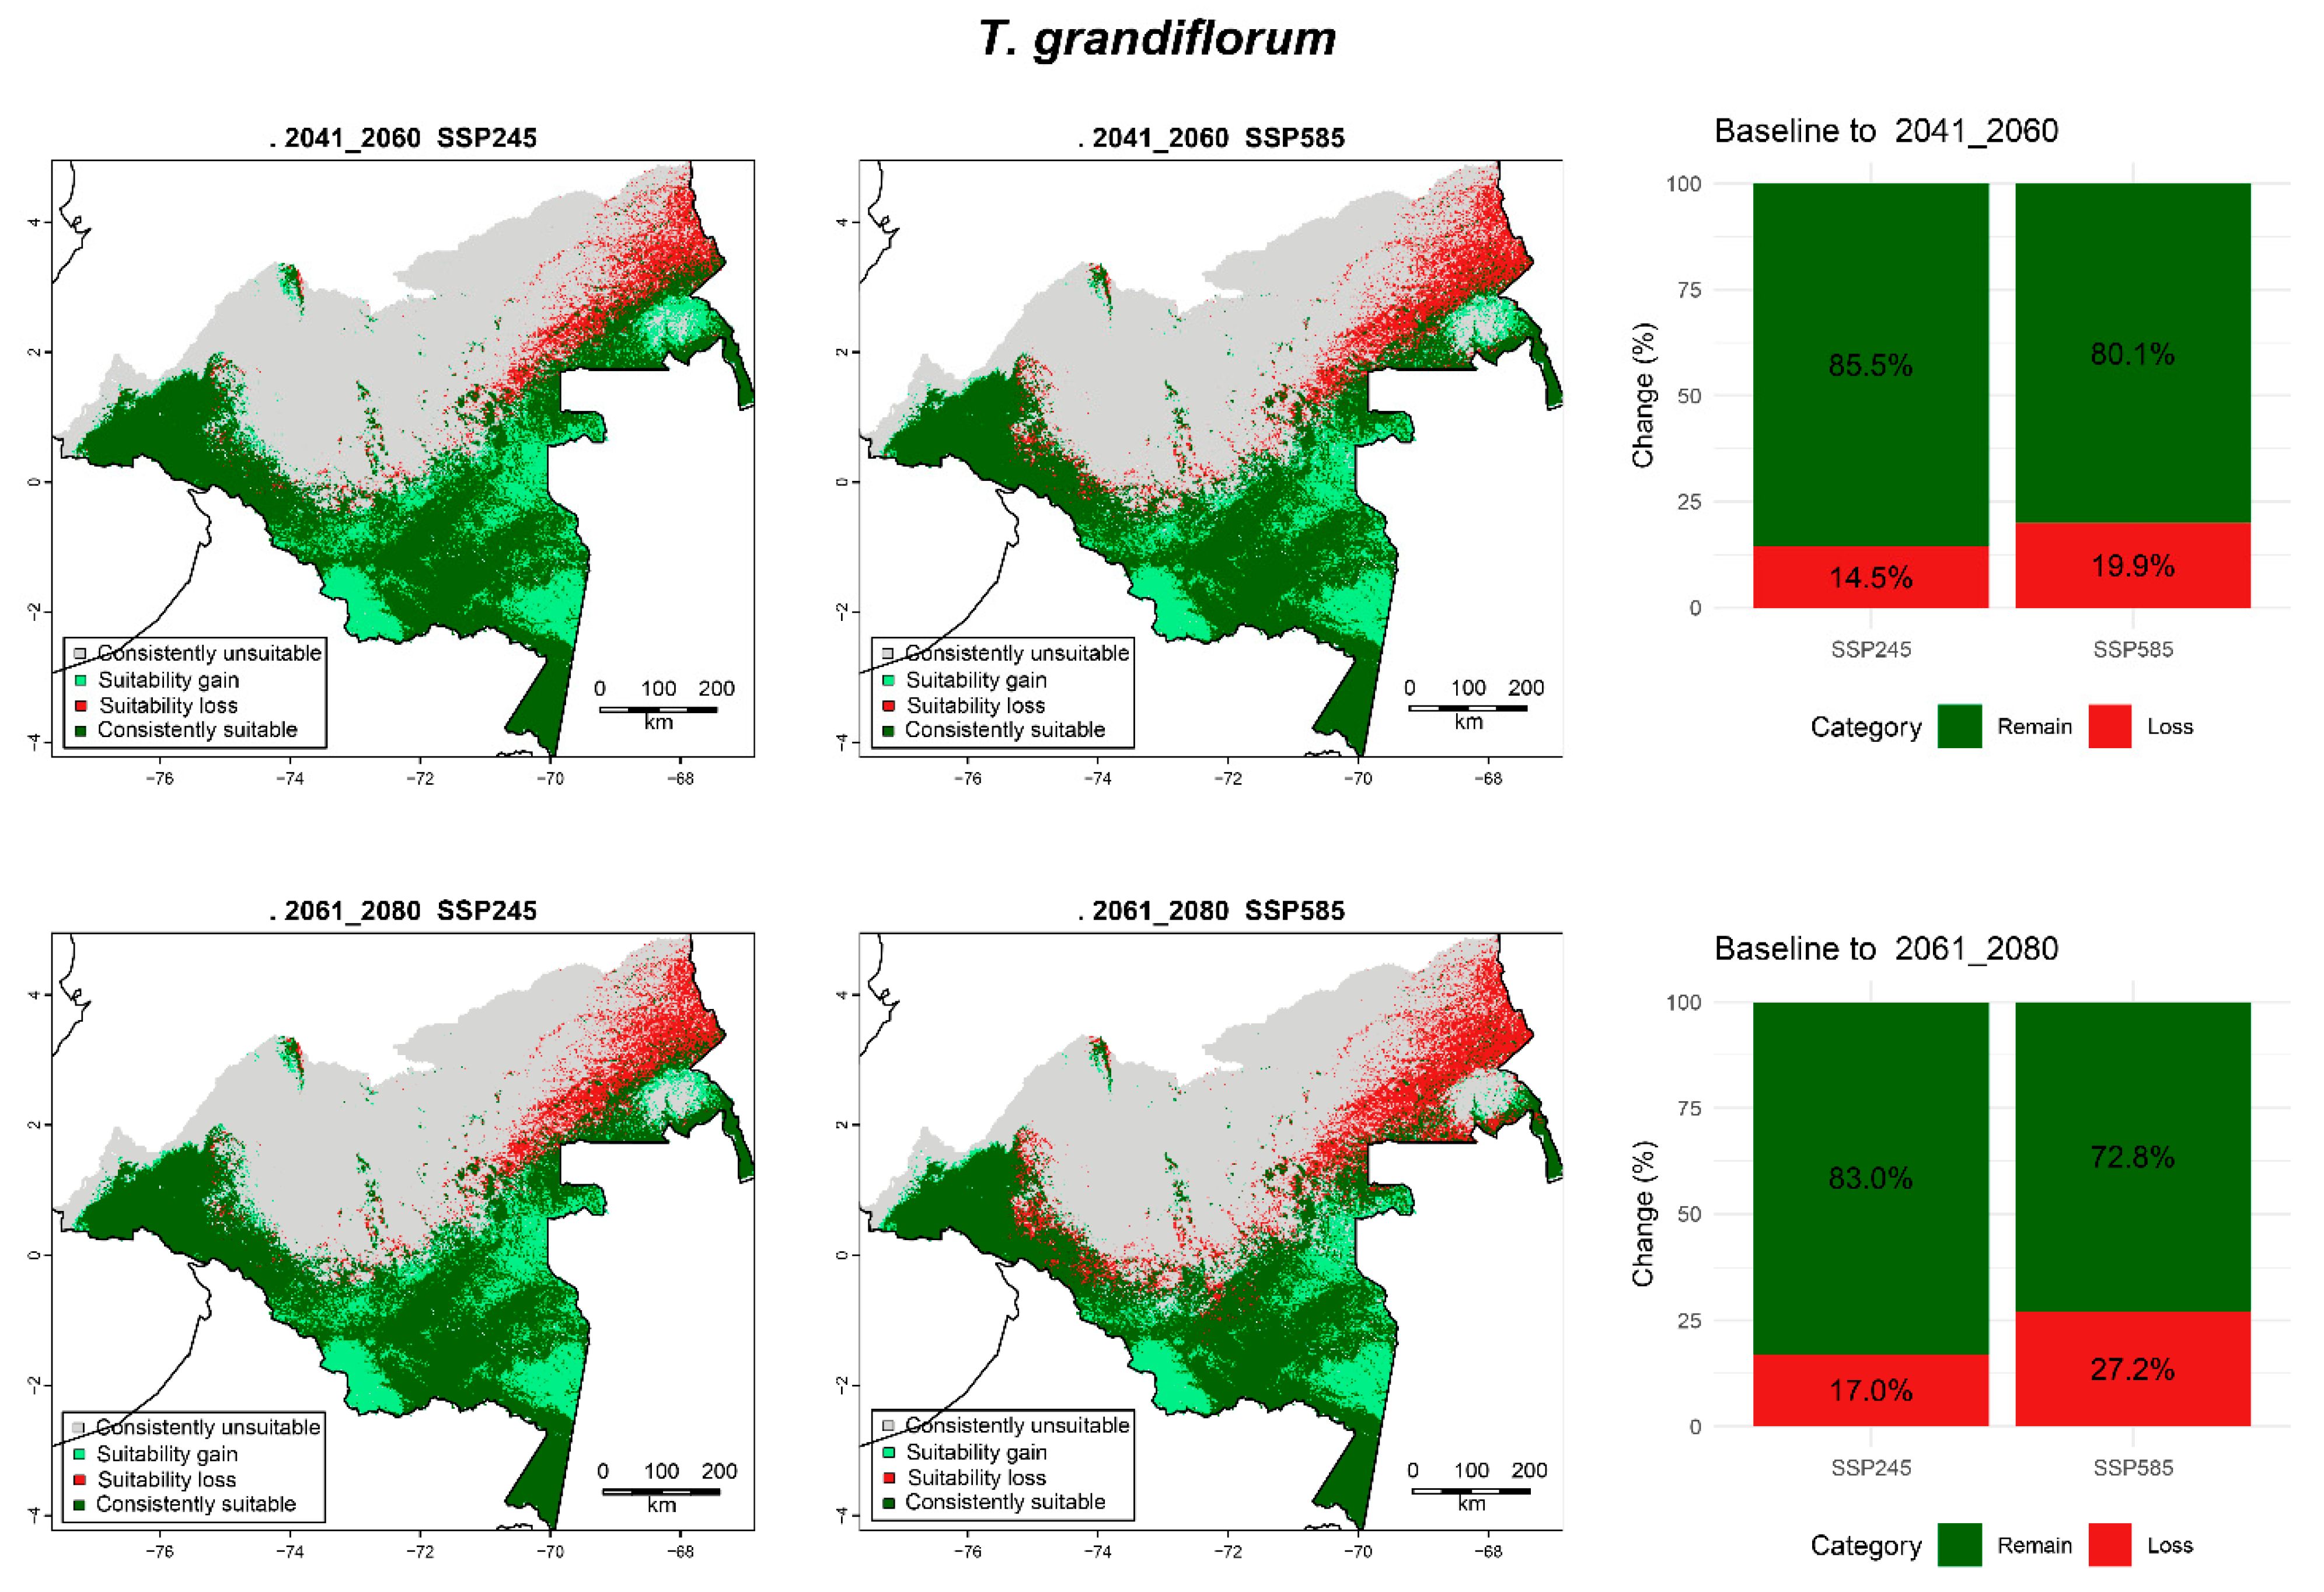
Projections for T. grandiflorum revealed the most pronounced spatial contraction among the evaluated species (Table 3; Figure 9). By 2041–2060, suitable habitats were largely restricted to the southwestern Amazon and Andean foothills, while extensive losses occurred across northern and eastern lowlands under both scenarios. Toward 2061–2080, contractions intensified, with habitat losses reaching 17.0% under SSP245 and 27.2% under SSP585.
Overall, T. grandiflorum exhibited moderate reductions in climatic suitability compared to the other species analyzed, with the strongest contractions projected for the late century under SSP585. Suitability losses were notable under all future projections, reaching up to 5.56 Mha (11.45%) under the SSP585 scenario for the 2061–2080 period (Supplementary Figure S10).

3.7. Potential Habitat Changes Within Special Management Areas

Projected changes in habitat suitability within SMAs (NNP, IR, NNR, and L2FR) revealed marked contrasts among species and between habitat condition categories (natural vs. intervened) (Supplementary Table S4). Palms such as E. precatoria, M. flexuosa, and O. bataua showed the lowest reductions, with losses below 0.2 Mha across all SMAs, and no notable differences between natural and intervened areas. V. elongata also showed minimal losses (<0.1 Mha), confirming its high persistence across both habitat conditions in most SMAs. However, the largest suitability reductions (0.24 Mha) were recorded in natural fractions of IR under the SSP585 scenario during the 2061–2080 period.
By contrast, M. guianensis and C. odorata exhibited more pronounced contractions. In natural portions of IR, losses for M. guianensis reached ~3 Mha under the most pessimistic scenario, while intervened areas added ~0.2 Mha, highlighting its sensitivity to land-use pressures. C. odorata recorded cumulative losses of nearly 0.4 Mha in natural fractions of NNP, with additional but smaller reductions in intervened areas.
Among the Theobroma species, T. cacao displayed minimal contractions (<0.2 Mha) under the less pessimistic scenario in natural fractions of NNP. In contrast, T. grandiflorum experienced the most substantial losses, particularly within natural fractions of IR, where reductions reached 6.5 and 8.1 Mha under the most pessimistic scenario for the 2041–2060 and 2061–2080 periods, respectively.
Overall, palms and V. elongata retained high habitat stability within SMAs (NNP, IR, NNR, and L2FR), whereas M. guianensis, C. odorata, and especially T. grandiflorum exhibited higher contractions, largely concentrated in natural fractions of these SMAs.

4. Discussion

4.1. Environmental Drivers Shaping Species Suitability

Hydro–climatic seasonality and soil fertility/acidity emerged as dominant predictors, consistent with previous studies highlighting the dual role of climate and soils in shaping Amazonian plant species distributions [63]. In particular, precipitation of the driest month (Bio14) and precipitation of the coldest quarter (Bio19) capture seasonal water stress, which strongly limits establishment and growth of mesic taxa, whereas soil organic carbon and pH reflect fertility and acidity gradients that regulate nutrient availability and rooting depth [64]. Together, these climatic and edaphic filters determine the physiological thresholds and competitive hierarchies among tree species, reinforcing the idea that Amazonian distributions are constrained by both moisture regimes and soil chemistry rather than either factor alone [65]. Thus, the consistent influence of these variables across species suggests that future shifts in hydrological seasonality or soil degradation could have cascading effects on species composition and ecosystem resilience.

4.2. Climate Impacts on Habitat Suitability and Distribution

Our species distribution models indicated divergent responses among eight Amazonian woody species under mid- (2041–2060) and late-century (2061–2080) climate projections, encompassing both range expansion and contraction patterns. Palms (M. flexuosa, E. precatoria, O. bataua), V. elongata, M. guianensis, and T. cacao showed high resilience due to their broad climatic envelopes and occurrence in both flooded and upland habitats, allowing persistence across environmental gradients [64,65]. In contrast, C. odorata showed moderate contractions under SSP585 by 2080 (~9%), but offsetting these reductions through gains in newly suitable regions, resulting in partial compensation under both mid- and high-emission scenarios. The most vulnerable species was T. grandiflorum, projected to lose up to 27% of its current suitable habitat under late-century SSP585. Although some gains were detected, they did not compensate for the magnitude of losses, leading to a fragmented distribution.
These divergent trajectories mirror broader ecological trends in Amazonian biota, where species with narrower climatic niches or low dispersal potential face higher vulnerability [64]. For example, a recent study on Amazonian bumblebees found one species losing ~42% of its suitable habitat by 2060 while a congeneric retained ~90% of its range, highlighting species-specific vulnerabilities [66]. In our case, moisture-loving species like T. grandiflorum appear more vulnerable to future drying and warming than more generalist palms (e.g., E. precatoria, M. flexuosa) that can thrive under a wider climatic envelope. Such differences emphasize that generalizations across all species can be misleading—some Amazonian species may retain or even expand their ranges under new climates, while others are projected to contract substantially. Consequently, conservation assessments should be conducted at the species level, focusing on those that are more vulnerable to projected climate change.
Within this spectrum of responses, T. cacao represents an interesting case, as our projection that it will retain >95% of its current suitable area and even gain new suitable zones seems optimistic compared to some prior studies. For example, Igawa et al. [38] modeled cacao suitability in the Brazilian Amazon and found that climate change (warmer and drier conditions) would sharply reduce cocoa-growing areas by 2050, with a ~37% decrease under RCP4.5 and >73% decrease under RCP8.5. They attributed this to cocoa’s sensitivity to drought—reduced rainfall and higher temperatures were projected to diminish suitable climate for cocoa cultivation. The discrepancy with our results may arise not only from differences in modeling assumptions and scope but also from regional climatic contrasts between the Colombian and Brazilian Amazon, both under current conditions and in future projections. They integrated soil conditions and current agricultural zones into their model and focused on optimal cultivation areas, whereas our ecological niche model for T. cacao considered the broader climatic tolerances. Additionally, our model’s projected “gains” for T. cacao might be in regions not currently farmed—implying potential future cultivation zones if other factors (soil, accessibility) permit. Ceccarelli et al. [67] found that in Peru, cultivated T. cacao is likely to experience range contraction under climate change, whereas wild T. cacao populations may have a more positive outlook, potentially expanding into newly suitable habitats. They highlighted the importance of identifying climate-tolerant genotypes of T. cacao in those emerging suitable areas to support future cultivation. Our findings reinforce this notion: even if overall suitable climate area for T. cacao might remain ample, it will not be in exactly the same places or for the same varieties. Thus, adaptation in the cocoa sector—through breeding drought-tolerant varieties and improved zoning based on climatic suitability—will be key to sustaining production in a changing climate.
For C. odorata, our projections indicate moderate range shifts with some expansion. A recent study in Mexico by Sampayo-Maldonado et al. [68] likewise predicted that Cedrela’s suitable range could expand slightly (by ~5%–8%) under future climates, but with a geographic redistribution: new areas becoming suitable and some current areas (e.g., the far north) losing suitability. They identified temperature and moisture thresholds for regeneration, noting that increased warmth might allow C. odorata to grow in areas previously too cool, even as hotter/drier regions become unfavorable. This aligns with our results: climate change is likely to shift its niche rather than simply shrink it. However, one caveat is that C. odorata is also heavily impacted by overexploitation (logging) and has a slow reproductive cycle. These biological constraints, rather than climatic suitability alone, may limit its natural ability to colonize new areas. Consequently, its establishment in climatically suitable zones may depend on human interventions such as restoration plantings or assisted migration (i.e., the deliberate establishment of the species in areas projected to become suitable under future climates), which can help C. odorata track its shifting climate niche.
The projections for E. precatoria show remarkable stability, with minimal habitat loss even under extreme scenarios. Marques et al. [45] obtained a comparable result—they found E. precatoria will remain broadly distributed across the Brazilian Amazon under moderate warming (SSP245), showing resilience up to a certain temperature increase. By contrast, its sister species Euterpe oleracea Mart. was much more sensitive and likely to lose suitable area under future climates. In our study we did not model E. oleracea, but the strong performance of E. precatoria underscores how even congeneric species respond differently. E. precatoria occupies predominantly upland and western Amazon habitats and appears to tolerate a wider climatic range (including seasonal drought)—it may even expand into parts of the central Amazon that become slightly drier. However, under the most extreme scenario (SSP585 late-century), even E. precatoria could eventually face stress once temperatures exceed its tolerance. Marques et al. [45] also noted that E. precatoria was resilient “up to a certain level of temperature increase”, beyond which suitability declines. This suggests a nonlinear response: moderate warming might have little effect, but very high warming could push even hardy species past a threshold. Continuous monitoring and modeling beyond 2080 would be useful, given that palms long-lived.
Our multi-species results are generally consistent with the patterns reported by de Morais et al. [69], who modeled five Amazonian timber tree species, although the magnitude of habitat loss projected in our study was comparatively lower. Under a high-emissions scenario (SSP585), they projected significant habitat losses ranging from 3% to 62% for the 2041–2060 period, whereas lower-emission scenarios (SSP245) resulted in milder impacts (1% to 29%) over the same timeframe. Most importantly, they identified the western Amazon as having the greatest concentration of remaining suitable areas in the future, making it a priority for conservation of genetic resources. Our maps likewise indicate that for many species the western Amazon (northwest Brazil, Colombia, Peru, Ecuador) will act as a refuge in a warming world. This region’s relatively cooler, wetter climate and large swaths of intact forest (including the Andes foothills that provide altitudinal escape routes) likely explain its persistence as suitable habitat under climate change. Additionally, Nunes-Silva et al. [66] specifically noted new suitable areas emerging in the western Amazon for future bumblebee populations—a pattern mirrored in our tree species projections. Altogether, these studies (including ours) point to west Amazonia as a climate refuge that could sustain biodiversity even as the eastern and southern Amazon face harsher climatic changes.

4.3. Implications of Habitat Changes Within Special Management Areas

Results revealed differences in habitat suitability losses across species and SMAs. E. precatoria, M. flexuosa, and O. bataua retained high climatic stability, with minimal reductions in suitability. This resilience is consistent with previous studies reporting broad climatic tolerance and persistence of palm-dominated systems under Amazonian disturbance regimes [41,45,70]. Similarly, V. elongata showed negligible contractions, further underscoring its stability under future climate scenarios. This persistence was consistent across both natural and intervened areas, although slightly greater reductions occurred in natural areas, likely reflecting differences in current habitat extent rather than differential exposure to climate change. The overall pattern highlights the relatively broad ecological amplitude of this late-successional species, which may confer resilience to moderate climatic fluctuations [64]. This suggests that V. elongata may play an increasingly important role in forest dynamics under future climates, maintaining both structural and functional contributions to canopy composition [63].
By contrast, M. guianensis and C. odorata exhibited higher contractions, especially in areas currently dominated by natural forest cover (i.e., IR and NNP). The sensitivity of M. guianensis to climatic drying is consistent with evidence that moisture-dependent hardwoods are particularly vulnerable to warming trends and deforestation frontiers in the Amazon [64]. For C. odorata, cumulative losses in natural forests may exacerbate pressures already imposed by selective logging, as this species is among the most exploited Neotropical timbers [44].
T. cacao displayed remarkable stability under intermediate warming pathways, consistent with previous modeling studies in agroforestry landscapes [38,39,71]. This apparent stability may reflect its relatively broad climatic tolerance or the buffering effects associated with shaded cultivation systems, rather than domestication per se. Conversely, T. grandiflorum suffered the greatest contractions, pointing to the heightened vulnerability of mesic-adapted species to projected climatic drying in the northwestern Amazon. These contrasting responses highlight the need for conservation and restoration strategies that consider species-specific vulnerabilities rather than assuming uniform responses across taxa [63].
At the same time, it is important to acknowledge that our models focused exclusively on climate change, whereas ongoing deforestation represents an equally relevant threat that may prevent species from occupying climatically suitable areas projected for the future [22,26,33]. The heterogeneous responses observed among species underscore that climate projections can serve as a tool to orient conservation, restoration, and sustainable use priorities, by identifying areas most likely to remain suitable in the long term and thus ensuring that interventions enhance ecosystem resilience rather than target areas at risk of becoming unsuitable.

4.4. Methodological Strengths and Limitations of the SDM Approach

This modeling framework emphasized traceability and methodological robustness throughout all stages of the SDM process. Key strengths included rigorous data cleaning, spatial thinning, and pseudo-absence selection restricted to accessible areas, combined with variable screening to ensure interpretability [48]. Incorporating both climatic and static predictors (soil, topography) reduced the risk of climate-only overestimations, aligning with recent calls for multi-predictor frameworks [36,69,72]. Ensemble projections were further strengthened by spatial block cross-validation, optimal thresholding (Youden/TSS), and a performance-weighted committee that reduced inter-algorithm variance [66,73].
Nevertheless, limitations remain. These include spatial thinning and pseudo-absence selection with prevalence-based sampling, combined with variable screening to ensure interpretability [74]. Similarly, AUC-based weighting privileges model discrimination but does not guarantee probability calibration, which may bias ensemble weighting in some contexts [75,76].
Binarized ensemble maps provide cartographic clarity but lose probabilistic detail, underscoring the need to report both probabilistic and categorical ensembles [66,77]. For this reason, reporting documenting threshold sensitivity, and complementing discrimination with calibration diagnostics is advisable.
Finally, future work could build upon our climate–environmental projections by incorporating deforestation scenarios, land-use change dynamics, and dispersal constraints. Such integration would refine estimates under combined pressures while reinforcing the robustness of our current findings.

5. Conclusions

This study provides a comprehensive assessment of how climate change may reshape both the potential distribution and habitat suitability of eight ecologically and socioeconomically important woody plant species in the Colombian Amazon. The ensemble modeling approach, integrating bioclimatic, edaphic, and topographic predictors, revealed heterogeneous species responses under future scenarios (SSP245 and SSP585) for 2041–2060 and 2061–2080. Palms (M. flexuosa, E. precatoria, O. bataua), V. elongata, M. guianensis and T. cacao exhibited high climatic resilience, retaining more than 95% of their current suitable habitat and even expanding into new areas. In contrast, C. odorata, and particularly T. grandiflorum (losses ~27%) showed moderate contractions under the high-emission scenario (SSP585).
Regarding SMAs, habitat losses were mainly concentrated in the natural fractions of IR and NNP, underscoring the importance of these areas for long-term species persistence.
Overall, these results demonstrate that climate change impacts are species-specific and spatially heterogeneous, emphasizing the need for conservation and restoration planning at both the species and landscape levels. Protecting remaining suitable habitats, reinforcing ecological connectivity within SMAs, and prioritizing climate-resilient taxa for restoration and sustainable use are essential to maintain biodiversity and ecosystem functionality under future climatic conditions.

Supplementary Materials

The following supporting information can be downloaded at: https://www.mdpi.com/article/10.3390/f16111640/s1, Figure S1: Species-specific Pearson correlation matrices of the predictor set used in the SDMs; Figure S2: Cross-validation performance and spatial bias control; Figure S3: Continuous habitat suitability for Euterpe precatoria; Figure S4: Continuous habitat suitability for Oenocarpus bataua; Figure S5: Continuous habitat suitability for Mauritia flexuosa; Figure S6: Continuous habitat suitability for Virola elongata; Figure S7: Continuous habitat suitability for Minquartia guianensis; Figure S8: Continuous habitat suitability for Cedrela odorata; Figure S9: Continuous habitat suitability for Theobroma cacao; Figure S10: Continuous habitat suitability for Theobroma grandiflorum; Table S1: List of eight Amazonian woody plant species; Table S2: Occurrence retrieval, quality control, and spatial thinning summary for eight Amazonian woody plant species; Table S3: Relative contribution (%) of bioclimatic, soil, and terrain predictors to four algorithms for each species; Table S4: Species Distribution Model–derived habitat suitability within special management areas in the Colombian Amazon including National Natural Parks (NNP), Indigenous Reserves (IR), National Natural Reserves (NNR), and the Law 2 Forest Reserve (L2FR).

Author Contributions

Conceptualization, U.G.M.-G., A.S. and J.R.-E.; methodology, J.R.-E., A.S., J.A.C.-R. and M.I.A.-S.; software, J.R.-E. and J.A.C.-R.; validation, J.R.-E. and A.S.; formal analysis, J.R.-E. and J.A.C.-R.; investigation, U.G.M.-G., A.S., J.R.-E. and C.H.R.-L.; resources, U.G.M.-G. and C.H.R.-L.; data curation, J.R.-E., A.S. and J.A.C.-R.; writing—original draft preparation, A.S. and J.R.-E.; writing—review and editing, A.S. and U.G.M.-G.; visualization, J.R.-E. and A.S.; supervision, U.G.M.-G.; A.S. and C.H.R.-L.; project administration, U.G.M.-G.; funding acquisition, U.G.M.-G. All authors have read and agreed to the published version of the manuscript.

Funding

This research was part of the project BPIN 202300000000285 “Investigación científica transformativa para potenciar el bienestar, la conservación y la gobernanza ambiental en la Amazonia colombiana Amazonas, Caquetá, Guainía, Guaviare, Meta, Putumayo, Vaupés”.

Data Availability Statement

Data is contained within the article and Supplementary Materials.

Acknowledgments

The authors gratefully acknowledge the administrative staff of the Amazonian Scientific Research Institute Sinchi for their valuable support in facilitating the logistical and organizational aspects of this research.

Conflicts of Interest

The authors declare no conflicts of interest. The funders had no role in the design of the study; in the collection, analyses, or interpretation of the data; in the writing of the manuscript, or in the decision to publish the results.

References

  1. Nobre, C.A.; Peña-Claros, M.; Arieira, J.; Brandão, D.O.; Riveros, F.V. Climate Change and Sustainability in Amazonia 2025. In Oxford Research Encyclopedia of Climate Science; Oxford University Press: Oxford, UK.
  2. Artaxo, P.; Hansson, H.C.; Machado, L.A.T.; Rizzo, L. V Tropical Forests Are Crucial in Regulating the Climate on Earth. PLOS Clim. 2022, 1, e0000054. [Google Scholar] [CrossRef]
  3. Ter Steege, H. Hyperdominance in the Amazonian Tree Flora. Science 2013, 342, 1243092. [Google Scholar] [CrossRef]
  4. Crowther, T.W.; Glick, H.B.; Covey, K.R.; Bettigole, C.; Maynard, D.S.; Thomas, S.M.; Smith, J.R.; Hintler, G.; Duguid, M.C.; Amatulli, G.; et al. Mapping Tree Density at a Global Scale. Nature 2015, 525, 201–205. [Google Scholar] [CrossRef]
  5. Moraes, R.; Correa, S.; Doria, C.; Duponchelle, F. Amazonian Ecosystems and Their Ecological Functions. In Amazon Assessment Report 2021; Nobre, C., Encalada, A., Anderson, E., Alcazar, F., Bustamante, M., Mena, C., Peña-Claros, M., et al., Eds.; United Nations Sustainable Development Solutions: New York, NY, USA, 2021; pp. 1–33. [Google Scholar]
  6. Qin, Y.; Xiao, X.; Liu, F.; de Sa e Silva, F.; Shimabukuro, Y.; Arai, E.; Fearnside, P.M. Forest Conservation in Indigenous Territories and Protected Areas in the Brazilian Amazon. Nat. Sustain. 2023, 6, 295–305. [Google Scholar] [CrossRef]
  7. Donadio Linares, L.M. The Awkward Question: What Baseline Should Be Used to Measure Biodiversity Loss? The Role of History, Biology and Politics in Setting up an Objective and Fair Baseline for the International Biodiversity Regime. Environ. Sci. Policy 2022, 135, 137–146. [Google Scholar] [CrossRef]
  8. IPCC. Climate Change 2021. The Physical Science Basis. In Contribution of Working Group I to the Sixth Assessment Report of the Intergovernmental Panel on Climate Change (IPCC); IPCC: Geneva, Switzerland, 2021. [Google Scholar]
  9. Murcia, U.; Barón, O.; Leon, A.; Garcia, S.; Arias, J. Cambios Multitemporales En El Período 2014 al 2016 y Coberturas Del Año 2016; Instituto Amazónico de Investigaciones Científicas Sinchi: Bogotá, Colombia, 2017; ISBN 9789585427105. [Google Scholar]
  10. Ortega, M.A.; Cayuela, L.; Griffith, D.M.; Camacho, A.; Coronado, I.M.; del Castillo, R.F.; Figueroa-Rangel, B.L.; Fonseca, W.; Garibaldi, C.; Kelly, D.L.; et al. Climate Change Increases Threat to Plant Diversity in Tropical Forests of Central America and Southern Mexico. PLoS ONE 2024, 19, e0297840. [Google Scholar] [CrossRef] [PubMed]
  11. Pecl, G.T.; Araújo, M.B.; Bell, J.D.; Blanchard, J.; Bonebrake, T.C.; Chen, I.-C.; Clark, T.D.; Colwell, R.K.; Danielsen, F.; Evengård, B.; et al. Biodiversity Redistribution under Climate Change: Impacts on Ecosystems and Human Well-Being. Science 2017, 355, eaai9214. [Google Scholar] [CrossRef]
  12. Habibullah, M.S.; Din, B.H.; Tan, S.-H.; Zahid, H. Impact of Climate Change on Biodiversity Loss: Global Evidence. Environ. Sci. Pollut. Res. 2022, 29, 1073–1086. [Google Scholar] [CrossRef] [PubMed]
  13. IPCC Summary for Policymakers. Contribution of Working Groups I, II and III to the Sixth Assessment Report of the Intergovernmental Panel on Climate Change. In Climate Change 2023: Synthesis Report; Core Writing Team, Lee, H., Romero, J., Eds.; IPCC: Geneva, Switzerland, 2023; pp. 1–34. [Google Scholar]
  14. Shahzad, A. Climate Change and Its Impact on Global Biodiversity. Prem. J. Environ. Sci. 2025, 3, 100013. [Google Scholar] [CrossRef]
  15. Marengo, J.A.; Souza, C.M.; Thonicke, K.; Burton, C.; Halladay, K.; Betts, R.A.; Alves, L.M.; Soares, W.R. Changes in Climate and Land Use Over the Amazon Region: Current and Future Variability and Trends. Front. Earth Sci. 2018, 6, 228. [Google Scholar] [CrossRef]
  16. Gatti, L.V.; Melack, J.; Basso, L.S.; Restrepo-Coupe, N.; Aguiar, A.P.; Pangala, S.; Saleska, S.R.; Aragão, L.E.O.; Phillips, O.L.; Armenteras, D. The Amazon Carbon Budget. In Amazon Assessment Report 2021; Nobre, C., Encalada, A., Anderson, E., Alcazar, F., Bustamente, M., Mena, C., Peña-Claros, M., Eds.; UN Sustainable Development Solutions Network (SDSN): New York, NY, USA, 2021; pp. 1–9. [Google Scholar]
  17. Da Silva, J.M.C.; Rapini, A.; Barbosa, L.C.F.; Torres, R.R. Extinction Risk of Narrowly Distributed Species of Seed Plants in Brazil Due to Habitat Loss and Climate Change. PeerJ 2019, 7, e7333. [Google Scholar] [CrossRef]
  18. Marengo, J.; Souza, C., Jr. Climate Change: Impacts and Scenarios for the Amazon; University of São Paulo: São Paulo, Brazil, 2018. [Google Scholar]
  19. Lovejoy, T.E.; Nobre, C. Amazon Tipping Point. Sci. Adv. 2018, 4, eaat2340. [Google Scholar] [CrossRef]
  20. Nepstad, D.C.; Stickler, C.M.; Filho, B.S.-; Merry, F. Interactions among Amazon Land Use, Forests and Climate: Prospects for a near-Term Forest Tipping Point. Philos. Trans. R. Soc. B Biol. Sci. 2008, 363, 1737–1746. [Google Scholar] [CrossRef] [PubMed]
  21. Aguirre-Gutiérrez, J.; Díaz, S.; Rifai, S.W.; Corral-Rivas, J.J.; Nava-Miranda, M.G.; González-M, R.; Hurtado-M, A.B.; Revilla, N.S.; Vilanova, E.; Almeida, E.; et al. Tropical Forests in the Americas Are Changing Too Slowly to Track Climate Change. Science 2025, 387, eadl5414. [Google Scholar] [CrossRef]
  22. Berenguer, E.; Armenteras, D.; Lees, A.C.; Smith, C.C.; Fearnside, P.; Nascimento, N.; Alencar, A.; Almeida, C.; Aragão, L.E.O.; Barlow, J.; et al. Drivers and Ecological Impacts of Deforestation and Forest Degradation. In Amazon Assessment Report 2021; Nobre, C., Encalada, A., Anderson, E., Alcazar, F., Bustamante, M., Mena, C., Peña-Claros, M., Eds.; UN Sustainable Development Solutions Network (SDSN): New York, NY, USA, 2021. [Google Scholar]
  23. Du, Y.; Gao, G.; Ma, X.; Xu, S.; Fu, B. Amazon Basin Shows Reduced Forest Loss but Increased Forest Spatial Fragmentation in 1992–2020. Sci. Total Environ. 2025, 990, 179917. [Google Scholar] [CrossRef]
  24. IPBES. Global Assessment Report on Biodiversity and Ecosystem Services of the Intergovernmental Science-Policy Platform on Biodiversity and Ecosystem Services; Brondizio, E.S., Settele, J., Díaz, S., Ngo, H.T., Eds.; IPBES Secretariat: Bonn, Germany, 2019; 1148p. [Google Scholar] [CrossRef]
  25. Kouhestani, F. The Impact of Climate Change on Biological Systems and Biodiversity. Int. J. Sci. Res. Arch. 2025, 14, 1885–1900. [Google Scholar] [CrossRef]
  26. Gomes, V.H.F.; Vieira, I.C.G.; Salomão, R.P.; ter Steege, H. Amazonian Tree Species Threatened by Deforestation and Climate Change. Nat. Clim. Chang. 2019, 9, 547–553. [Google Scholar] [CrossRef]
  27. Bernal, R.; Gradstein, S.; Celis, M. Catálogo de Plantas y Líquenes de Colombia; Universidad Nacional de Colombia (Sede Bogotá): Bogotá, Colombia, 2016. [Google Scholar]
  28. SIAT-AC. Instituto Amazónico de Investigaciones Científicas SINCHI. Indicadores de Monitoreo Ambiental SIMAAC. Sistema Regional de Indicadores de Monitoreo Ambiental de La Amazonia Colombiana. Available online: https://siatac.co/monitoreo-ambiental-simaac/ (accessed on 10 August 2025).
  29. ter Steege, H.; Pitman, N.C.A.; do Amaral, I.L.; de Souza Coelho, L.; de Almeida Matos, F.D.; de Andrade Lima Filho, D.; Salomão, R.P.; Wittmann, F.; Castilho, C.V.; Guevara, J.E.; et al. Mapping Density, Diversity and Species-Richness of the Amazon Tree Flora. Commun. Biol. 2023, 6, 1130. [Google Scholar] [CrossRef]
  30. Instituto de Hidrología, Meteorología y Estudios Ambientales—Ideam. Escenarios de Cambio Climático de La Cuarta Comunicación de Colombia; Instituto de Hidrología, Meteorología y Estudios Ambientales—Ideam, Ministerio de Ambiente y Desarrollo Sostenible, Programa de las Naciones Unidas para el Desarrollo—PNUD, Fundación Natura y Proyecto GEF-CBIT “Transparencia Climática Colombia”: Bogotá, Colombia, 2024. [Google Scholar]
  31. Instituto Amazónico de Investigaciones Científicas SINCHI. Sistema de Información Ambiental Territorial de la Amazonia colombiana SIAT-AC Coberturas de La Tierra—SIMCOBA. Available online: https://siatac.co/simcoba/ (accessed on 15 August 2025).
  32. Ministerio de Ambiente y Desarrollo Sostenible Estrategia Nacional de Restauración 2023–2026. 2023. Available online: https://www.minambiente.gov.co/wp-content/uploads/2025/03/ENR_3032025-1.pdf (accessed on 20 August 2025).
  33. Williams, C.A.; de Almeida, C.T.; Silva Junior, C.H.L. Unraveling the Drivers and Feedbacks of Deforestation across the Amazon Basin. Nat. Sustain. 2024, 7, 110–120. [Google Scholar]
  34. de Andrade, A.F.A.; Velazco, S.J.E.; De Marco Júnior, P. ENMTML: An R Package for a Straightforward Construction of Complex Ecological Niche Models. Environ. Model. Softw. 2020, 125, 104615. [Google Scholar] [CrossRef]
  35. Guisan, A.; Thuiller, W.; Zimmermann, N.E. Habitat Suitability and Distribution Models with Applications in R. In Habitat Suitability and Distribution Models: With Applications in R; Ecology, Biodiversity and Conservation, Cambridge University Press: Cambridge, UK, 2017; ISBN 9780521765138. [Google Scholar]
  36. Zhao, Y.; Xu, L.; Zhang, Y.; Wen, Y.; Zhang, D. Climate-Change Impacts on Distribution, Habitats, Sustainability and Cultivation Planning of Two Economically and Ecologically Important Forest Trees (China Fir and Masson Pine) in China. Glob. Ecol. Conserv. 2025, 57, e03349. [Google Scholar] [CrossRef]
  37. González-Orozco, C.E.; Pesca, A. Regionalization of Cacao (Theobroma cacao L.) in Colombia. Front. Sustain. Food Syst. 2022, 6, 925800. [Google Scholar] [CrossRef]
  38. Igawa, T.K.; de Toledo, P.M.; Anjos, L.J.S. Climate Change Could Reduce and Spatially Reconfigure Cocoa Cultivation in the Brazilian Amazon by 2050. PLoS ONE 2022, 17, e0262729. [Google Scholar] [CrossRef]
  39. Nelson, J.T.; Motamayor, J.C.; Cornejo, O.E. Environment and Pathogens Shape Local and Regional Adaptations to Climate Change in the Chocolate Tree, Theobroma cacao L. Mol. Ecol. 2021, 30, 656–669. [Google Scholar] [CrossRef]
  40. Urrego, L.E.; Galeano, A.; Peñuela, C.; Sánchez, M.; Toro, E. Climate-Related Phenology of Mauritia Flexuosa in the Colombian Amazon. Plant Ecol. 2016, 217, 1207–1218. [Google Scholar] [CrossRef]
  41. Sanjurjo-Vílchez, J.; Soudre-Zambrano, M.; Bendayán-Acosta, L. Distribución Biogeográfica de Seis Especies de Frutales Nativos En La Región Loreto, Perú. Una Aproximación al 2020 Mediante Modelamiento y Simulación Usando DIVA-GIS. Folia Amaz. 2012, 21, 129–140. [Google Scholar] [CrossRef]
  42. Da Costa, W.P.L.B.; Pinheiro, É.F.M.; Latorraca, J.V.F.; Moutinho, V.H.P.; Carmo, F.H.D.J.; Ataíde, G.C.V.S.; Volpato, M.; Aguiar, D.L.; Andrade, F.W.C. The Climate Change Influence on Cedrela odorata L. Radial Growth in the Amazon. Sustainability 2023, 15, 16755. [Google Scholar] [CrossRef]
  43. Cotrina Sánchez, A.; Rojas Briceño, N.B.; Bandopadhyay, S.; Ghosh, S.; Torres Guzmán, C.; Oliva, M.; Guzman, B.K.; Salas López, R. Biogeographic Distribution of Cedrela spp. Genus in Peru Using MaxEnt Modeling: A Conservation and Restoration Approach. Diversity 2021, 13, 261. [Google Scholar] [CrossRef]
  44. Estrada-Contreras, I.; Equihua, M.; Laborde, J.; Martínez Meyer, E.; Sánchez-Velásquez, L.R. Current and Future Distribution of the Tropical Tree Cedrela odorata L. in Mexico under Climate Change Scenarios Using MaxLike. PLoS ONE 2016, 11, e0164178. [Google Scholar] [CrossRef]
  45. Marques, M.J.; de Souza Bezerra, C.; Tomaz, J.S.; Lopes, R.; Wrege, M.S.; de Aguiar, A.V.; Ramos, S.L.F.; Meneses, C.H.S.G.; de Jesus Pinto Fraxe, T.; Lopes, M.T.G. Prediction of Geographic Distribution and Ecological Niche Modeling of Açaí Palm Trees in the Amazon. Pesqui. Agropecu. Trop. 2024, 54, e78108. [Google Scholar] [CrossRef]
  46. Zizka, A.; Silvestro, D.; Andermann, T.; Azevedo, J.; Ritter, C.D.; Edler, D.; Farooq, H.; Herdean, A.; Ariza, M.; Scharn, R.; et al. CoordinateCleaner: Standardized Cleaning of Occurrence Records from Biological Collection Databases. Methods Ecol. Evol. 2019, 10, 744–751. [Google Scholar] [CrossRef]
  47. Aiello-Lammens, M.E.; Boria, R.A.; Radosavljevic, A.; Vilela, B.; Anderson, R.P. SpThin: An R Package for Spatial Thinning of Species Occurrence Records for Use in Ecological Niche Models. Ecography 2015, 38, 541–545. [Google Scholar] [CrossRef]
  48. Barve, N.; Barve, V.; Jiménez-Valverde, A.; Lira-Noriega, A.; Maher, S.P.; Peterson, A.T.; Soberón, J.; Villalobos, F. The Crucial Role of the Accessible Area in Ecological Niche Modeling and Species Distribution Modeling. Ecol. Modell. 2011, 222, 1810–1819. [Google Scholar] [CrossRef]
  49. Hijmans, R.J. Spatial Data Analysis [R Package Terra Version 1.8-60]. CRAN: Contributed Packages 2025. Available online: https://CRAN.R-project.org/package=mgcv (accessed on 15 August 2025).
  50. Farr, T.G.; Rosen, P.A.; Caro, E.; Crippen, R.; Duren, R.; Hensley, S.; Kobrick, M.; Paller, M.; Rodriguez, E.; Roth, L.; et al. The Shuttle Radar Topography Mission. Rev. Geophys. 2007, 45. [Google Scholar] [CrossRef]
  51. Fick, S.E.; Hijmans, R.J. WorldClim 2: New 1-Km Spatial Resolution Climate Surfaces for Global Land Areas. Int. J. Climatol. 2017, 37, 4302–4315. [Google Scholar] [CrossRef]
  52. Poggio, L.; de Sousa, L.M.; Batjes, N.H.; Heuvelink, G.B.M.; Kempen, B.; Ribeiro, E.; Rossiter, D. SoilGrids 2.0: Producing Soil Information for the Globe with Quantified Spatial Uncertainty. SOIL 2021, 7, 217–240. [Google Scholar] [CrossRef]
  53. Naimi, B.; Hamm, N.A.S.; Groen, T.A.; Skidmore, A.K.; Toxopeus, A.G. Where Is Positional Uncertainty a Problem for Species Modelling? Ecography 2014, 37, 191–203. [Google Scholar] [CrossRef]
  54. R Core Team. R-4.5.0. A Language and Environment for Statistical Computing; R Core Team: Vienna, Austria, 2025; Available online: https://cran.r-project.org/bin/windows/base/old/4.5.0/ (accessed on 11 April 2025).
  55. Naimi, B.; Araujo, M.B. Sdm: Species Distribution Modelling v1.1-8. CRAN: Contributed Packages. 2021. Available online: https://cran.r-project.org/web/packages/sdm/index.html (accessed on 15 August 2025).
  56. Wood, S. Mgcv: Mixed GAM Computation Vehicle with Automatic Smoothness Estimation v1.9-1. CRAN: Contributed Packages. 2023. Available online: https://cran.r-project.org/web/packages/mgcv/index.html (accessed on 15 August 2025).
  57. Ridgeway, G.; Developers, G. Gbm: Generalized Boosted Regression Models v2.1-8. CRAN: Contributed Packages. 2020. Available online: https://cran.r-project.org/web/packages/gbm/index.html (accessed on 20 August 2025).
  58. Hijmans, R.J.; Phillips, S.; Leathwick, J.; Elith, J. Dismo: Species Distribution Modeling v.1.3-16. CRAN: Contributed Packages. 2024. Available online: https://cran.r-project.org/web/packages/dismo/dismo.pdf (accessed on 18 June 2024).
  59. Breiman, L.; Cutler, A.; Liaw, A.; Wiener, M. RandomForest: Breiman and Cutlers Random Forests for Classification and Regression v. 4.7-1.1. CRAN: Contributed Packages 2022. Available online: https://cran.r-project.org/web/packages/randomForest/randomForest.pdf (accessed on 22 May 2022).
  60. Thuiller, W.; Lafourcade, B.; Engler, R.; Araújo, M.B. BIOMOD—A Platform for Ensemble Forecasting of Species Distributions. Ecography 2009, 32, 369–373. [Google Scholar] [CrossRef]
  61. Boisier, J.P.; Ciais, P.; Ducharne, A.; Guimberteau, M. Projected Strengthening of Amazonian Dry Season by Constrained Climate Model Simulations. Nat. Clim. Chang. 2015, 5, 656–660. [Google Scholar] [CrossRef]
  62. Environmental Systems Research Institute (Esri) How Pairwise Intersect Works—ArcGIS Pro Documentation. 2025. Available online: https://pro.arcgis.com/en/pro-app/latest/tool-reference/analysis/how-pairwise-intersect-works.htm (accessed on 15 May 2025).
  63. Quesada, C.A.; Phillips, O.L.; Schwarz, M.; Czimczik, C.I.; Baker, T.R.; Patiño, S.; Fyllas, N.M.; Hodnett, M.G.; Herrera, R.; Almeida, S.; et al. Basin-Wide Variations in Amazon Forest Structure and Function Are Mediated by Both Soils and Climate. Biogeosciences 2012, 9, 2203–2246. [Google Scholar] [CrossRef]
  64. Esquivel-Muelbert, A.; Baker, T.R.; Dexter, K.G.; Lewis, S.L.; Brienen, R.J.W.; Feldpausch, T.R.; Lloyd, J.; Monteagudo-Mendoza, A.; Arroyo, L.; Álvarez-Dávila, E.; et al. Compositional Response of Amazon Forests to Climate Change. Glob. Chang. Biol. 2019, 25, 39–56. [Google Scholar] [CrossRef]
  65. Fyllas, N.M.; Patiño, S.; Baker, T.R.; Bielefeld Nardoto, G.; Martinelli, L.A.; Quesada, C.A.; Paiva, R.; Schwarz, M.; Horna, V.; Mercado, L.M.; et al. Basin-Wide Variations in Foliar Properties of Amazonian Forest: Phylogeny, Soils and Climate. Biogeosciences 2009, 6, 2677–2708. [Google Scholar] [CrossRef]
  66. Nunes-Silva, P.; Acosta, A.L.; Borges, R.C.; Freitas, B.M.; Oliveira, R.C.; Giannini, T.C.; Imperatriz-Fonseca, V.L. Climate Change Will Alter Amazonian Bumblebees’ Distribution, but Effects Are Species-Specific. Front. Bee Sci. 2025, 3, 1510004. [Google Scholar] [CrossRef]
  67. Ceccarelli, V.; Fremout, T.; Zavaleta, D.; Lastra, S.; Correa, S.I.; Arévalo-Gardini, E.; Rodriguez, C.A.; Hilacondo, W.C.; Thomas, E. Climate Change Impact on Cultivated and Wild Cacao in Peru and the Search of Climate Change-Tolerant Genotypes. Divers. Distrib. 2021, 27, 1462–1476. [Google Scholar] [CrossRef]
  68. Sampayo-Maldonado, S.; Ordoñez-Salanueva, C.A.; Mattana, E.; Way, M.; Castillo-Lorenzo, E.; Dávila-Aranda, P.D.; Lira-Saade, R.; Téllez-Valdés, O.; Rodríguez-Arévalo, N.I.; Flores-Ortiz, C.M.; et al. Potential Distribution of Cedrela odorata L. in Mexico According to Its Optimal Thermal Range for Seed Germination under Different Climate Change Scenarios. Plants 2023, 12, 150. [Google Scholar] [CrossRef]
  69. de Morais, I.L.L.; de Lima, A.A.; dos Santos, I.N.L.; Meneses, C.; da Silva, R.F.; Lopes, R.; Ramos, S.L.F.; de Aguiar, A.V.; Wrege, M.S.; Lopes, M.T.G. Climate Change Impact on the Distribution of Forest Species in the Brazilian Amazon. Sustainability 2024, 16, 3458. [Google Scholar] [CrossRef]
  70. Osland, M.J.; Bradford, J.B.; Toth, L.T.; Germino, M.J.; Grace, J.B.; Drexler, J.Z.; Stagg, C.L.; Grossman, E.R.; Thorne, K.M.; Romañach, S.S.; et al. Ecological Thresholds and Transformations Due to Climate Change: The Role of Abiotic Stress. Ecosphere 2025, 16, e70229. [Google Scholar] [CrossRef]
  71. Schroth, G.; Läderach, P.; Martinez-Valle, A.I.; Bunn, C.; Jassogne, L. Vulnerability to Climate Change of Cocoa in West Africa: Patterns, Opportunities and Limits to Adaptation. Sci. Total Environ. 2016, 556, 231–241. [Google Scholar] [CrossRef] [PubMed]
  72. Gollnow, F.; Cammelli, F.; Carlson, K.M.; Garrett, R.D. Gaps in Adoption and Implementation Limit the Current and Potential Effectiveness of Zero-Deforestation Supply Chain Policies for Soy. Environ. Res. Lett. 2022, 17, 114003. [Google Scholar] [CrossRef]
  73. Rodríguez-León, C.H.; Sterling, A.; Trujillo-Briñez, A.; Suárez-Córdoba, Y.D.; Roa-Fuentes, L.L. Forest Attribute Dynamics in Secondary Forests: Insights for Advancing Ecological Restoration and Transformative Territorial Management in the Amazon. Diversity 2025, 17, 39. [Google Scholar] [CrossRef]
  74. Rodríguez-León, C.H.; Sterling, A.; Daza-Giraldo, D.D.; Suárez-Córdoba, Y.D.; Roa-Fuentes, L.L. Scaling Plant Functional Strategies from Species to Communities in Regenerating Amazonian Forests: Insights for Restoration in Deforested Landscapes. Diversity 2025, 17, 570. [Google Scholar] [CrossRef]
  75. Brudvig, L.; Damschen, E.; Tewksbury, J.; Haddad, N.; Levey, D. Landscape Connectivity Promotes Plant Biodiversity Spillover into Non-Target Habitats. Proc. Natl. Acad. Sci. USA 2009, 106, 9328–9332. [Google Scholar] [CrossRef] [PubMed]
  76. Forest, F. Preserving the Evolutionary Potential of Floras in Biodiversity Hotspots. Nature 2007, 445, 757–760. [Google Scholar] [CrossRef] [PubMed]
  77. Vitt, P.; Havens, K.; Kramer, A.T.; Sollenberger, D.; Yates, E. Assisted Migration of Plants: Changes in Latitudes, Changes in Attitudes. Biol. Conserv. 2010, 143, 18–27. [Google Scholar] [CrossRef]
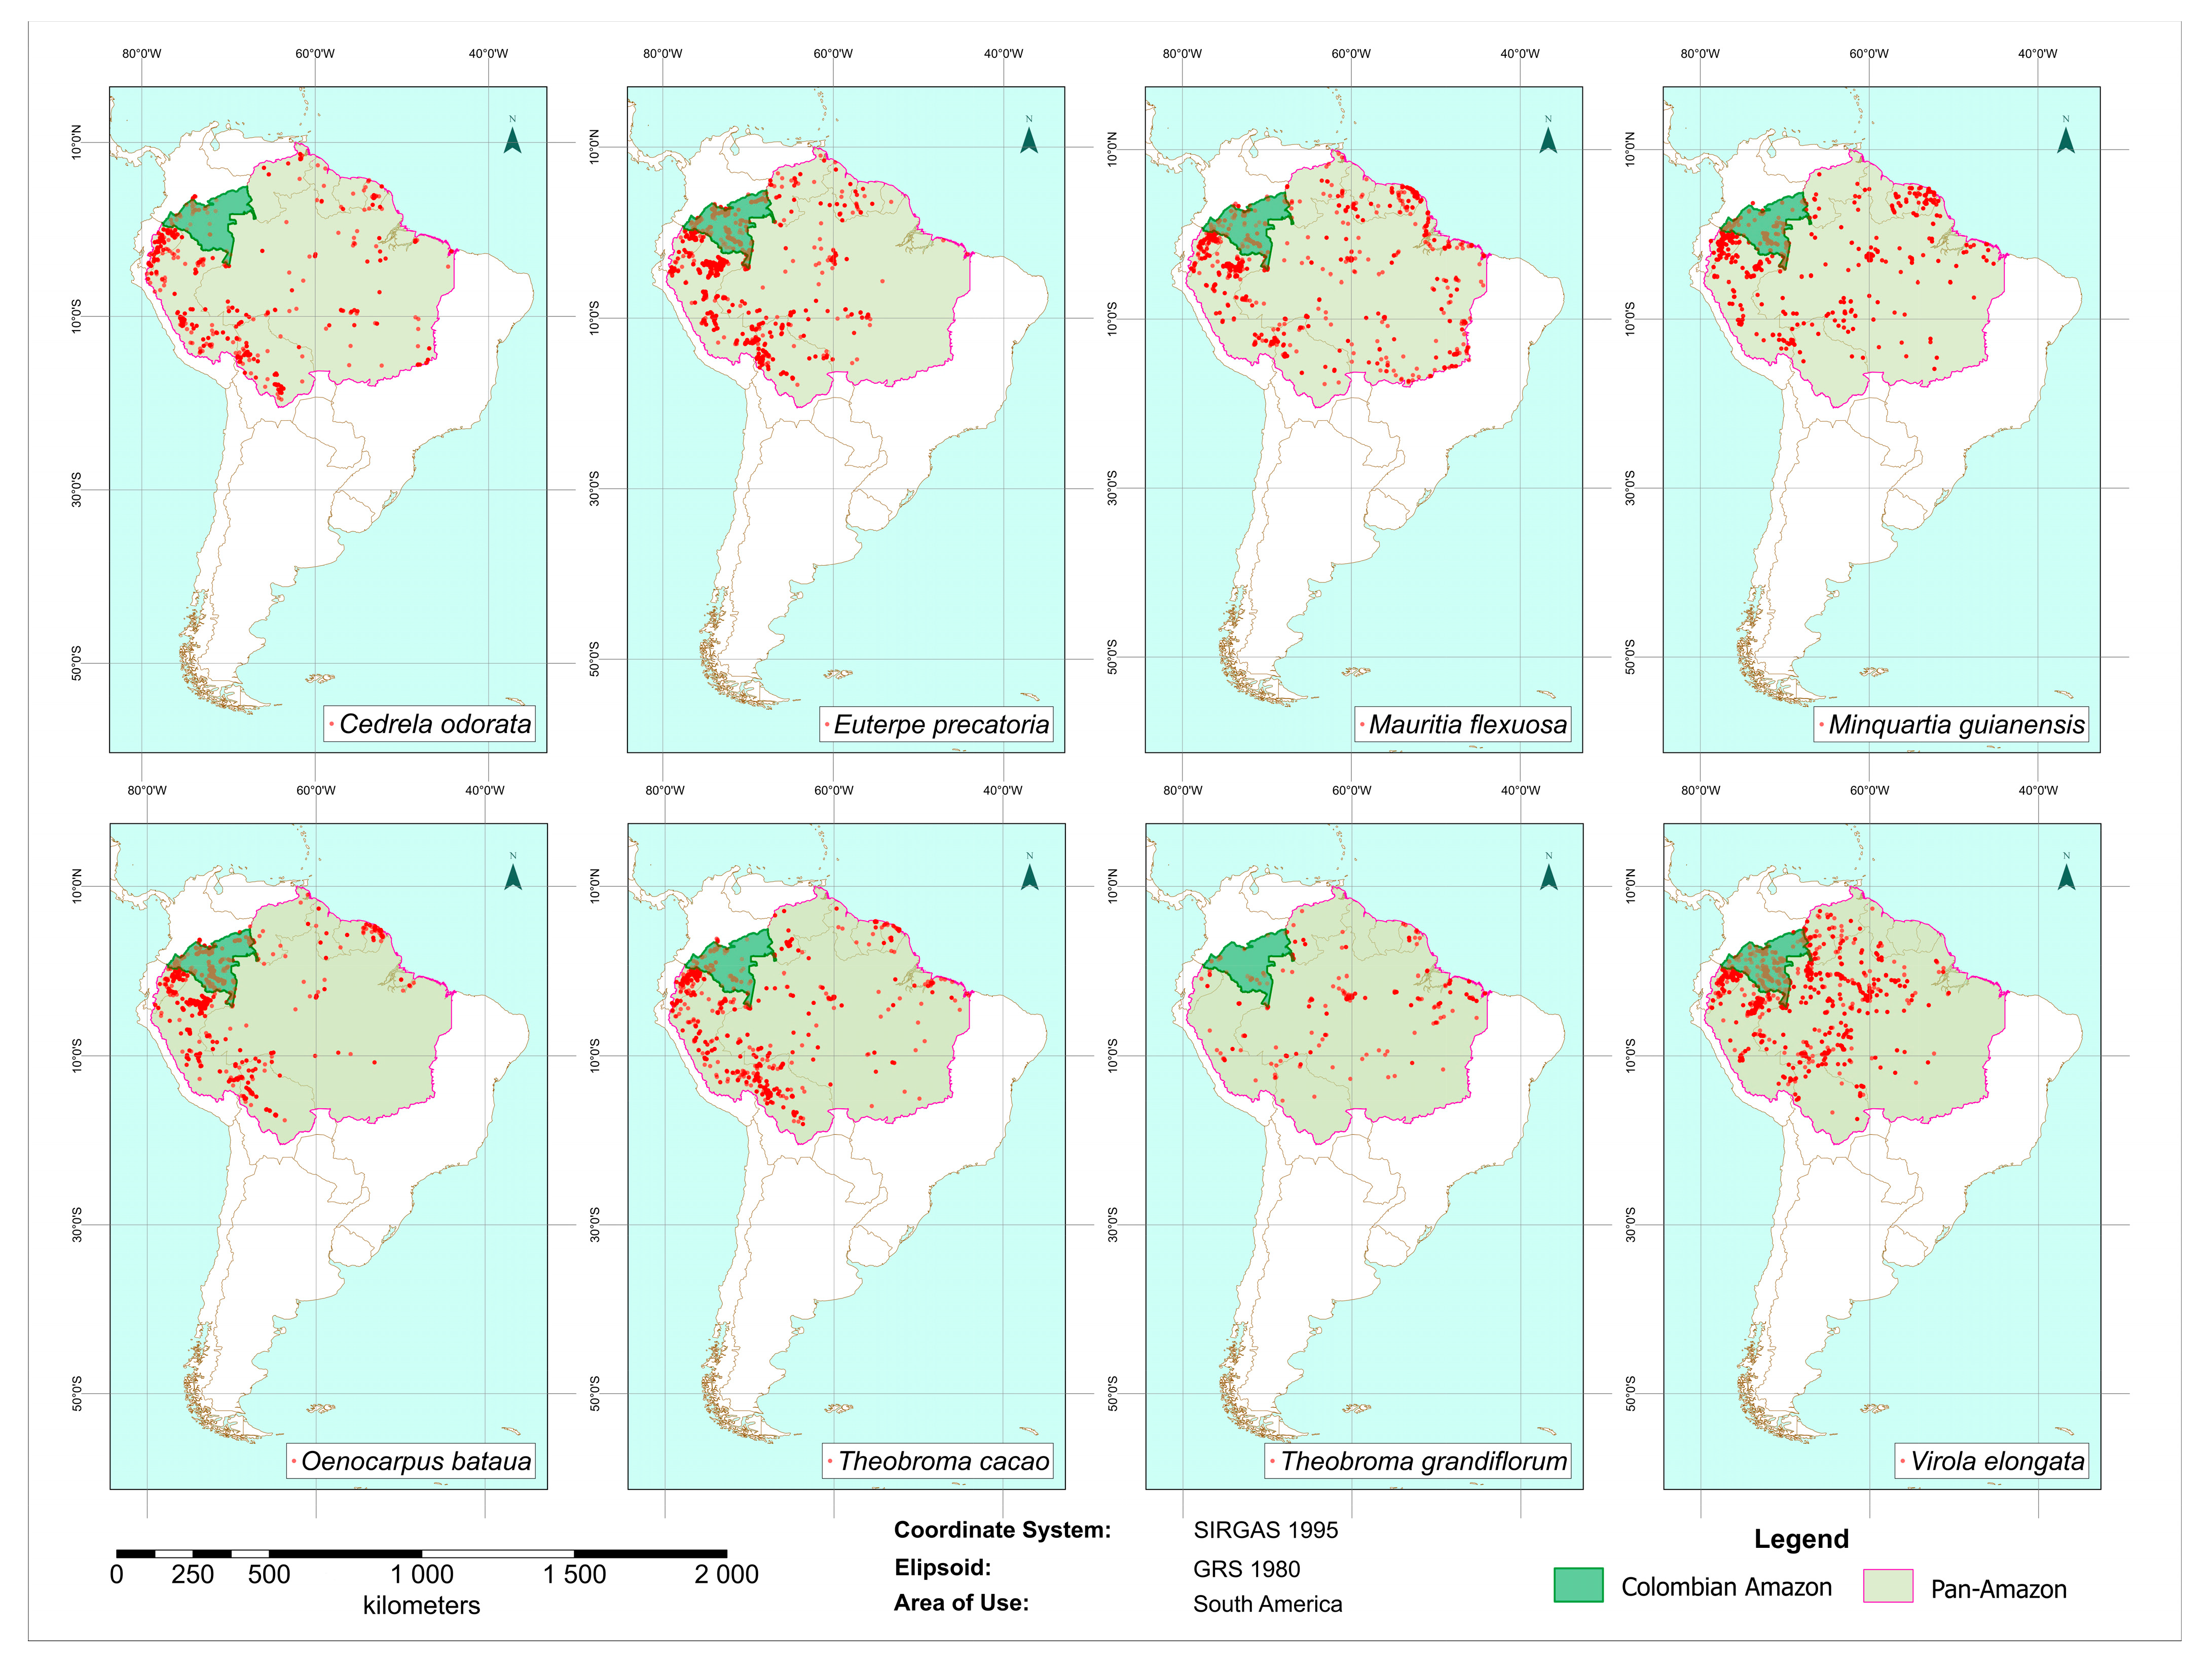
Figure 1. Geographic distribution of eight woody species: Cedrela odorata L., Euterpe precatoria (Mart.) A.J.Hend., Mauritia flexuosa L.f., Minquartia guianensis Aubl., Oenocarpus bataua Mart., Theobroma grandiflorum (Willd. ex Spreng.) Schum., Thebroma cacao L. and Virola elongata (Benth.) Warb. in the Pan-Amazon region (South America). Red dots represent georeferenced occurrence records. The dark green area indicates the Colombian Amazon, while the light green area represents the Pan-Amazon domain used for modeling. The magenta line shows the boundary of the Pan-Amazon region.
Forests 16 01640 g001
Figure 2. Habitat suitability change for E. precatoria under SSP245 and SSP585 climatic scenarios for two future periods (2041–2060 and 2061–2080). Suitability-change maps (Δ) depict areas consistently suitable, consistently unsuitable, suitability gain, and suitability loss relative to the baseline (1970–2000). Bar plots on the right show the percentage of changes in suitable habitat area, distinguishing between maintenance and loss under each scenario and period.
Forests 16 01640 g002
Figure 3. Habitat suitability change for O. batua under SSP245 and SSP585 climatic scenarios for two future periods (2041–2060 and 2061–2080). Suitability-change maps (Δ) depict areas consistently suitable, consistently unsuitable, suitability gain, and suitability loss relative to the baseline (1970–2000). Bar plots on the right show the percentage of changes in suitable habitat area, distinguishing between maintenance and loss under each scenario and period.
Forests 16 01640 g003
Figure 4. Habitat suitability change for M. flexuosa under SSP245 and SSP585 climatic scenarios for two future periods (2041–2060 and 2061–2080). Suitability-change maps (Δ) depict areas consistently suitable, consistently unsuitable, suitability gain, and suitability loss relative to the baseline (1970–2000). Bar plots on the right show the percentage of changes in suitable habitat area, distinguishing between maintenance and loss under each scenario and period.
Forests 16 01640 g004
Figure 5. Habitat suitability change for V. elongata under SSP245 and SSP585 climatic scenarios for two future periods (2041–2060 and 2061–2080). Suitability-change maps (Δ) depict areas consistently suitable, consistently unsuitable, suitability gain, and suitability loss relative to the baseline (1970–2000). Bar plots on the right show the percentage of changes in suitable habitat area, distinguishing between maintenance and loss under each scenario and period.
Forests 16 01640 g005
Figure 6. Habitat suitability change for M. guianensis under SSP245 and SSP585 climatic scenarios for two future periods (2041–2060 and 2061–2080). Suitability-change maps (Δ) depict areas consistently suitable, consistently unsuitable, suitability gain, and suitability loss relative to the baseline (1970–2000). Bar plots on the right show the percentage of changes in suitable habitat area, distinguishing between maintenance and loss under each scenario and period.
Forests 16 01640 g006
Figure 7. Habitat suitability change for C. odorata under SSP245 and SSP585 climatic scenarios for two future periods (2041–2060 and 2061–2080). Suitability-change maps (Δ) depict areas consistently suitable, consistently unsuitable, suitability gain, and suitability loss relative to the baseline (1970–2000). Bar plots on the right show the percentage of changes in suitable habitat area, distinguishing between maintenance and loss under each scenario and period.
Forests 16 01640 g007
Figure 8. Habitat suitability change for T. cacao under SSP245 and SSP585 climatic scenarios for two future periods (2041–2060 and 2061–2080). Suitability-change maps (Δ) depict areas consistently suitable, consistently unsuitable, suitability gain, and suitability loss relative to the baseline (1970–2000). Bar plots on the right show the percentage of changes in suitable habitat area, distinguishing between maintenance and loss under each scenario and period.
Forests 16 01640 g008
Figure 9. Habitat suitability change for T. grandiflorum under SSP245 and SSP585 climatic scenarios for two future periods (2041–2060 and 2061–2080). Suitability-change maps (Δ) depict areas consistently suitable, consistently unsuitable, suitability gain, and suitability loss relative to the baseline (1970–2000). Bar plots on the right show the percentage of changes in suitable habitat area, distinguishing between maintenance and loss under each scenario and period.
Forests 16 01640 g009
Table 1. Values of AUC (Area Under the Receiver Operating Characteristic Curve) and TSS (True Skill Statistic) for the eight modeled species: Cedrela odorata L., Euterpe precatoria (Mart.) A.J.Hend., Mauritia flexuosa L.f., Minquartia guianensis Aubl., Oenocarpus bataua Mart., Theobroma grandiflorum (Willd. ex Spreng.) Schum., Thebroma cacao L. and Virola elongata (Benth.) Warb. under cross-validation.
SpeciesAUCTSS
E. precatoria0.7620.440
O. bataua0.7960.530
M. flexuosa0.7220.345
V. elongata0.7380.407
M. guianensis0.7440.427
C. odorata0.8000.511
T. cacao0.8280.562
T. grandiflorum0.7290.434
Table 2. Best-performing algorithm by species (AUC primary, TSS tie-break).
SpeciesBest AlgorithmAUCTSS
E. precatoriaRF0.7800.461
O. batauaRF0.8070.546
M. flexuosaMaxEnt0.7300.342
V. elongataRF0.7540.434
M. guianensisBRT0.7530.410
C. odorataBRT0.8140.529
T. cacaoRF0.8460.585
T. grandiflorumBRT0.7540.475
AUC (Area Under the Receiver Operating Characteristic Curve); TSS (True Skill Statistic).
Table 3. Delta-map summary per species and Shared Socioeconomic Pathway (SSP) across periods (Area in Mha and %). Ensemble binary maps for each SSP (SSP245, SSP585) were intersected with the baseline to obtain four delta classes—consistently unsuitable (00), gain (01), loss (10), consistently suitable (11). Values are reported per species–SSP–period as area (Mha, %).
SpeciesPeriodScenario Consistently Unsuitable (Mha, %)Suitability Gain (Mha, %)Suitability Loss (Mha, %)Consistently Suitable (Mha, %)
C. odorata2041_2060SPS24541.69 (85.84)1.52 (3.13)0.19 (0.39)5.17 (10.64)
SSP58540.70 (83.8)2.51 (5.17)0.25 (0.51)5.11 (10.52)
2061_2080SPS24540.97 (84.35)2.24 (4.61)0.21 (0.43)5.15 (10.6)
SSP58540.58 (83.56)2.63 (5.41)0.47 (0.96)4.89 (10.07)
E. precatoria2041_2060SPS2454.43 (9.12)17.12 (35.26)0.21 (0.42)26.81 (55.2)
SSP5852.47 (5.08)19.09 (39.3)0.23 (0.48)26.78 (55.14)
2061_2080SPS2452.75 (5.66)18.80 (38.72)0.19 (0.39)26.82 (55.23)
SSP5851.85 (3.82)19.70 (40.56)0.22 (0.46)26.79 (55.16)
M. flexuosa2041_2060SPS2452.44 (5.02)21.04 (43.32)0.01 (0.02)25.08 (51.64)
SSP5852.08 (4.28)21.40 (44.07)0.01 (0.02)25.08 (51.64)
2061_2080SPS2452.14 (4.41)21.34 (43.93)0.01 (0.02)25.08 (51.63)
SSP5851.84 (3.8)21.63 (44.55)0.00 (0.0)25.09 (51.65)
M. guianensis2041_2060SPS2459.82 (20.22)11.96 (24.62)0.87 (1.78)25.92 (53.37)
SSP5857.71 (15.88)14.07 (28.97)0.94 (1.95)25.84 (53.21)
2061_2080SPS2456.92 (14.25)14.86 (30.59)0.61 (1.25)26.18 (53.9)
SSP58510.54 (21.7)11.24 (23.14)0.94 (1.93)25.85 (53.23)
O. bataua2041_2060SPS2455.58 (11.49)16.81 (34.62)0.18 (0.38)25.99 (53.51)
SSP5853.02 (6.22)19.37 (39.89)0.22 (0.46)25.95 (53.43)
2061_2080SPS2453.61 (7.42)18.79 (38.69)0.16 (0.32)26.02 (53.57)
SSP5852.62 (5.4)19.77 (40.71)0.43 (0.89)25.74 (52.99)
T. cacao2041_2060SPS24537.72 (77.66)5.34 (10.99)0.24 (0.49)5.27 (10.86)
SSP58536.21 (74.55)6.85 (14.1)0.20 (0.42)5.31 (10.93)
2061_2080SPS24536.45 (75.05)6.61 (13.6)0.18 (0.37)5.33 (10.98)
SSP58531.82 (65.53)11.23 (23.12)0.13 (0.28)5.38 (11.08)
T. grandiflorum2041_2060SPS24522.17 (45.65)5.93 (12.21)2.96 (6.09)17.50 (36.04)
SSP58522.96 (47.28)5.14 (10.58)4.08 (8.4)16.38 (33.73)
2061_2080SPS24522.53 (46.4)5.57 (11.47)3.49 (7.18)16.98 (34.95)
SSP58523.78 (48.96)4.33 (8.91)5.56 (11.45)14.90 (30.68)
V. elongata2041_2060SPS2451.60 (3.3)7.18 (14.79)0.04 (0.09)39.74 (81.82)
SSP5851.47 (3.03)7.31 (15.06)0.09 (0.18)39.69 (81.73)
2061_2080SPS2451.45 (2.99)7.33 (15.1)0.04 (0.08)39.74 (81.83)
SSP5851.30 (2.68)7.48 (15.41)0.10 (0.2)39.69 (81.71)
Disclaimer/Publisher’s Note: The statements, opinions and data contained in all publications are solely those of the individual author(s) and contributor(s) and not of MDPI and/or the editor(s). MDPI and/or the editor(s) disclaim responsibility for any injury to people or property resulting from any ideas, methods, instructions or products referred to in the content.