Article

Integrative Transcriptomic and Metabolomic Approaches to Deep Pink Flower Color in Prunus campanulata and Insights into Anthocyanin Biosynthesis

1
College of Forestry, Central South University of Forestry & Technology, 498 South Shaoshan Road, Changsha 410004, China
2
Hunan Botanical Garden, Changsha 410116, China
3
Hunan Academy of Forestry Sciences, Changsha 410004, China
4
Fine Arts and Design, Huaihua University, Huaihua 418000, China
*
Authors to whom correspondence should be addressed.
Forests 2025, 16(11), 1633; https://doi.org/10.3390/f16111633 (registering DOI)
Submission received: 24 September 2025 / Revised: 22 October 2025 / Accepted: 24 October 2025 / Published: 26 October 2025
(This article belongs to the Section Genetics and Molecular Biology)

Abstract

Flower pigmentation is a critical trait in plants, influencing ecological interactions and ornamental value. This study investigates the mechanisms underlying petal coloration in Prunus campanulata and its hybrids, PrunusOkame’ and PrunusYoko’. Morphological analysis revealed consistent flower size across varieties, indicating that color variation is not linked to structural differences. Physiological and biochemical analyses identified stages III and IV as critical for pigmentation, characterized by the significant accumulation of flavonoids and anthocyanins. Metabolomic profiling highlighted flavonoids as the dominant metabolites, with key compounds including chalcones, flavones, and anthocyanins contributing to color formation. Weighted gene co-expression network analysis (WGCNA) further identified several hub genes, including RPL34, NUDT12, and CYP78A9, within modules strongly correlated with pigment accumulation, suggesting their potential non-canonical roles in the coloration process. Environmental factors such as temperature and pH were found to influence pigment stability. Overall, this study provides insights into the genetic and biochemical regulation of flower pigmentation in P. campanulata, emphasizing the central role of flavonoid and anthocyanin biosynthesis.

1. Introduction

Flower color, as a primary ornamental trait, not only serves aesthetic purposes but also holds significant ecological and evolutionary implications. Recent research underscores the complexity of the factors influencing flower coloration, from genetic mechanisms to environmental interactions. The interplay of pigmentation, light absorption, and reflection critically impacts visual perception and ecological dynamics, highlighting the adaptive significance of floral traits. The evolutionary context of flower coloration has been linked to pollinator interactions, with findings showing that anthocyanin biosynthesis pathways drive phenotypic diversity and adaptation. This aligns with evidence that ancient pollinator visual systems shaped flower color signaling, with flowers exploiting the pre-existing visual capacities of pollinators like bees and birds to establish chromatic cues [1]. Additionally, the functional diversity of floral pigments extends beyond aesthetic appeal to ecological roles, such as stress resilience and pollinator attraction. For example, research in Gloriosa superba demonstrated how anthocyanin accumulation correlates with developmental changes and hormone signaling, contributing to its striking red coloration [2]. Similarly, flower coloration in Meconopsis wilsonii varies with the glycosylation levels of anthocyanins and interactions with metal ions, revealing adaptive strategies in pigmentation under different environmental conditions [3]. Such studies illuminate the dual roles of anthocyanins as pigments and antioxidants, enhancing both pollinator attraction and plant resilience. Furthermore, the pigmentation of petals is central to ecological interactions, particularly in pollination, where chromatic and achromatic contrasts signal pollinators effectively. Research has revealed that pigmentation can incorporate additional optical traits such as gloss and iridescence, enhancing pollinator attraction and evolutionary fitness [4]. Conical epidermal cells, a common feature in angiosperms, optimize pollinator grip and manipulate light to affect petal coloration while also contributing to thermal regulation under specific ecological conditions [5]. These structural adaptations highlight the complex interplay between petal morphology and ecological functionality. Genetic studies on species like Japanese morning glory and petunia have elucidated the role of anthocyanin biosynthesis and epigenetic mechanisms in governing floral color patterns, illustrating how molecular regulation contributes to floral diversity [6]. Moreover, the spatial assembly of flower colors within communities has been shown to promote pollinator fidelity while reducing interspecific pollen transfer, as observed in Oxalis species [7]. Such findings suggest that ecological and evolutionary pressures collaboratively shape floral coloration. The introduction of alien species with overlapping pigmentation traits can further disrupt native pollinator networks, adding another layer of complexity to the adaptive dynamics of flower coloration [8]. Additionally, temporal dynamics such as circadian rhythms regulate petal opening and scent production, aligning floral traits with optimal pollination windows, which underscores the co-evolutionary mechanisms enhancing phenotypic and genetic diversity in plant-pollinator interactions [9].
The biochemical basis of flower coloration is intricately tied to the composition and dynamics of pigments such as chlorophyll, anthocyanins, flavonoids, and carotenoids during the flowering process. In species such as honeysuckle and Rosa spp., chlorophyll degradation coincides with blooming and is associated with color transitions, while anthocyanin enrichment governs the intensity and vibrancy of red hues [6]. Flavonoids, particularly through co-pigmentation mechanisms, play a significant role in color variation, as observed in cyclamen, where flavonol biosynthesis regulates pigmentation [10]. Studies on gentians have demonstrated that anthocyanin biosynthesis within the flavonoid pathways controls color variation across species [11]. The interplay between anthocyanins and carotenoids has been examined in purple and yellow four o’clock flowers, further supporting their combined roles in color transitions, while chlorophyll’s role during early blooming underscores its interactions with other pigments [12]. These pigment dynamics align with findings on pigment stability and turnover under environmental influences, highlighting the biochemical and environmental interactions that shape flower coloration [13]. Moreover, petal coloration has ecological implications, particularly in pollinator attraction and adaptability, reflecting a complex interplay of genetic, biochemical, and environmental factors governing floral traits [14]. These insights collectively reveal the molecular, structural, and ecological underpinnings of floral pigmentation, emphasizing its evolutionary significance and potential for horticultural applications.
Central to flower coloration is the anthocyanin biosynthetic pathway, a network of enzymatic reactions beginning with phenylalanine. Key enzymes such as chalcone synthase (CHS), chalcone isomerase (CHI), and flavonoid-3′-hydroxylase (F3′H) contribute to the structural diversification of anthocyanins, while flavonoid-3′,5′-hydroxylase (F3′5′H) influences pigment outcomes, including the blue hues characteristic of delphinidin derivatives. The downregulation of CHS has been shown to deplete flavonoids and anthocyanins, resulting in white mutant flowers in carnations [15]. Regulatory mechanisms are primarily governed by R2R3-MYB transcription factors, which coordinate gene expression across the biosynthetic pathway. These transcription factors regulate structural genes, such as DFR, ANS, and UFGT, affecting pigment accumulation patterns and intensity in dicot species [16]. Gene-editing experiments targeting UFGT in petunias have altered anthocyanin glycosylation, demonstrating genetic modification’s potential for creating novel pigmentation traits [6]. The absence of F3′5′H, termed the “blue gene,” has been linked to the lack of blue pigmentation in plants like roses and chrysanthemums; however, its transgenic introduction has enabled blue delphinidin synthesis in species such as carnations and gentians [11]. Variations in CHI and F3H expression influence yellow and orange pigmentation through the modulation of flavonol and flavone levels, which are critical to the aesthetic diversity of flowers [12]. Environmental factors such as ultraviolet (UV) light and temperature also regulate anthocyanin biosynthesis, with light exposure shown to induce structural gene expression and amplify pigment production, as evidenced in red pears, where anthocyanin pathways in peel tissues are upregulated by light exposure [17,18]. These findings elucidate the genetic and environmental controls underlying anthocyanin biosynthesis, providing opportunities for engineering flower colors and enhancing horticultural aesthetics.
The regulation of flavonoid biosynthesis in plants is governed by transcription factors from the MYB, basic Helix–Loop–Helix (bHLH), and WD40 protein families, collectively forming the MBW complex. These transcription factors play a pivotal role in modulating structural gene expression, directly influencing anthocyanin biosynthesis and pigment accumulation. Among these, MYB transcription factors are critical for activating key genes such as CHS, F3H, and ANS, which are indispensable for anthocyanin production. The overexpression of MYB factors enhances anthocyanin accumulation and intensifies pigmentation, whereas MYB repressors, such as MdMYB28, inhibit this process by suppressing biosynthetic gene expression [16]. The bHLH proteins, exemplified by TT8, form functional interactions with MYB transcription factors to regulate late biosynthetic genes, thereby contributing to pigment diversification and tissue-specific expression, as observed in seed coats and flowers. Disruption of MBW complexes through mutations in bHLH or MYB genes has been shown to cause pigmentation loss in transgenic models such as poplar and Arabidopsis [19]. WD40 proteins, including AN11 in petunia, serve as scaffolding elements that facilitate the assembly of MYB and bHLH proteins. These proteins have been shown to regulate flavonoid accumulation and contribute to structural development, as demonstrated by their interactions with GL3 and EGL3 in Arabidopsis [20]. Environmental signals, such as UV exposure, further modulate MBW complex activity, as evidenced by the upregulation of MYB and bHLH-mediated gene expression, which enhances anthocyanin biosynthesis and highlights the adaptive significance of pigmentation [17]. In apple (Malus domestica), regulators like MYB10 and bHLH proteins are directly implicated in red pigmentation, providing a practical framework for horticultural breeding strategies [21]. This intricate regulatory network integrates genetic and environmental cues, presenting avenues for manipulating pigmentation to improve both plant aesthetics and ecological resilience.
The bellflower cherry (Prunus campanulata), native to China and distributed across regions such as Japan and Vietnam, exhibits unique phenotypic and biochemical characteristics. Its flower color transitions from pale pink to deep pink, a rare phenomenon among flowering plants, and its anthocyanins demonstrate potent antioxidant properties that are less commonly observed in other floral species. This color transformation reflects distinctive phenotypic diversity and highlights the dual role of anthocyanins as natural pigments and antioxidants. Studies have extensively documented the antioxidative properties of anthocyanins, correlating their chemical structures with free radical scavenging activities and their potential in mitigating oxidative stress-induced conditions [22]. The dual bioactivity of anthocyanins, encompassing pigmentation and plant resilience, underscores their ecological and physiological significance [23]. Comparative analyses with species like Japanese cherry and Cyclamen persicum reveal that variations in anthocyanin profiles are influenced by genetic and environmental factors, showcasing diverse mechanisms in pigmentation pathways [10]. Similarly, research on Prunus and related species highlights significant variation in flavonoid composition, emphasizing the role of edaphic and climatic conditions in modulating the antioxidant potential of these compounds [24]. The transition from pale to deep pink in P. campanulata likely involves fluctuations in anthocyanin biosynthesis and vacuolar pH regulation, analogous to mechanisms observed in Japanese morning glory and petunia. Genes such as F3′5′H and UDP-glucose flavonoid 3-O-glucosyltransferase (UFGT) have been implicated in regulating anthocyanin stability and spectral properties, further elucidating this process [6]. The exceptional antioxidant capacity of P. campanulata anthocyanins, potentially surpassing that of many ornamental plants, suggests valuable applications in food and pharmaceutical industries, aligning with research on their therapeutic effects against oxidative stress and related disorders [25,26,27,28]. This combination of pigmentation and antioxidative functionality reflects an evolutionary advantage, enhancing pollinator attraction and environmental adaptability in P. campanulata.
Despite the ecological and ornamental significance of P. campanulata, the specific genetic and biochemical mechanisms governing its distinctive deep pink flower color remain poorly characterized. In particular, the dynamic changes in pigment composition and the regulatory gene networks across key developmental stages are not well understood. To address this knowledge gap, the present study was designed to systematically investigate the physiological and molecular basis of petal coloration in P. campanulata and its hybrids, P. ‘Okame’ and P. ‘Yoko’. We combined morphological observations, physiological and biochemical assays, and assessments of pigment stability under different environmental conditions. Furthermore, we employed an integrative transcriptomic and metabolomic approach to identify key metabolites and differentially expressed genes across petal development. The primary goals of this research were to (1) dynamically profile the flavonoid and anthocyanin metabolites across key developmental stages; (2) identify the critical biosynthetic pathways and regulatory genes; and (3) construct a gene–metabolite network to elucidate the comprehensive mechanism of deep pink coloration. This multi-omics approach applied to a non-model ornamental cherry species provides novel insights that are not attainable through targeted studies alone, offering a holistic understanding of flower color development in Prunus.

2. Materials and Methods

2.1. Plant Material and Sample Collection

Experimental materials were sourced from the National Cherry Resource Bank (Hunan Botanical Garden, China; 113°01′30″ E, 28°06′40″ N). Petals of three cherry cultivars, Prunus campanulata, PrunusOkame’ (‘Caili’) and PrunusYoko’ (‘Yanggunag’) were collected during February–March 2023. Floral developmental stages were systematically classified into six distinct phases based on morphological and chromatic characteristics: Stage I (bud stage) with entirely green buds; Stage II (small bud stage) with slightly red floral tips; Stage III (large bud stage) with fully exposed light pink petals; Stage IV (initial bloom) where petals deepen to purple-red and filaments elongate to their maximum length; Stage V (half-bloom) with partially open petals; and Stage VI (full bloom) with fully expanded petals.

2.2. Floral Morphometric Analysis

Floral chromatic traits were assessed according to the standardized protocol by Qian YuChen’s method [29]. For each Prunus cultivar at Stage VI (full anthesis), petal coloration was phenotyped using the Royal Horticultural Society Colour Chart (RHSCC Edition V, UK) with ten biologically independent replicates, ensuring spatial sampling across three canopy strata (upper, middle, lower). A colorimeter (NR110, China) was used to determine the color difference of cherry petals at the fifth and sixth stages. After calibration with a colorimetric plate, the quantified values of lightness L*, hue a* and b* of petals were obtained. The average value of 30 petals randomly selected was determined as the color difference value of petals at that stage. And the group were analyzed with Excel version 2016.

2.3. Physiological Index Measurement

Physiological and biochemical indices were measured to investigate the process of petal coloring. The pH of petal cell sap was determined using a pH meter. Soluble sugar content was quantified using the anthrone-sulfuric acid method [30]. Soluble protein content was measured according to the Coomassie Brilliant Blue G-250 method [31]. Total flavonoid content was assessed using the sodium nitrite-aluminum nitrate colorimetric method [32]. Proanthocyanidin and anthocyanin contents were determined using the vanillin-hydrochloric acid method and the pH differential method, respectively [33].

2.4. Effects of Physico-Chemical Factors on Petal Color

Following a modified method adapted from Li Qun [34], petals at Stage VI were selected as experimental material. Frozen petals (1.0 g) were ground in a mortar with 10 mL of a methanol-hydrochloric acid solution (1:99, v/v). The homogenate was transferred to a 500 mL volumetric flask, repeatedly extracted with the same solvent under dark conditions at room temperature for 12 h, filtered, and combined extracts were diluted to volume.
The pigment extract was scanned from 400 to 600 nm using a UV-Vis spectrophotometer (1 nm intervals) to determine the maximum absorption wavelength and corresponding absorbance values.
Temperature Stability
Aliquots (10 mL) were equilibrated at thermal gradients (4, 20, 30, 40, 50, 60 °C) in precision incubators. Post-treatment samples were re-equilibrated to 25 °C for 30 min, and we determined the absorbance value at the maximum absorption wavelength.
Light Stability
Take 6 equal amounts of the extract solution, with 1 portion being treated in the dark, and the remaining 5 portions being treated under natural light for 1, 2, 3, 4, 5, and 6 h, respectively, before measuring their absorbance values.
pH Effects
Take 8 aliquots of the extraction solution, each with a volume of 5 mL, add HCl and NaOH to adjust the pH to 3, 4, 5, 6, 7, 8, 9, and 10 respectively, then dilute each to a final volume of 10 mL, and measure their absorbance at the maximum absorption wavelength.
Metal Ion Effects
Chloride salts (NaCl, KCl, CuCl2, CaCl2, MgCl2, ZnCl2, FeCl3) and Al(NO3)3 were prepared as 0.1% (w/v) aqueous solutions. Chelation complexes (1:1 v/v extract:ion solution) were vortex-mixed (30 s) and incubated in amber vials (25 °C, 1 h). Determine the absorbance value at the maximum absorption wavelength.

2.5. RNA Extraction, Testing, and Transcriptome Sequencing

Based on physiological and pigmentation analyses during the flowering stages of Prunus campanulata, four developmental phases (Stage I, III, IV, and VI) were selected as experimental materials for flavonoid metabolomics and transcriptome sequencing. A total of four sample groups—designated ZHY1, ZHY3, ZHY4, and ZHY6—were collected, with three biological replicates per group. Samples were immediately frozen in liquid nitrogen, stored at −80 °C, and subsequently submitted to Panomike Biomedical Technology (Suzhou and China) for analysis. Total RNA was extracted from P. campanulata petals using the Tiangen RNAprep Pure Polyphenolic Plant Total RNA Extraction Kit. RNA concentration and purity were assessed via NanoDrop spectrophotometry, while integrity was evaluated by RNA-specific agarose gel electrophoresis and Agilent 2100 Bioanalyzer (RIN values). RNA samples (≥1 μg) were processed using the NEBNext Ultra II RNA Library Prep Kit for Illumina. Polyadenylated mRNA was enriched using Oligo(dT) magnetic beads, fragmented via divalent cations under elevated temperature, and reverse-transcribed into cDNA using random hexamer primers. Double-stranded cDNA was purified, end-repaired, adenylated at the 3′-end, and ligated with sequencing adapters. cDNA fragments (400–500 bp) were size-selected using AMPure XP beads, PCR-amplified, and purified. Library quality was verified using the Agilent 2100 Bioanalyzer with the Agilent High Sensitivity DNA Kit. Library concentration was quantified via PicoGreen fluorometry (Quantifluor-ST fluorometer; Quant-iT PicoGreen dsDNA Assay Kit) and QPCR (StepOnePlus Real-Time PCR System). Multiplexed DNA libraries were pooled, normalized, and sequenced on an Illumina platform in PE150 mode. The raw sequencing reads were first processed through Fastp (v0.23.2) to remove adapters and low-quality bases. The clean reads were then aligned to the reference genome of Prunus campanulata using HISAT2 (v2.2.1). Read counting for each gene was performed using featureCounts (v2.0.3). Differential expression analysis was conducted using the DESeq2 (v1.38.3) package in R. Differentially expressed genes (DEGs) between comparison groups were identified with thresholds of |log2(fold change)| > 1 and an adjusted p-value < 0.05, with the p-value adjustment performed using the Benjamini–Hochberg procedure to control for false discovery rate (FDR) in multiple testing.

2.6. Transcriptome Assembly and Annotation

Clean reads from all samples were pooled and de novo assembled into transcripts using Trinity (v2.14.0) with default parameters. The resulting assembly was processed with CD-HIT-est to reduce redundancy, retaining transcripts with a sequence similarity threshold of 95%. For functional annotation, the assembled unigenes were searched against the NR, Swiss-Prot, Pfam, KEGG, eggNOG, and Gene Ontology (GO) databases using BLASTx (version 2.7.1) with an E-value cutoff of 1 × 10⁻⁵. Gene expression levels were quantified for each sample using RSEM. Differential expression analysis was performed with the DESeq2 package, and genes with an absolute log2 fold change |log2(fold change)| > 1 and a false discovery rate (FDR) adjusted p-value < 0.05 were considered differentially expressed.

2.7. Data Processing

Data processing and basic statistical analyses were performed using Microsoft Office Excel 2016. Statistical analysis, including the calculation of differentially expressed genes using the DESeq2 package, was conducted in R (v4.2.2) within the RStudio environment. Advanced analyses and graphical representations were generated with IBM SPSS Statistics 25 and Origin 2018 software, respectively. Graphical representations were generated with Origin 2018 software. All quantitative results are presented as mean ± standard deviation (SD).

3. Results

3.1. Analysis of Growth Indicators

To investigate the mechanisms underlying the formation of deep pink coloration in Prunus campanulata, its floral development was compared to two hybrid varieties, PrunusOkame’ (‘Caili’) and PrunusYoko’ (‘Yangguang’). Flower development was categorized into six stages based on morphological characteristics (Figure 1): Stage I (bud stage) with entirely green buds; Stage II (small bud stage) with slightly red floral tips; Stage III (large bud stage) with fully exposed light pink petals; Stage IV (initial bloom) where petals deepen to purple-red and filaments elongate to their maximum length; Stage V (half-bloom) with partially open petals; and Stage VI (full bloom) with fully expanded petals. Statistical analyses of floral growth revealed consistent developmental patterns across the three varieties, with no significant differences in flower dimensions despite their distinct pigmentation. Longitudinal diameter measurements showed a common trend of increase from stages I to V, followed by a slight decrease at stage VI, while transverse diameters steadily increased throughout all six stages (Table 1). These findings indicated that while morphological development proceeds uniformly across the varieties, differences in pigmentation were not reflected in growth dynamics or flower structure.

3.2. Analyses of Physiological Parameters and Color-Related Substance Contents in the Process of Petal Development

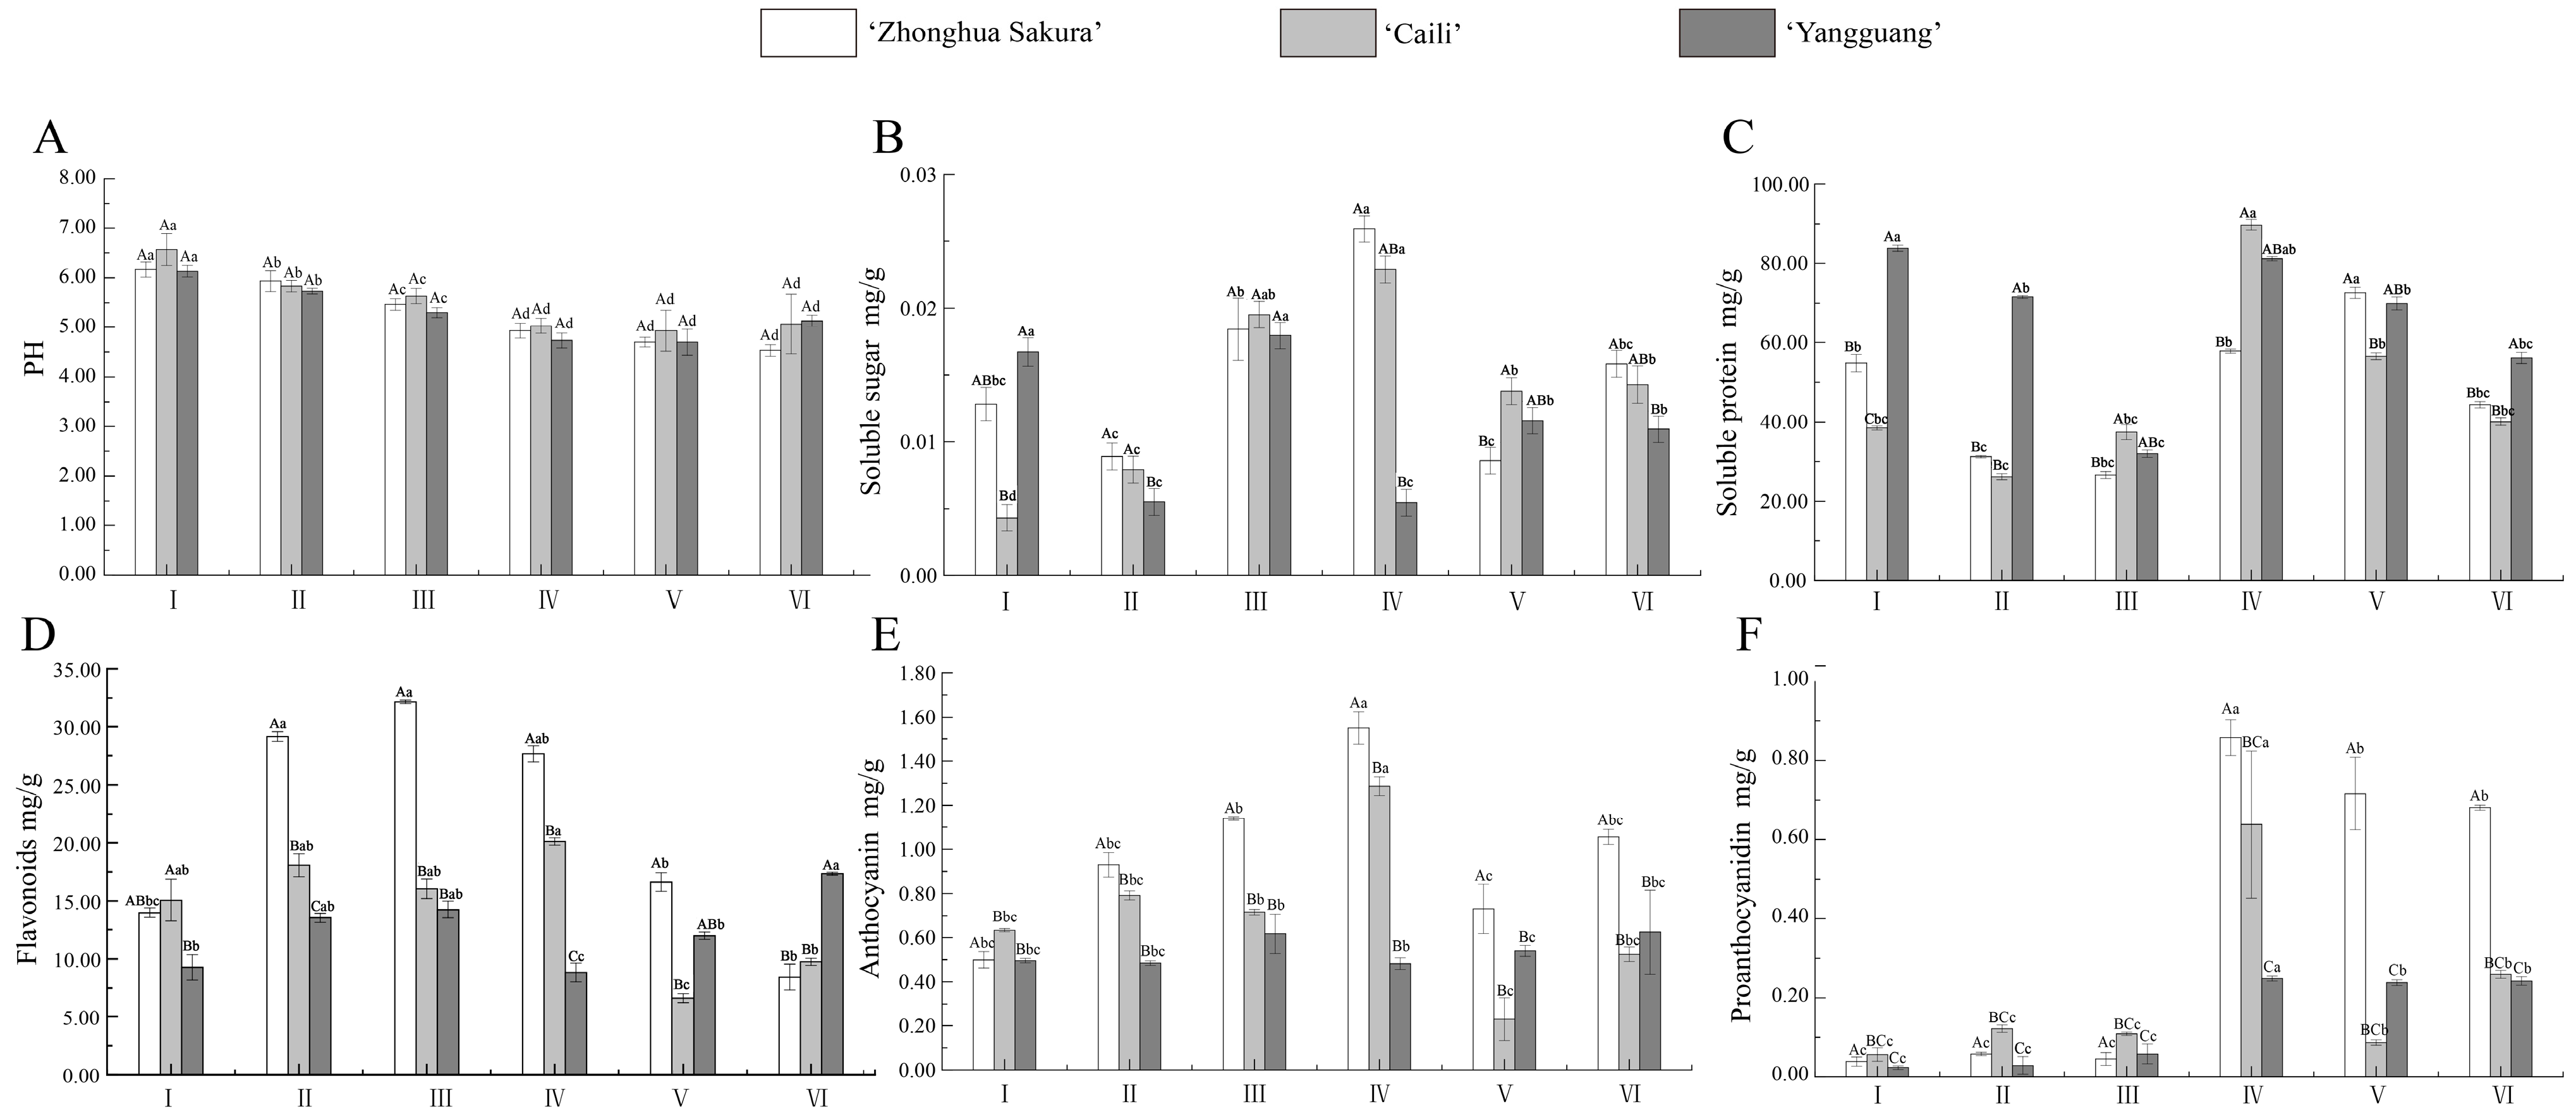
To better understand the biochemical drivers of cherry blossom pigmentation, especially given the absence of size-related trait differences among species, this study focused on key physiological and biochemical properties during petal development. Parameters such as pH, soluble sugars, soluble proteins, flavonoids, proanthocyanidins, and anthocyanins revealed distinct developmental trends and species-specific variations, with particular emphasis on the critical coloration stages of stage III and stage IV. Petal pH (Figure 2A) in all species remained acidic and generally decreased over time. P. campanulata exhibited its lowest pH at stage VI, while P. ‘Okame’ and P. ‘Yoko’ showed slight increases between stages V and VI. Soluble sugar (Figure 2B) content peaked at stage IV for both P. campanulata (0.026 mg/g) and P. ‘Okame’ (0.023 mg/g), with subsequent stabilization or slight recovery. P. ‘Yoko’ however, displayed a biphasic pattern, with a significant peak at stage III (0.018 mg/g). Soluble protein (Figure 2C) levels followed a decline-rise-decline pattern, with P. campanulata peaking at stage V (72.58 mg/g), P.Okame’ at stage IV (89.72 mg/g), and P. ‘Yoko’ at stage I (83.76 mg/g). Flavonoid (Figure 2D) content highlighted stage III as a pivotal moment, with P. campanulata reaching its highest level (32.16 mg/g), followed by a sharp decline by stage VI. Similarly, proanthocyanidins (Figure 2F) peaked at stage IV for both P. campanulata and P.Okame’, while remaining relatively stable in P. ‘Yoko’. Notably, anthocyanin (Figure 2E) levels rose significantly after stage IV, with P. campanulata achieving the highest concentration (0.86 mg/g). Principal component analysis emphasized the importance of anthocyanins, chlorophyll, carotenoids, and flavonoids as major contributors to petal pigmentation. These results underlined the central role of stages III and IV in driving the biochemical changes that define petal coloration, particularly through the accumulation of flavonoids and anthocyanins, marking these as the critical phases for pigmentation development in cherry blossoms.

3.3. Correlation Analysis of Flower Pigmentation

To investigate the physiological and biochemical mechanisms underlying petal coloration in cherry blossoms, the study analyzed eight key physiological indicators associated with petal color variation (Figure 3). These indicators were examined in relation to their impact on petal pigmentation, aiming to elucidate how biochemical composition drives color formation during flower development. The results revealed that petal lightness (L value) exhibited a highly significant negative correlation with redness (a value), anthocyanin content, proanthocyanidin content, and carotenoid content, while demonstrating a highly significant positive correlation with blueness (b value), pH, and soluble sugar content. As the b value decreased, the a value, proanthocyanidin, anthocyanin, and carotenoid content increased, resulting in darker petals, accompanied by a reduction in cell sap pH and soluble sugar levels. Conversely, petal redness (a value) was highly negatively correlated with b value and significantly negatively correlated with pH and soluble sugar content, while showing a highly significant positive correlation with carotenoid and anthocyanin content. This indicates that an increase in b value reduces carotenoid and anthocyanin content, leading to redder petals with elevated pH and soluble sugar levels. The b value itself was highly negatively correlated with proanthocyanidin, carotenoid, and anthocyanin content, suggesting that increased concentrations of these pigments result in bluer petals. Principal component analysis (Table 2) further streamlined the dataset, extracting two primary components with contribution rates of 50.513% and 26.541%, respectively, accounting for a cumulative 77.504% of the variability in the data. The first principal component (PC1) showed high loadings for anthocyanin, chlorophyll, and carotenoid content, indicating its primary reflection of these variables. The second principal component (PC2) was primarily influenced by total flavonoid content. This analysis identified anthocyanin, chlorophyll, carotenoid, and total flavonoid content as the dominant biochemical factors affecting petal coloration in cherry blossoms.

3.4. Effects of Physicochemical Factors on the Coloration of Flavonoid Extracts from Petals

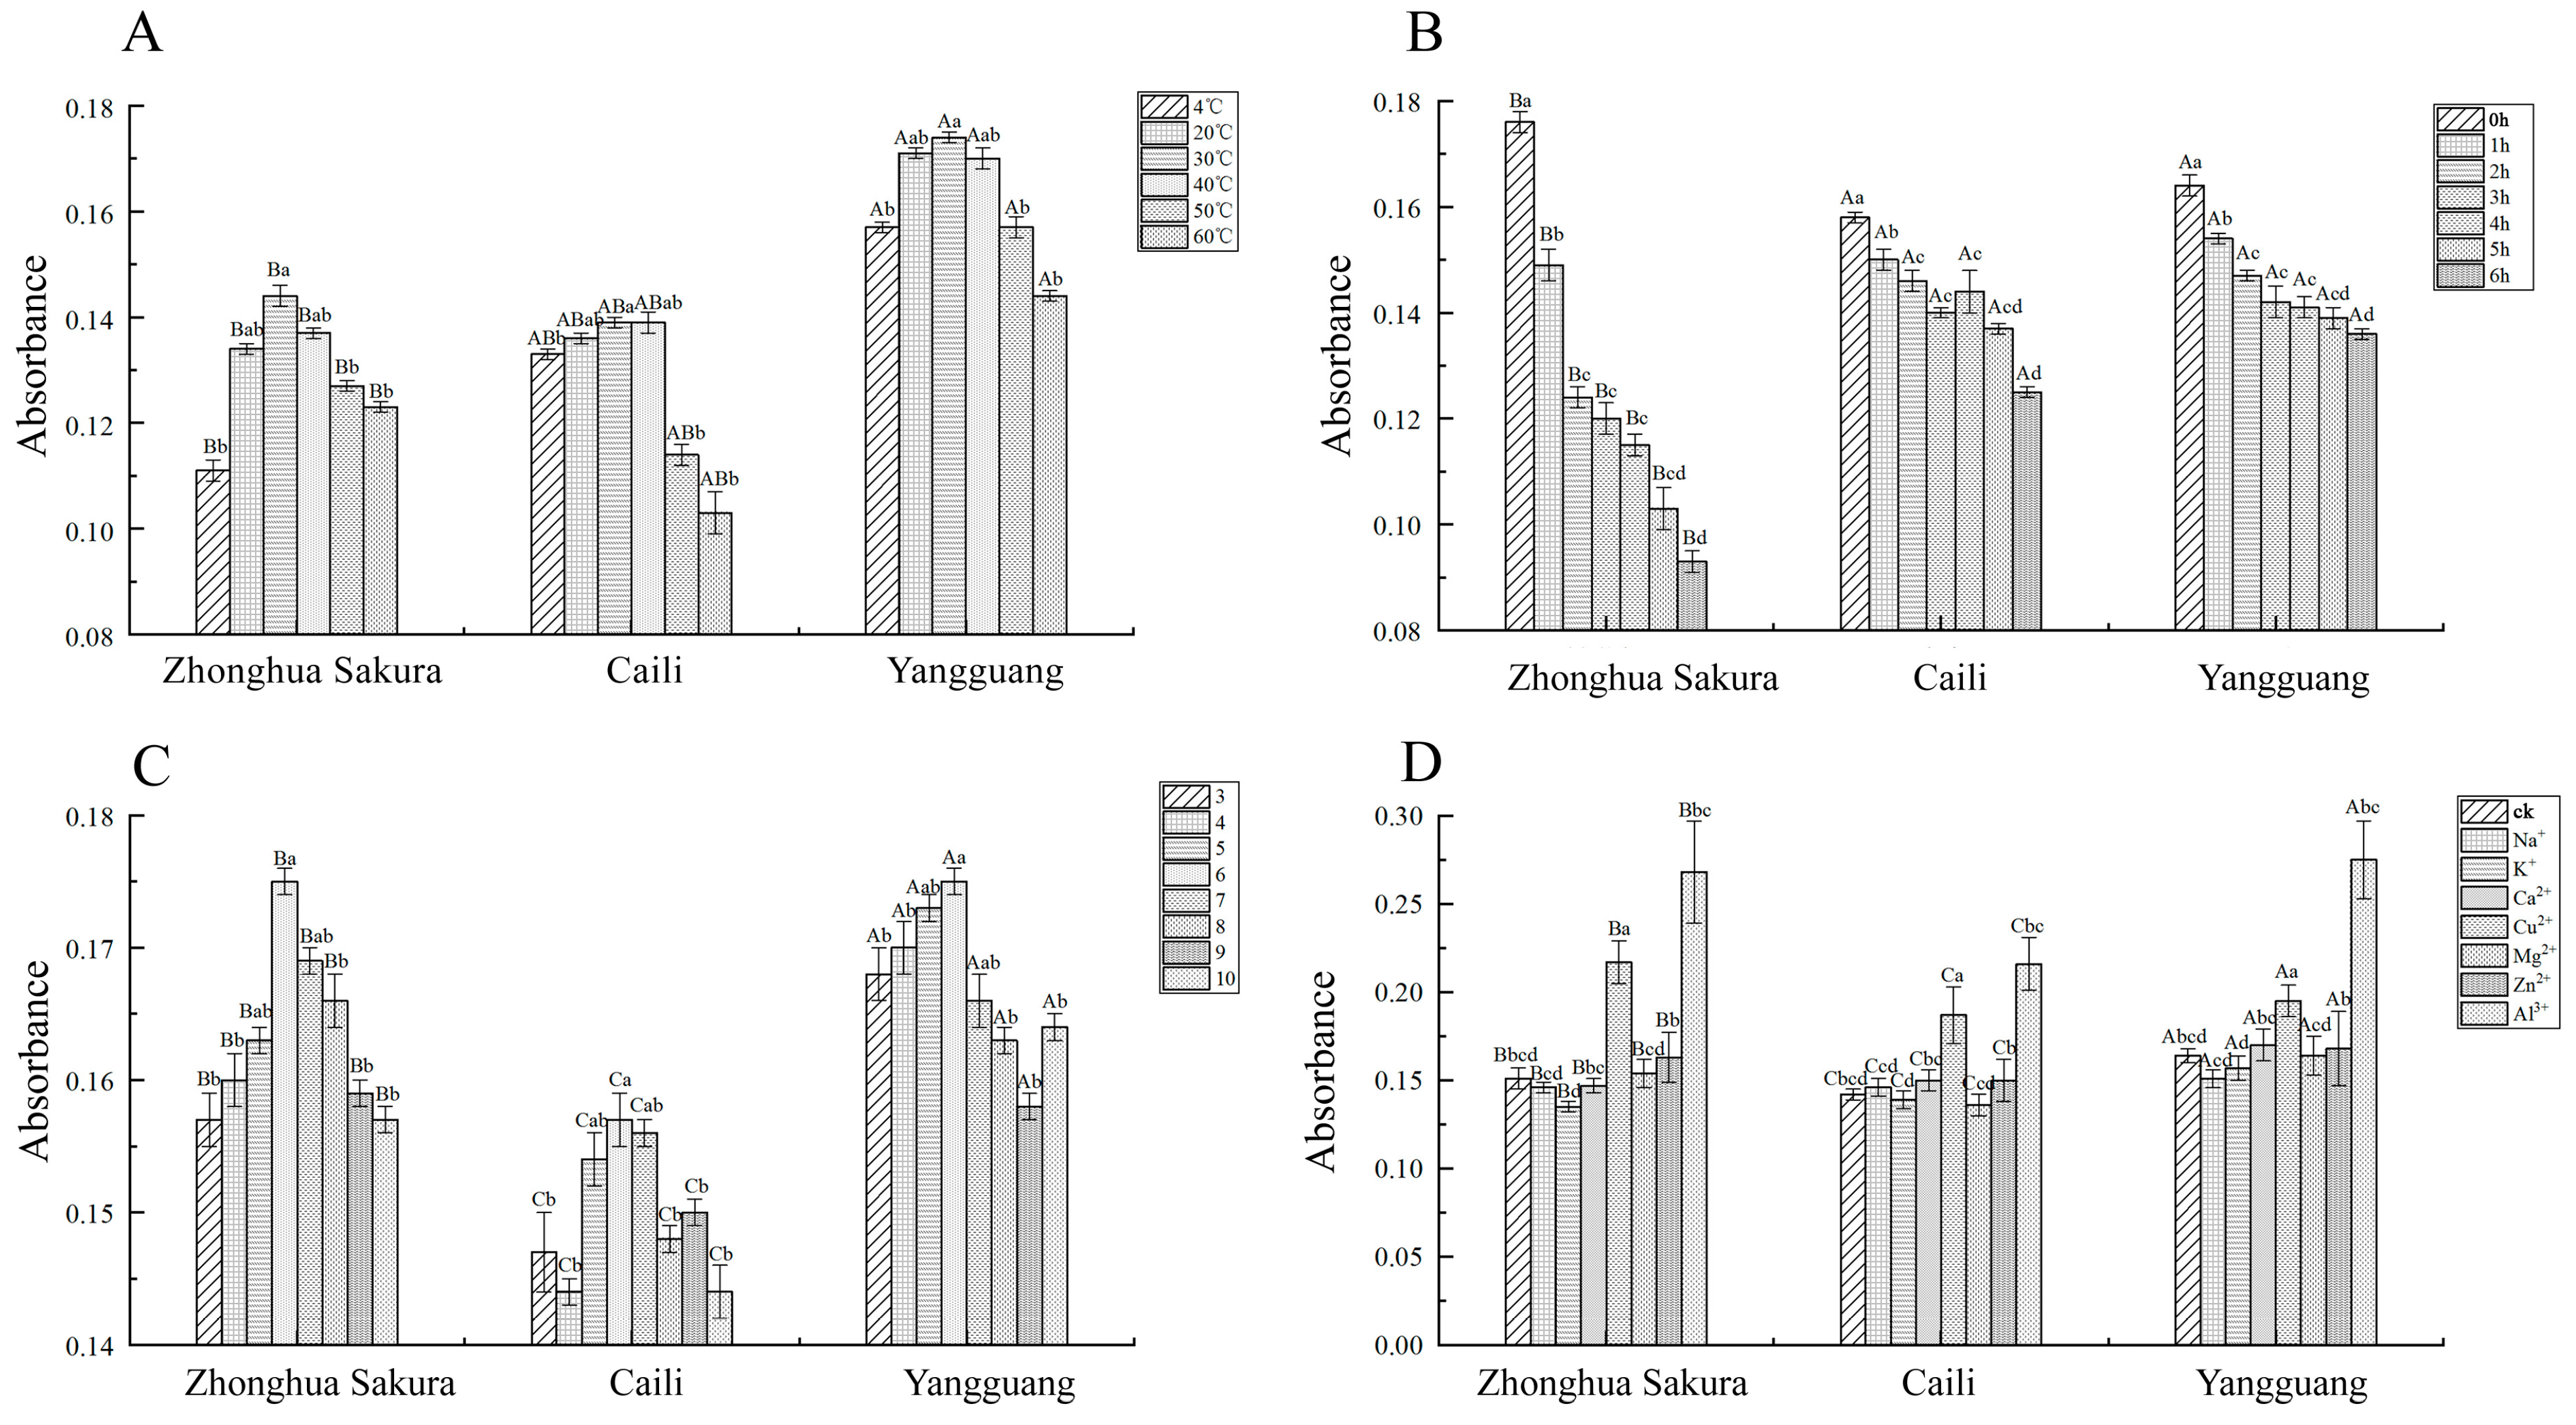
Flower coloration plays a central role in the ornamental and ecological value of cherry blossoms, driven by the biochemical properties of flavonoids and anthocyanins. To better understand the influence of environmental and chemical factors on pigments, a targeted experiment was conducted to evaluate the effects of temperature, light duration, pH, and metal ions on pigment stability in three cherry blossom varieties: Prunus campanulata (bellflower cherry), P. ‘Yoko’, and P. ‘Okame’ Temperature (Figure 4A) exhibited a marked influence, with absorbance increasing from 4 °C to a peak at 30 °C for P. campanulata and P. ‘Yoko’, followed by a decline at higher temperatures, while P.Okame’ showed only slight increases up to 40 °C before a sharp decrease. At 60 °C, absorbance levels were uniformly the lowest across all varieties. Light (Figure 4B) exposure caused anthocyanin degradation, with P. campanulata displaying rapid absorbance loss within the first two hours, whereas P. ‘Yoko’ and P.Okame’ exhibited minor and less consistent decreases over extended exposure. The impact of pH (Figure 4C) was generally mild but revealed that weakly acidic conditions (pH 6) maximized pigment stability in P. campanulata and P.Okame’ while P. ‘Yoko’ showed minimal fluctuation overall but reached its peak absorbance at pH 6. In contrast, extreme acidity or alkalinity reduced absorbance levels. Metal ion (Figure 4D) treatments highlighted distinct interactions; Na+, K+, Ca2+, Mg2+, and Zn2+ had negligible effects, while Cu2+ and Al3+ significantly increased absorbance, suggesting their involvement in anthocyanin synthesis. Fe3+ caused noticeable turbidity and red precipitate formation, indicating structural disruption of anthocyanins.

3.5. Metabolome Analysis of Prunus campanulata Petals

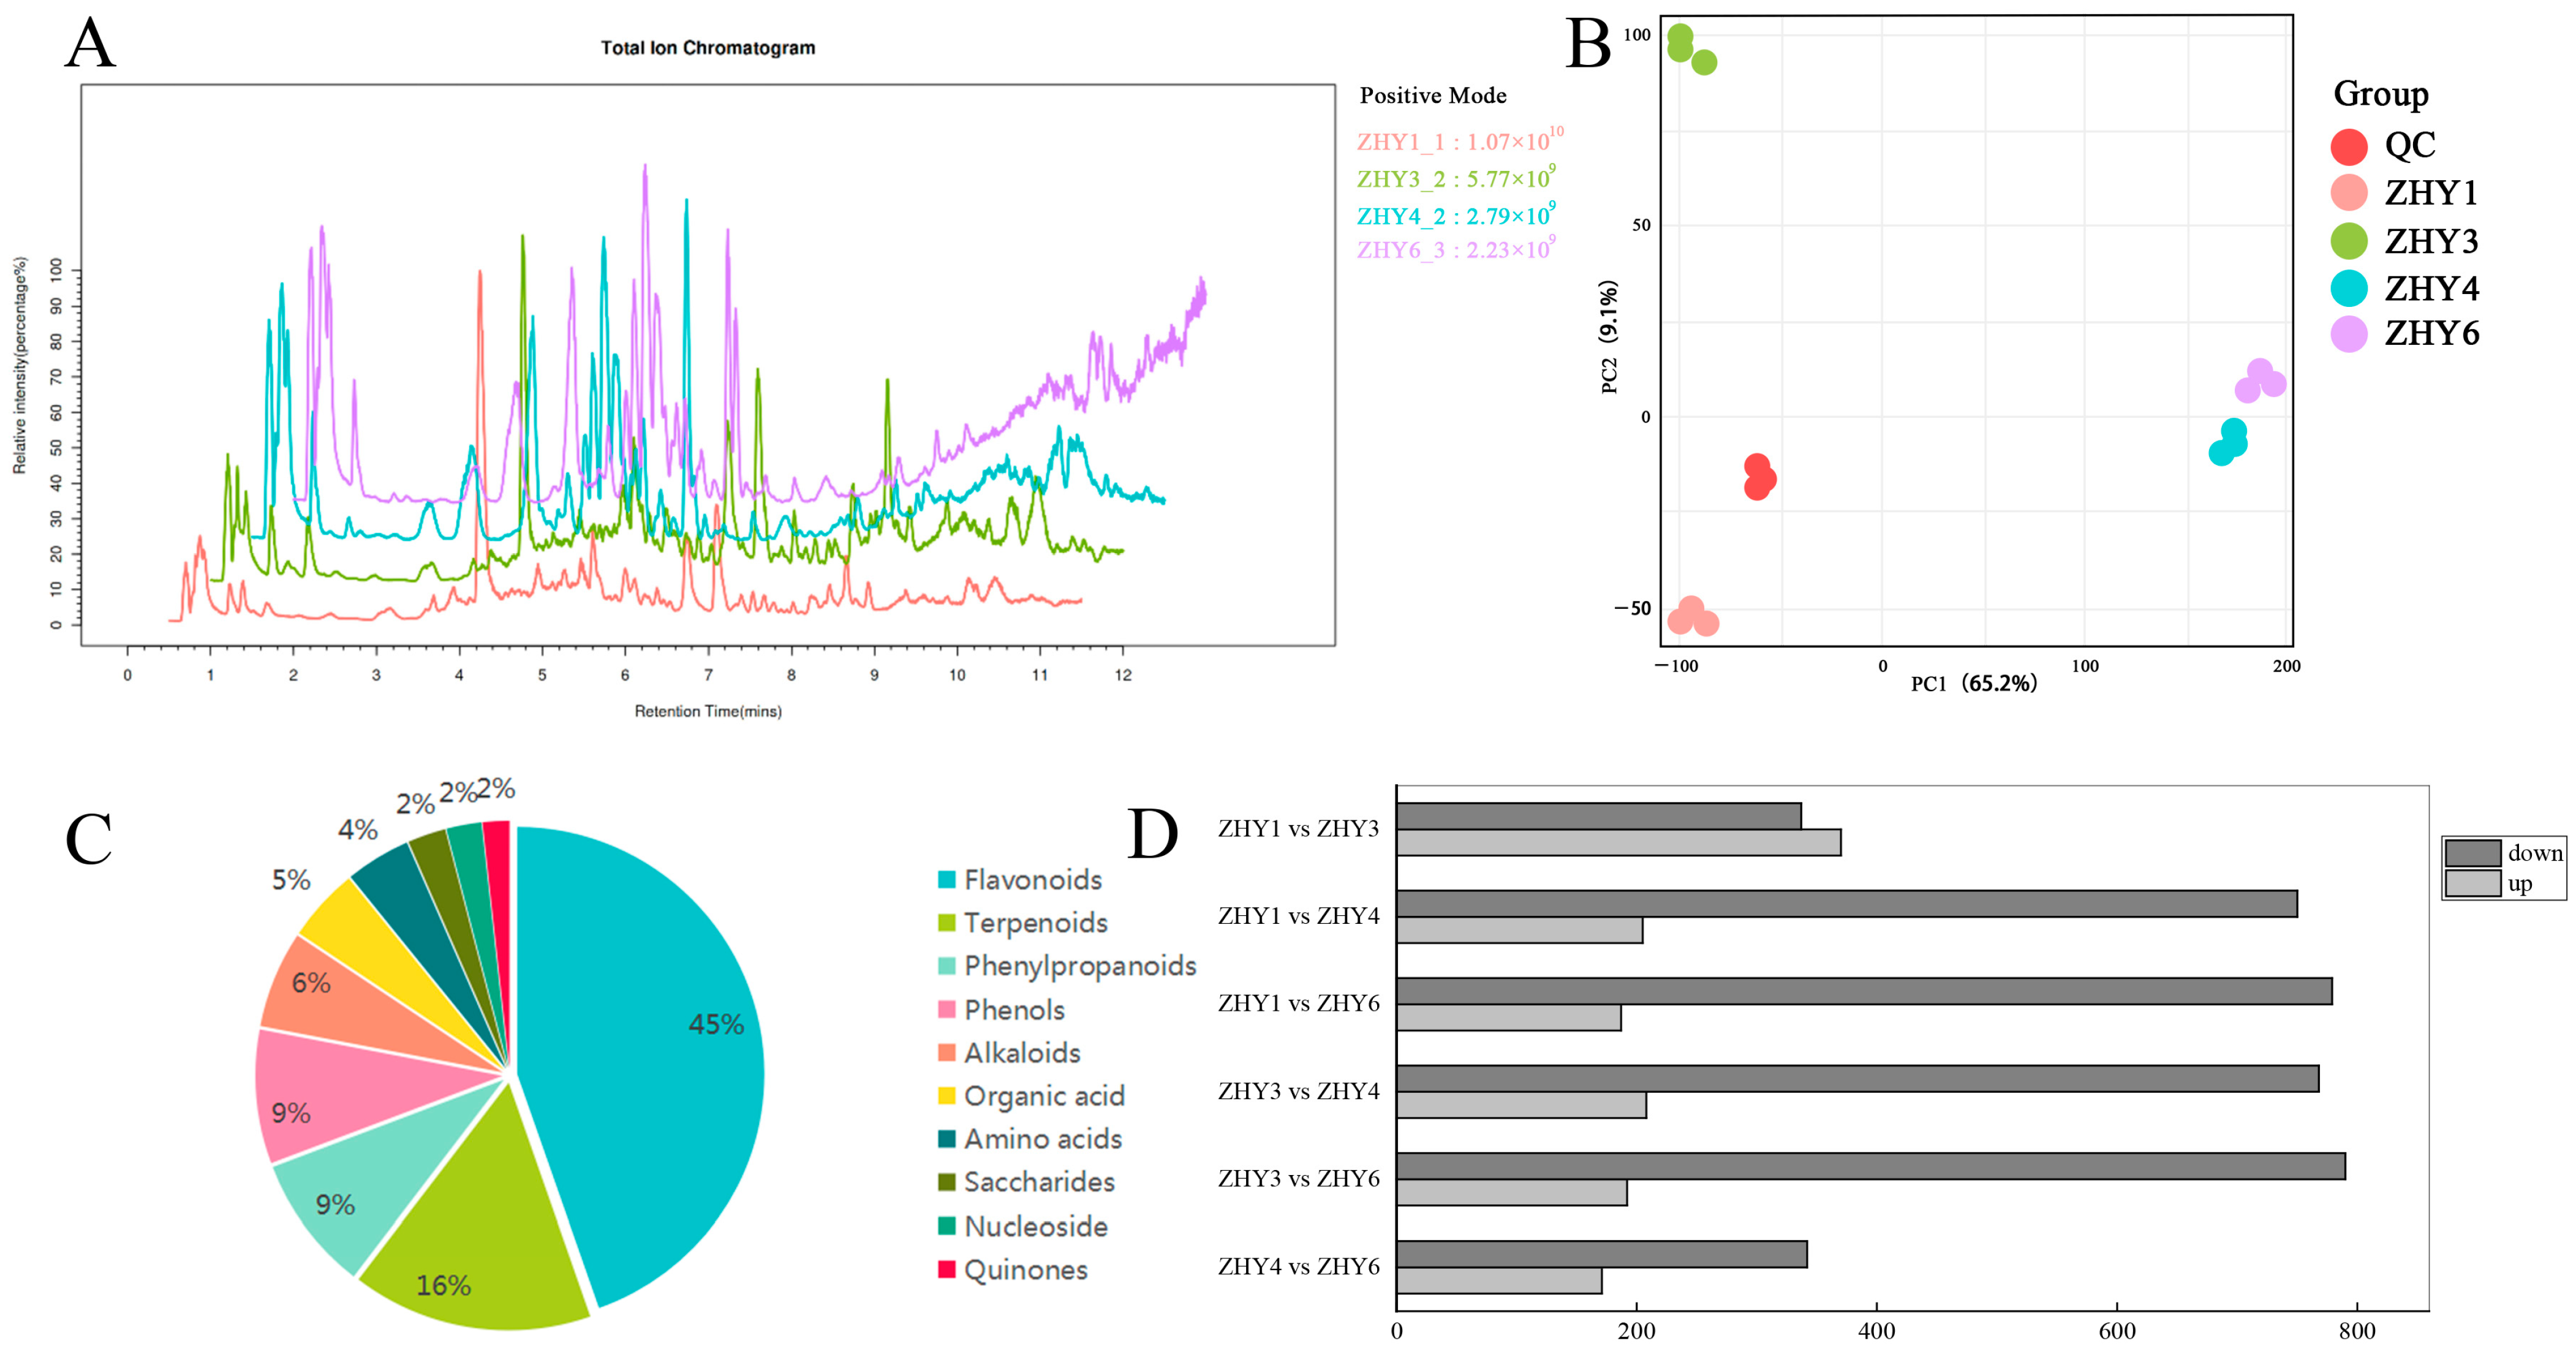
To elucidate the metabolic dynamics underlying the deep purple coloration process in Prunus campanulata petals, untargeted metabolomics was employed as a critical follow-up to physiological and biochemical analyses. This method enables the comprehensive profiling of metabolites associated with pigmentation, capturing subtle yet significant biochemical changes. The selection of developmental stages 1 (ZHY1), 3 (ZHY3), 4 (ZHY4), and 6 (ZHY6) for metabolomic analysis was carefully justified. Stage 1 represents the baseline for metabolic activity in early petal development, while stages 3 and 4 are pivotal due to their association with the most intense pigmentation changes, as demonstrated by prior biochemical findings. Stage 6, in contrast, serves as a mature reference point, reflecting the stabilization of petal traits after full bloom. The total ion chromatogram (TIC) results underscored the technical robustness of the analysis, with high reproducibility in metabolite extraction and detection evident from the overlapping TIC curves in QC samples (Figure 5A). Principal component analysis (PCA) revealed distinct metabolic profiles across the four stages, with PC1 and PC2 explaining 65.2% and 9.1% of the variance, respectively. Experimental samples were clearly separated by developmental stage, and QC samples formed a tight cluster, indicating high analytical precision (Figure 5B). Metabolomic profiling identified 1304 metabolites, with flavonoids, terpenes, and phenylpropanoids dominating the metabolic landscape. Flavonoids accounted for 44.64% of the total metabolites, encompassing 408 compounds such as flavonols, isoflavones, and chalcones, underscoring their central role in pigmentation (Figure 5C). Differential analysis across developmental stages (VIP > 1, p < 0.05) highlighted dynamic regulatory changes, particularly between ZHY3 and ZHY4, the critical pigmentation phases. Notably, comparisons such as ZHY1 vs. ZHY6 identified 966 differentially expressed metabolites (187 up regulated, 779 down regulated), while ZHY4 vs. ZHY6 showed 513 differential metabolites (171 up regulated, 342 down regulated), reflecting a trend toward increased down regulation during the deep purple transition (Figure 5D). The reliability of the OPLS-DA model was confirmed by high Q2 values (exceeding 0.95, see Table S1). This model was used to calculate the Variable Importance in Projection (VIP) score, which measures the contribution of each metabolite to the separation between sample groups. A VIP threshold > 1.0 was applied, along with a p-value < 0.05, to identify metabolites with significant contributions to the developmental changes.

3.6. Functional Enrichment Analysis of Differential Metabolites

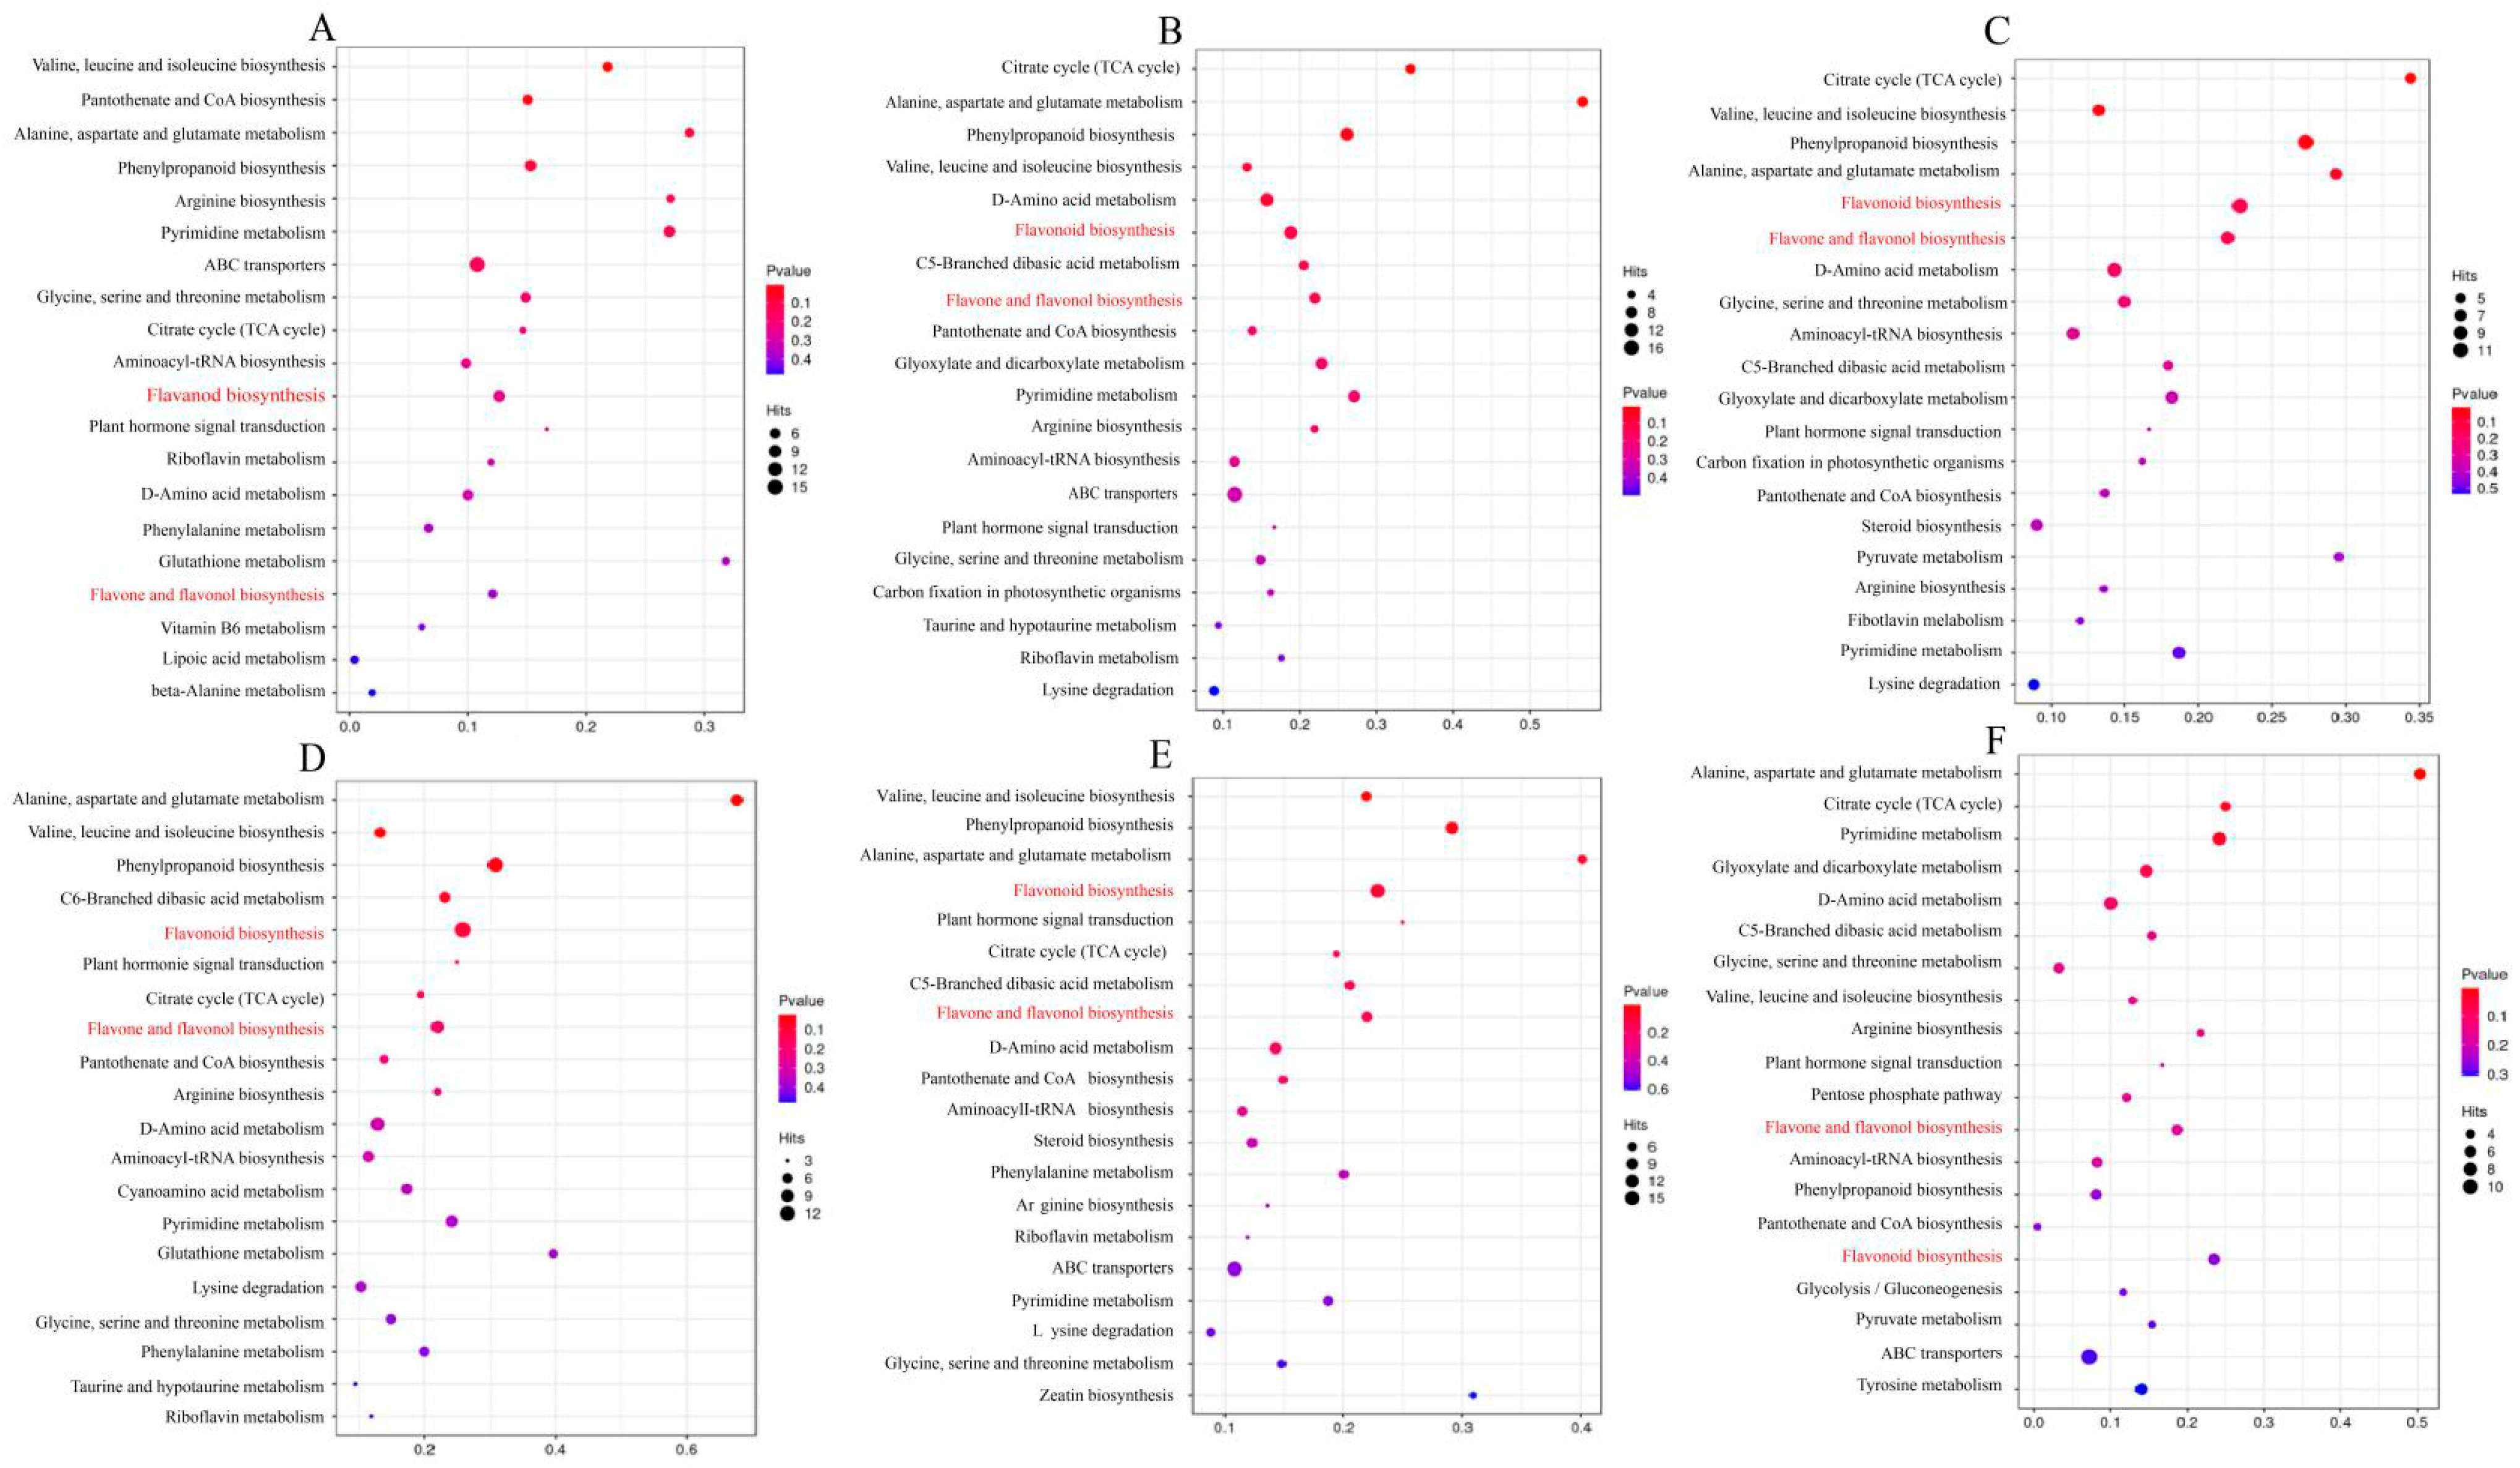
To investigate the metabolic basis of petal color transitions in Prunus campanulata, untargeted metabolomics analysis was conducted, with a focus on identifying the primary pathways and metabolites responsible for the observed deep purple coloration. A systematic comparison of metabolites across developmental stages highlighted the pivotal role of flavonoid metabolites in driving these changes. The KEGG pathway enrichment analysis consistently revealed the flavonoid biosynthesis pathway as a central metabolic route enriched with differential metabolites during petal development. In the ZHY1 vs. ZHY3 comparison, 8 differential metabolites were significantly enriched in the flavonoid biosynthesis pathway, marking an early shift in metabolic activity as coloration began (Figure 6A). As petals progressed into a more defined pigmentation phase in ZHY1 vs. ZHY4, the number of enriched flavonoid metabolites increased to 11, further underscoring the pathway’s importance in accumulating precursors and intermediates critical for pigmentation (Figure 6B). This trend persisted in later comparisons. Between ZHY1 and ZHY6, 11 flavonoid-related metabolites remained significantly enriched, demonstrating that flavonoid metabolism remained a key driver of pigmentation throughout development (Figure 6C). The ZHY3 vs. ZHY4 comparison, which corresponds to the transition into the most active pigmentation phase, showed the highest enrichment, with 12 differential metabolites in the flavonoid pathway, suggesting a peak in flavonoid-related activity at this critical stage (Figure 6D). Even in comparisons of later stages, such as ZHY3 vs. ZHY6 and ZHY4 vs. ZHY6, flavonoid-related metabolites continued to dominate, with 12 and 6 enriched compounds, respectively (Figure 6E,F). These results establish that flavonoid metabolism is the most consistently enriched pathway during the developmental stages of Prunus campanulata petals. The steady enrichment of flavonoid biosynthesis, particularly during key pigmentation phases (stages 3 and 4), underscores its central role in the regulation of petal coloration. This suggests that flavonoid compounds, including their derivatives, are critical determinants of the biochemical changes underlying the transition to the characteristic deep purple hue, warranting further targeted studies to dissect their specific contributions.

3.7. Analysis of Differential Flavonoid Metabolites

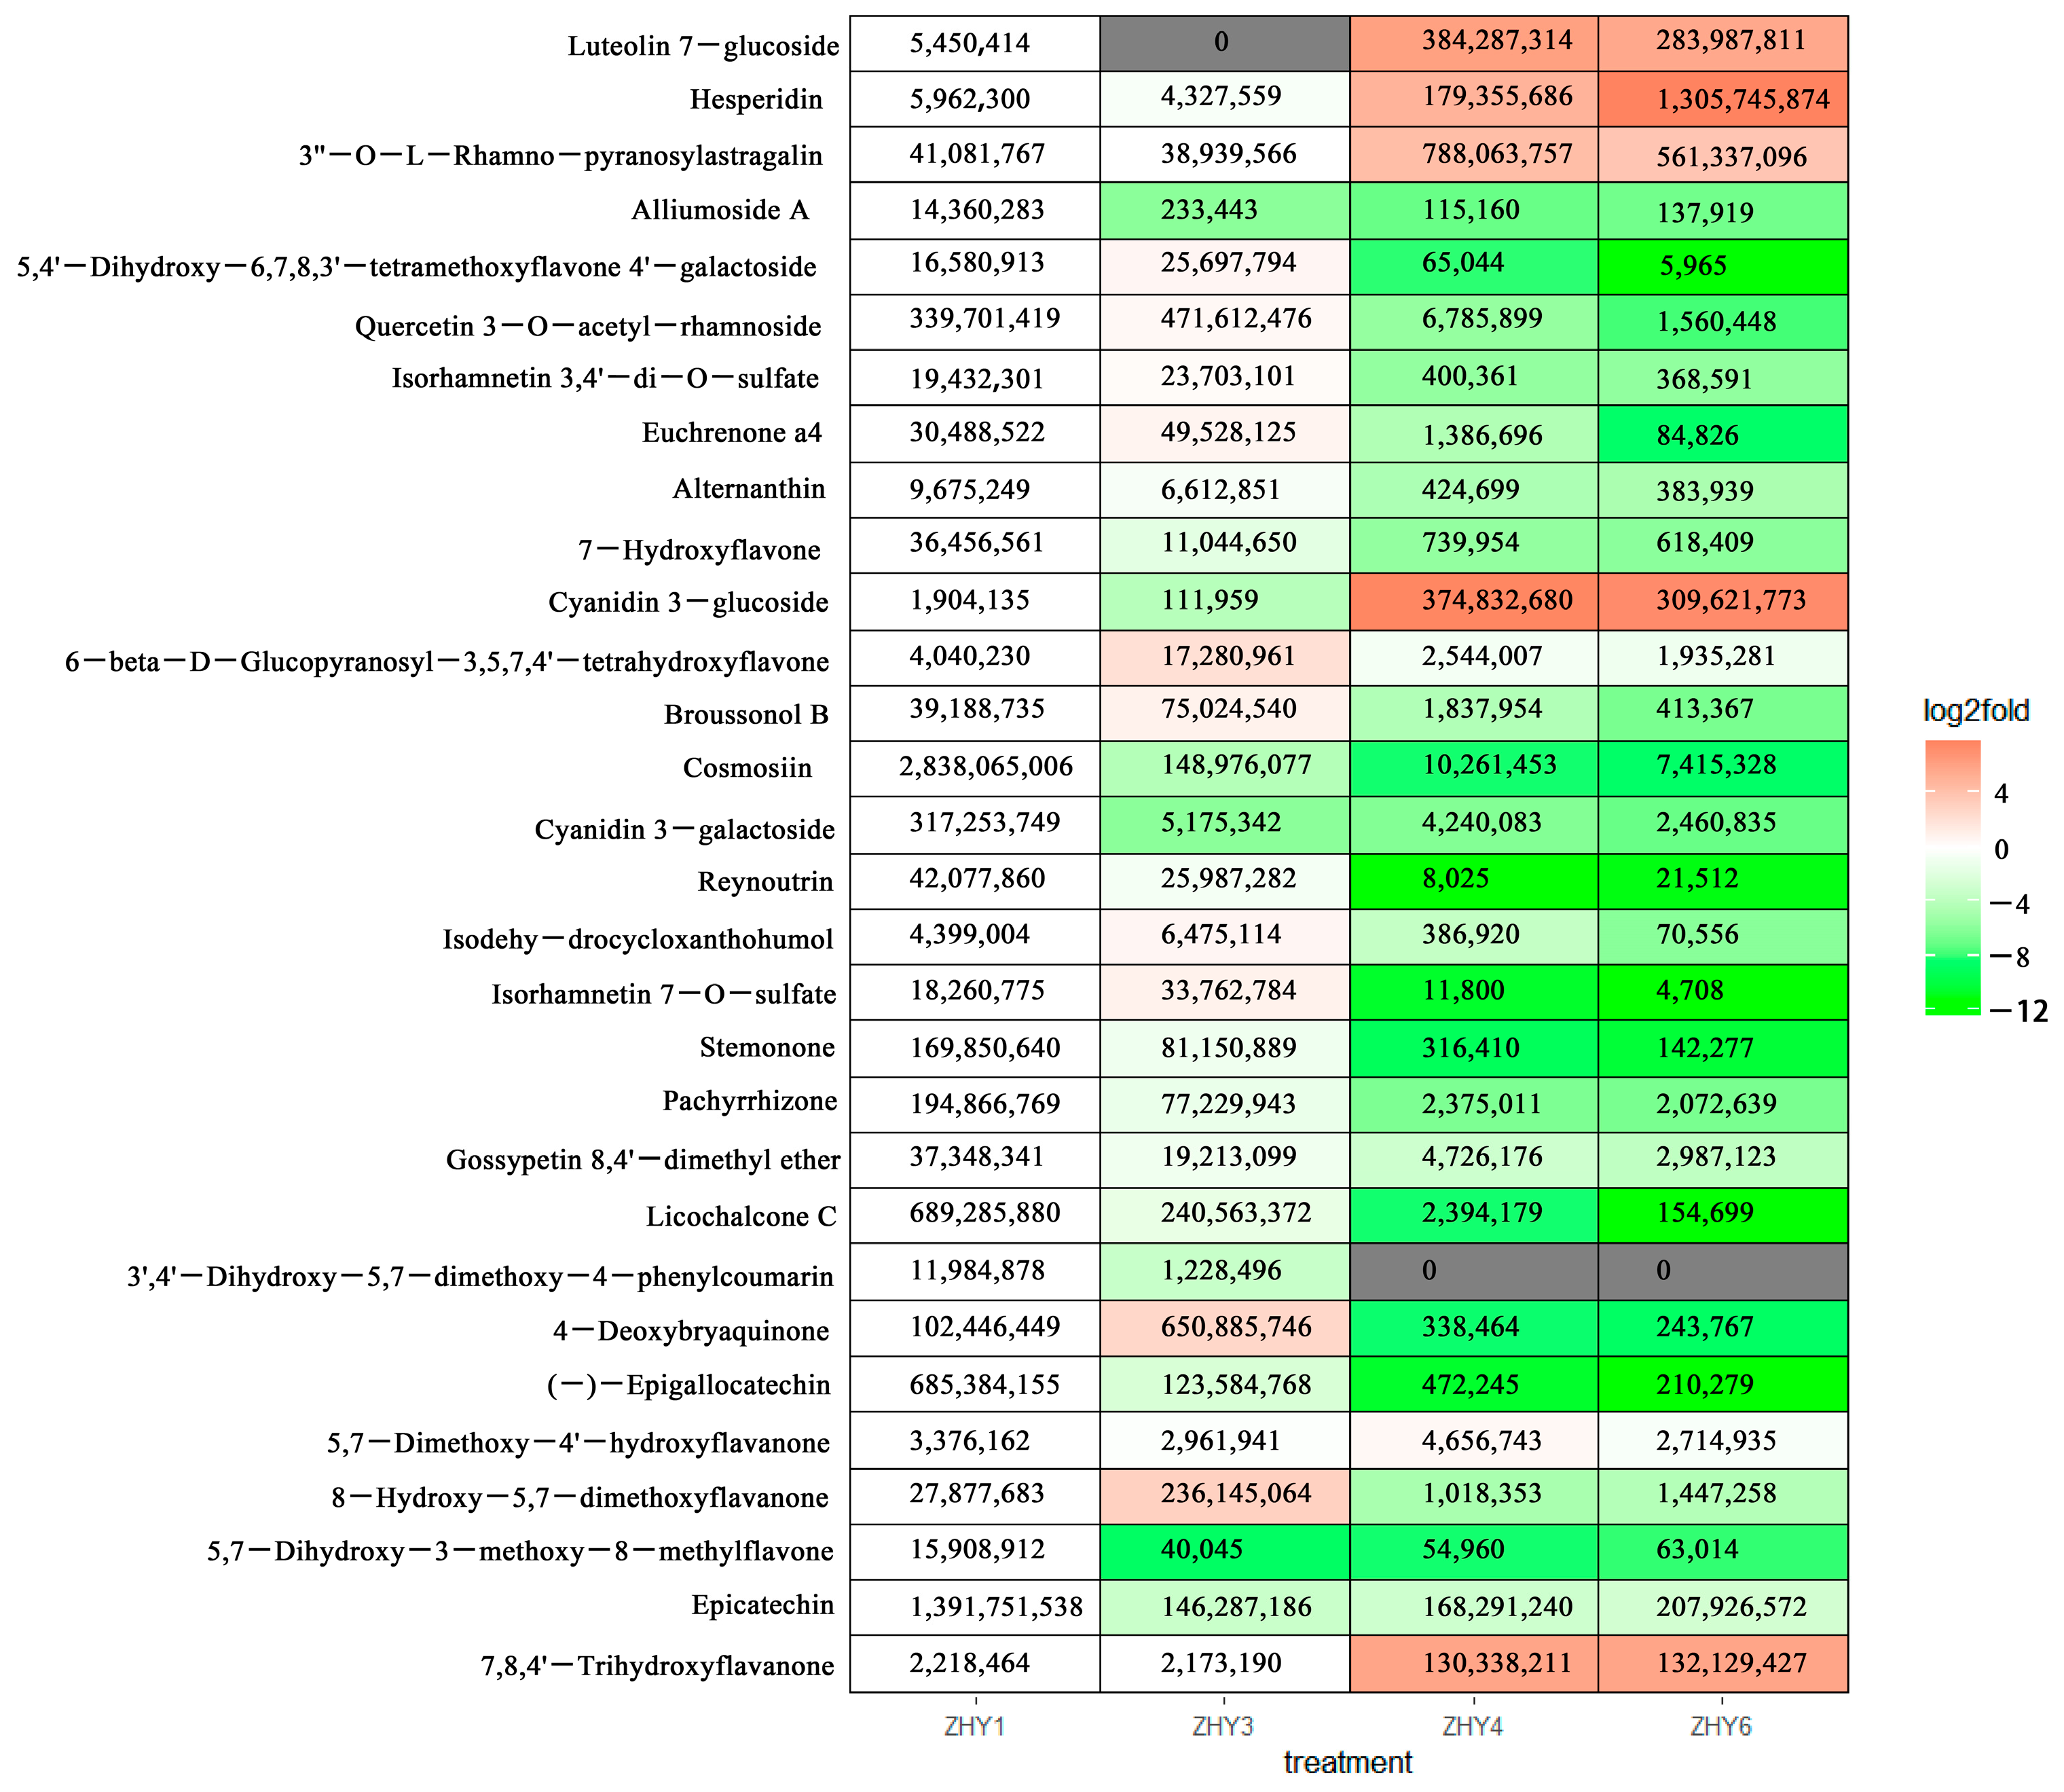
To investigate the metabolic factors influencing the unique coloration of Prunus campanulata petals, a detailed analysis of flavonoid-related differential metabolites was conducted following the identification of flavonoid as central contributors to pigmentation. The experiment aimed to pinpoint specific flavonoid compounds associated with the deep purple and red coloration, building upon KEGG pathway enrichment data and previous physiological findings. Differential analyses across developmental stages revealed key insights into the role of flavonoid compounds (Table 2), including chalcones, flavones, anthocyanins, flavonols, and isoflavones. Comparisons of metabolites between ZHY1 (stage 1) and subsequent stages demonstrated a pronounced increase in certain flavonoids during the pigmentation process. In the ZHY1 vs. ZHY3 comparison, 6 chalcones, 10 flavones, 4 anthocyanins, and 17 flavonols showed significant differences. This pattern persisted in later stages, with ZHY1 vs. ZHY4 identifying 7 anthocyanins and 17 flavonols as key contributors, while ZHY1 vs. ZHY6 highlighted significant increases in chalcones, anthocyanins, and new flavonoid subtypes like neoflavones. These trends were further emphasized in ZHY3 vs. ZHY4, where 13 flavonols and 11 flavones exhibited differential accumulation, indicating that stage 3 and stage 4 represent critical phases for flavonoid biosynthesis and accumulation. Specific anthocyanins emerged as pivotal to coloration. Cyanidin-3-O-glucoside (Cy3G) displayed the most significant increases across all comparisons, with fold changes as high as 18.70 in ZHY1 vs. ZHY4, far exceeding those of cyanidin-3-O-galactoside (Cy3Gal). This highlights Cy3G as the dominant pigment contributing to petal redness. Similarly, flavonoid derivatives such as luteolin-7-O-glucuronide and hyperoside exhibited remarkable fold changes, particularly in ZHY1 vs. ZHY4 and ZHY3 vs. ZHY6, suggesting their critical roles in color development. Heatmap analysis further confirmed that the 30 identified differential flavonoid compounds showed the most pronounced changes between stages 3 and 4, correlating with the peak anthocyanin levels observed earlier. These findings strongly suggest that these 30 compounds, including Cy3G, hyperoside, and luteolin derivatives, are key players in the pigmentation process. These compounds will be further analyzed in conjunction with transcriptomic data to explore their regulatory mechanisms and their roles in shaping the distinctive coloration of P. campanulata petals (Figure 7).

3.8. Transcriptome Sequencing Analysis over the Course of Petal Development

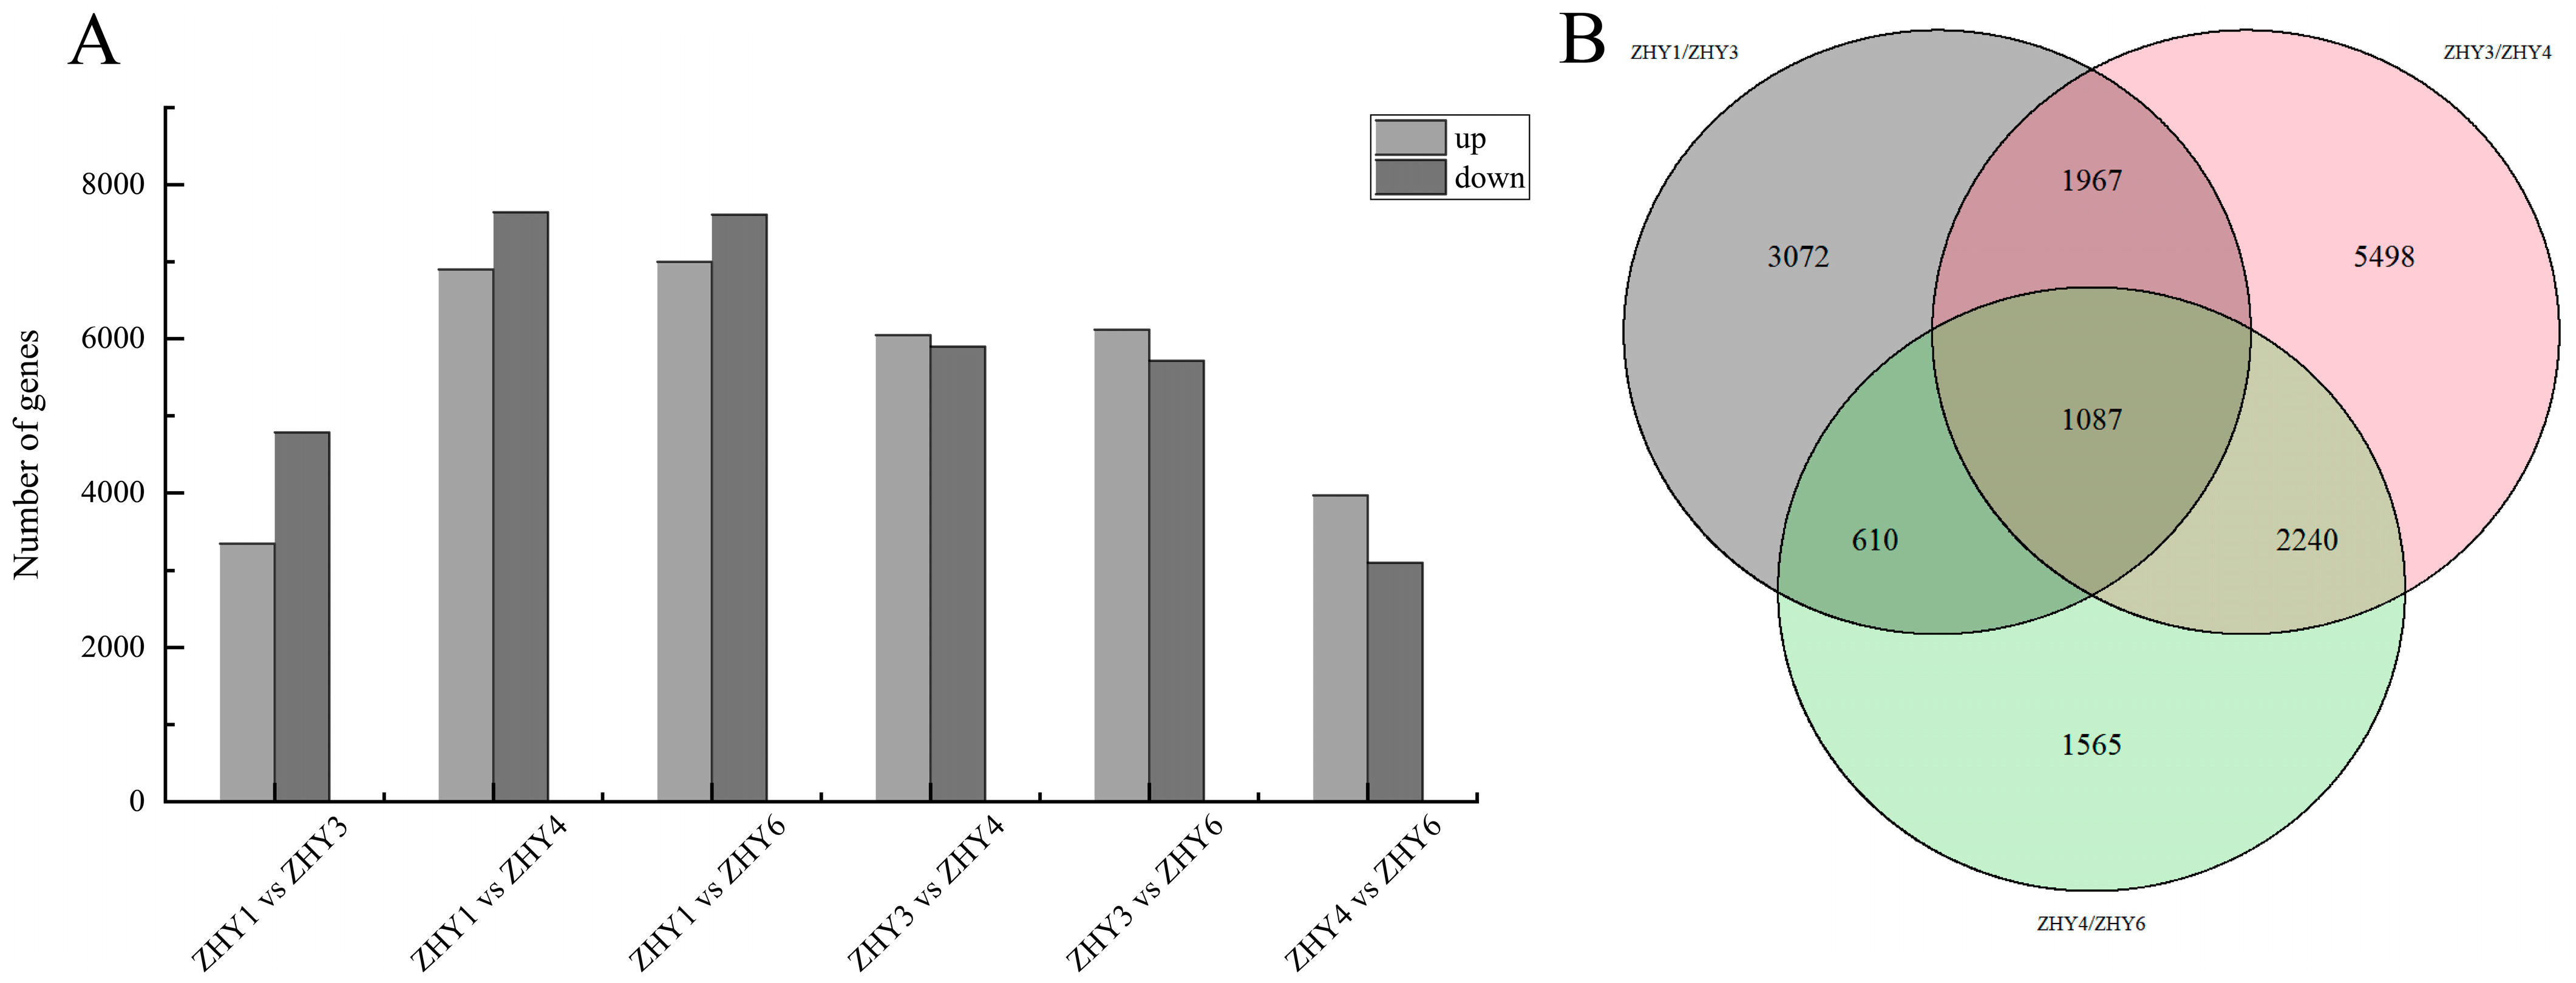
To uncover the molecular mechanisms underlying petal coloration in Prunus campanulata, transcriptomic sequencing was conducted to identify key genes associated with pigmentation. The high-quality sequencing dataset (Table S2), confirmed by stringent quality control (Q20 > 97%, Q30 > 95%), provided a reliable foundation for downstream analyses. Annotation results revealed that 44,323 unigenes were identified, with 89.13% successfully annotated in at least one database (Table S3), including NR (64.17%) and eggNOG (59.79%). However, 38.13% of unigenes remained unannotated, indicating the potential presence of novel or species-specific genes. Differential expression analysis across developmental stages revealed dynamic changes in gene expression. The largest number of DEGs was observed in ZHY1 vs. ZHY6 (14,609 DEGs: 6999 upregulated, 7610 downregulated), followed by ZHY1 vs. ZHY4 (14,541 DEGs). The fewest DEGs occurred in ZHY4 vs. ZHY6 (7068 DEGs), suggesting that gene activity diminishes during the later stages of petal maturation. Visualization through an upset plot revealed 469 DEGs shared across all comparisons and unique DEGs for each transition, highlighting stage-specific gene expression. Focusing on the stage 3 to stage 4 transition, where the most significant morphological and metabolic changes occur, time-series analysis and Venn diagram comparisons identified 5498 DEGs unique to this phase. These genes were absent in stage 1 vs. 3 and stage 4 vs. 6 transitions, emphasizing their critical role in regulating pigmentation. This stage-specific expression pattern aligns with the observed peak in anthocyanin accumulation and flavonoid biosynthesis, marking this transition as the pivotal phase in petal color development. These results provide a comprehensive view of gene expression dynamics, pinpointing 5498 key DEGs likely involved in regulating flavonoid biosynthesis and pigmentation pathways (Figure 8A,B). This dataset forms a robust basis for subsequent metabolomic-transcriptomic integration to elucidate the regulatory mechanisms driving petal coloration in P. campanulata.

3.9. Analysis of Key Gene Modules and Their Association with Metabolites

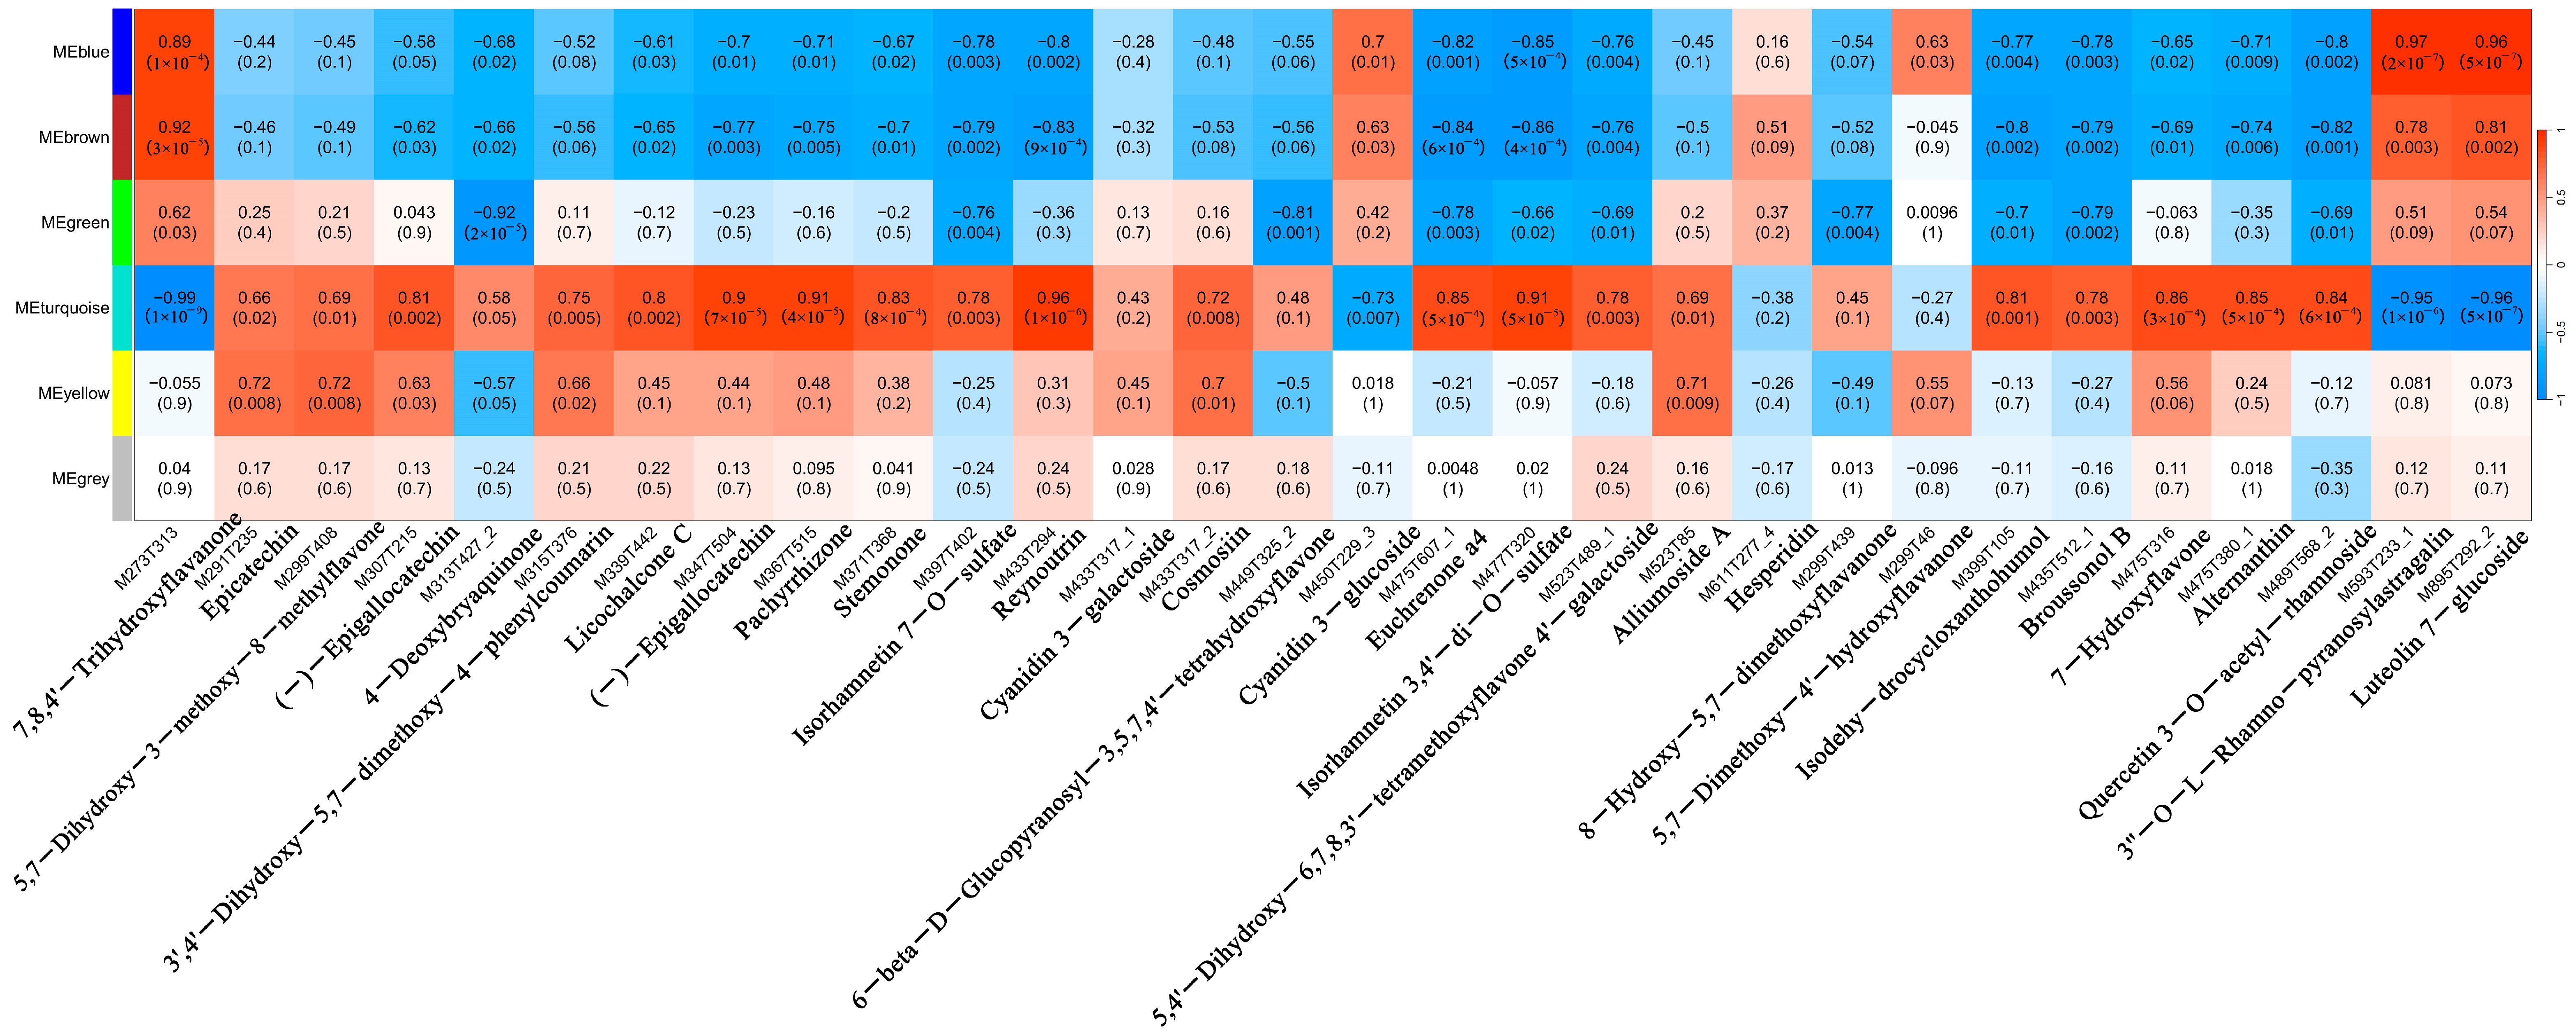
In order to better understand the molecular mechanisms underlying petal coloration in Prunus campanulata (bellflower cherry), a comprehensive analysis was conducted to identify key gene modules and their association with metabolites involved in this process. WGCNA was employed to identify gene clusters linked to 30 differential metabolites, revealing the intricate relationships between gene modules and petal color expression. As illustrated in Figure 9 significant correlations were found between specific modules, including Blue, Brown, and Turquoise, and distinct petal color traits. The MEBlue module demonstrated significant negative correlations with substances M475T607_1 (r = −0.82) and M477T320 (r = −0.85), while showing significant positive correlations with M593T233_1 (r = 0.97) and M895T292_2 (r = 0.96). The Brown module exhibited a strong positive correlation with M273T313 (r = 0.92). The Turquoise module showed significant positive correlations with M347T504 (r = 0.90), M367T515 (r = 0.91), M433T294 (r = 0.96), and M477T320 (r = 0.91), and significant negative correlations with M273T313 (r = −0.99), M593T233_1 (r = −0.95), and M895T292_2 (r = −0.96). Furthermore, the Green module displayed a negative correlation with M313T427_2 (r = −0.92). Overall, the Blue and Brown modules were found to exhibit negative correlations with all 30 metabolites, while the Turquoise module showed positive correlations with each of the metabolites. The Grey module, in contrast, demonstrated weak correlations with the metabolites.
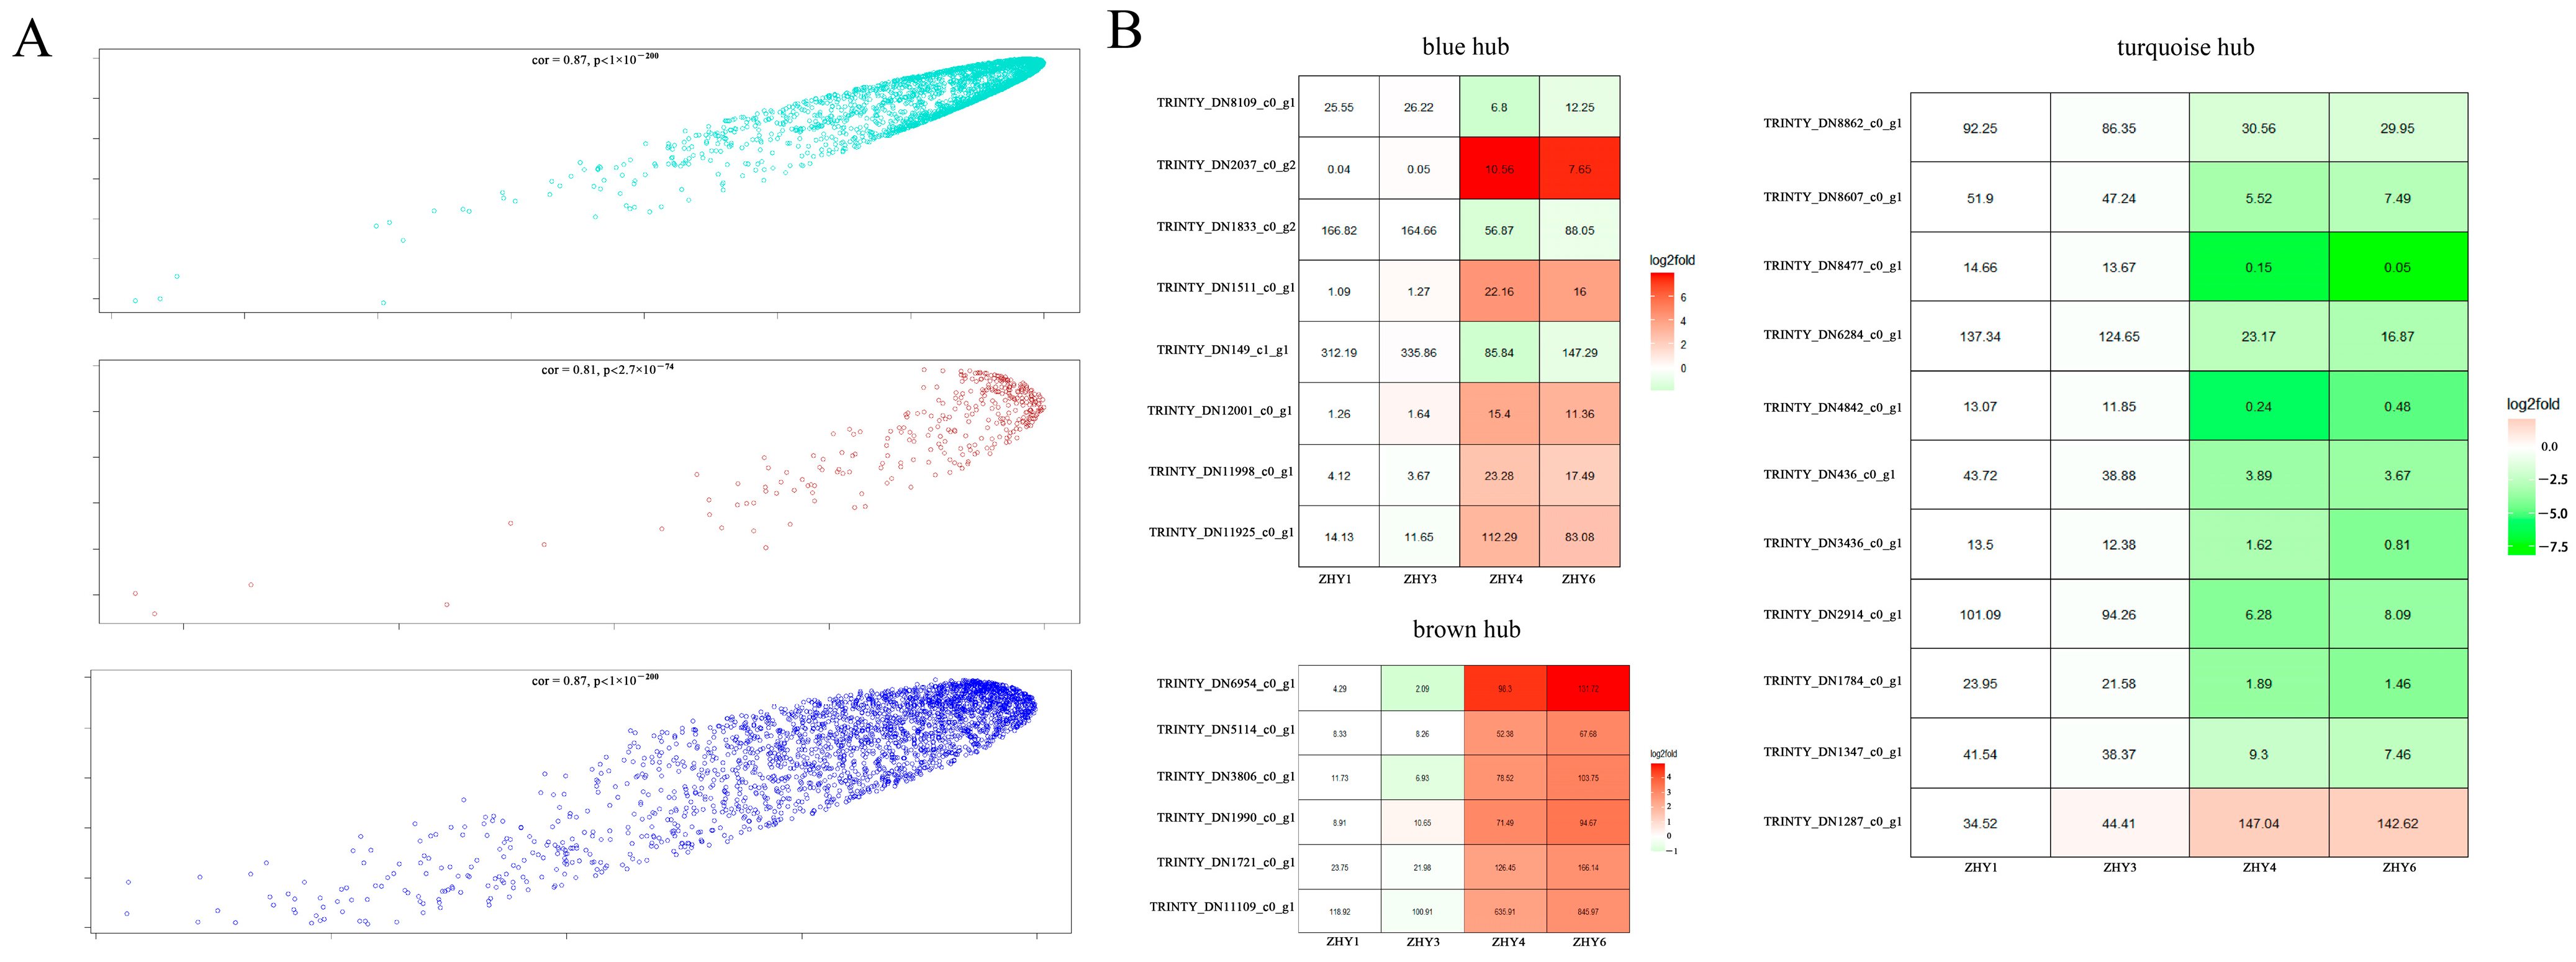
Further functional analysis revealed that the key genes within the Turquoise module play pivotal roles in various biological processes, such as photosynthesis and hormone signaling (Figure 10). Notably, the RPL34 gene (TRINITY_DN2914_c0_g2), encoding the 50S ribosomal protein L34 in the chloroplast, is crucial for cellular protein synthesis and metabolism. It is suggested that RPL34 may indirectly influence petal color expression by regulating protein synthesis and metabolic pathways. In addition, the analysis of the Blue and Brown modules provided further insights into their association with petal color-related metabolites. The NUDT12 gene (TRINITY_DN1511_c0_g1), located in the mitochondria within the Blue module, is involved in nucleotide metabolism. The elevated expression levels of NUDT12 suggest that it may regulate pigment synthesis, thus influencing petal coloration. The Brown module also highlighted the role of CYP78A9 (TRINITY_DN6954_c0_g1), a key gene associated with plant hormone synthesis, development, and pigment metabolism. CYP78A9 is closely linked to redox reactions and cytochrome P450 enzymes, suggesting its direct involvement in regulating petal color expression (Table S1).

4. Discussion

Our integrative analysis demonstrates that the deep pink coloration in Prunus campanulata petals is primarily determined by the coordinated accumulation of specific flavonoids and anthocyanins during stages III and IV, under tight transcriptional control, rather than by morphological differences. The variation in flower pigmentation observed in Prunus varieties is likely driven by the regulation of biochemical pathways responsible for pigment synthesis, rather than structural differences, a conclusion supported by studies in other plant species. Notably, flower size and pigment intensity are typically not correlated, with research indicating that color intensity is more closely linked to the accumulation of specific pigments than to physical traits such as size. This pattern holds true across a range of species, where biochemical processes, including the activation of flavonoid and anthocyanin biosynthetic pathways, underlie the variation in pigmentation. For instance, in Mimulus lewisii, competition between anthocyanin and flavonol biosynthesis governs spatial patterns in pigmentation [35], while in Silene littorea, the regulation of anthocyanin pathway genes is key to understanding color polymorphism. Similarly, studies on species like orchids have shown that MYB transcription factors can regulate pigment distribution across different floral segments [36]. These findings suggest that comparable biochemical mechanisms likely govern pigmentation variation in Prunus flowers, accounting for differences in color intensity across developmental stages. Therefore, the variation in Prunus flower color can be attributed to specific biochemical processes, rather than size differences, and continued research into the regulation of pigment biosynthesis will further elucidate the genetic foundations of flower color variation across species.
Further biochemical analysis of flower pigmentation has revealed that changes observed at stages III and IV—marked by significant shifts in flavonoid and anthocyanin content—support the central role of these compounds in flower color development [37]. This role of anthocyanins in flower coloration is consistent across various species. For instance, in Lysimachia arvensis, alterations in anthocyanin levels were tightly correlated with changes in gene expression, particularly in enzymes like F3′5′H and DFR [38]. Importantly, soluble sugars, which peaked during these same stages, are integral to the biosynthesis of these pigments, providing essential substrates and contributing to the intensification of color. A similar upregulation of the flavonoid biosynthesis pathway has been observed in species like Phalaenopsis amabilis, where key genes related to anthocyanin and flavonoid biosynthesis are preferentially expressed in purple petal cultivars, further reinforcing the critical role of flavonoid metabolism in pigmentation [39]. Transcriptomic and metabolomic analyses in these species reveal that flavonoids, along with terpenes and phenylpropanoids, are major metabolites influencing flower color [40]. Furthermore, flavonoids—especially in their glycosylated forms—were identified as key regulators of pigmentation, as demonstrated by KEGG pathway analysis [39]. Regulatory genes such as MYB and bHLH also play pivotal roles in orchestrating the metabolic processes driving anthocyanin and flavonoid biosynthesis [41]. Collectively, these findings highlight that pigment synthesis, rather than structural traits, is the primary driver of the observed variation in Prunus flower color, underscoring the complex interplay of structural and regulatory pathways.
Building on these biochemical insights, stage-specific transcriptomic analyses have further clarified the regulatory networks controlling flower pigmentation. These analyses show that during stages III and IV of petal color development, key genes involved in flavonoid and anthocyanin biosynthesis, such as PAL, CHS, and F3H, are significantly upregulated, illustrating a dynamic and finely tuned regulatory mechanism. The expression of these biosynthetic genes is influenced by both genetic and environmental factors. For instance, in Arabidopsis, the regulation of anthocyanin biosynthesis is governed by a coordinated system of transcription factors, including MYB, bHLH, and WD40 proteins, which collaborate to modulate pigment synthesis during flower development [42]. Similarly, in gentian flowers, specific R2R3-MYB transcription factors like GtMYBP3 and GtMYBP4 play crucial roles in regulating the early stages of flavonoid biosynthesis, particularly by enhancing the expression of CHS, while leaving later biosynthetic genes unaffected [43]. Further studies in tobacco have demonstrated that the overexpression of specific transcription factors can modulate anthocyanin accumulation, further highlighting the flexibility of transcriptional regulation in controlling pigmentation patterns. These findings underscore that flower pigmentation regulation, particularly anthocyanin biosynthesis, is a multifaceted process shaped by a delicate balance between transcriptional activators, repressors, developmental signals, and environmental cues. Additionally, meta-analyses have shown that MYB transcription factors play a central role in enhancing anthocyanin production in transgenic plants, offering valuable insights into the regulatory mechanisms governing flavonoid biosynthesis and their potential applications in flower color manipulation [44].
The network analysis of gene–metabolite interactions in Prunus flower color formation has advanced our understanding of the regulatory mechanisms governing pigmentation. In particular, the synthesis of flavonoids, especially anthocyanins and proanthocyanidins, is intricately coordinated with specific gene modules controlling their biosynthesis. This highlights the pivotal role that gene–metabolite networks play in regulating pigmentation. This framework aligns with findings across other species, where similar gene–metabolite interactions have been identified. For example, the MYB-bHLH-WDR transcription factor complex has been recognized as a key regulator of anthocyanin biosynthesis, triggering the expression of anthocyanin-related genes to produce corresponding pigments. In maize, research by Li demonstrated that WGCNA could identify key modules associated with anthocyanin accumulation in pericarps, further supporting the importance of gene modules in regulating pigment synthesis. Moreover, in a broader evolutionary context, explored the conservation of the anthocyanin biosynthetic pathway across land plants, emphasizing its role in plant stress responses and its evolutionary significance. Computational systems biology approaches, such as those by Clark and Verwoerd, have modeled the impact of gene modules and their interactions on pigmentation patterns, underscoring the complexity of these gene–metabolite systems. Collectively, these studies reinforce the view that flower color regulation in Prunus is governed by complex, interconnected gene networks that integrate with metabolic pathways to control pigment synthesis and accumulation [45,46,47,48].
In studies of gene modules associated with petal color formation, several key genes have been identified as playing significant roles in metabolic processes and pigment regulation. For example, the RPL34 gene, found within the Turquoise module, encodes a chloroplast-localized ribosomal protein essential for cellular protein synthesis and metabolism. This gene’s role in influencing petal color expression is likely indirect, as protein synthesis and metabolic pathways are tightly regulated and can affect pigmentation. Similar findings have been reported in various plant species, where chloroplast-localized proteins have been shown to regulate flower color through their influence on metabolic networks [37]. Additionally, the NUDT12 gene, located in the Blue module and primarily associated with mitochondrial functions, was identified as another key regulator. Increased expression of NUDT12 was found to correlate with elevated pigment synthesis, a pattern also observed in other studies examining mitochondrial enzymes involved in pigment biosynthesis in plants [49]. Moreover, the Brown module highlighted the involvement of the CYP78A9 gene, which encodes a cytochrome P450 enzyme. CYP78A9 is associated with hormone synthesis, development, and pigment metabolism. Its role in redox reactions, coupled with its close association with cytochrome P450 enzymes, suggests a direct influence on petal color regulation, reflecting similar findings in other species where cytochrome P450 enzymes are critical for pigment synthesis and modification [50,51]. Our transcriptomic assembly also revealed that a substantial proportion (38.13%) of unigenes lacked functional annotation in current databases. While this limits our immediate interpretation, the presence of these ‘genomic dark matter’ transcripts is a common yet significant feature in non-model organisms and underscores the incomplete state of genomic knowledge for species like P. campanulata. These unannotated sequences represent a valuable resource for future discovery, as they may encompass species-specific genes, non-coding RNAs, or rapidly evolving regulatory elements that could contribute to unique phenotypes, including the precise regulation of its distinctive flower coloration. Future studies utilizing more advanced genomic resources, such as a chromosome-level genome assembly for P. campanulata, will be essential to illuminate the identity and function of these unknown transcripts and to fully decipher the genetic basis of its ornamental traits. These genes in the Turquoise, Blue, and Brown modules provide valuable insights into how gene networks contribute to flower pigmentation through intricate metabolic and regulatory pathways. As previously noted, environmental factors, including temperature and light exposure, influence anthocyanin stability and flower color [52,53]. This environmental modulation is interconnected with the genetic network identified in the transcriptomic and network analyses. The influence of external factors on gene expression further underscores the dynamic nature of pigmentation, highlighting that flower color is not solely determined by genetic factors but also by the interaction between genes and the environment.

5. Conclusions

This study reveals that flower color variation in Prunus is primarily determined by the regulation of anthocyanin and flavonoid biosynthesis pathways, with specific emphasis on the pivotal roles of MYB and bHLH transcription factors. These genes govern pigmentation through intricate gene–environment interactions, where environmental factors like light and temperature significantly modulate gene expression and pigment accumulation. Notably, the study identifies 30 differential flavonoid compounds, with Cy3G emerging as the dominant compound responsible for the observed petal redness. Transcriptomic and metabolomic analyses further elucidate the complex gene–metabolite networks involved in pigment synthesis, highlighting the contributions of genes such as RPL34, NUDT12, and CYP78A9. Importantly, the research uncovers critical transformation points at stages III and IV of petal development, where major shifts in pigment accumulation occur. These findings enhance our understanding of the molecular mechanisms driving flower pigmentation in Prunus campanulata, offering potential applications in plant breeding and ornamental flower improvement, and emphasizing the significant influence of environmental factors on pigmentation patterns.

Supplementary Materials

The following supporting information can be downloaded at: https://www.mdpi.com/article/10.3390/f16111633/s1, Figure S1: Transcriptome data validation results of P. Companulata; Table S1: OPLS-DA model validation parameters; Table S2: P. Companulata RNA sequencing results; Table S3: P. Companulata Unigene annotation results.

Author Contributions

S.C. designed the research. Y.W. (Yuxing Wen) performed experiments. J.Z. and X.F. collected and analyzed the data; Y.W. (Yuxing Wen) and Y.W. (Yuxin Wang) wrote the manuscript; G.O., M.S., W.Z. and W.Y. provided valuable suggestions. L.Y. and Y.Y. obtained funding and are responsible for this article. All authors have read and agreed to the published version of the manuscript.

Funding

This research was funded by the Hunan Forestry Science and Technology Innovation Project (Grant No. XLK202417) and the Central Finance Forestry Science and Technology Extension Demonstration Fund Project (Grant No. 2024XT12).

Data Availability Statement

Raw sequence data for small RNAs, degradome, and transcriptome in this study are available at the NCBI Sequence Read Archive (http://www.ncbi.nlm.nih.gov/sra) under accession number PRJNA1191661.

Acknowledgments

We acknowledge the support of Central South University of Forestry and Technology and Hunan Botanical Garden, which made this study possible.

Conflicts of Interest

The authors declare no conflict of interest.

Abbreviations

The following abbreviations are used in this manuscript:
PCAPrincipal component analysis
CHSchalcone synthase
CHIchalcone isomerase
F3′Hflavonoid-3′-hydroxylase
F3′5′Hflavonoid-3′,5′-hydroxylase
bHLHbasic Helix–Loop–Helix
UFGTUDP-glucose flavonoid 3-O-glucosyltransferase
WGCNAWeighted gene co-expression network analysis
TICTotal ion chromatogram
OPLS-DAOrthogonal partial least squares-discriminant analysis
Cy3GCyanidin-3-O-glucoside
Cy3GalCyanidin-3-O-galactoside

References

  1. Dorin, A.; Shrestha, M.; Garcia, J.E.; Burd, M.; Dyer, A.G. Ancient Insect Vision Tuned for Flight among Rocks and Plants Underpins Natural Flower Colour Diversity. Proc. R. Soc. B Biol. Sci. 2023, 290, 20232018. [Google Scholar] [CrossRef]
  2. Sun, Y.; Hu, P.; Jiang, Y.; Li, J.; Chang, J.; Zhang, H.; Shao, H.; Zhou, Y. Integrated Metabolome and Transcriptome Analysis of Petal Anthocyanin Accumulation Mechanism in Gloriosa superba ‘Rothschildiana’ during Different Flower Development Stages. Int. J. Mol. Sci. 2023, 24, 15034. [Google Scholar] [CrossRef]
  3. Ou, Z.; Luo, J.; Qu, Y. Exploring the Molecular Mechanism of Coloration Differences in Two Meconopsis wilsonii Subspecies: Australis and Orientalis. Dev. Biol. 2024, 505, 1–10. [Google Scholar] [CrossRef]
  4. Van Der Kooi, C.J.; Dyer, A.G.; Kevan, P.G.; Lunau, K. Functional Significance of the Optical Properties of Flowers for Visual Signalling. Ann. Bot. 2019, 123, 263–276. [Google Scholar] [CrossRef]
  5. Whitney, H.M.; Bennett, K.M.V.; Dorling, M.; Sandbach, L.; Prince, D.; Chittka, L.; Glover, B.J. Why Do So Many Petals Have Conical Epidermal Cells? Ann. Bot. 2011, 108, 609–616. [Google Scholar] [CrossRef]
  6. Morita, Y.; Hoshino, A. Recent Advances in Flower Color Variation and Patterning of Japanese Morning Glory and Petunia. Breed. Sci. 2018, 68, 128–138. [Google Scholar] [CrossRef] [PubMed]
  7. De Jager, M.L.; Dreyer, L.L.; Ellis, A.G. Do Pollinators Influence the Assembly of Flower Colours within Plant Communities? Oecologia 2011, 166, 543–553. [Google Scholar] [CrossRef] [PubMed]
  8. Makino, T.T.; Yokoyama, J. Nonrandom Composition of Flower Colors in a Plant Community: Mutually Different Co-Flowering Natives and Disturbance by Aliens. PLoS ONE 2015, 10, e0143443. [Google Scholar] [CrossRef]
  9. Prieto-Benítez, S.; Dötterl, S.; Giménez-Benavides, L. Circadian Rhythm of a Silene Species Favours Nocturnal Pollination and Constrains Diurnal Visitation. Ann. Bot. 2016, 118, 907–918. [Google Scholar] [CrossRef]
  10. Akita, Y.; Morimura, S.; Loetratsami, P.; Ishizaka, H. A Review of Research on Flower-Colored Mutants of Fragrant Cyclamens Induced by Ion-Beam Irradiation. Hortic. Int. J. 2017, 1, 90–91. [Google Scholar] [CrossRef]
  11. Nakatsuka, T.; Sasaki, N.; Nishihara, M. Transcriptional Regulators of Flavonoid Biosynthesis and Their Application to Flower Color Modification in Japanese Gentians. Plant Biotechnol. 2014, 31, 389–399. [Google Scholar] [CrossRef]
  12. Conrad, A.C.; Mathabatha, M.F. Elucidating Variable Traits of Flower Pigments in Clivian Plants’ Species. Vegetos Int. J. Plant Res. 2017, 30, 9. [Google Scholar] [CrossRef]
  13. Verma, D.; Sharma, N.; Malhotra, U. Structural Chemistry and Stability of Anthocyanins. Pharma Innov. 2023, 12, 1366–1373. [Google Scholar] [CrossRef]
  14. Davies, K.M.; Landi, M.; Van Klink, J.W.; Schwinn, K.E.; Brummell, D.A.; Albert, N.W.; Chagné, D.; Jibran, R.; Kulshrestha, S.; Zhou, Y.; et al. Evolution and Function of Red Pigmentation in Land Plants. Ann. Bot. 2022, 130, 613–636. [Google Scholar] [CrossRef] [PubMed]
  15. Chandler, S.F.; Senior, M.; Nakamura, N.; Tsuda, S.; Tanaka, Y. Expression of Flavonoid 3′,5′-Hydroxylase and Acetolactate Synthase Genes in Transgenic Carnation: Assessing the Safety of a Nonfood Plant. J. Agric. Food Chem. 2013, 61, 11711–11720. [Google Scholar] [CrossRef] [PubMed]
  16. Liu, W.; Zheng, T.; Yang, Y.; Li, P.; Qiu, L.; Li, L.; Wang, J.; Cheng, T.; Zhang, Q. Meta-Analysis of the Effect of Overexpression of MYB Transcription Factors on the Regulatory Mechanisms of Anthocyanin Biosynthesis. Front. Plant Sci. 2021, 12, 781343. [Google Scholar] [CrossRef]
  17. Guo, J.; Han, W.; Wang, M.-H. Ultraviolet and Environmental Stresses Involved in the Induction and Regulation of Anthocyanin Biosynthesis: A Review. Afr. J. Biotechnol. 2008, 7, 4966–4972. [Google Scholar]
  18. Zhang, D.; Teng, Y. Germplasm Resources of Red Pears and Research Progress in Pear Coloring Mechanism. J. Fruit. Sci. 2011, 28, 485–492. [Google Scholar]
  19. Zumajo-Cardona, C.; Gabrieli, F.; Anire, J.; Albertini, E.; Ezquer, I.; Colombo, L. Evolutionary Studies of the bHLH Transcription Factors Belonging to MBW Complex: Their Role in Seed Development. Ann. Bot. 2023, 132, 383–400. [Google Scholar] [CrossRef]
  20. Hao, Y.; Zong, X.; Ren, P.; Qian, Y.; Fu, A. Basic Helix-Loop-Helix (bHLH) Transcription Factors Regulate a Wide Range of Functions in Arabidopsis. Int. J. Mol. Sci. 2021, 22, 7152. [Google Scholar] [CrossRef]
  21. Chen, Z.; Yu, L.; Liu, W.; Zhang, J.; Wang, N.; Chen, X. Research Progress of Fruit Color Development in Apple (Malus domestica Borkh.). Plant Physiol. Biochem. 2021, 162, 267–279. [Google Scholar] [CrossRef]
  22. Yousuf, B.; Gul, K.; Wani, A.A.; Singh, P. Health Benefits of Anthocyanins and Their Encapsulation for Potential Use in Food Systems: A Review. Crit. Rev. Food Sci. Nutr. 2016, 56, 2223–2230. [Google Scholar] [CrossRef]
  23. Alam, M.A.; Islam, P.; Subhan, N.; Rahman, M.M.; Khan, F.; Burrows, G.E.; Nahar, L.; Sarker, S.D. Potential Health Benefits of Anthocyanins in Oxidative Stress Related Disorders. Phytochem. Rev. 2021, 20, 705–749. [Google Scholar] [CrossRef]
  24. Liu, W.; Nan, G.; Nisar, M.F.; Wan, C. Chemical Constituents and Health Benefits of Four Chinese Plum Species. J. Food Qual. 2020, 2020, 8842506. [Google Scholar] [CrossRef]
  25. Winter, A.N.; Bickford, P.C. Anthocyanins and Their Metabolites as Therapeutic Agents for Neurodegenerative Disease. Antioxidants 2019, 8, 333. [Google Scholar] [CrossRef] [PubMed]
  26. De Ferrars, R.M.; Czank, C.; Zhang, Q.; Botting, N.P.; Kroon, P.A.; Cassidy, A.; Kay, C.D. The Pharmacokinetics of Anthocyanins and Their Metabolites in Humans. Br. J. Pharmacol. 2014, 171, 3268–3282. [Google Scholar] [CrossRef] [PubMed]
  27. Cásedas, G.; Les, F.; López, V. Anthocyanins: Plant Pigments, Food Ingredients or Therapeutic Agents for the CNS? A Mini-Review Focused on Clinical Trials. Curr. Pharm. Des. 2020, 26, 1790–1798. [Google Scholar] [CrossRef]
  28. Khoo, H.E.; Azlan, A.; Tang, S.T.; Lim, S.M. Anthocyanidins and Anthocyanins: Colored Pigments as Food, Pharmaceutical Ingredients, and the Potential Health Benefits. Food Nutr. Res. 2017, 61, 1361779. [Google Scholar] [CrossRef]
  29. Qian, Y.; Shan, L.; Zhao, R.; Tang, J.; Zhang, C.; Chen, M.; Duan, Y.; Zhu, F. Recent Advances in Flower Color and Fragrance of Osmanthus fragrans. Forests 2023, 14, 1403. [Google Scholar] [CrossRef]
  30. Choudhury, M.R.; Islam, M.S.; Ahmed, Z.U.; Nayar, F. Phytoremediation of Heavy Metal Contaminated Buriganga Riverbed Sediment by Indian Mustard and Marigold Plants. Environ. Prog. Sustain. Energy 2016, 35, 117–124. [Google Scholar] [CrossRef]
  31. Zhukov, A.V. Palmitic Acid and Its Role in the Structure and Functions of Plant Cell Membranes. Russ. J. Plant Physiol. 2015, 62, 706–713. [Google Scholar] [CrossRef]
  32. Roidoung, S.; Dolan, K.D.; Siddiq, M. Estimation of Kinetic Parameters of Anthocyanins and Color Degradation in Vitamin C Fortified Cranberry Juice during Storage. Food Res. Int. 2017, 94, 29–35. [Google Scholar] [CrossRef]
  33. Hosoda, K.; Sasahara, H.; Matsushita, K.; Tamura, Y.; Miyaji, M.; Matsuyama, H. Anthocyanin and Proanthocyanidin Contents, Antioxidant Activity, and in Situ Degradability of Black and Red Rice Grains. Asian-Australas J Anim Sci 2018, 31, 1213–1220. [Google Scholar] [CrossRef]
  34. Qiao, H.; Zhao, W.; Tian, S.; Wang, D.; Wu, H.; Wang, C.; Zhu, J.; Li, N.; Zhu, X.; Mu, S.; et al. Exploring the Mechanisms Underlying Petal Pigmentation Differences in Two Cultivars of Physalis philadelphica Based on HPLC and NGS. Horticulturae 2024, 10, 507. [Google Scholar] [CrossRef]
  35. Yuan, Y.-W.; Rebocho, A.B.; Sagawa, J.M.; Stanley, L.E.; Bradshaw, H.D. Competition between Anthocyanin and Flavonol Biosynthesis Produces Spatial Pattern Variation of Floral Pigments between Mimulus Species. Proc. Natl. Acad. Sci. USA 2016, 113, 2448–2453. [Google Scholar] [CrossRef]
  36. Li, B.-J.; Zheng, B.-Q.; Wang, J.-Y.; Tsai, W.-C.; Lu, H.-C.; Zou, L.-H.; Wan, X.; Zhang, D.-Y.; Qiao, H.-J.; Liu, Z.-J.; et al. New Insight into the Molecular Mechanism of Colour Differentiation among Floral Segments in Orchids. Commun. Biol. 2020, 3, 89. [Google Scholar] [CrossRef]
  37. Tanaka, Y.; Brugliera, F. Metabolic Engineering of Flower Color Pathways Using Cytochromes P450. In Fifty Years of Cytochrome P450 Research; Springer: Tokyo, Japan, 2014; pp. 207–229. [Google Scholar] [CrossRef]
  38. Sánchez-Cabrera, M.; Jiménez-López, F.J.; Narbona, E.; Arista, M.; Ortiz, P.L.; Romero-Campero, F.J.; Ramanauskas, K.; Igić, B.; Fuller, A.A.; Whittall, J.B. Changes at a Critical Branchpoint in the Anthocyanin Biosynthetic Pathway Underlie the Blue to Orange Flower Color Transition in Lysimachia Arvensis. Front. Plant Sci. 2021, 12, 633979. [Google Scholar] [CrossRef]
  39. Meng, X.; Li, G.; Gu, L.; Sun, Y.; Li, Z.; Liu, J.; Wu, X.; Dong, T.; Zhu, M. Comparative Metabolomic and Transcriptome Analysis Reveal Distinct Flavonoid Biosynthesis Regulation Between Petals of White and Purple Phalaenopsis Amabilis. J. Plant Growth Regul. 2020, 39, 823–840. [Google Scholar] [CrossRef]
  40. Yan, H.; Pei, X.; Zhang, H.; Li, X.; Zhang, X.; Zhao, M.; Chiang, V.L.; Sederoff, R.R.; Zhao, X. MYB-Mediated Regulation of Anthocyanin Biosynthesis. Int. J. Mol. Sci. 2021, 22, 3103. [Google Scholar] [CrossRef]
  41. Gou, J.-Y.; Felippes, F.F.; Liu, C.-J.; Weigel, D.; Wang, J.-W. Negative Regulation of Anthocyanin Biosynthesis in Arabidopsis by a miR156-Targeted SPL Transcription Factor. Plant Cell 2011, 23, 1512–1522. [Google Scholar] [CrossRef]
  42. Petroni, K.; Tonelli, C. Recent Advances on the Regulation of Anthocyanin Synthesis in Reproductive Organs. Plant Sci. 2011, 181, 219–229. [Google Scholar] [CrossRef] [PubMed]
  43. Nakatsuka, T.; Saito, M.; Yamada, E.; Fujita, K.; Kakizaki, Y.; Nishihara, M. Isolation and Characterization of GtMYBP3 and GtMYBP4, Orthologues of R2R3-MYB Transcription Factors That Regulate Early Flavonoid Biosynthesis, in Gentian Flowers. J. Exp. Bot. 2012, 63, 6505–6517. [Google Scholar] [CrossRef]
  44. Nakatsuka, T.; Yamada, E.; Saito, M.; Fujita, K.; Nishihara, M. Heterologous Expression of Gentian MYB1R Transcription Factors Suppresses Anthocyanin Pigmentation in Tobacco Flowers. Plant Cell Rep. 2013, 32, 1925–1937. [Google Scholar] [CrossRef]
  45. Albert, N.W.; Davies, K.M.; Schwinn, K.E. Gene Regulation Networks Generate Diverse Pigmentation Patterns in Plants. Plant Signal. Behav. 2014, 9, e29526. [Google Scholar] [CrossRef] [PubMed]
  46. Li, T.; Wang, Y.; Dong, Q.; Wang, F.; Kong, F.; Liu, G.; Lei, Y.; Yang, H.; Zhou, Y.; Li, C. Weighted Gene Co-Expression Network Analysis Reveals Key Module and Hub Genes Associated with the Anthocyanin Biosynthesis in Maize Pericarp. Front. Plant Sci. 2022, 13, 1013412. [Google Scholar] [CrossRef]
  47. Piatkowski, B.T.; Imwattana, K.; Tripp, E.A.; Weston, D.J.; Healey, A.; Schmutz, J.; Shaw, A.J. Phylogenomics Reveals Convergent Evolution of Red-Violet Coloration in Land Plants and the Origins of the Anthocyanin Biosynthetic Pathway. Mol. Phylogenet. Evol. 2020, 151, 106904. [Google Scholar] [CrossRef] [PubMed]
  48. Clark, S.T.; Verwoerd, W.S. A Systems Approach to Identifying Correlated Gene Targets for the Loss of Colour Pigmentation in Plants. BMC Bioinf. 2011, 12, 343. [Google Scholar] [CrossRef]
  49. Sintupachee, S.; Ngamrojanavanich, N.; Sitthithaworn, W.; De-Eknamkul, W. Molecular Cloning, Bacterial Expression and Functional Characterisation of Cytochrome P450 Monooxygenase, CYP97C27, and NADPH-Cytochrome P450 Reductase, CPR I, from Croton stellatopilosus Ohba. Plant Sci. 2014, 229, 131–141. [Google Scholar] [CrossRef]
  50. Kaspera, R.; Naraharisetti, S.B.; Evangelista, E.A.; Marciante, K.D.; Psaty, B.M.; Totah, R.A. Drug Metabolism by CYP2C8.3 Is Determined by Substrate Dependent Interactions with Cytochrome P450 Reductase and Cytochrome B5. Biochem. Pharmacol. 2011, 82, 681–691. [Google Scholar] [CrossRef]
  51. Zanger, U.M.; Schwab, M. Cytochrome P450 Enzymes in Drug Metabolism: Regulation of Gene Expression, Enzyme Activities, and Impact of Genetic Variation. Pharmacol. Ther. 2013, 138, 103–141. [Google Scholar] [CrossRef]
  52. Wulandari, R.; Budiyanto, M.A.K.; Waluyo, L. The Influence of Various Concentration of Red Roses (Rosa damascena Mill) Flower Extract to Anthocyanin Color Stability Jelly as Biology Learning Source. JPBI J. Pendidik. Biol. Indones. 2016, 2, 48–56. [Google Scholar] [CrossRef]
  53. Yudiono, K. Effect of Maltodextrin Concentrations and Drying Temperature on the Physico-Chemical Characteristics and Color Measurements of Butterfly Pea Flowers (Clitoria ternatea L) Powder. Turk. J. Agric. Food Sci. Technol. 2024, 12, 657–665. [Google Scholar] [CrossRef]
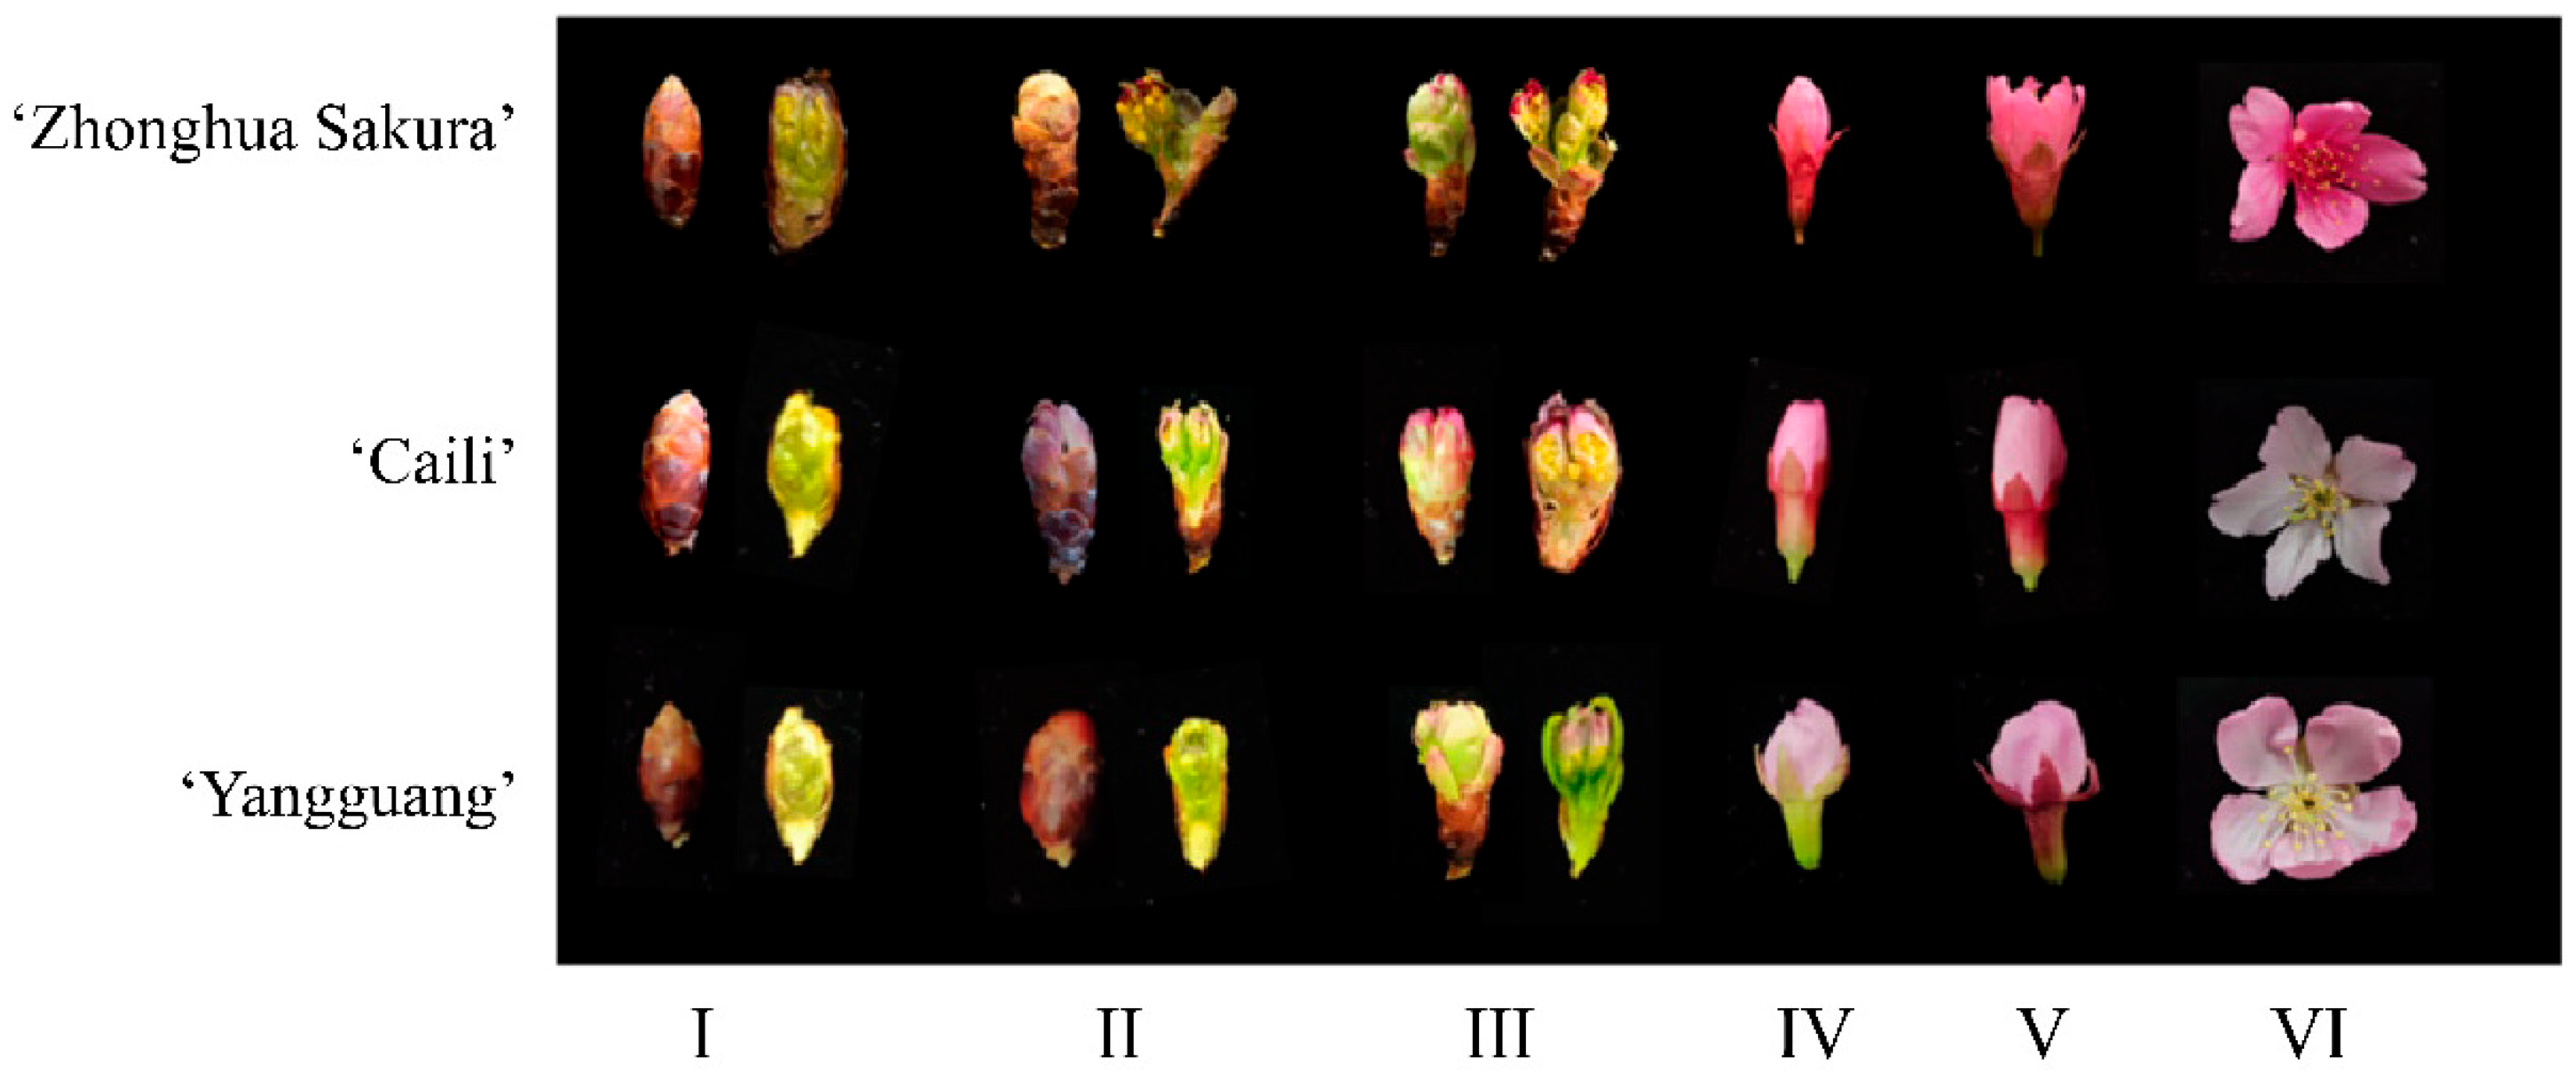
Figure 1. The pictures of the test materials from various periods.
Forests 16 01633 g001
Figure 2. (A): pH values of cherry blossom petals; (B): soluble sugar content of cherry blossom petals; (C): soluble protein content of cherry blossom petals; (D): flavonoid content of cherry blossom petals; (E): anthocyanidins content of cherry blossom petals; (F): proanthocyanins content of cherry blossom petals. Different capital letters represent different varieties in the same period with significant differences (p < 0.05), and different lowercase letters represent the same varieties in different periods with significant differences (p < 0.05).
Forests 16 01633 g002
Figure 3. Correlation of pigment content and physiological parameters with petal coloration. * represents correlation at the p < 0.05 level, ** represents correlation at the p < 0.01 level.
Forests 16 01633 g003
Figure 4. (A): effects of different temperatures on flavonoid extracts from cherry blossom petals; (B): effects of different light durations on flavonoid extracts from cherry blossom petals; (C): effects of different pH values on flavonoid extracts from cherry blossom petals; (D): effects of different metal ions on flavonoid extracts from cherry blossom petals. Different uppercase letters indicate significant differences (p < 0.05) among cultivars within the same environment, while different lowercase letters indicate significant differences (p < 0.05) across different environments for the same cultivar.
Forests 16 01633 g004
Figure 5. (A): QC sample mass spectrometry detection TIC overlay; (B): PCA score plot of mass spectrometry data for each sample and control sample of the overall sample; (C): classification of metabolites detected in P. campanulata petals; (D): the number of metabolites in each comparison group, the statistical thresholds used for identifying differential metabolites.
Forests 16 01633 g005
Figure 6. P. Companulata are enriched in KEGG, (A): ZHY1 vs. ZHY3 comparison; (B): ZHY1 vs. ZHY4 comparison; (C): ZHY1 vs. ZHY6 comparison; (D): ZHY3 vs. ZHY4 comparison; (E): ZHY3 vs. ZHY6 comparison; (F): ZHY4 vs. ZHY6 comparison.
Forests 16 01633 g006
Figure 7. Heatmap of peak value variations for 30 metabolites.
Forests 16 01633 g007
Figure 8. (A): The number of different expressed genes in each comparison period; (B): Venn diagram of differentially expressed genes.
Forests 16 01633 g008
Figure 9. P. campanulata substance–module relationship heat map.
Forests 16 01633 g009
Figure 10. (A): Module membership in three key modules, (B): three key modules screen out genes that affect flower color.
Forests 16 01633 g010
Table 1. Growth indicators of cherry blossom varieties in 6 periods.
CultivarsGrowth IndicatorTimes
IIIIIIIVVVI
‘Zhonghua Sakura’Flower length5.80 ± 0.76 Be8.37 ± 0.73 Bd12.22 ± 1.40 Bc14.48 ± 1.26 Bb17.07 ± 0.71 Ba12.67 ± 0.99 Bc
Flower width1.94 ± 0.31 Be2.84 ± 0.82 Bd5.75 ± 1.01 Bc5.76 ± 0.55 Bc7.94 ± 1.68 Bb8.78 ± 0.84 Ba
Flower Crown 21.99 ± 2.75 B
‘Caili’Flower length4.50 ± 0.45 Be6.63 ± 0.78 Bd8.16 ± 0.95 Bc11.21 ± 1.09 Bb17.21 ± 1.31 Ba11.51 ± 1.11 Bb
Flower width1.87 ± 0.33 Be2.36 ± 0.47 Bd3.52 ± 0.42 Bc3.91 ± 0.65 Bc6.02 ± 0.76 Bb7.45 ± 1.81 Ba
Flower Crown 21.19 ± 4.40 B
‘Yangguang’Flower length7.88 ± 0.66 Be9.77 ± 0.62 Bd16.23 ± 1.71 Bc16.41 ± 1.67 Bc21.26 ± 1.70 Ba19.01 ± 1.00 Bb
Flower width3.28 ± 0.34 Be4.33 ± 0.34 Bd6.33 ± 0.79 Bc6.56 ± 0.83 Bc9.17 ± 2.33 Bb16.87 ± 1.43 Ba
Flower Crown 40.91 ± 2.34 A
Note: Different capital letters represent different varieties in the same period with significant differences (p < 0.05), and different lowercase letters represent the same varieties in different periods with significant differences (p < 0.05).
Table 2. Correlation analysis of various indexes in the process of cherry blossom petal growing.
LightnessRednessBluenesspHSoluble SugarSoluble ProteinTotal FlavonoidsProanthocyanidinsAnthocyaninsChlorophyllCarotenoids
Lightness1
Redness−0.976 **1
Blueness0.692 **−0.672 **1
pH0.489 *−0.477 *0.4081
Soluble Sugar0.481 *−0.550 *0.039−0.0111
Soluble protein−0.0480.1140.123−0.170−0.808 **1
Total flavonoids0.162−0.177−0.0190.119−0.798 **0.529 *1
Proanthocyanidins−0.484 *0.446−0.833 **−0.2320.105−0.1570.2181
Anthocyanins−0.636 **0.612 **−0.865 **−0.4160.062−0.1080.1340.877 **1
Chlorophyll−0.4180.421−0.424−0.092−0.2670.0070.3980.4000.480 *1
Carotenoids−0.640 **0.604 **−0.658 **−0.3100.198−0.223−0.0560.4380.653 **0.3991
Note: * represents correlation at the p < 0.05 level, ** represents correlation at the p < 0.01 level.
Disclaimer/Publisher’s Note: The statements, opinions and data contained in all publications are solely those of the individual author(s) and contributor(s) and not of MDPI and/or the editor(s). MDPI and/or the editor(s) disclaim responsibility for any injury to people or property resulting from any ideas, methods, instructions or products referred to in the content.