Article

Trade-Offs and Synergies of Ecosystem Services and Their Driving Factors on the Northern and Southern Slopes of the Nanling Mountains

School of Geography and Environmental Engineering, Gannan Normal University, Ganzhou 341000, China
*
Author to whom correspondence should be addressed.
Forests 2025, 16(11), 1634; https://doi.org/10.3390/f16111634 (registering DOI)
Submission received: 21 September 2025 / Revised: 19 October 2025 / Accepted: 23 October 2025 / Published: 26 October 2025
(This article belongs to the Special Issue Forest Ecosystem Services and Sustainable Management)

Abstract

The Nanling Mountains are an important ecological barrier in China, where important ecosystem services (ESs) such as habitat quality (HQ), carbon storage (CS), soil conservation (SC), and water yield (WY) are impacted by notable topographic and temperature differences between the northern and southern sides. Spearman correlation analysis was employed to identify the correlations between these services, and the driving mechanisms were elucidated through the utilization of regression models and geographic detectors. The findings indicate the following: (1) ESs demonstrated a general upward trend, with the southern slope exhibiting more pronounced increases compared to the northern slope. The mean WY of the southern slope has been shown to exceed that of the northern slope by 17.2%, while in 2020, there was a 35.2% increase in the southern slope compared with its 1990 value. (2) The majority of ESs exhibit synergistic relationships. For instance, the HQ and the CS are associated with stable synergies, as are the HQ and CS in conjunction with SC. Trade-offs primarily occur between HQ and WY services, whereas the interaction between SC and WY services shifts from one of trade-off to synergy. (3) The driving forces behind the northern and southern slopes are found to be significantly different. The former is found to be controlled by GDP and temperature, whilst the latter is influenced by a combination of GDP, temperature, and slope gradient. The impact of human activity exhibits spatial variability.

1. Introduction

The environmental circumstances and advantages that ecosystems offer for human survival and advancement are referred to as ESs. They include all of the advantages that ecosystems provide to humans, either directly or indirectly, in order to meet their needs [1,2]. ESs have been a hotspot for interdisciplinary study in recent years, progressively moving from theory to practice. The spatiotemporal dynamics and trade-off/synergy interactions between various ESs and bundles of ESs are the main topics of current scholarly study on ESs. The interaction of ESs is characterized by a range of trade-offs or synergistic relationships, which vary in their degree of interaction. Researchers use statistical analysis and spatial assessment techniques to find supply–supply relationships (like the synergies between soil conservation and carbon sequestration) and demand–demand relationships (like the trade-offs between ecological conservation and resource extraction) (Bennett et al., 2009; Mouchet et al., 2014) [3,4]. They also uncover the factors that influence these relationships, such as land use, climate, topography, and other factors (Jiang et al., 2023) [5]. The sensitivity features of ESs have been the focus of mountain ecology research. On the one hand, this research has looked at how climate and slope, two natural drivers, control the provision of mountain ESs (e.g., the effect of slope on soil retention capacity); on the other hand, it has looked at management strategies based on spatial heterogeneity (e.g., zoned governance according to ES supply-demand patterns) to support mountain ES conservation. However, most of the studies that have been performed so far have focused on macro-level mountain features, paying little attention to areas like the Nanling Mountains that have notable north–south slope variations in terms of heat and water conditions.
The Nanling Mountains constitute one of the watershed boundaries that delineate the geographical boundaries between the Yangtze River system and the Pearl River system, which also act as an ecological transition zone. The range has a very noticeable hydrothermal gradient and unique ecosystem patterns because of the huge elevation difference between its northern and southern slopes as well as the interaction with the monsoon system. In addition to being a natural laboratory for researching the spatial heterogeneity of ESs, the ecological gradient differentiation caused by slope orientation is also essential for preserving regional ecological security, as the Nanling Mountains are the headwaters of the Ganjiang River system within the Yangtze River basin, as well as a critical water source and conservation area for the Pearl and Dongjiang rivers. Water quality and quantity security in the middle and lower reaches are directly impacted by its plant cover and soil retention ability. The Nanling Mountains, one of China’s hotspots for biodiversity, also protect a large number of rare and relict plant species, where connection and HQ are essential to the survival of the species. The Nanling Mountains have a high forest coverage rate, with approximately 75% on the southern slope and 68% on the northern slope, and harbor over 2000 endemic vascular plant species and 300 rare animal species—these forest ecosystems not only serve as critical carbon sinks but also maintain regional hydrological balance and biodiversity conservation. In order to methodically uncover the trade-offs and synergies in ESs as well as their underlying driving processes, this study creatively selects north and south slopes as fundamental units, breaking through the conventional framework of global-scale analysis. This change in viewpoint has important applications: knowing which service types are most prevalent and how north- and south-facing slopes differ in terms of vulnerability offers clear direction for putting slope-specific ecological restoration plans into action.
Existing research on ecosystem service trade-offs and synergies primarily examines ES connections within narrow landscape units (e.g., small watersheds, single slope aspects) or entire regions [6]. The amount of research evaluating mountain ESs like biodiversity, soil protection, carbon sequestration, and water production using the InVEST model is steadily rising. Finding trade-offs and synergies across ESs has also advanced in tandem with the model [7]. The availability and interrelationships of ESs may be significantly impacted by topographic factors, which are important in forming local habitats and have been shown to have a decisive impact on light, temperature, moisture distribution, and vegetation production [8,9,10]. However, present studies still lack precise spatial differentiation, even though they have made progress in evaluating ESs at global or single-slope-aspect scales. In particular, when resolving considerable slope-aspect gradients in vast mountain ranges, like north–south slopes, there is still a dearth of systematic and comprehensive quantitative investigations addressing the specific differentiation patterns of trade-offs/synergies among ESs. It is challenging to capture the geographical heterogeneity of ES interactions caused by changes in topography, vegetation types, and water and heat availability because the majority of research has not adopted slope aspect as the primary analytical unit [11,12]. At regional sizes and along altitudinal gradients, trade-offs and synergies among ESs have been partially identified [13]. However, little is known about how hydrotemperatural variables that are categorized by slope aspect systematically affect ES interactions throughout broad mountain ranges. Conceptual frameworks and assessment techniques for mountain forest ESs are carefully summarized in reviews to date, such as Glushkova et al. (2020) [14]. However, these studies mostly ignore how aspect causes microenvironmental variations by controlling light and precipitation, instead concentrating on variables like elevation and topographic slope. This macro-level viewpoint draws attention to the fact that mountain ES research frequently ignores this aspect. While a few studies have examined how slope aspect affects ESs, such as Li and Cai’s (2022) identification of slight trade-offs between certain ESs on southern slopes of Jieshi Mountain, such research frequently stays descriptive [15] and neither explores the underlying hydrotemperature-driven processes, nor rigorously analyzes the overall differences between northern and southern slope ESs. The ecological impacts of slope aspect are therefore limited to isolated observational levels. Furthermore, current research either treats mountain ranges as homogenous entities, ignoring internal variability induced by slope aspect, or only uses limited observations, as in the case of the Himalayas [16]. A comprehensive mechanism chain connecting slope aspect, hydrotemperature, and the ESs is not established by others, who often only study the impacts of elevation from the perspective of vertical zones. Slope orientation-based differential ecological management techniques are hampered by this information gap. As a result, this study suggests doing away with the conventional regional or altitudinal zonation and using the “slope orientation system” as the basic analytical unit. The utilization of the Nanling Mountains as a case study facilitates the establishment of a scientific foundation for slope-specific management. This foundation is achieved through a systematic comparison of the ecosystem service trade-offs and synergies between the northern and southern slopes. The following important scientific questions are put forth in this study to fill up the previously noted research gaps: Given the sharp topographic-climatic differences between the northern and southern slopes of the Nanling Mountains, how does the slope gradient affect the long-term dynamic evolution of trade-offs and synergies among key ESs (such as water production, carbon sequestration, SC, and biodiversity maintenance) through hydrotemperature redistribution and changes in human activity patterns? How do the primary motivators interact with one another?
This study suggests the following strategy to answer the above-mentioned scientific questions: The Nanling Mountains have been chosen as the study location, and the time frame is 1990–2020. The study chooses SC, CS, HQ, and water production services as typical ecosystem service indicators using multi-source spatiotemporal data and the InVEST model. The north and south slopes, which are objectively defined by the yearly average temperature isotherm of 20 °C, are the main units of analysis. It investigates the geographical features and dynamic evolution patterns of trade-offs and synergies among important ecosystem service pairs at the slope scale using quantitative computations with the InVEST model. Regionally weighted regression, geographic detector models, and Spearman’s rank correlation are combined to: (1) Identify and quantify the dominant natural (e.g., temperature, slope gradient) and human (e.g., GDP) factors that influence the spatial differentiation of ESs between northern and southern slopes, and thoroughly analyze their independent effects and interaction mechanisms. (2) Describe the spatial characteristics and spatiotemporal evolution patterns of trade-off/synergy relationships between major ES pairs (e.g., SC-WY, CS-HQ) at the north–south slope scale.
This study intends to elucidate the transformational aspects and underlying processes of the linkages between ESs in the Nanling Mountains across the region’s varied slope orientations by investigating these interactions from a range of perspectives and analytical approaches with the aim of improving knowledge of the precise spatial differentiation in mountain ES feedback mechanisms, thus closing the knowledge gap in systematic quantitative research on trade-offs and synergies between ecological services (ESs) on the northern and southern slopes of typical large mountain ranges (such as the Nanling Mountains). In this way, we expand knowledge of the factors that influence ES relationships under slope gradient settings, especially factor interactions, in order to establish an empirical basis for building more comprehensible models of mountain ES relationships. In order to inform future ecological construction and management in this area, we seek to establish a scientific foundation for developing slope-adaptive ecological conservation, restoration, and sustainable management strategies that are suited to the natural endowments and variations in human activity between the northern and southern slopes of the Nanling Mountains.

2. Materials and Methods

2.1. Study Area and Data

2.1.1. Overview of the Study Area

The Nanling Mountains are located in the ecological transition zone between 24° N and 27° N latitude of China and cover four provinces: Guangdong, Guangxi, Jiangxi, and Hunan. They form a continuous band along the geographical axis of South China. The Dupang Ridge, Yuecheng Ridge, and Mengzhu Ridge are the three primary core mountain clusters that make up the main mountain range, which is shaped like an arc and faces northeast-southwest. Warm, humid air currents from the Pacific Ocean dominate the hot, rainy summers, which are a hallmark of the subtropical mountainous monsoon climate. Significant climate heterogeneity between the northern and southern slopes occurs during the winter months due to the blocking impact of continental cold air [17].
In accordance with the traditional mountain ecological zoning scheme and the suggested thermal criteria for China’s subtropical zone in Ren Meizhuo’s “Outline of China’s Physical Geography,” this study produced an annual mean temperature isotherm of 20 °C using temperature data from 1990 to 2020. The boundary between the northern and southern slopes can be objectively defined using this isotherm [18] (Figure 1b). This classification indicates that 48.20% of the research area, which includes 24 county-level administrative regions and represents a typical subtropical ecosystem, is made up of the southern slopes with an annual average temperature of ≥20 °C. 51.80% of the land is made up of the northern slopes, which comprise a warm temperate-subtropical transition zone and span 27 county-level administrative regions with an annual average temperature of less than 20 °C. The topographic and ecological gradient features of the northern and southern slopes of the Nanling Mountains are clearly defined by the results of this partitioning scheme, which adheres to the accepted methodology used in studies of large mountain ranges like the Qinling and Hengduan Mountains [19,20]. The average annual temperature on the northern slope is below 16.5 °C, indicating a substantial influence of cold air. Summertime sees the most precipitation, resulting in an annual rainfall of roughly 1200–1500 mm. Steep slopes and an evergreen-deciduous mixed woodland habitat are fostered by this setting. The average yearly temperature on the southern slope is between 18.5 and 21.0 °C, thanks to warm, humid air currents. With more than 1800 mm of precipitation per year, it is plentiful and fairly equally spread throughout the seasons. A monsoon evergreen broadleaf forest ecosystem, with gently sloping hills as its base, has been cultivated as a result.

2.1.2. Data Sources

Multi-source spatial datasets were merged in this work (for further information, see Table 1), and ArcGIS 10.8 was used for all data processing. Spatial data (e.g., DEM, land use, slope) were processed and visualized using ArcGIS 10.8 (Esri, Redlands, CA, USA; https://www.esri.com/zh-cn/arcgis/products/arcgis-desktop/overview accessed on 10 May 2025). To achieve spatial scope uniformity, the raw data was processed via mask clipping, adhering to the research area borders specified in the National Soil and Water Conservation Zoning Guidelines. To remove geometric distortions brought on by projection differences, the coordinate system was then converted to WGS_1984_Albers using a projection transformation tool. A monthly average temperature raster series covering 1990–2020 was used for meteorological data. Missing values were spatially interpolated using Kriging after the raw NETCDF format data was retrieved and stitched together. Lastly, the Raster Calculator was used to create data on the average annual temperature. SRTM elevation data with a 30 m precision is the source of DEM data. Bilinear interpolation was used to resample the data to a uniform resolution after fill-in processing was used to remove terrain irregularities. After that, a slope raster was created using a slope analysis tool. The Chinese Academy of Sciences Resource and Environment Science Data Center is the source of LUCC data. Reclassification and projection processing were performed on the initial 30 m resolution land use data. In order to preserve category consistency and guarantee spatial alignment with other datasets, a mode sampling technique was used. A 100 m resolution absolute soil depth raster—which shows the depth from the ground surface to the bedrock interface—is used for soil depth data. River network datasets obtained from DEM-based catchment areas were used to define hydrological boundaries. For four sample years, 1990, 2000, 2010, and 2020, socioeconomic data (people density, GDP, and nighttime light intensity) were chosen at a resolution of 1 km. The Albers projection was used to spatially register all raster data after they were evenly resampled to 1000 m of resolution.

2.2. Methods of Research

A popular and useful assessment technique in contemporary domestic and international ESs research is the InVEST model. ESs may be quickly and easily quantified with this methodology. The primary rationales for the selection of the InVEST runoff module over alternative hydrological models (e.g., SWAT) in this study are its computational effectiveness and more accommodating data requirements at broad regional scales, such as the Nanling Mountains. It also enables the display of functional regions for ecological services. Four INVEST model modules—water production services, carbon stocks, habitat quality, and soil conservation—are used in the study. Ecosystem service quantification was conducted via the InVEST 3.12.0 model (Natural Capital Project, Stanford University; https://naturalcapitalproject.stanford.edu/software/invest accessed on 10 May 2025).

2.2.1. Services for WY

A quantitative evaluation of the WY service in the study region was carried out using the WY module of the InVEST model, which is based on Budyko’s hydrothermal coupling equilibrium theory (Budyko, 1974) [21]. With the exception of evapotranspiration losses, this model assumes that all precipitation converges at the watershed outflow. Its main benefit is that it can adapt to the different hydrological features of slopes that face north and south. The INVEST model was used for the calculations, which included information on root depth, evapotranspiration, and precipitation [22]. These formulas are shown in Equations (1)–(4), respectively:
Y   =   1 A E T P x P x
A E T P X = 1 + P E T P x 1 + P E T P X W 1 / W
P E T P x = K × E T P X
W = Z A W C P X + 1.25
The water production service (mm) for the area is denoted by Y in the equation; P x represents the research area’s yearly precipitation (mm); A E T represents the research area’s actual evapotranspiration (mm); P E T shows the region’s potential evaporation (mm), which is impacted by topographical and meteorological conditions; K is the evapotranspiration coefficient, which was derived from pertinent literature [23,24]; W is an empirical parameter that represents soil qualities; Z stands for seasonal precipitation characteristics, adjusted based on regional total water resources, set here at 0.535; E T stands for evapotranspiration under fully saturated soil conditions with ground cover by specific short vegetation; and A W C stands for the available water content for plants, influenced by soil depth and properties, computed using the formula suggested by Zhou [25].

2.2.2. SC

A key measure of soil and water conservation functionality, soil retention capacity describes an ecosystem’s capacity to lessen soil erosion through plant cover and topographic effects. By measuring the difference between potential erosion (the scenario without vegetation) and actual erosion, this study uses the InVEST sediment transport ratio module, which is based on the Revised Universal Soil Loss Equation (RUSLE) [26]. The model takes into account topography features, vegetation cover, soil erodibility, rainfall erosion intensity, and water and SC strategies. This formula is shown in Equation (5):
S C = R K L S R K L S C P
R stands for rainfall erosion factor [27], K for soil erodibility factor, L S for topography factor, C for vegetation cover management factor, P for soil and water conservation measures factor, and S C for soil conservation amount in the equation [28].

2.2.3. HQ

The potential ability of particular habitat types to support species survival and reproduction is reflected in HQ, a crucial indicator that characterizes an ecosystem’s capacity to sustain biodiversity [29]. This inquiry evaluates the HQ module of the InVEST model. Its fundamental idea is to calculate the HQ index by measuring habitat deterioration based on land-use-derived habitat appropriateness, along with the spatial intensity, decay distance, and sensitivity of external threat variables (such as farmland and construction land) [30]. Stronger capacity to maintain biodiversity is indicated by higher HQ. This formula is shown in Equation (6):
Q i j = H j [ 1 ( D i j z D i j z + k z ) ]
The grid cell’s HQ index is represented by Q i j , its habitat suitability for land use type j is indicated by H j , and the cumulative stress level experienced by the grid cell is indicated by D i j , which is determined by the intensity of threat factors (cultivated land, construction land), distance decay functions, and habitat sensitivity; the half-saturation constant is represented by k , and the normalization constant is represented by z .

2.2.4. Determining Trade-Offs/Synergies in ESs

First, ecosystem service provisioning was quantitatively evaluated using the InVEST model. Global correlations between services were then examined using Spearman’s rank correlation coefficient [31]. Because the ecosystem service data in this study might not exactly meet the premise of normal distribution, Spearman’s rank correlation was chosen over Pearson’s correlation. Based on data rankings, the Spearman technique can more reliably capture monotonic (but not necessarily linear) correlations among ESs and is less susceptible to outliers. The software-generated p-value was used to make the final decision after each computed Spearman correlation coefficient was subjected to significance testing. The null hypothesis is rejected if the requirement p < 0.05 is met, suggesting that there is a statistically significant monotonic connection between the two services on a worldwide scale. This formula is shown in Equation (7):
Y i = β 0 u i , v i + i = 1 k β k u i , v i X i k + ε i
where β 0 u i , v i is the constant term at the geographic coordinate location u i , v i ; u i , v i is the value of the continuous function at the i -th grid point; ε i is the random error term; Y i and X i k indicate the observed values of the i -th dependent variable Y and independent variable dataset X i k at the spatial location; k is the total number of independent variables.

2.2.5. Driving Factor Screening and Evaluation

The following procedures were used in this study to determine the main driving elements and measure their explanatory power: First, multicollinearity among the 12 initial drivers was examined using Spearman’s rank correlation coefficient (two-tailed test significance threshold p < 0.05). Factor groups were considered highly collinear if |ρ| > 0.7. The representative factor for each set of highly collinear factors was the one with the highest absolute correlation value with the intended ecosystem service. Eight key motivators were found as a result of this procedure [32,33,34]. In order to measure the explanatory power (q-value) of each factor for spatial differentiation in particular ecosystem service relationships (such as the synergistic relationship between CS and water production services), the Geodetector model was then used, with continuous factors discretized using Jenks’ natural break method. Additionally, when any two drivers interacted, the interaction detector in the geographic detector evaluated the q value that explained the spatial differentiation of service links and compared it to the q value from single-driver effects. In addition to revealing patterns of divergence between the primary drivers on the northern and southern slopes, this indicated interaction types (such as two-factor enhancement and nonlinear enhancement) [35]. The Geodetector was used to analyze the driving mechanisms. Geographic detectors concentrate more on identifying sources of spatial difference than techniques like geographically weighted regression (GWR), which prioritize predictive modeling. These formulas are shown in Equations (8)–(10), respectively:
q = 1 h = 1 1 N h σ h 2 N σ 2 = 1 S S W S S T
S S W = h 1 N h σ h 2
S S T = N σ 2
where N h and N are the number of units at level h and the total number of units across the entire domain, respectively; σ h 2 is the variance of ecosystem service relationship strength Y within level h , and σ 2 is the variance of Y across the entire domain. The q value in the equation indicates the explanatory power of driving factors for the spatial differentiation of trade-offs/synergies in ESs (range [0, 1]); h is the number of hierarchical levels following factor discretization (divided into 5 categories based on land use types). Furthermore, S S T = N σ 2 is the global variance and S S W = h 1 N h σ h 2 is the intra-layer variance.

3. Results

3.1. Spatial-Temporal Features of ESs

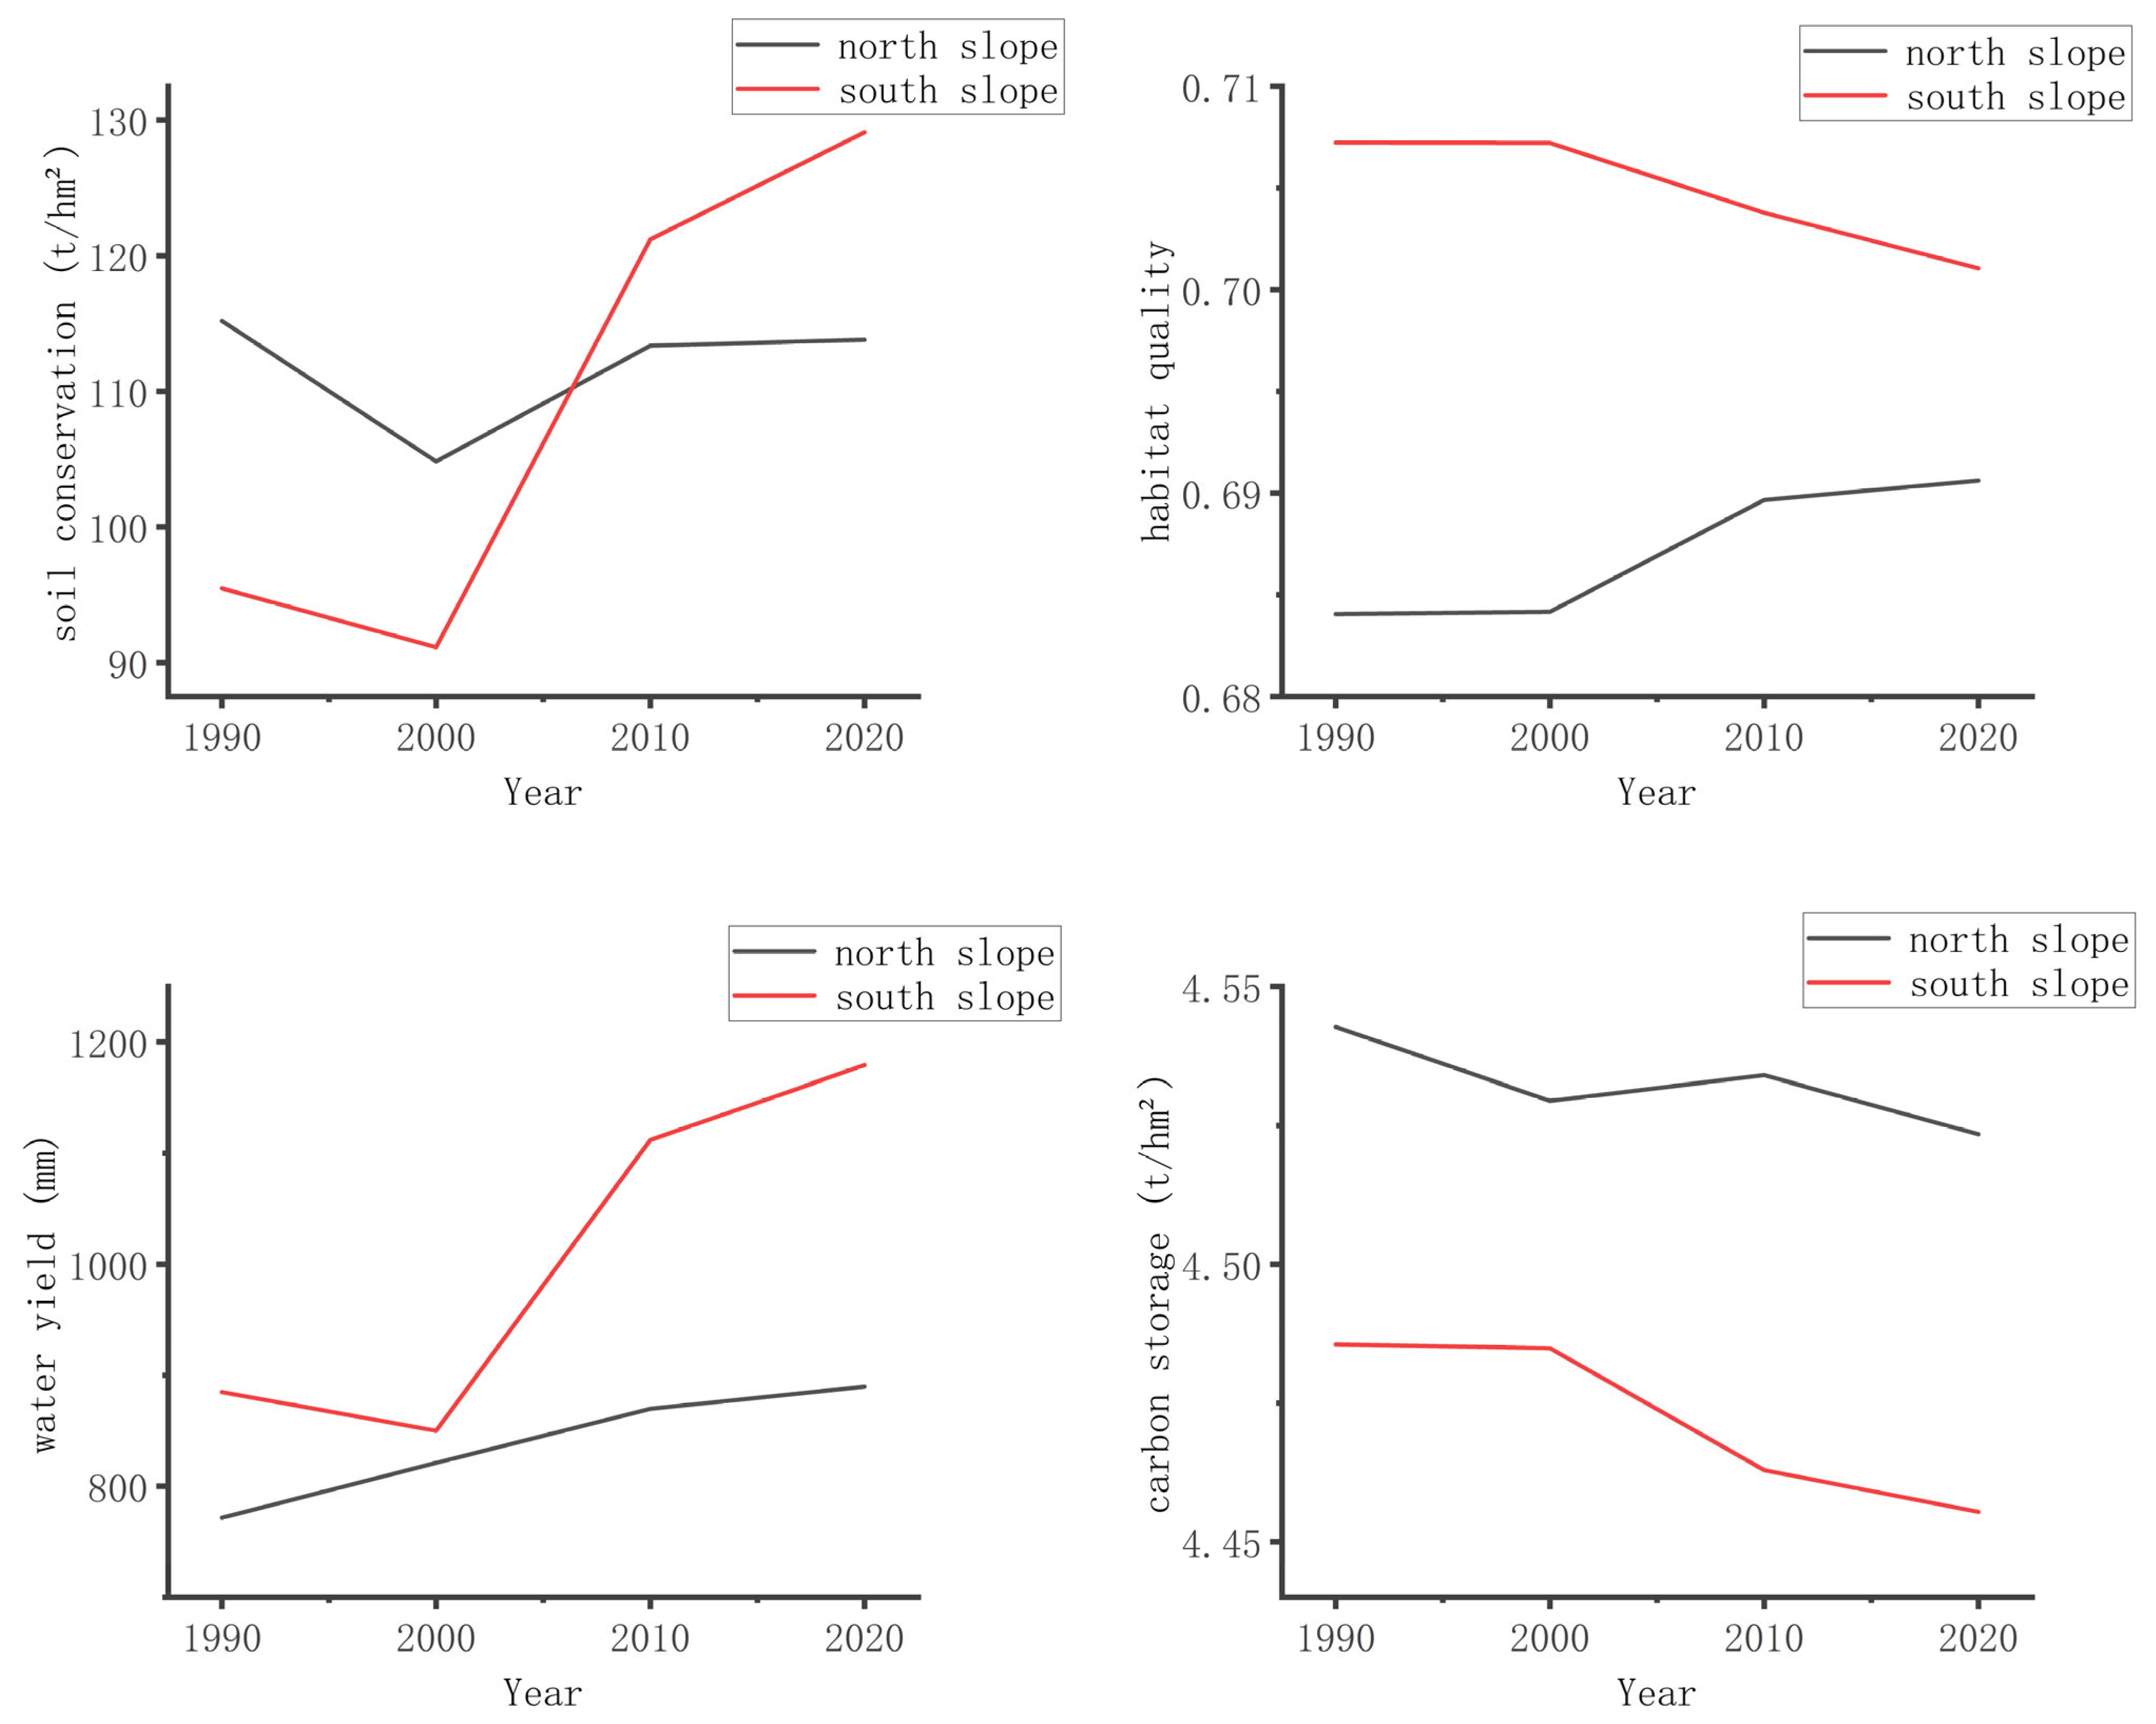
From 1990 to 2020, ESs in the Nanling region showed an overall upward trend, with extremely significant differences between the northern and southern slopes (p < 0.001). Two-way analysis of variance revealed that slope aspect exerted an extremely significant main effect on all four services (p < 0.001), with the greatest impact observed on WY (F = 6.24 × 10⁴). The north–south slope differentiation pattern changes dynamically throughout time, as seen in Figure 2. WY showed a consistent upward trend, with the southern slope seeing more noticeable increases. This trend peaked in 2010 (southern slope: 1112.14 mm; northern slope: 869.77 mm). The southern slope’s multi-year average WY output was 982 ± 135 mm, much greater than the northern slope’s 838 ± 45 mm, indicating a 17.2% relative increase. Despite a downward trend in the dominance of the southern slope, habitat quality was mostly constant: The habitat quality of the southern slope was 0.0232 greater in 1990 (0.7072) than that of the northern slope (0.6840). This difference decreased to 0.0104 by 2020 (northern slope 0.6906, southern slope 0.7010). Carbon storage decreased overall and fluctuated little, with no discernible gain. The southern slope dropped slightly from 4.49 t·hm−2 to 4.46 t·hm−2, whereas the northern slope dropped slightly from 4.54 t·hm−2 in 1990 to 4.52 t·hm−2 in 2020. Because of the geographic uniformity of regional carbon sink functions, the average difference between the slopes stayed below 1%. There were notable variations in soil retention capacity depending on slope and orientation. While there was no discernible overall rise on the northern slope between 1990 and 2020, the 2020 value on the southern slope rose by about 35.2%.
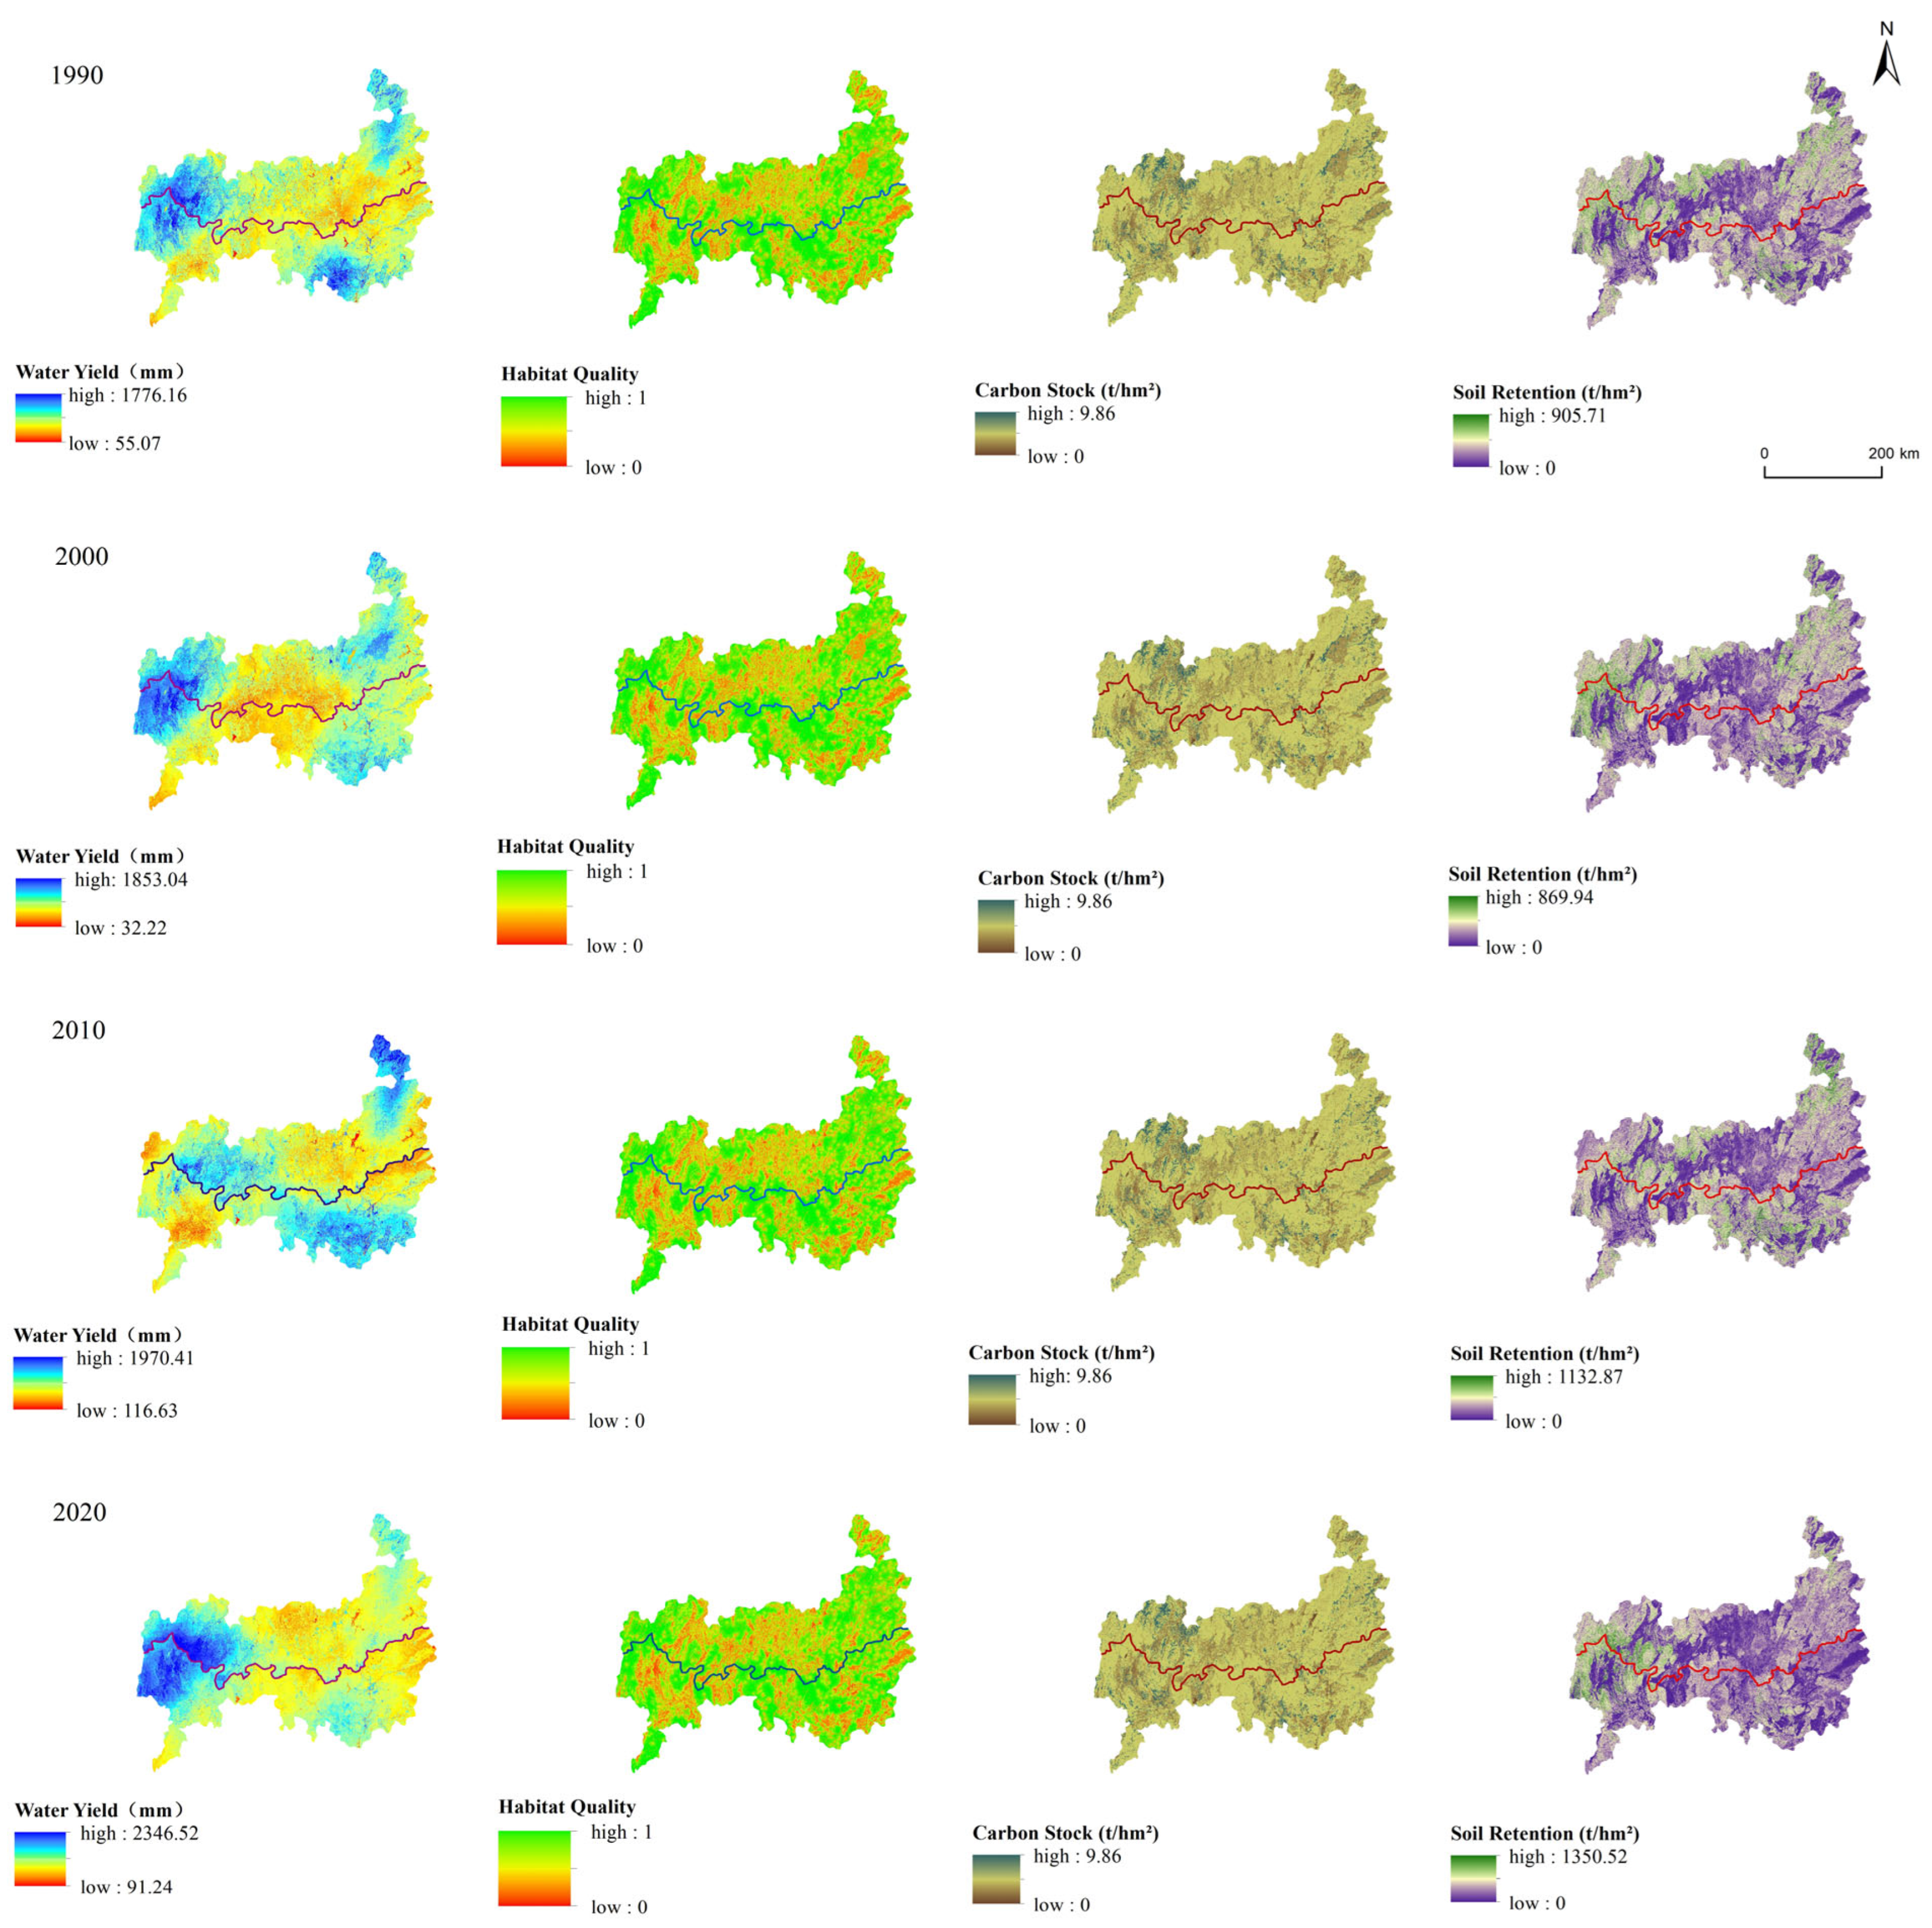
The regional heterogeneity of each service is noticeable and shows dynamic changes over time in terms of spatial distribution (Figure 3). There is a noticeable tendency of growth in the high-value zones for WY, especially as high-value areas continue to expand. There are consistent contrasts between the ecosystems on the northern and southern slopes: Although it retains relatively modest levels of soil retention, the northern slope is the central region for WY. In comparison to the northern slope, the southern slope has larger carbon stocks and the highest intensity of soil retention in the entire region. With the most noticeable spatial heterogeneity seen in water production services and SC, the sharp gradient shifts on the northern and southern slopes demonstrate the strong control of slope aspect over water-soil-carbon services. While high-value zones for water production services are steadily dispersed over the steep mountainous terrain on the northern slopes, high-value zones for SC services continue to cluster in the gently sloping hilly areas on the southern slopes.
On both the northern and southern slopes, ecosystem service capacity showed absolutely superior expansion between 2010 and 2020. While the hotspots for increased water production services are concentrated along the ridges of the northern slope, the core area of SC growth completely overlaps with its high-value zone, encompassing the majority of the southern slope. The low-elevation plains in the central and eastern regions, which are hardest hit by the growth of construction land and extensive farmland reclamation within the study area, are primarily home to service degradation zones. The expansion patterns of ESs, which are strongly correlated with topography and human activity, show notable variations across different slope orientations.
Using independent samples t-tests and two-way analysis of variance, a comprehensive evaluation of the statistical importance of slope aspect on ESs in the Nanling Mountains was carried out based on time-series data from 1990 to 2020. The findings show that all four services were strongly impacted by the slope-oriented main effect (p < 0.001), with the most sensitive reaction being shown by the water production services (F = 6.24 × 10⁴). The primary effect of time showed no significant temporal trends in HQ, marginally significant changes in CS (p = 0.007), and significantly significant interannual oscillations in soil retention and WY services (p < 0.001). WY, soil retention, and HQ were all significantly impacted by the interaction between slope aspect and time (p < 0.001), suggesting that north- and south-facing slopes respond to environmental changes differently.
The considerable difference in service between the north and south slopes was further confirmed by the t-test (p < 0.001). Soil retention rates saw a notable reversal, moving from higher retention on northern slopes to southern slopes surpassing northern slopes; HQ disparities increased by 92%; and the slope gradient differential in WY services grew from 113 mm (1990) to 290 mm (2020). Interannual fluctuations are negligible, despite the fact that carbon stocks continue to follow a trend of greater levels in the north and lower levels in the south. According to the statistical findings, slope aspect has a crucial role in controlling the dynamic evolution and regional differentiation of ESs.

3.2. Trade-Offs and Partnerships in ESs

This study examined the links between four ESs at the north and south slope scales: HQ, CS, SC, and WY using time-series data from 1990 to 2020. The majority of important service partnerships show good temporal stability overall. Both HQ and CS and HQ and SC exhibit strong and consistent positive correlations (i.e., synergistic relationships), as seen in Figure 4. The strongest synergy is shown by HQ-SC, with correlation values ranging from 0.49 to 0.52 and 0.51 to 0.56, respectively. Both the HQ and WY and CS and WY associations fell short of statistical significance (p > 0.05). With HQ-WY showing the highest negative connection (down to −0.31), the correlation coefficients varied from −0.23 to −0.12 and −0.31 to −0.16, respectively. During the study period, there was a notable change in the relationship between SC and WY, going from a negative correlation (trade-off) to a positive correlation (synergy). Other important service pairs (such as CS-SC) showed more steady connection features (significant positive correlation or non-significant) during the course of the investigation. Interestingly, on the southern slope, the intensity of the positive association between CS and SC was consistently higher than that on the northern slope.
ESs trade-offs and synergies vary significantly across space and follow unique spatiotemporal evolution patterns, as seen in Figure 5a–d. Between 1990 and 2020, the percentage of trade-off regions for HQ-WY and SC-WY was much higher than that of synergistic areas. On the other hand, compared to trade-off areas, the percentage of synergistic regions for HQ-SC, CS-SC, and CS-HQ was significantly higher. In particular, the trade-off intensity on the southern slope of the SC-WY relationship continuously outperformed that on the northern slope between 1990 and 2010. Afterwards, its spatial arrangement was altered. By 2020, the percentage of synergistic areas had risen, and the intensity of the trade-off between the northern and southern slopes had converged. In 1990 and 2000, the whole research region showed low trade-off intensity; by 2010, however, this changed to a spatial pattern with high trade-off intensity on the southern slope and low trade-off intensity on the northern slope. This was a clear progression of the HQ-WY connection. By 2020, both slopes’ trade-off intensity levels were similar. Between 1990 and 2010, the CS-WY connection showed low-intensity trade-offs on the northern slope; by 2020, the trade-off intensity increased in tandem with an increase in the percentage of synergistic areas. The coexistence pattern on the southern slope is now defined by medium-intensity trade-offs rather than low-intensity trade-offs. While the northern slope showed consistent low-intensity coordination across the course of the study, the southern slope’s HQ-SC interactions were mostly moderate-intensity coordinated in 1990 before switching to low-intensity coordination. Over the course of the investigation, there were no notable trend-based changes in the geographical patterns or the strength of the relationships between CS-SC and CS-HQ.
During the research period, at the county level, synergistic relationships between CS-HQ, CS-SC, and HQ-SC were predominant on both the southern and northern slopes (Figure 5e,f). There are mainly trade-off linkages between SC-WY and HQ-WY. The HQ-SC strong synergy zones are concentrated on the eastern and western sides of the southern slope (e.g., Dayu County, Nanxiong County, Qujiang County, Shaoguan City, Pingle County, and Lipu County) and in the center of the northern slope (e.g., Guiyang County, Ningyuan County, Xintian County, Chenzhou City, Jiahe County, and Yizhang County). According to more research, HQ-SC and CS-HQ have strong synergistic regions that are dispersed throughout the northern slopes (Guiyang County, Xintian County, and Jiahe County) and the southern slopes (Nanxiong County, Pingle County, and Wengyuan County). This implies that the provision of ESs that cooperate depends on these areas.
Regarding relationship weighting, the southern slope’s strong weighting zone, which is mostly found along the eastern and western sides, shows intense spatial clustering for both HQ-WY and SC-WY. On the other hand, there is no discernible spatial grouping on the northern slope. There are trade-offs and synergies in the relationship pattern between CS-WY on both the northern and southern slopes: Strong synergy zones are mostly found along the eastern and western flanks (e.g., Ziyuan County, Shangyou County, Longsheng County, Yongfu County, Ruyuan Yao Autonomous County, Fuchuan Yao Autonomous County, and Jinxiu Yao Autonomous County), whereas strong trade-off zones are mostly found in the central areas of the northern and southern slopes (e.g., Xintian County, Chenzhou City, Jiahe County, Yizhang County, and Lanshan County).

3.3. Analysis of Drivers of Trade-Offs/Synergies in ESs

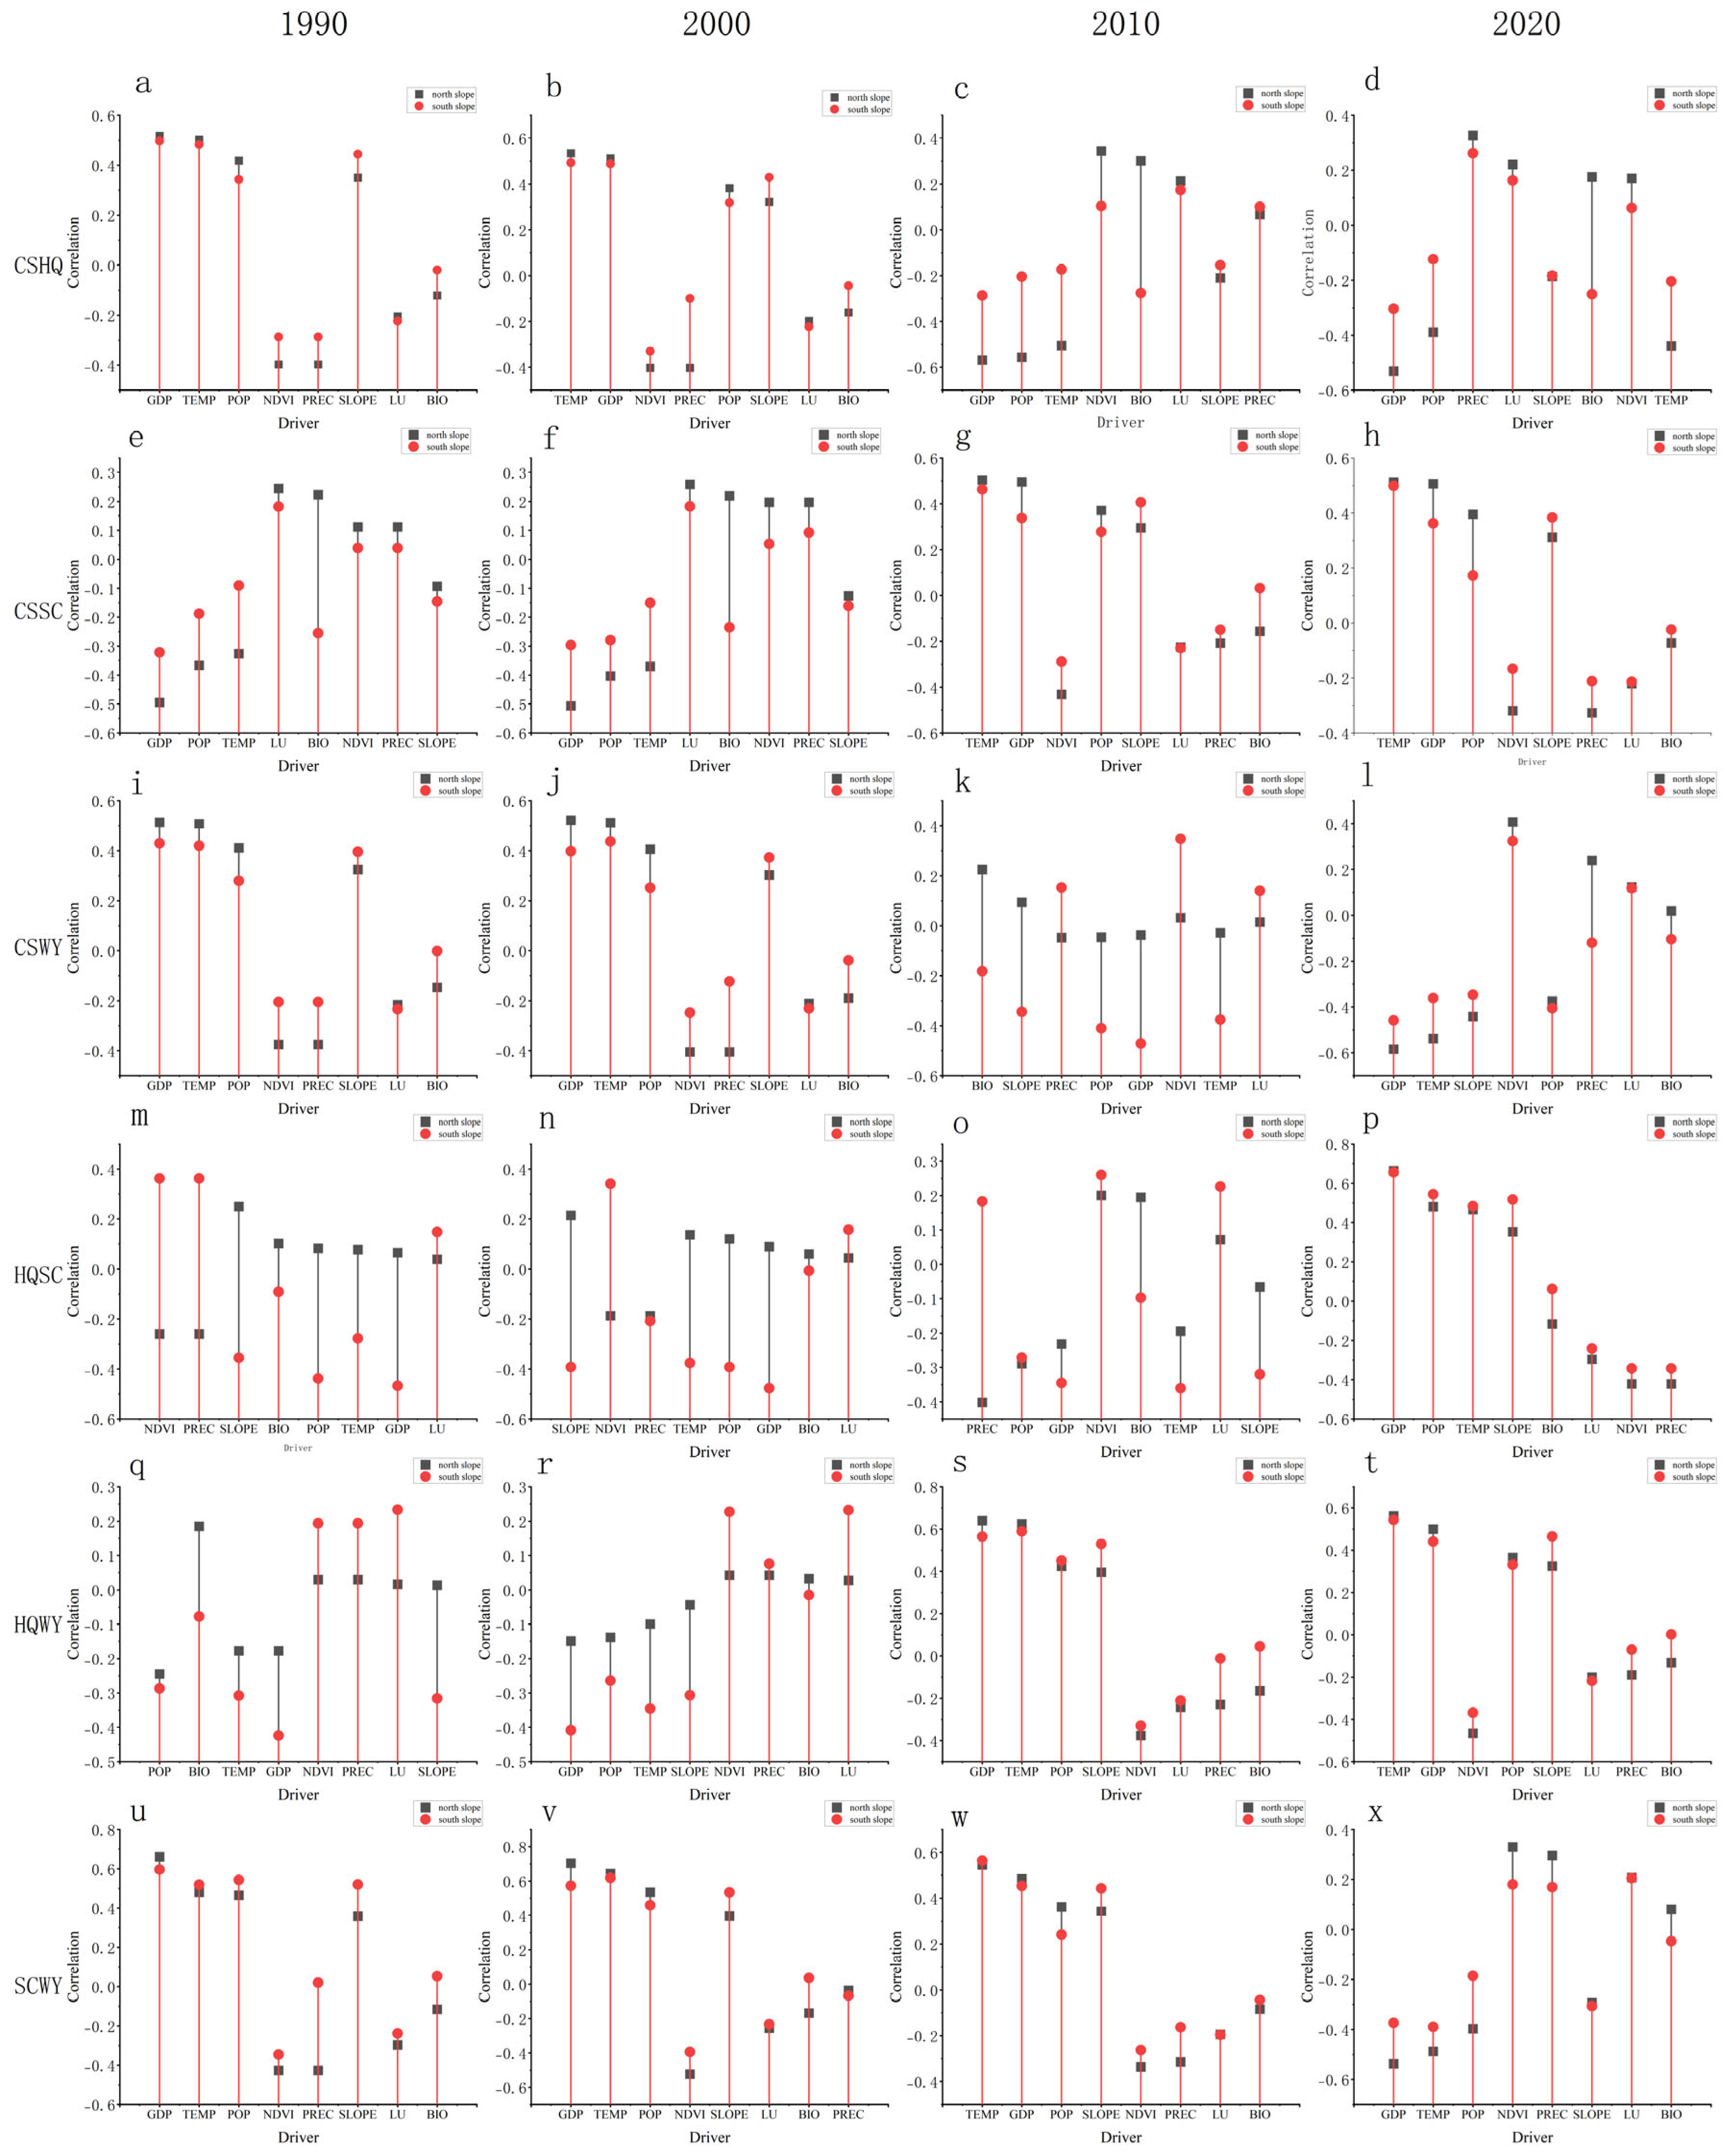
The combined impacts of anthropogenic influences and the natural endowment differences between the northern and southern slopes restrict the spatiotemporal variability of ecosystem service trade-offs and synergies in the Nanling area. Figure 6 illustrates how the primary drivers of SC-WY changed across slope aspects between 1990 and 2020. These services were still controlled by temperature (TEMP), GDP, and slope gradient on south-facing slopes. In contrast, north-facing slopes were ruled by GDP and temperature by 2020, as opposed to population (POP) and biodiversity (BIO) in 1990 (see Figure 6u–x). Quality of CS-HQ While GDP remained the primary influencing factor throughout on the northern slope, the driving force on the southern slope changed from early GDP to later temperature domination (see Figure 6a,b). Conservation of CS-SC It shows two drivers of temperature and GDP on the north and south slopes (see Figure 6e–h). Conservation of HQ-SC In the next two decades, temperature became the main factor on both slopes, replacing GDP in 1990 (see Figure 6m–p). HQ-WY on the northern slope evolved from POP and BIO in 1990 to GDP and POP in 2020, while the southern slope has long been controlled by GDP and temperature (Figure 6q–t). The multifaceted connections between terrain, climate, and human activity are the cause of this dynamic shift in trade-off/synergy relationships. Its primary mechanism appears in three ways: First, complicated transformation processes cannot be explained by a single factor; rather, a combination of factors, including temperature, GDP, and slope, must work in concert. Second, spatial heterogeneity in dominant factors—caused by variations in vegetation cover and intensity of human activity between north and south slopes—as well as the long-term impact of GDP on the north slope and the gradual intensification of temperature effects on the south slope led to the emergence of slope-specific differentiation responses. This demonstrates how ESs respond to driving variables in a nonlinear way.
Two-factor enhancement, nonlinear enhancement, and independent effects are the three ways that factor interactions affect trade-off/synergy relationships. Two-factor enhancement is present in more than 57% of cases, and its explanatory power is far higher than that of any one factor operating alone. In particular, in the southern slope region, the spatial variation in the CS-HQ synergy relationship was best explained by the interaction between temperature (TEMP) and biodiversity (BIO) (q = 0.47), with its value greatly outweighing the separate contributions of either factor. This suggests that abundant biodiversity and appropriate temperatures work together to drive increased vegetation productivity on south-facing slopes with favorable hydrothermal conditions. This strengthens the synergistic effects of ecosystem carbon sequestration and biodiversity maintenance functions. On the other hand, temperature (TEMP) and vegetation cover (NDVI) combine to largely control the CS-HQ synergistic relationship on the northern slope (q = 0.42). This study demonstrates how temperature controls vegetation growth and development in the comparatively chilly northern slope, whereas vegetation conditions in turn affect carbon cycling and the surface microclimate. These two elements work together to form the primary mechanism controlling the interdependent relationship between biodiversity functions and CS.

4. Discussion

4.1. Driving Mechanisms of Ecosystem Service Differentiation Patterns Between Northern and Southern Slopes

In the Nanling Mountains, the combined effects of human activity and natural terrain lead to the geographical heterogeneity of ecological services. Slope aspect has a highly significant impact on all four services (p < 0.001), according to statistical testing, with water production responding most sensitively (F = 6.24 × 10⁴). Significant differences between north and south slopes continued to exist throughout the study period (p < 0.001), as evidenced by the water production gap expanding from 118 mm in 1990 to 294 mm in 2020 and the soil retention values moving from higher values on northern slopes to southern slopes surpassing them (to 12,910 t·km−2 in 2020, 13% higher than northern slopes), indicating the strict control of slope aspect over service differentiation. This reversal results from a unique synergistic process that connects ecological benefits with gentle slope topography. The southern side’s gentle slopes maximize water output and soil conservation while reducing runoff and extending rainfall retention. On the other hand, the northern slope’s steep terrain causes soil erosion and quick runoff discharge, which results in a soil retention rate per unit area that is only 88% of the southern slope’s. The high-value water yield zones experience spatial antagonism as a result. This result is in good agreement with what is already understood about how ecological processes are regulated by slope. Li et al. (2022), for example, clearly showed in their Loess Plateau study that slopes less than 15° promote synergistic soil retention and water output [36]. Similarly, gentle slopes are essential terrain units for preserving synergistic interactions among various ESs, as Wudnesh Naba et al. (2023) verified through a study in Ethiopia [37]. Therefore, the geographical heterogeneity of ESs is ultimately driven by the prevalent topographic patterns of gentle or steep slopes on northern and southern slopes, as well as the previously documented verified slope processes.
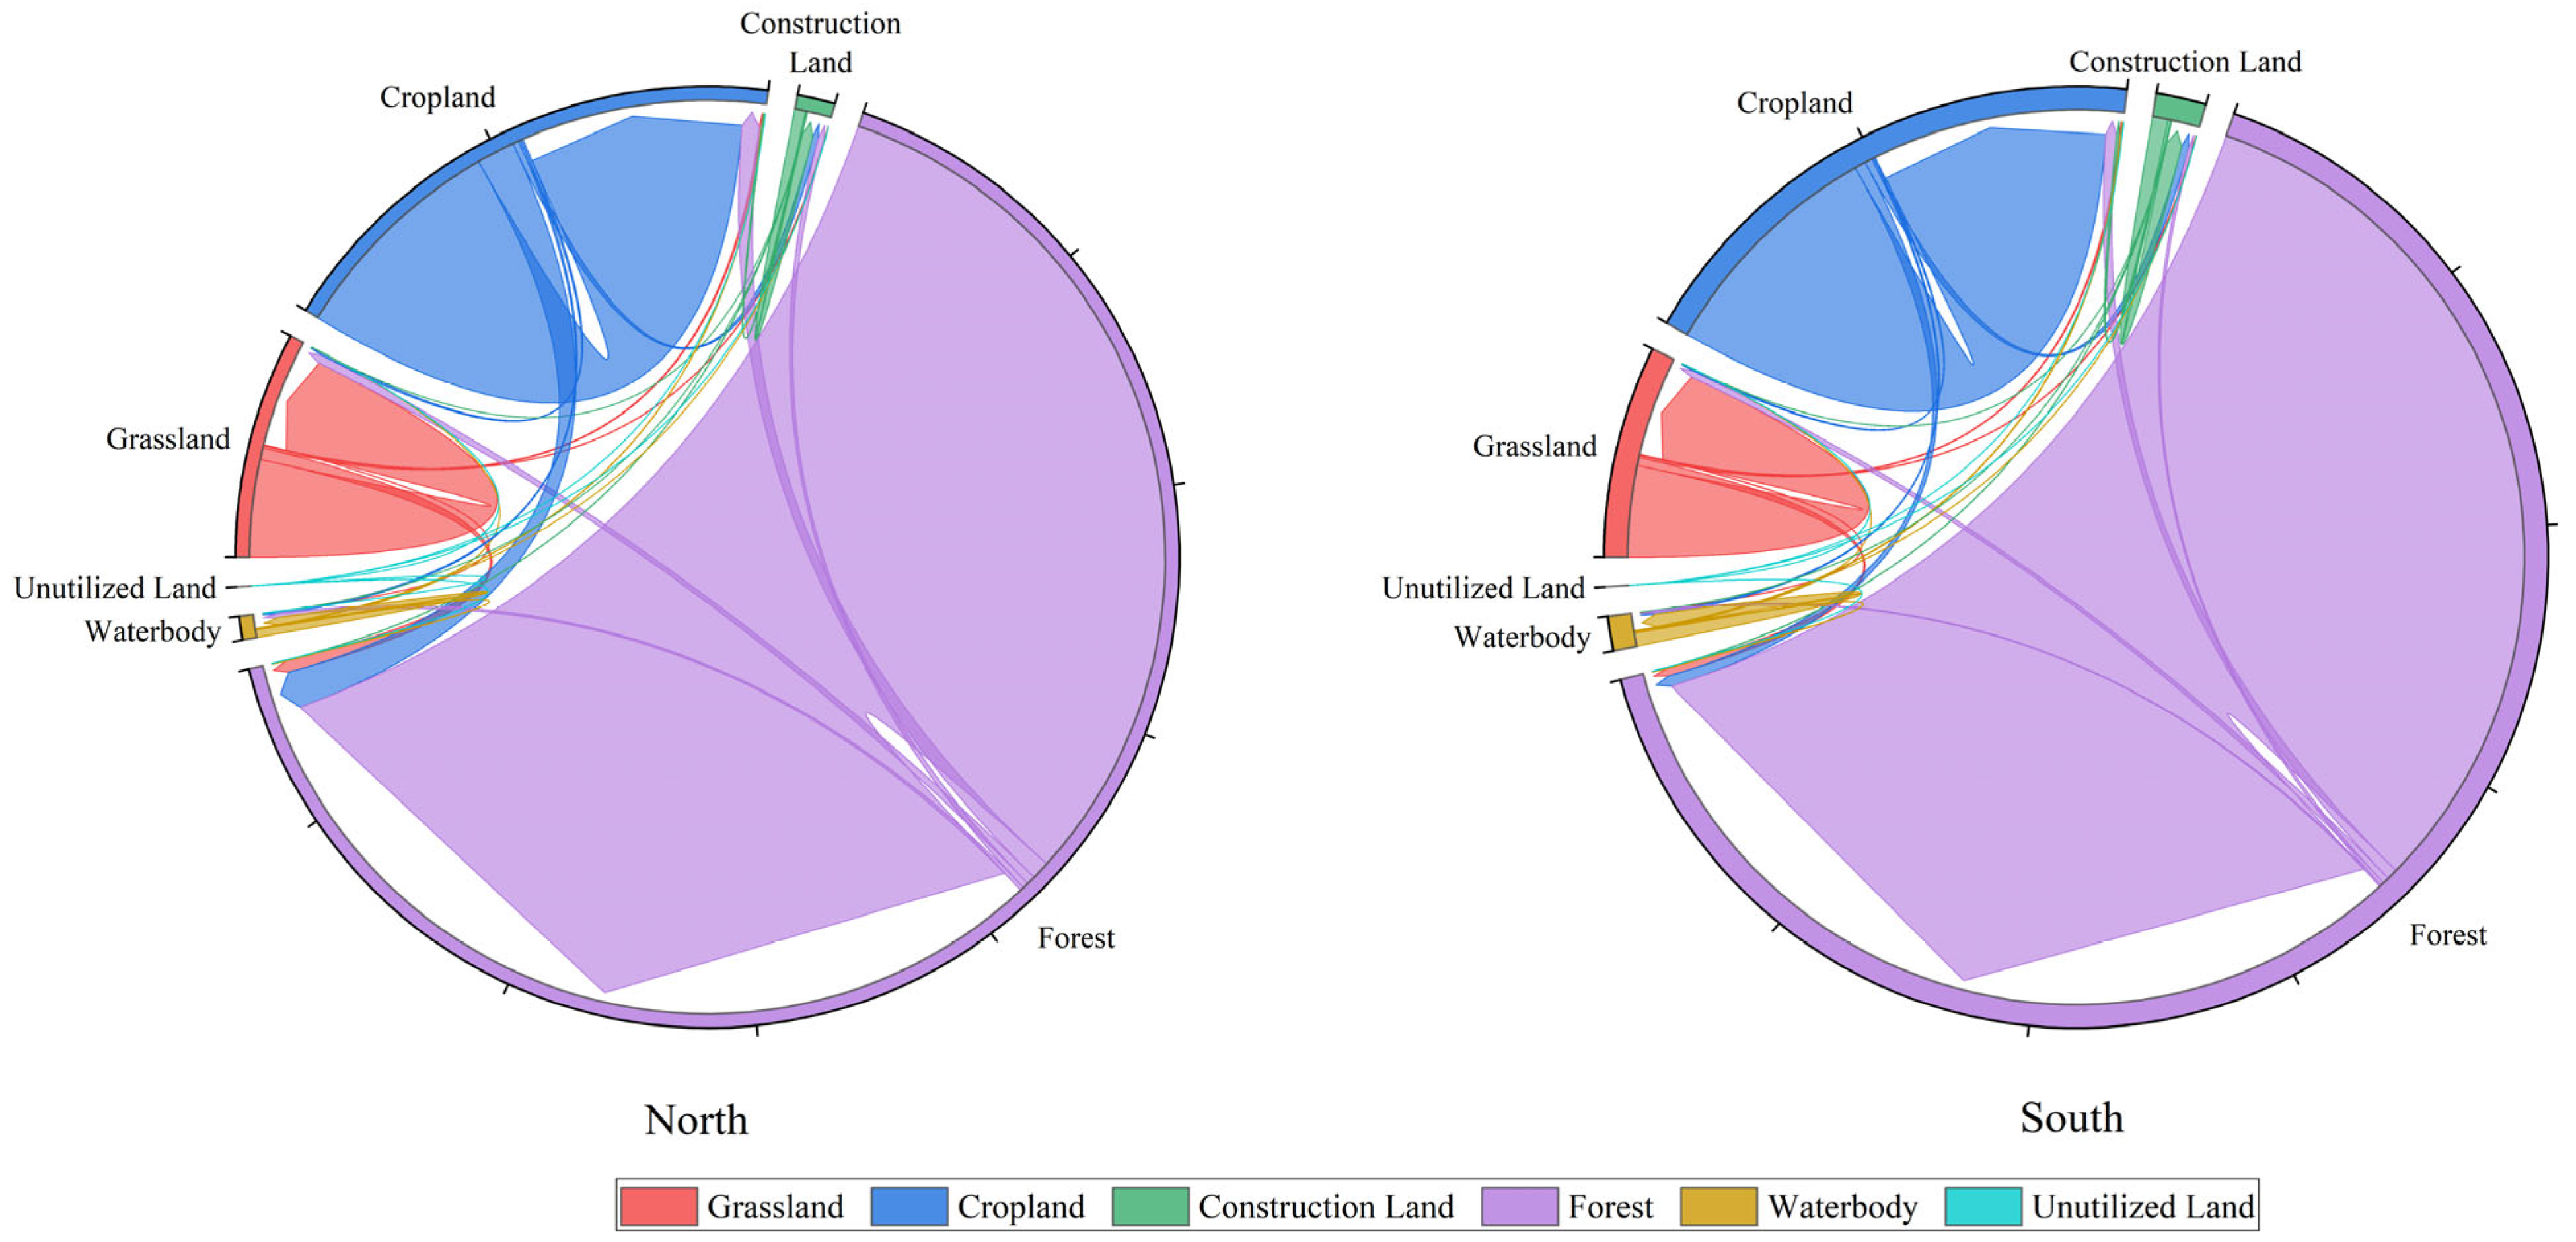
ESs are significantly impacted by the gradient effect of human activity. Figure 7 illustrates how increased human disturbance on the northern slope, including the conversion of cropland to forest (with afforestation encompassing 1575.04 km2) and the expansion of building land, worsened trade-offs between habitat quality and water production services (HQ-WY). The southern slope saw comparatively little human disturbance, protecting the core hilly belt’s wooded regions (only 130.46 km2 were impacted). This study identifies a “topography-human activity filtering coupling mechanism” based on this geographical differentiation pattern. In particular, the geography of the low-elevation plains on the northern slope amplifies the impacts of human disturbances, whereas the mountainous southern slope naturally mitigates some of the disturbance pressure. This process shows up as glaring ecological inequalities: High-intensity building and farming caused habitat quality in the heavily disturbed low-elevation core area of the central-eastern northern slope to nearly stagnate (0.003 in 2020 compared to 1990). On the other hand, the habitat quality on the southern slope, which was subjected to less disturbance, improved steadily and reached 0.710 in 2020. Yang et al.’s (2023) observations on the Qinghai–Tibet Plateau are consistent with this, but our research also identifies the mechanism via which slope topography and the intensity of human activity are coupled [38].
This analysis shows a reasonably uniform geographical distribution of carbon stocks (north–south slope difference < 1.5%) with weakly significant interannual oscillations (p = 0.007), in contrast to the noticeable slope-dependent variation in hydrological and edaphic services. This suggests that carbon sink functions show a noticeable “lag effect” in response to topographic heterogeneity, in contrast to hydrological and edaphic processes that react quickly to water and heat conditions. The slow turnover properties of the carbon cycle, especially the soil carbon pool, are the main cause of this impact. Long-term stable variables like plant type and soil organic matter control its spatial pattern more so than short-term hydrological and thermal circumstances. In their research of the upper Yangtze River basin, Liu et al. (2023) revealed that plant type had a greater beneficial impact on soil carbon stocks than short-term hydrotemperatural changes, providing direct support for this process [39]. Together, the study’s findings support these conclusions by showing that, as a result of the diverse temporal scales of the underlying biological processes, different ESs respond to external forces in different ways and at different rates.

4.2. Scale Effects of Trade-Offs/Synergies in ESs

The trade-offs between ESs exhibit a discernible scale dependency. By employing a nested analysis over three scales—regional, slope-oriented, and county-level—this study overcomes the limitations of traditional single-scale approaches. By systematically revealing the underlying spatial variability patterns of ES connections in the Nanling Mountains, it improves our understanding of the fundamental properties of scale effects. According to this study, the relationship between soil conservation and water yield services (SC-WY) shows a general tendency of moving from “trade-off” to “synergy” at the regional level. The innately hostile evolutionary trajectories of the northern and southern slopes are obscured by this overall pattern, though. According to analysis at the slope orientation scale, high-intensity trade-offs between SC and WY were produced by steep topography on northern slopes until 2010, and by 2020, this tendency had only slowed down after ecological engineering interventions were implemented. On the other hand, because of the “gentle slope topography-ecosystem service synergy mechanism’s” optimizing impact, southern slopes continuously maintained greater synergy intensity. This suggests that the conclusion at the regional level is the result of different processes being “neutralized” on the north and south slopes. The crucial layer for identifying internal inconsistencies in mountain ecosystems is the slope-scale level. This finding not only validates the spatiotemporal dynamics of the relationship but, more significantly, reveals the internal contradictions and localized processes driving the overall trend, furthering our understanding of the mechanisms underlying “scale effects” in contrast to Wang et al. (2024), whose study mainly relied on regional-level analysis [40].
One of the study’s main innovations in comparison to previous studies is the discovery of more intricate spatial heterogeneity patterns at the county level. According to research, the HQ-SC strong synergy zone is spread across the eastern and western sides of the southern slope (Dayu County and Nanxiong County), while it is concentrated in central counties and cities on the northern slope (Guiyang County and Ningyuan County). This result is consistent with the findings of Sun et al. (2021) in their Loess Plateau study, which found that counties with slopes less than 15° are better suited to managing vegetation to achieve synergistic ESs, while counties with slopes greater than 25° face greater trade-offs because of faster runoff loss [41]. In contrast to earlier research, this study has revealed the spatial conflict between the demands of ecological conservation and agricultural irrigation by identifying a county-level pattern in the Nanling region where the CS-WY relationship displays a “central trade-off and bilateral coordination” dynamic.
The multi-scale analytic approach used in this work overcomes the drawbacks of conventional research and identifies important scale effects in the interactions between carbon and water: The relationship between water production and CS did not reach statistical significance at the regional level; at the slope level, the intensity of carbon-water synergies on southern slopes rises with elevation gradients, whereas northern slopes display traits that are jointly regulated by GDP and temperature; The tension between the demands for carbon sinks and agricultural water use in central counties and cities (like Chenzhou City) is further revealed at the county level. The geographical heterogeneity of mountain ecosystem service linkages is more clearly revealed by this multiscale analytic method than by Liu et al. (2017) [42].

4.3. Spatial Heterogeneity of Driving Mechanisms for Trade-Offs/Synergies in ESs

Strong spatial heterogeneity and factor interactions are present in the driving mechanisms of trade-offs and synergies in ESs [43]. On the southern slope, vegetation cover and slope gradient are the main driving elements. By delaying and obstructing runoff and improving canopy interception, these two factors greatly increase the synergistic intensity of soil retention and water output. GDP and temperature work together to regulate the northern slope. Through the Farmland-to-Forest Conversion Program, GDP development partially offsets ecological losses, while low temperatures limit the physiological activity of vegetation. The driving mechanisms of the Nanling Mountains’ northern and southern slopes are more distinctive than those of the Qinling and Hengduan Mountains. The Qinling Mountains’ northern slope is cold and dry, with temperature and precipitation acting as the main influences and little human interference. The Hengduan Mountains are mainly distinguished by their altitude gradients. However, because of the combined effects of high human activity and temperature and hydrological differences, the Nanling Mountains show a complex interplay of natural and human elements. In their research of the karst region in southwest China, C et al. (2025) came to the following conclusion: “Anthropogenic factors become prominent in areas of concentrated human activity, while hydrothermal gradients shape naturally driven dominance” [44]. The geographic detector’s interaction results showed that 57% of factor combinations had a two-factor enhancement effect, with explanatory power much higher than that of single factors. The strongest explanation for the CS-HQ synergistic relationship (q = 0.47) came from the interaction between temperature (TEMP) and south-slope biodiversity (BIO), which was far greater than the independent contributions of either factor. The “biodiversity-thermal conditions” on the southern slope are confirmed by this; high biodiversity and appropriate temperatures increase vegetative productivity, which in turn improves carbon sequestration and biodiversity maintenance processes; The “temperature-vegetation” limiting chain in cooler environments is highlighted by the dominance of the temperature (TEMP) and vegetation cover (NDVI) interaction on the northern slope (q = 0.42). An increase of 1° C in temperature can raise NDVI by 0.12, fostering the synergy between CS and HQ.
The CS-SC synergistic coefficient increased by 0.12 when north-slope farmland was converted to forest land (1575.04 km2), and the HQ-WY trade-off intensity increased by 0.23 when construction sites encroached on forest land (243.94 km2). The southern slope saw less encroachment of construction sites on core forest land (130.46 km2), which resulted in less disturbance to its service relationships from human activities. Rainfall and slope gradient interactions were still the most important natural factors (q = 0.70). Human activities in the Nanling Mountains have a more noticeable effect on ESs than in the Hengduan Mountains region. The southern slopes of the Nanling Mountains have better hydrological and thermal conditions than the Qinling Mountains, and ecosystems there are more resilient to human disturbance. This contrasts sharply with the ecosystems’ susceptibility on the Qinling Mountains’ northern slopes. This discrepancy implies that in order to preserve natural synergistic mechanisms, the southern slope should preserve forested regions in the hilly zones, while the northern slope should concentrate on limiting the growth of low-altitude plains development.

4.4. Shortcomings

Though there are still some restrictions on the breadth and depth of the research, this study methodically examined the trade-off/synergy linkages among ESs in the Nanling Mountains and their underlying processes. Spatially, the analysis mostly ignored the impact of vertical elevation gradients in favor of focusing on the horizontal differentiation between northern and southern slopes (e.g., how low-elevation hills and mid-to-high-elevation mountains regulate ES relationships due to differences in hydrotemperature and vegetation). Temporally, the seasonal dynamics of ES relationships are not studied, which leaves unmeasured phenomena like the trade-offs between habitat quality and runoff on northern slopes during the dry season or the combined effects of rainfall-induced runoff and soil conservation on southern slopes during the wet season [45]. From a conceptual standpoint, the study focuses on pairs of ES linkages without disclosing the geographical patterns of the resultant “service clusters” or the networked links among numerous services. The modeling estimates of ES progression under future scenarios, such as steep slope afforestation on northern slopes and building land growth on southern slopes, are also absent in this work, which is based on historical observational data from 1990 to 2020 [46]. Although interactions between variables such as temperature, slope, and GDP were found, there are no quantitative models that systematically explain micro-processes, such as how GDP indirectly affects the carbon storage-soil conservation synergy through policy implementation or how slope specifically controls the trade-off between soil conservation and water yield by changing runoff pathways. Future studies could use structural equation modeling to measure indirect effects and causal pathways of driving factors, couple CA-Markov and InVEST models to simulate ES evolution under various development scenarios, and integrate elevation-stratified data to analyze multi-service linkages along vertical gradients. The theoretical foundation for mountain ES research would be significantly improved by these methods.

4.5. Recommendations

To attain exact alignment between ecological conservation and regional development, the study area is separated into three management zones based on the methodical examination of the spatiotemporal patterns, trade-offs/synergies, and driving mechanisms of ESs on the northern and southern slopes of the Nanling Mountains [47]. In particular, the core region of the northern slope and the eastern and western sides of the southern slope were recognized and classified as “Core Conservation Zones.” Several ESs, such as soil conservation, carbon storage, and habitat quality, show consistent synergistic connections within these zones. As a result, these regions need to be included in the main scope of ecological protection redlines, which have strong restrictions on large-scale development and commercial logging. A “Regulatory Restoration Zone” is created concurrently, mostly spanning the low-altitude plains in the central-eastern region of the northern slope and a few high-tradeoff counties on the southern slope. HQ-WY and SC-WY high-intensity tradeoffs are concentrated in this zone. The implementation of systematic vegetation restoration and ecological rehabilitation projects for existing industrial and mining wastelands and degraded mountain areas, the strict prohibition of further encroachment of construction land into ecological spaces, and the demarcation of urban development boundaries must be the main objectives of management strategies. Additionally, for the largest “Natural Restoration and Adaptive Utilization Zone,” distinct guidance techniques had to be used. Transitional regions with intricate carbon-water connections and somewhat uniform driving processes are the main focus of this zone. To improve total ecosystem service functions, afforestation and ecological compensating mechanisms should be promoted on the northern slope. To obtain synergistic increases in ecological and economic advantages, sustainable agroforestry and ecological agricultural techniques may be promoted to a reasonable extent in the steep and gently sloping parts of the southern slope.
More specific regulatory actions are needed for important trade-off zones: By maximizing urban green space layouts and encouraging industrial upgrading, ecological footprints should be minimized in Jiahe County and Chenzhou City’s territorial jurisdiction on the northern slope, where early economic growth depended on expanding construction land, resulting in an HQ-WY trade-off pattern. Historically, mining operations in parts of Chenzhou City and long-term agricultural reclamation in Xintian County have caused conflicts between ecological carbon sequestration demands and agricultural water use in CS-WY high-tradeoff counties in the central areas of both slopes (such as Xintian County and some counties under Chenzhou City jurisdiction). Improving irrigation efficiency and promoting water-saving agriculture technology are crucial for reducing the stresses of competition for water resources.

5. Conclusions

The following are the primary conclusions: (1) Although there is regional variation between the southern and northern slopes, ESs in the Nanling region generally exhibit an upward trend. It is evident that the services provided by the southern slope exhibited a greater rate of growth in comparison to those of the northern slope. It is noteworthy that the disparity in SC and WY between the two slopes increased. Despite the HQ advantage consistently maintained on the south slope, the CS values exhibited a relatively uniform spatial distribution. (2) Whereas synergies generally arise between HQ and SC, trade-offs among ESs mostly occur between HQ and WY. Trade-offs are secondary to the synergistic interactions that characterize ESs. Significant temporal and geographical variation can be seen in these relationships: the southern slope is centered on persistent synergy between HQ and SC, whereas the northern slope is characterized by a high-intensity trade-off between HQ and WY. Synergy progressively replaces the initial trade-off connection in the interaction between SC and WY. (3) The driving processes of the northern and southern slopes differ significantly. In contrast to the southern slope, where temperature, GDP, and slope gradient all play a role, the ecosystem service linkages of northern slope are largely controlled by temperature and GDP. In addition, strong explanatory power is shown by the way the slope gradient regulates soil retention-runoff generation and how it interacts with precipitation on the southern slope. (4) The primary mechanism underlying geographic heterogeneity in ecosystem service connections is factor interactions, specifically two-factor synergistic effects. (5) This work provides scientific support for differentiated ecological management by confirming that the “slope-facing system” may serve as an efficient analytical unit for exposing internal variation in mountain ESs.

Author Contributions

All authors made significant contributions to the preparation of this manuscript. Conceptualization, X.X. and X.Z.; methodology, X.X. and X.Z.; software, X.X., K.Z. and X.Z.; formal analysis, X.X., Y.H. and X.Z.; resources, X.X. and X.Z.; writing—original draft preparation, X.X., X.Z., Y.H., R.L., J.L. and K.Z.; writing—review and editing, X.X., K.Z. and X.Z.; funding acquisition, X.X. and X.Z. All authors have read and agreed to the published version of the manuscript.

Funding

This research was funded by the National Natural Science Foundation of China (42261015), the Science and Technology Foundation of the Education Department of Jiangxi Province (GJJ211426), University Student Innovation and Entrepreneurship Training Program Project of Jiangxi Province (S202510418062).

Data Availability Statement

All data and materials are available upon request.

Conflicts of Interest

The authors declare no conflicts of interest.

References

  1. Yang, F.; Zhang, L.X.; Shi, L. Trade-Offs/Synergies and Driving Forces of Ecosystem Services in the Coastal Shelterbelt System Construction Project Area. Acta Ecol. Sin. 2023, 43, 9952–9966. [Google Scholar] [CrossRef]
  2. Xu, X.; Zhang, X.; Qin, L.; Li, R. Unveiling Spatiotemporal Evolution and Driving Factors of Ecosystem Service Value: Interpretable HGB-SHAP Machine Learning Model. Front. Environ. Sci. 2025, 13, 1640840. [Google Scholar] [CrossRef]
  3. Bennett, E.M.; Peterson, G.D.; Gordon, L.J. Understanding Relationships Among Multiple Ecosystem Services. Ecol. Lett. 2009, 12, 1394–1404. [Google Scholar] [CrossRef]
  4. Mouchet, M.A.; Lamarque, P.; Martín-López, B.; Crouzat, E.; Gos, P.; Byczek, C.; Lavorel, S. An Interdisciplinary Methodological Guide for Quantifying Associations Between Ecosystem Services. Glob. Environ. Change 2014, 28, 298–308. [Google Scholar] [CrossRef]
  5. Jiang, W.; Gao, G.; Wu, X.; Lv, Y. Assessing Temporal Trade-Offs of Ecosystem Services by Production Possibility Frontiers. Remote Sens. 2023, 15, 749. [Google Scholar] [CrossRef]
  6. Xiao, S.; Xia, H.; Zhai, J.; Jin, D.; Gao, H. Trade-Off and Synergy Relationships and Driving Factor Analysis of Ecosystem Services in the Hexi Region. Remote Sens. 2024, 16, 3147. [Google Scholar] [CrossRef]
  7. Supriyanto, S.; Martono, D.N.; Hasibuan, H.S.; Hartono, D.M. Assessing Payment for Ecosystem Services to Improve Lake Water Quality Using the InVEST Model. Environ. Econ. 2024, 15, 149–161. [Google Scholar] [CrossRef]
  8. Shang, K.K.; Da, L.J. Micro-Topographic Spatial Differentiation Pattern and Coexistence Mechanism of Relict Deciduous Broadleaved Trees: A Review. Chin. J. Ecol. 2013, 32, 1912–1919. [Google Scholar] [CrossRef]
  9. Ackerly, D.; Knight, C.; Weiss, S.; Barton, K.; Starmer, K. Leaf Size, Specific Leaf Area and Microhabitat Distribution of Chaparral Woody Plants: Contrasting Patterns in Species Level and Community Level Analyses. Oecologia 2002, 130, 449–457. [Google Scholar] [CrossRef] [PubMed]
  10. Ning, A.; Chen, W.J.; Zhao, Y. Distribution Effect of Grassland Biological Disasters Driven by Topography in the Ili River Valley. Nat. Reserv. 2024, 4, 99–109. [Google Scholar]
  11. Wang, L.Y.; Li, X.M.; Gan, D.X.; Liu, Y.; Wang, J.L. Spatial Heterogeneity and Driving Factors of Ecosystem Service Trade-Off/Synergy Relationships in Chang-Zhu-Tan Urban Agglomeration. Ecol. Environ. Sci. 2024, 33, 969–980. [Google Scholar] [CrossRef]
  12. Wang, Q.; Mu, Q.; Luo, M.Y.; Li, J.; Zhang, Y.L. Spatiotemporal Heterogeneity of Ecosystem Service Synergy and Trade-Off in Qinling Mountains. Chin. J. Appl. Ecol. 2022, 33, 2145–2154. [Google Scholar] [CrossRef]
  13. Ma, X.; Zhang, H. Variations in the Value and Trade-Offs/Synergies of Ecosystem Services on Topographic Gradients in Qinghai Province, China. Sustainability 2022, 14, 15546. [Google Scholar] [CrossRef]
  14. Glushkova, M.; Zhiyanski, M.; Nedkov, S.; Yaneva, R.; Stoeva, L. Ecosystem Services from Mountain Forest Ecosystems: Conceptual Framework, Approach and Challenges. Silva Balcan. 2020, 21, 47–68. [Google Scholar] [CrossRef]
  15. Li, G.; Cai, J. Spatial and Temporal Differentiation of Mountain Ecosystem Service Trade-Offs and Synergies: A Case Study of Jieshi Mountain, China. Sustainability 2022, 14, 4652. [Google Scholar] [CrossRef]
  16. Aryal, K.; Maraseni, T.; Apan, A. Spatial Dynamics of Biophysical Trade-Offs and Synergies Among Ecosystem Services in the Himalayas. Ecosyst. Serv. 2023, 59, 101503. [Google Scholar] [CrossRef]
  17. Wang, Y.D.; Ma, W.L.; Yuan, Y. Comparison of Polypore Florae and Diversity from Temperate to Subtropical Forest Zones in China. Biodivers. Sci. 2021, 29, 1369–1381. [Google Scholar] [CrossRef]
  18. Ren, M.E. Chinese Natural Geography Outline, Revised ed.; Commercial Press: Beijing, China, 1982; pp. 105–130. [Google Scholar]
  19. Ji, Y.H.; Zhou, G.S.; Wang, S.D.; Wang, L.X.; Zhou, M.Z. Evolution Characteristics and Driving Forces of Vegetation Ecological Quality in Qinling Mountains Region (2000–2019). Chin. J. Plant Ecol. 2021, 45, 617–625. [Google Scholar] [CrossRef]
  20. Wang, W.T.; Guo, W.Y.; Jarvie, S.; Svenning, J.C. The Fate of Meconopsis Species in the Tibeto-Himalayan Region Under Future Climate Change. Ecol. Evol. 2021, 11, 887–899. [Google Scholar] [CrossRef] [PubMed]
  21. Budyko, M.I. Climate and Life; Miller, D.H., Translator; Academic Press: New York, NY, USA, 1974. [Google Scholar]
  22. Allen, R.G.; Pereira, L.S.; Raes, D.; Smith, M. Crop Evapotranspiration—Guidelines for Computing Crop Water Requirements—FAO Irrigation and Drainage Paper 56; FAO: Rome, Italy, 1998; p. 300. [Google Scholar]
  23. Wang, B.S.; Chen, H.X.; Dong, Z.; Zhu, W.; Qiu, Q.Y.; Tang, L.N. Impact of Land Use Change on the Water Conservation Service of Ecosystems in the Urban Agglomeration of the Golden Triangle of Southern Fujian, China. Acta Ecol. Sin. 2020, 40, 484–498. [Google Scholar] [CrossRef]
  24. Zhang, L.; Yang, F. Spatiotemporal Dynamics of Water Conservation Service of Ecosystems in the Zhejiang Greater Bay Area and Its Impact Factors Analysis. Sustainability 2022, 14, 10392. [Google Scholar] [CrossRef]
  25. Chen, T.; Wang, Y.; Zeng, X.; Wang, Q. Characteristics and Constraint Relationship Between Ecosystem Services and Vegetation Coverage in Southwest China. Acta Ecol. Sin. 2023, 43, 2253–2270. [Google Scholar] [CrossRef]
  26. Pan, N.H. Spatial and Temporal Differentiation of Key Ecosystem Services and Their Trade-Offs/Synergies in the Qilian Mountain Area. Ph.D. Thesis, Lanzhou University, Lanzhou, China, 2022. [Google Scholar] [CrossRef]
  27. Zhang, W.B.; Fu, J.S. Estimation of Rainfall Erosivity Using Different Types of Rainfall Data. Resour. Sci. 2003, 25, 35–41. [Google Scholar] [CrossRef]
  28. Wang, Y.; Zhu, L.; Wang, X.; Yang, X.; Zhang, X.; Fang, Q.; Yu, X. Evaluating the Ecological Conservation Effectiveness and Strategies in Nanling Key Ecological Function Zone of China: A CHANS Perspective. Ecol. Front. 2024, 44, 1140–1148. [Google Scholar] [CrossRef]
  29. Wang, J.; Abulizi, A.; Mamitimin, Y.; Mamat, K.; Yuan, L.; Bai, S.; Shen, F. Spatiotemporal Evolution of Habitat Quality and Scenario Modeling Prediction in the Tuha Region. Land 2024, 13, 1005. [Google Scholar] [CrossRef]
  30. Li, S.; Hong, Z.; Xue, X.; Zheng, X.; Du, S.; Liu, X. Evolution Characteristics and Multi-Scenario Prediction of Habitat Quality in Yulin City Based on PLUS and InVEST Models. Sci. Rep. 2024, 14, 11852. [Google Scholar] [CrossRef]
  31. Xiong, M.; Li, F.; Liu, X.; Liu, J.; Luo, X.; Xing, L.; Guo, F. Characterization of Ecosystem Services and Their Trade-Off and Synergistic Relationships Under Different Land-Use Scenarios on the Loess Plateau. Land 2023, 12, 2087. [Google Scholar] [CrossRef]
  32. Yang, S.W.; Liu, J.F.; Kuang, Y.W.; Wang, Q.; Huang, R.Z.; Nie, W.; Sun, J.Y.; Zhao, Y.P. Spatial-Temporal Dynamics of Trade-Offs and Synergies of Ecosystem Services and Their Driving Forces in Jiangxi Province. Chin. J. Ecol. 2025, 44, 216–225. [Google Scholar] [CrossRef]
  33. Li, L.; Zhao, F.; Zhu, L.Q.; He, S.S.; Ye, L.P. Geodetector of Ecosystem Service Trade-Off and Spatial Differentiation Mechanism in Qihe River Basin. Acta Ecol. Sin. 2021, 41, 7568–7578. [Google Scholar] [CrossRef]
  34. Yan, J.X.; Huang, H.; Gao, Y.H.; Wang, T.T.; Zhang, Y. Spatiotemporal Variation Characteristics of Terrestrial Ecosystem NPP in Jilin Province for a Long Time Series. J. Soil Water Conserv. 2021, 35, 172–180. [Google Scholar] [CrossRef]
  35. Ma, X.P.; Li, J.; Yu, Y.Y.; Deng, C.H. Spatial Service Scope and Simulation Prediction of Carbon Neutrality in Qinling Mountains. Acta Ecol. Sin. 2022, 42, 9431–9441. [Google Scholar] [CrossRef]
  36. Li, J. Evaluation of Soil and Water Conservation Function in Dingxi City, Upper Yellow River Basin. Water 2022, 14, 2919. [Google Scholar] [CrossRef]
  37. Naba, W.; Wolde, B. Techniques for Conservation Tillage Under 15–25% Slope: Soil and Water Conservation, Maize Yield and Yield Components in Basketo Zone, Southern Ethiopia. OMO Int. J. Sci. 2023, 6, 68–80. [Google Scholar] [CrossRef]
  38. Yang, H.; Xu, Y.; Wang, L.; Xu, L. Spatio-Temporal Variation of Human Activity Intensity and Its Driving Factors on the Qinghai-Tibet Plateau. Acta Ecol. Sin. 2023, 43, 3995–4009. [Google Scholar] [CrossRef]
  39. Liu, S.C.; Shao, Q.Q.; Niu, L.N.; Ning, J.; Liu, G.B.; Zhang, X.Y.; Huang, H.B. Changes of Ecological and the Characteristics of Trade-Offs and Synergies of Ecosystem Services in the Upper Reaches of the Yangtze River. J. Ecol. 2023, 3, 1028–1039. [Google Scholar] [CrossRef]
  40. Wang, J.; Li, Y.; Wang, S.; Li, Q.; Wang, R.; Zhang, R.; Ge, X. Evolution and Driving Mechanism of Multiple Ecosystem Services in Resource-Based Region of Northern China. Sci. Rep. 2024, 14, 22338. [Google Scholar] [CrossRef]
  41. Sun, C.; Hou, H.; Chen, W. Effects of Vegetation Cover and Slope on Soil Erosion in the Eastern Chinese Loess Plateau Under Different Rainfall Regimes. PeerJ 2021, 9, e11226. [Google Scholar] [CrossRef] [PubMed]
  42. Liu, Y.; Bi, J.; Lv, J.; Ma, Z.; Wang, C. Spatial Multi-Scale Relationships of Ecosystem Services: A Case Study Using a Geostatistical Methodology. Sci. Rep. 2017, 7, 9486. [Google Scholar] [CrossRef]
  43. Farber, S.C.; Costanza, R.; Wilson, M.A. Economic and Ecological Concepts for Valuing Ecosystem Services. Ecol. Econ. 2002, 41, 375–392. [Google Scholar] [CrossRef]
  44. He, C.; Xiong, K.; Rong, L. Trade-Offs and Synergies of Ecosystem Services and Their Drivers in the Forests of the South China Karst. Npj Herit. Sci. 2025, 13, 298. [Google Scholar] [CrossRef]
  45. Li, G.; Jiang, C.; Gao, Y.; Du, J. Natural Driving Mechanism and Trade-Off and Synergy Analysis of the Spatiotemporal Dynamics of Multiple Typical Ecosystem Services in Northeast Qinghai-Tibet Plateau. J. Clean. Prod. 2022, 374, 134075. [Google Scholar] [CrossRef]
  46. Zukula, K.; Chen, Y.; Li, Y.; Wang, C. Dynamic Evolution and Scenario Simulation of Ecosystem Services Under the Impact of Land-Use Change in an Arid Inland River Basin in Xinjiang, China. Remote Sens. 2023, 15, 2476. [Google Scholar] [CrossRef]
  47. Lyu, R.; Clarke, K.C.; Tian, X.; Zhao, W.; Pang, J.; Zhang, J. Land Use Zoning Management to Coordinate the Supply-Demand Imbalance of Ecosystem Services: A Case Study in the City Belt Along the Yellow River in Ningxia, China. Front. Environ. Sci. 2022, 10, 911190. [Google Scholar] [CrossRef]
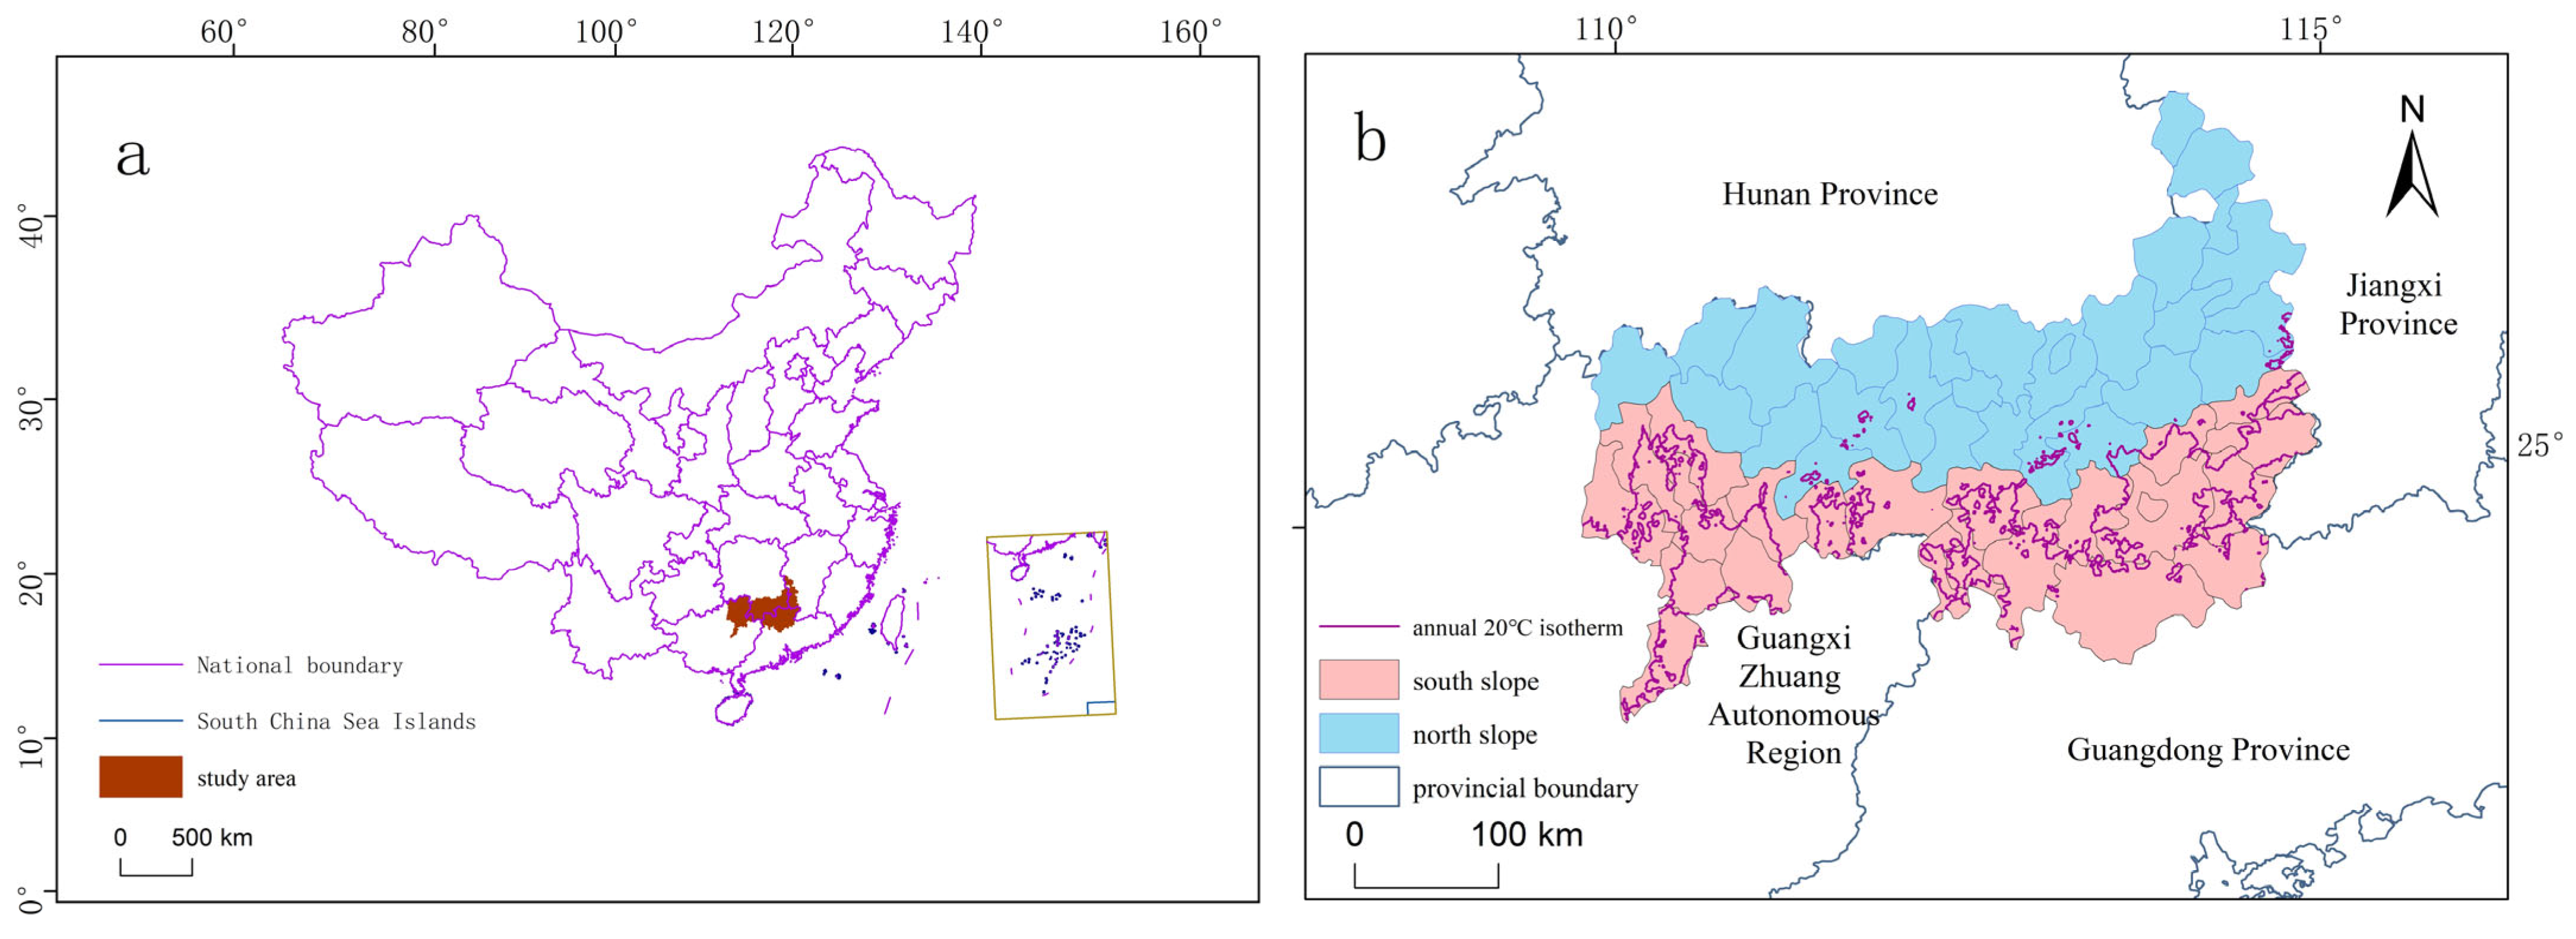
Figure 1. The boundary between the Nanling Mountains’ northern and southern slopes is shown schematically. Note: (a) Overall location of the study area; (b) Division of the study area into northern and southern parts based on the 20 °C annual mean isotherm.
Forests 16 01634 g001
Figure 2. Changes in HQ, Carbon Stock, Water Production Services, and SC from 1990 to 2020.
Forests 16 01634 g002
Figure 3. Spatial-Temporal Trends of ESs from 1990 to 2020.
Forests 16 01634 g003
Figure 4. Relationships Among ESs on the Northern and Southern Slopes of the Nanling Mountains. Note: Spearman correlation coefficients between variables are displayed in the heatmap. Colors are clearly mapped to correlation coefficients in the legend on the right: stronger correlations are shown by increased color saturation, while negative correlations are indicated by blue tones and positive correlations by red tones. White denotes no association.
Forests 16 01634 g004
Figure 5. Changes in Trade-offs/Synergies Between ESs at Grid and County Scales, 1990–2020. Note: (a) Grid-scale, 1990; (b) Grid-scale, 2000; (c) Grid-scale, 2010; (d) Grid-scale, 2020; (e) County-scale, 1990; (f) County-scale, 2000; (g) County-scale, 2010; (h) County-scale, 2020. The heatmap illustrates trade-offs/synergies among variables. The legend on the right clearly maps colors to trade-off/synergy relationships: blue tones indicate trade-offs, red tones indicate synergies, and higher color saturation signifies stronger trade-offs/synergies.
Forests 16 01634 g005
Figure 6. Changes in the Importance of Driving Factors for Trade-offs/Synergies in ESs. Note: GDP: Gross Domestic Product; TEMP: Temperature; POP: Population; NDVI: Normalized Difference Vegetation Index; PREC: Precipitation; LU: Land Use; BIO: Biodiversity. (a) CS-HQ, 1990; (b) CS-HQ, 2000; (c) CS-HQ, 2010; (d) CS-HQ, 2020; (e) CS-SC, 1990; (f) CS-SC, 2000; (g) CS-SC, 2010; (h) CS-SC, 2020; (i) CS-WY, 1990; (j) CS-WY, 2000; (k) CS-WY, 2010; (l) CS-WY, 2020; (m) HQ-SC, 1990; (n) HQ-SC, 2000; (o) HQ-SC, 2010; (p) HQ-SC, 2020; (q) HQ-WY, 1990; (r) HQ-WY, 2000; (s) HQ-WY, 2010; (t) HQ-WY, 2020; (u) SC-WY, 1990; (v) SC-WY, 2000; (w) SC-WY, 2010; (x) SC-WY, 2020.
Forests 16 01634 g006
Figure 7. Land Use Changes on the Northern and Southern Slopes of the Nanling Mountains, 1990–2020.
Forests 16 01634 g007
Table 1. Data sources.
Data TypeFormatResolutionData Source
Monthly precipitation,
monthly potential evapotranspiration,
monthly temperature
NETCDF1 kmNational Glacier, Permafrost, and Desert Scientific Data Center
(https://www.ncdc.ac.cn/, accessed on 10 May 2025)
Root depthTIFF100 mNational Qinghai–Tibet Plateau Scientific Data Center (http://data.tpdc.ac.cn, accessed on 10 May 2025)
LUCCTIFF30 mCenter for Resource and Environmental Science and Data, Chinese Academy of Sciences
(https://www.resdc.cn/, accessed on 10 May 2025)
Basin Boundary Center for Resource and Environmental Science and Data, Chinese Academy of Sciences
(https://www.resdc.cn/, accessed on 10 May 2025)
DEMTIFF30 mSTRM elevation data
(http://srtm.csi.cgiar.org/srtmdata/, accessed on 10 May 2025)
PopulationTIFF1 kmCenter for Resource and Environmental Science and Data, Chinese Academy of Sciences
(https://www.resdc.cn/, accessed on 10 May 2025)
NDVITIFF1 kmCenter for Resource and Environmental Science and Data, Chinese Academy of Sciences
(https://www.resdc.cn/, accessed on 10 May 2025)
GDPTIFF1 kmScientific Data (https://www.nature.com/, accessed on 10 May 2025)
Irreplaceability Coefficient of BiodiversityShp1 kmNational Ecological Dataset (accessed on 10 May 2025)
Disclaimer/Publisher’s Note: The statements, opinions and data contained in all publications are solely those of the individual author(s) and contributor(s) and not of MDPI and/or the editor(s). MDPI and/or the editor(s) disclaim responsibility for any injury to people or property resulting from any ideas, methods, instructions or products referred to in the content.