Article

Refining Carbon Balance Estimates of Harvested Wood Products: A Generalizable Tier-3 Production Approach for China

1
State Key Laboratory of Regional and Urban Ecology, Research Center for Eco-Environmental Sciences, Chinese Academy of Sciences, Beijing 100085, China
2
College of Economics and Management, Nanjing Forestry University, Nanjing 210037, China
Forests 2025, 16(10), 1603; https://doi.org/10.3390/f16101603
Submission received: 29 August 2025 / Revised: 12 October 2025 / Accepted: 15 October 2025 / Published: 19 October 2025
(This article belongs to the Section Forest Ecology and Management)

Abstract

The carbon pool of harvested wood products (HWPs) is an essential part of the national greenhouse gas inventory. Developing a Tier-3 method for the Intergovernmental Panel on Climate Change (IPCC) Production Approach (PA) enhances the accuracy of HWP carbon balance assessments and removal estimates. This is crucial as the PA is a mandatory IPCC approach. A major challenge for developing a Tier-3 PA is the absence of an effective way to allocate HWP production to domestic and overseas end uses, precluding the application of Tier-3 PA in most countries in the world. Here, we integrated the Eora multi-regional input–output (MRIO) model, which effectively allocates HWPs to these end uses into the PA to create a generalizable Tier-3 PA. Using China-produced HWPs from 1990 to 2020 as a case study, we report that these HWPs accumulated a carbon stock of 3376 MtCO2e by 2020 and provided a carbon sink of 221 MtCO2e yr−1 from 2016 to 2020. Construction, furniture, other solid HWPs, sanitary and household paper, and other paper products accumulated 1244, 226, 1032, 0, and 189 MtCO2e, respectively. China’s trade partners consumed 14% of China-produced HWPs and contributed to 13% of the total carbon stock and 15% of the total carbon sink. The generalizable Tier-3 PA is applicable for countries with limited end-use data, and thus enhances their HWP carbon removal estimates. Our first-ever comprehensive PA-based assessment of overseas HWP consumption and carbon removal supports IPCC methodological improvement and future HWP-related international negotiations and mitigation actions.

1. Introduction

Harvested wood products (HWPs) can contribute to either carbon removal [1,2,3,4,5] or carbon source [6,7] depending on whether they are sustainably produced and used or not. Therefore, as an essential part of forest management, HWPs have been required to be a carbon pool reported in national greenhouse gas inventory since 2011 [8]. The Intergovernmental Panel on Climate Change (IPCC) provided four approaches [9,10,11], namely the Simple Decay Approach (SDA), Production Approach (PA), Stock-Change Approach (SCA), and Atmospheric Flow Approach (AFA) for countries to assess their HWP carbon removals or emissions (see Figure 1 for their accounting scopes). Generally, PA and SCA were more widely used in HWP carbon balance assessment [12,13]. For each approach, the IPCC recommends the use of the Tier-3 method [9,10,11] in which HWPs are divided into specific end uses (construction materials, furniture, etc.). This method is more accurate than the default Tier-2 method in which HWP end uses are defined as semi-finished HWP (sawnwood, wood-based panels, etc.) consumption [12]. Developing a generalizable Tier-3 method for PA (Tier-3 PA) is especially significant because PA is a mandatory approach, even though IPCC also allows countries to use other approaches to assess HWP carbon balance and removals [11].
The PA is a timber-harvesting country-based accounting scheme, in which the fate of HWPs produced from a reporting country’s wood harvests should be assessed. Therefore, a Tier-3 PA should theoretically allocate the end uses of these HWPs (i.e., semi-finished HWPs) regardless of whether they are produced domestically or overseas (Figure 1). However, the HWPs produced from domestic harvests but manufactured overseas overall represent an insignificant issue in PA-based accounting, despite this is being a common research gap [12]. This is because global industrial roundwood exports only account for 7% of production [14], which is much lower than the export share of HWPs (~27%) [14,15]. For the limited industrial roundwood exports, a reporting country can choose to assume that this roundwood has the same fate of that consumed domestically, [1,9,16,17,18,19,20] or even exclude this roundwood from the accounting scope [2,10,11,21,22], as recommended by existing studies and the IPCC.
Existing national Tier-3 PA-based assessments often use statistical or survey data to allocate domestically produced HWPs to domestic end uses [12]. However, these data are often available in only a few countries [18,19,23,24,25,26] due to the large cost of statistics and surveys, hindering the use of Tier-3 PA in most countries in the world. More importantly, existing Tier-3 PA has large gap in terms of allocating domestically produced HWPs to overseas end-users. This is a common challenge, as collecting data on the fate of exported HWPs is more difficult than collecting data on those consumed domestically. Only a few country-specific studies, e.g., for Canada [1,23] and New Zealand [27], have allocated these HWPs to the end uses of their major trade partners (e.g., the United States and China). Without sufficient data on end uses of exported HWPs, the carbon accounting of end-of-life disposal was also highly uncertain. The latest PA in the IPCC guidelines even recommends to exclude the exported HWPs from the accounting scope, which is referred to as Production Approach Domestic Consumption (PA-DC) [11]. A previous study has demonstrated that there is a large gap in carbon removal between the sum of country-level PA-DC-based estimates and global PA-based estimates [22].
Using a multi-regional input–output (MRIO) model is an effective way to distribute domestic and overseas end uses of a product when direct data are unavailable [28]. For example, our previous two studies used the Eora MRIO model to allocate HWP end uses in global [29] and China-specific [15] cases. By doing this, we then used Tier-3 SCA to account for global HWP carbon in end-use stage [18] and used an innovative Trade-Linked Approach (TLA) to assess the whole life cycle carbon balance of China-made HWPs [15]. Despite the fact that these are the only studies integrating the MRIO model into HWP carbon accounting, none of them have established a generalizable Tier-3 PA integrated with an MRIO model. Additionally, compared to PA, it is more difficult to integrate the MRIO model into SCA, an HWP-consuming country-based approach [18]. This is because such an SCA requires allocating all the trade partner’s HWP production to the reporting country’s end uses (Figure 1).
In this study, we developed a generalizable Tier-3 PA by incorporating the Eora MRIO model which consists of MRIO tables covering most comprehensive industrial sectors and the longest time span [30,31,32]. We then used the developed approach to assess the life cycle biogenic carbon balance of the HWPs produced by mainland China (referred to as China hereinafter) from 1990 to 2020 as a case study.

2. Materials and Methods

2.1. China-Specific Analytical Framework of Tier-3 Production Approach

2.1.1. Overall Analytical Framework

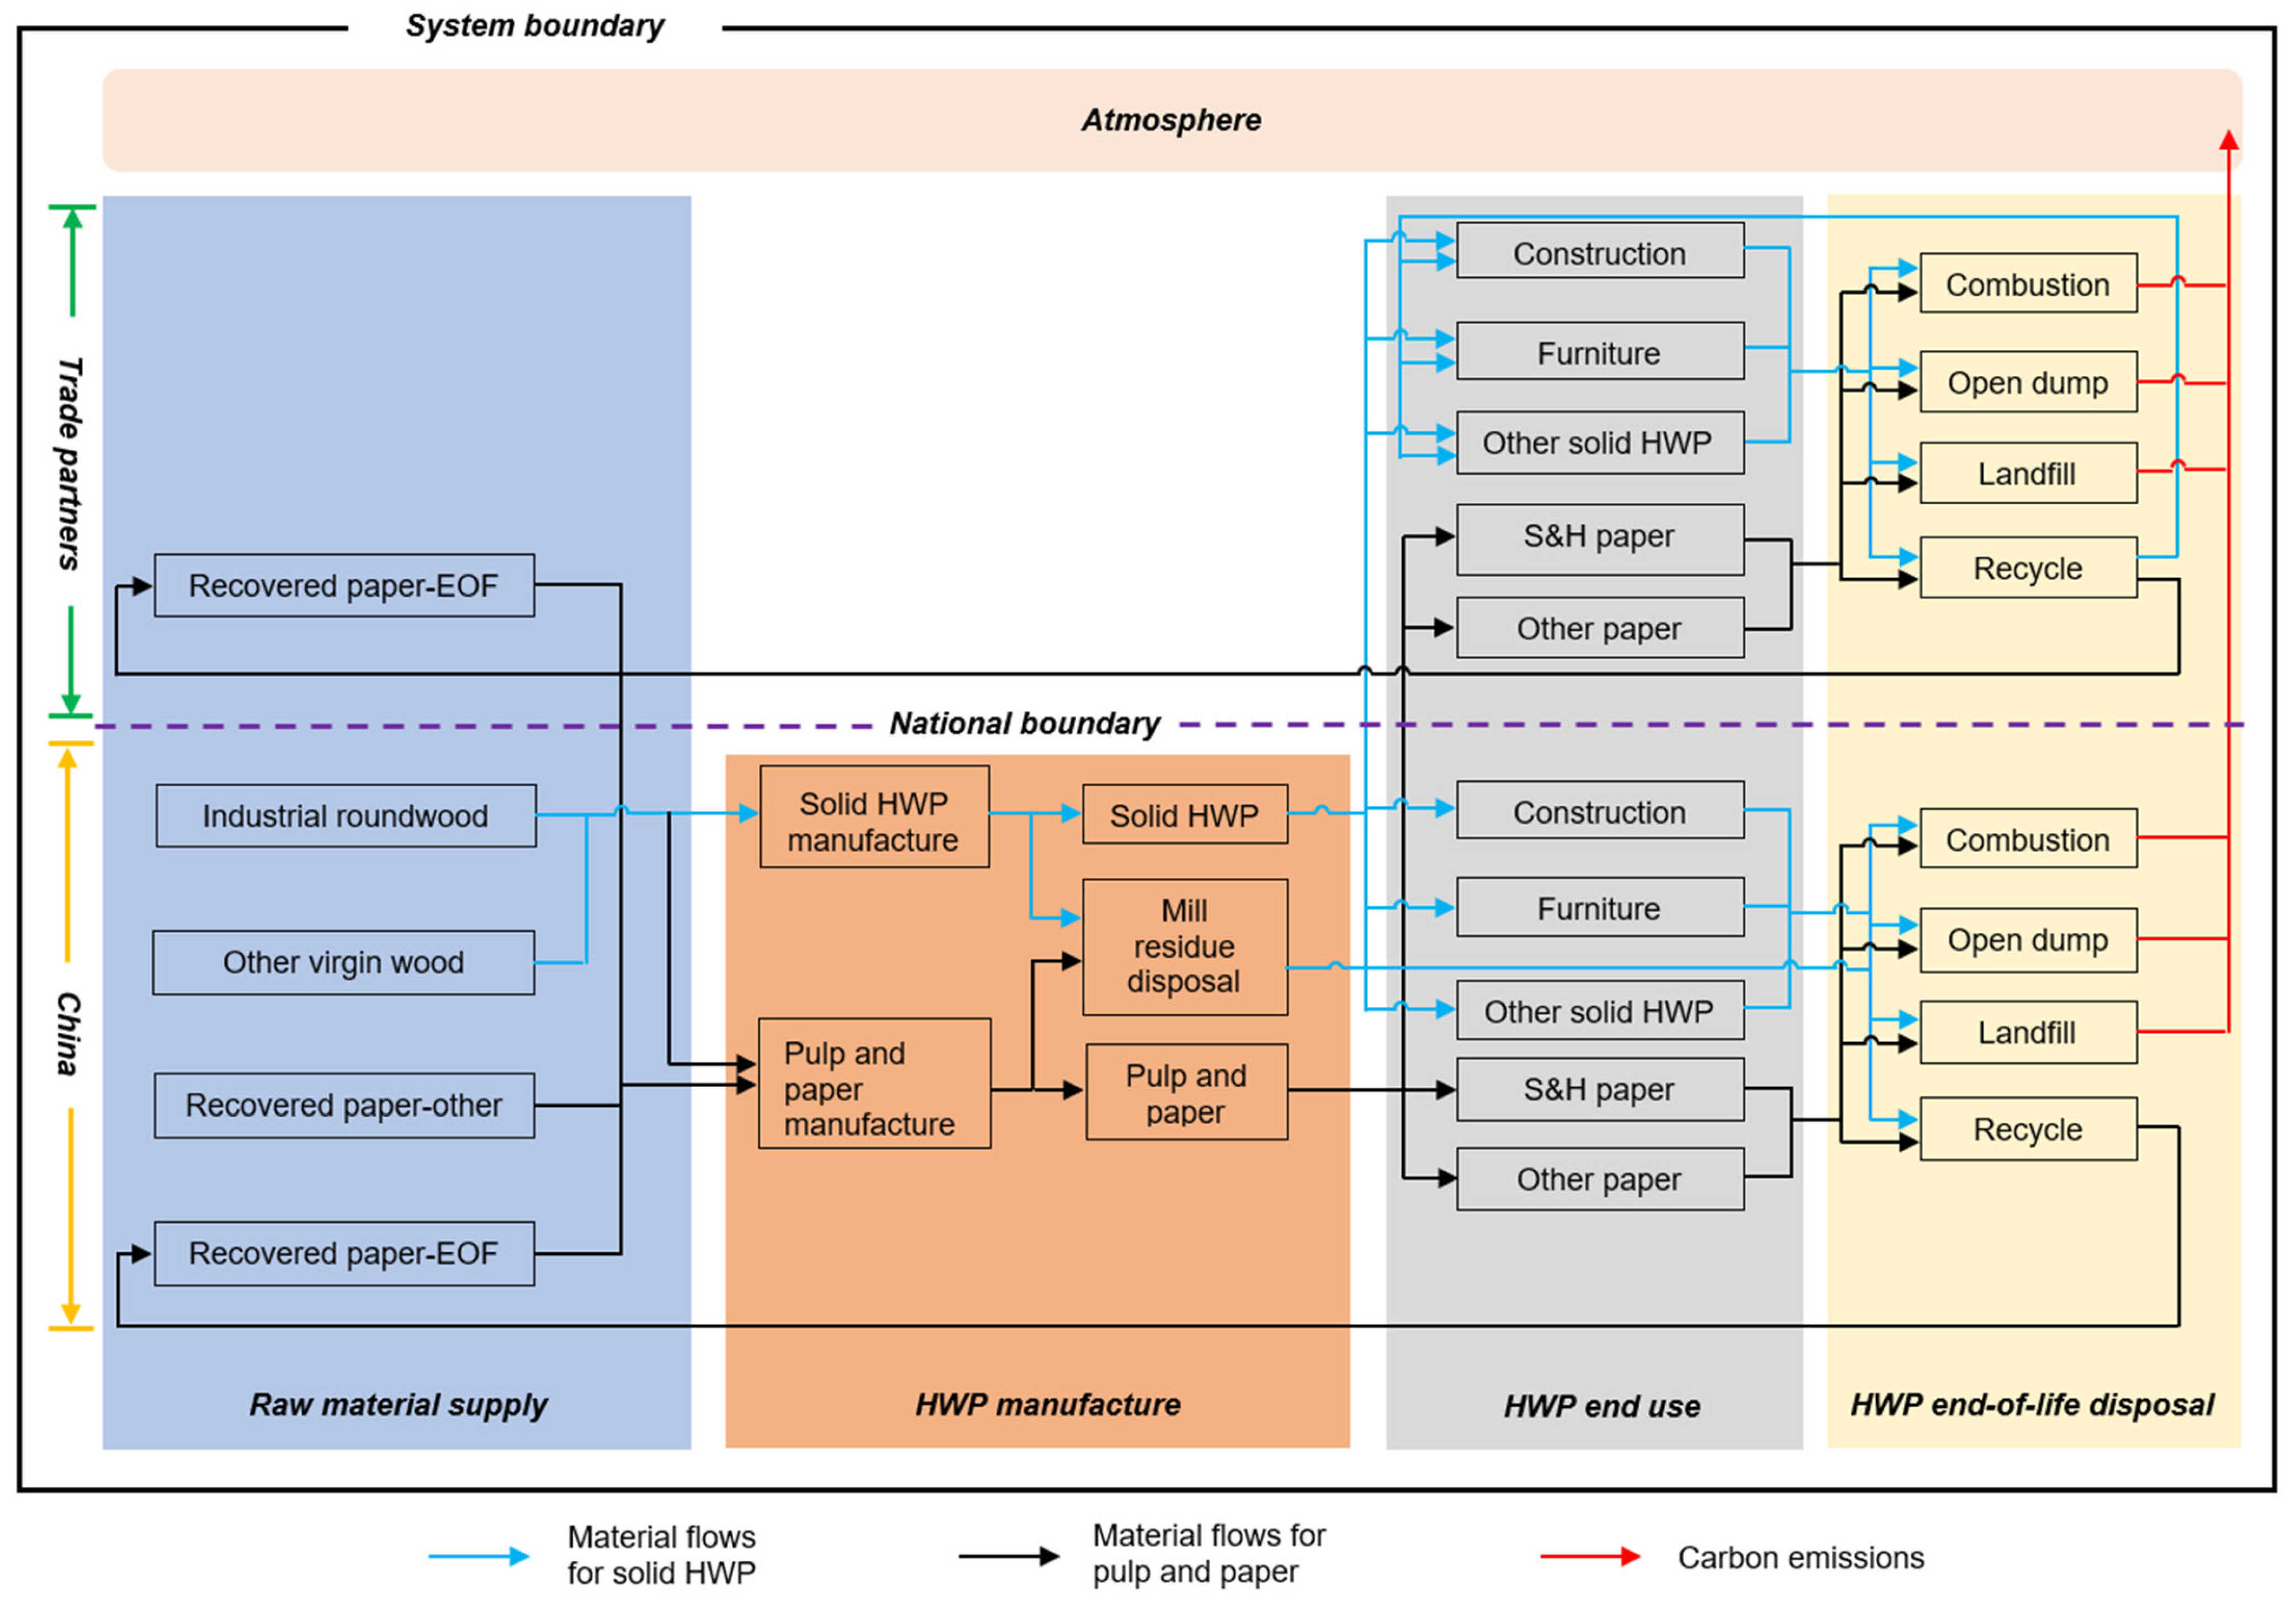
The life cycle of China-produced HWPs consists of 4 stages, namely raw material supply, HWP manufacture, HWP end use, and HWP end-of-life disposal (Figure 2). The biogenic carbon contained in the raw materials flows alongside the life cycle. Some of the biogenic carbon accumulates in end uses and solid waste disposal sites, while the rest is emitted back into the atmosphere during the end-of-life disposal.

2.1.2. Raw Material Supply

In theory, PA-based raw materials include only industrial roundwood. In reality, however, HWPs are often made from recycled products, e.g., recovered paper. Recovered paper is the major feedstock for China’s pulp and paper industry [14,15,33] and therefore was included in our study. Note that we only included recovered paper that originated from domestic harvests, which is done by multiplying a “domestic harvest fraction” described in Section 2.1.3. Some of the paper was produced and collected in the end-of-life disposal in the study period, which was named “Recovered paper—EOF” and should be excluded from the carbon input to the assessment system. The rest of the recovered paper was named “Recovered paper—other”, originated from China’s paper production prior to the study period. Obviously, “Recovered paper—other” should be included as the carbon input to the assessment system. When the study period is long enough (e.g., from 1900 to present), the “Recovered paper—other” should also be excluded from the carbon input to the assessment system.
In addition to recovered paper production, China-produced industrial roundwood and other virgin wood were also included. The “other virgin wood” includes logging residues and wood harvests (e.g., scatter trees) that were not included in the statistics, with its estimation method detailed in our previous studies [15,34].

2.1.3. Harvested Wood Product Manufacture

All the above-mentioned raw materials are processed as HWPs including solid HWPs, as well as pulp and paper products. Solid HWPs include sawnwood and wood-based panels, with the latter consisting of plywood, fiberboard (hardboard, medium-density fiberboard, and insulating board/other board), particleboard, and oriented strand board. Pulp and paper can be present as either pulp production (including recovered paper pulp) or paper production [11,15,23]. Here, we used pulp production because the production of paper and paper products consist of those made from imported wood pulp and recovered paper, adding additional uncertainties when excluding these products not originating from domestic harvests.
The HWP production in this study included only products originating from domestic wood harvests, which was calculated by the HWP production multiplied by a “domestic harvest fraction”. The domestic harvest fraction varies by IPCC guidelines. In 2006, the IPCC suggested that this fraction was equal to the share of domestic industrial roundwood production in total virgin wood consumption [9]. In 2014, the IPCC added an additional domestic wood pulp production fraction when estimating the paper products from domestic harvests, and excluded HWPs made from exported industrial roundwood [10]. In 2019, the IPCC further added domestic recovered paper utilization fraction for estimating paper products from domestic harvests [11]. Moreover, this IPCC guideline also allowed countries to exclude exported HWPs when data were insufficient to assess their fate, which is often referred to as the previously mentioned PA-DC approach [11]. We calculated the domestic harvest fraction following the 2006 IPCC guideline, because it matches best with the principle of PA. For comparison, the domestic harvest fractions in the other two IPCC guidelines add great complexity and uncertainty when maintaining the material balance of the HWP life cycle. Note that, in addition to wood chips and industrial roundwood, our virgin wood consumption used to calculate the domestic harvest fraction also included “other virgin wood”, a type of China-specific raw materials mentioned in Section 2.1.2.
The mill residues are estimated as the carbon contained in the feedstocks’ input to the manufacture minus the carbon contained in the output HWPs. According to China’s statistic data [33], we assumed that 1 m3 of virgin wood can be used to produce 0.25 tonnes of dry pulp. China’s statistics also reported that very limited (~5%) wood fiber was lost in the paper manufacture from wood pulp and recovered paper [33]. To simplify the calculation, we therefore assumed that there is no wood fiber loss in the manufacturing process, which is also in line with existing studies [1,19,20,25,35,36]. After estimating the virgin wood input to produce wood pulp, the remaining part of the virgin wood was assumed to produce solid HWPs. The industrial roundwood production and carbon fractions are reported under bark in FAOSTAT [37] and IPCC [9,10,11], and thus the bark loss during the manufacturing process does not need to be considered in the present study.

2.1.4. Harvested Wood Product End Use

Based on the industrial sector classifications of the Eora MRIO table, we divided HWP end uses as construction materials, furniture, other uses of solid HWPs, sanitary and household paper, and other paper products [15,29]. Apart from sanitary and household paper which was assumed to have a zero-year service life, all these end uses can accumulate carbon depending on their service lives.

2.1.5. Harvested Wood Product End-of-Life Disposal

The retired HWPs can be either recycled or disposed of at solid waste disposal sites including combustion, open dumps, or landfills. Mill residues can be disposed of by combustion, in stockpiles, or in industrial landfills. Combusted HWPs and mill residues release biogenic carbon back into the atmosphere. The decomposition of HWPs and mill residues in open dumps (or stockpiles) and landfills generates carbon dioxide (CO2) and methane (CH4). Methane has a 28-fold greater global warming potential compared to CO2 across the 100-year span [38]. The undecomposed HWPs and mill residues retain carbon in the end-of-life stage. Note that the biogenic carbon stocks and emissions in our study considered 28-fold greater global warming potential of CH4, and thus were present in the unit of CO2 equivalents (CO2e) unless otherwise specified.

2.2. Using Eora Multi-Regional Input–Output Model to Allocate Harvested Wood Product End Uses

2.2.1. Linking Harvested Wood Product (HWP) Production and Consumption by an HWP-Extended Multi-Regional Input–Output Table

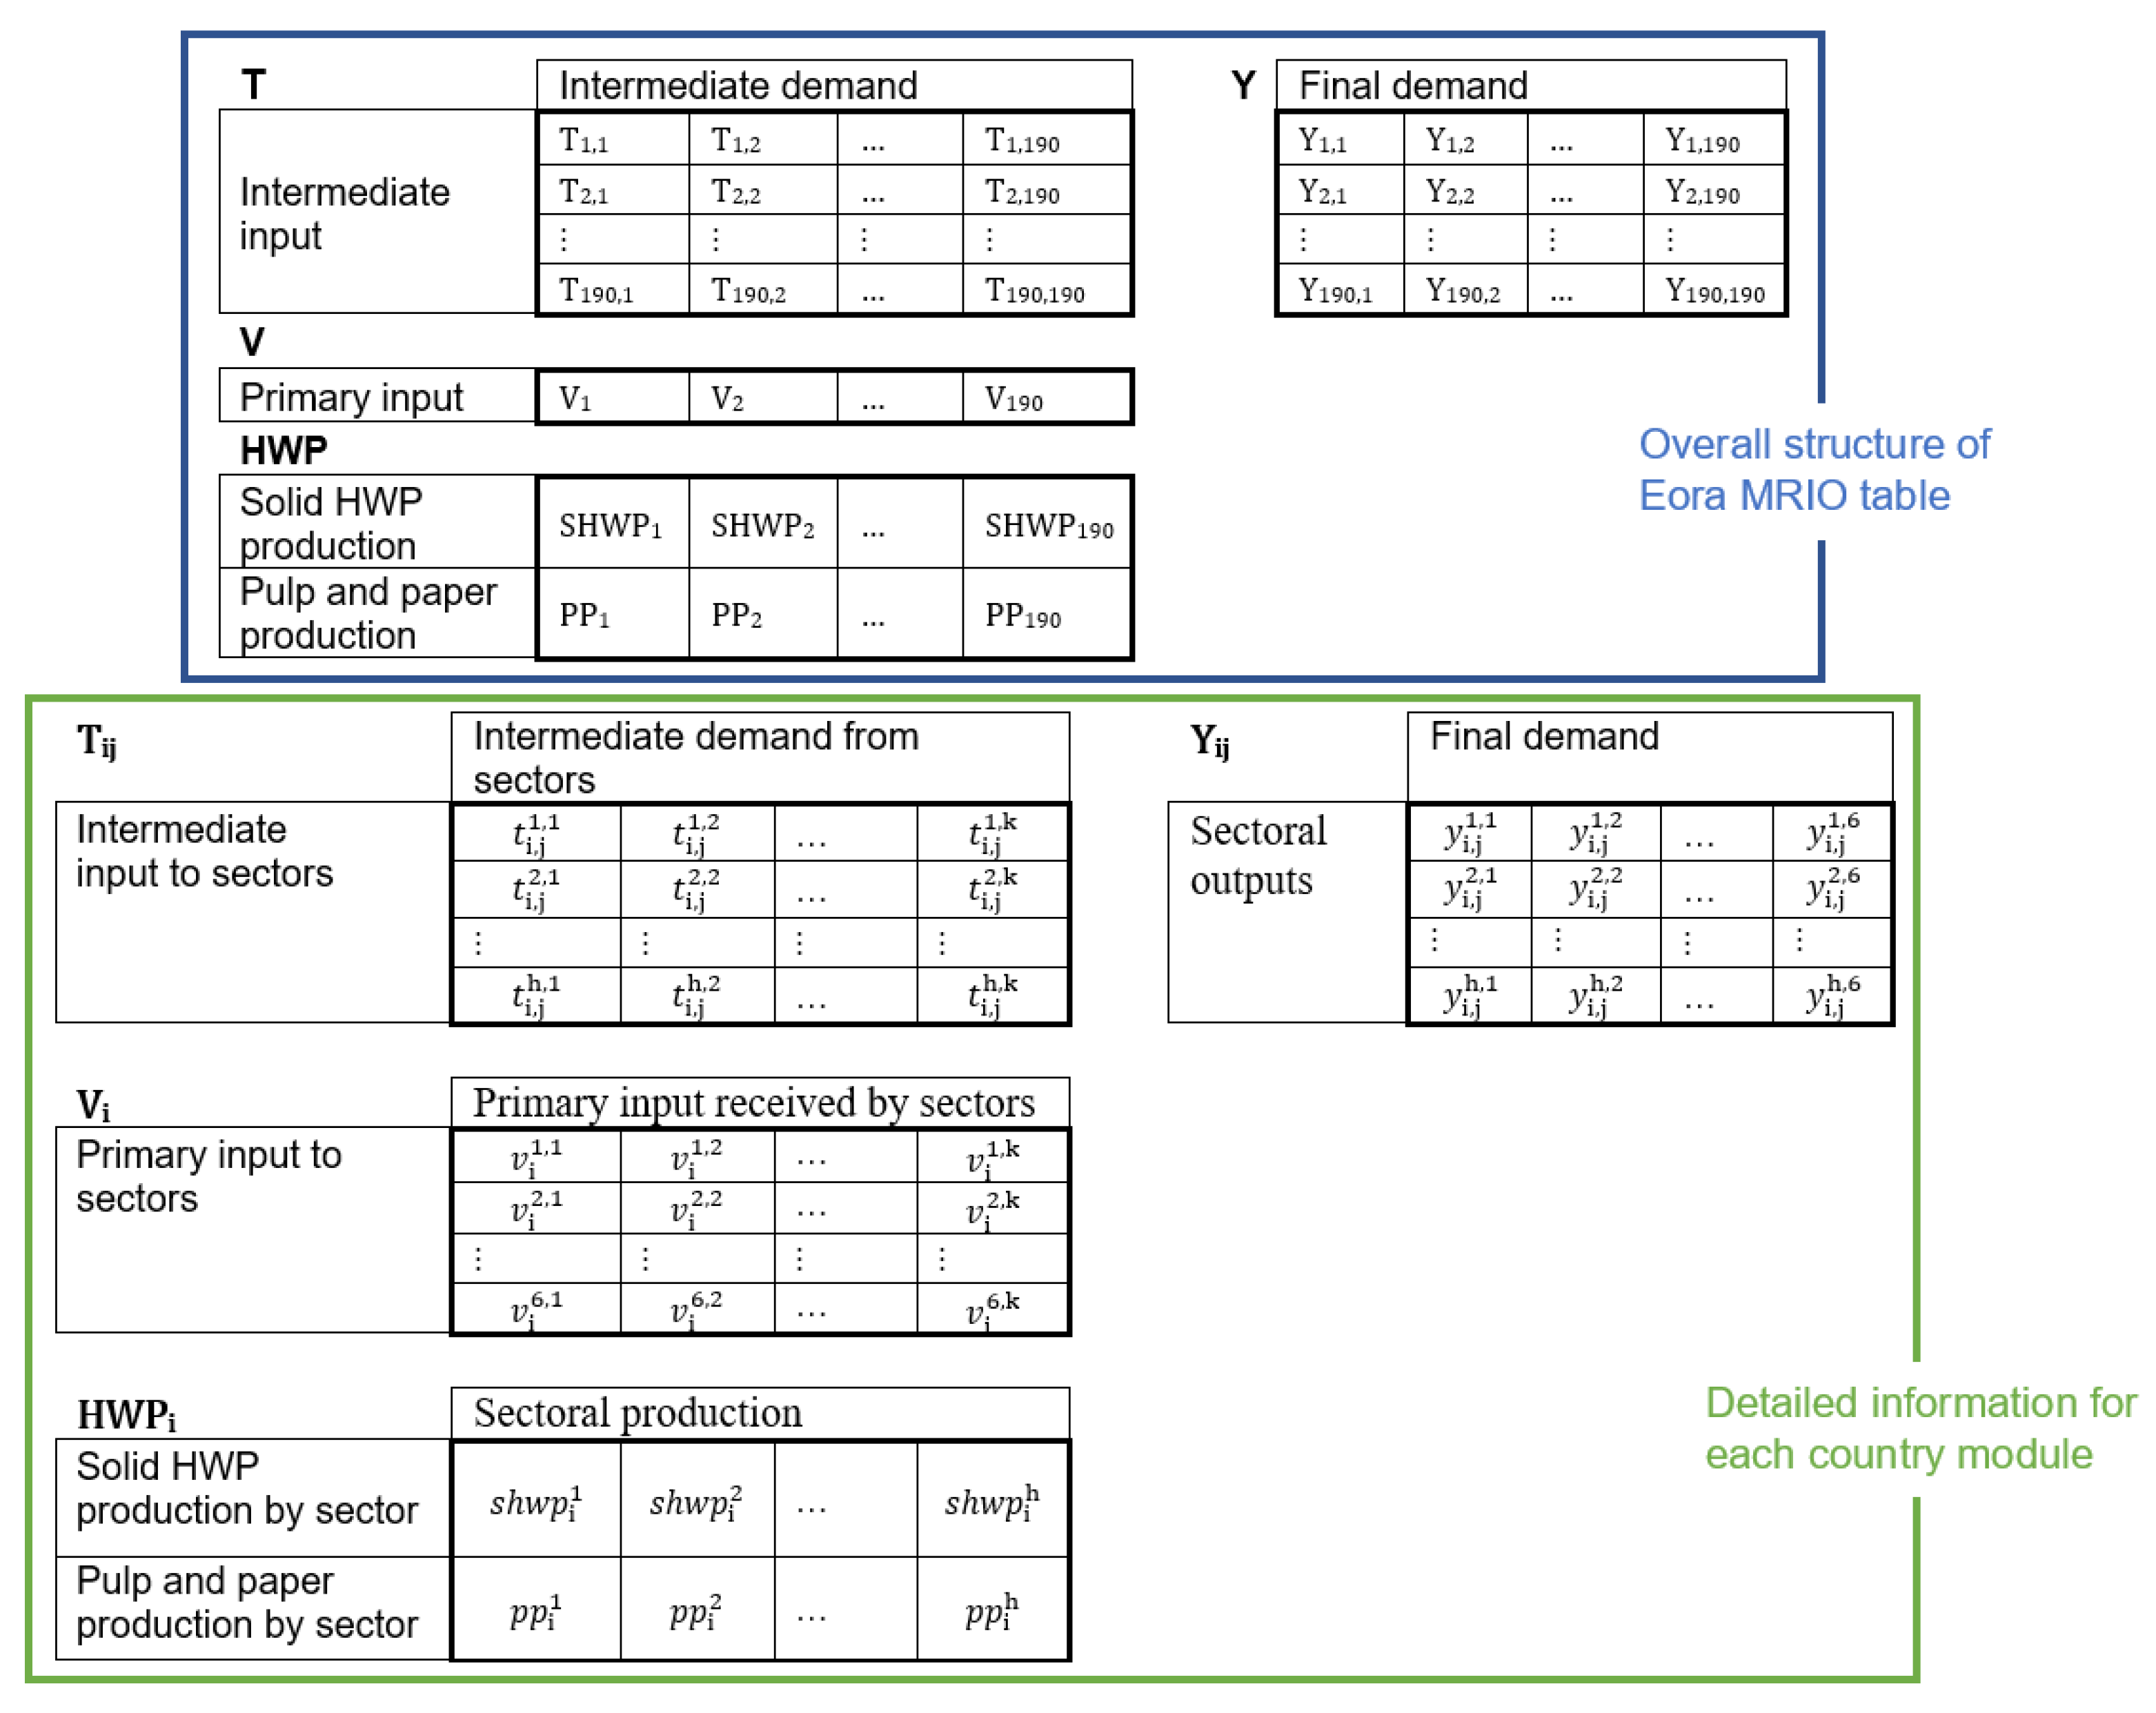
The Eora MRIO table describes monetary linkages between sectors by three blocks (Figure 3), namely the intermediate demand block (block T), final demand block (block Y), and primary input block (block V). The block T, a 14,839 × 14,839 matrix, describes transactions between industrial sectors (e.g., agriculture, solid HWP producing sector, construction sector, steal producing sector, banking sector). The elements in each row vector represent output of a sector to another sectors (i.e., products and services of a sector sold to another sectors). Elements in each column vector describe inputs from other sectors to a sector (i.e., products and services from other sectors sold to a sector). The block Y, a 14,839 × 1140 matrix, describes the output of the industrial sectors to the final demand sectors (governmental purchase, household consumption, etc.) of 190 countries. The block V, a 1140 × 14,839 matrix, describes social resources (e.g., the compensation of employees) input to industrial sectors for supporting the daily operation of companies. The block V can also be described as the value added to product manufacture and service provision in the industrial sectors. The Eora MRIO table generally maintains a balance between the total inputs and total outputs for each industrial sector, which is represented as the column sum of blocks T and V equal to the row sum of blocks T and Y.
The Eora MRIO describes HWP transactions in monetary value rather than physical value (e.g., cubic meter, tonne, or carbon mass). The latter can be used to estimate the HWP consumed by each end user. We therefore developed an additional HWP extension block, a 2 × 14,839 matrix, to address this issue [15,29]. The matrix consists of two row vectors reporting solid HWP and pulp and paper production for their corresponding sectors, respectively. Note that the production includes only the HWPs originated from domestic harvests, as elaborated in Section 2.1.3. Obviously, most of the elements in the matrix are zeros. The non-zero values report China’s solid HWP and pulp and paper production, which is the 2531st column (solid HWP producing sector) in the first vector and the 2533rd column (pulp and paper producing sector) in the second vector, respectively.

2.2.2. Modification of Eora Multi-Regional Input–Output Table to Exclude Virtual HWP Consumption

The direct use of the Eora MRIO table to allocate HWP production to end uses likely leads to virtual HWP consumption because not all the monetary transactions between industrial sectors are accompanied by physical HWP delivery [14]. We therefore modified the Eora MRIO table to address this issue. We classified the industrial sectors included in Eora MRIO table into three categories. The first category is the goods-producing sectors that produce, process, and assemble HWPs, with all their transactions accompanied by HWP deliveries. For solid HWPs, these sectors included (1) solid HWP-producing sectors, (2) furniture-producing sectors, (3) building material (e.g., floor, window, prefabricated house, etc.)-producing sectors, (4) vehicle (ship, boat, coach, train carriage, car, etc.) producing sectors, and (5) “other manufacturing industries” representing the sectors not elsewhere classified that also process and assemble HWPs. For pulp and paper, these sectors included (1) pulp- and paper-producing sectors; (2) book- and periodical-producing sectors, (3) stationery-producing sectors, and (4) media- and recording material-producing sectors. The second category is other goods-producing sectors that consume HWPs but likely deliver HWPs to other sectors for only one time. For example, a fruit-producing sector may buy solid HWPs as packaging materials and then deliver the HWPs by selling the packaged fruits to a beverage-producing sector; however, these HWPs are unlikely to be delivered again when the beverage-producing sector sells products to other sectors. The last category is that of the construction and service sectors that act as the final consumers of HWPs and therefore do not likely deliver HWPs to other sectors. For these sectors, international transactions often do not deliver HWPs as well. After classifying sectors, we followed the “end-use transfer” method [39]—or “mask matrix” in other study [40]—to modify the Eora MRIO table. We set all the above-mentioned transactions between industries—where no physical HWPs are delivered—to zero. Then, we added the original values to the domestic final demand for the construction and service sectors, while adding the original values to the domestic and overseas final demand for the goods producing sectors. To maintain the balance between the total input and output of the sectors that process/assemble HWPs, we did not modify the transactions between the goods-producing sectors that process/assemble HWPs and the above-mentioned construction sectors/service sectors/goods-producing sectors. A hypothetical example of MRIO modification can be found in the “Supplementary Data.xlsx” spreadsheet available in the Supporting Information.

2.2.3. Estimating Harvested Wood Products Consumed by End Users

We used the classical Leontief inverse matrix (Equation (1)) to specify the HWP consumed by the end use type as one unit of final demand:
A X + Y = X X A X = Y X = I A 1 × Y ,
where X is a 14,839 × 1 vector with each element representing the total output of (e.g., products produced by) a sector; Y is a 14,839 × 1 vector with each element representing the row sum of the final demand matrix, as described above; A is a 14,839 × 14,839 matrix of coefficients, with each column vector representing the proportions of intermediate input received by a sector that are provided by other sectors to the total inputs (the column sum of the intermediate and primary inputs) received by the sector; and I is an identity matrix (an 14,839 × 14,839 matrix with the diagonal elements set to 1 and all other elements set to 0). Therefore, the matrix A X is equivalent to the matrix of intermediate demand. And thus, A X + Y = X represents the economic balance of the MRIO table; that is, the total demand for a sector’s output, the sum of intermediate and final demand, is equal to the total input, the sum of intermediate and final inputs. Using the matrix transformation illustrated by Equation (1), we can produce the classical Leontief inverse matrix ( I A ) 1 .
However, the classical Leontief inverse matrix is expressed in monetary units [41]. By incorporating the HWP-extension block, we then converted the classical Leontief inverse matrix to a Leontief multiplier (Equation (2)) to estimate the quantity of end-use HWPs (in carbon mass) corresponding to one unit of monetary final demand:
M = H W P e × ( I A ) 1 ,
where M is the Leontief multiplier; and H W P e is the HWP intensity vector, specifying the HWP production (in carbon mass) for each unit of the total monetary output of a sector. The H W P e can be produced for solid HWPs or pulp and paper by dividing the elements in the HWP-extension block by the monetary value of the sectoral total output.
Then, the HWP distribution matrix ( E U ), reporting the national HWP consumption by end-use type, can be estimated by left-multiplying the final demand matrix Y by a diagonalized Leontief multiplier M ^ (Equation (3)). The diagonal elements of M ^ are those of the Leontief multiplier M ( m 1 , m 2 , …, m n ) and all other elements are zeros.
E U = M ^ × Y ; M ^ = m 1 0 0 0 m 2 0 0 0 m n ,
More details of using the HWP-extended Eora MRIO table to estimate the end-use HWP consumption can be found in our previous studies [15,29].

2.3. Estimating Biogenic Carbon Stocks and Emissions in the Life Cycle

2.3.1. Carbon Stocks of In-Use Harvested Wood Products

We estimated in-use HWP carbon stocks by assuming an HWP decay rate (the ratio of HWPs going out of use after consumption) subjected to a Chi-squared decay function [42,43], a single parameter Gama distribution-based decay function [42,43,44,45]. The Chi-squared decay function assumes that most of the HWP decays appear around the half-life, while few HWPs decay at other times [42,43,44,45]. This is a more realistic assumption than that of the exponential decay function-based first-order decay method, as recommended by the IPCC [9,10,11], which assumes the largest HWP decays appear upon consumption.
When using the Chi-squared decay function, for a specific year t + 1 , the cumulative decay ( H W P d e c a y ) of HWPs that were consumed τ + 1 years ago (i.e., t τ is the consumption year) can be estimated as follows:
H W P d e c a y ( t + 1 ) = 0 t E U t τ × G a m m a τ d τ = 0 t E U ( t τ ) × τ ( k 1 ) Γ ( k ) θ k e τ θ d τ ,
where E U is the HWP consumption by a specific end use type in a particular country, which is estimated using the HWP-extended Eora MRIO model. The shape of the Gamma distribution curve, G a m m a τ = τ ( k 1 ) Γ ( k ) θ k e τ θ , is defined by two Gamma parameters, namely the horizonal parameter θ and the vertical parameter k . Previous studies suggest that the Chi-squared distribution, by setting θ to 2, is sufficient to estimate the dynamic decay rate of in-use HWPs [42]. The vertical parameter k can be estimated by assuming the value of the cumulative density function of the Chi-squared distribution to be 0.5 when the HWP half-life is reached.
For a specific HWP end use, the in-use HWP carbon stocks in the year t + 1 were then calculated by deducting the cumulative HWP decay from the carbon of HWP consumption in τ years. The annual carbon stock changes (i.e., carbon sinks) of the in-use HWP in year t is the deference between the cumulative in-use HWP carbon stocks by the years of t + 1 and t .

2.3.2. Carbon Stocks and Emissions of Landfills and Open Dumps (Or Stockpiles)

Landfills may create both anaerobic and aerobic conditions for HWP decomposition that enable carbon storage. Under anaerobic conditions, part of the HWPs never decompose or decompose extremely slowly, resulting in permanent carbon storage. The remaining HWPs, i.e., degradable HWPs, retain carbon during anaerobic decomposition [46]. Under aerobic conditions, HWPs also retain carbon by relatively faster decomposition. China’s municipal landfills create 39% of aerobic conditions and 61% of anaerobic conditions [47]. Under anaerobic conditions, 33% and 24% of wood and paper, respectively, were degradable in China’s municipal landfills [47]. Municipal landfills in China’s trade partners were assumed to be managed landfills, as recommended by the IPCC. Managed landfills provide completely anaerobic conditions where 10% and 50% of the wood and paper, respectively, are degradable [46]. We assumed that industrial landfills create 20% of aerobic conditions and 80% of aerobic conditions for mill residues. Ten percent of the mill residues were assumed to be degradable under anaerobic conditions [46]. As recommended by the IPCC [46], we also assumed that open dumps or stockpiles create completely aerobic decomposition, generating only CO2.
We used the first-order decay method shown in Equation (5) to estimate the carbon stocks of degradable HWPs (or mill residues) under aerobic or anaerobic conditions. To simplify illustration, here we use degradable HWPs under the anaerobic conditions of landfills as an example.
C s t o c k t + 1 = δ e δ k × I n f l o w ( t δ ) ,
where C s t o c k ( t + 1 ) denotes the carbon retained by degradable HWPs under anaerobic condition of landfills in the year t + 1 ; I n f l o w ( t δ ) denotes the newly added HWPs under the anaerobic conditions of landfills in the year t δ ; δ denotes the years since the HWPs were disposed of; and k = ln 2 / H L denotes the constant decomposition rate where H L is the half-life of the decomposition. We assumed a half-life of 29 and 16.5 years for solid HWPs under anaerobic and aerobic conditions, respectively, and 15 and 8.25 years for paper under anaerobic and aerobic conditions, respectively [46]. The decay half-lives for mill residues are assumed to be the same as those of solid HWPs that decompose aerobically, because no specific data are available.
The CO2 emissions of aerobic decomposition can be estimated by deducting carbon stocks from the total carbon input to the decomposition. However, anaerobic decomposition generates CH4, which can offset part of the carbon stocks. The CH4 emission can be estimated as follows.
E m e t h a n e t + 1 = 0.5 × E a n _ l a n d f i l l ( t + 1 ) × 16 12 × 28 × ( 1 M C ) × ( 1 O X ) ,
where E m e t h a n e ( t + 1 ) is the cumulative CH4 emissions by the year t + 1 ; E a n _ l a n d f i l l ( t + 1 ) is the cumulative carbon emissions (in carbon mass) under anaerobic conditions in landfills by the same year; 0.5 represents that half of the carbon emissions of landfill gas is in the form of CH4 [46]; 16/12 is the molecular ration for converting carbon mass to CH4; 28 is the global warming potential of CH4; M C is the fraction of CH4 collected in landfills, which is 0.05 in China [46] and assumed to be 0 in the trade partners; and O X is the CH4 oxidation rate, which is 0.2 in China [47] and assumed to be 0.1 in the trade partners [41], representing the fraction of CH4 that is oxidized when reaching the top layer of landfills.
After being offset by the higher global warming potential of CH4, the net carbon stocks of degradable HWPs in anaerobic conditions in landfills ( N C a n _ l a n d f i l l ) can be then calculated as follows.
N C a n _ l a n d f i l l = C a n _ l a n d f i l l E m e t h a n e 0.5 × E l a n d f i l l × 44 12 × ( 1 M C ) × ( 1 O X ) .

2.4. Sensitivity Analysis

Uncertainty analysis for an input–output analysis using global MRIO tables for multiple decades is a common challenge [40], precluding the uncertainty analysis of our HWP carbon balance estimates. We therefore conducted a one-at-a-time sensitivity analysis to test the potential impacts of major variables and parameters on HWP carbon stock estimates. These variables and parameters were increased by 10% (multiplied by 1.1) in the sensitivity analysis. Some fractions were increased to 1 if they were greater than 0.91. Additionally, we also tested the impacts of HWPs produced from 1900 to 1989 on the carbon stock and sink estimates. This was assessed by assuming that China-produced HWPs grew at a constant rate of 2.194% [9] and that all the parameters (including end-use structure of HWPs) maintained a constant value of 1990.

2.5. Data Source

We downloaded MRIO tables for 1990 to 2020 from the Eora Global Supply Chain Database (available at https://www.worldmrio.com/eora/, accessed on 29 April 2025). To keep data source consistency with Eora MRIO tables, we used raw materials and HWP production data from the FAOSTAT database (available at https://www.fao.org/faostat/en/#data, accessed on 29 April 2025) rather than China’s official statistics. The raw material and HWP trade data (for estimating domestic harvest fraction) were from the UN Comtrade database (available at https://comtradeplus.un.org/, accessed on 29 April 2025). The carbon fraction of each raw material and HWP aligns with IPCC default values [9,10,11]. End-use HWP half-lives and Eora MRIO industrial sectors that included in each HWP end use can be found in our recent study [15]. All the estimates are present in the unit of million tonnes of CO2 equivalents (MtCO2e). Note that, due to rounding, the numbers present in this article may not add up and fractions may not be equal to those estimated using the numbers present in the article.

3. Results

3.1. Overall Material Flows and Carbon Balance of China-Produced Harvested Wood Products

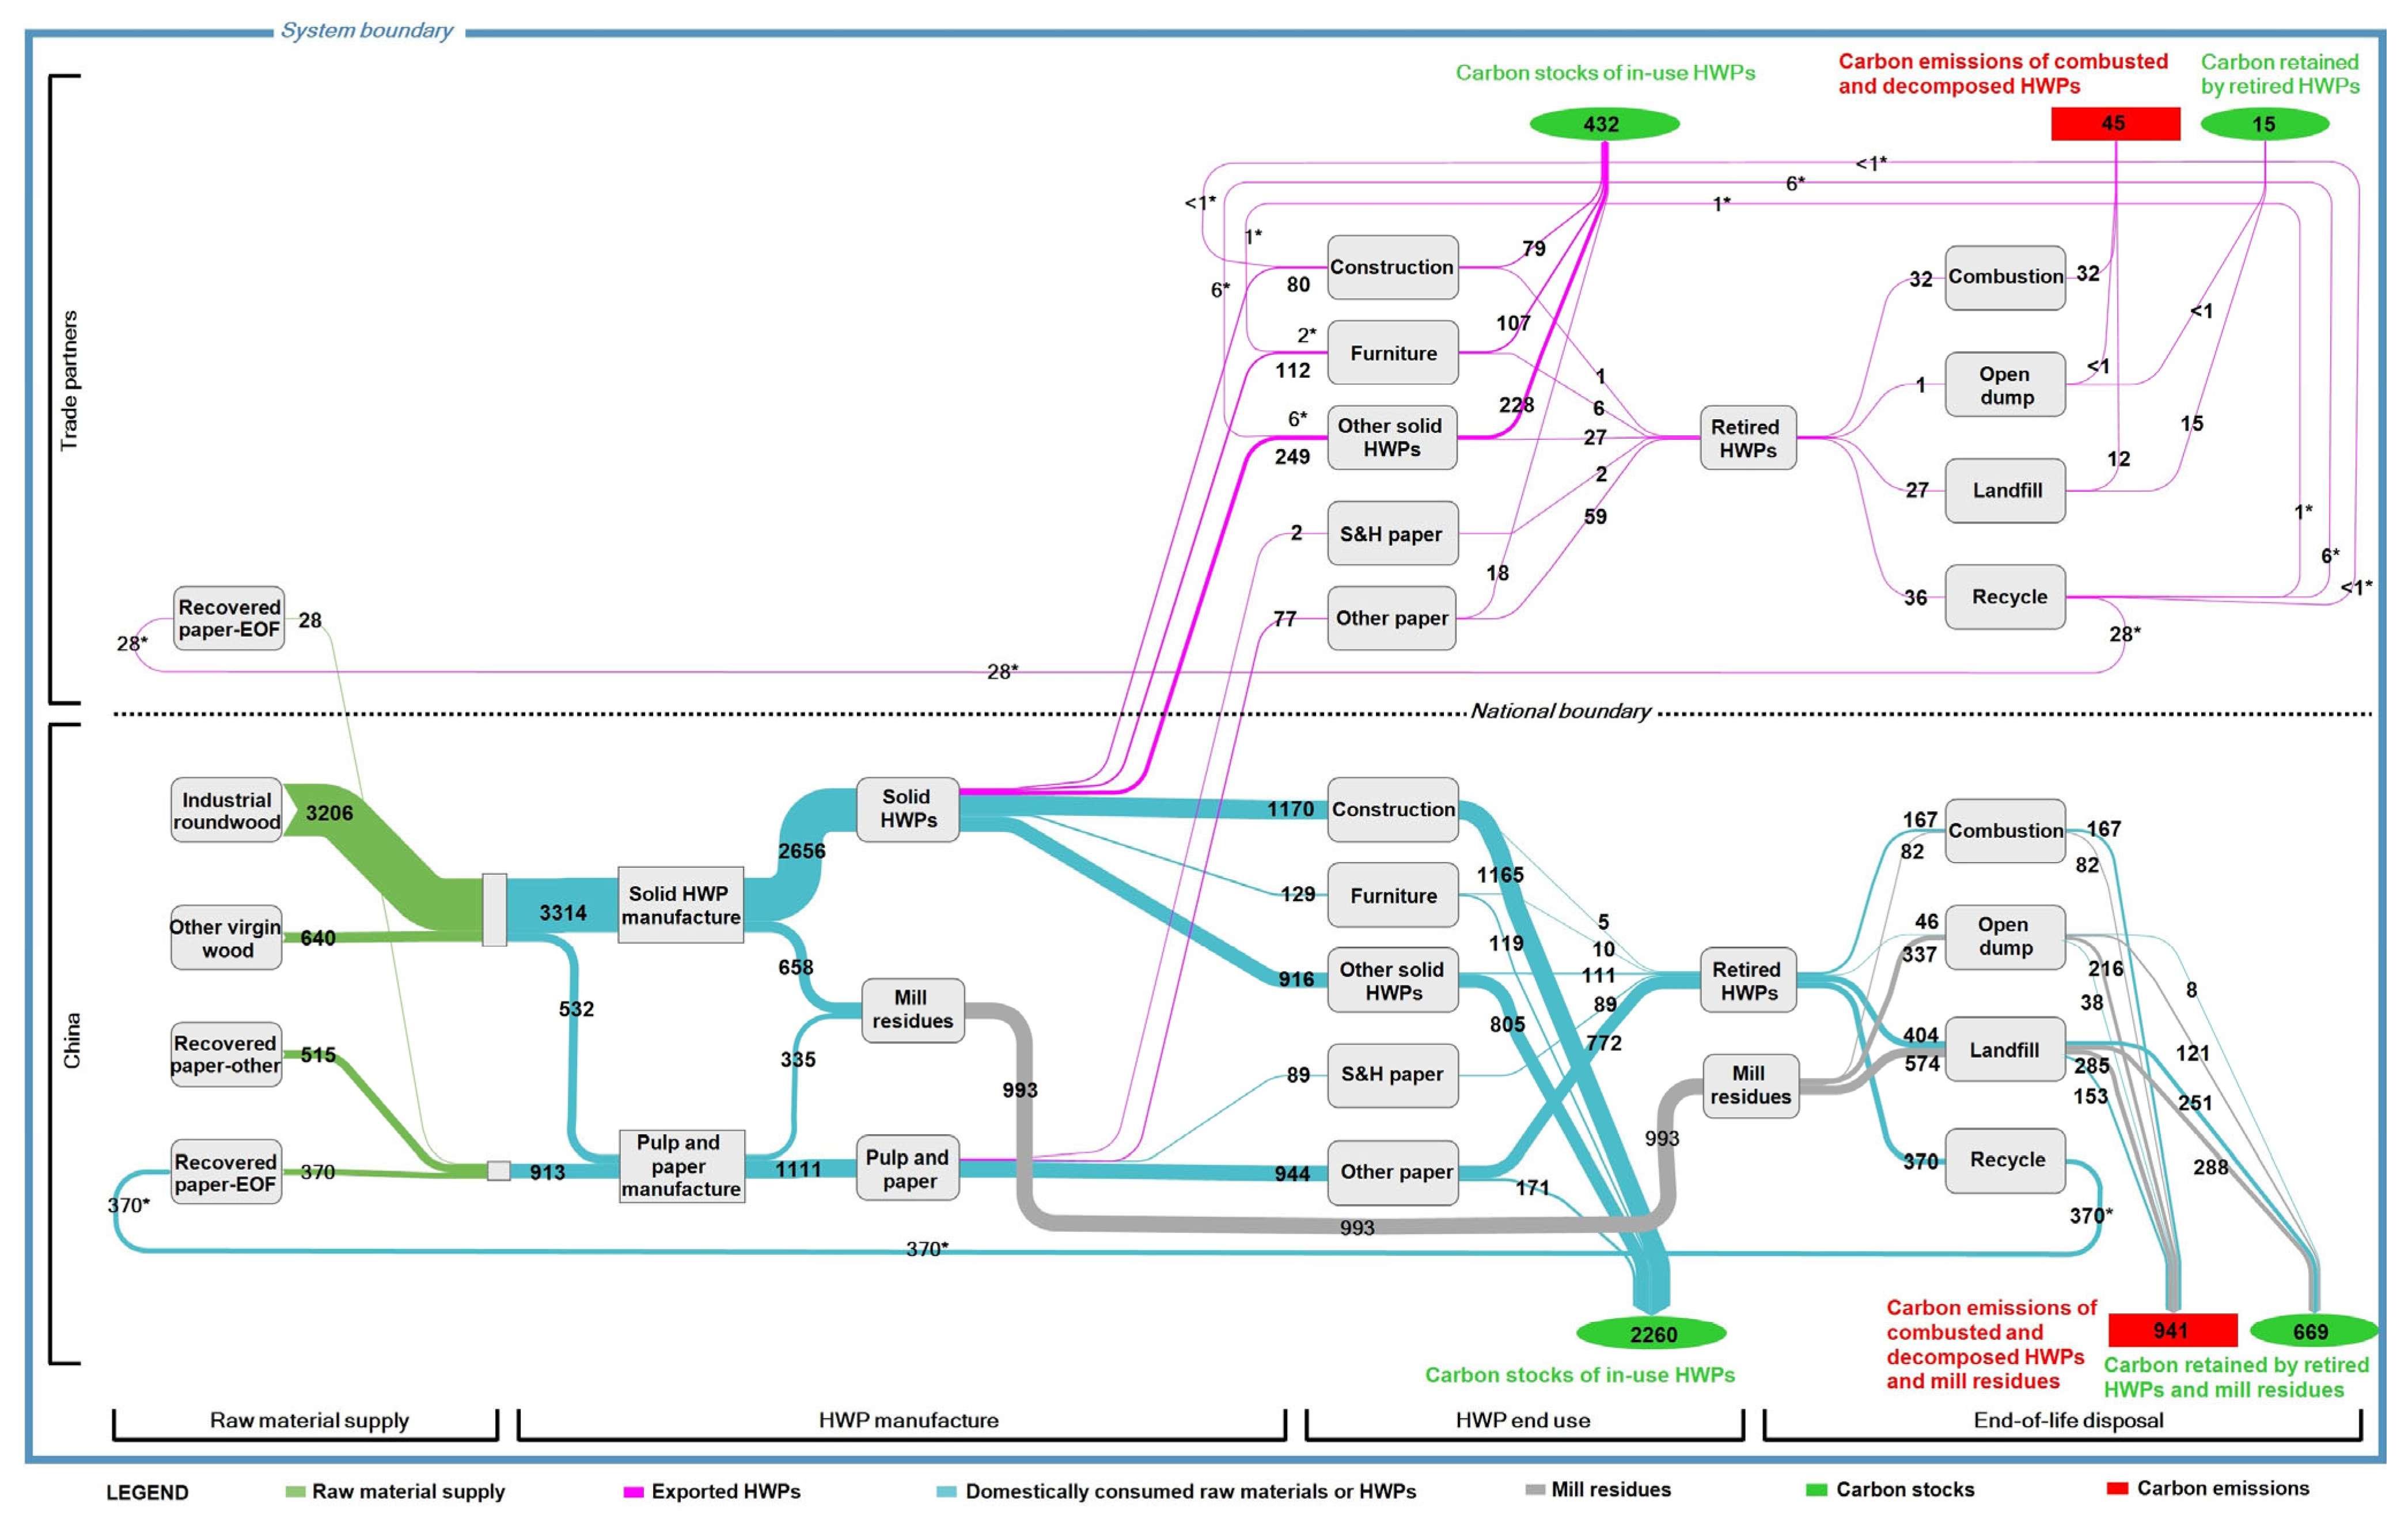
From 1990 to 2020, the total raw materials originated from China’s wood harvests contained 4759 MtCO2e, with 81% as virgin wood and 19% as recovered paper, respectively (Figure 4). The industrial roundwood accounted for the majority (83%) of the virgin wood. Fifty-six percent of the recovered paper was estimated to be originated from the paper production prior to 1990. The remaining part of the recovered paper was estimated to have originated from the paper that was produced in the study period and collected after its service life.
Using these raw materials, China produced HWPs containing 3767 MtCO2e, of which solid HWPs and pulp and paper products accounted for 71% and 29%, respectively (Figure 4). The HWP manufacture generated mill residues containing 993 MtCO2e, with 66% of them from solid HWP manufacture. Overall, the HWP production efficiency was 79% from 1990 to 2020. The relatively high HWP production efficiency resulted from high recovered paper utilization rate (80%) for pulp and paper manufacture and the high ratio (70%) of wood-based panels in solid HWP production. The manufacture of these HWPs has high utilization rate of raw materials.
The produced HWPs were consumed as construction materials (33%), furniture (6%), other solid HWPs (31%), and sanitary and household paper (2%), and the paper products used for other purposes (27%). Of these end-use HWPs, 6%, 47%, 21%, 2%, and 8%, respectively, were consumed by trade-partner s (Figure 4). Overall, 17% (or 441 MtCO2e) of solid HWPs, 7% (or 79 MtCO2e) of paper products, was consumed by trade partners, accounting for 14% (520 MtCO2e) of the total HWPs. Additionally, 8 MtCO2e of exported solid HWPs was reused. During the study period, in-use HWPs retained a carbon stock of 2691 MtCO2e of carbon, while the retired HWPs contained 1083 MtCO2e. The HWPs consumed overseas represented 16% (or 432 MtCO2e) of the carbon stocks (Figure 5). Solid HWPs accounted for the majority (92%) of the in-use HWP carbon stocks (Figure 4). Among the five HWP end uses, construction materials accounted for 46% (or 1244 MtCO2e) of the in-use HWP carbon stocks, followed by “other solid HWPs” (38%, or 1032 MtCO2e), furniture (8%, or 226 MtCO2e), and “other paper” (7%, or 189 MtCO2e) (Figure 4).
Of the total HWPs retired from use, combustion, open dump, and landfills were used to dispose of these HWPs containing 199, 47, and 431 MtCO2e (Figure 4). Additionally, HWPs containing 405 MtCO2e were recycled, the majority (98%) of which were recovered paper. By 2020, retired HWPs retained a carbon stock of 275 MtCO2e (Figure 5). The majority (97%) of this carbon was stored in municipal landfills, especially in China’s municipal landfills (91%) (Figure 4). Combustion, stockpiles, and industrial landfills were used to disposed of 8%, 34%, and 58%, respectively, of mill residues generated (993 MtCO2e) in HWP manufacture. By 2020, these mill residues retained a carbon stock of 410 MtCO2e, with the remaining 583 MtCO2e emitted back to atmosphere (Figure 5). Overall, the end-of-life disposal stage retained a carbon stock of 684 MtCO2e and a carbon emission of 986 MtCO2e, of which 2% of carbon stock and 5% of carbon emission were distributed in China’s trade partners (Figure 4).
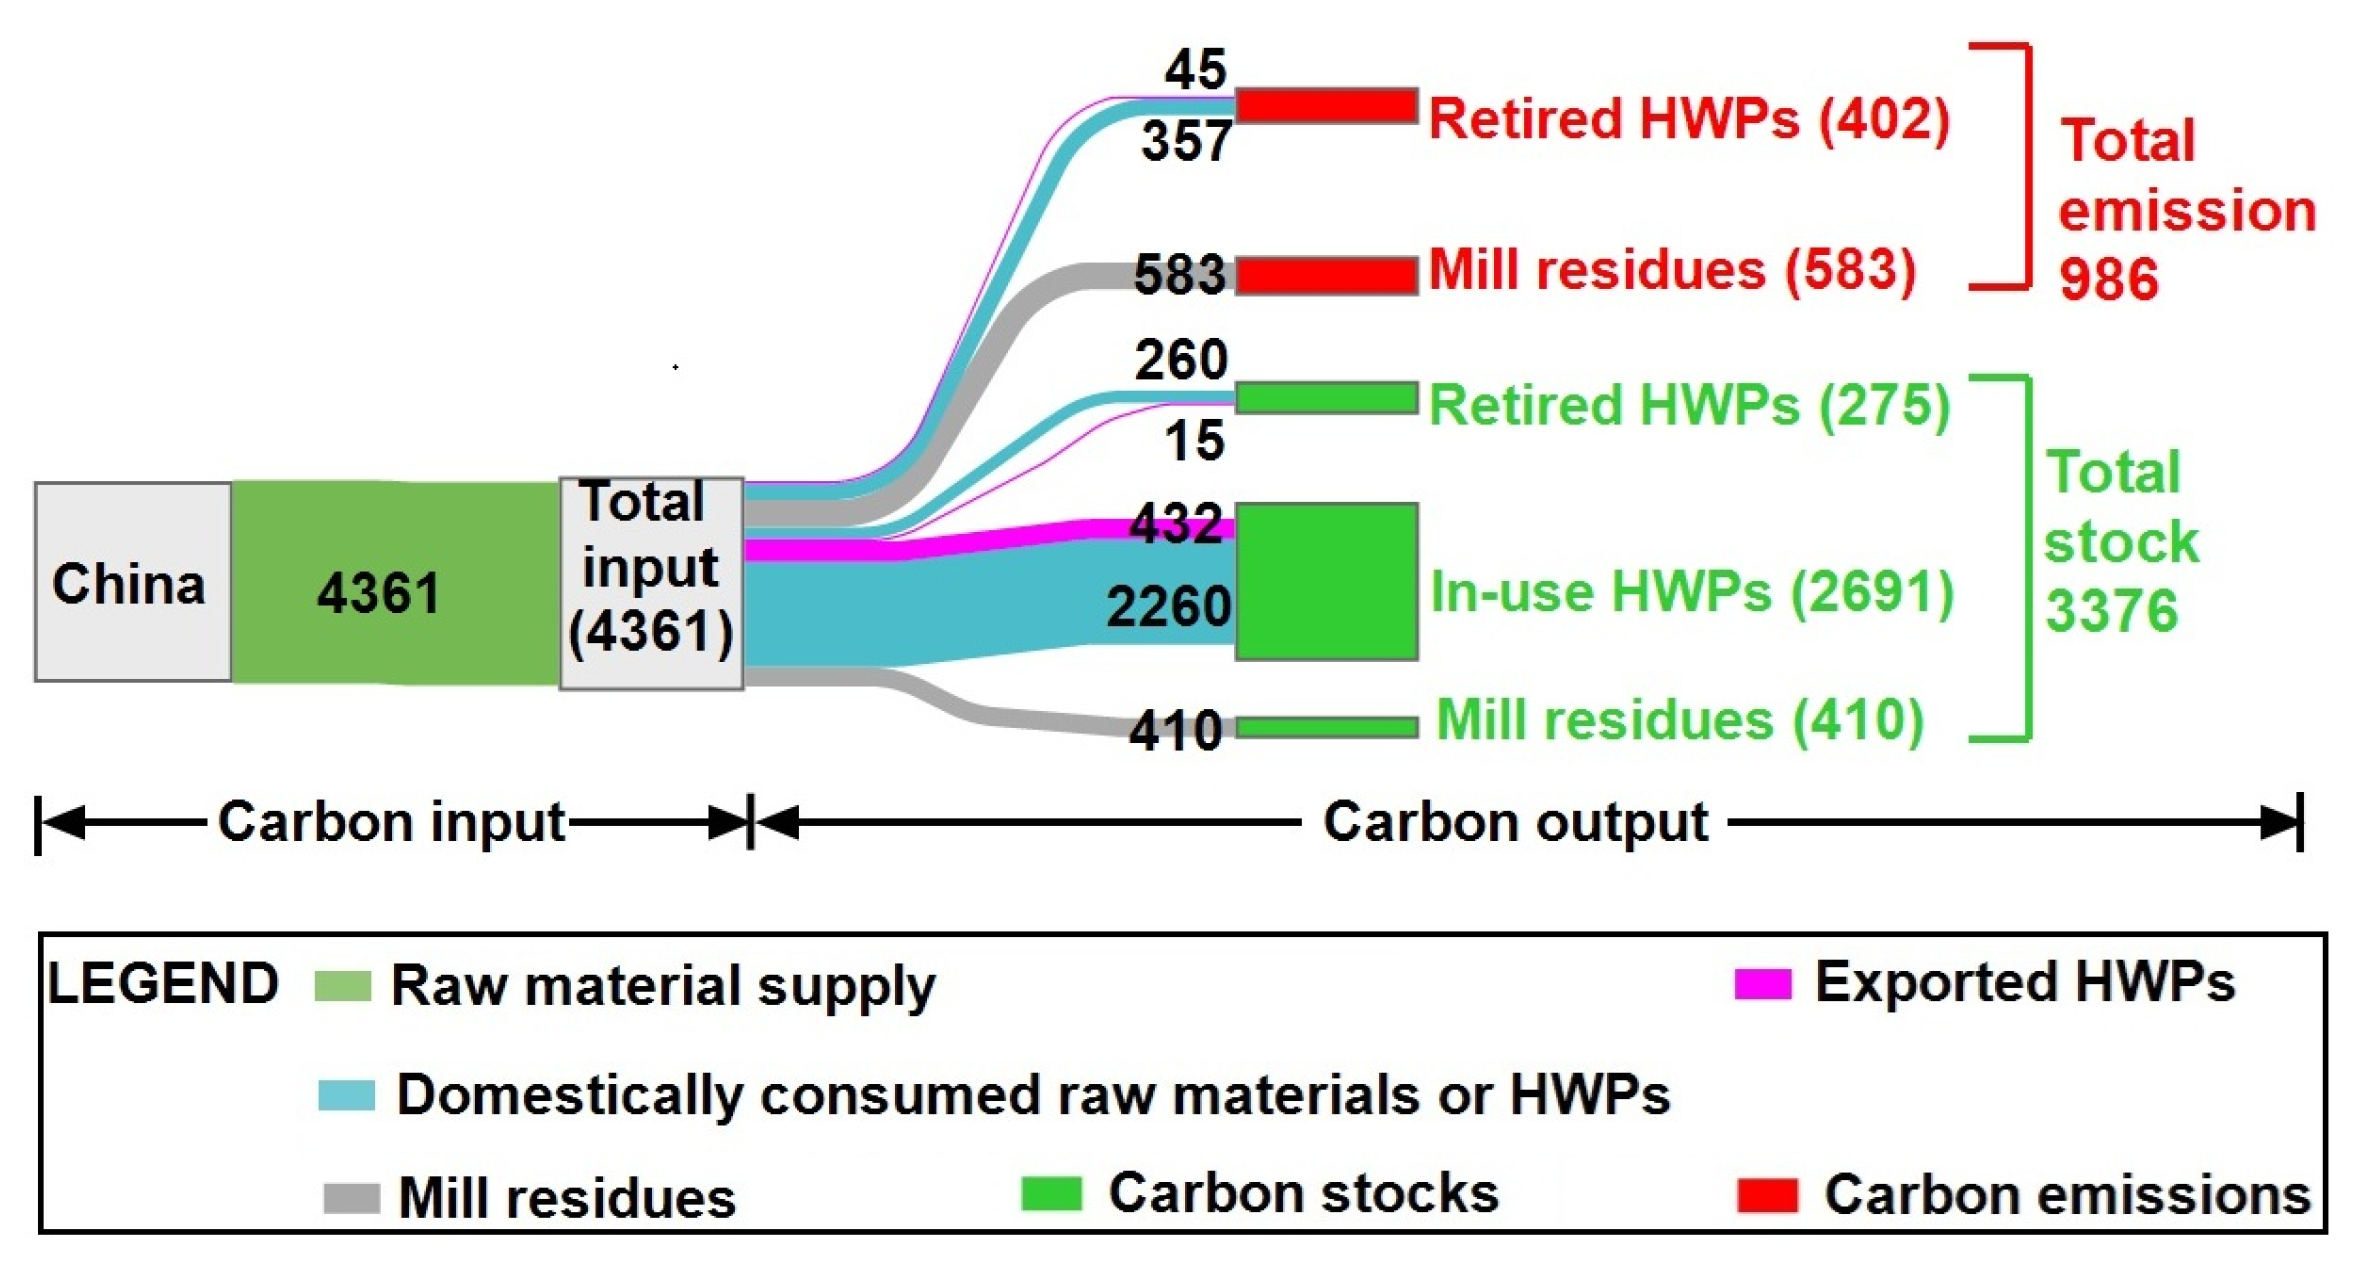
The total carbon input to the life cycle HWP carbon pool, including virgin wood and the recovered paper that was not collected in the end-of-life stage in this study, was estimated to be 4361 MtCO2e from 1990 to 2020 (Figure 5). The total carbon output over the same period was also 4361 MtCO2e, consisting of 3376 MtCO2e of carbon stocks and 986 MtCO2e of carbon emissions. We also estimated that trade partners contributed to 13% of the carbon stocks and 3% of the carbon emissions.

3.2. Carbon Stocks and Sinks Distributed in China and Major Trade Partners

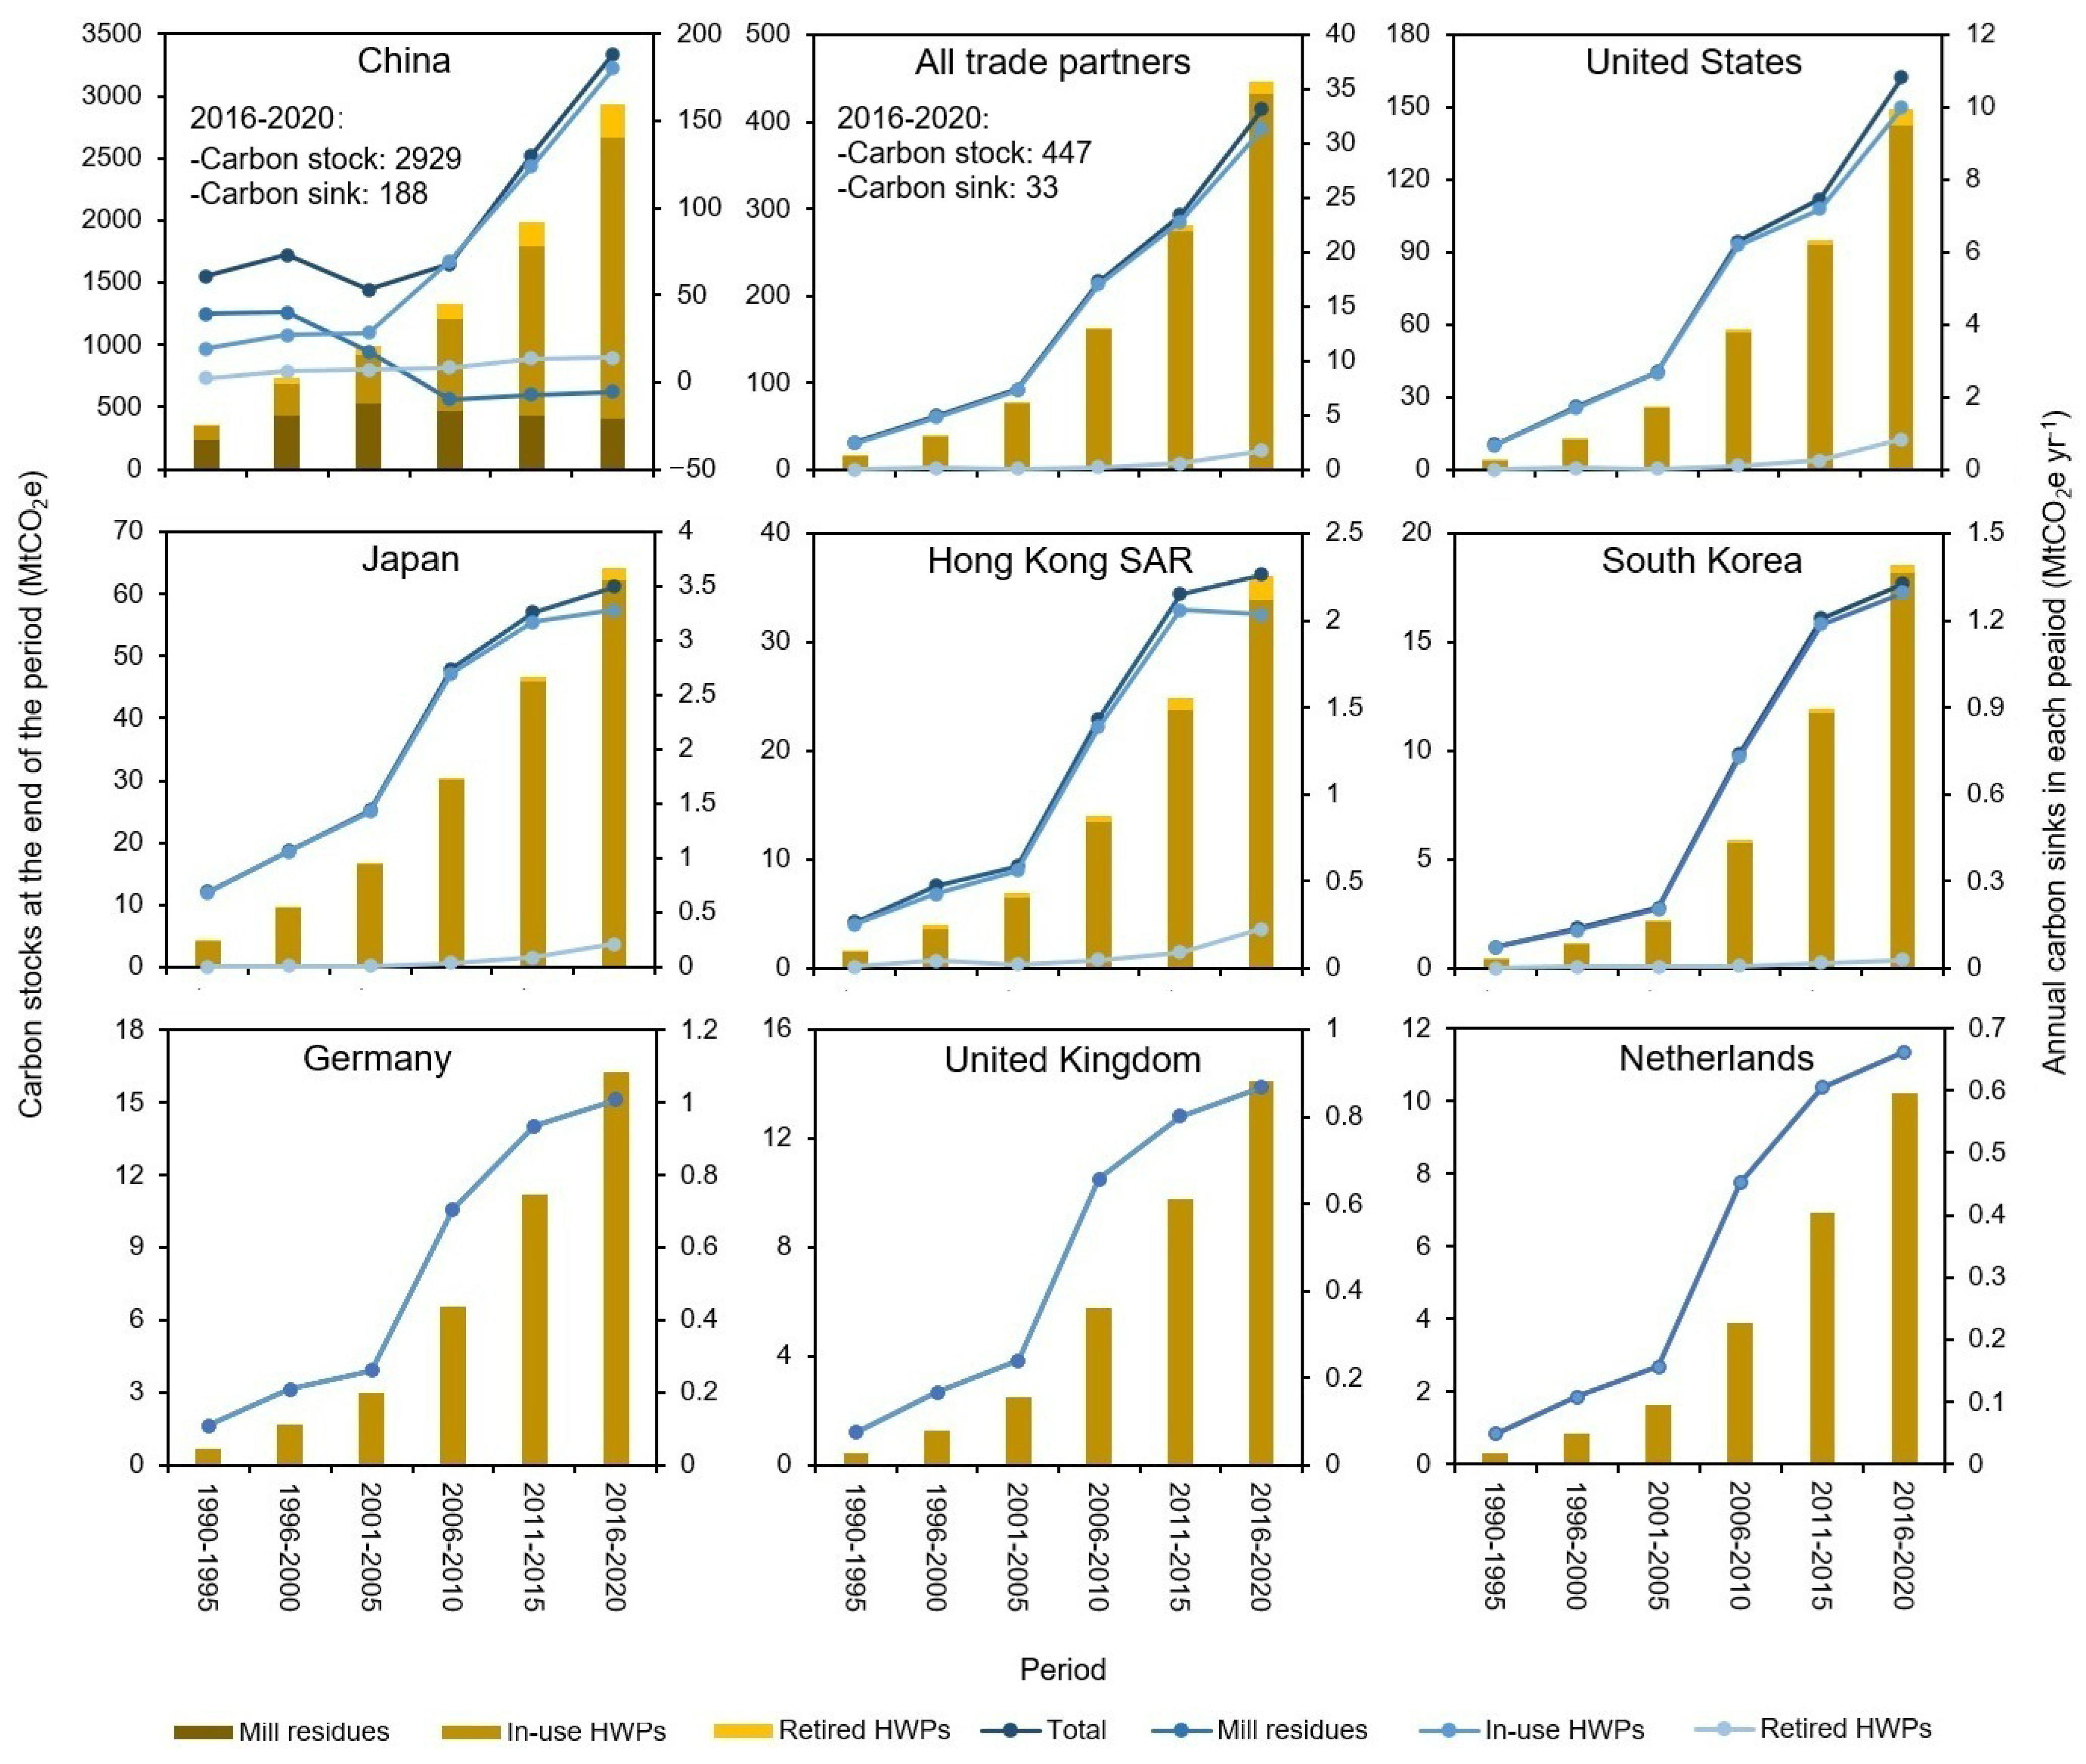
We report that seven leading overseas end users of Chinese-made HWPs, namely the United States, Japan, Hong Kong Special Administrative Region (SAR), South Korea, Germany, the United Kingdom, and the Netherlands, account for 69% of the carbon stocks retained by China-produced HWPs that were consumed overseas and 9% of the total life cycle carbon stocks of HWPs produced by China by 2020 (Figure 6). Together, these seven trade partners and China accounted for 96% of the total HWP carbon stocks by 2020. Carbon stocks in these eight leading end users kept climbing throughout the study period, particularly after 2000.
In addition to increased carbon stocks, carbon sinks (i.e., annual increases in carbon stocks) in these eight leading end users also grew overall, thereby continuously contributing to carbon removal. Most of the eight end users experienced a sharply increased carbon sink after 2005 (Figure 6), owing to the booming of China’s HWP production [14]. After 2015, China, the United States, and the aggregate of China’s trade partners have all experienced continuous rapid growth in carbon sinks, while the six other leading end users showed a slower growth rated in carbon sinks compared to their growth rates before 2015. During the period of 2016–2020, the life cycle carbon sink of China-produced HWPs reached 221 MtCO2e yr−1, with 85% contributed by China, 15% by its trade partners, and 9% by its top seven trade partners.
We also report that the decrease mill residues have led to a decline in the carbon stocks of mill residues, thereby resulting in a net carbon source since 2006 (Figure 6). From 2016 to 2020, the mill residues contributed to a net carbon source of 6 MtCO2e yr−1. The carbon sinks of retired HWPs accounted for a minor fraction in both China and its trade partners. From 2016 to 2020, these HWPs contributed to a carbon sink of less 16 MtCO2e, with 89% distributed in China and 11% in trade partners. As a comparison, in-use HWPs accounted for the majority of HWP carbon sinks in China (96%), its top seven trade partners (90%–100%), and all of its trade partners combined (95%). From 2016 to 2020, the carbon sink of in-use HWPs reached 211 MtCO2e yr−1, with 85% contributed by China and 15% by its trade partners.

3.3. Potential Factors Influencing Carbon Stock Estimates

We report that our assessment model is most sensitive to the quantity of raw material supplied (10%), the domestic harvest fraction (8.8%), half-life of HWP disposed of in open dumps and landfills (1.3%), fractions of retired HWPs and mill residues disposed of in open dumps (or stockpiles) (1.0%) and landfills (1.1%), and a fraction of degradable component under conditions of anaerobic decomposition (−1.0%) (Table 1). This indicates that reducing the uncertainties of HWP production data and waste disposal related data are crucial in HWP carbon balance estimates. We also show that pre-1990 HWP production would significantly impact the estimates of the carbon retained by mill residues (58%), retired HWPs (80%), and the total life cycle carbon stocks (16.2%). However, these HWPs had a smaller impact on the life cycle HWP carbon sink (−7.3%) from 2016 to 2020, because the decay rates of these HWPs are negligeable compared to the carbon sinks of post-1990 HWPs.
The sensitivity analysis also implies potential policy options to increase the HWP carbon stock. Extending the HWP service life by incentivizing recycling and reuse can increase the HWP carbon stock, despite the fact that the sensitivity analysis shows that the HWP carbon stock is less sensitive to the HWP half-life. This is because most of China’s HWPs were produced after 2005, and most of them are still in use [12,15,17], making the HWP half-life less sensitive. Promoting HWP and mill residue disposal in managed landfills while enhancing CH4 collection is also an effective policy to increase HWP carbon stocks. This is because, as mentioned above, the HWP carbon stock is sensitive to the fraction of wood waste disposed of in open dumps and landfills and the relative decomposition half-life. The managed landfill provides a longer decomposition lifespan that can retain more carbon compared to open dump and unmanaged landfills [47]. Additionally, only 5% of landfill CH4 was collected in China [47], which is much less than in the United States and Canada [1]. Therefore, a 10% (or 0.5 percentage point) increase in the methane collection rate unsurprisingly results in limited HWP carbon increases (Table 2). More carbon can be stored if a much higher CH4 collection rate can be implemented.

4. Discussion

4.1. Carbon Removal of China-Produced Harvested Wood Products for Climate Change Mitigation

We report China-produced HWPs accumulated a carbon stock of 3376 MtCO2e by 2020, equivalent to 3% of the carbon stock of China’s forests in 2015 [48], and provided a carbon sink of 221 MtCO2e yr−1 from 2016 to 2020, representing 26% of the China’s forest carbon sink from 2010 to 2015 [49]. The HWP carbon sink can be used to offset 2% of the fossil fuel carbon emissions of China from 2016 to 2020 [50]. China’s afforestation potential is now very limited and the forest carbon sink is expected to peak around 2035 due to the maturation of existing forests [49]. Thus, HWPs can provide a significant carbon sink to China’s forestry in the net-stage forest management (i.e., thinning and regeneration) of these forests [51]. In addition to carbon removal, HWPs can reduce fossil carbon emissions by substituting high carbon-density materials (e.g., steal and plastic), which was estimate to be more than the carbon contained in HWPs [52]. The carbon removal as well as the reduced fossil carbon emission can contribute to China’s goal of achieving carbon neutrality by 2060 [53].
We also report that 14% (or 520 MtCO2e) of China-produced HWPs were exported to overseas end users from 1990 to 2020. Trade partners accumulated 13% (or 447 MtCO2e) of the total carbon stocks and contributed 15% (or 33 MtCO2e yr−1) of the total carbon sink. The overseas carbon sink is equivalent to 69% of the “forest and land use carbon credits” transacted in global voluntary carbon markets in 2020. Since the carbon removal of exported HWPs should be accounted by and credited to the reporting country, our generalizable Tier-3 PA can support future HWP-related international negotiation and actions to mitigate climate change. This is especially important for countries that have large exports, for example, Canada [1,19], Brazil [16], and Russia [20].

4.2. Estimate Comparison and Implications for Improvement of Accounting Approaches

For a direct comparison, we also used IPCC default Tier-2 PA and the consistent dataset to estimate the carbon stocks and sinks of China-produced HWPs. Instead of directly using the IPCC equation to calculate the domestic fractions, as has been done in our previous study [15], we used the China-specific domestic harvest fractions calculated using the method described in Section 2.4 in the Tier-2 PA-based estimation. By doing this, we can maintain the carbon balance of the life cycle when using the Tier-2 PA, and thus produce comparable results. Compared to Tier-2 PA-based estimates, the Tier-3 PA-based carbon stocks and sinks were 1% and 3% lower, respectively (Table 2). The shortfall between these estimates is mainly because of less in-use HWP carbon stocks and sinks estimated using Tier-3 PA, which are 3% smaller than those estimated using Tier-2 PA. The major cause is that, our Tier-3 PA-based assessment includes HWP end uses with diverse service lives. Particularly, sanitary and household paper accounted for 2.4% of end-use HWP consumption but accumulated no carbon. Therefore, when data on HWP end use categories and relative half-lives can be more detailed and refined, the difference between our Tier-3 PA and Tier-2 PA can be greater. This indicates that our Tier-3 PA can be potentially more accurate than the Tier-2 PA. And, the Tier-2 PA is insufficient to estimate the fate of HWPs consumed by trade partners (Table 2). Our Tier-3 PA, for the first time ever, provides a generalizable analytical tool for a comprehensive assessment of the fate and carbon removal of exported HWPs. Thus, our Tier-3 PA can produce more accurate carbon removal estimates compared to Tier-2 PA when a reporting country has massive HWP exports.
We also compared our estimates with Tier-2 SCA and TLA, the approaches with different accounting scopes, to discuss the future fusion of different approaches. As described in Figure 1, compared to PA, SCA includes more raw material and HWP consumption for a net importer like China [14,34]. The Trade-Linked Approach (TLA), a Tier-3 method developed in our recent study [15], included not only the HWPs made from China’s wood harvests, but also those made from the wood harvests from its trade partners. Thus, our Tier-3 PA-based carbon stock and sink estimates are unsurprisingly smaller than that estimated using Tier-2 SCA (49% and 43% smaller, respectively) and TLA (23% and 25% smaller, respectively) (Table 2). Both our Tier-3 PA and TLA used the Eora MRIO model to allocate HWP end uses. We show that the fractions of the overseas in-use HWP carbon stocks (or sinks) to the carbon stocks (or sinks) of total in-use HWPs are similar under these two approaches. This is because the MRIO model assumes linear production and consumption [41], which means that the proportion of HWPs allocated to each end use is not affected by changes in HWP production. Therefore, if future research could allocate all the countries’ HWP production to end uses using the MRIO model, we would be able to produce the end-use HWP consumption, carbon stocks, and carbon sinks for PA, SCA, and TLA simultaneously, as these approaches only varied for the “HWP production” in the HWP extension block. This could develop the Tier-3 method for all these approaches while avoiding the gap in carbon removal estimates between global level estimates and the sum of country-level estimates [22].

4.3. Methodological Contributions

Our generalizable Tier-3 PA has two major methodological contributions to HWP accounting. First, our approach is the first-ever generalizable Tier-3 IPCC approach that uses an effective way to allocate HWP end uses when relative data are unavailable. This approach is applicable to the majority of countries in the world, where HWP end-use data is limited. Second, our approach provides an effective method to assess the fate of HWPs exported to all the trade partners of a country. This filled a major gap in PA, given that global HWP exports may account for up to 40% of global production [54].

4.4. Practical Contributions

Our approach, as well as the Chinese case study, has two major practical contributions. First, using this approach, we provide a more accurate and comprehensive assessment, which can enhance national greenhouse gas inventory reports. Second, through the first-ever comprehensive assessment of the fate of exported HWPs, we advocate for a new framework for international HWP-based negotiations. This is especially important because carbon stocks and sinks are determined by the use and disposal practices of trade partners but should be credited to the reporting country. More policies (e.g., compensation to overseas end users) to motivate trade partners to increase HWPs can enhance the carbon stocks and sinks of exported HWPs.

4.5. Limitations of the Study

Although the developed generalizable Tier-3 PA can effectively allocate the HWP production of the reporting country to its domestic and overseas end users, the approach still cannot fill the gap of allocating the end uses of the overseas HWP production made from the reporting country’s wood harvests. Filling this gap can largely improve the HWP carbon removal estimates of the countries that have massive raw material exports like Canada and Russia [20,29], and thus should be an important future research need. Using hybrid MRIO-physical flow models or bilateral data may help to fill the gap [39]. And, we used the data from FAOSTAT, a database with a consistent data source of Eora MRIO tables, which may also lead to some biased estimates, as FAOSTAT reports larger industrial roundwood production and smaller HWP production compared to China’s official statistics [14,34]. And thus, we may underestimate the carbon stocks and emissions of mill residues while overestimating those of in-use and retired HWPs. Combining FAOSTAT with national statistics is an important future research need. Lastly, it is still unknown whether end-use HWP distribution produced by the MRIO model agrees with reality. Future research should collect more data to demonstrate and/or improve the MRIO model-based estimates.

5. Conclusions

We integrated the Eora MRIO model into the Tier-2 PA to developed a generalizable Tier-3 PA, which effectively fills the methodological gap of allocating HWP production to domestic and overseas end uses. Our China-case study showed that HWPs accumulated a carbon stock of 3376 MtCO2e from 1990 to 2020, of which construction, furniture, other solid HWPs, sanitary, and household paper, and other paper products accounted for 1244, 226, 1032, 0, and 189 MtCO2e, respectively. China’s trade partners consumed 14% of China-produced HWPs, accumulated 13% of the total carbon stocks, and contributed to 15% (or 33 MtCO2e yr−1) of the total carbon sink. The generalizable Tier-3 PA is applicable to countries with limited end-use data, and thus enhance their HWP carbon removal accounting. Our first-ever comprehensive assessment of overseas HWP consumption and removal under PA not only improved the accounting approach, but also support future HWP-related international negotiation and actions to mitigate climate change.

Supplementary Materials

The following supporting information can be downloaded at https://www.mdpi.com/article/10.3390/f16101603/s1, Supplementary Data.xlsx.

Funding

This research was funded by the National Natural Science Foundation of China (grant numbers 52300239, 72403127).

Data Availability Statement

All the data sources have been provided in the manuscript. The Matlab M files for processing the data are available upon reasonable request.

Conflicts of Interest

The author declares no conflicts of interest.

Abbreviations

The following abbreviations are used in this manuscript:
HWPsHarvested wood products
IPCCIntergovernmental Panel on Climate Change
PAProduction Approach
PA-DCProduction Approach Domestic Consumption
SDASimple Decay Approach
SCAStock-Change Approach
AFAAtmospheric Flow Approach
Recovered paper-EOFThe paper collected and recovered in the end-of-life disposal stage

References

  1. Chen, J.; Ter-Mikaelian, M.T.; Yang, H.; Colombo, S.J. Assessing the greenhouse gas effects of harvested wood products manufactured from managed forests in Canada. Forestry 2018, 91, 193–205. [Google Scholar] [CrossRef]
  2. Johnston, C.M.T.; Radeloff, V.C. Global mitigation potential of carbon stored in harvested wood products. Proc. Natl. Acad. Sci. USA 2019, 116, 14526–14531. [Google Scholar] [CrossRef]
  3. Churkina, G.; Organschi, A.; Reyer, C.P.O.; Ruff, A.; Vinke, K.; Liu, Z.; Reck, B.K.; Graedel, T.E.; Schellnhuber, H.J. Buildings as a global carbon sink. Nat. Sustain. 2020, 3, 269–276. [Google Scholar] [CrossRef]
  4. Cabiyo, B.; Fried, J.S.; Collins, B.M.; Stewart, W.; Wong, J.; Sanchez, D.L. Innovative wood use can enable carbon-beneficial forest management in California. Proc. Natl. Acad. Sci. USA 2021, 118, e2019073118. [Google Scholar] [CrossRef]
  5. Dai, M.; Sun, M.; Chen, B.; Shi, L.; Jin, M.; Man, Y.; Liang, Z.; de Almeida, C.M.V.B.; Li, J.; Zhang, P.; et al. Country-specific net-zero strategies of the pulp and paper industry. Nature 2024, 626, 327–334. [Google Scholar] [CrossRef] [PubMed]
  6. Curtis, P.G.; Slay, C.M.; Harris, N.L.; Tyukavina, A.; Hansen, M.C. Classifying drivers of global forest loss. Science 2018, 361, 1108–1111. [Google Scholar] [CrossRef] [PubMed]
  7. Peng, L.; Searchinger, T.D.; Zionts, J.; Waite, R. The carbon costs of global wood harvests. Nature 2023, 620, 110–115. [Google Scholar] [CrossRef] [PubMed]
  8. Report of the Conference of the Parties Serving as the Meeting of the Parties to the Kyoto Protocol on Its Seventh Session, Held in Durban from 28 November to 11 December 2011. Available online: http://unfccc.int/resource/docs/2011/cmp7/eng/10a01.pdf (accessed on 29 July 2025).
  9. Intergovernmental Panel on Climate Change. Chapter 12: Harvest Wood Products. In 2006 IPCC Guidelines for National Greenhouse Gas Inventories, Volume 4, Agriculture, Forestry, and Other Land Use; Institute for Global Environmental Strategies: Kanagawa, Japan, 2006; pp. 12.1–12.33. Available online: https://www.ipcc-nggip.iges.or.jp/public/2006gl/pdf/4_Volume4/V4_12_Ch12_HWP.pdf (accessed on 29 July 2025).
  10. Intergovernmental Panel on Climate Change. 2013 Revised Supplementary Methods and Good Practice Guidance Arising from the Kyoto Protocol; Intergovernmental Panel on Climate Change: Geneva, Switzerland, 2014; pp. 2.110–2.134. Available online: https://www.ipcc-nggip.iges.or.jp/public/kpsg/pdf/KP_Supplement_Entire_Report.pdf (accessed on 29 July 2025).
  11. Intergovernmental Panel on Climate Change. Chapter 12: Harvest Wood Products. In 2019 Refinement to the 2006 IPCC Guidelines for National Greenhouse Gas Inventories, Volume 4 Agriculture Forestry, and Other Land Use; Intergovernmental Panel on Climate Change: Geneva, Switzerland, 2019; pp. 12.1–12.49. Available online: https://www.ipcc-nggip.iges.or.jp/public/2019rf/pdf/4_Volume4/19R_V4_Ch12_HarvestedWoodProducts.pdf (accessed on 29 July 2025).
  12. Brunet-Navarro, P.; Jochheim, H.; Muys, B. Modelling carbon stocks and fluxes in the wood product sector: A comparative review. Glob. Chang. Biol. 2016, 22, 2555–2569. [Google Scholar] [CrossRef]
  13. Geng, A.; Yang, H.; Chen, J.; Hong, Y. Review of carbon storage function of harvested wood products and the potential of wood substitution in greenhouse gas mitigation. For. Policy Econ. 2017, 85, 192–200. [Google Scholar] [CrossRef]
  14. Buongiorno, J.; Johnston, C.; Zhu, S. An assessment of gains and losses from international trade in the forest sector. For. Policy Econ. 2017, 80, 209–217. [Google Scholar] [CrossRef]
  15. Zhang, X.; Chen, J.; Lenzen, M.; Brunet-Navarro, P.; Dias, A.C.; Shao, S.; Liu, G.; Cao, Z.; Hu, W.; Lu, F.; et al. Carbon balance of China-made wood products assessed using a trade-linked approach. Environ. Sci. Technol. 2025, 59, 10227–10238. [Google Scholar] [CrossRef]
  16. Sanquetta, C.R.; Tomé, M.; Dias, A.C.; Maas, G.C.V.; Sanquetta, F.T.I. Carbon storage and CO2 dynamics from harvested wood products in Brazil during 1900–2016. Carbon Bal. Manag. 2019, 10, 417–429. [Google Scholar] [CrossRef]
  17. Yu, Z.; Zhang, H.; Tu, Q.; Yang, H. Methodological comparison of the production approach 2013 and 2019 for quantifying the carbon stock in harvested wood products in China. Front. Environ. Sci. 2022, 10, 758857. [Google Scholar] [CrossRef]
  18. Wei, X.; Zhao, J.; Hayes, D.J.; Daigneault, A.; Zhu, H. A life cycle and product type based estimator for quantifying the carbon stored in wood products. Carbon Bal. Manag. 2023, 18, 1. [Google Scholar] [CrossRef]
  19. Ménard, I.; Thiffault, E.; Magnan, M.; Kurz, W.A.; Hébert, F.; Boucher, J.-F. Improving carbon storage and greenhouse gas emissions avoidance through harvested wood products use. Trees Forest. People 2025, 19, 100757. [Google Scholar] [CrossRef]
  20. Gordeev, R.V.; Pyzhev, A.I. Evaluating carbon emissions and removals resulting from Russia’s trade in harvested wood products. For. Policy Econ. 2025, 172, 103444. [Google Scholar] [CrossRef]
  21. Sato, A.; Nojiri, Y. Assessing the contribution of harvested wood products under greenhouse gas estimation: Accounting under the Paris Agreement and the potential for double-counting among the choice of approaches. Carbon Bal. Manag. 2019, 14, 15. [Google Scholar] [CrossRef]
  22. Kayo, C.; Kalt, G.; Tsunetsugu, Y.; Tsunetsugu, Y.; Hashimoto, S.; Komata, H.; Noda, R.; Oka, H. The default methods in the 2019 Refinement drastically reduce estimates of global carbon sinks of harvested wood products. Carbon Bal. Manag. 2021, 16, 37. [Google Scholar] [CrossRef]
  23. Chen, J.; Colombo, S.J.; Ter-Mikaelian, M.; Heath, L.S. Carbon profile or the managed forests in Canada in the 20th century: Sink or source? Environ. Sci. Technol. 2014, 48, 9859–9866. [Google Scholar] [CrossRef]
  24. Kayo, C.; Tsunetsugu, Y.; Noda, H.; Tonosaki, M. Carbon balance assessments of harvested wood products in Japan taking account of inter-regional flows. Environ. Sci. Policy 2014, 37, 215–226. [Google Scholar] [CrossRef]
  25. Marland, E.; Marland, G.; Stockmann, K. The present net impact value for the atmospheric emission of forest carbon from harvested wood products. Environ. Model. Assess. 2025, 30, 253–264. [Google Scholar] [CrossRef]
  26. Horan, W.; Quilligan, M.; Bishop, G.; Styles, D. Improving biogenic carbon and land use accounting for construction wood. Resour. Conserv. Recy. 2025, 222, 108434. [Google Scholar] [CrossRef]
  27. Manley, B.; Evison, D. An estimate of carbon stocks for harvested wood products from logs exported from New Zealand to China. Biomass Bioenerg. 2018, 113, 55–64. [Google Scholar] [CrossRef]
  28. Kanemoto, K.; Lenzen, M.; Peters, G.P.; Moran, D.D.; Geschke, A. Frameworks for comparing emissions associated with production, consumption, and international trade. Environ. Sci. Technol. 2012, 46, 172–179. [Google Scholar] [CrossRef] [PubMed]
  29. Zhang, X.; Chen, J.; Dias, A.C.; Yang, H. Improving carbon stock estimates for in-use harvested wood products by linking production and consumption—A global case study. Environ. Sci. Technol. 2020, 54, 2565–2574. [Google Scholar] [CrossRef] [PubMed]
  30. Lenzen, M.; Kanemoto, K.; Moran, D.; Geschke, A. Mapping the structure of the world economy. Environ. Sci. Technol. 2012, 46, 8374–8381. [Google Scholar] [CrossRef] [PubMed]
  31. Lenzen, M.; Kanemoto, K.; Moran, D.; Geschke, A. Building Eora: A global multi-regional input-output database at high country and sector resolution. Econ. Syst. Res. 2013, 25, 20–49. [Google Scholar] [CrossRef]
  32. Moran, D.; Wood, R. Convergence between the Eora, WIOD, EXIOBASE, and open EU’s consumption-based carbon accounts. Econ. Syst. Res. 2014, 26, 245–261. [Google Scholar] [CrossRef]
  33. China Technical Association of the Paper Industry. Almanac of China Paper Industry 2021; China Light Industry Press: Beijing, China, 2021; pp. 1–150. (In Chinese) [Google Scholar]
  34. Zhang, X.; Yang, H.; Chen, J. Life-cycle carbon budget of China’s harvested wood products in 1900–2015. For. Policy Econ. 2018, 92, 181–192. [Google Scholar] [CrossRef]
  35. Brunet-Navarro, P.; Jochheim, H.; Franz, K.; Muys, B. Effect of cascade use on the carbon balance of the German and European wood sectors. J. Clean. Prod. 2018, 170, 137–146. [Google Scholar] [CrossRef]
  36. Bozzolan, N.; Grassi, G.; Mohren, F.; Nabuurs, G.J. Options to improve the carbon balance of the harvested wood products sector in four EU countries. GCB Bioenergy 2024, 16, e13104. [Google Scholar] [CrossRef]
  37. Joint Forest Sector Questionnaire Definitions. Available online: https://unece.org/sites/default/files/2025-04/DEF-EN-JQ-for-2024-data.pdf (accessed on 29 July 2025).
  38. Intergovernmental Panel on Climate Change. Climate Change 2014: Mitigation of Climate Change. Contribution of Working Group III to the Fifth Assessment Report of the Intergovernmental Panel on Climate Change; Cambridge University Press: New York, NY, USA, 2014; p. 47. [Google Scholar]
  39. Steeck, J.; Wieland, H.; Pauliuk, S.; Wiedenhofer, D. A review of methods to trace material flows into final products in dynamic material flow analysis: Comparative application of six methods to the United States and EXIOBASE3 regions Part 2. J. Ind. Ecol. 2023, 27, 436–456. [Google Scholar] [CrossRef]
  40. Lenzen, M.; Geschke, A.; West, J.; Fry, J.; Malik, A.; Giljum, S.; i Canals, L.M.; Piñero, P.; Lutter, S.; Wiedmann, T.; et al. Implementing the material footprint to measure progress towards Sustainable Development Goals 8 and 12. Nat. Sustain. 2022, 5, 157–166. [Google Scholar] [CrossRef]
  41. Leontief, W. Environmental repercussions and the economic structure: An input-output approach. Rev. Econ. Stat. 1970, 52, 262–271. [Google Scholar] [CrossRef]
  42. Bates, L.; Jones, B.; Marland, E.; Marland, G.; Ruseva, T.; Kowalczyk, T.; Hoyle, J. Accounting for harvested wood products in a forest offset program: Lessons from California. J. For. Econ. 2017, 27, 50–59. [Google Scholar] [CrossRef]
  43. Cherubini, F.; Guest, G.; Strømman, A.H. Application of probability distributions to the modeling of biogenic CO2 fluxes in life cycle assessment. GCB Bioenergy 2012, 4, 784–798. [Google Scholar] [CrossRef]
  44. Marland, E.; Marland, G. The treatment of long-lived carbon-containing products in inventories of carbon dioxide emissions to the atmosphere. Environ. Sci. Policy 2003, 6, 139–152. [Google Scholar] [CrossRef]
  45. Marland, S.E.; Stellar, K.; Marland, G.H. A distributed approach to accounting for carbon in wood products. Mitig. Adapt. Strateg. Glob. Change 2010, 15, 71–91. [Google Scholar] [CrossRef]
  46. Intergovernmental Panel on Climate Change. Chapter 3: Solid Waste Disposal. In 2019 Refinement to the 2006 IPCC Guidelines for National Greenhouse Gas Inventories, Volume 4 Agriculture Forestry, and Other Land Use; Intergovernmental Panel on Climate Change: Geneva, Switzerland, 2019; pp. 3.1–3.25. [Google Scholar]
  47. Cai, B.; Lou, Z.; Wang, J.; Sarkis, J.; Liu, J.; Gao, Q. CH4 mitigation potentials from China landfills and related environmental co-benefits. Sci. Adv. 2018, 4, eaar8400. [Google Scholar] [CrossRef] [PubMed]
  48. Tang, X.; Zhao, X.; Bai, Y.; Wang, W.; Zhao, Y.; Wan, H.; Xie, Z.; Shi, X.; Wu, B.; Wang, G.; et al. Carbon pools in China’s terrestrial ecosystems: New estimates based on an intensive field survey. Proc. Natl. Acad. Sci. USA 2018, 115, 4021–4026. [Google Scholar] [CrossRef] [PubMed]
  49. Cai, W.; He, N.; Liu, M.; Xu, L.; Wang, L.; Zhu, J.; Zeng, N.; Yan, P.; Si, G.; Zhang, X.; et al. Carbon sequestration of Chinese forests from 2010 to 2060: Spatiotemporal dynamics and its regulatory strategies. Sci. Bull. 2022, 67, 836–843. [Google Scholar] [CrossRef] [PubMed]
  50. World Bank Group. The World Bank Data. Available online: https://data.worldbank.org/indicator (accessed on 29 April 2025).
  51. Wang, M.; Yue, C.; He, J.; Zhang, P.; Xu, M.; Li, Y.; Wang, J.; Wang, L.; Xu, C. Can wood harvest followed by forest regrowth enhance carbon sequestration of the forest sector in China? Global Planet. Change 2024, 243, 104626. [Google Scholar] [CrossRef]
  52. Myllyviita, T.; Soimakallio, S.; Judl, J.; Seppälä, J. Wood substitution potential in greenhouse gas emission reduction-review on current state and application of displacement factors. For. Ecosyst. 2021, 8, 42. [Google Scholar] [CrossRef]
  53. Wang, Y.; Guo, C.; Chen, X.; Jia, L.; Guo, X.; Chen, R.; Zhang, M.; Chen, Z.; Wang, H. Carbon peak and carbon neutrality in China: Goals, implementation path and prospects. China Geol. 2021, 4, 720–746. [Google Scholar] [CrossRef]
  54. Dieter, M. Analysis of trade in illegally harvested timber: Accounting for trade via third party countries. For. Policy Econ. 2009, 11, 600–607. [Google Scholar] [CrossRef]
Figure 1. Harvested wood product (HWP) accounting scopes of the Production Approach (PA), Simple Decay Approach (SDA), Stock-Change Approach (SCA), Atmospheric Flow Approach (AFA), and Trade-Linked Approach (TLA).
Forests 16 01603 g001
Figure 2. Analytical framework for assessing the carbon balance of China-produced harvested wood products using a Tier-3 Production Approach. HWP: harvested wood product; Recovered paper-EOF: the paper collected and recovered in the end-of-life disposal stage; Recovered paper—other: other recovered paper that was not collected in the end-of-life disposal stage (i.e., the paper previously produced and recovered in the study period); S&H paper: sanitary and household paper.
Forests 16 01603 g002
Figure 3. Structure of Eora multi-regional input–output (MRIO) table with a harvested wood product (HWP) extension block (block HWP). The Eora MRIO table includes an intermediate block (block T), final demand block (block Y), and a primary input block (block V). Each block consists of international and intranational momentary transactions. All these transactions were archived by intersectoral transactions showed in the “detailed information for each country module”. The i and j represent the number of countries, with a maximum of 190. The h and k represent the number of industrial sectors, with its maximum varied by country.
Forests 16 01603 g003
Figure 4. Material and carbon flow relationship between China and its trade partners in the life cycle of China-produced harvested wood products (HWPs) from 1990 to 2020. The material and carbon flow relationship include material flows throughout raw material supply, HWP manufacture, HWP end uses, and end-of-life disposal, with the carbon stocks retained by in-use HWPs and waste management and the carbon emissions from waste combustion and decomposition. The numbers labeled with *, represent the carbon contained in the products that were recycled in the end-of-life stage. All the values in the diagram were presented as cumulative values in the period in the unit of million tonnes of carbon dioxide-equivalents (MtCO2e). Numbers may not add up due to rounding.
Forests 16 01603 g004
Figure 5. The carbon balance relationship between the carbon inputs to the life cycle of China-produced harvested wood products (HWPs) and carbon outputs of the life cycle from 1990 to 2020. The carbon input equals the carbon contained in the raw materials other than the recovered paper collected in the end-of-life stage in the assessment period. The carbon output equals the sum of carbon emissions and carbon stocks in the HWP life cycle. All the values in the diagram were presented as cumulative values during the period in the unit of millions of tonnes of carbon dioxide-equivalents (MtCO2e). Numbers may not add up due to rounding.
Forests 16 01603 g005
Figure 6. Carbon stocks (bars) and annual carbon sinks (lines) of mill residues, in-use harvested wood products (HWPs), and retired HWPs distributed in mainland China and major trade partners from 1990 to 2020. The carbon stocks are cumulative values at the end of each period. The carbon sinks are the periodic annual average carbon stock changes, in which a negative value represents the carbon source. The total HWP carbon sinks are equal to in-use HWP carbon sinks in Germany, the United Kingdom, and the Netherlands, because retired HWPs in these countries were assumed to be either combusted or recycled. Hong Kong SAR: Hong Kong Special Administrative Region.
Forests 16 01603 g006
Table 1. Percentage change in harvested wood product (HWP) carbon stock estimates caused by increasing the value of a single parameter or variable by 10% and impacts of pre-1990 HWP production on the HWP carbon stock estimates.
Input Variables and Parameters of the Assessment ModelPercentage Changes in Carbon Stock Estimates
Mill
Residues
In-Use HWPsRetired HWPsTotal
Wood material supplyRaw material supply10.010.010.010.0
Domestic harvest fraction0.010.010.08.8
HWP manufactureSolid HWP production efficiency−5.01.32.50.7
Virgin pulp production efficiency−2.40.11.3−0.1
HWP end useIntermediate demand of countries-0.0−0.20.0
Final demand of countries-0.00.20.0
HWP half-life-1.8−7.30.9
HWP end-of-life disposalFraction of retired HWPs and mill residues that were combusted−1.70.0−4.2−0.6
Fraction of retired HWPs and mill residues disposed of in open dumps (or stockpile)0.10.012.51.0
Fraction of retired HWPs and mill residues disposed of in landfills3.10.09.71.1
Fraction of retired HWPs that were recycled-0.9−4.00.4
Half-life of HWP disposed of in open dumps and landfills7.7-4.31.3
Fraction of anaerobic condition of HWP in landfills0.0-1.00.1
Fraction of degradable component in anaerobic decomposition−5.6-−3.5−1.0
Methane collection fraction0.2-0.50.1
Methane oxidation fraction1.1-0.60.2
Effects of 1900–1989 HWP production58.03.480.016.2
Note: Numbers with an absolute value greater than 1 are in bold, which represents their relatively greater sensitivity of life-cycle HWP carbon stock to the corresponding variables, parameters, or assumptions.
Table 2. The comparison of the harvested wood product (HWP) carbon stocks (MtCO2e) and sinks (MtCO2e yr−1) estimated using Tier-3 Production Approach (PA) with those estimated using Tier-2 PA, Tier-2 Stock-Change Approach (SCA), and Trade-Linked Approach (TLA).
Tier-3 PATier-2 PATier-2 SCATLA
Data sourceThis studyThis study[34][15]
Carbon stocks by 2020/20153376/2268 *3418 4456 *4375
 Mill residues410/438 *410 513 *470
 In-use HWPs2691/1634 *2781 3284 *3455
  China2260/1359 *--2905
  Trade partners432/275 *--550
 Retired HWPs275/196 *227 659 *449
  China260/190 *--429
  Trade partners15/6 *--20
Carbon sinks in 2016–2020/2011–2015221/154 *225 272 *294
 Mill residues−6/−7 *−6 −7 *−4
 In-use HWPs211/147 * 217 267 *274
  China180/124 *--233
  Trade partners31/23 *--41
 Retired HWPs16/14 *14 12 *24
  China14/14 *--22
* These values are the carbon stocks by 2015 or the carbon sinks from 2011 to 2015.
Disclaimer/Publisher’s Note: The statements, opinions and data contained in all publications are solely those of the individual author(s) and contributor(s) and not of MDPI and/or the editor(s). MDPI and/or the editor(s) disclaim responsibility for any injury to people or property resulting from any ideas, methods, instructions or products referred to in the content.