Article

Assessing Synergistic Effects on NPP from a Refined Vegetation Perspective: Ecological Projects and Climate in Heilongjiang

School of Geomatic, Liaoning Technical University, Fuxin 123000, China
*
Author to whom correspondence should be addressed.
Forests 2025, 16(10), 1574; https://doi.org/10.3390/f16101574
Submission received: 13 September 2025 / Revised: 5 October 2025 / Accepted: 9 October 2025 / Published: 12 October 2025

Abstract

Net Primary Productivity (NPP) serves as a key indicator of ecosystem health and productivity. However, most existing research focuses on primary land cover types, overlooking the dynamic response processes of NPP in refined vegetation types to multiple climate drivers. Furthermore, it lacks systematic analysis of the feedback mechanisms through which China’s Five-Year Plan (FYP) ecological projects regulate climate stress. This study, based on refined vegetation classification, systematically analyzes the dynamic changes in NPP in Heilongjiang Province from the 10th to the 13th FYP periods (2001–2020), with a focus on refined vegetation types. Results show that between 2001 and 2020, mixed-leaved forest emerged as the core driver of regional NPP change during the 12th FYP (NPP increase of +58.4 gC·m−2·a−1). Although deciduous needle-leaved forest (DNF) showed the highest cumulative increase (+64 gC·m−2·a−1), it experienced significant degradation (p < 0.01) in 57%–62% of its area during the 12th and 13th FYP periods. The dominant climate driver shifted from precipitation (positively correlated in 74% of the area during the 10th–11th FYPs) to drought stress dominated by vapor pressure deficit (VPD) (positive correlation increasing to 54%). Ecological projects mitigated the negative impact of temperature, reducing the area with negative correlations by 13%. Overall, the ecological policies of the FYP exerted a weak negative influence. However, forest vegetation was strongly regulated by VPD (SV = −0.61~0.59), while grasslands and croplands exhibited high sensitivity to temperature. These findings underscore the contrasting climate policy responses among plant functional groups, highlighting the urgent need for differentiated ecological management strategies.

1. Introduction

Amid ongoing global warming, the increasing frequency of extreme climate events has triggered serious challenges to natural ecosystems, human living conditions, and sustainable development. The Intergovernmental Panel on Climate Change (IPCC) released its Sixth Assessment Report in 2022. According to this report, the global average temperature over the past decade has risen by approximately 1.1 °C compared to the 1850–1900 baseline [1]. To effectively address this global challenge, numerous economies have formulated and implemented independent emission reduction plans. China, in particular, has proposed its “dual carbon” goals, aiming to peak carbon dioxide emissions by 2030 and achieve carbon neutrality by 2060 through both emission reductions and enhanced regional carbon sink capacity [2]. Correspondingly, China’s Five-Year Plan (FYP) ecological projects offer clear policy pathways for realizing the dual carbon goals. These initiatives are closely integrated with the dual carbon targets in terms of their objectives within the ecological priorities, policy synergies, and mutual reinforcement. They collectively strive to combat climate change, promote low-carbon development, and advance sustainable development. Therefore, it is essential to understand the impacts of climate change on terrestrial ecosystems within the context of FYP ecological project implementation. This enhanced understanding is key to providing robust scientific support for climate change adaptation and mitigation strategies.
Climate change affects terrestrial ecosystems in diverse ways, and understanding these impacts is essential, particularly in the context of FYP ecological project implementation. It serves as a key indicator of plant community production capacity and the carbon source–sink function of ecosystems [3,4]. In the context of global climate change, Net Primary Productivity (NPP) plays a crucial role in both ecological processes and the global carbon cycle. Li et al. [5] employed Net Primary Productivity (NPP) to develop a Grassland Degradation Index (GDI), through which they quantified levels of degradation risk and identified threshold values specific to different grassland types. In a related study, Kharuk et al. [6] observed a strong positive correlation (r = 0.82) between NPP and the growth index (GI) of pine stands. Furthermore, both pine stands and the surrounding bush–steppe ecosystems exhibited increasing NPP, indicating a “greening” trend in pine habitats since the resurgence of warming. These NPP trends have been associated with multiple environmental factors, including reduced emissions, ongoing warming, and the invasion and expansion of resilient species such as birch, willow, shrubs, and graminoids [7].
To investigate the spatiotemporal trends of NPP, Hui et al. [8] have utilized trend and correlation analyses to examine NPP changes in the Fenhe River Basin. Obtained results revealed a fluctuating upward trend in vegetation NPP from 2000 to 2015 with an average annual growth rate of 6.62 gC·m−2·a−1. Xi et al. [9] employed the coefficient of variation, trend analysis, and Hurst exponent to explore the spatial and temporal characteristics of NPP dynamics in Heilongjiang Province, also predicting future trends. Their results indicated that the province’s total NPP exhibited a fluctuating but overall increasing trend over the past two decades, with an overall increase of 23.47%. Gains and losses in NPP were primarily observed in high-coverage forested regions and urban areas undergoing intense urbanization, respectively. In another study, ref. [10] simulated the spatiotemporal variation of NPP on the Loess Plateau of China from 1982 to 2014, finding an average annual NPP of 254.0 gC·m−2·a−1, with sustained growth over the 30-year period and significant differences across vegetation types. The study by [11] explored the spatiotemporal evolution of NPP in Northeast China, reporting an overall upward trend in NPP across different forest types, although 47.42% of the region still exhibited a decreasing trend. Despite these advancements, existing studies have yet to quantitatively assess the specific impacts of China’s FYPs major ecological projects on NPP trends.
To precisely quantify the driving mechanisms of NPP distribution and change, and to accurately capture its spatiotemporal patterns, the study by [12] revealed how climate regulates alpine grassland ecosystem NPP variations across spatial and temporal scales, demonstrating that vegetation NPP exhibits higher sensitivity to temperature than precipitation, particularly in arid areas where vegetation exhibits a more pronounced response to climate change. Wang et al. [13] found that in the mountainous regions of North China, the moisture index was the primary driver of NPP, outweighing the effects of temperature and solar radiation, with meteorological factors collectively contributing up to 68% to NPP variability. In Liaoning Province, [14] confirmed that precipitation plays a leading role in influencing NPP at the provincial scale, while land use change has emerged as the primary driver in the central urban agglomeration, highlighting the localized influence of anthropogenic activity. Zhang et al. [15] explored the impacts of natural factors and human activities on grassland NPP across the Tibetan Plateau and the Inner Mongolian Plateau. Their results showed that moisture was the primary driver, with a more significant effect on the Inner Mongolian Plateau, while anthropogenic factors exerted stronger indirect influences—mediated by topography and climate—on the Tibetan Plateau. Beyond climate and anthropogenic influences, China’s characteristic ecological projects also play a critical role in shaping NPP dynamics. For instance, ref. [16] assessed the ecological and environmental effects of the Kökyar Greening Project in Xinjiang’s Aksu region and found that post-implementation, the average annual NPP increased by ~1.34 gC·m−2·a−1—a 90.39% increase over the 2000 baseline of 32.67 gC/m2—demonstrating the project’s efficacy. Fu et al. [17] assessed NPP changes during different phases of Xinjiang’s ecological restoration projects and found that the average NPP was significantly higher during the initial project phases. The observed decline in later phases may reflect lagged impacts of ecological water transfers on vegetation growth, providing insights into the resilience of NPP under different water transfer regimes. Cheng et al. [18] identified that ecological restoration projects in Heilongjiang Province significantly impacted NPP, with afforestation emerging as a superior strategy for enhancing vegetation NPP. Similarly, [19] examined NPP changes during the second phase of the Three-North Shelterbelt Program (2001–2020), revealing that precipitation had a more pronounced influence on NPP than the ecological intervention itself and climatic factors accounted for 76% of the variation, while the program contributed only 10.9%. These studies collectively demonstrate the distinct impacts of different “ecological projects” on NPP and provide quantitative evidence for the significant role of climate and other factors on NPP variation. However, most existing research on NPP drivers remains at the level of primary land cover categories (e.g., forests and grasslands as a whole), lacking in-depth quantification of the driving mechanisms affecting refined vegetation types. These studies do not systematically decouple the interactive contributions of distinct China-specific ecological engineering measures and climatic factors.
Heilongjiang Province, located in Northeast China, features unique topography often described as “50% mountains, 10% water, 10% grassland, and 30% farmland,” and is endowed with abundant forest, water, grassland, and cultivated land resources. As a vital ecological security barrier in northern China and a major forestry province, it has a high forest coverage rate of 45.25%. Previous studies on NPP in Heilongjiang have primarily examined the impacts of climatic factors and ecological projects on its spatiotemporal variation. However, since the beginning of the 21st century, China’s Five-Year Plan (FYP) ecological projects, which are formulated every five years, have displayed distinct phased characteristics corresponding to different stages of national economic development. As a crucial policy instrument for guiding China’s socio-economic development, the FYP provides a critical lens for understanding the country’s development trajectory [20]. Nevertheless, limited research has focused on how NPP changes are influenced specifically within the context of FYP. Previous studies on vegetation NPP in Heilongjiang have overlooked these temporal policy phases, with limited exploration of the climate, vegetation interactions during different FYP stages and failing to quantify the specific contribution of FYP ecological projects to vegetation NPP. Therefore, the overarching goal of this study is to elucidate the differential impacts of climate change and FYP ecological projects on the NPP of refined vegetation types in Heilongjiang Province and to identify the dominant roles of these refined vegetation types in regional carbon sink dynamics.
The specific objectives are as follows:
  • To analyze the differential spatiotemporal evolution patterns of NPP across refined vegetation types in Heilongjiang Province from 2001 to 2020;
  • To quantify the dynamic weights of climatic factors—including temperature, precipitation, and vapor pressure deficit (VPD)—on NPP across refined vegetation types;
  • To uncover the specific response mechanisms of refined vegetation type’s NPP as driven by the interaction between climatic factors and FYP ecological projects.

2. Study Area, Data, and Methods

2.1. Study Area

Heilongjiang Province is located in the northeastern part of China (Figure 1), spanning longitudes 121°11′ E to 135°05′ E and latitudes 43°26′ N to 53°33′ N. With a total area of 473,000 km2, it ranks as the sixth-largest province in China [21]. Heilongjiang belongs to the temperate monsoon climate zone, with an annual average temperature of 5.5 °C. Precipitation distribution is characterized by more rainfall in summer than in winter, with an annual precipitation of approximately 419.7 mm. In terms of sunshine duration, it shows s spatial gradient—greater in the west and lower in the east—reaching up 2800 h in the western region. The geo-morphological features of Heilongjiang Province are a mix of mountains, plains, and water areas. Forest resources are abundant: the total managed forest area amounts to 31.75 million hectares, covering two-thirds of the provincial territory, and the forest coverage rate stands at 45.25%. Heilongjiang ranks among the top provinces in China in terms of forest area, total forest stock volume, and timber output. It has more than 100 tree species, among which more than 30 have high utilization value [22,23,24,25]. The main refined vegetation types in the study area include herbaceous vegetation (HBC), cropland (CPL), broad-leaved deciduous forest (BF), evergreen needle-leaved forest (ENF), deciduous needle-leaved forest (DNF), mixed-leaved forest (MLF), and grassland (GL). Dominant tree species include Pinus koraiensis, Larix gmelinii, Pinus sylvestris var. Mongolica, Picea spp., and Betula platyphylla.

2.2. Datasets

2.2.1. NPP Dataset

The MOD17A3HGF dataset provides annual NPP information derived from the cumulative sum of 8-day net photosynthesis products over a given year [26]. It features a temporal resolution of one year and a spatial resolution of 500 m [27]. As a widely applied dataset in studies of ecosystem carbon cycling, vegetation dynamics, and ecosystem health assessment, MOD17A3HGF plays a critical role in analyzing the spatiotemporal variations in NPP and it driving factors. This enables a better understanding of regional vegetation growth patterns and mechanisms under global environmental change. Consequently, vegetation NPP data for the study area spanning 2001–2020 were downloaded from the Google Earth Engine (GEE) platform [26,27].

2.2.2. Climate Datasets

Temperature (Tmp) and precipitation (Pre) data were sourced from the National Tibetan Plateau Data Center (https://data.tpdc.ac.cn), with a spatial resolution of 1 km. This dataset was generated using the Delta spatial downscaling scheme in China based on the 0.5° global climate dataset released by CRU and the global high-resolution climate dataset released by WorldClim [28,29]. Sunshine duration (SSD) data were downloaded for free from the National Basic Meteorological Elements Daily Dataset of China’s Surface Meteorological Stations (V3.0) (http://data.cma.cn/en) [30,31]. Air pressure and specific humidity data were derived from the China Meteorological Forcing Dataset (CMFD) (https://data.tpdc.ac.cn). As one of the most widely used climate datasets in China, CMFD demonstrates temporal continuity and high consistency when compared to the GLDAS (global land data assimilation system) [32].
VPD refers to the difference between saturated and actual vapor pressure in the atmosphere at a given temperature. It reflects the dryness of the air and regulates key physiological processes in plants, such as stomatal closure, transpiration, and photosynthesis. Consequently, VPD exerts a significant impact on ecosystem evapotranspiration processes and water use efficiency. In this study, VPD values were calculated using temperature, specific humidity, and air pressure data [33], and supplemented with China’s first high-resolution atmospheric humidity index dataset called HiMIC-Monthly (1 km resolution) [34]. The calculation formula of VPD is as follows:
V P D = S V P A V P
S V P = 6.1078 × e x p 17.27 T T + 237.3
A V P = S V P × S H × P 62.2
where T represents temperature (°C). To mitigate the influence of radiation, outlier regions in the VPD dataset were excluded from the analysis [35].

2.2.3. Fine High-Resolution Land Cover Product

Land cover data were obtained from the Earth Big Data Science Engineering Data Network (https://data.casearth.cn), specifically the GLC_FCS30 global fine high-resolution land cover product. This dataset includes four time periods—2005, 2010, 2015, and 2020—and provides land cover information at 30 m spatial resolution for the study area [36]. Developed and released by the team led by Liu Liangyun from the Aerospace Information Research Institute, Chinese Academy of Sciences, GLC_FCS30 is the first global land cover product at this resolution. It depicts global land cover distribution (excluding Antarctica) at a 30 m spatial resolution, providing up-to-date data support for land surface-related analyses. This product holds significant value for research on global environmental change, sustainable development, and monitoring of geographical national conditions. It serves as a foundational dataset for climate change studies and ecological assessments [36].
Due to differences in coordinate systems and spatial resolutions among remote sensing data products, ArcGIS (https://www.arcgis.com/index.html) was used to standardize all datasets to a common coordinate system. Subsequently, all data were resampled to a 1 km spatial resolution using bilinear interpolation—a commonly applied method in land surface parameter downscaling that effectively balances accuracy and computational efficiency. The sources of each dataset are listed in Table 1.

2.3. Study Methods

2.3.1. Trend Analysis

The temporal trends of Net Primary Productivity (NPP) in Heilongjiang Province across the “Five-Year Plan” ecological engineering periods were quantified using a non-parametric statistical framework. Given that long-term ecological data often violate the normality assumptions of parametric tests, we adopted Theil–Sen median trend analysis in conjunction with the Mann–Kendall significance test. This combination is robust against outliers and does not require normally distributed data [37]. The Theil–Sen median provides a reliable estimate of the trend slope [38], while the Mann–Kendall test robustly assesses its significance. Its calculation formula is as follows:
S = Median x j x i j i     j > i
where xi and xj represent vegetation NPP values in the ith and jth years, respectively; the median represents the median function; and S is the trend slope. A positive S indicates an upward trend, while a negative S indicates a downward trend.
The Mann–Kendall test is a non-parametric statistical method used to detect trends in time series [39]. It can determine whether a series exhibits an increasing or decreasing trend and assess the statistical significance of that trend. A key advantage of this method is that it makes no assumptions about the underlying data distribution, making it suitable for diverse datasets, including those with outliers or missing values—common in ecological and climatic datasets. Its calculation formula is as follows:
S = i = 1 n 1 j = i + 1 n sgn x j x i
where sgn() is the sign function, and its calculation formula is as follows:
sgn x j x i = + 1 x j x i > 0 0 x j x i = 0 1 x j x i < 0
where the test statistic Z is used to conduct trend testing.

2.3.2. Partial Correlation Analysis

Partial correlation analysis measures the linear association between two variables while controlling for the confounding effects of other variables. Unlike bivariate correlation, it isolates the intrinsic relationship by statistically removing the influence of specified covariates. This method is particularly valuable when a shared dependence on a third variable may obscure the true association between the primary variables of interest, thereby enabling a more independent assessment of their direct relationship [40].
In this study, pixel-based partial correlation analysis is used to investigate the effects of multiple factors on NPP changes. By controlling for the influence of other variables, this approach quantifies the impacts of Pre, Tmp, VPD, and SSD on NPP changes.

2.3.3. PLS-SEM

PLS-SEM is utilized to estimate causal relationships among latent variables that cannot be monitored directly but can be represented by one or more monitored variables; i.e., variables that can be monitored or measured directly. PLS-SEM typically comprises one measurement and a structural model, with the former representing the relationships between latent and monitored variables, and the latter representing the relationships between exogenous and endogenous latent variables. This is represented by the following equations:
X = Δ x a + b
where X represents latent and monitored variables, respectively, and ∆ denotes the correlation coefficients between latent variables and their corresponding monitored variables.
Z = C × Z + D × δ + η
where Z and δ are different latent variables, C and D are their influence coefficients, and η is the regression residual.
In this study, temperature (Tmp) and vapor pressure deficit (VPD), as core observed variables, together constitute thermal stress (TM), meanwhile, sunshine duration and precipitation, as latent variables, are used for the comprehensive analysis of the driving mechanism of ecosystem productivity. During the data processing stage, the original dataset was subjected to rasterization conversion. Subsequently, with grids of 1 × 1 km resolution as the basic unit, a standardized research sample set was constructed, and all observed variables and latent variables were standardized to ensure that each variable participated in the analysis under a unified dimension.

2.3.4. Multiple Linear Regression

To quantify the contributions of climate change and FYP ecological engineering to vegetation NPP, this study employed the multiple linear regression residual method, which statistically distinguishes their respective effects. Taking NPP as the dependent variable, and selecting Pre, Tmp, VPD, and SSD as independent variables, a multiple linear regression model was constructed. In this model, the coefficients of each independent variable were calculated to precisely reflect their independent influence on NPP.
The predicted NPP values were derived using the parameters of this multiple regression model. This step quantified the potential impact of climate change on NPP, with predicted values driven by changes in climatic factors (i.e., Pre, Tmp, VPD, and SSD). These predicted values provided a baseline for estimating the NPP changes expected under the sole influence of climate change.
To isolate and quantify the effect of FYP ecological engineering, the residual was calculated as the difference between the observed NPP values and the climate-driven predicted NPP values. This residual represents the portion of NPP change that cannot be explained by climate variability alone, thus reflecting the additional impact of FYP ecological engineering. The calculation formula is as follows:
N P P c c = a × P r e + b × T m p + c × V P D + d × S S D + e
N P P r = N P P o b s N P P c c
where NPPobs and NPPcc denote the observed NPP value and the predicted NPP value based on the regression model, respectively; a, b, c, d, and e represent the model parameters; and NPPr stands for the residual.
To quantify the sensitivity of vegetation NPP to various climatic factors, this study applied multiple linear regression analysis to explore the sensitivity of each climatic factor [41,42,43]. Prior to regression model construction, all independent variables were standardized to ensure comparability of their effects—this step eliminated the influence of differing units (e.g., precipitation in mm vs. temperature in °C), enabling direct comparison of coefficient magnitudes. The regression coefficients derived are defined as sensitivity values (SV).
In the multiple linear regression model, the annual mean NPP was used as the dependent variable, with Pre, Tmp, VPD, and SSD as independent variables. This setup allowed for a comprehensive assessment of the relative contributions of different climatic factors.
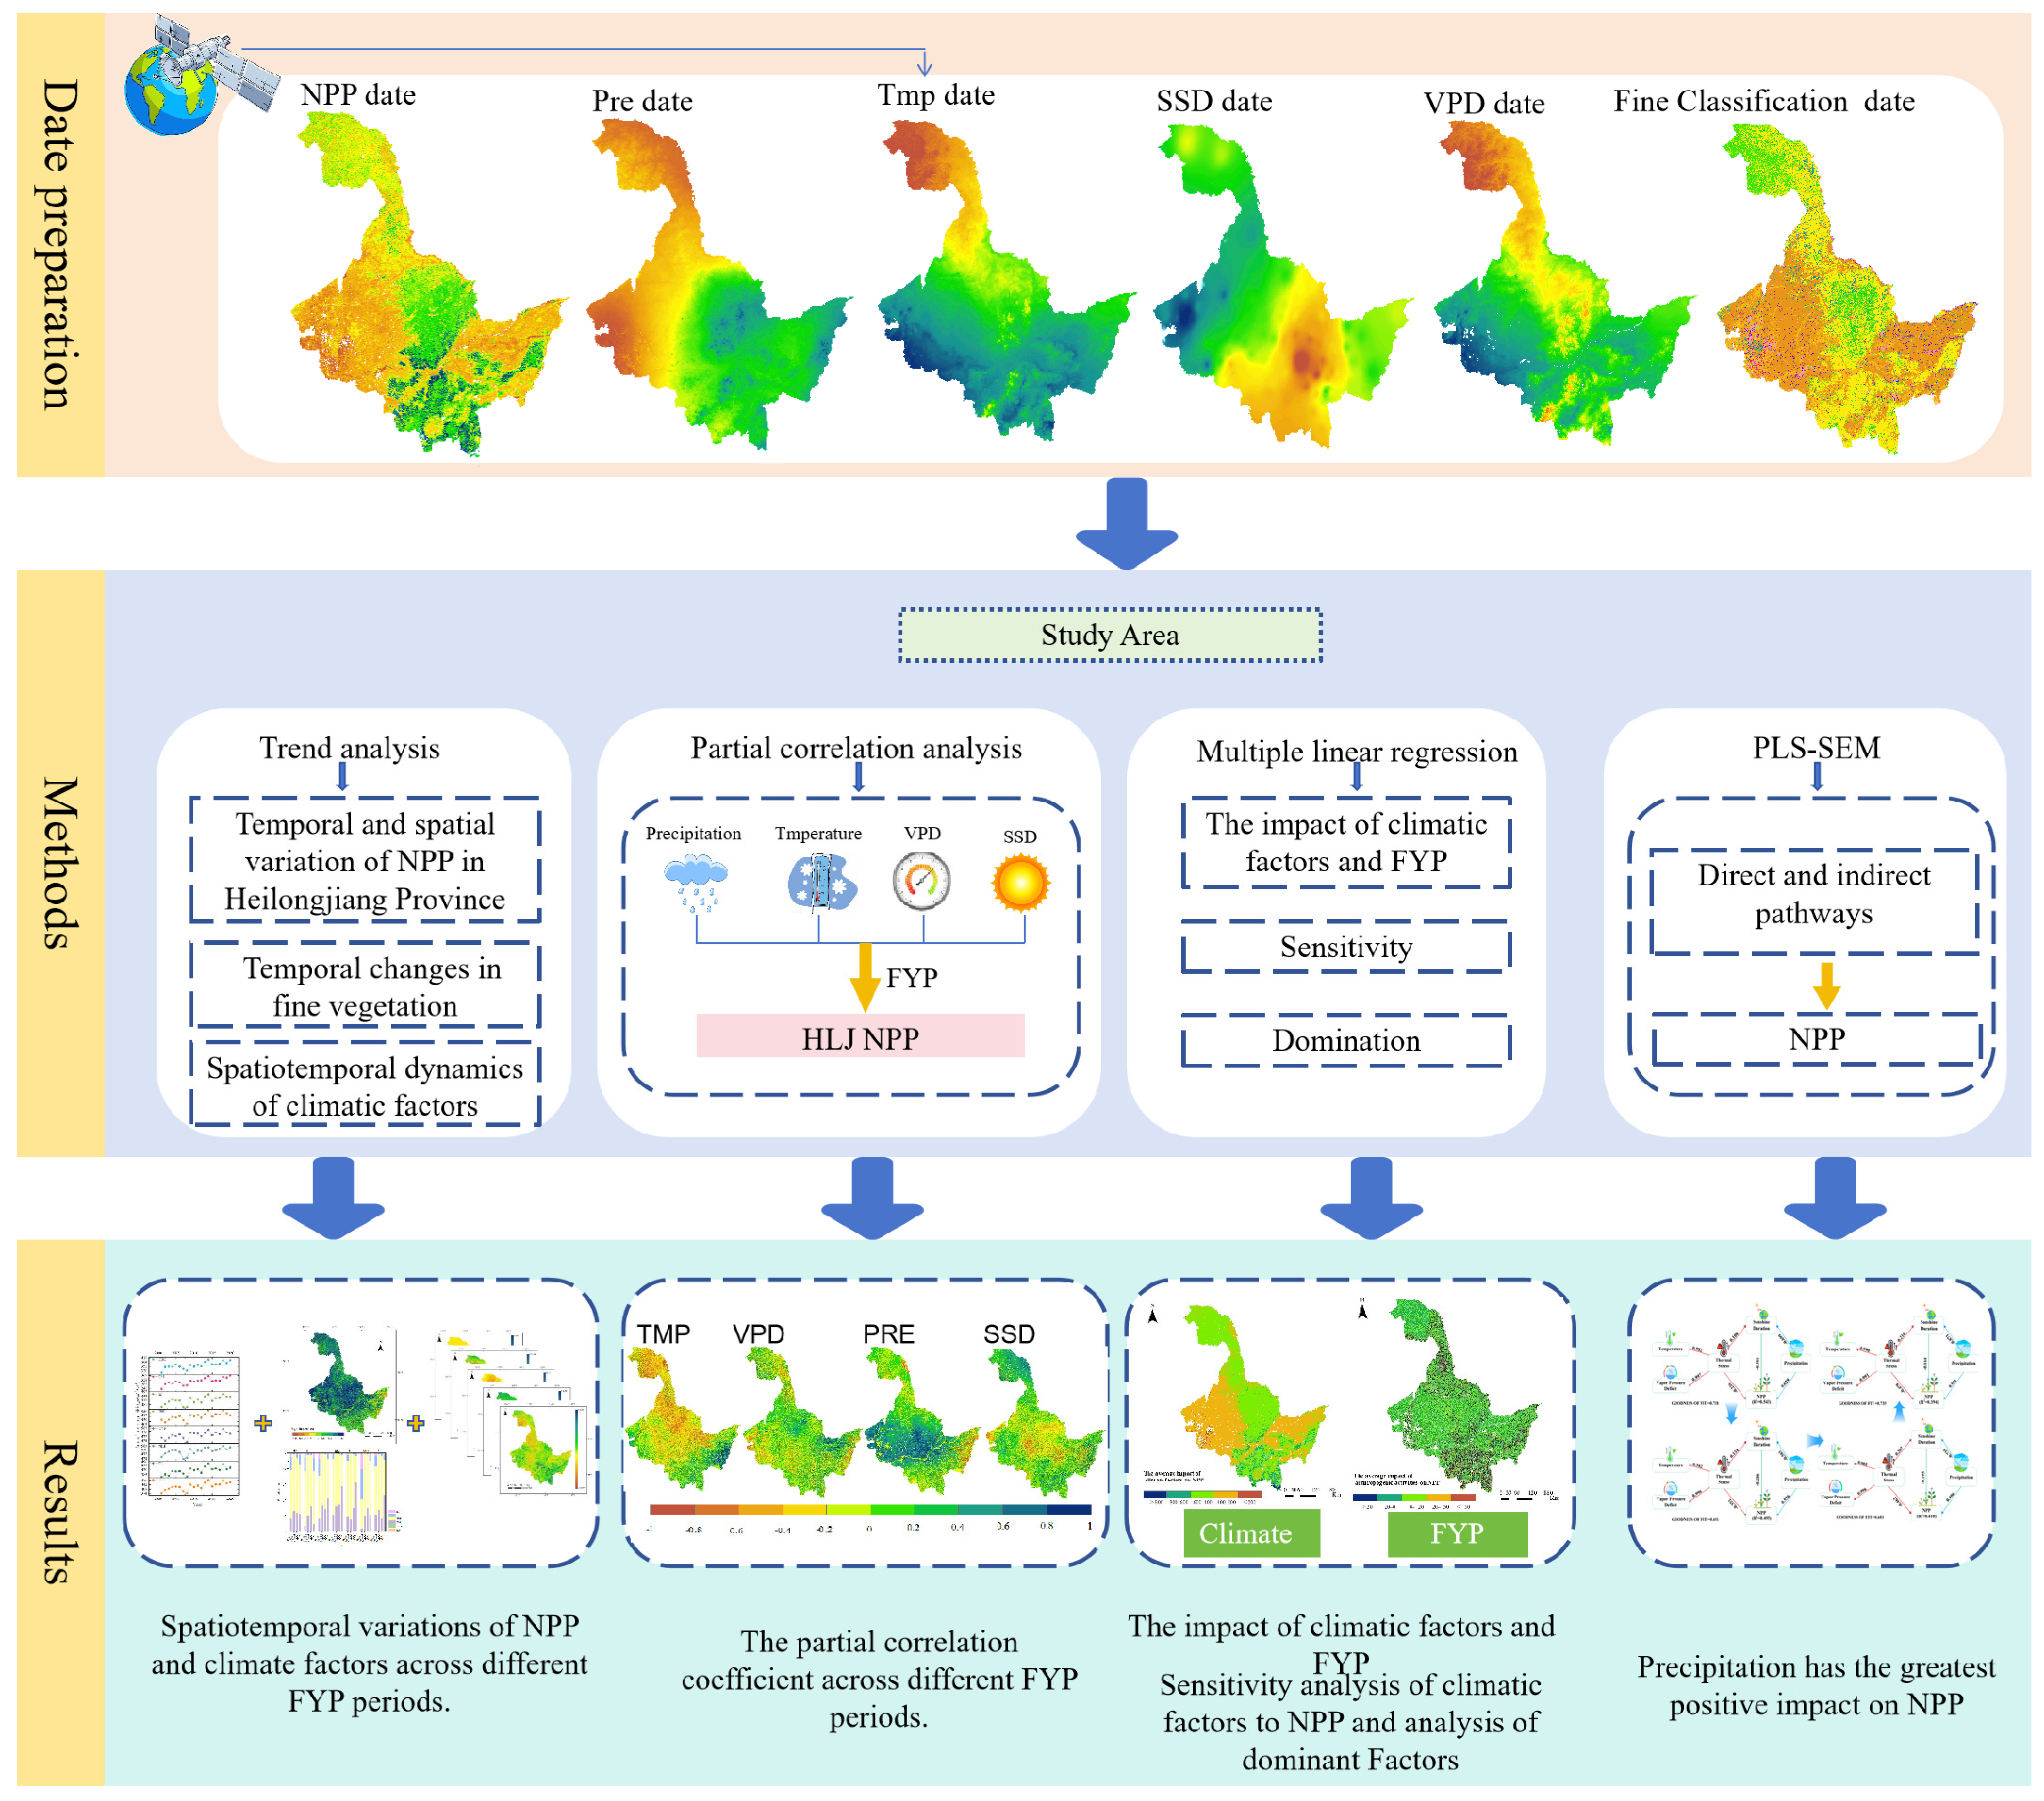
By comparing the absolute magnitudes of SV, the most influential climatic drivers of NPP can be identified. Specifically, an independent variable with a higher absolute SV indicates a stronger driving effect on NPP variability, providing empirical support for understanding the mechanisms of climate–vegetation interactions. The overall workflow of this study is illustrated in Figure 2.

3. Results

3.1. Spatiotemporal Variations of NPP

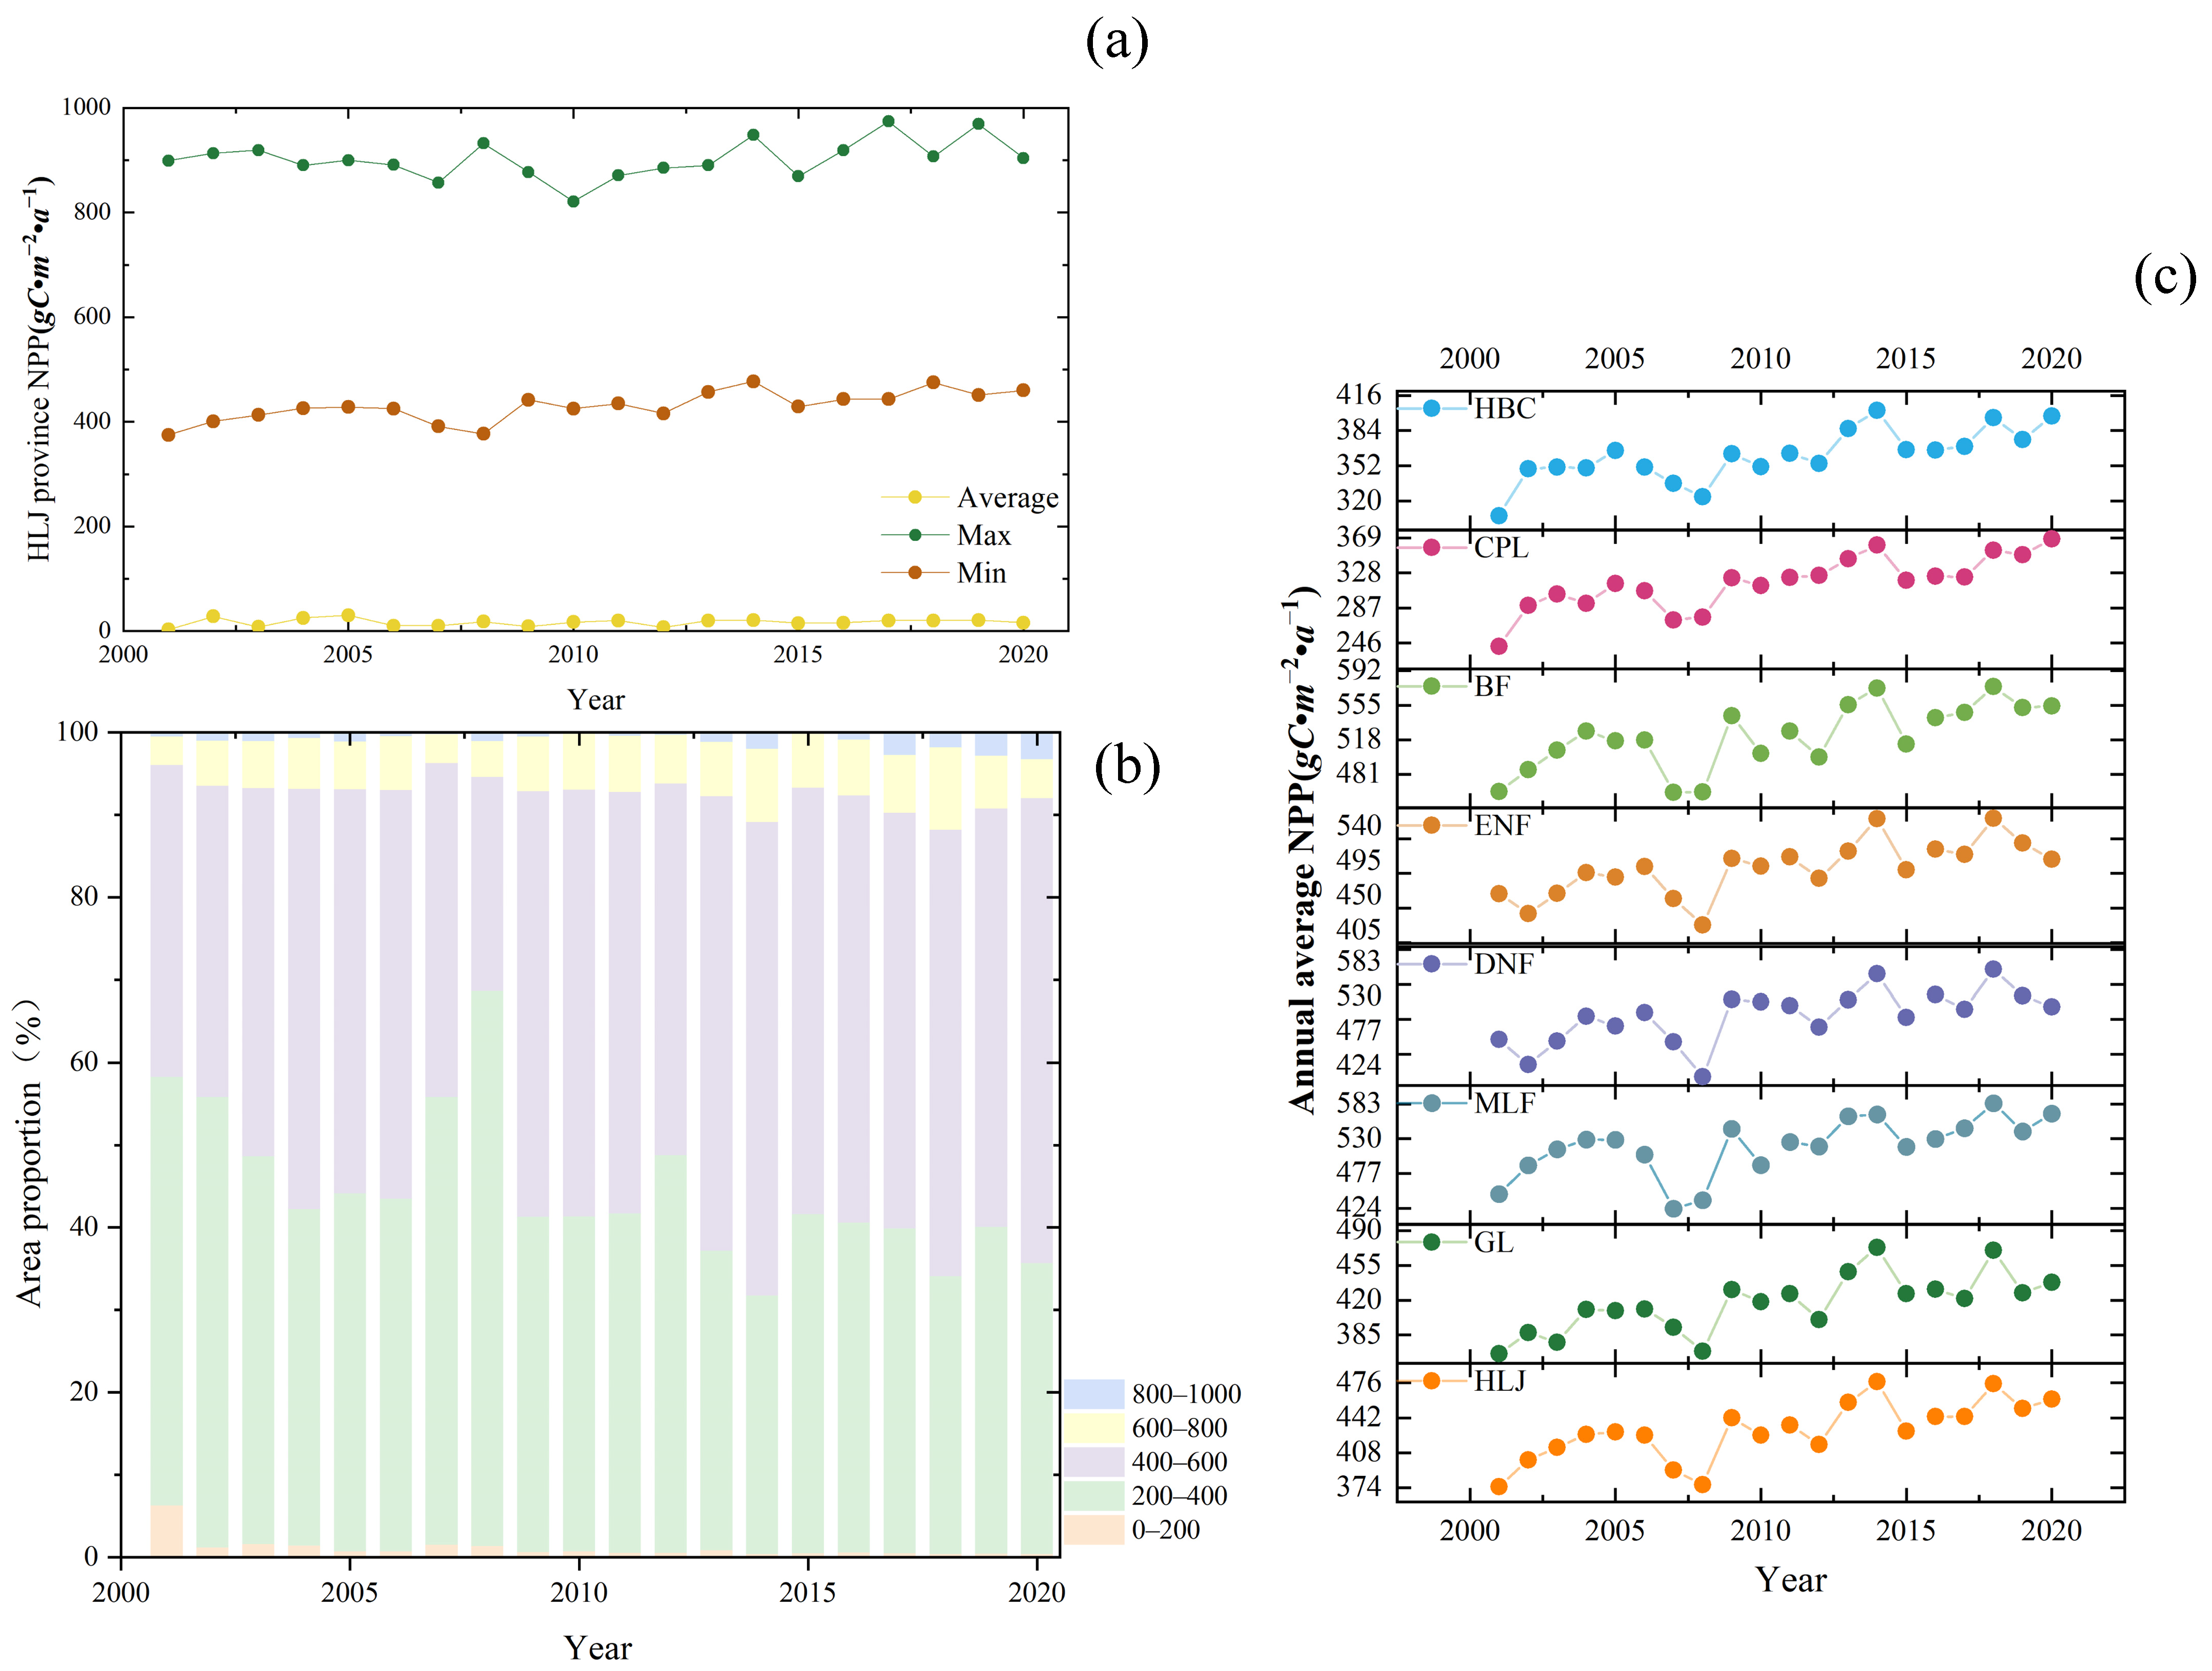
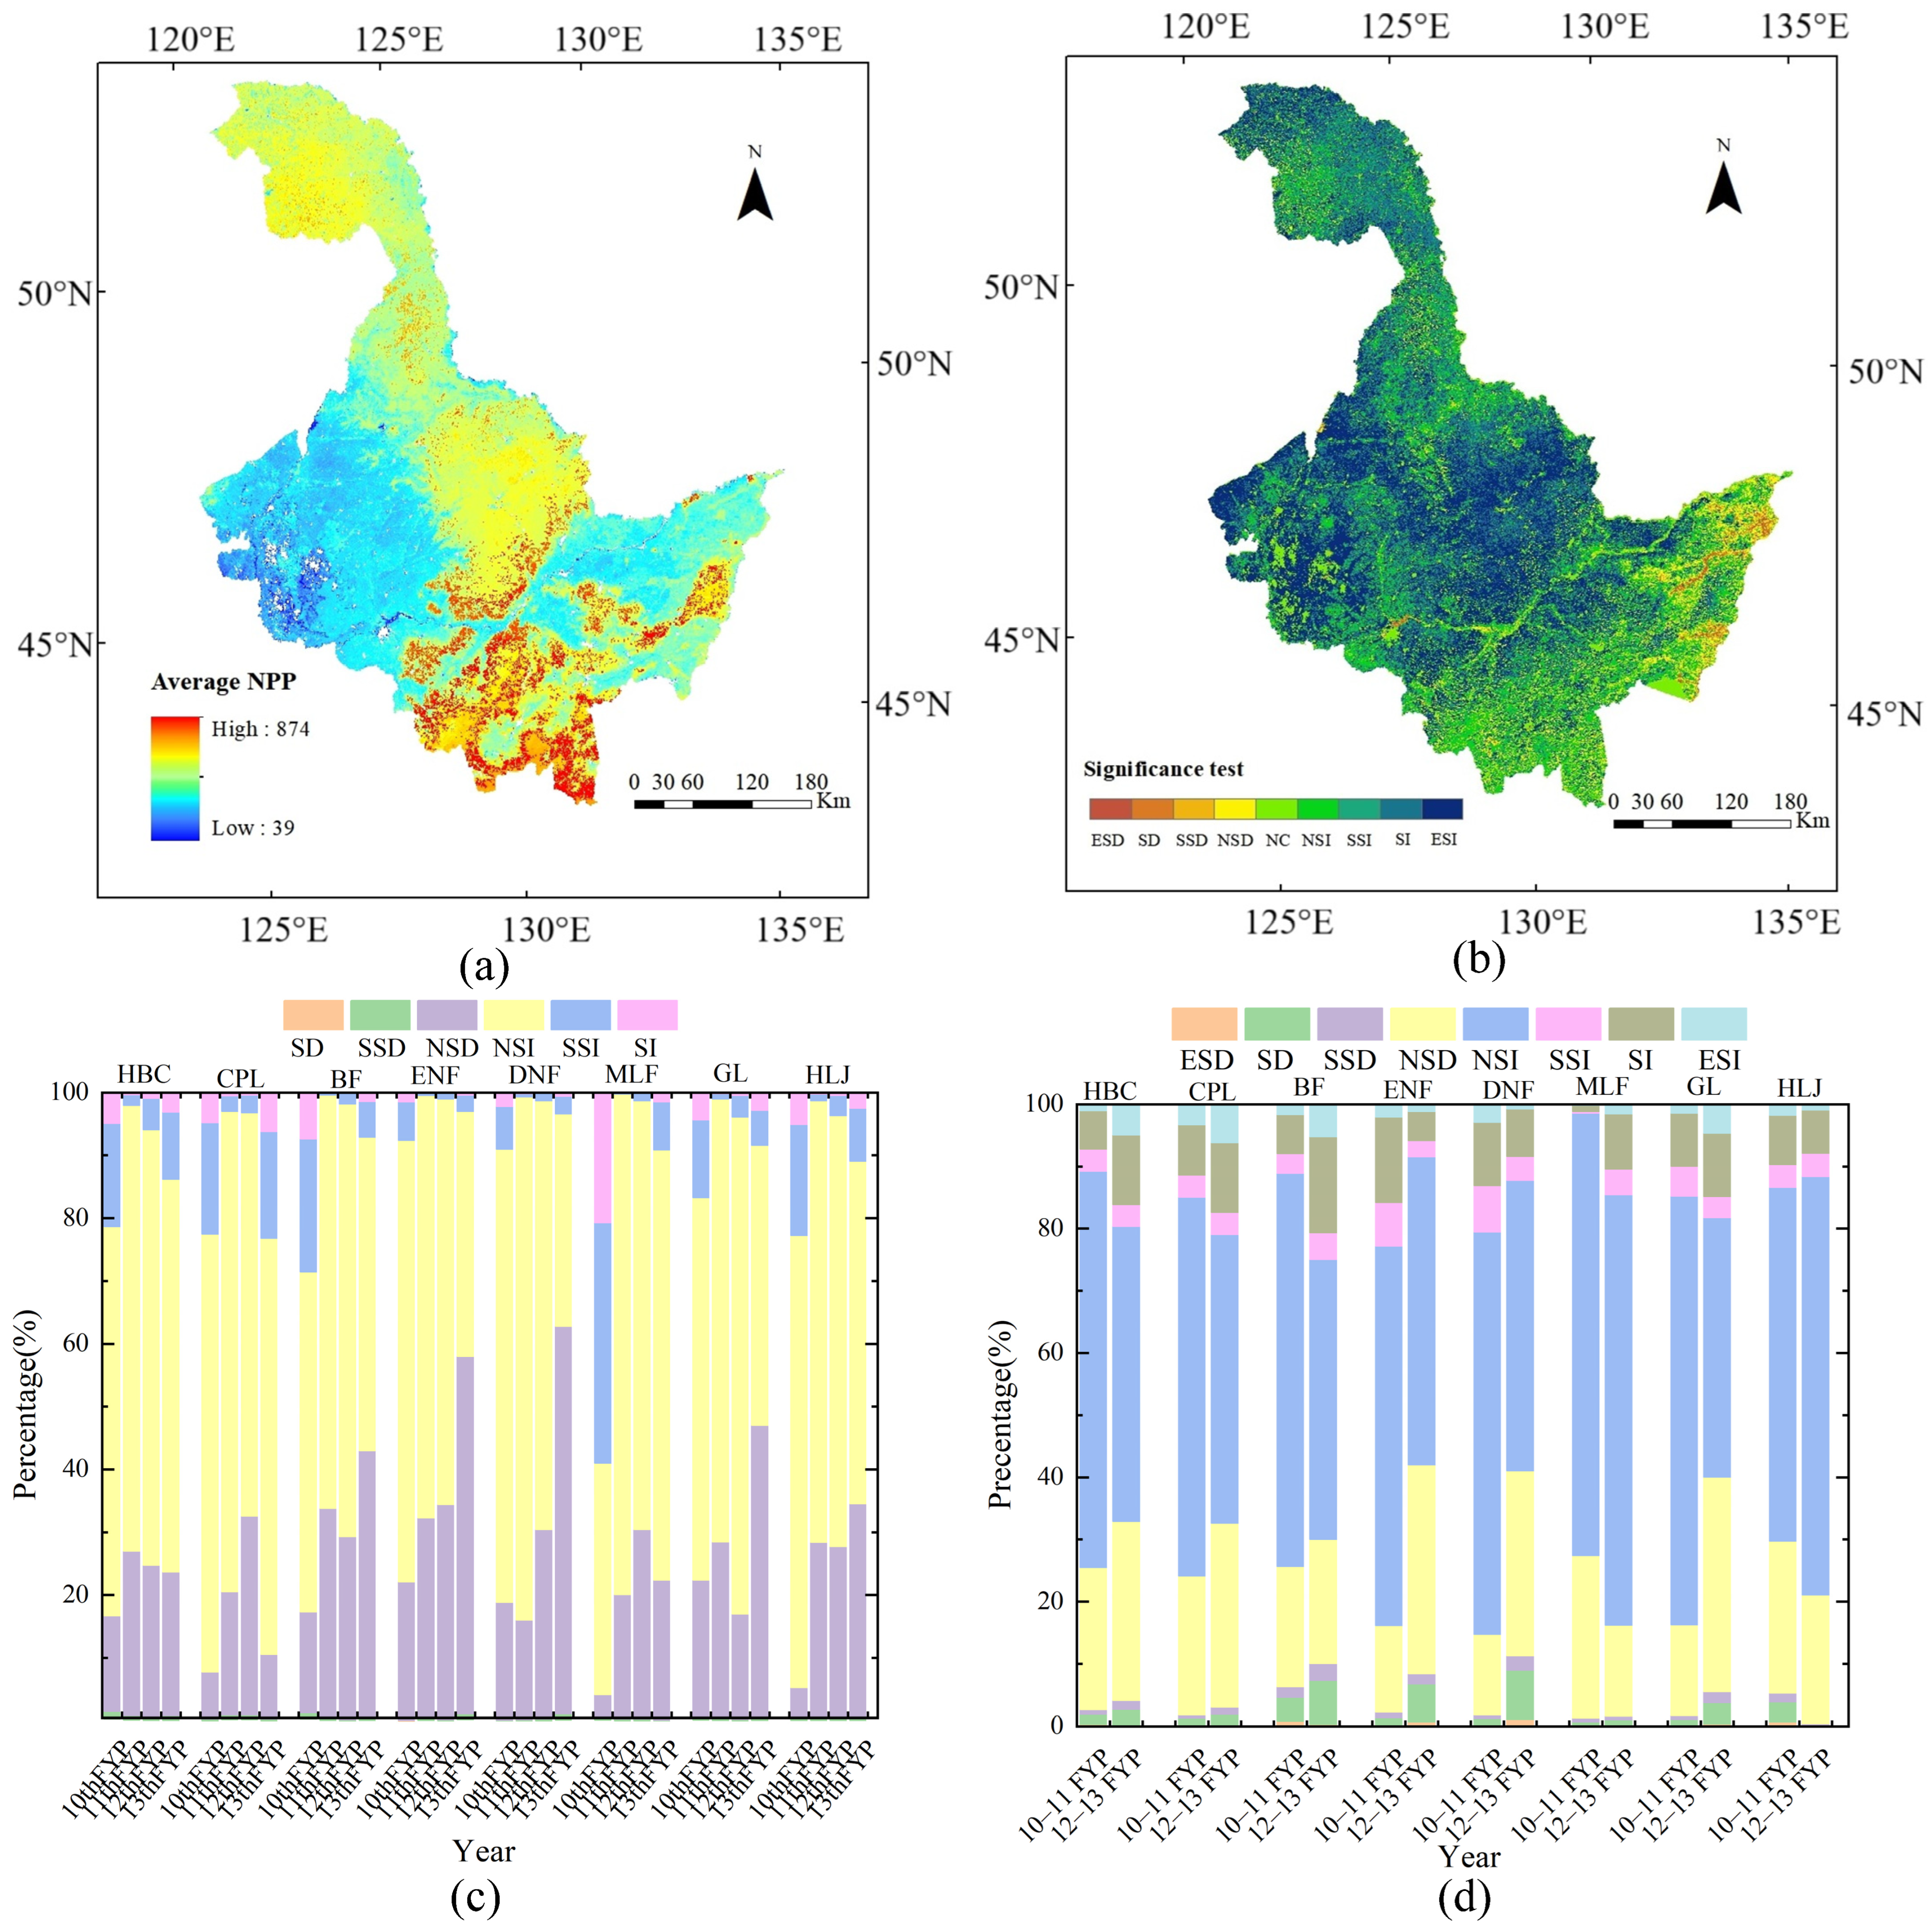
Figure 3 shows the variation trends of NPP in Heilongjiang Province and the NPP trends for different vegetation types during each FYP period. Figure 4 presents the spatial variations in NPP in Heilongjiang Province and statistically significant variation trends of NPP for different vegetation types during each FYP period.
Figure 3a illustrates the annual mean NPP in Heilongjiang Province during the study period. The annual mean NPP fluctuated within the range of 375–460 gC·m−2·a−1, with the maximum, minimum, and mean values exhibiting a high degree of consistency—indicating synchronized responses of NPP to large-scale drivers, such as climatic anomalies and province-wide ecological policies.
Figure 3b depicts the proportion of NPP values across different categories. A pixel-wise statistical analysis was conducted on NPP values, which were classified into five intervals: 0–200 gC·m−2·a−1, 200–400 gC·m−2·a−1, 400–600 gC·m−2·a−1, 600–800 gC·m−2·a−1, and 800–1000 gC·m−2·a−1. More than 85% of pixels fell within the range of 200–600 gC·m−2·a−1, and their combined share showed an overall upward trend, suggesting a general improvement in vegetation productivity across the region.
To further explore the NPP changes of refined vegetation types during the FYP periods, the study period was divided into the “10th FYP”, “11th FYP”, “12th FYP”, and “13th FYP”. Figure 3c illustrates the changes in annual mean NPP for different vegetation types during each FYP period, while Table 2 presents the Theil–Sen slope changes in various vegetation types, quantifying the directional trends of NPP within each planning period. Table 3 provides the mean NPP values of different vegetation types during each FYP period, serving as a baseline for comparing productivity levels across both time and vegetation categories.
As observed in Table 2, during the 10th FYP, the NPP of all vegetation types showed a statistically significant increase (Theil–Sen slope > 0), with MLF exhibiting the fastest growth rate and ENF the slowest. The trends of BF and MLF were highly consistent with those of Heilongjiang Province as a whole. Forest ecosystems (BF, MLF, ENF, DNF) had significantly higher NPP values than other vegetation types, making them the primary contributors to provincial NPP changes. During the 11th FYP, NPP for all vegetation types continued to increase (slope > 0) but followed a pattern of initial decline followed by recovery. Despite pronounced interannual fluctuations, mean NPP showed no statistically significant change compared to the 10th FYP. During the 12th FYP, HBC and GL showed accelerated growth (increased slopes), whereas the growth rates of other vegetation types slowed (decreased slopes). Overall, NPP maintained an upward trend (slope > 0). During the 13th FYP, NPP of ENF and DNF decreased (slope < 0), while other vegetation types continued to increase (slope > 0), with CPL showing the largest increment.
Throughout the entire study period, the NPP of most vegetation types exhibited an increasing trend. BF and MLF recorded the highest NPP values, followed by DNF. The variation trend of MLF closely aligned with provincial NPP trends, corroborating the conclusion in [44] that forests are the dominant contributors to NPP in terrestrial ecosystems. As shown in Table 3, the mean NPP of CPL was lower than that of other vegetation types across the three FYP periods, while forest ecosystems maintained high NPP levels. The most significant NPP increase occurred during the 12th FYP (37.1 gC·m−2·a−1), with MLF achieving a single-period increment of 58.4 gC·m−2·a−1—far exceeding that of other vegetation types. Over the entire study period, DNF showed the largest cumulative increment (64 gC·m−2·a−1), while HBC showed the smallest (36 gC·m−2·a−1). The significant improvement in forest NPP, particularly during the 12th FYP, may be linked to ecological policy implementation; during this period, forest coverage in Heilongjiang Province increased by 0.56% [45], and vegetation ecological quality improved by 13.9% compared to the 20-year average—reaching the optimal level in nearly two decades.
Figure 4a shows the spatial pattern of the mean NPP in Heilongjiang Province from 2001 to 2020 (10th–13th FYPs), showing significant spatial heterogeneity (p < 0.01). High-value areas (>400 gC·m−2·a−1) were concentrated in forest-rich regions, including the northern Greater Khingan Range, the central-eastern Heihe–Yichun area, and southern Mudanjiang. Among these, Mudanjiang had the highest mean NPP (573 gC·m−2·a−1), significantly exceeding that of the Greater Khingan Range (472 gC·m−2·a−1), Heihe (431 gC·m−2·a−1), and Yichun (490 gC·m−2·a−1) (Tukey’s HSD, p < 0.05). This discrepancy likely reflects an optimized hydrothermal regime: Mudanjiang, located in the temperate monsoon climate zone, receives higher annual precipitation (550–600 mm) and accumulated temperature (≥10 °C, 2500–2800 °C·d) compared with other high-NPP regions [38,40]. Low-value areas (<300 gC·m−2·a−1) were mainly distributed in the western Songnen Plain (Qiqihar: 308 gC·m−2·a−1; Daqing: 278 gC·m−2·a−1), where CPL and GL dominate (>85% coverage), resulting in relatively low carbon sequestration capacity.
Sen–Mann–Kendall (Sen+MK) trend analysis (Figure 4b) indicated that 54.69% of Heilongjiang Province exhibited significant NPP increases, including significantly increasing (SI) and extremely significantly increasing (ESI) regions. Only 10.05% of the study area showed decreasing trends, including extremely significantly decreasing (ESD), significantly decreasing (SD), and slightly significantly decreasing (SSD) regions. Increases were widely distributed in the central Songnen Plain and northern forest regions, likely driven by ecological engineering (e.g., natural forest protection) and climate warming–moistening [46,47,48]. Declines were scattered along the eastern Ussuri River wetlands (8.22% as non-significantly decreasing [NSD] regions), where wetland shrinkage due to natural degradation and inadequate protection has contributed to the decline [9].
From the perspective of refined vegetation types (Figure 4c), during the 10th–11th FYPs, NPP increased in 92% of the province, with CPL and MLF showing gains in over 90% of their distribution areas. However, ENF and GL exhibited decreasing trends in 22%–32% of their areas, likely due to the high proportion of young forests and grazing disturbance [49]. In the 12th–13th FYPs, the proportion of ENF and DNF with decreasing trends surged to 57%–62% (p < 0.01), while the upward trend of MLF continued to strengthen, with more than 80% of its area showing non-significantly increasing (NSI) or stronger trends, reflecting the effectiveness of plantation management [48].
To assess long-term variation patterns of NPP, considering the short duration of individual FYPs, the study period was divided into two stages for analyzing long-term temporal and spatial changes in NPP: the 10th–11th FYPs and 12th–13th FYPs (Figure 4d). In the 10th–11th FYPs, over 70% of the province and all vegetation types showed upward trends, with over 60% in the significantly increasing (NSI). ENF, DNF, and GL exhibited particularly prominent upward trends in over 80% of their areas. ENF and DNF were mainly distributed in the species-rich natural forest regions of the Greater Khingan Range. In the 12th–13th FYPs, the proportion of ENF, DNF, and GL with downward trends increased to ~40%, consistent with the trends observed in the 13th FYP in Figure 4c. The proportion of other vegetation types with downward trends also increased slightly. The overall variation in Heilongjiang Province was similar to that of MLF, with its upward trend increasing to ~80%, aligning with the temporal trends in Figure 3c and demonstrating high spatiotemporal consistency.
Analysis of spatiotemporal changes in NPP in Heilongjiang Province reveals a significant upward trend in annual mean NPP, with peaks concentrated in the 12th–13th FYPs. Forest vegetation—especially MLF, with its prominent contributions—was the primary driver of this increase, consistent with the findings of [48]. Growth rates increased significantly after 2010, reaching a historical maximum in 2020. Across all vegetation types, NPP showed an overall increase, with ~73% of the province exhibiting upward trends, predominantly in the NSI category. However, clear spatial heterogeneity was evident: high-value areas (>400 gC·m−2·a−1) were concentrated in forest-dense northern, central, and southern regions (Greater Khingan Range, Heihe, Mudanjiang), while low-value areas were distributed in CPL and GL in the western and eastern regions. The expansion of downward trends in some regions (e.g., ENF/DNF, ~40% of their areas) may be related to the high proportion of young and middle-aged forests [49]. Overall, the results indicate that the implementation of FYPs, especially the increase in forest coverage during the 12th FYP, has made a positive contribution to improving ecological quality.

3.2. Spatiotemporal Dynamics of Climatic Factors

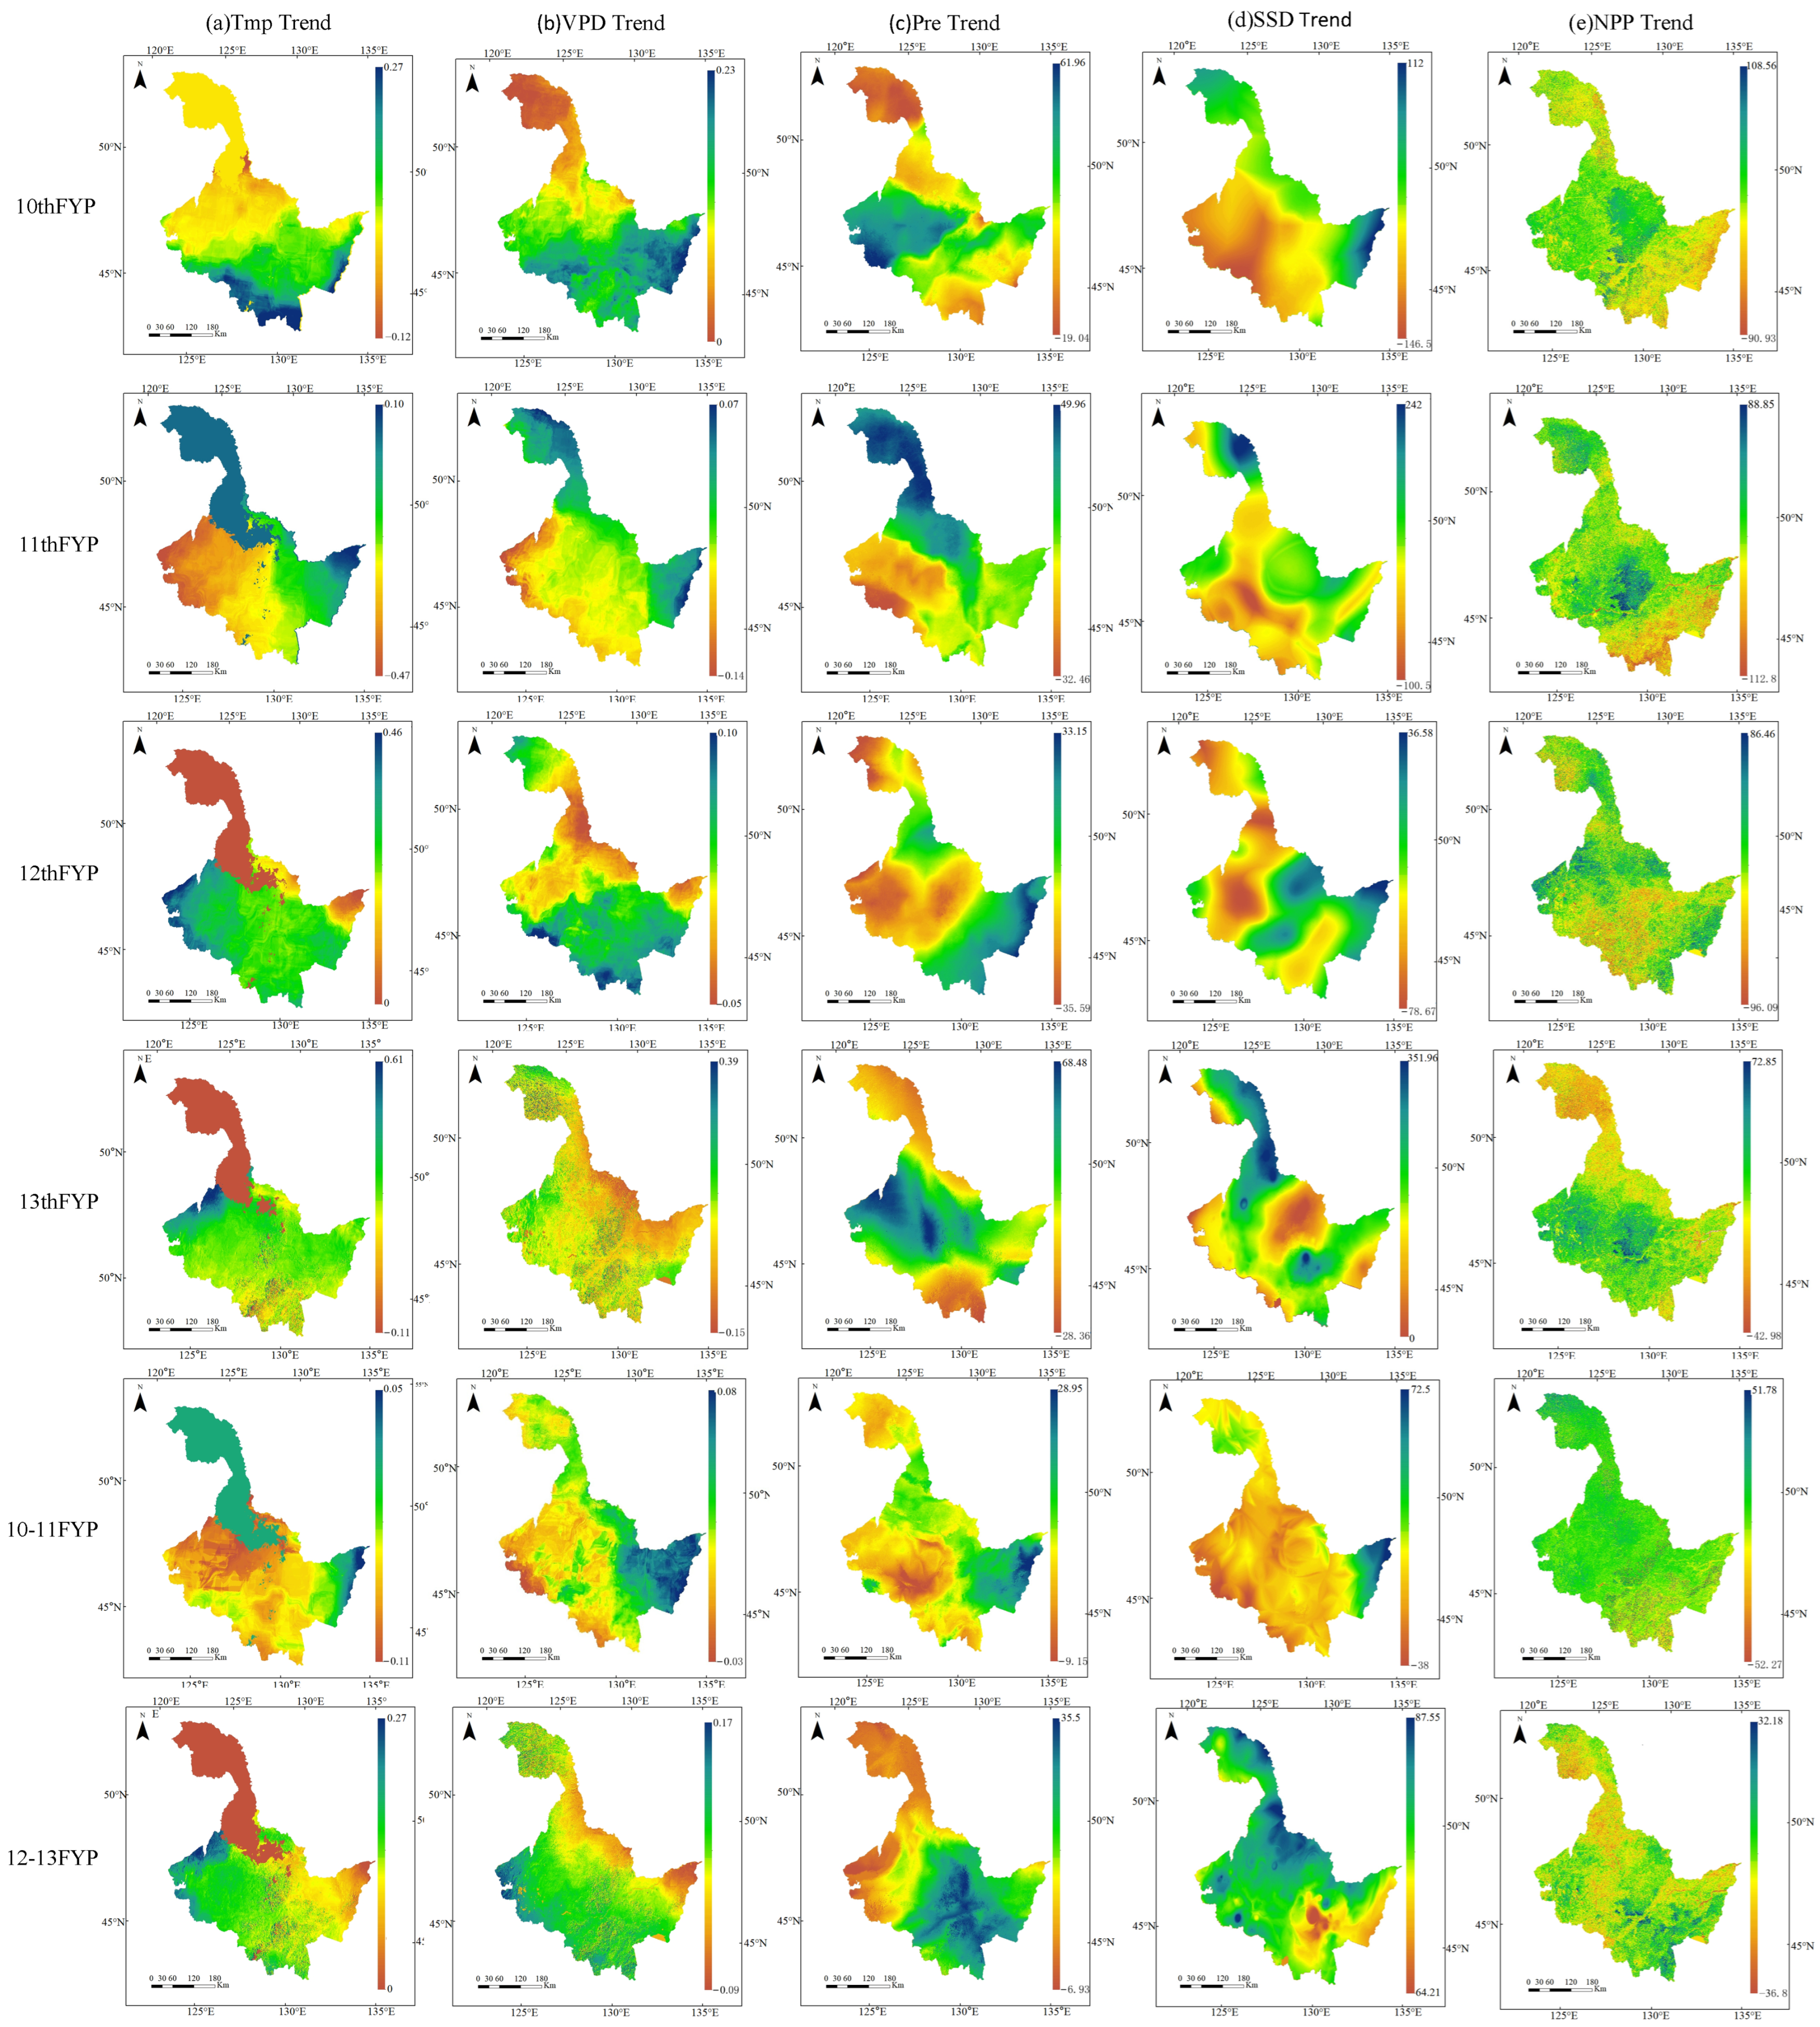
To explore the overall variation trends of NPP, Tmp, Pre, VPD, and SSD in Heilongjiang Province, Figure 5 presents the trends of these variables during different FYP periods.
During the 10th FYP, NPP (+79%), Tmp (+81%), Pre, and VPD were dominated by significant increasing trends, with NPP and Pre showing widespread increases. SSD was mainly characterized by a decreasing trend (accounting for 63%), concentrated in the western and southwestern regions. In the 11th FYP, NPP remained predominantly increasing (70%), but spatial heterogeneity intensified. Yichun recorded a sharp rise (+93%, mean 14.5 gC·m−2·a−1), while Mudanjiang showed a marked decline (−82%, mean of −7.2 gC·m−2·a−1), with the decreasing trend shifting southward. Tmp and VPD both reversed to significant decreasing trends (97% and 74% of the decreasing area, respectively). Pre maintained an increasing trend (70%), with the Greater Khingan Range shifting from a decreasing trend in the 10th FYP (mean of −9.4 mm) to an increasing trend (mean of 38.37 mm). SSD continued to decrease, affecting 94% of the area.
During the 12th FYP, NPP (+70%) exhibited a north–south gradient, with higher values in the north and lower in the south, including a significant decrease in Harbin (23% of the overall decrease). Tmp increased consistently across the entire region (mean value of 0.244). Pre shifted to a predominantly decreasing trend (62%), concentrated in the northern, central, and western regions. VPD increased in 74% of the area, while SSD continued to decrease significantly in 85%. In the 13th FYP, NPP maintained an increasing trend (64%) but shifted spatially to higher values in the south and lower values in the north, with the Greater Khingan Range and Heihe forming the core of decreasing areas. The Greater Khingan Range accounted for 35% of the overall decrease. Tmp continued to increase across the entire region (mean of 0.20), with large fluctuations in Mudanjiang (max value of 0.527 °C). Pre increased significantly again (84%), except in the eastern Greater Khingan Range and Mudanjiang, where it decreased (78% of Mudanjiang’s area, mean of −4.08). VPD (94% increasing, mean of 0.047) and SSD both showed highly consistent increasing trends.
For longer-term patterns, the study merged the two stages of 10th–11th FYPs and 12th–13th FYPs. In the 10th–11th FYPs, NPP increased across 68% of the province, with decreases scattered in the southern and southeastern regions (notably Mudanjiang, where 76% of the area declined). Pre increased significantly (mean of 8.6), Tmp and SSD decreased, and VPD showed minimal variation (from −0.02 to 0.07), with only 6% of the area decreasing slightly. In the 12th–13th FYPs, NPP gains intensified (74% of the area), with decreasing areas shifting northward to Heihe and the southern Greater Khingan Range (20% and 26% of total decline, respectively). Pre continued to increase across 82% of the area (mean of 12.7), though values in the northern and western regions remained below the mean. Tmp shifted to a consistent increase across the entire region and SSD reversed to a significant increase (mean of 38.5). VPD expanded its variation range (from −0.09 to 0.17), with an overall pattern of higher values in the west and lower in the east, dominated by an increasing trend (88% of the area), with significant local fluctuations (e.g., in the Greater Khingan Range, Heihe, Yichun, and Mudanjiang).
The study results indicate that NPP showed a sustained increasing trend in each planning period. Despite phase-specific differences in growth rates and spatial patterns, the overall trend reflects a steady improvement in regional vegetation productivity. This change is driven by both climatic conditions (e.g., increased Pre and suitable Tmp) and is closely related to climate adaptability and targeted human management policies (e.g., forest protection in Yichun during the 11th FYP).
Tmp generally rose in sync with global warming but displayed regional and periodic fluctuations. Pre increased in most periods but exhibited significant spatiotemporal heterogeneity. VPD’s sustained increase is consistent with the enhanced atmospheric water-holding capacity caused by rising temperatures. SSD decreased in most periods but reversed to an increasing trend during the 12th–13th FYPs and 13th FYP, reflecting complex interactions among cloud cover, aerosols, and anthropogenic activities.

3.3. Relationships Between NPP and Climatic Factors

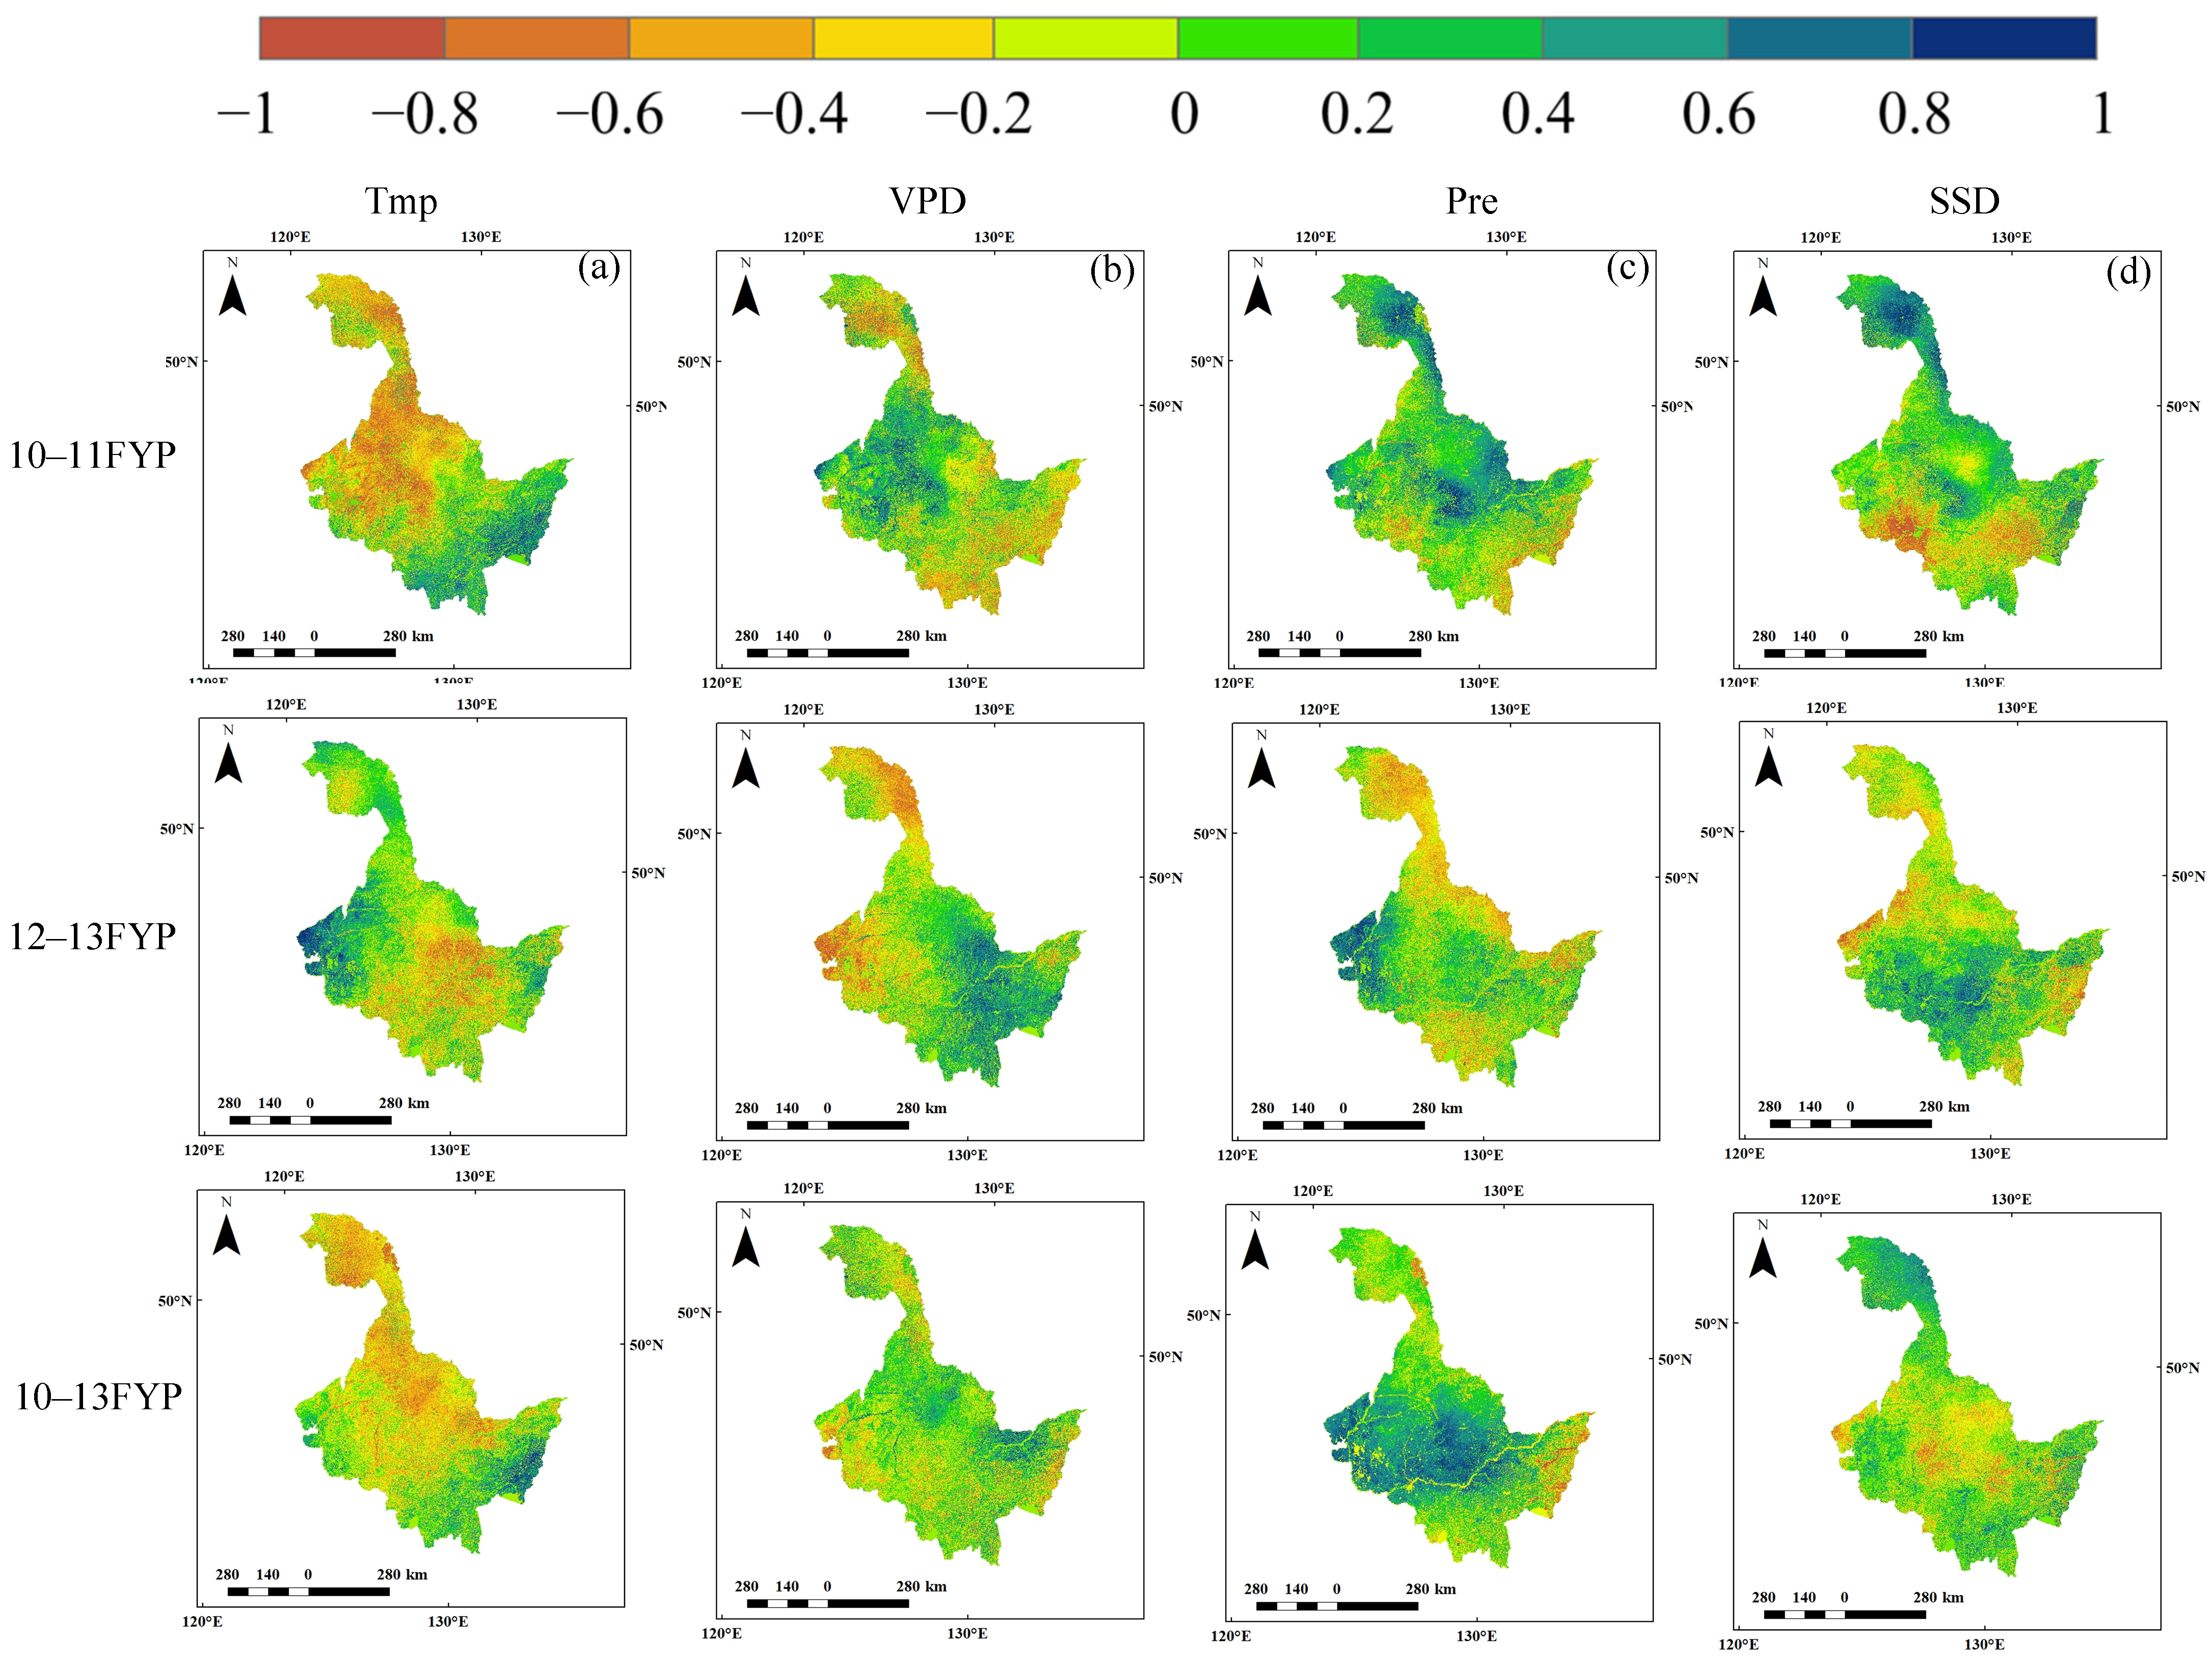
To assess the impacts of climatic factors on NPP during different FYP periods, pixel-wise partial correlations between Pre, Tmp, VPD, SSD, and NPP were calculated. Given that a single FYP period is relatively short and may not fully capture stable partial correlations between climatic factors and NPP, the analysis focused on longer time spans—10th–11th FYPs, 12th–13th FYPs, and 10th–13th FYPs (Figure 6).
During 2001–2020 (10th–13th FYPs), the relationships between NPP and climatic factors in Heilongjiang Province exhibited distinct spatiotemporal differentiation and dynamic variation patterns. As a key climatic factor, Tmp showed a predominantly non-significant negative correlation with NPP (64% of the area), with a mean correlation coefficient of −0.15. This phenomenon may suggest that warming-induced increases in evapotranspiration can inhibit vegetation growth. The negative correlation was spatially heterogeneous: the central and northern parts of the study area mainly showed negative correlations, while the southern and southeastern regions (particularly Mudanjiang) exhibited significant positive correlations (mean of 0.29; positive in 80% of the area), indicating that vegetation in these regions may have stronger temperature adaptability. Over time, the proportion of negative correlation areas decreased from 65% to 52% during the 12th–13th FYPs, likely due to ecological engineering projects enhancing vegetation resilience to temperature changes.
The relationship between Pre and NPP showed more complex characteristics. Across the entire study period, positive correlations dominated (78%). In the 10th–11th FYPs, positive correlations reached 74%, significantly promoting vegetation growth in central regions dominated by CPL and GL. However, in the 12th–13th FYPs, the proportion of positive correlations decreased to 47%, suggesting that sustained high precipitation may surpass optimal water requirements, potentially reducing productivity. VPD maintained a stable positive relationship with NPP over time (54% of the area), with the mean correlation coefficient increasing from 0.031 (10th–11th FYPs) to 0.078 (12th–13th FYPs). This strengthening trend indicates that vegetation has gradually developed physiological adaptation mechanisms to drought stress, enabling plants to maintain productivity under moderate water deficits.

3.4. The Impact of Climatic Factors and FYP on NPP

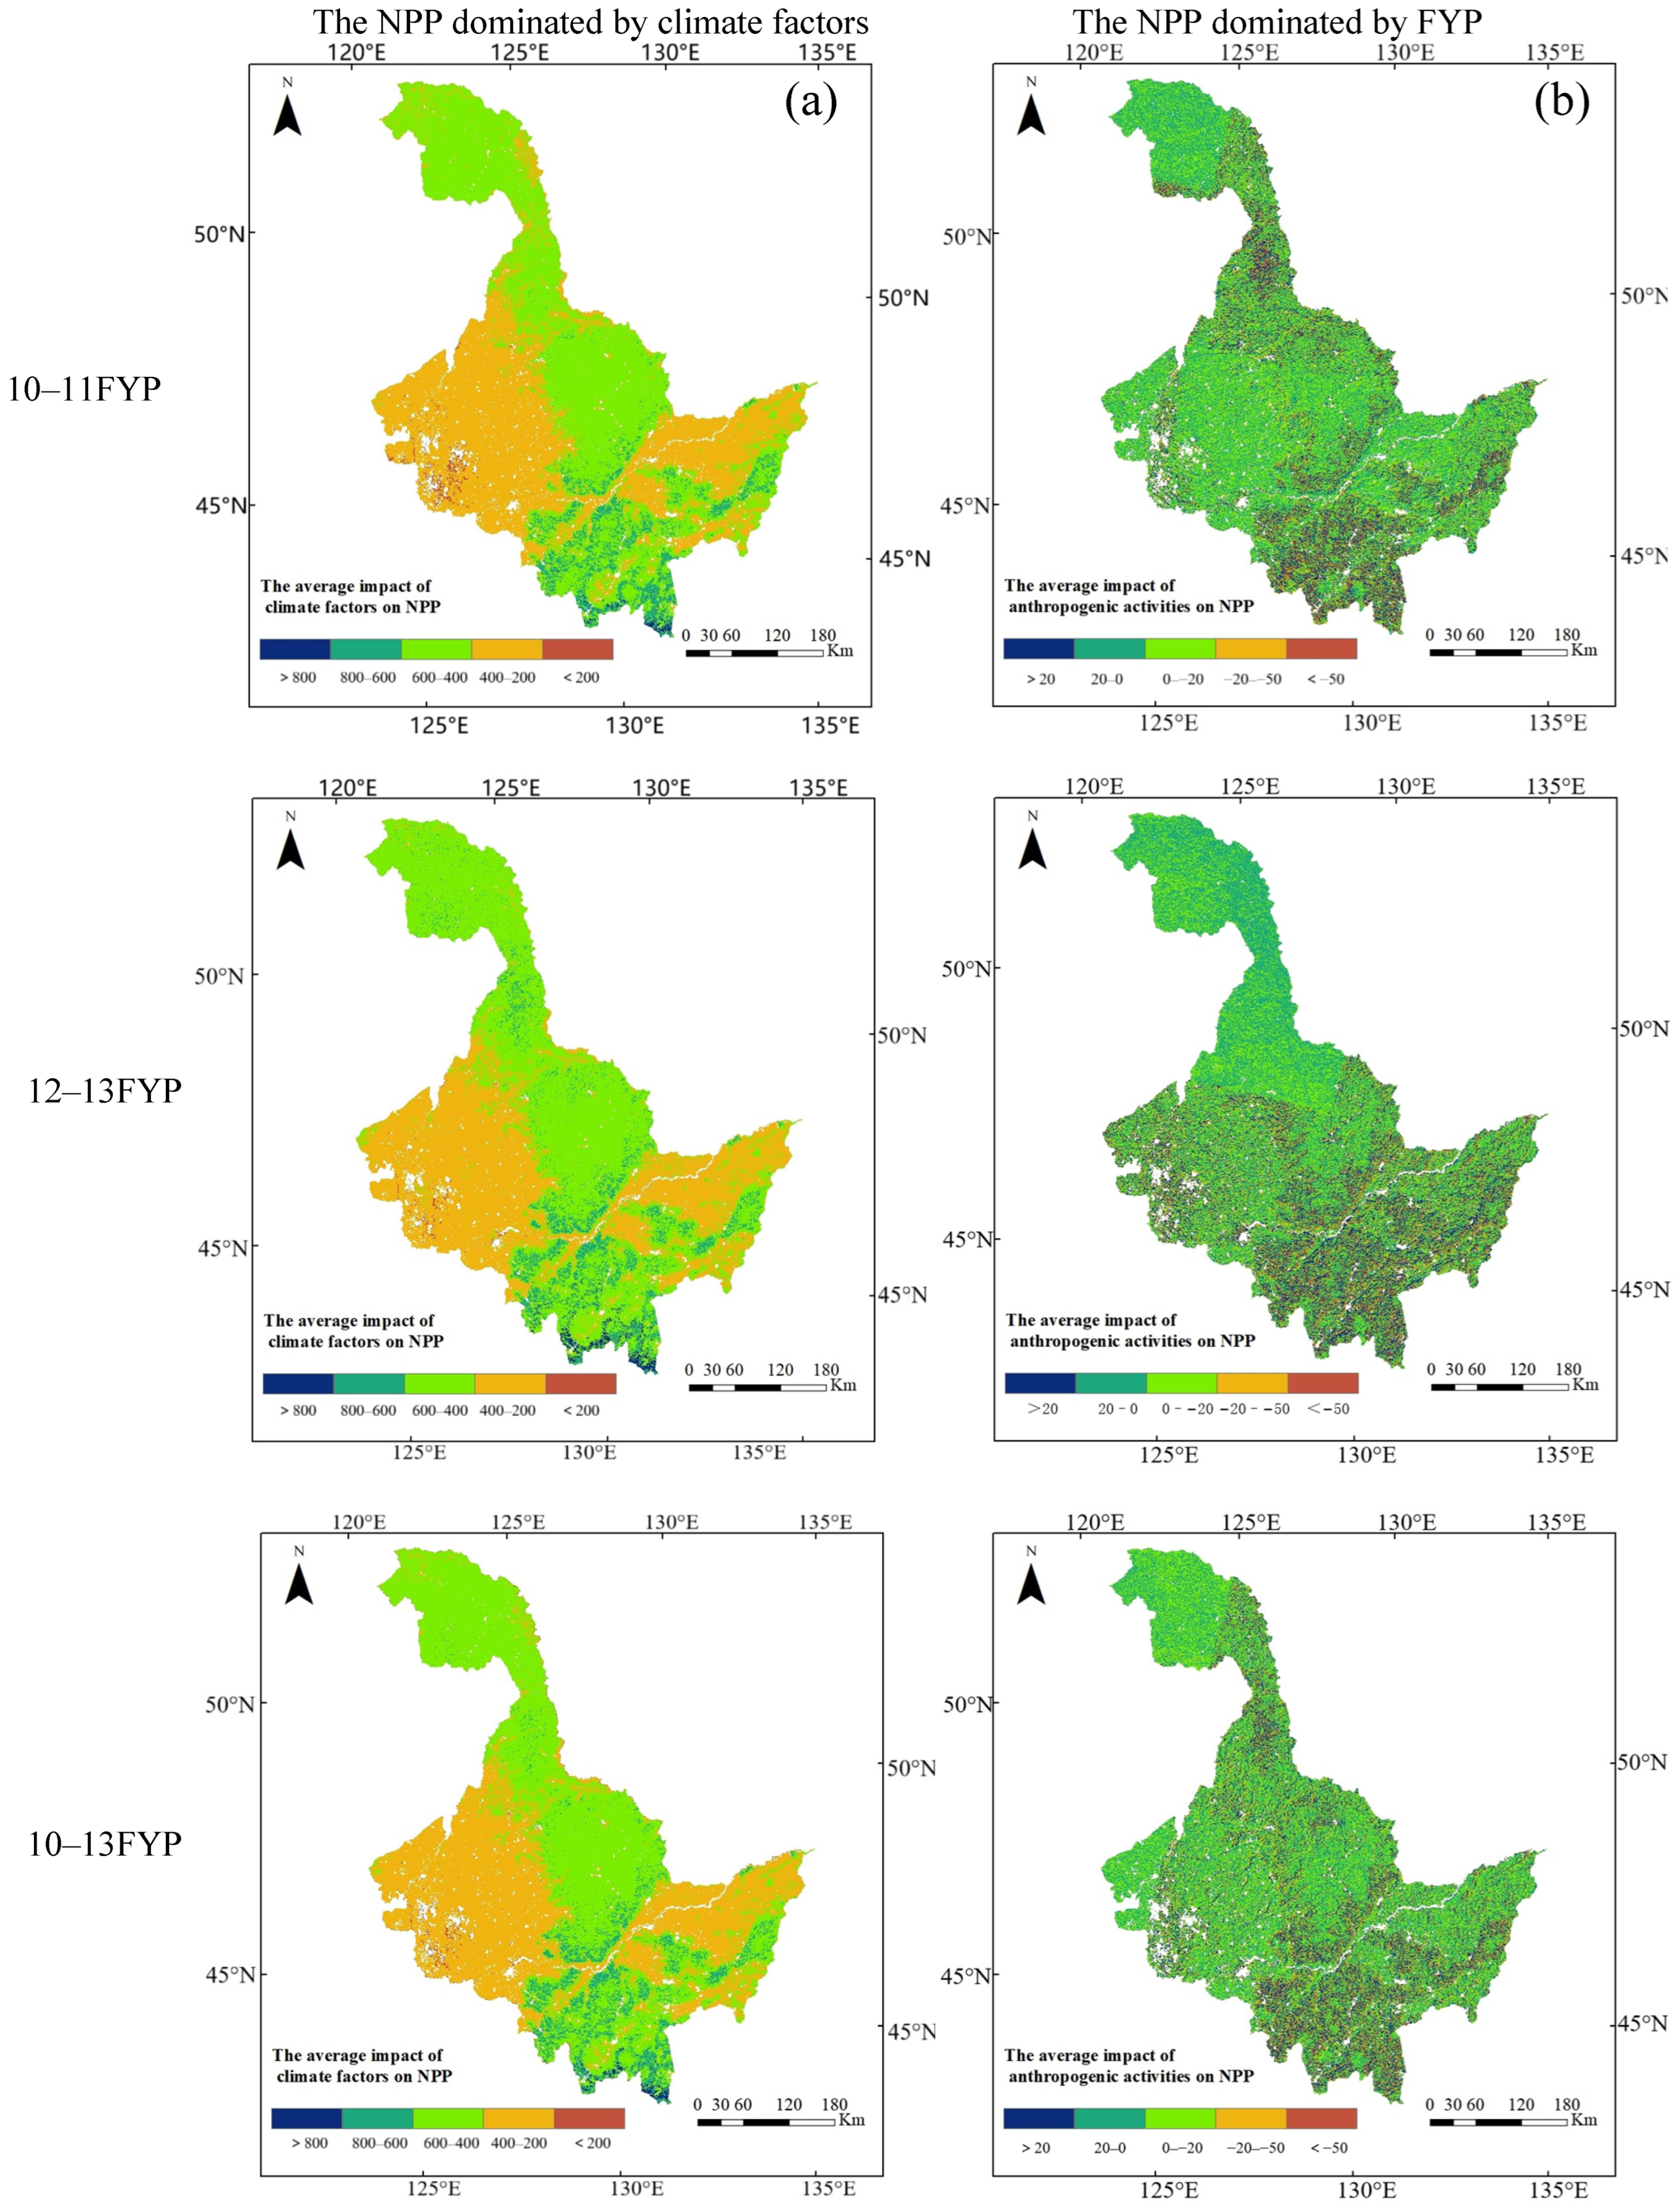
To disentangle the interactive effects of FYPs and climatic factors on NPP, this study employed the residual analysis method to quantify the relative contributions of each driver (Figure 7). Given the short temporal span of a single FYP cycle, which limits the ability to capture long-term trends and cumulative effects, the study period was divided into two sub-stages—10th–11th FYPs (2001–2010) and 12th–13th FYPs (2011–2020)—to improve analysis robustness.
The results (Figure 7) indicate that the impacts of climatic factors and FYP policies on NPP exhibit significant spatiotemporal heterogeneity. The impact value of climatic factors (IVclimate) ranged from 200 to 600 gC·m−2·a−1, with the mean value increasing from 411 gC·m−2·a−1 during the 10th–11th FYPs to 449 gC·m−2·a−1 during the 12th–13th FYPs. Forest ecosystems showed the strongest responses (400–600 gC·m−2·a−1), while CPL and GL were less sensitive (200–400 gC·m−2·a−1), indicating a clear vegetation type-dependent climate response. In contrast, the impact value of FYP policies (IVFYP) was smaller in magnitude (−20~20 gC·m−2·a−1) but showed significant spatial patterns. During the 10th–11th FYPs, negative policy impacts were concentrated in the southern region (52% of Mudanjiang’s area with |IVFYP| > 20) and northern region (32% of Heihe’s area). During the 12th–13th FYPs, the affected area had expanded southward and intensified, with the proportion of areas showing |IVFYP| > 20 increasing from 24% to 30%.
Over the long-term (10th–13th FYPs), climatic factors dominated NPP variation, with mean IVclimate values approximately two orders of magnitude greater than IVFYP. FYP impacts, while spatially variable, showed a consistent negative effect (mean value of −2.04 gC·m−2·a−1), and their spatial pattern closely matched the intensity of regional policy implementation.

3.5. Analysis of Driving Factors Based on PLS-SEM

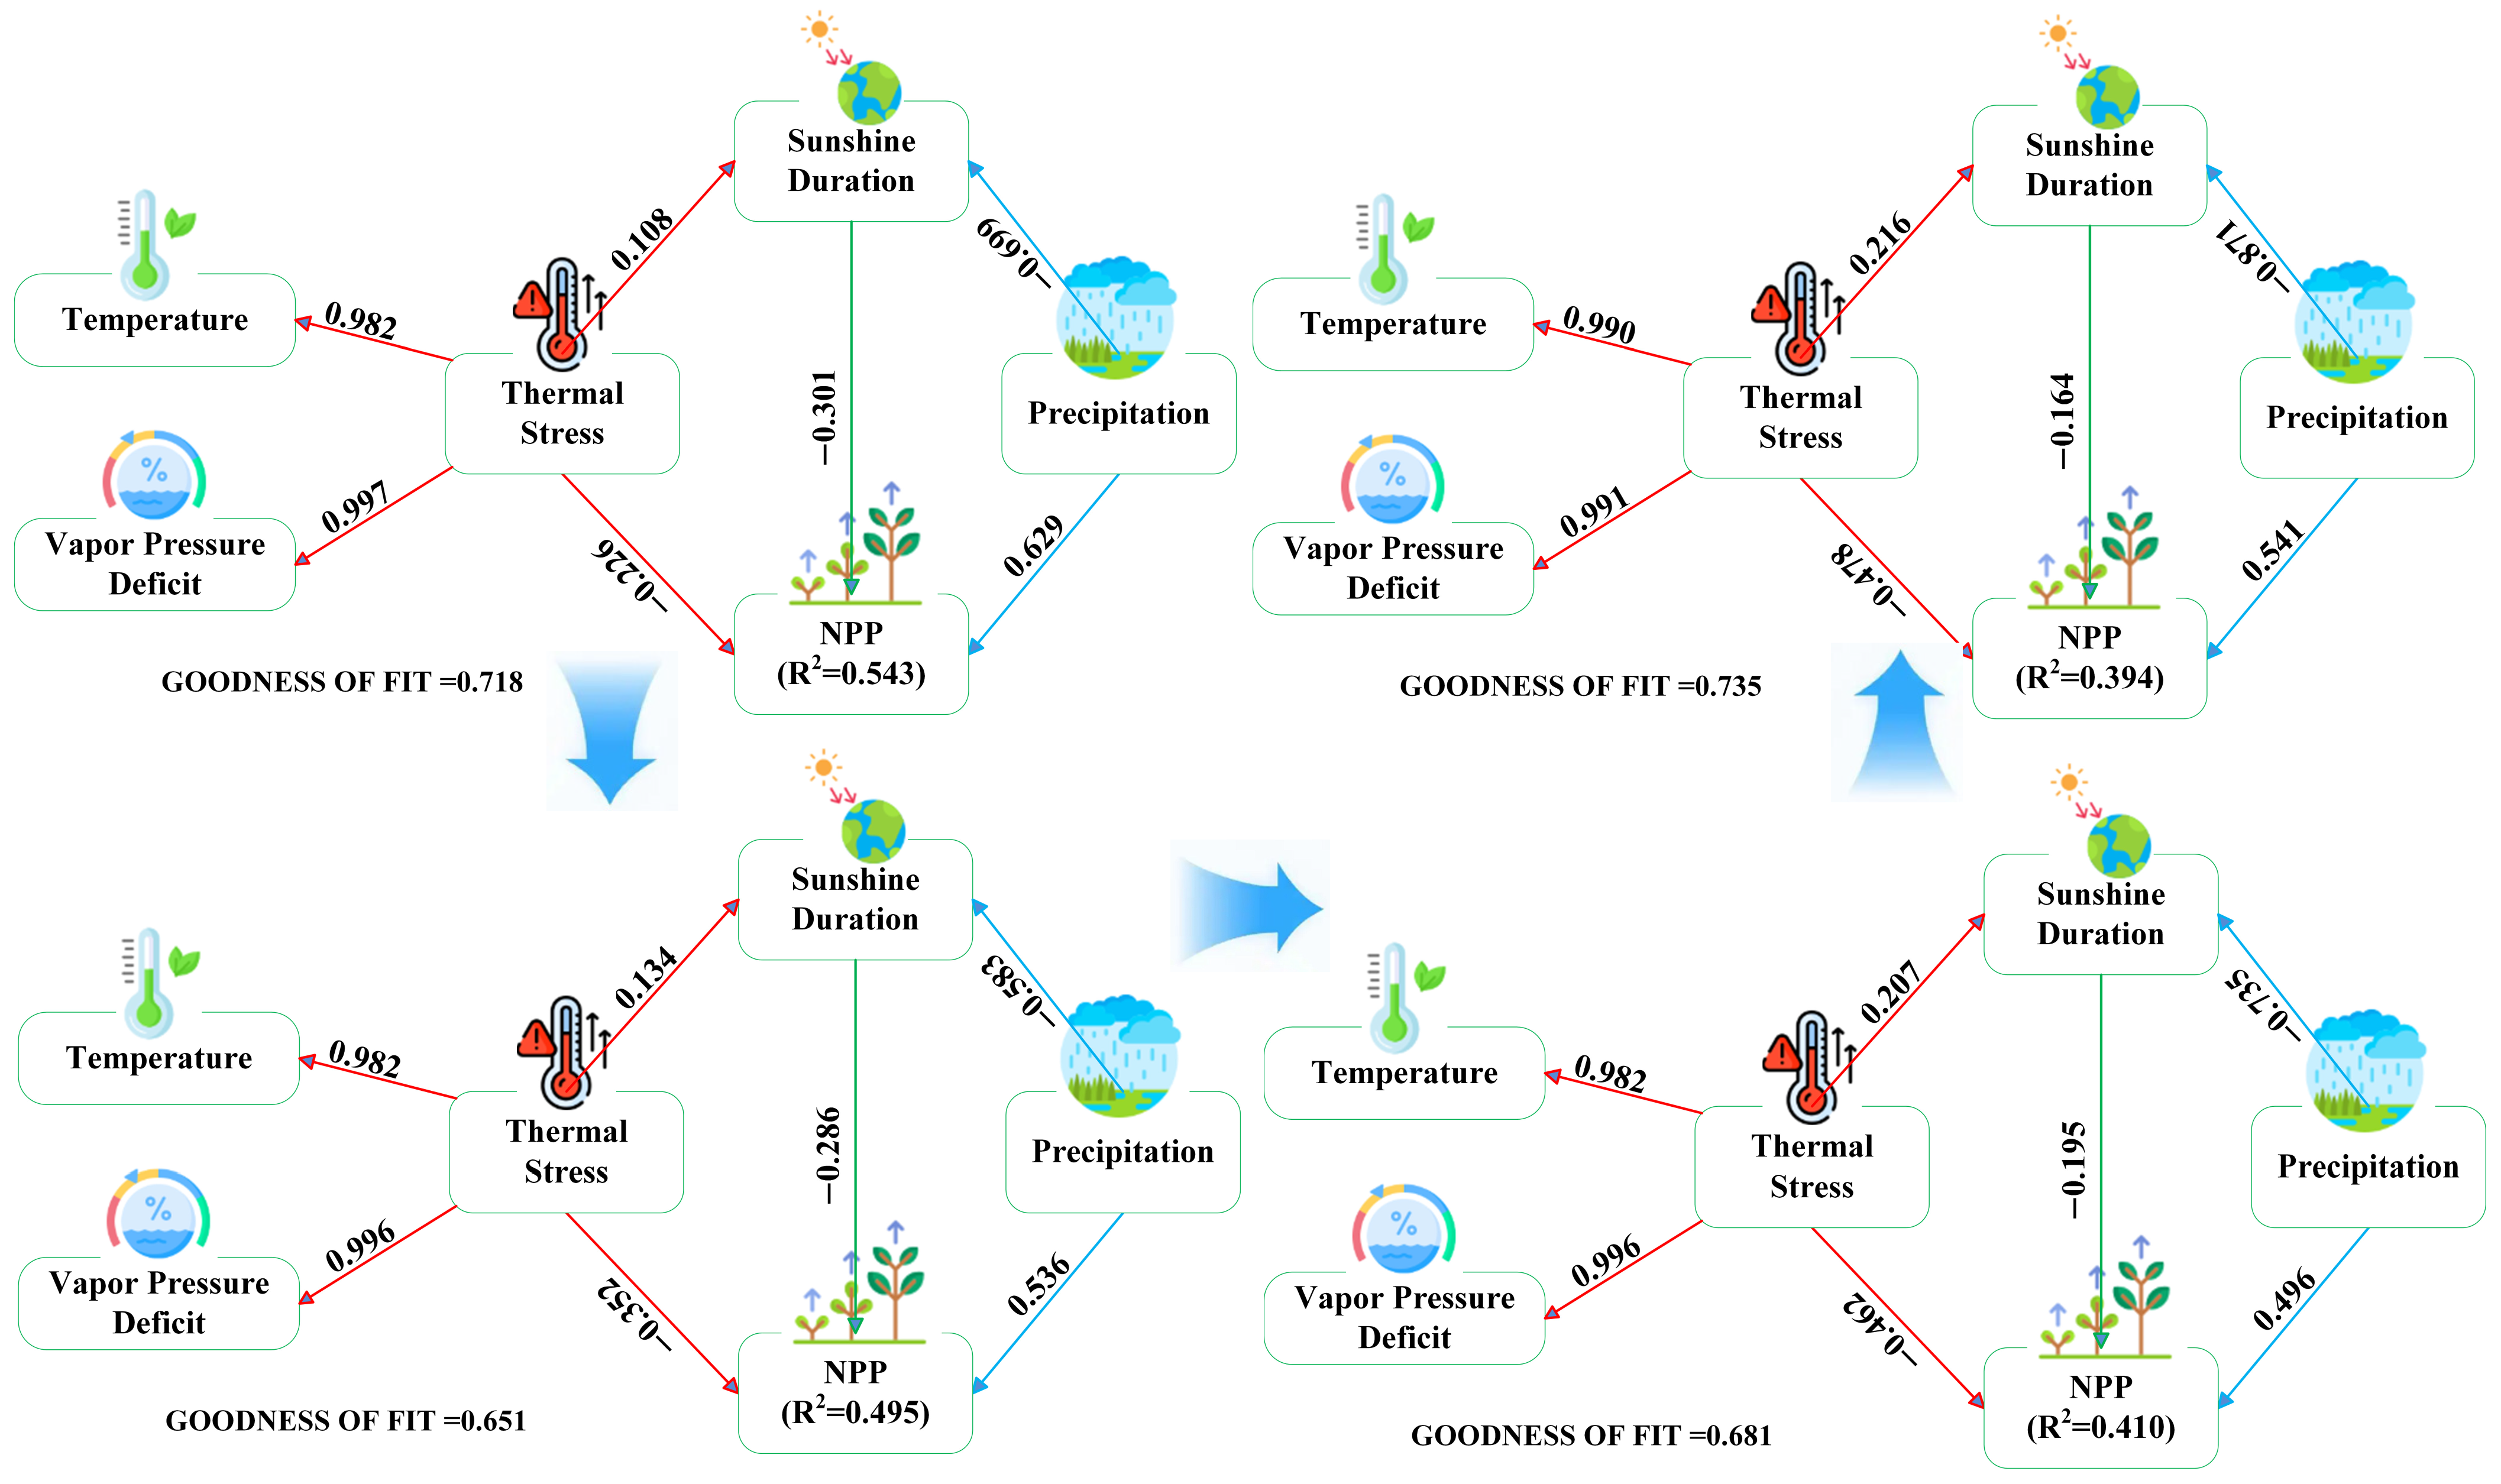
Figure 8 illustrates the links between NPP and the latent variables in the PLS-SEM between 11th FYP and 13th FYP. The model fitting degree is between 0.65 and 0.74, indicating the reliability of the results. In terms of model explanatory power, the explanations of climate factors for the variation in NPP during the 11th FYP and 13th FYP period were 54.3%, 49.5%, 41%, and 39.4%, respectively, showing a decreasing trend. Precipitation consistently exerted a positive effect on NPP across the 11th to 13th FYPs, with path coefficients of 0.629, 0.536, 0.496, and 0.541, making it the most significant factor influencing vegetation NPP. In contrast, thermal stress had a negative effect on NPP, with an increasingly stronger impact, as reflected by path coefficients of −0.226, −0.352, −0.462, and −0.478.
Additionally, the PLS-SEM model was employed to assess indirect effects among latent variables. During the 11th FYP, the most prominent negative indirect effect on NPP (−0.301) resulted from the combined action of precipitation and thermal stress on sunshine duration. Over time, the influences of precipitation and thermal stress on sunshine duration gradually expanded. Precipitation’s negative effect on sunshine duration intensified, with path coefficients of −0.699, −0.583, −0.753, and −0.871, while thermal stress’s positive effect increased, with path coefficients of 0.108, 0.134, 0.207, and 0.216. The superimposition of these two effects collectively led to a gradual weakening of sunshine duration’s negative impact on vegetation NPP, with path coefficients of −0.301, −0.286, −0.195, and −0.164 across the respective periods.

3.6. Sensitivity Analysis

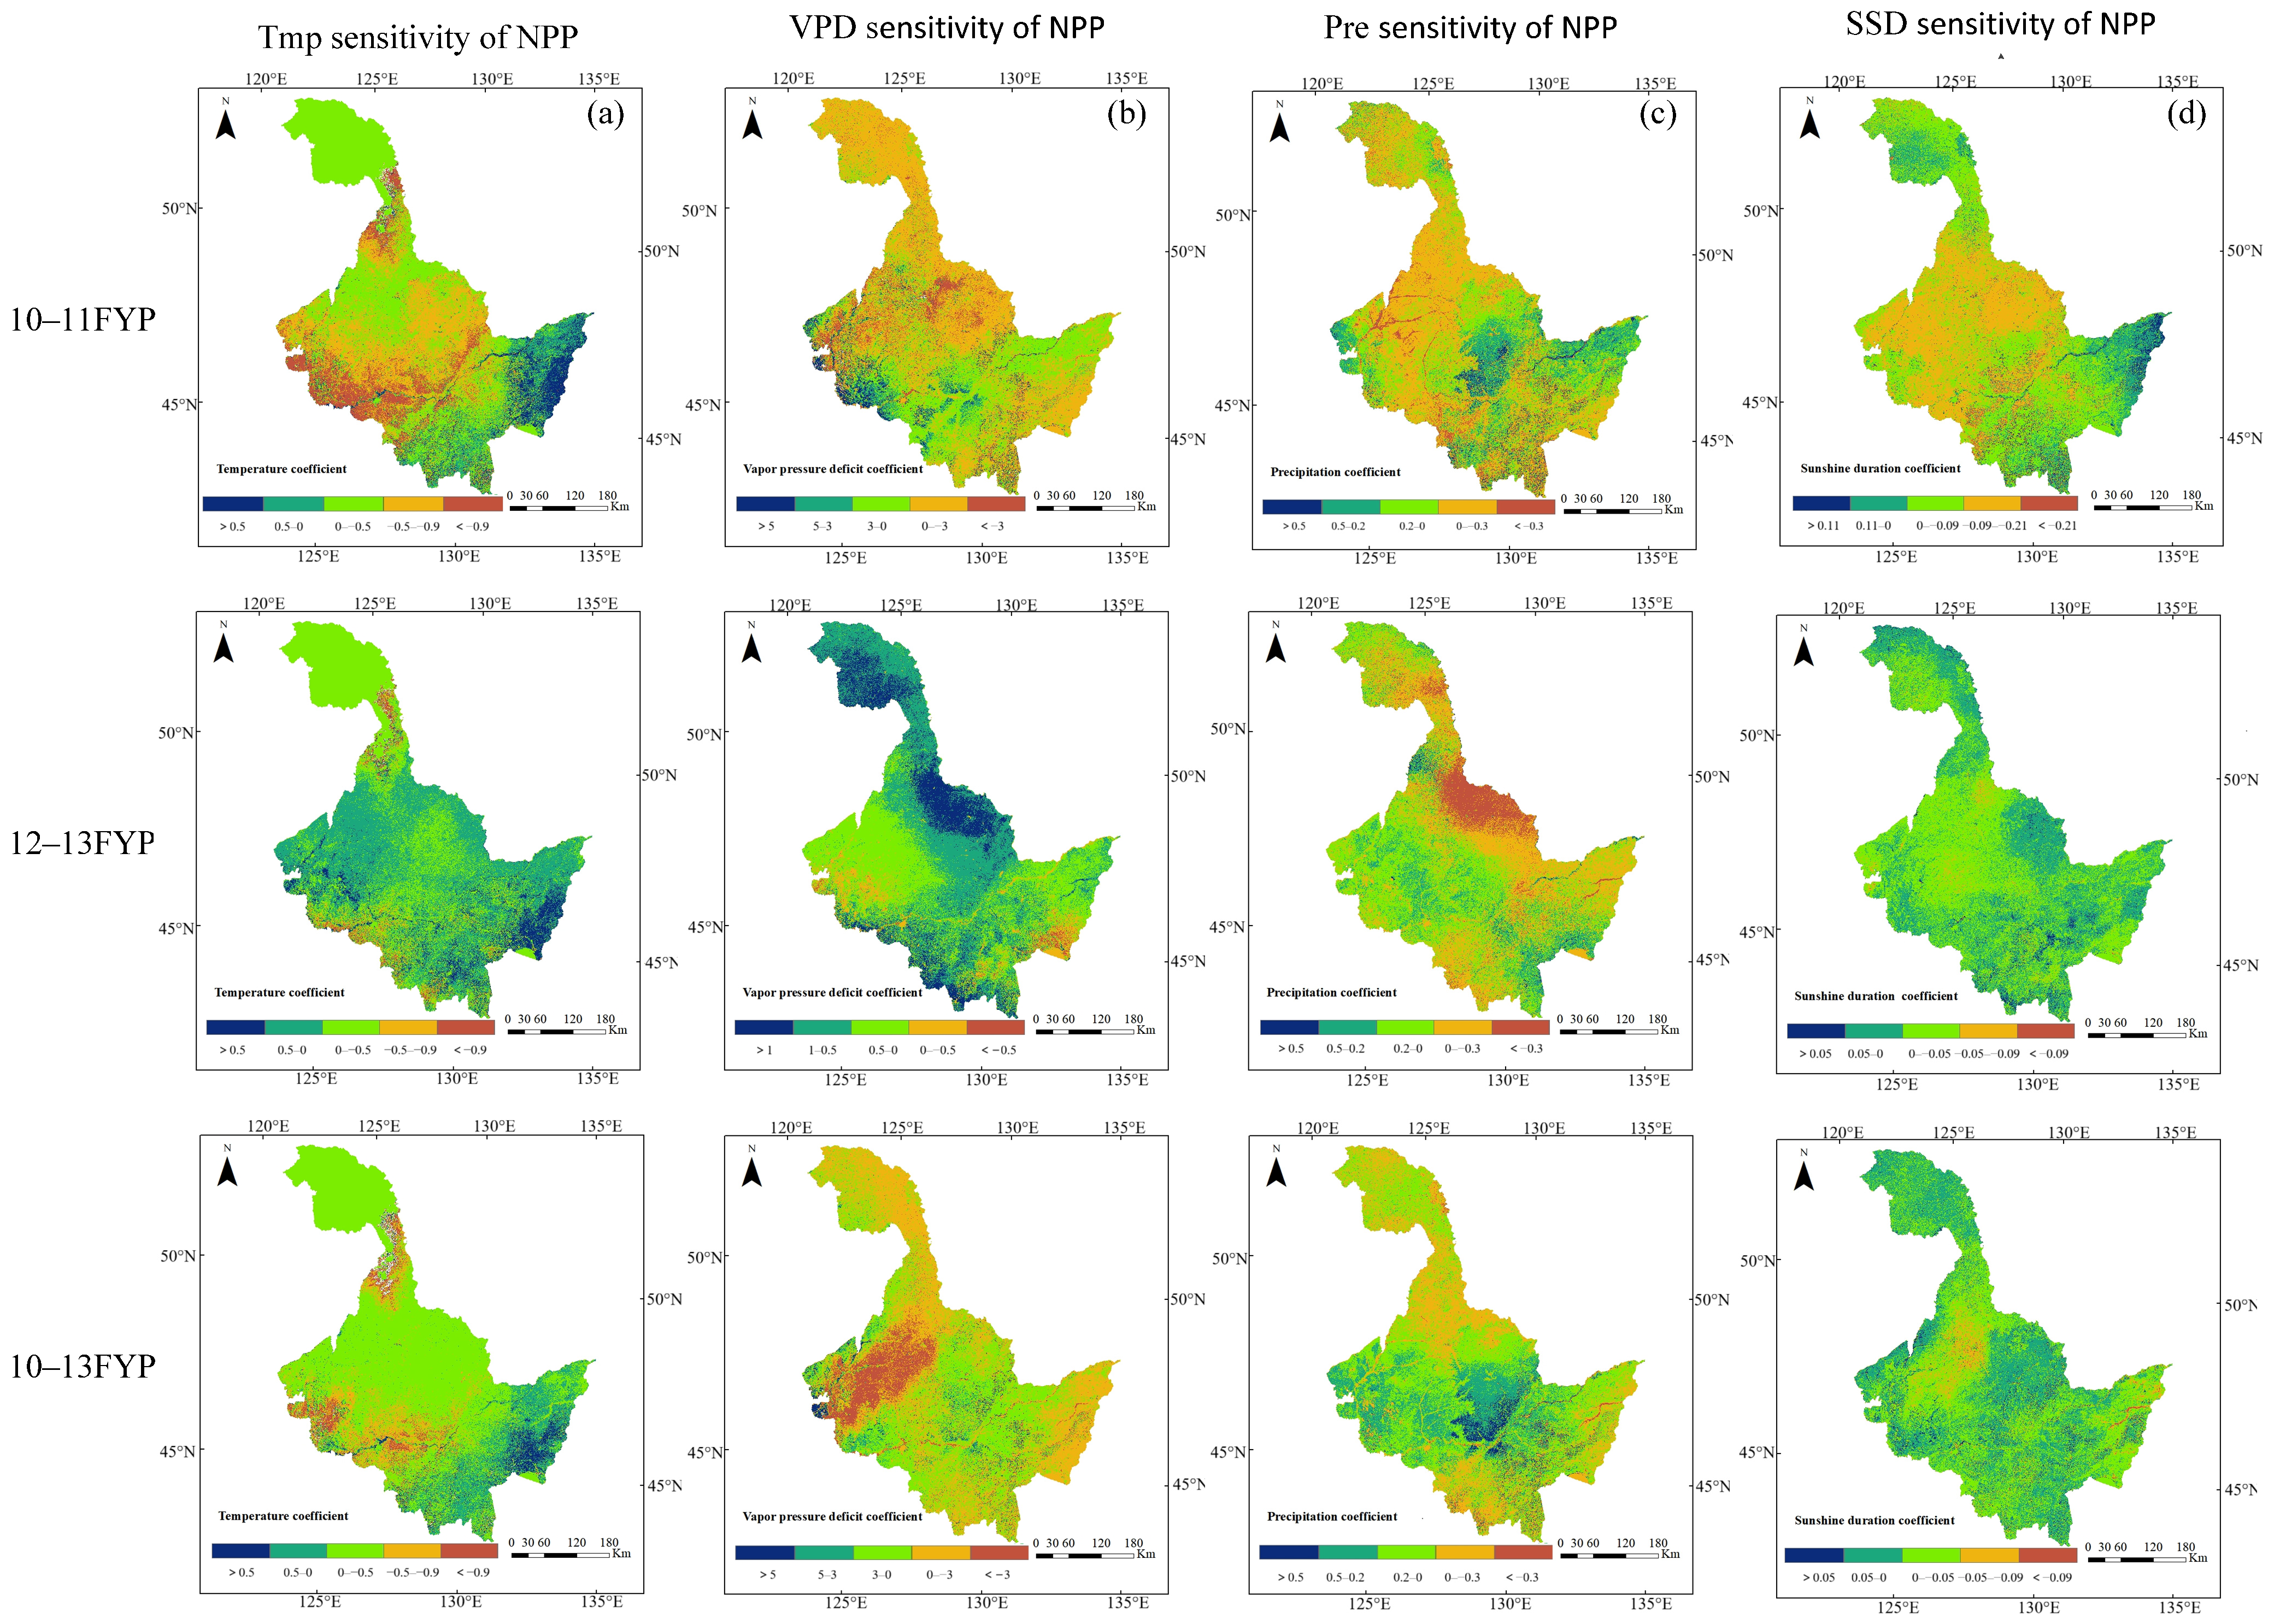
Given the significant influence of climatic factors on NPP within the study area, this study further examined the sensitivity of fine-scale vegetation NPP to individual climatic factors using multiple linear regression, with the SV calculated for each factor (Figure 9).
The results indicate significant spatiotemporal heterogeneity among NPP responses to climatic factors (Figure 9). During the 10th–11th FYPs, NPP showed strong sensitivity to Tmp and VPD, with mean SVs of −0.37 and −0.61, respectively. Among these, 82% of the study area exhibited negative effects of Tmp on NPP, while VPD-sensitive areas accounted for 64% of the total area. In contrast, sensitivity to Pre and SSD was relatively low (mean SVs of 0.004 and −0.06, respectively), with 84% of the area exhibiting absolute Pre sensitivity values <0.3.
During the 12th–13th FYPs, the sensitivity of NPP to climatic factors changed noticeably. VPD remained the dominant factor (mean SV of 0.59; sensitive area = 78%), while Tmp sensitivity weakened significantly (mean SV = 0.07). Sensitivity varied by vegetation type: broad-leaved and needle-leaved forests showed higher sensitivity to Tmp (SV < −0.5), whereas CPL and GL exhibited positive responses. A distinct negative Pre–NPP response emerged in northern regions (Greater Khingan Range, Heihe, Yichun).
Over the full study period (10th–13th FYPs), NPP was most sensitive to changes in VPD and Tmp (composite mean SVs of −0.21 and −0.20, respectively), while sensitivity to SSD and Pre was relatively low (mean SVs of −0.004 and 0.09, respectively). Spatially, NPP in Daqing and Harbin—dominated by HBC and CPL—exhibited strong negative sensitivity to temperature (SV < −0.5), whereas Yichun, dominated by BF, showed strong positive sensitivity to precipitation (SV > 0.5). VPD remained the dominant climatic factor driving NPP changes throughout the study period, with its dominant area accounting for 64%, 78%, and 55% of the study area during the 10th–11th FYPs, 12th–13th FYPs, and 10th–13th FYPs, respectively. Pre emerged as the secondary driver, with its dominant area increasing to 28.7% during the 10th–13th FYPs (up from 21.2% in the 10th–11th FYPs). SSD had the smallest influence range (approximately 4%). Overall, regardless of the temporal scale, VPD consistently emerged as the most sensitive driver of vegetation NPP, highlighting the strong responsiveness of vegetation growth to fluctuations in atmospheric moisture conditions. Such heightened sensitivity may reduce vegetation resilience under extreme drought events, posing risks to ecosystem stability.
A weakening trend in NPP sensitivity to climatic factors was observed over time. During the 12th–13th FYPs, absolute SV values for Tmp and SSD decreased compared with the 10th–11th FYPs, while the absolute SV value for VPD also decreased despite a sign reversal (from −0.61 in the 10th–11th FYPs to 0.59 in the 12th–13th FYPs), resulting in a lower composite value over the full period (−0.21). Although VPD maintained its dominant status—affecting 55% of the area during the 10th–13th FYPs—the proportion of areas dominated by Pre increased from 21.2% in 10th–11th FYPs to 28.7% in the 10th–13th FYPs. This overall weakening of sensitivity may be attributed to ecological restoration measures implemented during the FYP periods—such as afforestation, vegetation rehabilitation, and biodiversity enhancement—which enhanced vegetation adaptability to climate change and partially buffered the direct impacts of climatic factors.

4. Discussion

4.1. Paradigm Shift in NPP Climatic Drivers

An in-depth analysis revealed that the impacts of different climatic factors on NPP exhibit distinct stage-specific evolutionary characteristics. During the 10th–11th FYPs, Pre and Tmp were the dominant factors, showing significant positive and negative influences, respectively. However, during the 12th–13th FYPs, the roles of VPD and SSD intensified significantly, suggesting that vegetation growth in Heilongjiang Province is becoming increasingly constrained by water stress and light-use efficiency.
Although SSD showed an overall weak positive correlation with NPP (50.5% of the area across the entire period), its spatial pattern changed substantially. In the northern part of the study area, correlations shifted from positive to negative, likely due to negative physiological responses—such as stomatal closure and reduced transpiration—induced by excessive sunshine duration, which limits carbon assimilation despite sufficient light.
From an ecosystem response perspective, Pre remained the most consistent positive driver, with its beneficial effects being particularly prominent in central agricultural ecosystems. This is mainly due to the high alignment between growing-season precipitation (June–August) and crop water demand periods. However, the persistence of negative temperature–NPP correlations, combined with the strengthening positive VPD–NPP correlations, indicates that vegetation may face increasing environmental stress under continued climate warming.
Regional differences are also evident: southern regions (e.g., Mudanjiang) exhibit distinctive positive response characteristics, while northern regions (e.g., Greater Khingan Range) are more sensitive to climate change. This spatial heterogeneity provides a scientific basis for formulating differentiated ecological management strategies. Future ecological construction should account for the combined impacts of shifting precipitation patterns, sustained temperature increases, and intensified drought stress on vegetation productivity.

4.2. Drivers of NPP in Heilongjiang

During the period of the 11th FYP to the 13th FYP, PLS-SEM revealed the temporal dynamic response patterns of Net Primary Productivity of vegetation to three types of climatic variables: precipitation, thermal stress, and sunshine duration (Figure 8). The explanatory power of climate factors for NPP variation is weakening. Similar results were found in the study by Wang et al. [50], where, in the Chinese region, the impact of climate factors on NPP was determined to be around 44%. Among these factors, precipitation consistently served as the strongest positive driving factor for NPP, with the path coefficient decreasing from 0.629 during the 11th FYP to 0.541 during the 13th FYP. The 0.08 decline in the coefficient indicates a weakening of its unit effect, possibly related to the changes in precipitation patterns against the backdrop of global warming [51].
In contrast, thermal stress exhibited a significantly intensifying negative impact on NPP. This result aligns with the IPCC [1] report, which highlighted that climate change has substantially increased the probability and intensity of extreme heat events, particularly in tropical regions, leading to damaged photosynthetic machinery, accelerated respiratory carbon loss, and soil water deficiency. By the 13th FYP, thermal stress had become the second-largest regulatory factor for NPP. Meanwhile, PLS-SEM also identified a critical indirect pathway involving PRE-TM-SSD. Although precipitation directly promoted NPP, it reduced SSD by increasing cloud cover, and this negative effect gradually strengthened. Thermal stress, on the other hand, exerted a positive influence on SSD, which also intensified over time. The interaction between solar radiation and precipitation affected the photosynthetic efficiency of vegetation through spatiotemporal differences in water and heat combinations [52]. In summary, the overall explanatory power of climatic factors on NPP increased during the study period, with precipitation remaining the dominant positive driver and thermal stress rapidly emerging as the dominant negative driver. The indirect regulation of SSD by PRE and TM further complicated the dynamics of NPP, highlighting the need for comprehensive climate adaptation strategies. These findings provide scientific support for optimizing vegetation management and climate resilience policies in future planning periods.

5. Limitation

This study was based on refined vegetation classification and systematically analyzed the dynamic changes in Net Primary Productivity (NPP) in Heilongjiang Province from 2001 to 2020. The focus was on exploring the response process of different refined vegetation types to multiple climate driving factors, as well as the feedback regulation mechanism of five-year ecological engineering on climate stress.
However, the spatial resolution of the remote sensing data (1 km) employed here presents a recognized limitation for fine-scale environmental monitoring, particularly in capturing spatial heterogeneity within vegetation functional groups. Although these well-established products provide a consistent and invaluable resource for macro-scale assessments, they potentially obscure critical variations at the sub-pixel level, such as fragmented forest patches, mixed vegetation composition, and localized human disturbances. This can introduce uncertainty in areas with high spatial variability and complicate the precise attribution of NPP changes to specific vegetation types or climate drivers. To address this constraint, subsequent research by the authors will focus on developing advanced downscaling methodologies or data fusion frameworks that incorporate concurrent observations from sensors with higher spatial resolution (e.g., Sentinel-2 MSI at 10–20 m). Such approaches promise to enhance the spatial granularity of existing products while striving to retain the accuracy and temporal consistency of the original datasets, thereby supporting more refined monitoring and mechanism analysis in future ecological studies.

6. Conclusions

This study examined the spatiotemporal dynamics of NPP in Heilongjiang Province from 2001 to 2020 at a refined vegetation-type scale, systematically analyzing the mechanistic impacts of climate change and FYP policies on NPP. The principal findings are as follows:
(1)
During the 12th FYP, MLF exhibited the highest single-period NPP increase (+58.4 gC·m−2·a−1), significantly exceeding other vegetation types, and emerged as the primary driver of provincial NPP growth. Over the entire study period, DNF showed the highest cumulative NPP gain (+64 gC·m−2·a−1). However, 57%–62% of DNF areas shifted to a declining trend during the 12th–13th FYPs (p < 0.01), reflecting the divergent sensitivity of coniferous vegetation to late-stage climatic and management conditions.
(2)
Analysis of climatic driving mechanisms revealed Pre as the key positive driver during the 10th–11th FYPs (positive correlation in 74% of the area), while VPD significantly strengthened and became the primary limiting factor during the 12th–13th FYPs (positive correlation proportion rising to 54%; mean correlation coefficient increasing from 0.031 to 0.078). Tmp predominantly exerted negative effects on NPP throughout the period (negative correlation in 64% of the area; mean correlation coefficient = −0.15), but the extent of negatively affected areas decreased from 65% to 52% during the 12th–13th FYPs, suggesting that FYP ecological projects have partially mitigated warming-induced growth inhibition.
(3)
NPP changes in forest vegetation (broad-leaved, coniferous, mixed forests) were primarily governed by VPD (SV values ranging from −0.61 to 0.59), with substantial climatic contributions (400–600 gC·m−2·a−1). In contrast, grasslands and croplands showed high sensitivity to temperature stress (SV values as low as −0.5), weak responses to precipitation and VPD, lower climatic contributions (200–400 gC·m−2·a−1), and limited resilience, demonstrating distinct zonal differentiation. The overall influence of FYP policies was weakly negative (IV_FYP = −2.04) but displayed significant spatial heterogeneity.

Author Contributions

T.X. and J.H.: methodology; T.X.: formal analysis; J.H.: investigation; J.H.: resources; T.X.: data curation; T.X.: writing—original draft preparation; J.H.: writing—review and editing. All authors have read and agreed to the published version of the manuscript.

Funding

This work was supported by the National Natural Science Foundation of China (Grant Nos. 42401488, 42571520, and 42071351), the National Key Research and Development Program of China (Grant Nos. 2020YFA0608501 and 2017YFB0504204), Liaoning Province Doctoral Research Initiation Fund Program (2023-BS-202), and the Basic Research Projects of Liaoning Department of Education (JYTQN2023202).

Data Availability Statement

The original contributions presented in this study are included in the article. Further inquiries can be directed to the corresponding author(s).

Acknowledgments

Many thanks to NASA and GEE for providing free datasets.

Conflicts of Interest

The authors declare no conflicts of interest.

References

  1. IPCC. Climate Change 2022: Impacts, Adaptation, and Vulnerability. Contribution of Working Group II to the Sixth Assessment Report of the Intergovernmental Panel on Climate Change; Cambridge University Press: Cambridge, UK; New York, NY, USA, 2022. [Google Scholar]
  2. Chen, L.; Msigwa, G.; Yang, M.Y.; Osman, A.I.; Fawzy, S.; Rooney, D.W.; Yap, P.S. Strategies to achieve a carbon neutral society: A review. Environ. Chem. Lett. 2022, 20, 2277–2310. [Google Scholar] [CrossRef] [PubMed]
  3. Wei, X.; Yang, J.; Luo, P.; Lin, L.G.; Lin, K.L.; Guan, J.M. Assessment of the variation and influencing factors of vegetation NPP and carbon sink capacity under different natural conditions. Ecol. Indic. 2022, 138, 108834. [Google Scholar] [CrossRef]
  4. Yan, F.; Li, C.Y.; Wang, J.; Lu, Z.X.; Huang, X.H.; Wang, M.L.; Wang, W.D.; Li, R.Q.; Pang, J.; Chen, Y.H. Quantitative Analysis of Driving Forces for Spatiotemporal Evolution of Vegetation NPP in the Beijing-Tianjin-Hebei Ecological Barrier Zone. Environ. Sci. 2025, 46, 327–339. [Google Scholar] [CrossRef]
  5. Li, J.; Liang, W.; Xu, M.; Tian, H.; Gao, X.; Yang, Y.; Hu, R.; Zhang, Y.; Cao, C. Threshold Extraction and Early Warning of Key Ecological Factors for Grassland Degradation Risk. Remote Sens. 2025, 17, 3098. [Google Scholar] [CrossRef]
  6. Kharuk, V.I.; Petrov, I.A.; Shushpanov, A.S.; Im, S.T.; Ondar, S.O. Scots Pine at Its Southern Range in Siberia: A Combined Drought and Fire Influence on Tree Vigor, Growth, and Regeneration. Forests 2025, 16, 819. [Google Scholar] [CrossRef]
  7. Kharuk, V.I.; Petrov, I.A.; Im, S.T.; Golyukov, A.S.; Dvinskaya, M.L.; Shushpanov, A.S. Pollution and Climatic Influence on Trees in the Siberian Arctic Wetlands. Water 2023, 15, 215. [Google Scholar] [CrossRef]
  8. Hui, W.T.; Ru, T.B.; Hong, F.Z.; Yan, J. Driving factors and gradient effect of net primary productivity in Fenhe River Basin. Chin. J. Ecol. 2019, 38, 3066–3074. [Google Scholar] [CrossRef]
  9. Xi, Z.L.; Chen, G.Z.; Xing, Y.Q.; Xu, H.D.; Tian, Z.Y.; Ma, Y.; Cui, J.; Li, D. Spatial and temporal variation of vegetation NPP and analysis of influencing factors in Heilongjiang Province, China. Ecol. Indic. 2023, 154, 110798. [Google Scholar] [CrossRef]
  10. Shi, X.L.; Yang, Z.Y.; Wang, X.S.; Gao, J.; Hu, Y. Spatial and temporal variation of net primary productivity and its relationship with climate factors in the Chinese loess plateau. Chin. J. Agrometeorol. 2016, 37, 445–453. [Google Scholar] [CrossRef]
  11. Wang, C.; Jiang, Q.; Deng, X.; Lv, K.X.; Zhang, Z.H. Spatio-Temporal Evolution, Future Trend and Phenology Regularity of Net Primary Productivity of Forests in Northeast China. Remote Sens. 2020, 12, 3670. [Google Scholar] [CrossRef]
  12. Cui, J.X.; Wang, Y.D.; Zhou, T.C.; Jiang, L.L.; Qi, Q.W. Temperature Mediates the Dynamic of MODIS NPP in Alpine Grassland on the Tibetan Plateau, 2001–2019. Remote Sens. 2022, 14, 2401. [Google Scholar] [CrossRef]
  13. Wang, D.D.; Qin, W.; Jia, G.D.; Shan, Z.J.; Hao, M. Assessing the effects of climate variability and vegetation conversion on variations of net primary productivity in the mountainous area of North China. For. Ecol. Manag. 2022, 506, 119957. [Google Scholar] [CrossRef]
  14. Chen, T.; Huang, Q.; Liu, M.; Qu, L.; Deng, S.L.; Chen, D. Decreasing Net Primary Productivity in Response to Urbanization in Liaoning Province, China. Sustainability 2017, 9, 162. [Google Scholar] [CrossRef]
  15. Zhang, J.; Zhang, Y.X.; Qin, Y.; Lu, X.; Cao, J.J. The spatiotemporal pattern of grassland NPP in Inner Mongolia was more sensitive to moisture and human activities than that in the Qinghai-Tibetan Plateau. Glob. Ecol. Conserv. 2023, 48, e02709. [Google Scholar] [CrossRef]
  16. Wang, Z.; Bai, T.; Xu, D.; Kang, J.; Shi, J.; Fang, H.; Nie, C.; Zhang, Z.J.; Yan, P.W.; Wang, D.N. Temporal and Spatial Changes in Vegetation Ecological Quality and Driving Mechanism in Kökyar Project Area from 2000 to 2021. Sustainability 2022, 14, 7668. [Google Scholar] [CrossRef]
  17. Fu, A.; Li, W.; Chen, Y.N.; Wang, Y.; Hao, H.C.; Li, Y.P.; Sun, F.; Zhou, H.H.; Zhu, C.G.; Hao, X.M. The effects of ecological rehabilitation projects on the resilience of an extremely drought-prone desert riparian forest ecosystem in the Tarim River Basin, Xinjiang, China. Sci. Rep. 2021, 11, 18485. [Google Scholar] [CrossRef] [PubMed]
  18. Cheng, C.; Yu, M.; Mao, Z.; Xie, L.; Zhang, Y.; Sun, T.; Xu, Z.; Wu, S.; Li, Q.; Xu, J. Spatio-temporal Evolution and Mutation Patterns of NPP in Heilongjiang Province Under the Process of Ecological Protection and Restoration in China. J. For. Sci. 2022, 58, 23–31. [Google Scholar] [CrossRef]
  19. Zhang, J.; Zhang, Y. Quantitative Assessment of the Impact of the Three-North Shelter Forest Program on Vegetation Net Primary Productivity over the Past Two Decades and Its Environmental Benefits in China. Sustainability 2024, 16, 3656. [Google Scholar] [CrossRef]
  20. Hu, A.; Yan, Y.; Lyu, J. An Important Means of China’s Development Miracle: Taking the Transformation of Five-Year Plans as an Example (from the 6th Five-Year Plan to the 11th Five-Year Plan). J. Tsinghua Univ. 2011, 26, 43–52+158. [Google Scholar] [CrossRef]
  21. Gao, J.; Liu, Y. Climate warming and land use change in Heilongjiang Province, Northeast China. Appl. Geogr. 2011, 31, 476–482. [Google Scholar] [CrossRef]
  22. Liu, S.; Ding, Z.; Lin, Y.; Yao, S.B. The Efficiency of Forest Management Investment in Key State-Owned Forest areas under the Carbon Neutral Target: A Case Study of Heilongjiang Province, China. Forests 2022, 13, 609. [Google Scholar] [CrossRef]
  23. Gao, C.Y. Simulation of Forest Carbon Cycle in Heilongjiang Province under Climate Change Scenarios. Ph.D. Thesis, Northeast Forestry University, Harbin, China, 2016. [Google Scholar]
  24. Gao, J.; Liu, Y. Deforestation in Heilongjiang Province of China, 1896–2000: Severity, spatiotemporal patterns and causes. Appl. Geogr. 2012, 35, 345–352. [Google Scholar] [CrossRef]
  25. Wu, Z.; Li, M.; Wang, B.; Tian, Y.P.; Quan, Y.; Liu, J.Y. Analysis of Factors Related to Forest Fires in Different Forest Ecosystems in China. Forests 2022, 13, 1021. [Google Scholar] [CrossRef]
  26. Ma, F.; Jiang, Q.; Xu, L.; Lv, K.X.; Chang, G.L. Processes, potential, and duration of vegetation restoration under different modes in the eastern margin ecotone of Qinghai-Tibet Plateau. Ecol. Ind. 2021, 132, 108267. [Google Scholar] [CrossRef]
  27. Wang, Y.; Tang, W.; Li, S.; Zhao, H.Y.; Xie, J.L.; Ma, C.; Yan, C.Z. Change in grassland productivity in Qinghai Province and its driving factors. Acta Prataculturae Sin. 2022, 31, 1–13. [Google Scholar] [CrossRef]
  28. Peng, S. 1-km Monthly Precipitation Dataset for China (1901–2024); National Tibetan Plateau/Third Pole Environment Data Center: Beijing, China, 2020; Available online: https://data.tpdc.ac.cn/en/data/faae7605-a0f2-4d18-b28f-5cee413766a2 (accessed on 8 October 2025).
  29. Peng, S. 1-km Monthly Mean Temperature Dataset for China (1901–2022); National Tibetan Plateau/Third Pole Environment Data Center: Beijing, China, 2019. [Google Scholar] [CrossRef]
  30. Li, Q.; Liu, X.; Zhang, H.; Thomas, C.P.; David, R.E. Detecting and adjusting temporal inhomogeneity in Chinese mean surface air temperature data. Adv. Atmos. Sci. 2004, 21, 260–268. [Google Scholar] [CrossRef]
  31. Hutchinson, M.F. Interpolating mean rainfall using thin plate smoothing splines. Int. J. Geogr. Inf. Syst. 1995, 9, 385–403. [Google Scholar] [CrossRef]
  32. He, J.; Yang, K.; Tang, W.; Lu, H.; Qin, J.; Chen, Y.Y.; Li, X. The first high-resolution meteorological forcing dataset for land process studies over China. Sci. Data 2020, 7, 25. [Google Scholar] [CrossRef]
  33. Jin, J.; Xiao, Y.; Jin, J.; Zhu, Q.A.; Yong, B.; Ji, Y.Y. Temporal and spatial variation characteristics of extreme hydro meteorological events in the Yangtze River Basin and their impact on vegetation. Prog. Water Sci. 2021, 32, 867–876. [Google Scholar] [CrossRef]
  34. Zhang, H.; Luo, M.; Zhan, W.; Zhao, Y.Q.; Yang, Y.J.; Ge, E.J.; Ning, G.C. HiMIC-Monthly: A 1 km High-Resolution Atmospheric Moisture Index Collection over China, 2003–2020, 2003–2020; National Tibetan Plateau/Third Pole Environment Data Center: Beijing, China, 2023. [Google Scholar] [CrossRef]
  35. Liu, L.B.; Gudmundson, L.; Hauser, M.; Qin, D.H.; Li, S.C.; Sonia, I.S. Soi moisture dominates dyness stress on ecosystem production gilobaly. Nat. Commun. 2020, 1, 4892. [Google Scholar] [CrossRef] [PubMed]
  36. Zhang, X.; Liu, L.; Chen, X.; Gao, Y.; Xie, S.; Mi, J. GLC_FCS30: Global land-cover product with fine classification system at 30 m using time-series Landsat imagery. Earth Syst. Sci. Data 2021, 13, 2753–2776. [Google Scholar] [CrossRef]
  37. Deng, X.Y.; Liu, Y.; Liu, Z.H.; Wu, H.; Zhang, C.; Xie, H.J.; Li, J. Temporal-spatial dynamic change characteristics of evapotranspiration in arid region of Northwest China. Acta Ecol. Sin. 2017, 37, 2994–3008. [Google Scholar] [CrossRef]
  38. Song, Y.; Gao, M.; Wang, Z.; Wang, Z.R.; Wang, J.F.; Xu, Z.X. Exploration of spatiotemporal variation characteristics and driving factors of cultivated land NPP in the Shandong region of the Bohai Sea. Environ. Sci. 2024, 45, 4733–4743. [Google Scholar] [CrossRef]
  39. Wang, G.J.; Peng, W.F.; Zhang, L.D.; Zhang, J. Quantifying the impacts of natural and human factors on changes in NPP using an optimal parameters-based geographical detector. Ecol. Indic. 2023, 155, 111018. [Google Scholar] [CrossRef]
  40. Liu, X.; Luo, Z.; Xiao, H. Temporal and spatial variations of vegetation monthly NPP in the green heart area of Changsha Zhuzhou Xiangtan and its response to climatic and topographic factors. Environ. Sci. 2024, 45, 6888–6898. [Google Scholar] [CrossRef]
  41. Zhao, J.; Du, Z.Q.; Wu, Z.H.; Zhang, H.; Guo, N.; Ma, Z.T.; Liu, X.J. Seasonal variations of day and nighttime warming and their effects onvegetation dynamics in China’s temperate zone. Acta Geogr. Sin. 2018, 73, 395–404. [Google Scholar] [CrossRef]
  42. Jin, K.; Wang, F.; Han, C.; Shi, S.Y.; Ding, W.B. The impact of climate change and human activities on vegetation NDVI changes in China from 1982 to 2015. Acta Geogr. Sin. 2020, 75, 961–974. [Google Scholar] [CrossRef]
  43. Yang, H.; Xing, Y.; Chang, X.; Wang, J.Q.; Li, Y.X.; Tang, J.; Wang, D.J. Internal response of vegetation growth to degrees of permafrost degradation in Northeast China from 2001 to 2020. Geo-Spat. Inf. Sci. 2025, 28, 265–283. [Google Scholar] [CrossRef]
  44. Wang, Y.B.; Zhao, Y.H.; Han, L.; Ao, Y. Spatiotemporal variation of vegetation net primary productivity and its driving factors from 2000 to 2015 in Qinling-Daba Mountains, China. J. Appl. Ecol. 2018, 29, 2373–2381. [Google Scholar] [CrossRef]
  45. Wei, Y.; Yu, D.; Lewis, B.J.; Zhou, L.; Zhou, W.M.; Fang, X.M.; Zhao, W.; Wu, S.N.; Dai, L.M. Forest carbon storage and tree carbon pool dynamics under natural forest protection program in northeastern China. Chin. Geogr. Sci. 2014, 24, 397–405. [Google Scholar] [CrossRef]
  46. Wen, Z.; Zhou, Z.; Wei, X.; Xiao, D.; Xu, L.; Wan, W. Spatio-Temporal Simulation of the Productivity of Four Typical Subtropical Forests: A Case Study of the Ganjiang River Basin in China. Forests 2025, 16, 603. [Google Scholar] [CrossRef]
  47. Dan, Z.; Liu, D.; Luo, H.; Liu, J.W.; Zhang, L.M.; Wei, Y.H. The impact of human activities on the net primary productivity of vegetation in the Chengde Jieba area under the background of climate change. Environ. Sci. 2023, 44, 6215–6225. [Google Scholar] [CrossRef]
  48. Cheng, C.; Yu, M.; Wu, M.; Bo, Y.; Mao, Z.J. Analysis of driving factors of land vegetation NPP in Heilongjiang Province from 2000 to 2020. J. Northeast. Agric. Univ. 2022, 53, 20–28+75. [Google Scholar] [CrossRef]
  49. Wang, B.; Li, M.; Fan, W.; Yu, Y.; Chen, J.M. Relationship between Net Primary Productivity and Forest Stand Age under Different Site Conditions and Its Implications for Regional Carbon Cycle Study. Forests 2018, 9, 5. [Google Scholar] [CrossRef]
  50. Wang, Y.; Tong, X.; Li, J.; Yang, M.X.; Wang, Y. Impacts of Climate Change and Human Activities on Vegetation Productivity in China. Remote Sens. 2025, 17, 1724. [Google Scholar] [CrossRef]
  51. Chen, J.; Dai, A.; Zhang, Y. Linkage between Projected Precipitation and Atmospheric Thermodynamic Changes. J. Clim. 2020, 33, 7155–7178. [Google Scholar] [CrossRef]
  52. Du, G.; Yan, S.; Chen, H.; Yang, J.; Wen, Y. Intra-Annual Cumulative Effects and Mechanisms of Climatic Factors on Global Vegetation Biomes’ Growth. Remote Sens. 2024, 16, 779. [Google Scholar] [CrossRef]
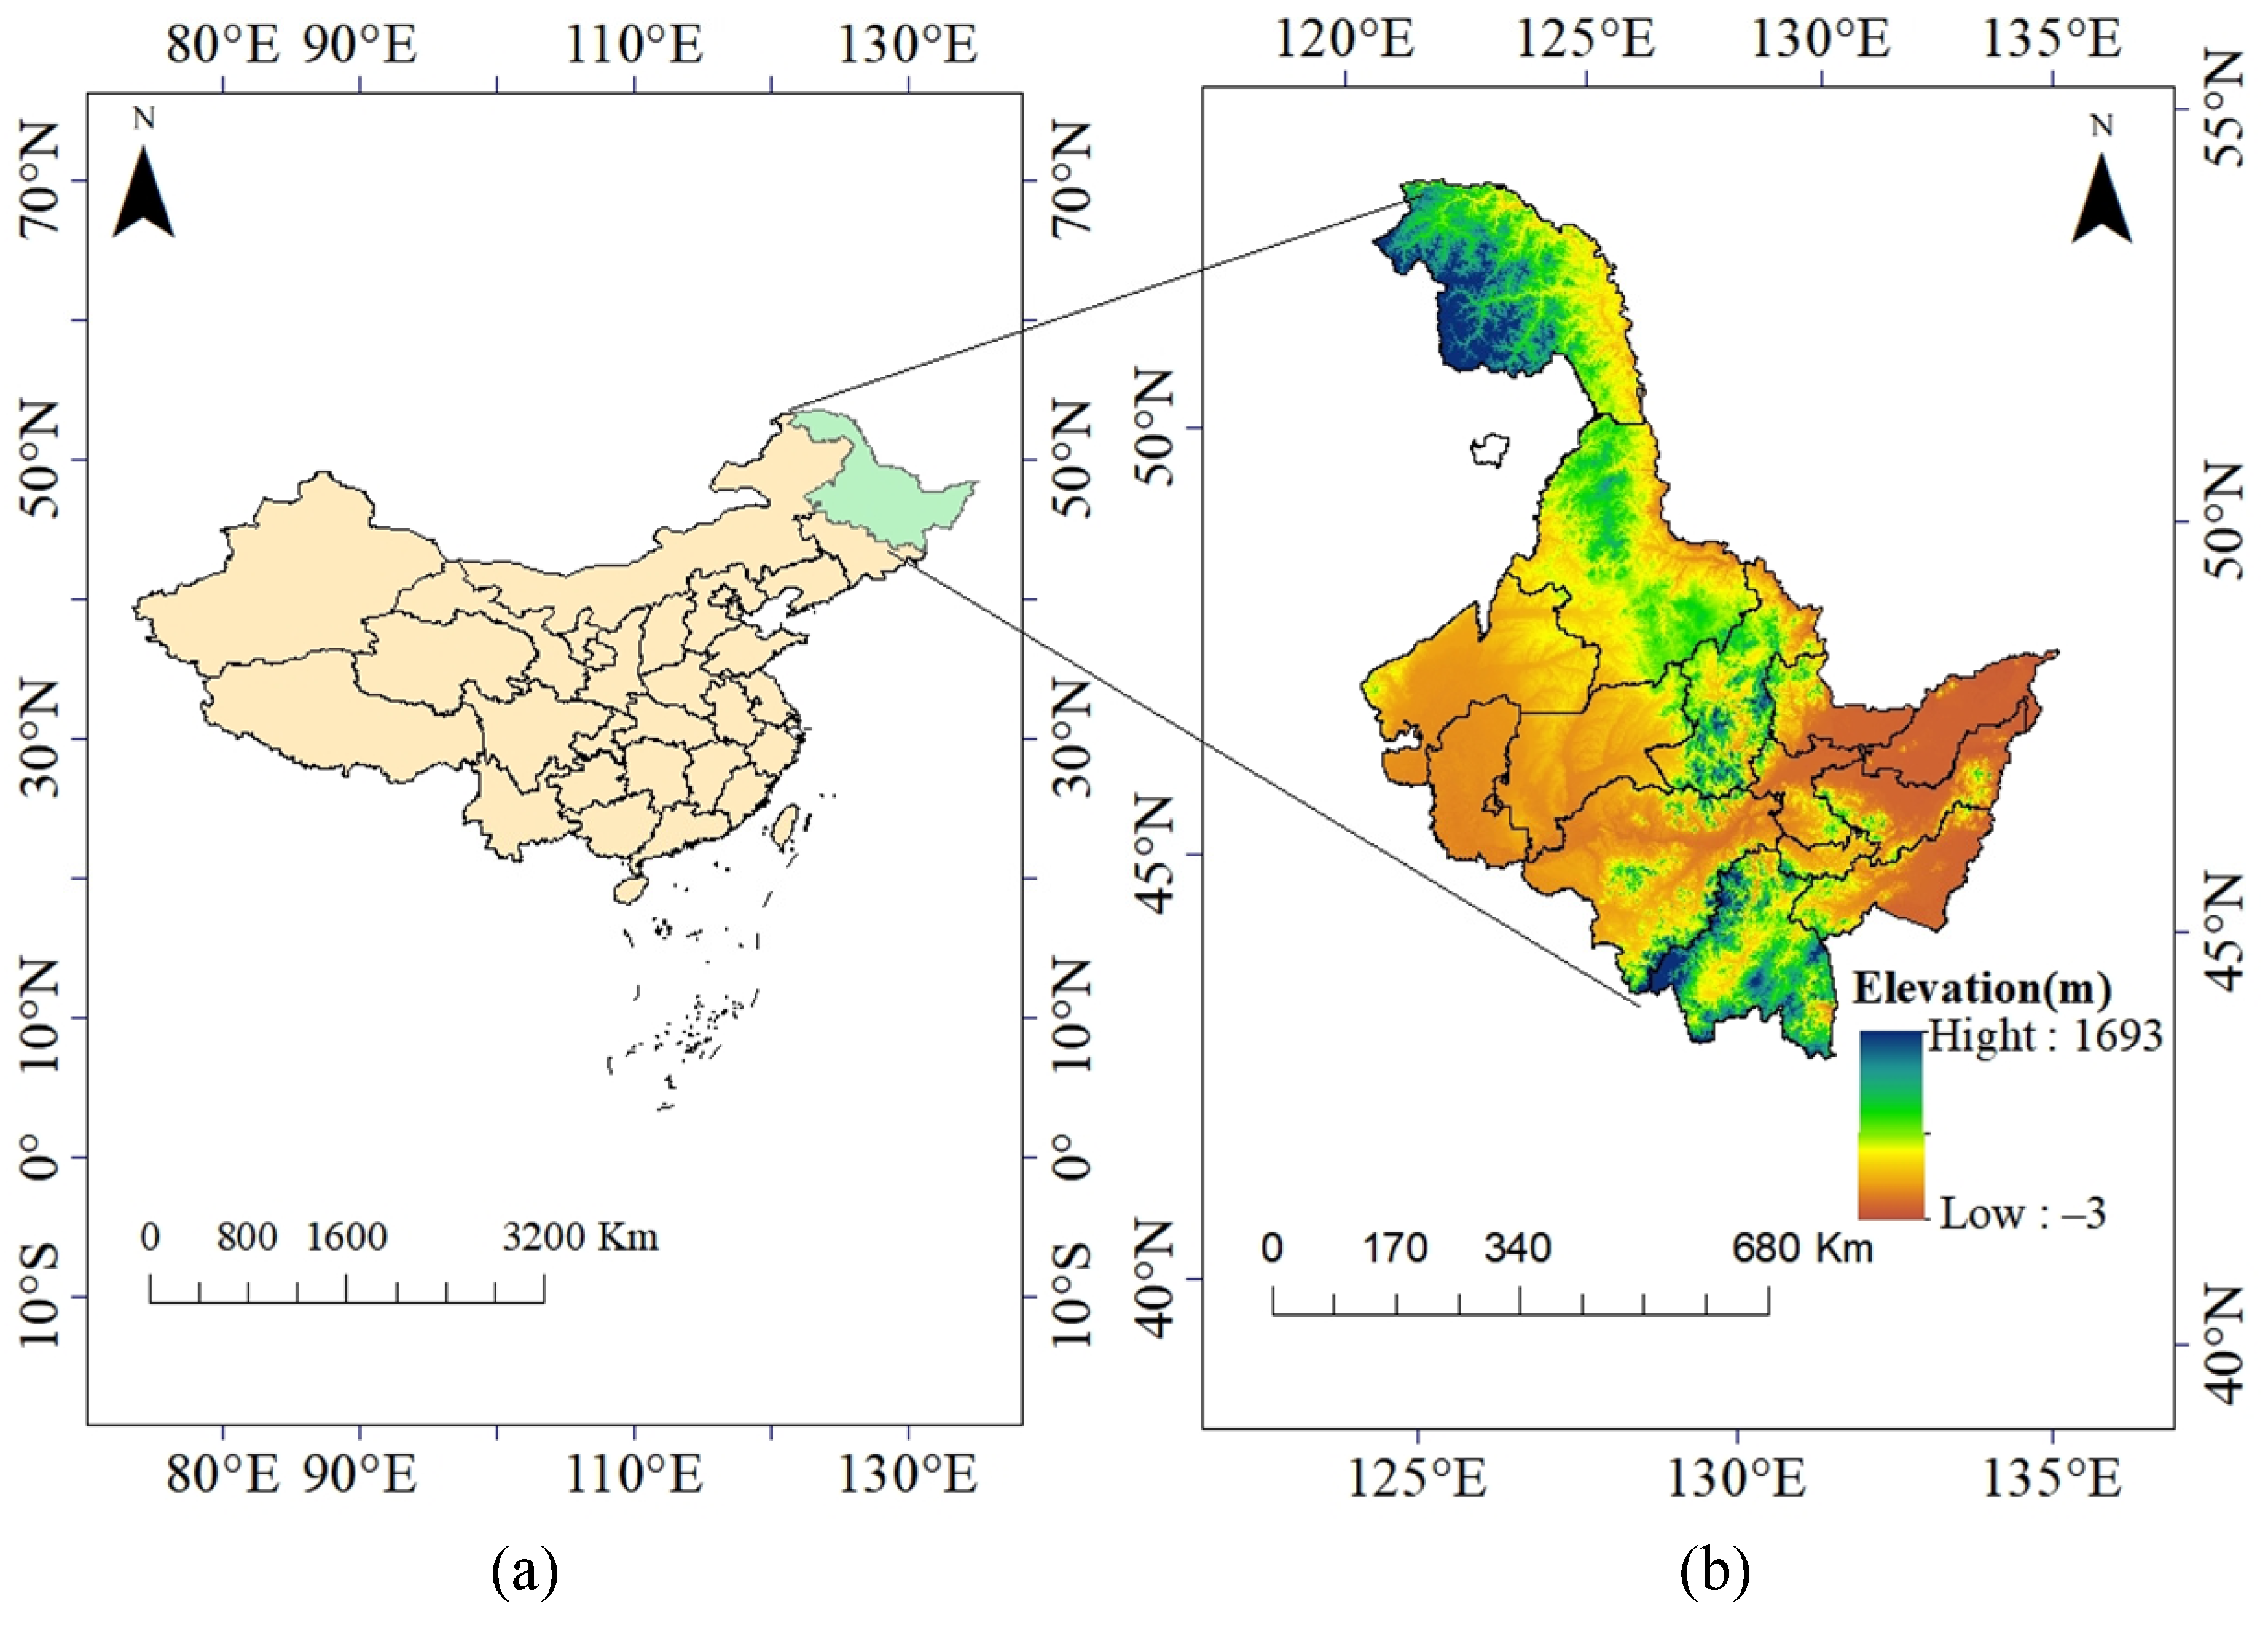
Figure 1. (a) Geographical location of Heilongjiang Province, China. (b) The base map is a digital elevation model of SRTM.
Forests 16 01574 g001
Figure 2. The overall workflow of this study.
Forests 16 01574 g002
Figure 3. Changes in NPP and NPP of different vegetation types in Heilongjiang Province during various planning periods. (a). the annual mean NPP in Heilongjiang Province. (b) the proportion of NPP values across different categories. (c). the changes in annual mean NPP for different vegetation types during each FYP period.
Forests 16 01574 g003
Figure 4. Spatial changes in NPP in Heilongjiang Province and significant trends of NPP changes for different vegetation types during each planning period. (a). The spatial pattern of the mean NPP in Heilongjiang Province from 2001 to 2020, (b). Significance test for Heilongjiang Province, (c). Significant test of various vegetation types during different FYP periods, (d). Significant test of various vegetation types during different FYP periods (long-term spatial variations).
Forests 16 01574 g004
Figure 5. Trend slopes of Tmp (a), VPD (b), Pre (c), SSD (d), and NPP (e) before different “Five-Year Plan” periods.
Forests 16 01574 g005
Figure 6. Partial correlation coefficient between NPP and climate factors in different planning periods. (a). Partial correlation coefficient between NPP and Tmp, (b). Partial correlation coefficient between NPP and VPD, (c). Partial correlation coefficient between NPP and Pre, (d). Partial correlation coefficient between NPP and SSD.
Forests 16 01574 g006
Figure 7. The impact of climate factors and FYP at different stages on vegetation NPP in the study area. (a). The impacts of climatic factors on NPP, (b). the impacts of FYP on NPP.
Forests 16 01574 g007
Figure 8. Relationship between variables and NPP in 2001–2005, 2006–2010, 2011–2015, and 2016–2020 revealed through PLS-SEM.
Forests 16 01574 g008
Figure 9. Sensitivity spatiotemporal changes of NPP and Tmp (a), VPD (b), Pre (c) and SSD (d) in Heilongjiang Province during different FYPs.
Forests 16 01574 g009
Table 1. Data sources.
DataYearResolutionUnitData Resource
NPP2000–2020500 mgC/m2Google Earth Engine (https://developers.google.com/earth-engine accessed on 25 July 2025)
Fine high-resolution land cover product2005, 2010, 2015, and 202030 m-Earth Big Data Science Engineering Data Network (https://data.casearth.cn)
Temperature2000–20201000 m°CNational Tibetan Plateau Data Center (https://data.tpdc.ac.cn)
Precipitation2000–20201000 mmmNational Tibetan Plateau Data Center (https://data.tpdc.ac.cn)
Sunshine duration2000–20201000 mhNational Basic Meteorological Elements Daily Dataset of China’s Surface Meteorological Stations (V3.0) (http://data.cma.cn/en)
Table 2. Changes in slopes for different vegetation types during each planning period.
Vegetation Types10th FYP Slope11th FYP Slope12th FYP Slope13th FYP Slope10–13 FYP Slopes
HBC0.0110.0020.0050.0060.0030 **
CPL0.0150.0060.0020.0110.0043
BF0.0150.0050.0040.0030.0041 **
ENF0.0090.0050.004−0.0010.0042
DNF0.0110.0090.004−0.0010.0046
MLF0.020.0080.0030.0070.0046
GL0.0110.0050.0070.0020.0035
** Indicates that the data exhibit statistical significance.
Table 3. Mean NPP of different vegetation types during each planning period.
Vegetation Types10th FYP (gC·m−2·a−1)11th FYP (gC·m−2·a−1)12th FYP (gC·m−2·a−1)13th FYP (gC·m−2·a−1)
HBC344.62345.03374.46380.80
CPL288.68298.28334.52343.73
BF499.79497.77533.84554.06
ENF473.27482.51518.81532.03
DNF449.28465.88499.16513.60
MLF501.23480.06538.50553.87
GL390.24404.32434.94437.56
Disclaimer/Publisher’s Note: The statements, opinions and data contained in all publications are solely those of the individual author(s) and contributor(s) and not of MDPI and/or the editor(s). MDPI and/or the editor(s) disclaim responsibility for any injury to people or property resulting from any ideas, methods, instructions or products referred to in the content.