Article

Hydro-Functional Strategies of Sixteen Tree Species in a Mexican Karstic Seasonally Dry Tropical Forest

by
Jorge Palomo-Kumul
1,
Mirna Valdez-Hernández
1,*,
Gerald A. Islebe
1,
Edith Osorio-de-la-Rosa
2,
Gabriela Cruz-Piñon
3,
Francisco López-Huerta
4 and
Raúl Juárez-Aguirre
4
1
Herbario, Diversidad y Dinámica de Ecosistemas del Sureste de México, El Colegio de la Frontera Sur, Chetumal 77014, Quintana Roo, Mexico
2
Departamento de Ciencias, Ingeniería y Tecnología, SECIHTI-Universidad Autónoma del Estado de Quintana Roo, Blv. Ignacio Comonfort S/N, Chetumal 77015, Quintana Roo, Mexico
3
Laboratorio de Socioecosistemas Marinos y Costeros, Departamento Académico de Ciencias Marinas y Costeras, Universidad Autónoma de Baja California Sur, La Paz 23085, Baja California Sur, Mexico
4
Facultad de Ingeniería Eléctrica y Electrónica, Universidad Veracruzana, Boca del Río 94294, Veracruz, Mexico
*
Author to whom correspondence should be addressed.
Forests 2025, 16(10), 1535; https://doi.org/10.3390/f16101535
Submission received: 25 August 2025 / Revised: 22 September 2025 / Accepted: 24 September 2025 / Published: 1 October 2025

Abstract

Seasonally dry tropical forests (SDTFs) are shaped by strong climatic and edaphic constraints, including pronounced rainfall seasonality, extended dry periods, and shallow karst soils with limited water retention. Understanding how tree species respond to these pressures is crucial for predicting ecosystem resilience under climate change. In the Yucatán Peninsula, we characterized sixteen tree species along a spatial and seasonal precipitation gradient, quantifying wood density, predawn and midday water potential, saturated and relative water content, and specific leaf area. Across sites, diameter classes, and seasons, we measured ≈4 individuals per species (n = 319), ensuring replication despite natural heterogeneity. Using a principal component analysis (PCA) based on individual-level data collected during the dry season, we identified five functional groups spanning a continuum from conservative hard-wood species, with high hydraulic safety and access to deep water sources, to acquisitive light-wood species that rely on stem water storage and drought avoidance. Intermediate-density species diverged into subgroups that employed contrasting strategies such as anisohydric tolerance, high leaf area efficiency, or strict stomatal regulation to maintain performance during the dry season. Functional traits were strongly associated with precipitation regimes, with wood density emerging as a key predictor of water storage capacity and specific leaf area responding plastically to spatial and seasonal variability. These findings refine functional group classifications in heterogeneous karst landscapes and highlight the value of trait-based approaches for predicting drought resilience and informing restoration strategies under climate change.

1. Introduction

Seasonally dry tropical forests (SDTFs) are among the most climatically constrained terrestrial ecosystems, characterized by marked intra-annual precipitation seasonality, extended dry periods, and high evaporative demand. Although they account for less than 42% of tropical forests globally, SDTFs are biodiversity hotspots and significant carbon reservoirs [1]. Climate projections indicate that these forests will experience increased drought frequency and altered rainfall regimes under global change [2,3], pushing many species toward their physiological limits, particularly in areas already subjected to prolonged water deficits [4,5]. Projections of species distributions in Central America and southern Mexico suggest that 58%–67% of forest plant species will be classified as threatened by the IUCN by 2061–2080. This evidence highlights the significant impact of climate change on plant communities in water-limited tropical ecosystems [6].
Tree species inhabiting these environments display a wide spectrum of hydraulic and morphological strategies to cope with seasonal and interannual water deficits. Key traits include wood density (WD), vulnerability to xylem cavitation (P50), turgor loss point (Ψtlp), and sapwood capacitance, which together shape drought resistance [7,8,9]. High WD is generally associated with conservative water-use strategies and greater hydraulic safety, whereas low WD often corresponds to acquisitive strategies that maximize hydraulic efficiency at the cost of vulnerability [10,11,12]. Leaf-level traits such as specific leaf area (SLA) and relative water content (RWC), together with stem water storage capacity and stomatal regulation, further modulate drought tolerance [13,14].
Functional group classifications based on WD, xylem water potential, RWC, and phenology have been widely employed to identify patterns of water-use strategies in SDTFs [15,16,17]. These classifications, such as distinguishing drought-avoiding deciduous species from drought-tolerant evergreen species, provide a valuable framework for predicting species responses. At the same time, recent studies suggest that in heterogeneous karst environments, species with contrasting phenologies may occasionally converge in traits such as deep-water access [18,19,20]. Furthermore, inter- and intraspecific variability in rooting depth, water sources, and safety–efficiency trade-offs add complexity to these classifications [9,14,21]. Rather than diminishing their utility, such variability underscores the need to refine functional group schemes by identifying subgroups within traditional categories, which is a central contribution of the present study.
Integrating above- and below-ground traits provides a more robust framework for predicting community responses under changing climates [13,22]. In extensive SDTFs, acquisitive species with high stem and bark water storage can persist in drier sites by buffering short-term rainfall variability, while conservative species maintain lower vulnerability through tighter hydraulic safety margins [9,22]. Additional factors, such as plant–microbe interactions, may also enhance drought resistance—for example, endophytic fungi have been shown to improve water uptake efficiency and alter stomatal control in karst-adapted species [23].
In the Yucatán Peninsula, these climatic constraints are compounded by the presence of karst landscapes. Formed through the dissolution of carbonate rocks, karst terrains are characterized by shallow, rocky soils, low water-holding capacity, high infiltration rates, and extensive subterranean drainage [24,25]. These edaphic conditions severely limit surface water and nutrient retention, forcing trees to rely on deep water stored in fractures or aquifers, sometimes several meters below ground [17,19,20,26]. While groundwater access can buffer the impacts of seasonal drought, its availability is spatially heterogeneous, and the aquifer is increasingly threatened by salinization and contamination linked to land use change and anthropogenic pollution [27,28]. Also, such hydrological pressures are expected to interact with climate change to further constrain plant performance and forest resilience.
In this study, we examine 16 tree species from SDTFs on karst soils in the Yucatán Peninsula along a precipitation gradient. We quantify WD, xylem water potential, SLA, RWC, and saturated water content (SWC) to characterize species’ positions along the conservative–acquisitive continuum, assess the reliability of functional group classifications in predicting water-use strategies, and identify trait combinations that underpin resilience in one of the most hydrologically challenging tropical forest environments.

2. Materials and Methods

2.1. Study Area

This study was carried out at three representative sites of seasonally dry tropical forests of the Yucatán Peninsula. In the Yucatán Peninsula, three seasons are present: the dry season, which runs from March to May, is characterized by high temperatures and sporadic rainfall; the rainy season, which runs from June to October, is characterized by high temperatures and constant rainfall; and the nortes season is characterized by lower temperatures and sporadic precipitation. In addition to the seasonal effect on water availability, we consider the spatial gradient of precipitation that can be observed from north to south of the Yucatán Peninsula [29]. The selected sites have a mean annual precipitation of 700, 1000, and 1200 mm (Figure 1).
The dry site is positioned in Dzibilchaltún National Park, located in the north of Yucatán state (21°05′ N, 89°35′ W), with a mean annual temperature of 25.8 °C and a mean annual precipitation (MAP) of 700 mm. The characteristic vegetation is low deciduous forest [17,30]. The soil is flat, shallow, dark or reddish in color, and calcareous, with several rocky outcrops [30].
The intermediate site is positioned in a forest reserve of the X-pichil community, located in the center of Quintana Roo state (19°41′ N, 88°22′ W), with a mean annual temperature of 26.4 °C and MAP of 1000 mm. Characteristic vegetation is semi-evergreen forest described in [31]. The soils are lithosols associated with rendzinas and luvisols [31].
The wet site is positioned in a forest area of the El Colegio de la Frontera Sur-Chetumal, located in the south of Quintana Roo state (18°32′ N, 88°15′ W), with a mean annual temperature of 27 °C and MAP of 1200 mm. The characteristic vegetation is semi-evergreen forest (personal observation). The soils are lithosols associated with rendzinas and are shallow, with calcareous rocks in the lower part [32].

2.2. Species Analyzed

Sixteen tree species were analyzed; they were chosen considering a contrasting leaf phenology (evergreen or deciduous) and wood density differences. For classification purposes, species were grouped into three categories: light wood (<0.60 g cm−3), soft wood (0.60–0.80 g cm−3), and hard wood (>0.80 g cm−3). These thresholds follow established ecological frameworks that link wood density to life-history strategies and hydraulic performance in tropical forests [33,34]. From each species, two diameter classes were selected (young < 10 cm and mature > 20 cm). A brief description of the species and a list of individuals used are presented in Table 1. All trees were selected without visible damage on stems or crown.

2.3. Sampling Seasons

Samples were taken during the three seasons of the Yucatán Peninsula: dry, rainy, and nortes. The samples were taken in three or four days per site consecutively. The sampling of the rainy season was carried out from 29 October to 14 November 2014. For the nortes season, sampling was carried out from 9 to 20 January 2015, and the dry season was sampled from 31 March to 12 April 2015.

2.4. Morphophysiological Parameters

Water potential (Ψx): Measures were carried out with a Scholander pressure chamber (1505D, PMS Instrument, Albany, OR, USA) using three terminal twigs per individual, in four individuals per species, site, and per season. The terminal twigs were collected at half-canopy with a pruning stick; predawn water potential (Ψpd) was measured between 4:00 and 5:00; midday water potential (Ψmd) was measured between 12:00 and 13:00. Immediately after their collection, the terminal twigs were deposited in hermetically sealed plastic bags and transported with ice in a refrigerator to avoid dehydration. The measurements were made in a maximum time of two hours. This protocol follows procedures previously applied and validated in SDTF studies of the Yucatán Peninsula [17,18], where no artefacts due to short-term transport were detected. Samples were consistently kept under cool and sealed conditions to minimize water loss, ensuring reliable Ψ measurements despite logistical constraints.
To integrate daily plant water dynamics, we also calculated the difference between midday and predawn water potential (ΔΨ = Ψmd − Ψpd). This parameter is widely used as an indicator of transpiration demand and soil–plant water gradients, providing complementary insight into drought response strategies.
Wood samples: Samples for evaluating wood density (WD, g cm−3), relative water content (RWC, %), and saturated water content (SWC, %) were collected with a core borer (wood cores: 5 mm diameter, ~30 mm long). Immediately after collection, the samples were placed in a microtube with a hermetic seal to prevent dehydration and were transported on ice to the laboratory. Each sample was weighed on an analytical balance (PA214C, OHAUS, Parsippany, NJ, USA) to obtain fresh weight. Subsequently, wood cores were placed in distilled water for 24 h to obtain weight at saturation. Finally, samples were dried in an oven at 80 °C for 24 h to obtain the dry weight. To ensure complete saturation, wood cores were submerged in distilled water for 24 h until no further weight increase was detected. For drying, samples were oven-dried at 110 °C for 24 h, until constant weight was achieved, following standard wood trait protocols. Only sapwood tissue was extracted and used for these analyses, while heartwood was explicitly avoided to prevent bias in water storage estimates. WD (g cm−3) was estimated as the sample dry weight over the volume [35].
SWC = (saturated weight − dry weight)/dry weight × 100
RWC = (fresh weight − dry weight)/(saturated weight − dry weight) × 100
Specific leaf area (SLA): SLA was measured independently from wood traits. Ten exposed leaves and ten shaded leaves of four individuals per species per site and season were collected to evaluate specific leaf area. After collection, each leaf was photographed and marked to determine leaf area with Imagej 1.48 [36]. In the laboratory, leaves were dried at 80 °C for 48 h to obtain dry weight. The specific leaf area was calculated using leaf area and dry weight values according to [37].
Sampling sizes: In general, four individuals were sampled per species, diameter class, and site. However, depending on local availability, this number may have been lower in some cases. Exact replication by species, site, and size is presented in Table 1. These differences reflect natural heterogeneity and the uneven distribution of individuals within SDTFs. Nevertheless, replication was sufficient to capture consistent patterns across traits and sites.
In cases where certain species could not be found across all sites, individuals from traditional Maya homegardens were also included. These homegardens, which often extend over areas of one hectare or more, are ecologically comparable to extensions of tropical dry forest and receive no irrigation, being fully dependent on natural precipitation. To verify that their inclusion did not bias water potential measurements (Ψpd, Ψmd), a two-way ANOVA was performed considering microenvironment (natural forest vs. homegarden) and season (dry, rainy, nortes). No significant differences were detected, confirming the robustness of this approach. Per-figure and per-table sample sizes (n = 319) are reported in the corresponding captions.

2.5. Environmental Parameters

The meteorological data of wet and intermediate sites were obtained by the National Commission of Water; stations were located between 5 and 12 km away from the sites. For the wet site, data were obtained from a weather station located at the same site (WatchDog Serie 2000, Spectrum, Aurora, IL, USA).

2.6. Statistical Analysis

Considering that the selected species were selected when their wood density was inferred through their foliar phenology, to corroborate that there are significant differences in wood density between species, a multifactorial ANOVA was performed; species, sites (dry, intermediate, wet), and diameter classes (young < 10 cm and mature > 20 cm) were considered factors. To establish differences in Ψpd, Ψmd, WD, RWC, SWC, and SLA, we used a multifactorial ANOVA; species, sites (dry, intermediate, wet), seasons (dry, rainy, nortes), and diameter classes (young < 10 cm and mature > 20 cm) were considered factors. In addition, the diurnal amplitude of water potential (ΔΨ) was calculated as the difference between predawn (Ψpd, maximum water potential) and midday (Ψmd, minimum water potential), expressed as ΔΨ = Ψpd − Ψmd, to evaluate the diurnal amplitude of plant water status. In addition, a post hoc Tukey HSD test was applied to determine significant differences. Some tree species could not be found in all sites and categories, so trees in homegardens were integrated. All trees present in homegardens were not irrigated and were located far from sources of additional water. To rule out the effect of a possible additional supply of water in individuals (Ψpd, Ψmd), a two-way ANOVA was performed; microenvironment (natural conditions, homegarden) and season (dry, rainy, nortes) were considered as factors. To determine the effect of the environment on the physiological response, a Spearman correlation was performed. The environmental data (precipitation, average temperature, and vapor pressure deficit) were considered by station and site. For the physiological parameters (Ψpd, Ψmd, ΔΨ, SWC, RWC, WD, SLA), the averages by species, station, and site were considered. Prior to the application of ANOVA, assumptions of normality and homogeneity of variances were tested using the Shapiro–Wilk and Levene’s tests, respectively. When assumptions were not fully met, log- or square-root transformations were applied to improve data fit. All analyses were performed with Statistica 12 [38].
To identify functional groups, a principal component analysis (PCA) was performed using individual-level trait data (Ψpd, Ψmd, ΔΨ, RWC, SWC, WD, SLA) collected across sites (dry, intermediate, wet) and seasons (rainy, nortes, dry). By incorporating all individuals rather than species means, the analysis captures both intraspecific variation and seasonal plasticity, avoiding artificial inflation of group separation and ensuring that ordination patterns reflect the full range of observed trait responses. The PCA was conducted with PC-Ord 5.1 [39], and eigenvalues and loadings were used to identify the traits contributing most strongly to each axis.

3. Results

3.1. Wood Density

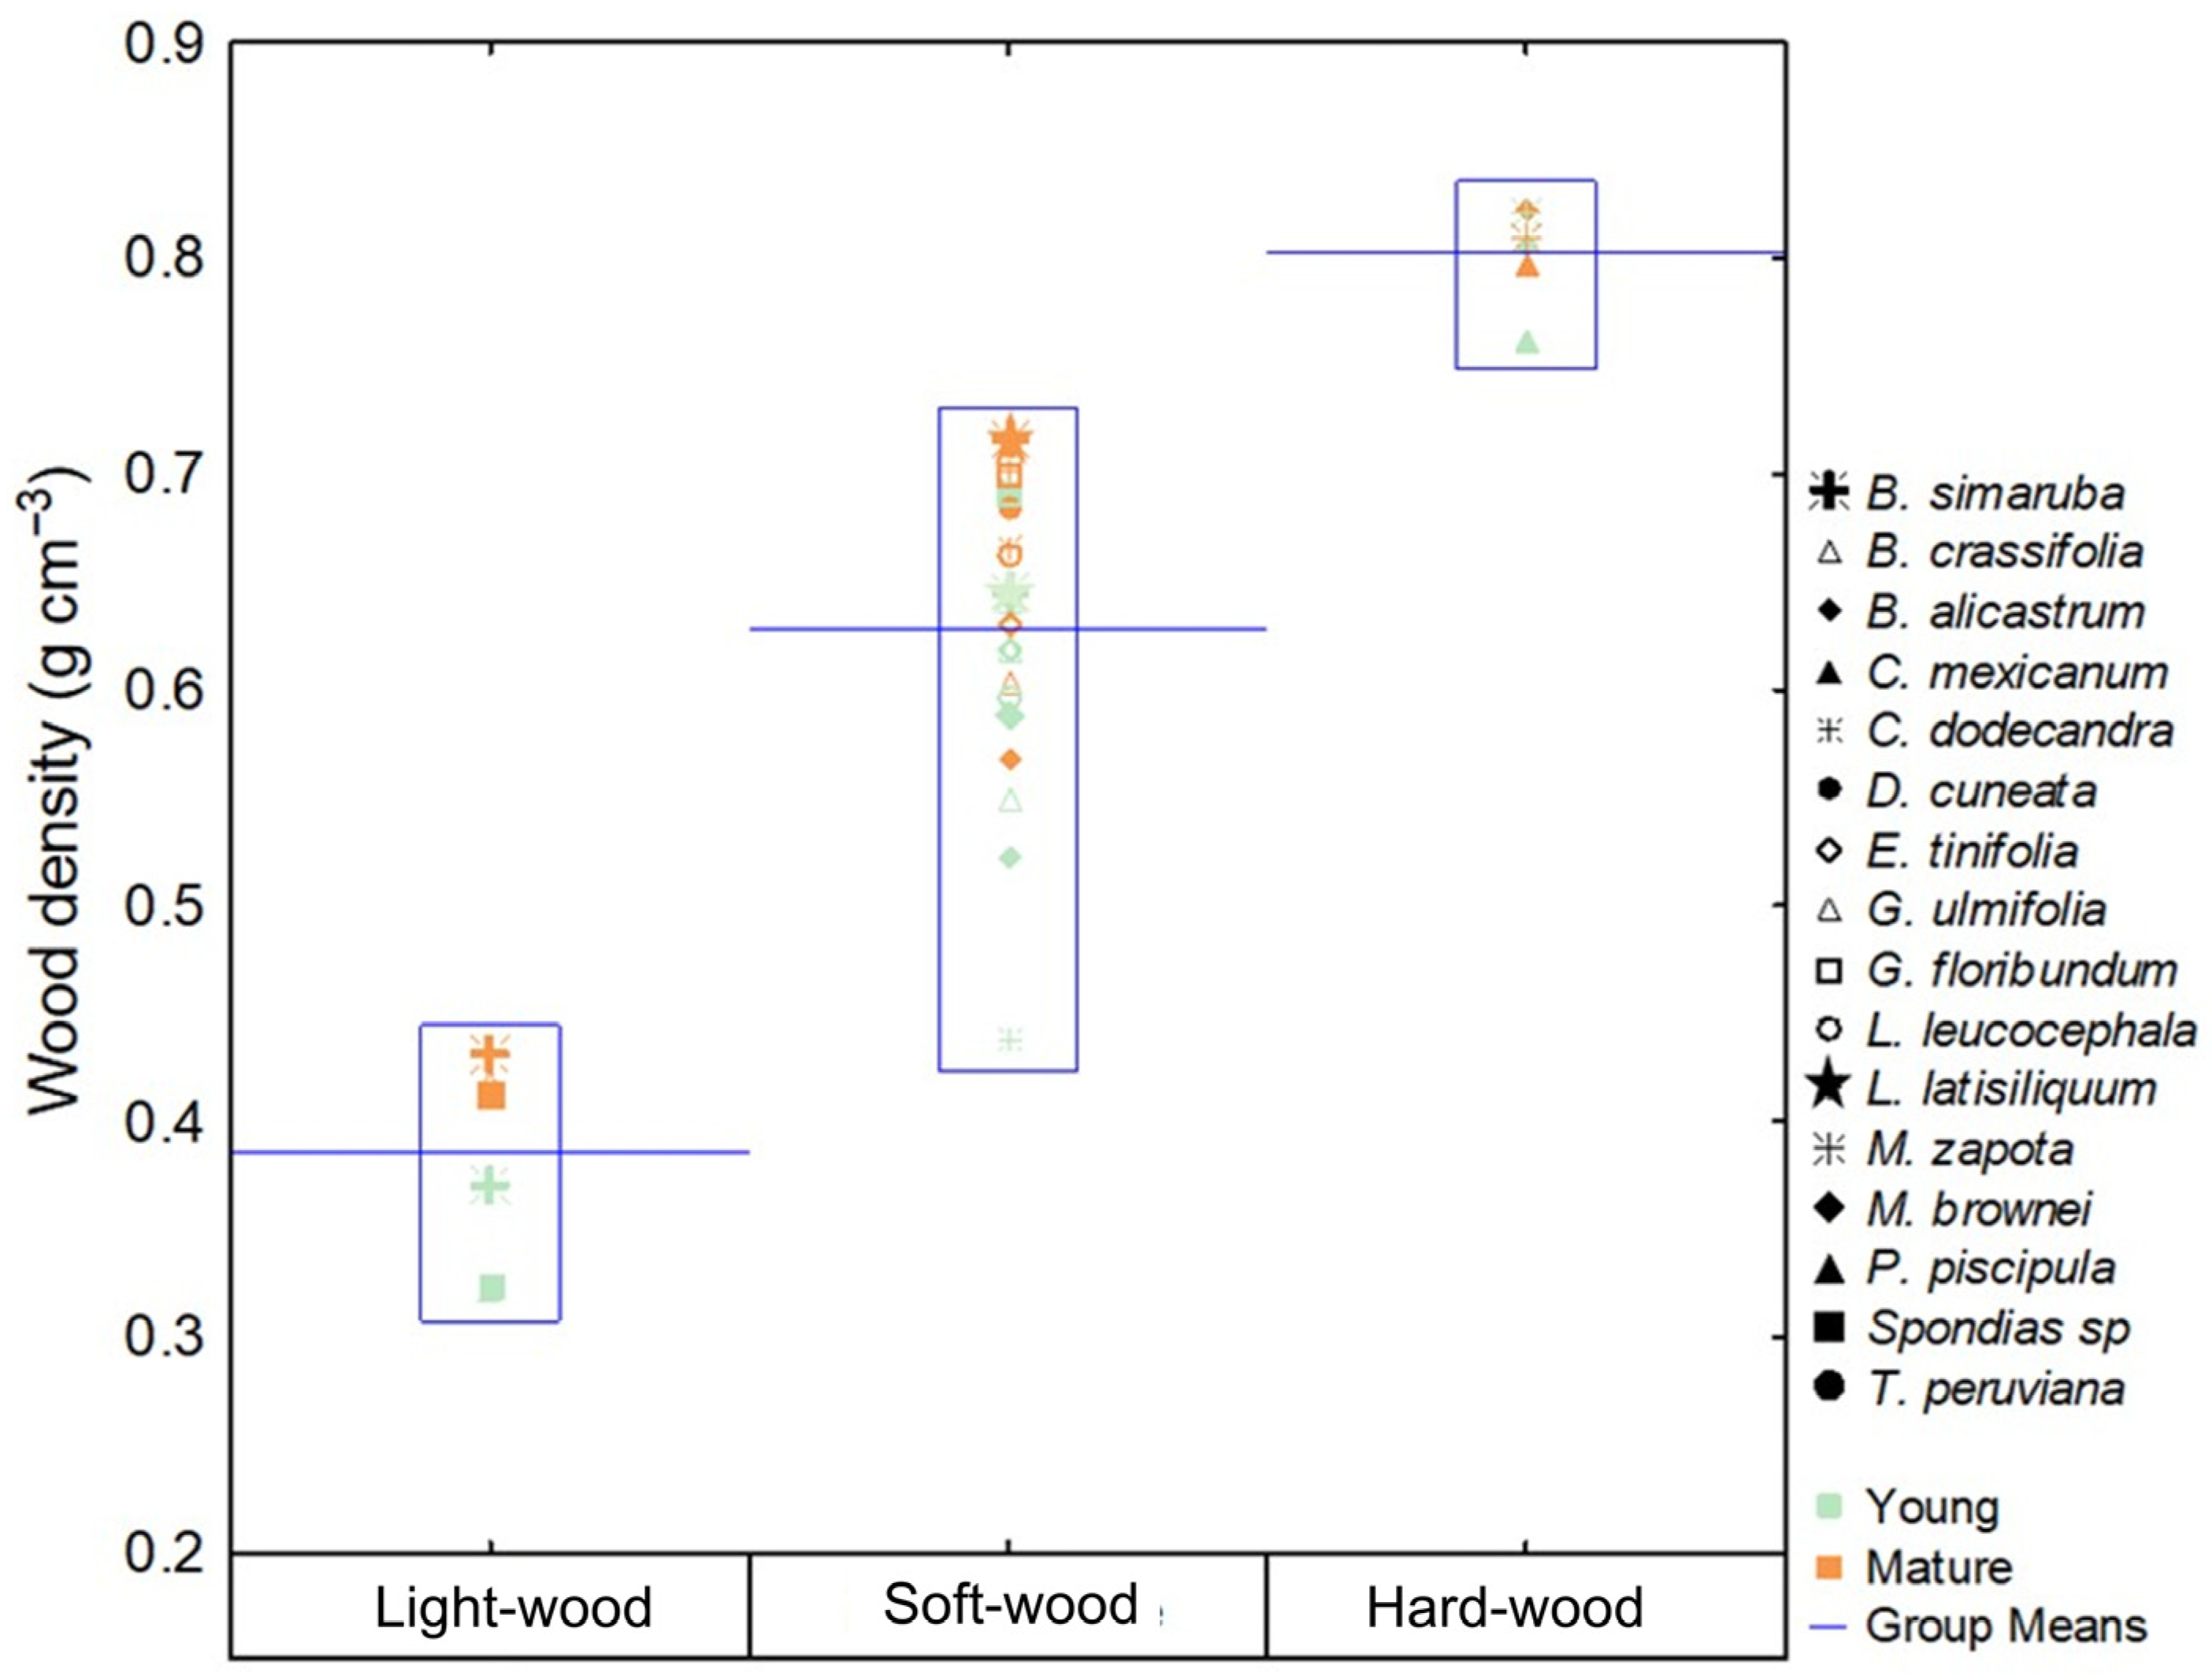
The wood density values defined three groups (Figure 2; F = 248.65, p < 0.001). The first group is species with low density or light wood (WD < 0.5 g cm−3). In this group, B. simaruba and Spondias sp. were found. The second group is intermediate-wood-density or soft-wood species (WD = 0.5–0.7 g cm−3). The species in this group are D. cuneata, P. piscipula, C. dodecandra, M. brownei, G. ulmifolia, E. tinifolia, G. floribundum, L. latisiliquum, L. leucocephala, T. peruviana, and B. crassifolia. In the third group, species with high wood density or hard wood (WD > 0.75 g cm−3) are found. In this group, B. alicastrum, C. mexicanum, and M. zapota were found.
In the three wood density groups (light-wood, soft-wood, and hard-wood), the young stage has significant differences between sites (Table 2; F = 4.1784, p < 0.01). The dry site had lower precipitation and higher wood density. In the mature stage, only the soft-wood group shows significant differences between sites (Table 2; F = 8.6350, p < 0.001), and dry sites have the highest wood density values. No significant inter-seasonal differences in both stages are detected. Diametric classes give significant differences and were observed in the light-wood group (Table 2; F = 55.221, p < 0.001) and soft-wood group (Table 2; F = 112.27, p < 0.001), where the young stage has low wood density.

3.2. Water Potential

Changes in water potential by site, season, and diameter class (young and mature) will be discussed separately for each wood density group.
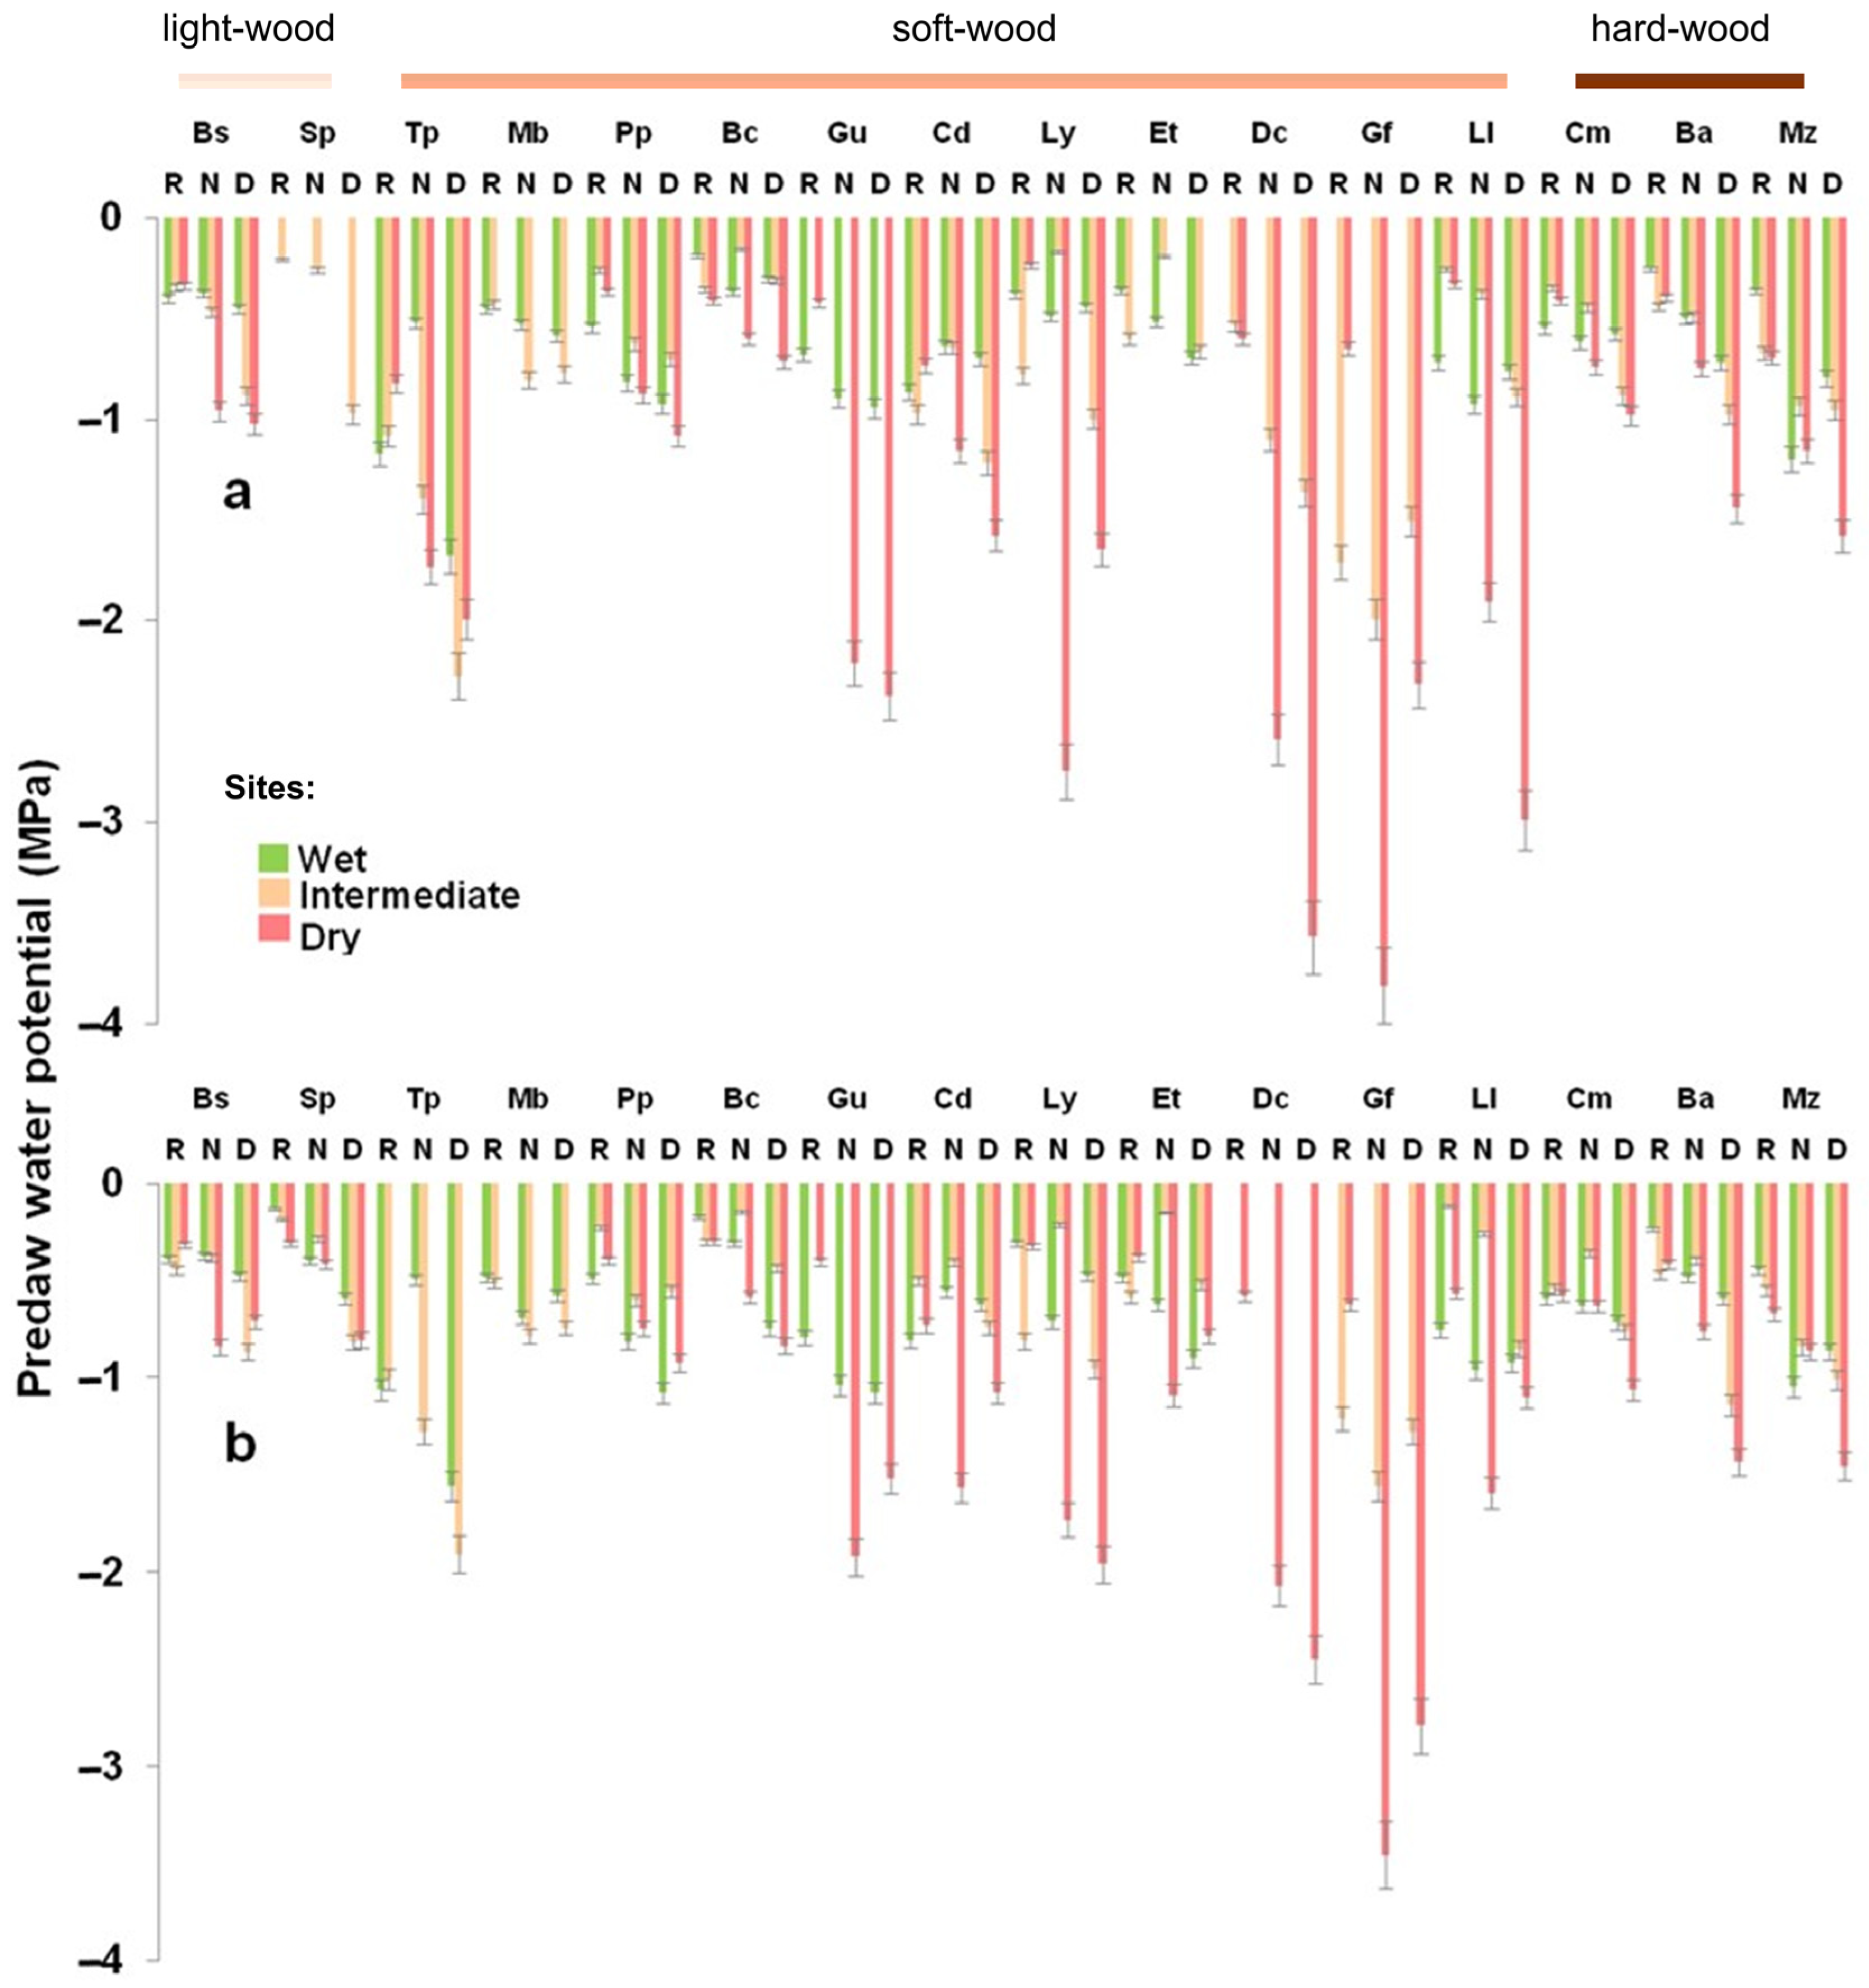
The light-wood group (B. simaruba and Spondias sp.) has high water potential values (~−1 MPa). The young stage Ψpd shows significant differences between sites (Figure 3a; F = 5.2062, p < 0.01); Ψpd is lower in the dry site, where there are lower precipitation values. For Ψpd in the mature stage, no significant differences are found (Figure 3b). In relation to seasonality, Ψpd in the dry season has the lowest values (Figure 3a,b; F = 50.948, p < 0.001). Ψmd shows significant differences between sites for both the young and mature stages (Figure 4a,b; F = 9.7348, p < 0.001); at both stages, the Ψmd was higher at the wet site (Figure 4a,b). Comparing diameter classes, Ψmd registered in young and mature stages shows no significant differences (Table 2).
The soft-wood group shows significant differences within the group (Figure 3a,b; F = 14.061, p < 0.001). Species that showed high Ψpd (>−1 MPa) were C. dodecandra, P. piscipula, B. crassifolia, E. tinifolia, and M. brownei. Species with low Ψpd were G. ulmifolia, D. cuneata, G. floribundum, L. latisiliquum, and T. peruviana (<−1 MPa). Those species showed significant differences in Ψpd between sites (Figure 3a,b; F = 58.942, p < 0.001), and the dry site had the lowest values. In relation to seasonality, the dry season showed the lowest Ψpd (Figure 3a,b; F = 41.701, p < 0.001). Between diameter classes, young and mature presented no differences. Likewise, Ψmd of M. brownei shows high values (~−1 MPa; Figure 4b; F = 30.776, p < 0.001); C. dodecandra, G. ulmifolia, P. piscipula, B. crassifolia, and E. tinifolia can register water potential between −1 MPa and −2 MPa (Figure 4a,b), while D. cuneata, G. floribundum, L. latisiliquum, and T. peruviana may present values below −2 MPa (Figure 4a,b; F = 30.776, p < 0.001). The Ψmd showed significant differences between sites (Figure 4a,b; F = 58.730, p < 0.001); dry sites showed the lowest values, and the dry season showed the lowest values (Figure 4a,b; F = 27.376, p < 0.001). For the diameter classes, the mature stage presents the highest values (Figure 4b; p = 5.2496, p < 0.01).
The hard-wood group with the species C. mexicanum, B. alicastrum, and M. zapota showed low values, but a high variation during the day. The juvenile and mature stage showed Ψpd (Figure 3a,b; F = 10.94, p < 0.001) and Ψmd values (Figure 4a,b; F = 24.484, p < 0.001) that evidence significant differences between sites, with the driest site showing the lowest values.

Comparison Between Natural Conditions and Homegardens

C. dodecandra is the only species in the same diameter class with individuals in both homegardens and natural conditions. The variance analysis indicates that homegarden trees do not have a higher amount of water, since the Ψpd and Ψmd traits, linked directly to the water status of individuals, showed no significant differences (Figure 5).

3.3. Saturated Water Content

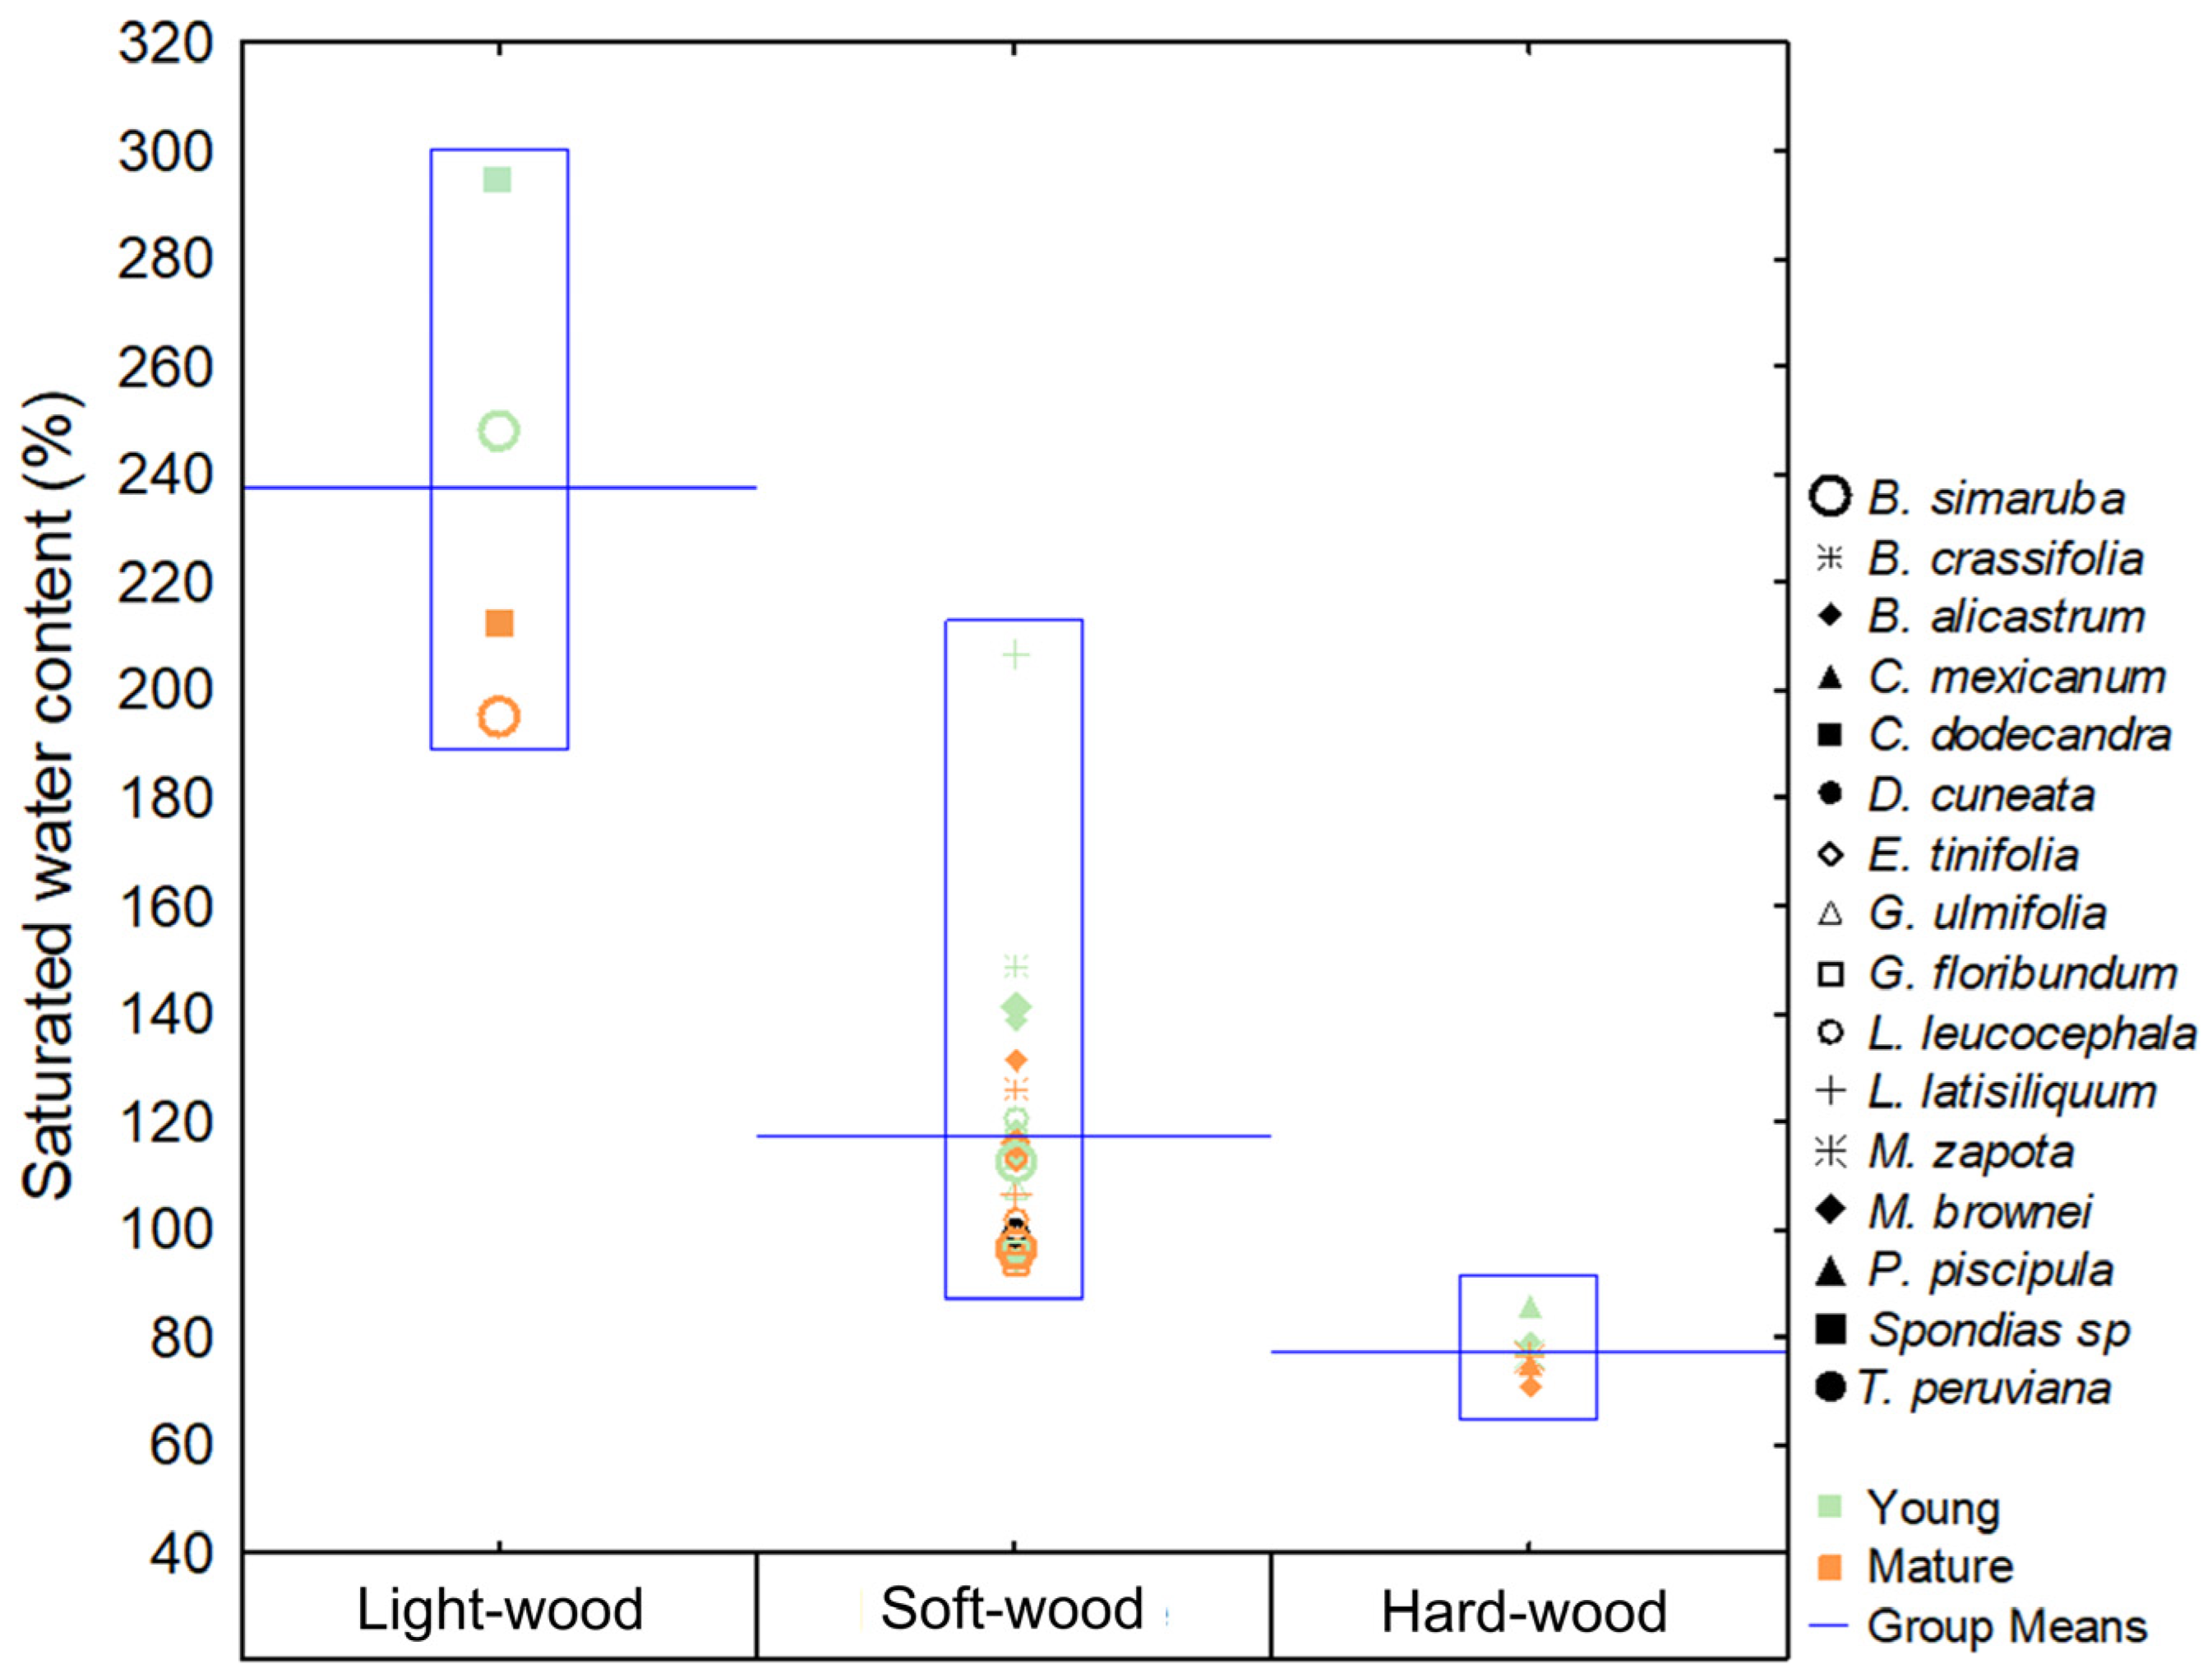
The species with the highest saturated water content were B. simaruba and Spondias sp. (Figure 6; F = 695.99, p < 0.001), corresponding to the light-wood group with the lowest WD values. In this group, young individuals showed significant site-level differences (F = 11.685, p < 0.001), with the lowest values recorded in dry sites, and no seasonal differences were observed. Mature individuals did not differ significantly between sites or seasons. Across diameter classes, young trees consistently presented higher SWC than mature ones (Figure 6; F = 36.432, p < 0.001).
Soft-wood species (C. dodecandra, P. piscipula, D. cuneata, G. floribundum, B. crassifolia, L. latisiliquum, L. leucocephala, E. tinifolia, M. brownei, G. ulmifolia, and T. peruviana) showed intermediate SWC values (Figure 6; F = 695.99, p < 0.001). Both young and mature individuals differed significantly among sites (F = 17.645, p < 0.001), with the lowest values in dry sites. In mature trees, seasonal differences were also detected (F = 4.1120, p < 0.05), with the highest values recorded in the nortes season.
Hard-wood species (B. alicastrum, M. zapota, and C. mexicanum) exhibited the lowest SWC values (Figure 6; F = 695.99, p < 0.001). Significant differences between sites were observed for both diameter classes (F = 15.232, p < 0.001), with the wet site showing the highest values. Seasonal differences were also present (F = 9.7981, p < 0.001), with the nortes season showing the highest SWC. As in the other wood density groups, young trees exhibited higher SWC than mature ones (Figure 6; F = 10.697, p < 0.001).

3.4. Relative Water Content

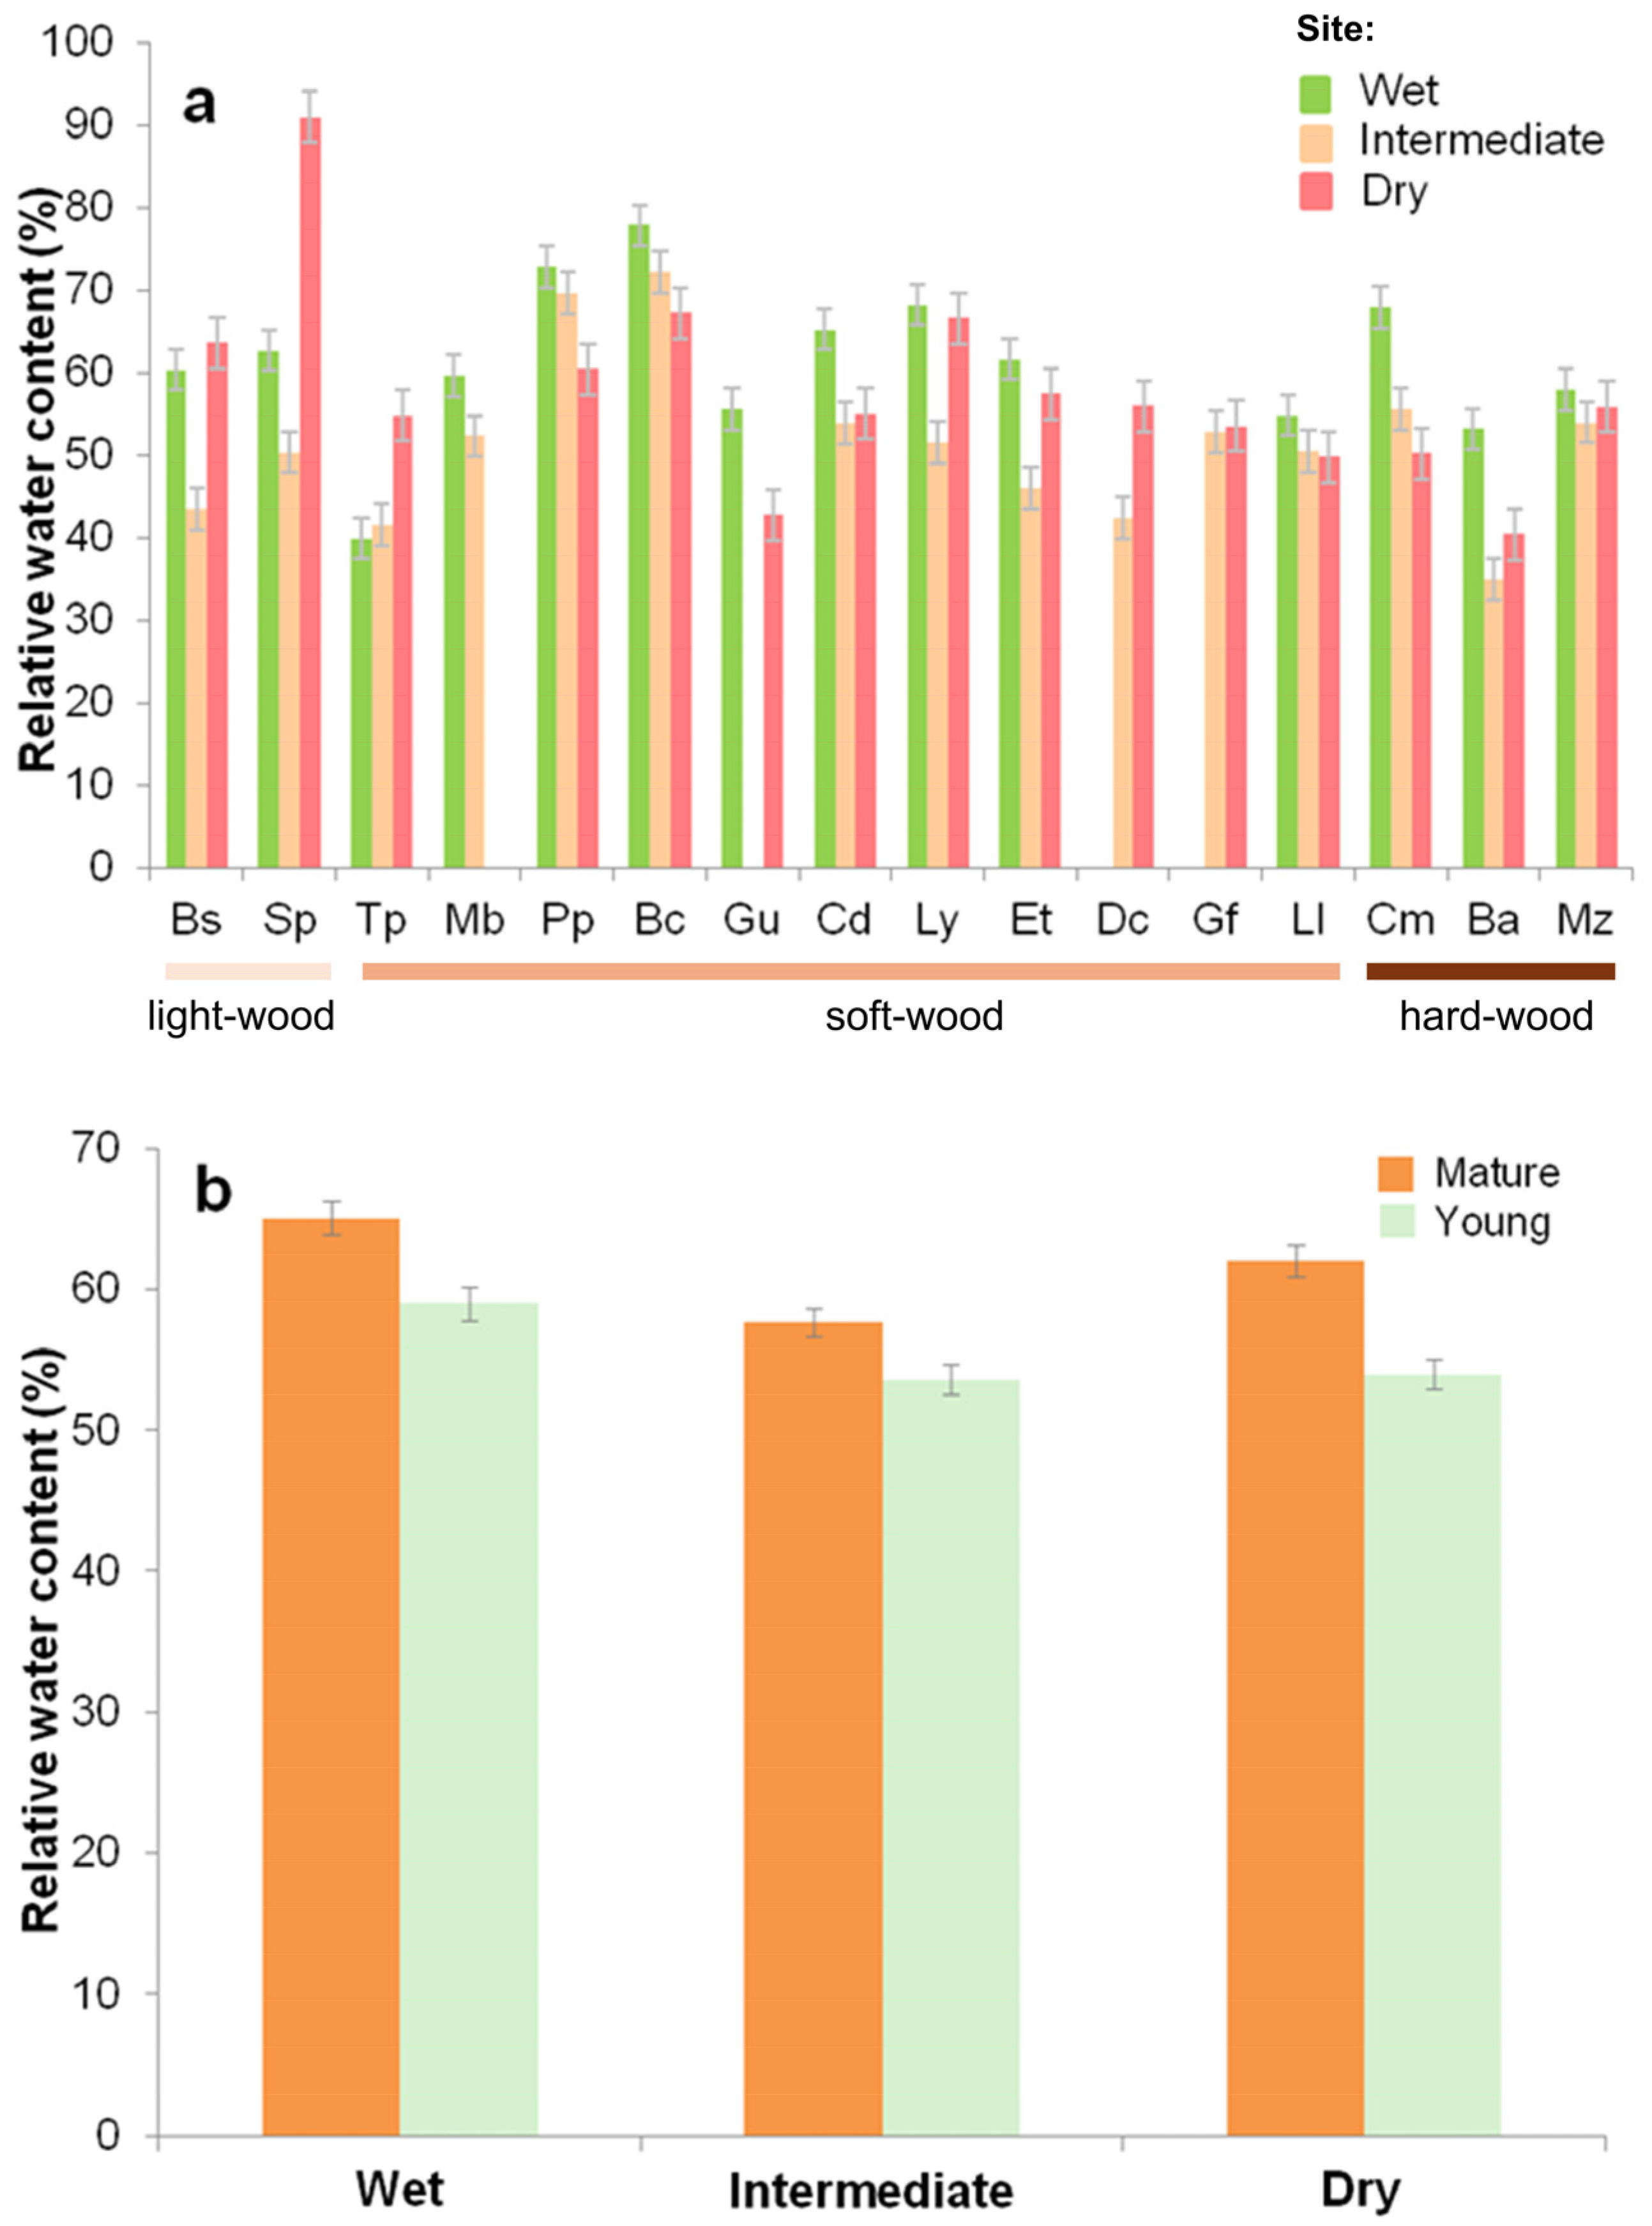
Relative water content (RWC) varied markedly among species (Figure 7a; F = 34.043, p < 0.001). The highest values (>55%) were observed in B. simaruba, Spondias sp., C. mexicanum, C. dodecandra, P. piscipula, D. cuneata, G. floribundum, B. crassifolia, L. latisiliquum, E. tinifolia, and M. brownei, while the lowest corresponded to T. peruviana (<40%). Intermediate values (50–55%) were found in B. alicastrum, M. zapota, and G. ulmifolia. Across sites, RWC was consistently higher in wet forests (Figure 7b; F = 21.783, p < 0.001). Seasonal variation was also evident, with nortes registering the highest values (F = 8.5645, p < 0.001). These patterns are consistent with recent studies that highlight the importance of quantifying trait plasticity across environmental gradients [40]. Between diameter classes, the mature stage maintained higher RWC compared to young individuals (Figure 7b; F = 47.119, p < 0.001). Moreover, significant season × species interactions confirmed that RWC plasticity varied among taxa, with several species showing marked shifts across seasons, reflecting their ability to adjust water-use strategies to fluctuating environmental conditions.

3.5. Specific Leaf Area

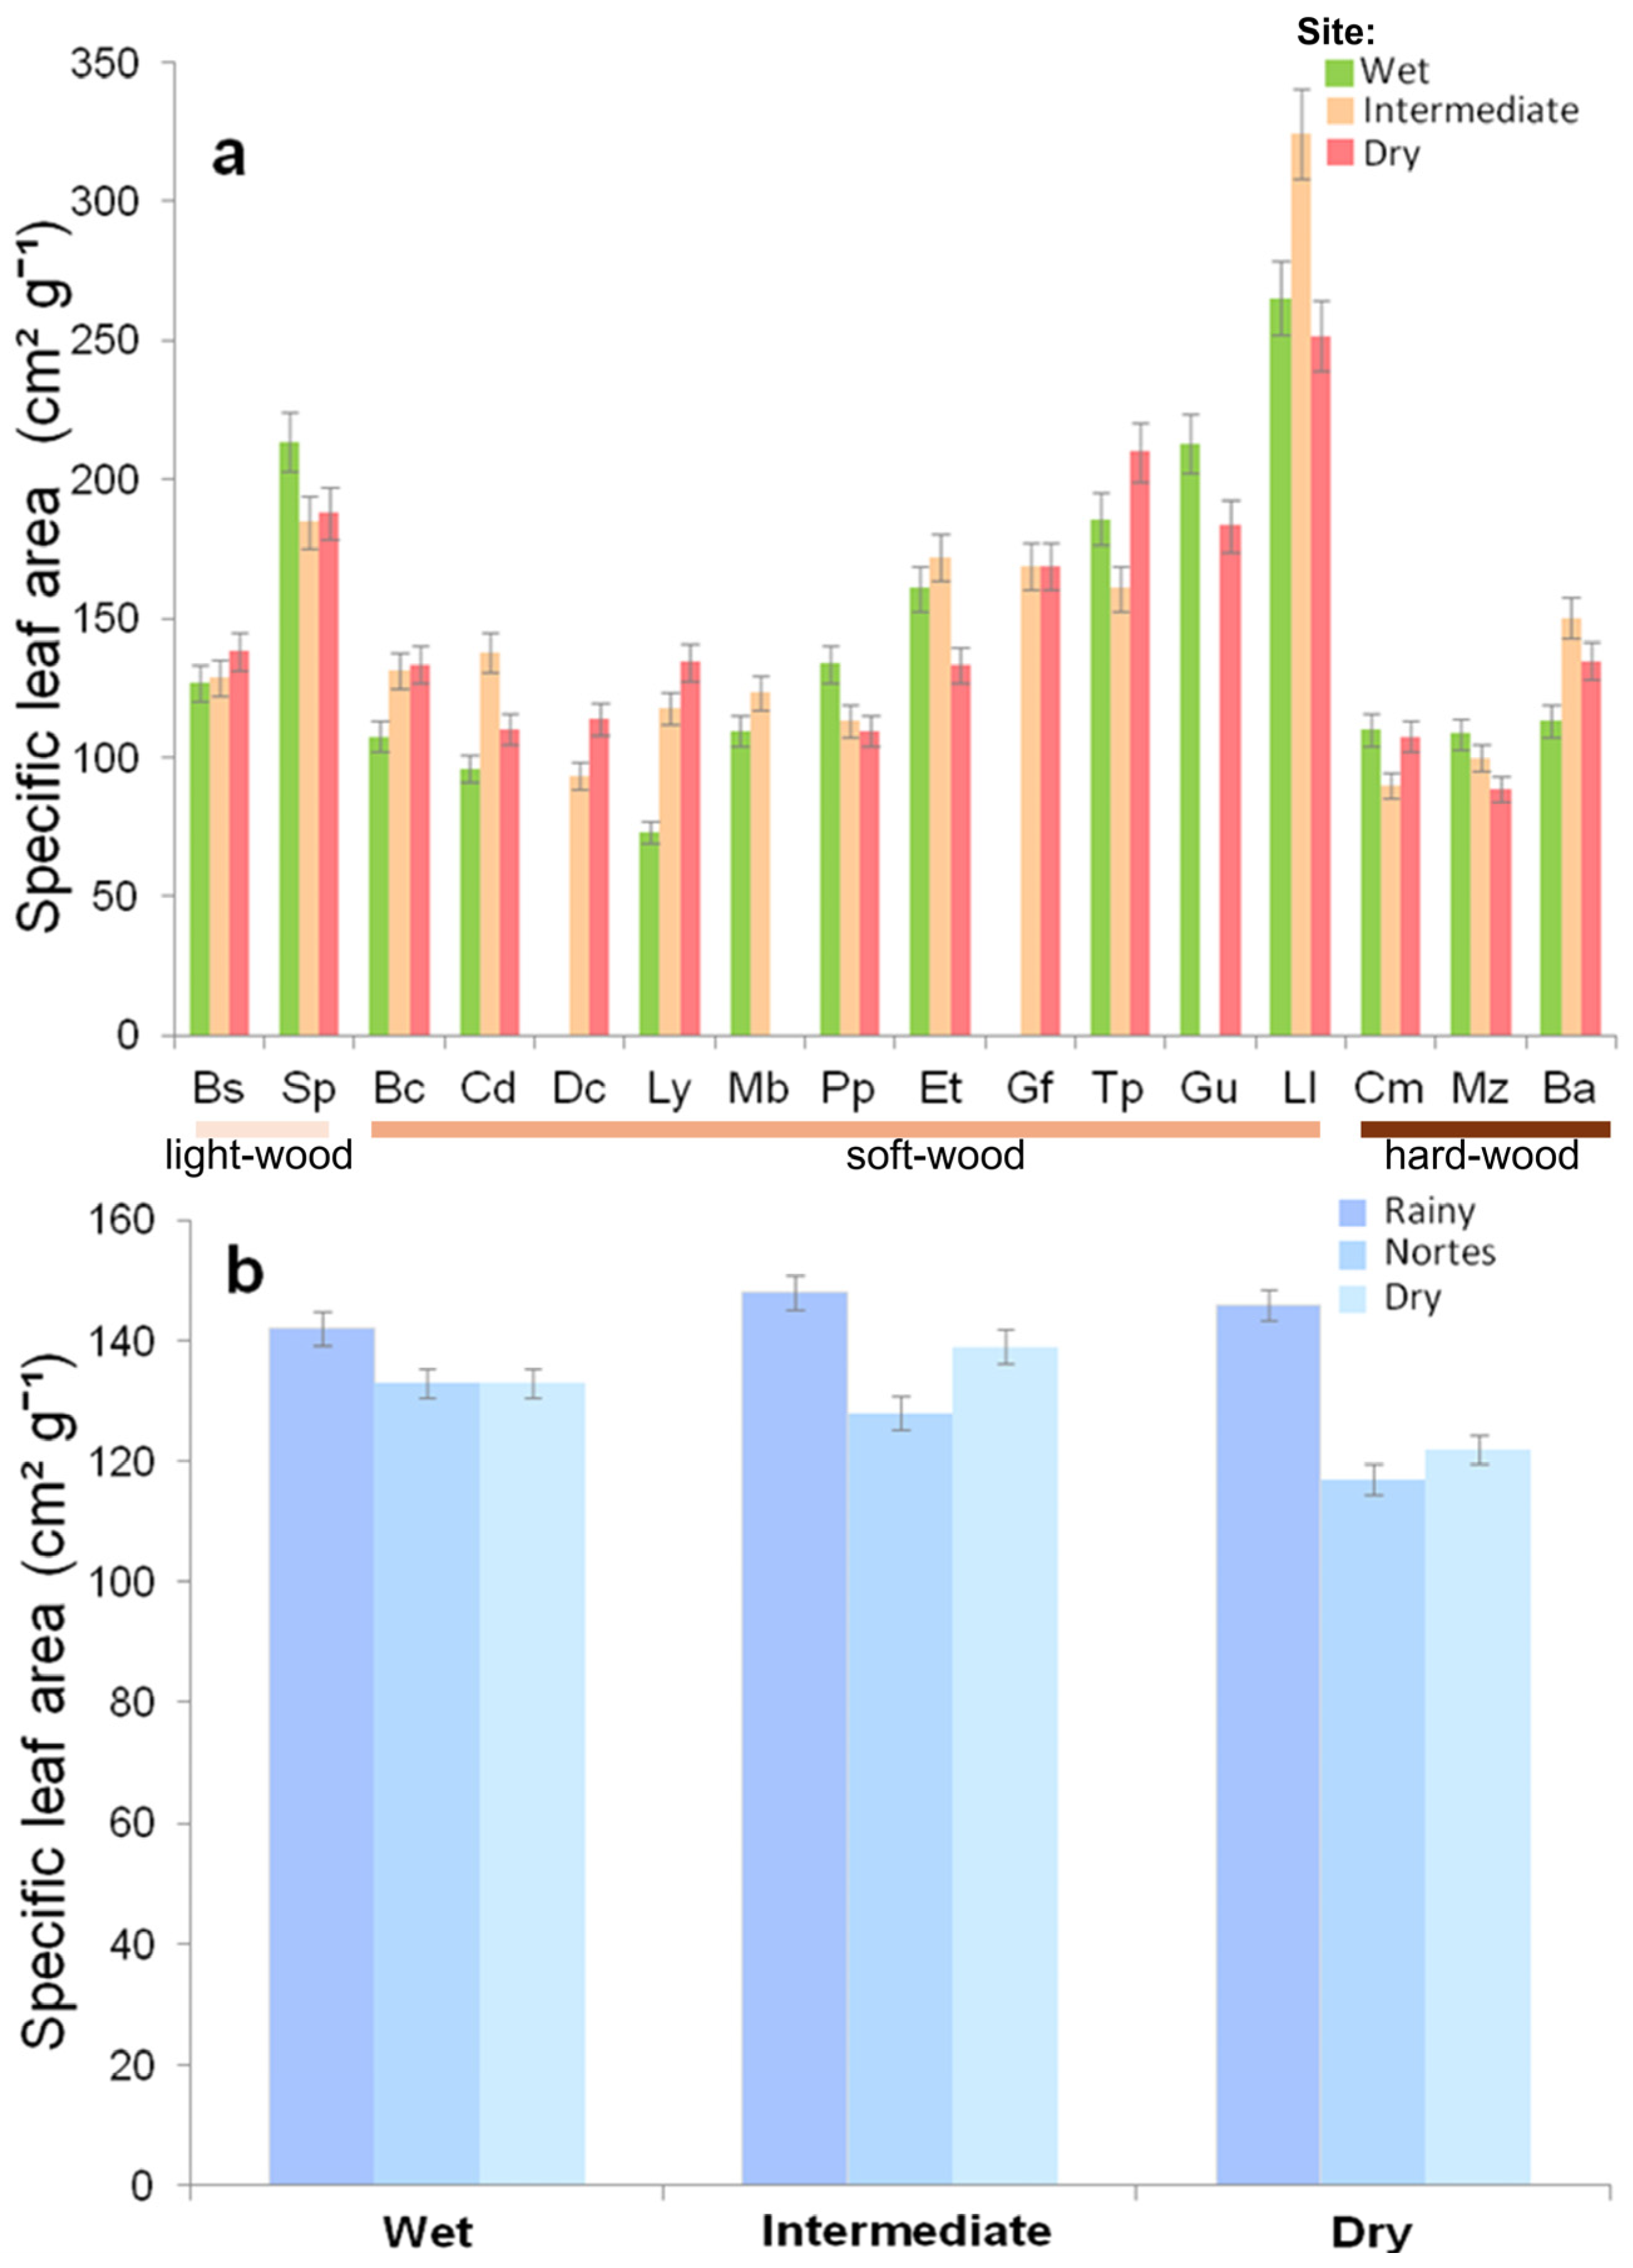
Species with the highest specific leaf area were L. leucocephala and Spondias sp. (Figure 8a; ~200 cm2 g−1) and showed significant differences between species (Figure 8a; F = 58.006, p < 0.001). Medium specific leaf area values were measured in T. peruviana, G. ulmifolia, E. tinifolia, and G. floribundum (140–170 cm2 g−1). A low specific leaf area was found in B. alicastrum, B. simaruba, M. brownei, C. dodecandra, and L. latisiliquum (120–140 cm2 g−1), and lower values were found in B. crassifolia, C. mexicanum, M. zapota, P. piscipula, and D. cuneata (<120 cm2 g−1). There are significant differences between sites (Figure 8b; F = 3.0510, p < 0.05); the dry site showed the lowest values. Regarding seasonality, the rainy season showed the highest specific leaf area (Figure 8b; F = 12.643, p < 0.001). Between diameter classes, no differences were found.

3.6. Correlations Between Functional Traits and Environmental Factors

Although there was no strong correlation between the functional traits and the environmental factors, some of the correlations are significant (Table 3). We found a negative correlation of the water potential values (Ψpd and Ψmd) with the temperature and the vapor pressure deficit, and a positive correlation with precipitation balances. SWC was negatively correlated with temperature and vapor pressure deficit, while WD was negatively correlated with precipitation. SLA, in contrast, showed a positive correlation with precipitation. Furthermore, SWC and RWC were positively correlated with Ψpd and Ψmd, whereas RWC was negatively correlated with SWC (Table 3). WD correlated positively with RWC but negatively with Ψpd, Ψmd, and SWC. These patterns indicate that wood density is a strong predictor of water storage capacity and leaf morphological adjustments. These results are summarized in Table 3 and highlight the role of wood density as a central integrator of water storage and leaf morphological traits. The broader implications of these correlations are further developed in the Discussion.

3.7. Functional Groups

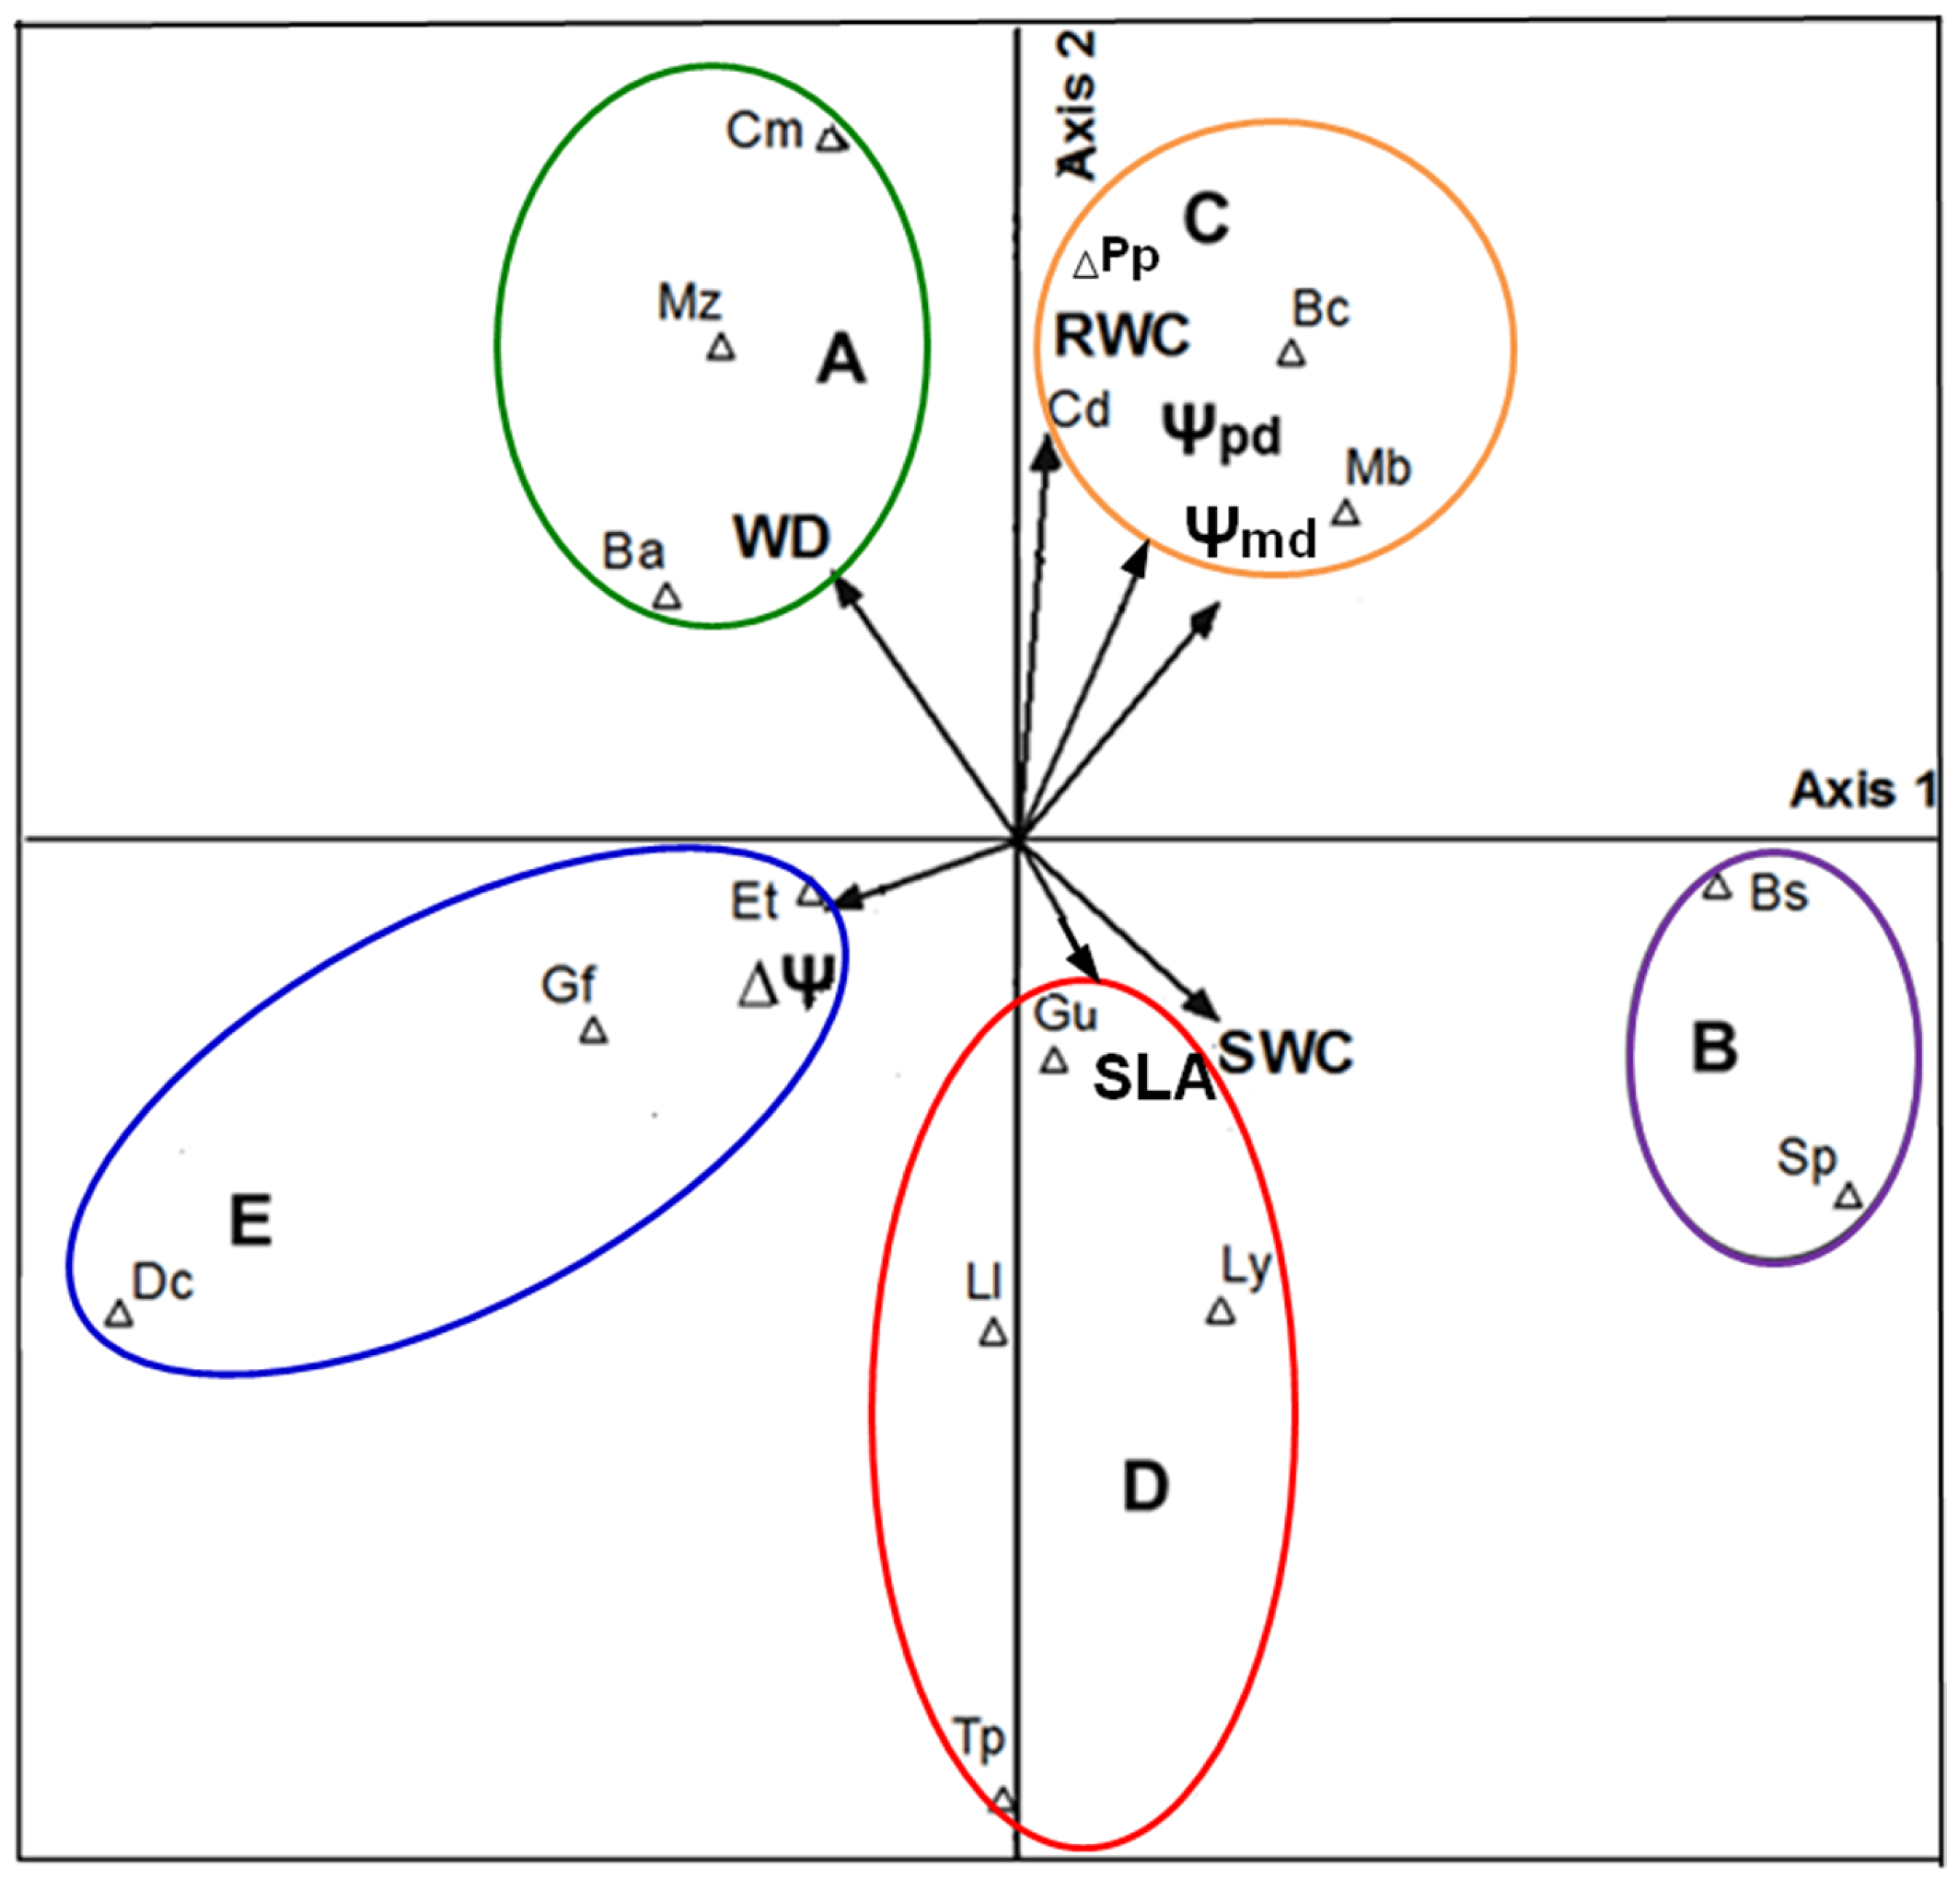
PCA analysis explains 79% of the total variance. The first axis explains 53% of the variance and is determined mainly by ΔΨ (correlation coefficient: −0.82) and SWC (correlation coefficient: 0.86). The second axis explains 26% of the variance and is determined mainly by RWC (correlation coefficient: 0.75) and SLA (correlation coefficient: −0.51). This ordination was based on individual-level data across sites and seasons, ensuring that intraspecific variation and seasonal plasticity were represented. According to PCA, five functional groups were identified (Figure 9).
The hard-wood group (A, Figure 9) comprises species with high WD (0.80 g cm−3 ± 0.010), low SWC (76.84% ± 1.35), low SLA (96.59 cm2 g−1 ± 5.39), intermediate RWC values (58.22% ± 2.51), and the highest tolerance to low Ψmd (−2.06 MPa ± 0.127).
The light-wood group (B, Figure 9) is characterized by species with low WD values (0.40 g cm−3 ± 0.004), high SWC values (220.13% ± 9.24), high Ψmd values (~−1 MPa), and high SLA values (171.21 cm2 g−1 ± 22.72).
The soft-wood group (C, Figure 9) comprises species with high RWC values and slight ΔΨ values (−0.76 MPa ± 0.068), high Ψpd values (−0.77 MPa ± 0.097), and low Ψmd values (−1.54 MPa ± 0.121). The soft-wood group with high SLA (D, Figure 9) further comprises the largest SWC values of the group (124.36% ± 11.236). The soft-wood group, highly tolerant to low water potentials (E, Figure 9), showed the lowest Ψpd values (−1.66 MPa ± 0.18) and Ψmd values (−3.48 MPa ± 0.32) and highest ΔΨ values (−1.81 MPa ± 0.152) throughout the day.
Loadings of the PCA are provided in Tables S1 and S2 (Supplementary Materials), highlighting ΔΨ and SWC as the strongest contributors to the first axis and RWC and SLA to the second axis.

4. Discussion

The functional classification derived from our PCA (Figure 9) underscores the considerable diversity of hydraulic strategies among tree species in SDTFs on karst soils. The five groups identified—ranging from hard-wood species with high hydraulic safety to light-wood species with large water storage capacity—capture the continuum between conservative and acquisitive strategies under severe seasonal water limitation, reflecting both structural and physiological adjustments shaped by the dual constraints of climatic seasonality and karst edaphic conditions [20].
Hard-wood species (Group A), such as Brosimum alicastrum, Chrysophyllum mexicanum, and Manilkara zapota, exhibited high wood density, low saturated water content (SWC), and low specific leaf area, consistent with conservative water-use strategies. These traits are often associated with higher resistance to xylem cavitation as suggested by previous studies [41,42], although this relationship was not directly evaluated in our study. While low midday water potentials during the dry season align with high safety margins, some individuals maintained unexpectedly high values. One possible explanation is latex-mediated buffering, which has been observed in other latex-producing species [19,43]. It has been hypothesized that latex contributes to maintaining water status under drought stress [44]. Previous research has suggested that latex influences water relations in species such as Hevea brasiliensis during the dry season [43] and that laticiferous vessels provide osmotic adjustment [45]. In Manilkara zapota, latex production has been reported to vary with microenvironmental conditions [46]. However, direct measurements of latex production, vessel pressure, and osmotic potential are lacking. Therefore, this remains a hypothetical mechanism that requires direct experimental testing. Future studies that explicitly assess seasonal latex production and its physiological effects are needed to clarify its potential role in regulating water use and drought resilience in karst ecosystems. The ability of these species to access deep water sources, documented in Brosimum alicastrum [47], in Manilkara zapota [47], and more broadly across SDTF taxa [26], also contributes to their persistence in the driest sites.
Light-wood species (Group B), including Bursera simaruba and Spondias spp., displayed low wood density and high SWC, enabling them to sustain higher predawn and midday water potentials even during the dry season. The wood density values of B. simaruba (0.42 g cm−3; Table 2) from the dry site are like the WD values (~ 0.4 g cm−3) reported by [17,48]. For Spondias (WD = 0.38 g cm−3), the results are similar compared to those reported by [49] in Spondias mombin (WD = 0.39 g cm−3) in a dry tropical forest of Costa Rica. The group agrees with the findings of other studies like [15,17,50,51]. The species of this group have a high ability to store water in the stem and therefore suffer less variation in water during the day [52]. These species can even present high water potential values (~−1 MPa) in the dry season [15,17]. Water stored in the stem can be quite abundant, and species can afford to flower during the dry season [17,49]. Deciduousness and shallow root growth after rainfall have been reported as drought-avoidance traits in SDTF species [53], although these aspects were not directly evaluated in our study. This is in line with reports from other SDTFs where stem water storage supports transpiration and reproduction during drought [14,15].
Species with soft wood density under high-humidity conditions behave as a single functional group, differentiated into three functional subgroups under dry-season conditions (Figure 9).
Soft-wood species with high RWC (Group C)—Piscidia piscipula, Cordia dodecandra, Metopium brownei, Byrsonima crassifolia—maintained relatively stable daily water potentials, likely due to efficient stomatal control, as observed in species initiating leaf flush during the dry season [54]. B. crassifolia trait values are similar to the data reported by [54] for the same species, which has high daily and seasonal water potential. Therefore, a constant water potential during the dry season, when new leaves are formed, could be explained by efficient stomatal control. This suggests greater stomatal sensitivity to moisture in young leaves than in mature leaves [54].
The high-SLA subgroup (Group D)—Guazuma ulmifolia, Lysiloma latisiliquum, Leucaena leucocephala, Thevetia peruviana—showed lower RWC but tolerated reduced Ψmd, consistent with acquisitive strategies that balance photosynthetic gain with moderate hydraulic risk. Density values are higher than those obtained by [48] for L. leucocephala (WD = 0.65 g cm−3; Table 2). In the case of G. ulmifolia, the observed low relative water content during the dry season may reflect additional physiological demands, potentially including reproductive activity, as has been documented for other SDTF species in the Yucatán Peninsula [17] and specifically reported for G. ulmifolia [55]. Although we do not present data on the phenology and reproductive status of the species in this study, this explanation constitutes an interesting hypothesis that we will test in the future to better understand the relationship between phenological investment and hydraulic regulation. Results of water potential and wood density in G. ulmifolia are like the values reported by [56]. Those data confirm the ability of this species to tolerate low water potential. Also, this response is consistent with [49], where in a dry tropical forest of Costa Rica, soft-wood group plants presented intermediate values in wood density and could tolerate low water potential and low relative water content.
The low-water-potential-tolerant subgroup (Group E)—Diospyros cuneata, Ehretia tinifolia, Gymnopodium floribundum—with evergreen or leaf-exchange phenology tolerated extreme midday water potentials (<−3 MPa) and exhibited traits associated with anisohydric regulation and deep rooting [4,57]. Also, it is necessary to consider that the three species of this functional group are evergreen or leaf-exchange species [17,47]. To maintain their phenological behavior, these species can develop large root systems and access underground water reserves to avoid dehydration [17,47,58]. These groups agree with those found by [17], where the group of evergreen soft-wood species presented relatively high values of relative water content. Likewise, these species show a high predawn water potential, even during the dry season. During the night, these species access deep water sources and recharge their water reserves for daytime use. In D. cuneata, a trait that could allow drought tolerance is the presence of sclerophyllous leaves [17], in addition to a combination with low stomatal conductivity and a deep root system [59]. These groups reflect the trade-offs between hydraulic safety and efficiency described by [9], where higher WD often limits storage but increases cavitation resistance, while lower WD supports higher capacitance at the expense of vulnerability.
Across groups, correlation analysis (Table 3) demonstrated strong coupling between climate drivers and hydraulic performance: water potentials were negatively related to temperature and vapor pressure deficit (VPD) and positively related to precipitation, while SWC declined with higher VPD. WD consistently emerged as a strong negative predictor of SWC, reinforcing its role as a structural constraint on water storage capacity [9,13]. SLA increased with precipitation, reflecting plasticity in leaf morphology along the gradient. These results align with recent syntheses that emphasize the integration of above- and below-ground traits for predicting drought responses in heterogeneous karst environments [20,22].
Nevertheless, we acknowledge that our environmental dataset was derived from regional meteorological stations and did not include direct measurements of soil moisture or groundwater availability. Therefore, the observed correlations should be interpreted as associations rather than strict causal relationships. Future studies incorporating local soil and hydrological monitoring will be essential to strengthen trait–environment inferences and refine our understanding of hydraulic responses in karst SDTFs.
In addition, we note that PCA and correlation analyses are exploratory tools that reveal patterns of association but cannot establish causality among traits and environmental variables. Accordingly, we interpret our findings as indicative linkages rather than mechanistic pathways. While our study did not calculate explicit plasticity indices, the observed patterns align with recent work stressing the value of quantifying trait flexibility across temporal and environmental gradients [40]. Future work incorporating structural equation modeling or path analysis, coupled with broader replication, will be necessary to test causal hypotheses more directly.
While our PCA and trait–environment correlations reveal meaningful associations, we recognize that the analysis is based on species means with uneven replication across sites and size classes. These constraints are inherent to field-based studies in natural SDTFs, where individual availability is heterogeneous and replication cannot be standardized as in nursery or common-garden experiments. For this reason, we interpret the observed patterns cautiously, emphasizing associations rather than direct causal mechanisms. Future studies employing hierarchical or mixed-effects approaches, together with expanded and more balanced sampling, will be essential to refine the relationships identified here and to further integrate variability across individuals and environments.
In karst landscapes, hydrological functioning is tightly coupled to below-ground architecture and access to fractured aquifers; these processes interact with above-ground functional traits to shape phenology and drought tolerance. Evidence from the Yucatán Peninsula shows that rooting distribution and source-water partitioning can strongly influence seasonal performance and life-history timing [17,26,47]. Incorporating such below-ground perspectives in future research will provide a more integrative understanding of hydraulic strategies and enhance predictions of species resilience across precipitation gradients in seasonally dry tropical forests on shallow karst soils.
Building on these ecological insights, from a restoration perspective, our classification provides concrete guidance for species selection in karst SDTFs. Hard-wood species (Group A, e.g., Brosimum alicastrum and Manilkara zapota) are especially suitable for the driest sites, where their deep-rooting capacity ensures access to fractured aquifers. Light-wood species (Group B, e.g., Bursera simaruba and Spondias spp.) can buffer drought through stem water storage and maintain reproductive activity during water scarcity. Soft-wood groups (Groups C–E) are ideal for mixed plantations that combine acquisitive and conservative strategies, thereby enhancing resilience through functional complementarity. Restoration efforts must also explicitly consider karst constraints such as shallow soils, spatially variable hydrological regimes, and aquifer connectivity. These practical implications are consistent with recent syntheses on ecosystem processes in carbonate landscapes [60], underscoring the need to integrate trait-based frameworks into restoration planning under increasing hydroclimatic variability.
Due to natural heterogeneity and species availability, replication between sites was inevitably uneven. As shown in Table 1, sample sizes varied depending on species, site, and diameter class. Despite this variation, the consistency of trait patterns across sites lends robustness to our results. However, future studies with more balanced designs and hierarchical models will help to refine these conclusions.
Although this study examined only 16 tree species, it is one of the few studies with a complex field experimental design conducted on a precipitation gradient. The study considered species with contrasting leaf phenologies, wood density categories, and diameter classes. Therefore, it is one of the most extensive comparative datasets of hydrofunctional traits for SDTFs in Central America. However, we acknowledge that our sample comprises only a small percentage of the approximately 500 tree species in the regional flora. Consequently, it is highly likely that not all documented functional strategies have been identified. Future studies should expand taxonomic coverage to include less common and less accessible species. Building on the foundations laid here will provide a more complete picture of hydraulic and phenological diversity in seasonally dry tropical forests.

5. Conclusions

From a regional perspective, the limited availability of functional data underscores a critical knowledge gap in the Yucatán Peninsula, where only ~3% of the ~500 tree species have documented physiological traits and ~20% have recorded values of wood density (WD) [29,61]. Extrapolation from our dataset suggests that soft-wood species could represent approximately two-thirds (66%) of the flora, while hard-wood and light-wood species may comprise 26% and 8%, respectively. The predominance of soft-wood species, combined with substantial intragroup variability, highlights the limitations of relying exclusively on WD as a functional classifier in SDTFs.
In the context of projected increases in dry-season length and vapor pressure deficit, evergreen anisohydric species within Group E may face elevated vulnerability unless continuous access to deep groundwater is secured. By contrast, hard-wood species and light-wood species could maintain resilience through deep-water uptake and stem water storage, respectively, if aquifer integrity and quality are preserved.
From an applied perspective, the classification proposed here offers a mechanistic framework for species selection in restoration and climate adaptation strategies. In the driest environments, prioritizing taxa with wider hydraulic safety margins or enhanced storage capacity could increase establishment and survival under intensifying drought. In more mesic sites, combining acquisitive and conservative species may optimize productivity while buffering against interannual variability. Looking forward, future research should integrate long-term monitoring of plant water status, rooting profiles, and latex production, alongside continuous assessments of groundwater availability and quality, to refine projections of species resilience under increasingly variable hydroclimatic and edaphic conditions.

Supplementary Materials

The following supporting information can be downloaded at https://www.mdpi.com/article/10.3390/f16101535/s1: Table S1: Eigenvalues and percentage of variance explained by the principal components derived from functional trait data across sites and seasons; Table S2: Loadings of functional traits on the first two principal components (PC1 and PC2) derived from the dry-season dataset. Values in bold indicate traits with the highest contributions (>|0.70|) to axis separation.

Author Contributions

Conceptualization, M.V.-H.; methodology, M.V.-H. and J.P.-K.; software, validation, M.V.-H. and J.P.-K.; formal analysis, M.V.-H., J.P.-K., E.O.-d.-l.-R., G.A.I., G.C.-P., F.L.-H., and R.J.-A.; investigation, M.V.-H. and J.P.-K.; resources, M.V.-H.; data curation, M.V.-H. and J.P.-K.; writing—original draft preparation, M.V.-H., J.P.-K., and G.A.I.; writing—review and editing, M.V.-H., E.O.-d.-l.-R., and G.C.-P.; visualization, M.V.-H. and J.P.-K.; supervision, M.V.-H.; project administration, M.V.-H.; funding acquisition, M.V.-H. All authors have read and agreed to the published version of the manuscript.

Funding

This research was supported by Secretaria de Educación Pública-Consejo Nacional de Ciencia y Tecnología (177842). J. Palomo-Kumul received a fellowship from Consejo Nacional de Ciencia y Tecnología (307957).

Data Availability Statement

The original contributions presented in this study are included in the article and Supplementary Materials. Further inquiries can be directed to the corresponding author.

Acknowledgments

We thank Oscar Verduzco, Carlos Gómez, Vanessa Préfontaine, Eduardo Avilez, Yonathan Puc, Irving Ramírez, and Holger Weissenberger for support during the field work. We thank National Park Dzibilchaltún, Xpichil and El Colegio de la Frontera Sur, unidad Chetumal, and the homegarden owners in Xpichil and Dzibilchaltún for permission to conduct the field work.

Conflicts of Interest

The authors declare no conflicts of interest.

References

  1. Murphy, P.G.; Lugo, A.E. Ecology of Tropical Dry Forest. Annu. Rev. Ecol. Syst. 1986, 17, 67–88. [Google Scholar] [CrossRef]
  2. IPCC. Contribution of Working Groups I, II and III to the Sixth Assessment Report of the Intergovernmental Panel on Climate Change. In Climate Change 2023: Synthesis Report; Core Writing Team, Lee, H., Romero, J., Eds.; IPCC: Geneva, Switzerland, 2023; pp. 35–115. [Google Scholar] [CrossRef]
  3. Lopez-Toledo, L.; Prieto-Torres, D.A.; Barros, F.D.V.; Ribeiro, N.; Pennington, R.T. Seasonally dry tropical forests: New insights for their knowledge and conservation. Front. Glob Change 2024, 6, 1350375. [Google Scholar] [CrossRef]
  4. Hasselquist, N.J.; Allen, M.F.; Santiago, L.S. Water relations of evergreen and drought-deciduous trees along a seasonally dry tropical forest chronosequence. Oecologia 2010, 164, 881–890. [Google Scholar] [CrossRef] [PubMed]
  5. Aguirre-Gutiérrez, J.; Rifai, S.W.; Deng, X.; Steege, H.t.; Thomson, E.; Corral-Rivas, J.J.; Guimaraes, A.F.; Muller, S.; Klipel, J.; Fauset, S.; et al. Canopy functional trait variation across Earth’s tropical forests. Nature 2025, 641, 129–136. [Google Scholar] [CrossRef] [PubMed]
  6. Ortega, M.A.; Cayuela, L.; Griffith, D.M.; Camacho, A.; Coronado, I.M.; del Castillo, R.F.; Figueroa-Rangel, B.L.; Fonseca, W.; Garibaldi, C.; Kelly, D.L.; et al. Climate Change Increases threat to Plant Diversity in Tropical Forests of Central America and Southern Mexico. PLoS ONE 2024, 19, e0297840. [Google Scholar] [CrossRef]
  7. Anderegg, W.R.L.; Konings, A.G.; Trugman, A.T.; Yu, K.; Bowling, D.R.; Gabbitas, R.; Karp, D.S.; Pacala, S.; Sperry, J.S.; Sulman, B.N.; et al. Hydraulic diversity of forests regulates ecosystem resilience during drought. Nature 2018, 561, 538–541. [Google Scholar] [CrossRef] [PubMed]
  8. Méndez-Alonzo, R.; Paz, H.; Zuluaga, R.C.; Rosell, J.A.; Olson, M.E. Coordinated Evolution of Leaf and Stem Economics in Tropical Dry Forest Trees. Ecology 2012, 93, 2397–2406. [Google Scholar] [CrossRef]
  9. De Guzman, M.E.; Acosta-Rangel, A.; Winter, K.; Meinzer, F.C.; Bonal, B.; Santiago, L.S. Hydraulic traits of Neotropical canopy liana and tree species across a broad range of wood density: Implications for predicting drougth mortality with models. Tree Physiol. 2021, 41, 24–34. [Google Scholar] [CrossRef]
  10. Markesteijn, L.; Poorter, L.; Bongers, F.; Paz, H.; Sack, L. Hydraulics and Life History of Tropical Dry Forest Tree Species: Coordination of Species’ Drought and Shade Tolerance. New Phytol. 2011, 191, 480–495. [Google Scholar] [CrossRef]
  11. Ávila-Lovera, E.; Urich, R.; Coronel, I.; Tezara, W. Ecophysiological traits change Little along a successional gradient in a tropical dry deciduous woodland from Margarita Island, Venezuela. Front. For. Glob. Change 2023, 6, 1043574. [Google Scholar] [CrossRef]
  12. Flo, V.; Martínez-Vilalta, J.; Mencuccini, M.; Granda, V.; Anderegg, W.R.; Poyatos, R. Climate and functional traits jointly mediate tree water-use strategies. New Phytol. 2021, 231, 617–630. [Google Scholar] [CrossRef]
  13. Fagundes, M.V.; Souza, A.F.; Oliveira, R.S.; Ganade, G. Functional traits above and below ground allow species with distinct ecological strategies to coexist in the largest seasonally dry tropical forest in the Americas. Front. For. Glob. Change 2022, 5, 930099. [Google Scholar] [CrossRef]
  14. Smith-Martin, C.M.; Muscarella, R.; Hammond, W.M.; Jansen, S.; Brodribb, T.J.; Choat, B.; Johnson, D.M.; Vargas-G, G.; Uriarte, M. Hydraulic variability of tropical forests is largely independent of water availability. Ecol. Lett. 2023, 26, 1829–1839. [Google Scholar] [CrossRef] [PubMed]
  15. Borchert, R.; Pockman, W.T. Water storage capacitance and xylem tension in isolated branches of temperate and tropical trees. Tree Physiol. 2005, 25, 457–466. [Google Scholar] [CrossRef] [PubMed]
  16. Lavorel, S.; Garnier, E. Predicting Changes in Community Composition and Ecosystem Functioning from Plant Traits: Revisiting the Holy Grail. Funct. Ecol. 2002, 16, 545–556. [Google Scholar] [CrossRef]
  17. Valdez-Hernández, M.; Andrade, J.L.; Jackson, P.C.; Rebolledo-Vieyra, M. Phenology of five tree species of a tropical dry forest in Yucatan, Mexico: Effects of environmental and physiological factors. Plant Soil 2010, 329, 155–171. [Google Scholar] [CrossRef]
  18. Palomo-Kumul, J.; Valdez-Hernández, M.; Islebe, G.A.; Cach-Pérez, M.J.; Andrade, J.L. El Niño-Southern Oscillation affects the water relations of tree species in the Yucatan Peninsula, Mexico. Sci. Rep. 2021, 11, 10451. [Google Scholar] [CrossRef]
  19. Adams, R.E.; West, J.B. Functional Groups Mask Inter- and Intraspecific Variation in Water Use Strategies in a Seasonally Dry Tropical Forest. Front. Water 2022, 4, 950346. [Google Scholar] [CrossRef]
  20. Jackson, P.C.; Andrade, J.L.; Reyes-García, C.; Hernández-González, O.; McElroy, T.; Us-Santamaría, R.; Simá, J.L.; Dupuy, J.M. Physiological responses of species to microclimate help explain population dynamics along succession in a tropical dry forest of Yucatan, Mexico. Forests 2018, 9, 411. [Google Scholar] [CrossRef]
  21. Liu, C.; Huang, Y.; Wu, F.; Liu, W.; Ning, Y.; Huang, Z.; Tang, S.; Liang, Y. Plant adaptability in karst regions. J. Plant Res. 2021, 134, 889–906. [Google Scholar] [CrossRef]
  22. Oliveira, R.S.; Eller, C.B.; Barros, F.D.V.; Hirota, M.; Brum, M.; Bittencourt, P. Linking plant hydraulics and the fast–slow continuum to understand resilience to drought in tropical ecosystems. New Phytol. 2021, 230, 904–923. [Google Scholar] [CrossRef] [PubMed]
  23. Li, F.; He, X.; Sun, Y.; Zhang, X.; Tang, X.; Li, Y.; Yi, Y. Distinct endophytes are used by diverse plants for adaptation to karst regions. Sci. Rep. 2019, 9, 5246. [Google Scholar] [CrossRef] [PubMed]
  24. Ford, D.; Williams, P. Karst Hydrogeology and Geomorphology; John Willey & Sons: Sussex, UK, 2007. [Google Scholar]
  25. Geekiyanage, N.; Goodale, U.M.; Cao, K.; Kitajima, K. Plant ecology of tropical and subtropical karst ecosystems. Biotropica 2019, 51, 626–640. [Google Scholar] [CrossRef]
  26. Estrada-Medina, H.; Santiago, L.S.; Graham, R.C.; Allen, M.F.; Jimenez-Osornio, J. Source water, phenology and growth of two tropical dry forest tree species growing on shallow karst soils. Trees 2013, 27, 1297–1307. [Google Scholar] [CrossRef]
  27. Narvaez-Montoya, C.; Mondragón Bonilla, R.; Goldscheider, N.; Mahlknecht, J. Groundwater salinization patterns in the Yucatan Peninsula reveal contamination and vulnerability of the karst aquifer. Commun. Earth Environ. 2025, 6, 468. [Google Scholar] [CrossRef]
  28. Hernández-Flores, G.; Gutiérrez-Aguirre, M.A.; Cervantes-Martínez, A.; Marín-Celestino, A.E. Historical analysis of a karst aquifer: Recharge, water extraction, and consumption dynamics on a tourist island (Cozumel, Mexico). In Annales de Limnologie-International Journal of Limnology; EDP Sciences: Les Ulis, France, 2021; Volume 57, p. 16. [Google Scholar] [CrossRef]
  29. Valdez-Hernández, M.; González-Salvatierra, C.; Reyes-García, C.; Jackson, P.C.; Andrade, J.L. Physiological Ecology of Vascular Plants. In Biodiversity and Conservation of the Yucatán Peninsula; Islebe, G., Calmé, S., León-Cortés, J., Schmook, B., Eds.; Springer: Cham, Switzerland, 2015. [Google Scholar] [CrossRef]
  30. Thien, L.; Bradburn, A.S.; Welden, A.L. The Woody Vegetation of Dzibilchaltún. A Maya Archeological Site in Northwest Yucatán, México; Middle American Research Institute: New Orleans, LA, USA, 1982; pp. 1–24. [Google Scholar]
  31. Valdez-Hernández, M.; Sánchez, O.; Islebe, G.A.; Snook, L.K.; Negreros-Castillo, P. Recovery and early succession after experimental disturbance in a seasonally dry tropical forest in Mexico. For. Ecol. Manag. 2014, 334, 331–343. [Google Scholar] [CrossRef]
  32. Bautista, F.; Palacio, G.; Ortiz-Pérez, M.; Batllori-Sampedro, E.; Castillo-González, M. El origen y el manejo maya de las geoformas, suelos y aguas en la Península de Yucatán. In Caracterización y Manejo de los Sue los de la Península de Yucatán: Implicaciones Agropecuarias, Forestales y Ambientales; Zúñiga, F.B., Ed.; Universidad Autónoma de Campeche: Campeche, Mexico; Universidad Autónoma de Yucatán: Mérida, Mexico, 2005; pp. 21–32. [Google Scholar]
  33. Chave, J.; Coomes, D.; Jansen, S.; Lewis, S.L.; Swenson, N.G.; Zanne, A.E. Towards a Worldwide Wood Economics Spectrum. Ecol. Lett. 2009, 12, 351–366. [Google Scholar] [CrossRef]
  34. Mo, L.; Zhang, Y.; Li, X.; Johnson, D.J.; Fortunel, C.; Lin, D.; Swenson, N.G.; Wright, S.J.; Xu, H.; He, N. The Global Distribution and Drivers of Wood Density. Nat. Plants 2024, 10, 1120–1132. [Google Scholar] [CrossRef]
  35. Koide, R.T.; Robichaux, R.H.; Morse, S.R.; Smith, C.M. Plant water status, hydraulic resistance and capacitance. In Plant Physiological Ecology; Pearcy, R.W., Ehleringer, J.R., Mooney, H.A., Rundel, P.W., Eds.; Springer: Dordrecht, The Netherlands, 1989. [Google Scholar] [CrossRef]
  36. Schneider, C.A.; Rasband, W.S.; Eliceiri, K.W. NIH Image to ImageJ: 25 years of image analysis. Nat. Methods 2012, 9, 671–675. [Google Scholar] [CrossRef]
  37. Bucci, S.J.; Scholz, F.G.; Goldstein, G.; Meinzer, F.C.; Arce, M.E. Soil Water Availability and Rooting Depth as Determinants of Hydraulic Architecture of Patagonian Woody Species. Oecologia 2009, 160, 631–641. [Google Scholar] [CrossRef]
  38. StatSoft, Inc. STATISTICA, Version 12. Data Analysis Software System. StatSoft, Inc.: Tulsa, OK, USA, 2013.
  39. McCune, B.; Mefford, M.J. PC-ORD, Version 5.10. Multivariate Analysis of Ecological Data. MjM Software: Gleneden Beach, OR, USA, 2006.
  40. Wei, Z.; Kou, J.; Miao, L.; Hu, F.; Li, L.; Wu, X.; Li, S.; Meng, L. Exploring diurnal variation in soil moisture via sub-daily estimates reconstruction. J. Hydrol. 2025, 662, 134005. [Google Scholar] [CrossRef]
  41. Hacke, U.G.; Sperry, J.S.; Pockman, W.T.; Davis, S.D.; McCulloh, K.A. Trends in wood density and structure are linked to prevention of xylem implosion by negative pressure. Oecologia 2001, 126, 457–461. [Google Scholar] [CrossRef]
  42. Gleason, S.M.; Westoby, M.; Jansen, S.; Choat, B.; Hacke, U.G.; Pratt, R.B.; Bhaskar, R.; Brodribb, T.J.; Bucci, S.J.; Cao, K.-F.; et al. Weak tradeoff between xylem safety and xylem-specific hydraulic efficiency across the world’s woody plant species. New Phytol. 2016, 209, 123–136. [Google Scholar] [CrossRef]
  43. Rao, P.S.; Saraswathyamma, C.K.; Sethuraj, M.R. Studies on the relationship between yield and meteorological parameters of para rubber tree (Hevea brasiliensis). Agr. Forest Meteorol. 1998, 90, 235–245. [Google Scholar] [CrossRef]
  44. García, E.G.; Di Stefano, J.F. Fenología de árbol Sideroxylon capiri (Sapotaceae) en el Bosque Seco Tropical de Costa Rica. Rev. Biol. Trop. 2005, 53, 5–14. [Google Scholar] [PubMed]
  45. Vijayakumar, K.R.; Dey, S.K.; Chandrasekhar, T.R.; Devakumar, A.S.; Mohankrishna, T.; Sanjeeva Rao, P.; Sethuraj, M.R. Irrigation requirement of rubber trees (Hevea brasiliensis) in the subhumid tropics. Agric. Water Manag. 1998, 35, 245–259. [Google Scholar] [CrossRef]
  46. Dugelby, B. Mecanismos gubernamentales y tradicionales que norman la extracción del látex del chicle en El Petén Guatemala. In La Selva Maya Conservación y Desarrollo; Primack, R.B., Bray, D., Galletti, H.A., Ponciano, I., Eds.; Siglo XXI Editores Mexico: Mexico City, Mexico, 1999; pp. 197–220. [Google Scholar]
  47. Querejeta, J.I.; Estrada-Medina, H.; Allen, M.F.; Jiménez-Osornio, J.J. Water Source Partitioning Among Trees Growing on Shallow Karst Soils in a Seasonally Dry Tropical Climate. 44. Oecologia 2007, 152, 26–36. [Google Scholar] [CrossRef]
  48. Reyes-García, C.; Andrade, J.L.; Luis Simá, J.; Us-Santamaría, R.; Jackson, P.C. Sapwood to heartwood ratio affects whole-tree water use in dry forest legume and non-legume trees. Trees 2012, 26, 1317–1330. [Google Scholar] [CrossRef]
  49. Borchert, R. Soil and Stem Water Storage Determine Phenology and Distribution of Tropical Dry Forest Trees. Ecology 1994, 75, 1437–1449. [Google Scholar] [CrossRef]
  50. Bucci, S.J.; Goldstein, G.; Meinzer, F.C.; Scholz, F.G.; Franco, A.C.; Bustamante, M. Functional Convergence in Hydraulic Architecture and Water Relations of Tropical Savanna Trees: From Leaf to Whole Plant. Tree Physiol. 2004, 24, 891–899. [Google Scholar] [CrossRef]
  51. Singh, K.P.; Kushwaha, C.P. Emerging paradigms of tree phenology in dry tropics. Curr. Sci. 2005, 89, 964–975. [Google Scholar]
  52. Stratton, L.; Goldstein, G.; Meinzer, F.C. Stem water storage capacity and efficiency of water transport: Their functional significance in a Hawaiian dry forest. Plant Cell Environ. 2000, 23, 99–106. [Google Scholar] [CrossRef]
  53. Olivares, E.; Medina, E. Water and nutrient relations of woody perennials from tropical dry forests. J. Veg. Sci. 1992, 3, 383–392. [Google Scholar] [CrossRef]
  54. Goldstein, G.; Sarmiento, G.; Meinzer, F. Patrones diarios y estacionales en las relaciones hídricas de árboles siempreverdes de la sabana tropical. Acta Oecologica 1986, 7, 107–119. [Google Scholar]
  55. Borchert, R. Phenology and Flowering Periodicity of Neotropical Dry Forest Species: Evidence from Herbarium Collections. J. Trop. Ecol. 1996, 12, 65–80. [Google Scholar] [CrossRef]
  56. Worbes, M.; Blanchart, S.; Fichtler, E. Relations between water balance, wood traits and phenological behavior of tree species from a tropical dry forest in Costa Rica—A multifactorial study. Tree Physiol. 2013, 33, 527–536. [Google Scholar] [CrossRef]
  57. Johnson, D.M.; Katul, G.; Domec, J.C. Catastrophic hydraulic failure and tipping points in plants. Plant Cell Environ. 2022, 45, 2231–2266. [Google Scholar] [CrossRef]
  58. Borchert, R. Responses of Tropical Trees to Rainfall Seasonality and Its Long-Term Changes. Clim. Change 1998, 39, 381–393. [Google Scholar] [CrossRef]
  59. Valladares, F.; Vilagrosa, A.; Peñuelas, J.; Ogaya, R.; Camarero, J.J.; Corcuera, L.; Sisó, S.; Gil-Pelegrín, E. Estrés hídrico: Ecofisiología y escalas de la sequía. In Ecología del Bosque Mediterráneo en un Mundo Cambiante, 2nd ed.; Valladares, F., Ed.; Naturaleza y Parques Nacionales, Ministerio de Medio Ambiente: Madrid, Spain, 2004; pp. 165–192. [Google Scholar]
  60. Wu, L.; Bai, X.; Li, C.; Li, H.; Cao, Y.; Ran, C.; Zhang, S.; Xiong, L.; Du, C.; Luo, G.; et al. Assessment of carbon sinks caused by the chemical weathering of carbonate rocks under the influence of exogenous acids: Methods, progress, and prospects. Sci. China Earth Sci. 2025, 68, 1785–1804. [Google Scholar] [CrossRef]
  61. ICRAF 2019. Tree Functional Attributes and Ecological Database. Available online: https://worldagroforestry.org/tree-knowledge/type-of-resource/tree-databases (accessed on 25 June 2025).
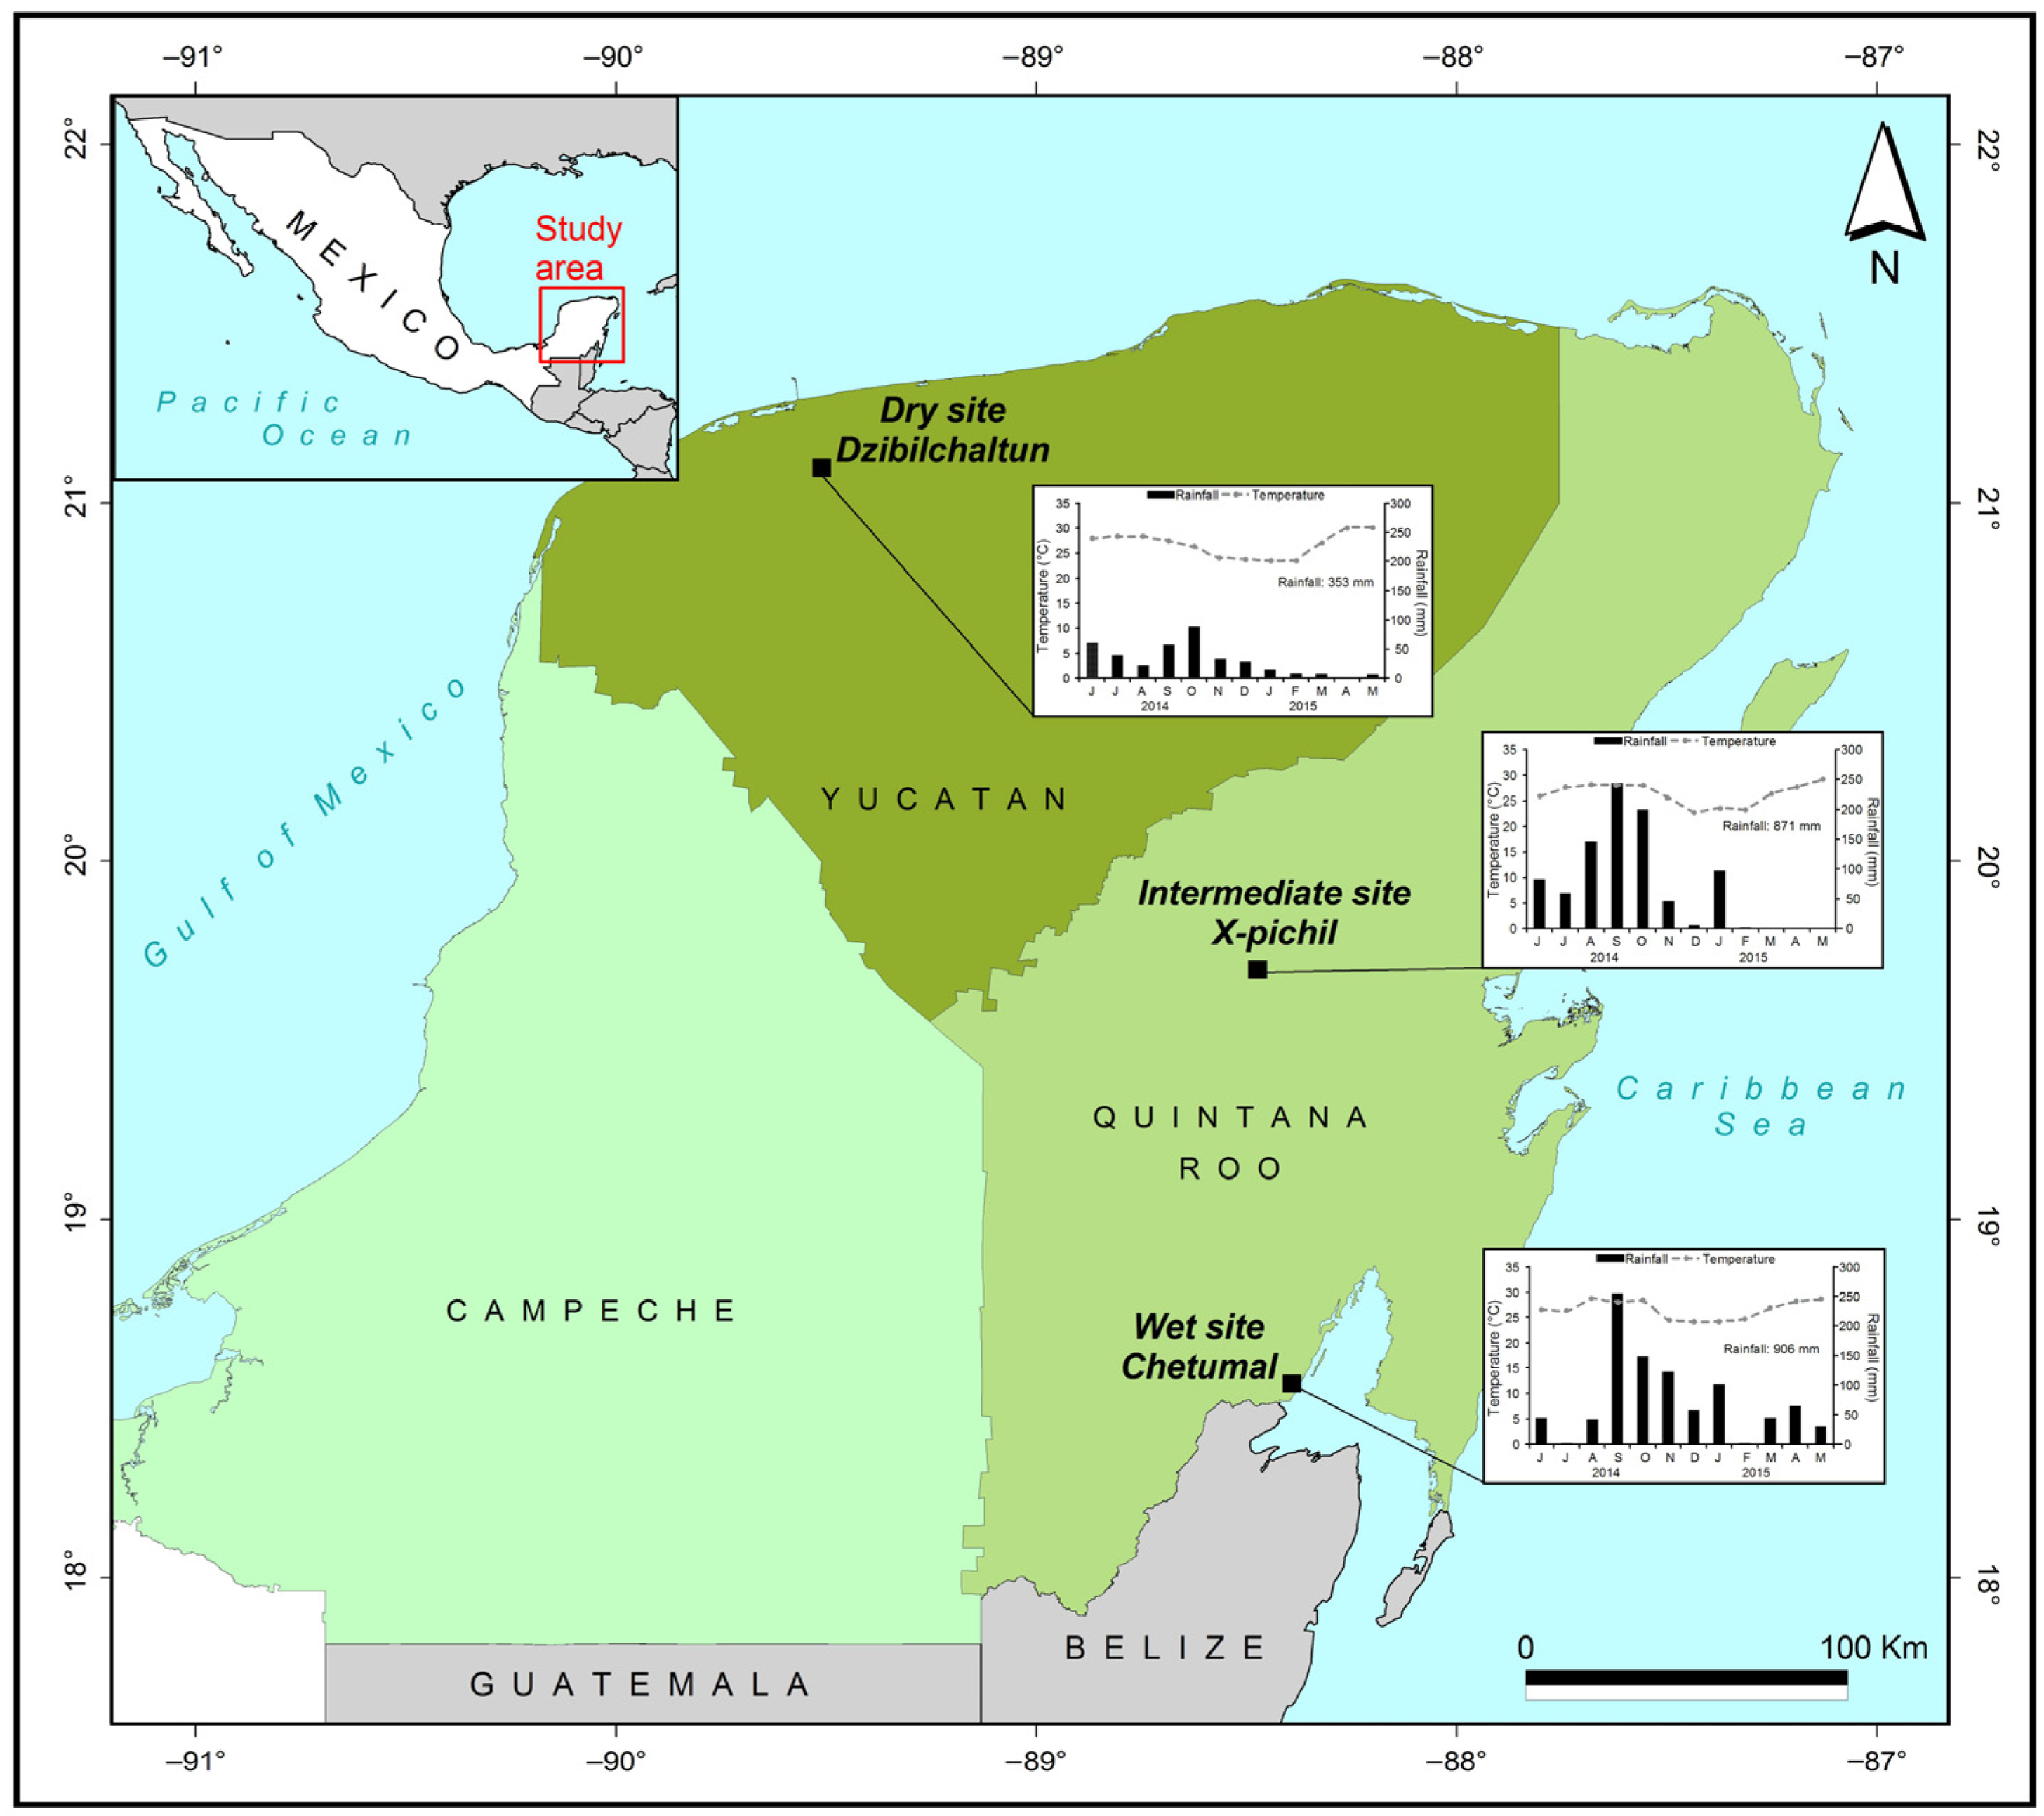
Figure 1. Geographic location of the three study sites in the Yucatán Peninsula, Mexico: dry site (Dzibilchaltún National Park; 21°05′ N, 89°35′ W; MAP 700 mm), intermediate site (X-pichil forest reserve; 19°41′ N, 88°22′ W; MAP 1000 mm), wet site (ECOSUR forest area in Chetumal; 18°32′ N, 88°15′ W; MAP 1200 mm). Ombrothermic diagrams correspond to the sampling period at each site.
Forests 16 01535 g001
Figure 2. Wood density (WD, g cm−3) groups for 16 tree species considering two diameter classes: young (<10 cm DBH) and mature (>20 cm DBH). Groups: light-wood (WD < 0.50 g cm−3), soft-wood (0.50–0.74 g cm−3), and hard-wood (>0.75 g cm−3). Error bars indicate ± SE.
Forests 16 01535 g002
Figure 3. Predawn water potential (Ψpd, MPa) recorded for 16 tree species in the Yucatán Peninsula during the rainy season (R), nortes (N), and dry season (D). (a) Young stage; (b) mature stage. Values represent mean ± SE, n = 319.
Forests 16 01535 g003
Figure 4. Midday water potential (Ψmd, MPa) for 16 tree species during the rainy season (R), nortes (N), and dry season (D). (a) Young stage; (b) mature stage. Values are mean ± SE, n = 319.
Forests 16 01535 g004
Figure 5. Water potential comparison of Cordia dodecandra, homegarden vs. natural conditions. (a) Predawn water potential (Ψpd), (b) midday water potential (Ψmd); error bars represent standard errors.
Forests 16 01535 g005
Figure 6. Saturated water content (SWC, %) for 16 tree species grouped by wood density classes and considering two diameter classes: young (<10 cm DBH) and mature (>20 cm DBH). Values are mean ± SE.
Forests 16 01535 g006
Figure 7. Relative water content (RWC, %) for 16 tree species of the Yucatán Peninsula. (a) Rainy season comparison among sites; (b) comparison between diameter classes and sites. Values are mean ± SE.
Forests 16 01535 g007
Figure 8. Specific leaf area (SLA) recorded for 16 tree species. (a) Rainy season comparison among sites. (b) comparison between seasons and sites. Values are mean ± SE.
Forests 16 01535 g008
Figure 9. Principal component analysis (PCA) for 16 tree species during the dry season (n = 319), based on wood density (WD), saturated water content (SWC), predawn water potential (Ψpd), midday water potential (Ψmd), relative water content (RWC), specific leaf area (SLA), and diurnal amplitude of water potential (ΔΨ). Functional groups identified: (A) hard-wood; (B) light-wood; (C) soft-wood with high RWC; (D) soft-wood with high SLA; (E) soft-wood tolerant to low water potentials. Symbols and colors indicate functional groups; percentages in axes labels represent variance explained.
Forests 16 01535 g009
Table 1. Main characteristics of the species, grouped according to wood density, showing the number of individuals per species. Wet site (W, 1200 mm mean annual precipitation), intermediate site (I, 1000 mm mean annual precipitation), dry site (D, 700 mm mean annual precipitation), young stage (Y), mature stage (M). Asterisks indicate that trees were in homegardens.
FamilySpeciesKeyFruit TypeLeaf PhenologyIndividual
WID
YMYMYM
Light-wood species
BurseraceaeBursera simaruba (L.) Sarg.BsDrupeD444444
AnacardiaceaeSpondias sp.SpDrupeD044404 *
Soft-wood species
ApocynaceaeThevetia peruviana (Pers.) K. Schum.TpDrupeE44443 *0
BoraginaceaeCordia dodecandra DC.CdDrupeD444 *3 *42 *
SterculiaceaeGuazuma ulmifolia Lam.GuCapsuleD440044
BoraginaceaeEhretia tinifolia L.EtDrupeE444 *4 *04
LeguminosaePiscidia piscipula (L.) Sarg.PpPodD444444
EbenaceaeDiospyros cuneata Standl.DcDrupeE004044
AnacardiaceaeMetopium brownei (Jacq.) Urb.MbDrupeD444400
PolygonaceaeGymnopodium floribundum RolfeGfNutE004444
FabaceaeLysiloma latisiliquum (L.) Benth.LyPodD444444
FabaceaeLeucaena leucocephala (Lam.) de WitLlPodD444444
MalpighiaceaeByrsonima crassifolia (L.) KunthBcDrupeD444404
Hard-wood species
MoraceaeBrosimum alicastrum Sw.BaDrupeE444 *4 *4 *4 *
SapotaceaeManilkara zapota (L.) P. RoyenMzDrupeE44442 *3 *
SapotaceaeChrysophyllum mexicanum Brandegee ex Standl.CmDrupeE4444 *2 *4 *
Table 2. Physiological parameters are grouped according to wood density, between sites, seasons, and diameter classes. Wet site (W), intermediate site (I), dry site (D), young stage (Y), mature stage (M), wood density (WD, g cm−3), saturated water content (SWC, %), predawn water potential (Ψpd, MPa), midday water potential (Ψmd, MPa), relative water content (RWC, %), specific leaf area (SLA, cm2 g−1), the hyphen represents absence of trees in the site, the asterisk represents absence of leaves of individuals in the site, n = 319.
SiteSeasonWDSWCΨpdΨmdRWCSLA
YMYMYMYMYMYM
Light-wood species
B. simarubaWrain0.340.44255188−0.39−0.39−0.61−0.635467133120
dry0.380.45242201−0.45−0.48−0.99−0.596168138140
nortes0.350.42319230−0.37−0.37−0.5−0.524160127123
Irain 0.340.39287227−0.34−0.45−0.57−0.73651129128
dry0.380.44242173−0.88−0.87−1.1−1.085060122124
nortes0.340.43272211−0.46−0.38−0.5−0.45485397102
Drain 0.390.46225146−0.33−0.31−0.81−0.745869132144
dry0.430.42204179−1.02−0.71−1.3−1.245561153153
nortes0.410.43188200−0.95−0.84−1.18−0.616163*131
Spondias sp.Wrain - 0.41 - 207 - −0.13 - −0.25 - 63 - 213
dry - 0.45 - 201 - −0.48 - −0.59 - 68 - 179
nortes - 0.42 - 230 - −0.37 - −0.52 - 60 - *
Irain 0.290.42305196−0.2−0.18−0.99−1.054556184184
dry0.320.43285175−0.97−0.59−1.6−1.54863239236
nortes0.350.45293198−0.25−0.29−0.86−0.573550211161
Drain - 0.36 - 254 - −0.31 - −1 - 95 - 188
dry - 0.38 - 282 - −0.81 - −1.54 - 74 - 193
nortes - 0.43 - 201 - −0.41 - −0.75 - 89 - 199
Soft-wood species
T. peruvianaWrain0.460.54146145−1.16−1.06−1.75−1.534040184187
dry0.480.54149140−1.67−1.55−2.14−2.133638158145
nortes0.460.55176135−0.52−0.49−2.03−1.823342166147
Irain 0.550.61134115−1.08−1.01−1.5−1.754241172149
dry0.570.63112109−2.27−1.9−2.67−2.293539136137
nortes0.540.54158145−1.39−1.27−1.66−1.83434148122
Drain0.52 - 121 - −0.82 - −1.49 - 54 - 209 -
dry0.53 - 140 - −1.9 - −2.47 - 36 - 115 -
nortes0.56 - 116 - −1.73 - −2.19 - 48 - 150 -
L. leucocephalaWrain0.550.6711594.8−0.71−0.75−1.12−1.334664256273
dry0.540.67142104−0.76−0.93−1.63−1.614659182174
nortes0.60.66129107−0.92−0.96−1.83−1.694971197203
Irain0.60.6411097.2−0.25−0.12−1.66−1.644853355293
dry0.610.6611697.6−0.88−0.85−2.16−2.163845179172
nortes0.570.62140121−0.37−0.26−1.09−0.644043171196
Drain0.630.711899−0.32−0.57−0.96−1.494356256246
dry0.650.6899.292.1−2.98−1.1−3.78−2.824152147152
nortes0.610.67115104−1.9−1.59−3.29−3.313955167147
P. piscipulaWrain0.660.7110881.3−0.54−0.49−0.63−0.577274132134
dry0.640.72114105−0.92−1.08−2.04−1.8677288111
nortes0.630.7131109−0.81−0.81−1.36−1.25616411999
Irain0.610.7510782.3−0.25−0.23−0.86−0.836871121104
dry0.650.7410392.1−0.7−0.55−2.15−1.01656811679
nortes0.640.68124122−0.62−0.6−1−0.84636811294
Drain0.630.710987.8−0.36−0.39−1.04−0.926556117101
dry0.670.7310896.1−1.08−0.93−1.61−1.76065109109
nortes0.670.711090.9−0.87−0.75−1.9−1.3364739786
E. tinifoliaWrain0.630.65111111−0.35−0.48−0.99−0.896163173148
dry0.640.67112106−0.69−0.9−1.8−1.566767152145
nortes0.670.67118117−0.51−0.62−1.13−1.376262163139
Irain0.570.58119129−0.6−0.58−1.68−1.484943171172
dry0.590.61121121−0.66−0.52−2.01−2.056667177191
nortes0.610.61125123−0.19−0.15−0.25−0.286866141151
Drain - 0.63 - 105 - −0.38 - −1.15 - 57 - 133
dry - 0.6 - 107 - −0.78 - −1.62 - 64 - 160
nortes - 0.66 - 97.4 - −1.09 - −1.44 - 74 - 132
C. dodecandraWrain0.690.7105104−0.86−0.81−1.23−1.25656510487
dry0.690.710498.2−0.69−0.62−1.17−1.076566148125
nortes0.670.66109104−0.63−0.56−1.09−17071115146
Irain0.580.792.590.5−0.97−0.5−1.95−1.95255141132
dry0.620.7211592.7−1.21−0.74−2.47−2.0864688295
nortes0.570.6814694−0.64−0.43−0.75−0.656573150187
Drain0.620.7210786.2−0.73−0.73−1.54−1.976152100114
dry0.610.7212798.5−1.57−1.08−2.18−1.58546015399
nortes0.60.6912998.3−1.28−1.56−2.03−1.955165125102
G. floribundumWrain0.670.69107101−1.71−1.21−3.19−2.815452180157
dry0.70.7198.492.7−1.5−1.27−3.99−3.085963126113
nortes0.690.7011196.7−1.99−1.55−3.5−3.16567161130
Drain0.710.728187.5−0.65−0.63−2.33−2.274958176161
dry0.700.7087.390.8−2.31−2.79−4.5−4.72545912392
nortes0.700.7188.792−4.01−3.45−5.41−4.335966144159
L. latisiliquumWrain0.410.55205130−0.37−0.31−1.95−2.4365707472
dry0.360.63254111−0.44−0.47−1.93−1.715676154145
nortes0.420.66218111−0.48−0.71−2.23−2.6467747772
Irain0.440.66214109−0.77−0.81−2.65−2.684558117117
dry0.430.66199112−0.99−0.95−2.19−2.123556266198
nortes0.400.66248116−0.16−0.21−1.76−0.82426114794
Drain0.430.7319892−0.23−0.32−1.94−2.376567156112
dry0.470.7216186−1.64−1.95−2.30−2.94325518387
nortes0.460.6915886−2.74−1.72−3.92−2.44426612495
M. browneiWrain0.590.6714397.4−0.45−0.48−0.54−0.495762107112
dry0.620.67123111−0.58−0.58−0.96−0.8157669393
nortes0.580.64150114−0.52−0.69−0.84−1.22596593104
Irain0.530.61149120−0.43−0.51−0.62−0.594460128117
dry0.570.63149124−0.77−0.74−1.86−1.355763174217
nortes0.630.65137127−0.8−0.78−0.9−0.855360116102
G. ulmifoliaWrain0.620.6410297.3−0.67−0.79−0.9−0.935359205220
dry0.570.6612695.2−0.94−1.07−1.86−2.255264166195
nortes0.590.64124104−0.89−1.04−1.46−1.585459160192
Drain0.640.6397.297.9−0.42−0.4−1.27−1.254739182184
dry0.650.6598.6103−2.37−1.51−2.5−1.665353149105
nortes0.650.6510197.9−2.2−1.92−3.16−3.235757161151
D. cuneataWrain0.69 - 91.8 - −0.53 - −2.11 - 42 - 93 -
dry0.70 - 88 - −1.36 - −3.62 - 56 - 76 -
nortes0.70 - 91.4 - −1.1 - −2.8 - 62 - 67 -
Drain0.660.6810399.3−0.59−0.58−1.96−2.135557126101
dry0.690.79596.7−3.57−2.44−5.3−4.8356617866
nortes0.700.6997.5104−2.58−2.07−3.41−3.0662638476
B. crassifoliaWrain0.510.6415799.2−0.18−0.17−1.11−1817589125
dry0.540.6154118−0.3−0.74−1.26−1.36787394117
nortes0.510.59161120−0.36−0.3−1.33−1.09847796134
Irain0.50.66166114−0.35−0.3−1.27−1.377075132130
dry0.530.64155116−0.3−0.43−1.52−1.415965111127
nortes0.590.58150150−0.15−0.15−0.71−0.486754109112
Drain0.590.58123133−0.41−0.3−1.32−1.336963134132
dry0.570.56146153−0.71−0.83−1.56−1.535561115122
nortes0.60.57128132−0.59−0.58−1.48−1.196772115114
Hard-wood species
B. alicastrumWrain0.780.8384.974.9−0.25−0.23−0.32−0.355452111115
dry0.770.8589.666.3−0.7−0.59−1.93−1.555654112113
nortes0.790.8193.677.4−0.49−0.49−0.6−0.65654119122
Irain0.80.7772.665.1−0.44−0.47−0.56−0.593139140159
dry0.830.8476.871.5−0.97−1.14−2.27−1.955652112112
nortes0.80.8183.873.6−0.49−0.39−0.49−0.456466116120
Drain0.820.8266.664.1−0.39−0.41−1.66−1.584239135134
dry0.830.8467.870.3−1.43−1.43−2.85−3.234749100104
nortes0.830.8372.276.5−0.75−0.76−0.79−15555106106
M. zapotaWrain0.790.738080−0.36−0.45−0.56−0.445858106110
dry0.80.779197.3−0.79−0.86−1.22−1.38626098103
nortes0.810.7987.285.4−1.19−1.05−2.04−1.666364104103
Irain0.810.8376.271−0.67−0.55−1.3−1.08545410594
dry0.840.8670.568.6−0.95−1.01−1.92−2.1764599986
nortes0.850.867571.9−0.93−0.84−1.34−1.4969679291
Drain0.840.8266.663.5−0.69−0.67−1.55−1.6457558987
dry0.830.8269.873−1.57−1.45−2.71−3.1756565384
nortes0.820.8174.877.5−1.15−0.86−1.92−1.6861688884
C. mexicanumWrain 0.790.8175.567.5−0.54−0.59−1.45−1.126867109110
dry0.750.7990.579.5−0.57−0.72−1.5−1.7656610498
nortes0.770.7692.897.4−0.61−0.63−1.43−1.096160142107
Irain 0.770.7479.257.1−0.34−0.54−1.04−1.1644874104
dry0.760.8283.970.1−0.87−0.76−1.56−1.8565587090
nortes0.730.8396.768.7−0.44−0.36−1.01−0.47697172108
Drain0.730.8374.980.7−0.41−0.58−1.7−1.44385698112
dry0.780.8185.161.6−0.98−1.06−2.02−2.1161598280
nortes0.780.7890.789.8−0.74−0.63−1.45−1.8768698986
Table 3. Spearman correlation between biological variables and environmental factors for 16 tree species of the Yucatán Peninsula. a p < 0.05, b p < 0.001, c p < 0.0001.
Environmental VariablesBiological Variables
Temperature (°C)Rainfall (mm)VPD (kPa)Ψpd (MPa)Ψmd (MPa)SWC (%)RWC (%)WD (g cm−3)
Ψpd (MPa)−0.1151 c0.4919 c−0.2572 c
Ψmd (MPa)−0.2195 c0.4151 c−0.2136 c0.6754 c
SWC (%)−0.0804 a0.0522−0.0966 b0.2190 c0.1966 c
RWC (%)−0.0708 a−0.04200.03840.1613 c0.1533 c−0.0861 b
WD (g cm−3)0.0357−0.0767 a0.0447−0.2009 c−0.1535 c−0.9231 c0.1578 c
SLA (cm2 g−1)0.03570.1080 c−0.03370.06030.05130.3153 c−0.2934 c−0.4078 c
Disclaimer/Publisher’s Note: The statements, opinions and data contained in all publications are solely those of the individual author(s) and contributor(s) and not of MDPI and/or the editor(s). MDPI and/or the editor(s) disclaim responsibility for any injury to people or property resulting from any ideas, methods, instructions or products referred to in the content.