Article

Precipitation Variations in the Central Qilian Mountains since the 7th Century and Regional Differences: Evidence from Tree-Ring Data

1
Key Laboratory of Land Surface Pattern and Simulation, Institute of Geographic Sciences and Natural Resources Research, Chinese Academy of Sciences, Beijing 100101, China
2
University of Chinese Academy of Sciences, Beijing 100049, China
3
Faculty of Geographical Science, Beijing Normal University, Beijing 100875, China
*
Author to whom correspondence should be addressed.
Forests 2024, 15(4), 624; https://doi.org/10.3390/f15040624
Submission received: 20 February 2024 / Revised: 21 March 2024 / Accepted: 26 March 2024 / Published: 29 March 2024

Abstract

:
The Qilian Mountains, located in northwest China and serving as a crucial water recharge area, have exhibited significant regional differences in precipitation patterns in recent decades. However, the limited temporal coverage of instrumental data has hindered a deep understanding of hydroclimate variations and regional differences. Further investigation into their long-term spatial and temporal precipitation characteristics is urgently needed. In this study, a new tree-ring-width chronology spanning 1743 years was established in the central Qilian Mountains using Qilian juniper (Juniperus przewalskii Kom.) samples. Significant correlations were found between the tree-ring indices and precipitation during both the growing and pre-growing seasons. Based on these correlations, annual precipitation from August of the previous year to July of the current year was reconstructed. The reconstruction model successfully explains 34.5% of the variation in precipitation during the calibration period. The analysis of the reconstructed series reveals notable interannual to multi-decadal dry–wet variability during the period from 614 AD to 2016 AD. The mid- to late-15th century emerges as the longest-lasting dry period, while the last decade stands out as the wettest. Comparative analysis with other precipitation reconstructions in the eastern and western Qilian Mountains reveals that regional drought events tend to be more pronounced and enduring. Low-frequency fluctuations on decadal to century scales show distinct wet and dry periods in the 12th–18th centuries in both the eastern and western parts of the Qilian Mountains, with weaker fluctuations in subsequent centuries. However, the central part of the Qilian Mountains exhibits opposite trends, possibly due to the complex interactions of multiple circulation systems.

1. Introduction

Located in the arid and semi-arid areas of northwest China, the Qilian Mountains are characterized by low annual precipitation and significant seasonal and spatial differences in precipitation. Serving as a crucial water replenishment area for the Hexi Corridor, they exert a significant influence on economic development and people’s livelihoods in the region [1]. The precipitation pattern in this area profoundly impacts regional environments and social development, thus attracting considerable public attention. In the context of global warming [2], there is a growing interest in understanding the spatial and temporal patterns of precipitation changes worldwide [3,4,5,6,7]. Therefore, a thorough understanding of precipitation variation in this region is essential for predicting future climate changes and formulating relevant policies.
Climate changes in this region are complex, influenced by the Asian monsoon system, mid-latitude westerly system, and the Tibetan Plateau, resulting in significant regional differences in precipitation. Observational data analysis revealed a pattern of less precipitation in the western Qilian Mountains and more in the east, with an overall increase since 2003 and notable disparities between the eastern, central, and western regions [8]. Precipitation trends in the eastern and western regions were generally opposite from 1960 to 2000 [9]. However, most of the meteorological stations in the Qilian Mountains were established after 1954; the limited temporal coverage of instrumental data hinders the study of climate change patterns over longer periods.
In recent years, dendrochronology research has been widely conducted in the Qilian Mountains due to the sensitivity of tree growth to environmental changes and the availability, wide spatial distribution, long time span, and high resolution of tree-ring samples [10,11,12,13,14]. While several millennium-scale precipitation and humidity series have been reconstructed, they are largely concentrated in the central and western parts of the northern slope of the Qilian Mountains [15,16,17], as well as in the central area of the southern slope [18,19]. Precipitation differences across different parts of the region have been observed over the past millennium [15,20]. For instance, during the past 150 years, tree-ring-based humidity series indicate a clear drying trend in the western part [15,17] and a wetting trend in the eastern part, while the central region showed a wet–dry–wet fluctuation with a wetting trend in the recent 50 years.
Interestingly, the distance between the western and central sites is less than 200 km, and the distance between the eastern and central sites is about the same. Questions such as why such significant differences exist between such close sites, whether those differences are related to recent rapid warming, and whether similar differences also exist over longer time scales are relevant to resource planning. However, these studies are unevenly spatially distributed and therefore inadequate for understanding long-term precipitation differences in this region. Therefore, constructing additional millennium-scale paleoclimate records in the region is essential for analyzing long-term hydroclimate variations and regional differences.
Based on the above questions, a new, millennium-scale tree-ring-width chronology was established in Gaotai county, located in the central-west parts of the Qilian Mountains. The aims of this study are to develop a new millennium-long tree-ring chronology, to increase the density of the research site distribution, and to investigate precipitation variations and regional differences in the study area over the past millennium.

2. Materials and Methods

The sampling for this study was conducted in the Wujia and Dashui valleys of Gaotai county, Gansu province, China (Figure 1). The valleys are located on the northern slope of the central Qilian Mountains, have similar local habitats, and are separated by a distance of less than 2 km. Qilian junipers grow sparsely on south- and semi-south-facing slopes at elevations of 3200–3700 m above sea level (m.a.s.l.) in this area. Some standing old dead trees are distributed at various elevations without signs of insect damage on the bark, and no other tree species, namely Qinghai spruce (Picea crassifolia Kom.) were found. Two increment cores were extracted from each living tree, and three or more increment cores were extracted from each dead tree, to obtain older and more complete cores. All the junipers sampled in the two valleys grow on the southeast-facing slope at altitudes ranging between about 3300 m and 3600 m. The average correlation between the measurements and the master series is as high as 0.72. Therefore, we merged the samples from the two valleys for further processing (referred to as GT hereafter). A total of 37 living trees and 50 standing dead trees of Qilian juniper were sampled, yielding 188 increment cores.
Nearby meteorological stations include Gaotai, Jiuquan, Sunan and Tuole, the first three meteorological stations located on the northern side of the Qilian Mountains. Gao Tai and Jiuquan stations are situated in the plains at lower elevations, while Tuole station is located adjacent to the sample site on the southern side (Table 1). The Qilian Mountains as a whole run in a northwest–southeast direction, with the highest peak reaching an altitude of 5808 m. The elevations of other major peaks are mostly between 4500 m and 5500 m. The blocking effect of the high mountains results in significant differences in precipitation conditions on the north and south sides of the main body of the Qilian Mountains. Considering the local precipitation characteristics, meteorological data from the nearest station (Sunan Station) was selected for subsequent analysis. The meteorological data utilized in this study were sourced from the China Meteorological Administration.
Based on meteorological data from Sunan Station spanning 1957–2018, the region experiences rainy and hot seasons concurrently. The average annual temperature is 4.05 degrees Celsius, with an annual precipitation of 264 mm. The majority of precipitation falls between June and August, accounting for 62.4% of the total annual rainfall. July has the highest amount of rainfall, with an average of 63.7 mm (Figure 2).
The collected samples were dried, fixed, and polished in the laboratory. After microscopic visual inspection and dating procedures [21,22], the ring-width measurements of the samples were obtained using the Lintab system. The COFECHA program [23] was used to assess the quality of the series and cross-dating. The tree-ring chronology was then constructed using the ARSTAN program [24]. Because the mean segment length of all measurements is 366 years, with the longest measurement being 1472 years, we could not obtain a reliable regional tree growth curve using the Regional Curve Standardization (RCS) detrending technique [25]. Negative exponential and linear function methods (168 cores) were mainly used to fit the growth trend of most measurements. To reduce the possible “end-effect” bias [26], we used the arithmetic mean horizontal line (51 cores) to detrend samples that were clearly in the middle and later stages of growth. For samples reaching the pith of the tree, we attempted to apply the Hugershoff growth curve (seven cores) and general negative exponential curve (eight cores) to fit the initial rapid growth of young trees. In cases of individual cores with abnormal growth fluctuations, we used a cubic smoothing spline function with a 50% frequency response cut-off at approximately 67% of the series length (five cores). The standard tree-ring-width chronology (STD) was ultimately obtained by dividing each original measurement by the fitted curves and employing a robust-weighted averaging method (Figure 3). Chronology statistics, including the average correlation coefficient among all samples, the average correlation coefficient between different samples from the same tree, the average correlation coefficient between different trees, a signal-to-noise ratio and expressed population signal, were employed to evaluate the quality of the chronology (Table 2). The length of the reliable chronology is determined using the expressed population signal (EPS) statistic, where an EPS greater than 0.85 is generally considered to be an acceptable threshold for a reliable chronology for climatic reconstruction [27]. Finally, the chronology was considered reliable when the sample size reached 10 cores, corresponding to the period from 614 to 2016 AD.
To identify the factors limiting the growth of Qilian Juniper, the correlation and response function analyses were conducted on the tree-ring chronology and instrumental data using the program dendroclim2002 [28,29]. The moving interval correlation analysis was also used to test the temporal stability of the relationship between the tree-ring chronology and instrumental data. We used climatic data from Sunan station, including monthly precipitation, monthly average temperature, and monthly average maximum and minimum temperature. The relationship between radial tree growth and climatic factors for individual months, different combinations of months, and the entire annual period were analyzed. A conversion function between the tree-ring index and climate factors was developed based on correlation analysis results and scatterplot distributions. The reliability of the conversion function was verified using both split-period verification and leave-one-out methods [30]. Finally, past precipitation changes in the region were reconstructed.
With regard to regional differences in dry–wet variations, we compared millennial-scale dry–wet reconstructions on the northern slope of the Qilian Mountains, including the central HYG site [16], the eastern LYA site [10], and the western YQ [15] and QF sites [17]. Wavelet spectrum and cross-spectrum analyses [31] were conducted to study the periodic variations in the reconstructed series and the similarities and differences in periodic fluctuations between adjacent sample sites.

3. Results

3.1. Correlation Analysis of Chronology and Climate Factors

The correlation analysis results indicate a positive correlation between the tree-ring index and precipitation in July of the previous year to September of the current year (Figure 4a). Particularly, significant correlations are observed with precipitation in the previous August (r = 0.289), previous December (r = 0.293), current January (r = 0.333), current May (r = 0.51), and current June (r = 0.35). However, significant correlations are found with the minimum temperature in the previous September (r = 0.348), previous October (r = 0.196), and current February (r = 0.238) and the maximum temperature in previous October (r = 0.267). A significant negative correlation with average temperature is found in May (r = −0.213). The response function analysis shows little change in the correlation between the tree-ring index and precipitation, while no significant relationships were found among the tree-ring index and temperature elements (Figure 4b). Significant correlations are also noted with spring and summer seasons, as well as annual precipitation. The highest correlation is observed with annual precipitation from July of the previous year to June of the current year (r = 0.63, p < 0.01), followed by the period from August of the previous year to July of the current year (r = 0.59, p < 0.01). The results of moving interval analysis further show the continuous significant positive correlations of the tree-ring index with precipitation in current May and June, and with annual precipitation from the previous August to current July and from the previous July to the current June (Figure 4c).

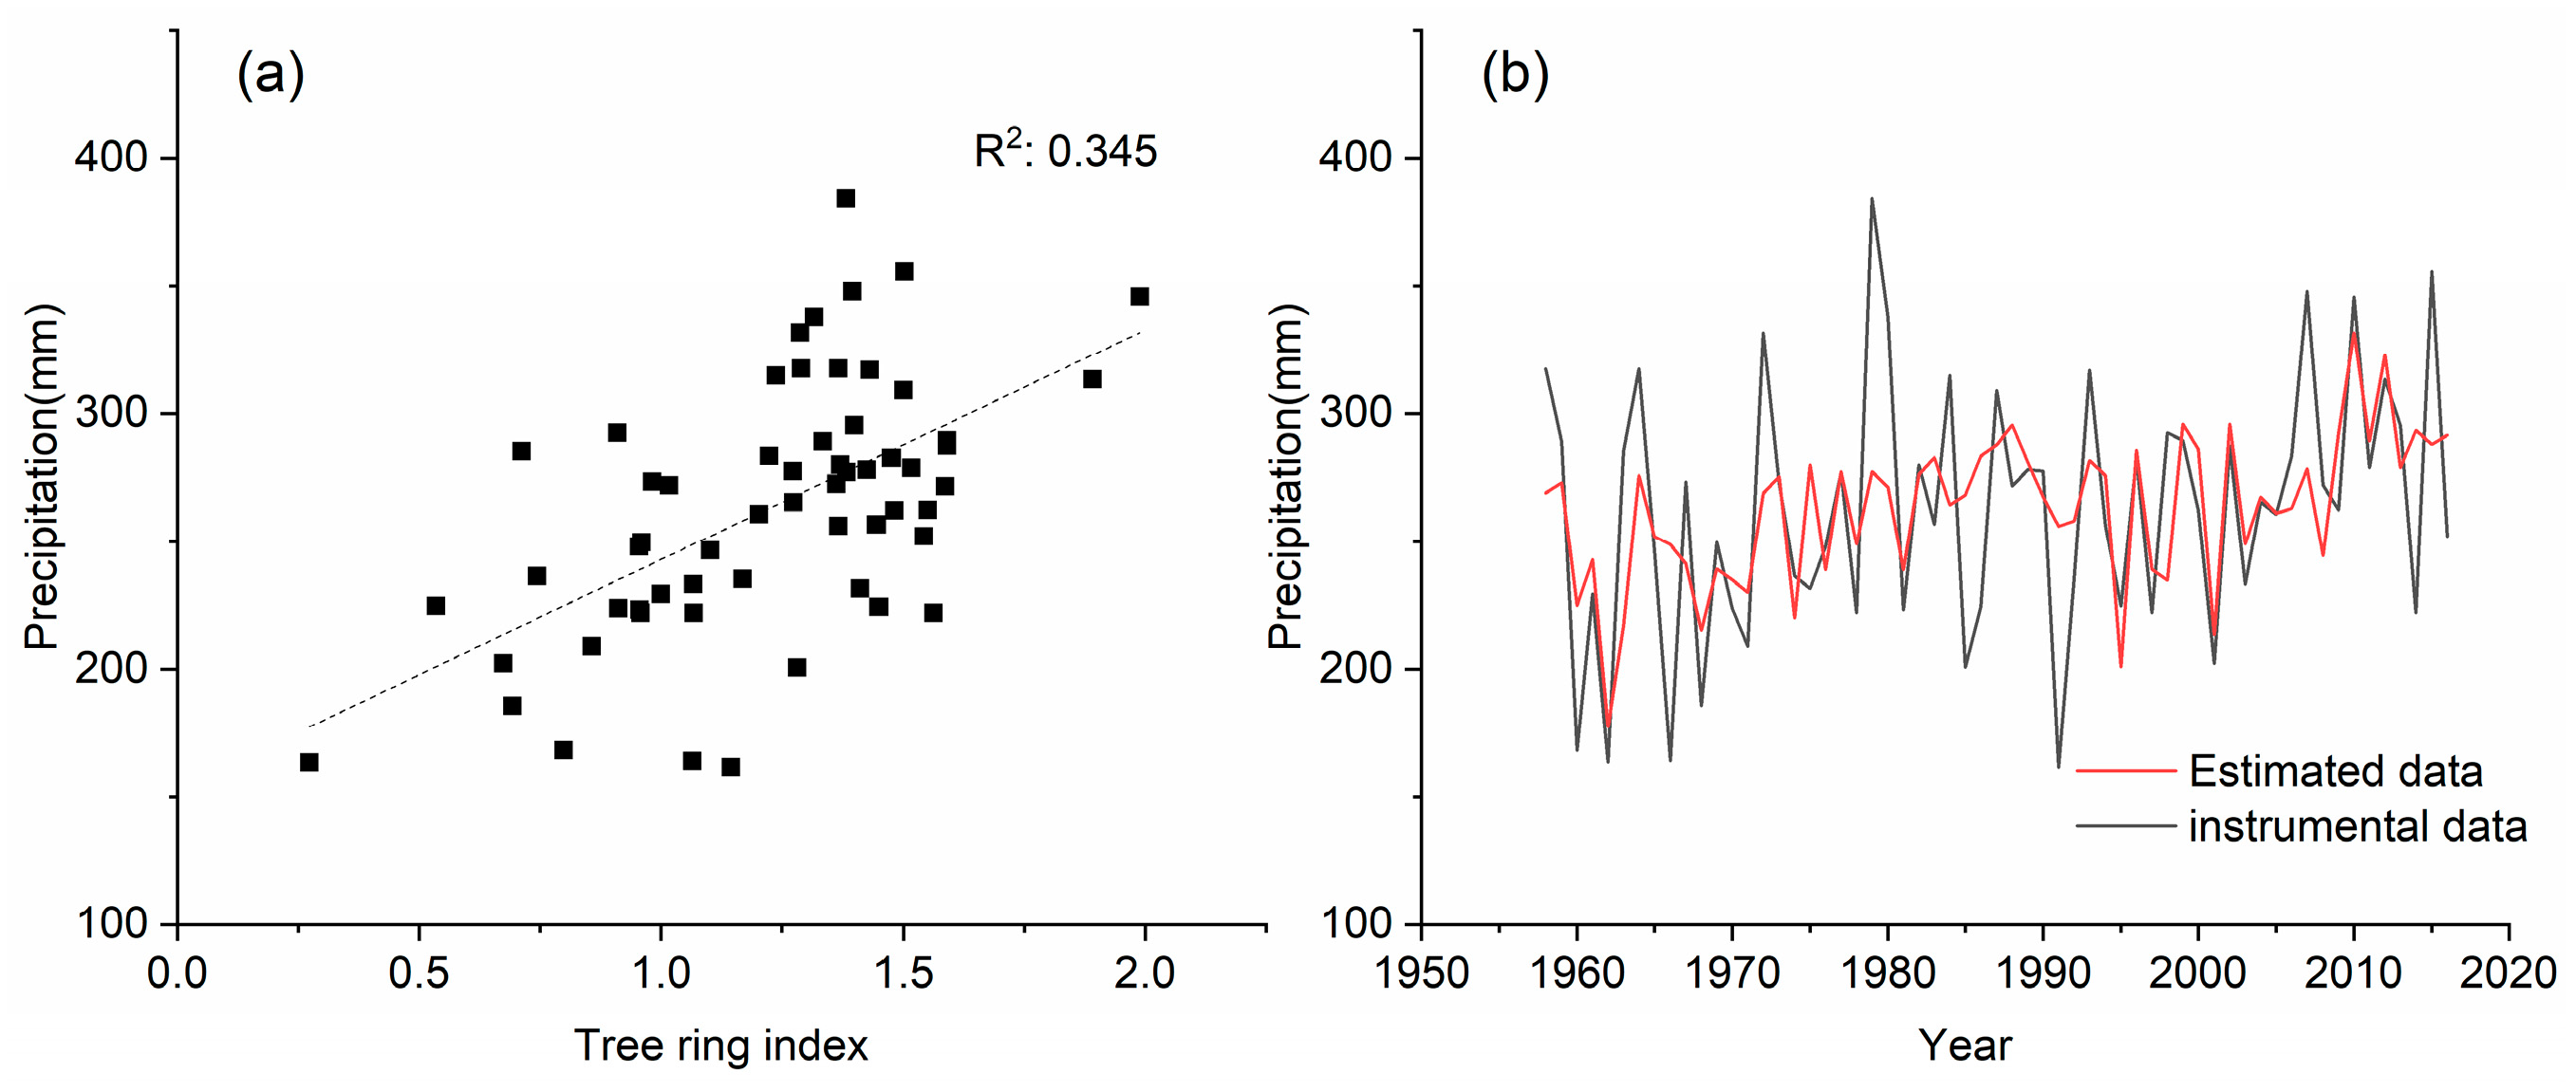
3.2. Calibration and Verification

Based on the results of correlation analysis and a comparison of the scatter plots of different monthly combinations of climate factors (Figure 5a), a linear regression model was utilized to reconstruct the precipitation changes in the central Qilian Mountains. After evaluating calibration and validation results from multiple high-correlation periods (Table S1), we chose to reconstruct the annual precipitation changes from August of the previous year to July of the current year. The reconstruction model is expressed as follows:
Prep8-c7 = 153 + 90 × STD
where Prep8-c7 is the annual precipitation from August of the previous year to July of the current year and STD is the ring-width index of the GT chronology.
The reconstruction explains 34.5% of the variance in actual precipitation, or 33.3% after adjusting the degrees of freedom. The F-test value is 29.9 (p < 0.01).
Figure 5b displays the comparison between actual precipitation and reconstructed precipitation from 1957 to 2016. It demonstrates good consistency in interannual high-frequency variations and low-frequency trends. In particular, the reconstructed values closely match the actual values in multiple dry years (such as 1957, 1962, 1995, and 2001) and wet years (1964, 2002, and 2010). Split-period verification results indicate a high correlation coefficient in both periods. The sign test and first-order difference sign test pass the 95% confidence test. The two strict statistical test values, RE and CE, are positive in each testing period and both exceed 0.3 (Table 3). All of the above analyses indicate that the reconstruction model is stable, robust, and statistically significant [32], demonstrating its ability to reconstruct past changes in precipitation.

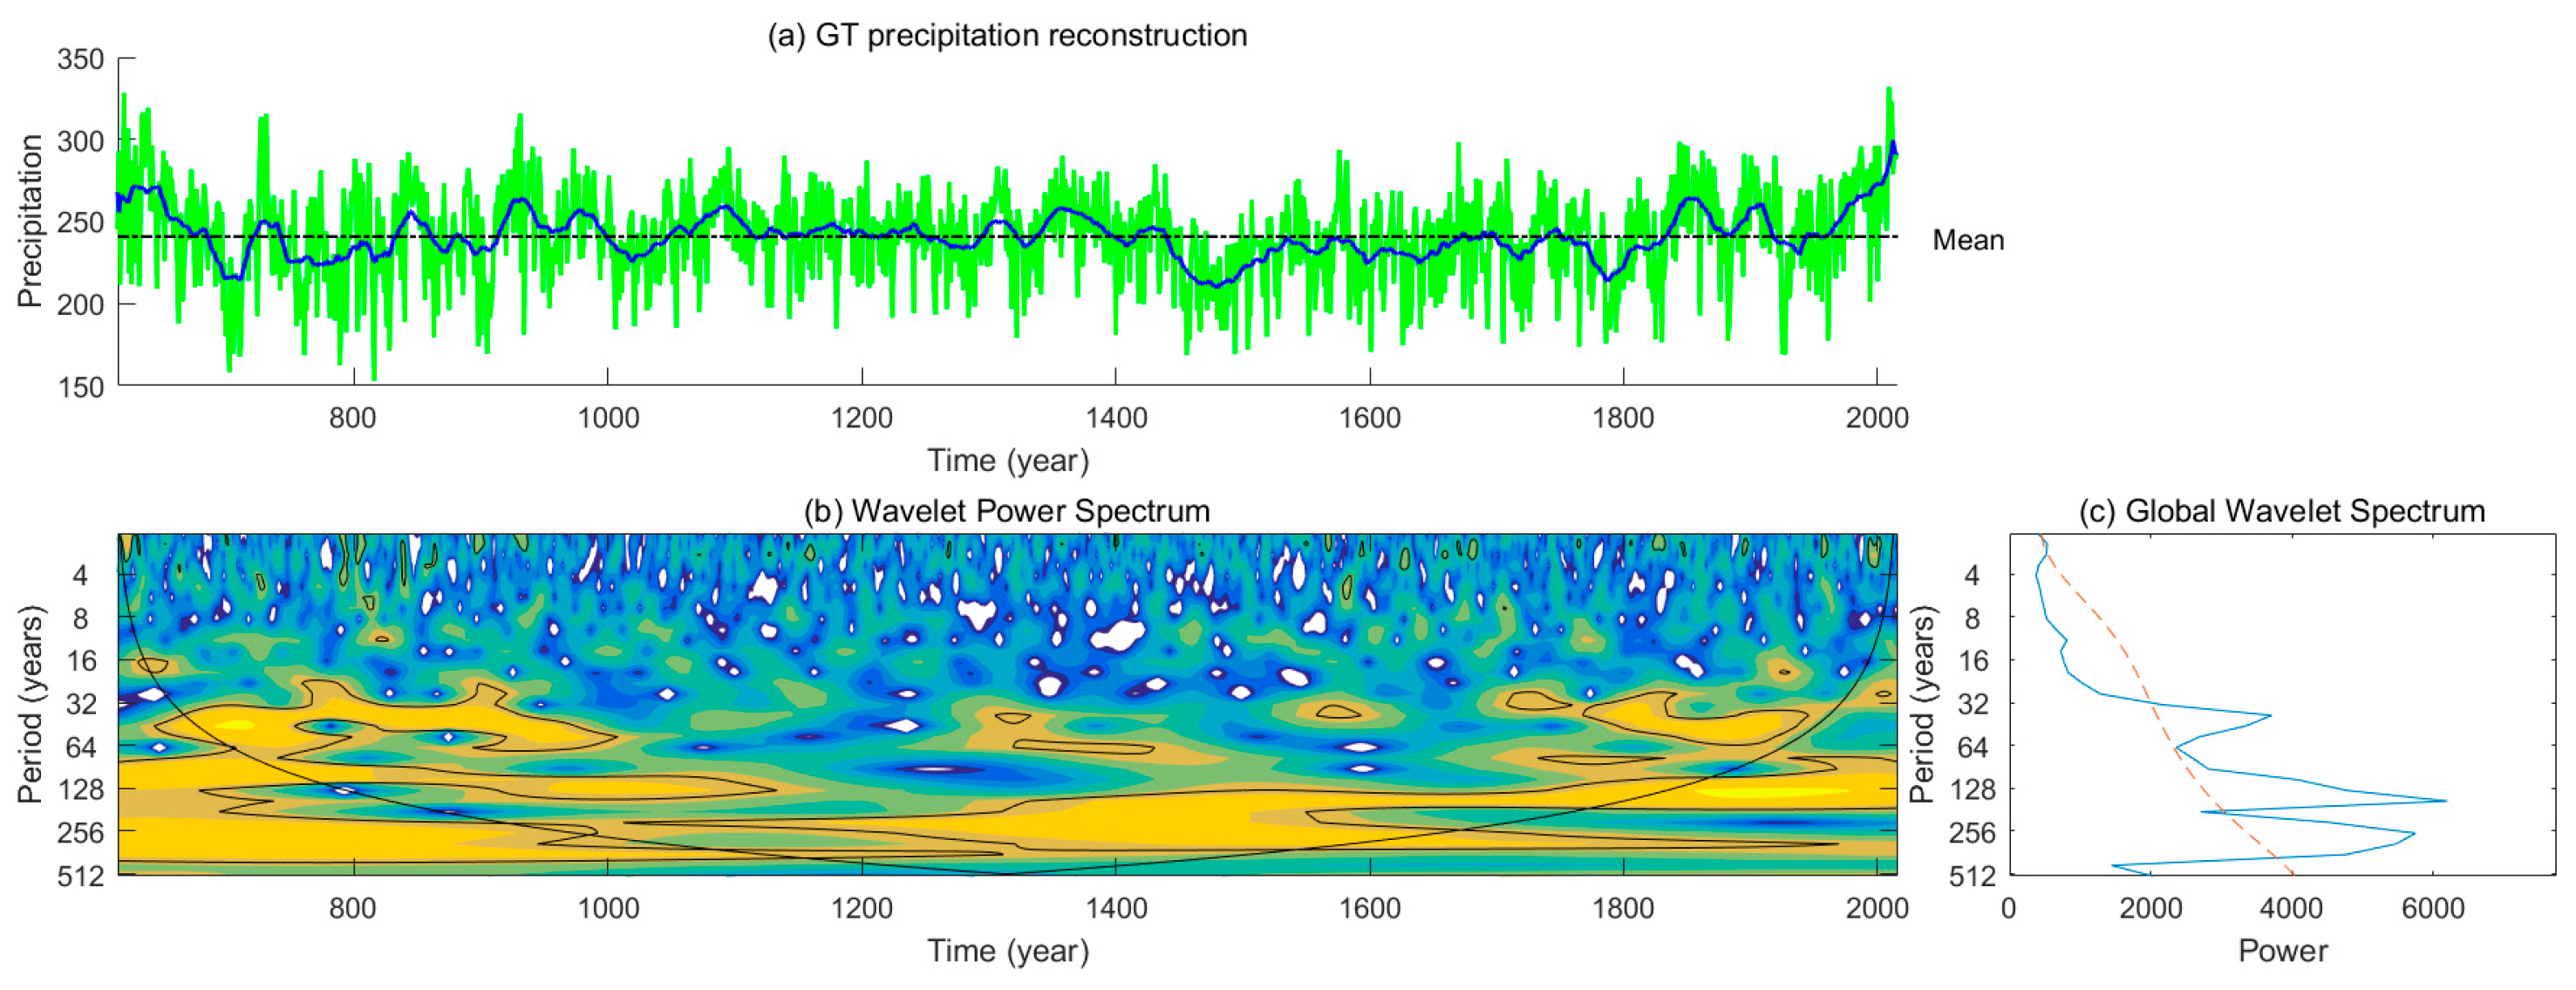
3.3. Annual Precipitation Variations over the Past 1403 Years

Based on the established regression function, the annual precipitation changes in the study area from August of the previous year to July of the current year were reconstructed. The annual precipitation reconstruction shows distinct interannual to multi-decadal scale fluctuations in dryness and wetness (Figure 6a). In addition, there are noticeable wet periods in the 7th century, early 10th century, 14th century, and late 19th and late 20th centuries, and several clear dry periods in the 8th, 11st, 15th, and 18th centuries. The mid-to-late 15th century was the longest and driest period, while the early 6th century and the recent 50 years were notably wet, with precipitation in the past 10 years being the greatest of the past 1403 years. The wavelet spectrum analysis indicates significant short periods of 2–3 years, mesoscale periods of about 40 years, and century-scale periods of about 160 and 260 years in the whole sequence (Figure 6c). The short–medium period is mainly distributed at the two ends of the sequence, while the long period runs through the whole sequence (Figure 6b).

4. Discussion

4.1. Climatic Implications of the Chronology and Validation of the Reconstruction

The correlation analysis between the tree-index and climate factors at Sunan Station suggests a close connection between the growth of Qilian juniper and precipitation during both the previous and current growing seasons. Specifically, during the early stage of the growing season (May–June), we observe a positive correlation of the tree-ring index with precipitation and a negative correlation with temperature, especially the maximum temperature in May and June. This correlation pattern aligns with the findings from other dry–wet reconstructions in northwest China. Reduced precipitation hampers the growth of Qilian Juniper [13,16,19], and high temperatures exacerbate the situation by increasing evaporation, thereby reducing the soil moisture content. This indicates that the soil moisture is the limiting factor for Juniper growth in this area. The continuous significant correlations between the tree-ring index and annual precipitation suggest a stable relationship between the two. Indeed, the signal of annual precipitation preserved in Qilian juniper has been widely validated by precipitation reconstructions for the Qilian Mountains and surrounding areas [33,34,35,36], and the multi-decadal dry–wet fluctuations in our reconstruction coincide well with those in other surrounding proxy-based dry–wet series (Figures S1 and S2), such as lake sediments [37], historical documents [38], and stalagmites [39], further confirming the stability and reliability of our reconstruction.
In the moving interval correlation analysis, we observed the highest correlation between the chronology and precipitation from May to June in the current year (r = 0.76, p < 0.01). However, the first-order difference sign test failed at the 95% confidence level for both the split calibration periods, and the values of Re and CE were negative. The annual precipitation situation from July of the previous year to June of the current year is also quite similar (Table S1). We therefore chose to reconstruct annual precipitation from previous August to current July, although the explained variances of the model in the calibration period are slightly low.
It is important to note that our reconstruction exhibits a certain degree of bias, as the driest year reconstructed in the instrument measurement period is not the driest throughout the entire period. Additionally, a comparison between the reconstructed data and the actual data indicates that our reconstruction better captures the signals of drought signals than moisture signals, as trees are more sensitive to a lack of water than an abundance of water. In several extreme rainy years, the reconstruction does not completely match the actual data. This discrepancy may be related to the growth environment of the Qilian juniper. At the sampling site, the slope is steep, the soil layer is thin, and the water storage capacity is weak, making heavy rainfall prone to forming surface runoff and flowing downhill [21,40]. Furthermore, during several drought years (such as 1992 and 1986), differences between the instrumental and reconstructed values may be related to precipitation differences over seasonal and annual time scales. Although total precipitation in these drought years was very low, monthly precipitation statistics from the previous August to current July revealed that precipitation for most of the previous August and the previous or current growing season was higher than or close to the multi-year average. Therefore, precipitation during the previous year or the current growing season ensured that tree rings could grow well, resulting in differences between the instrumental and reconstructed values. In addition, differences in location and altitude between the sample site and the meteorological station may partly explain the difference between reconstructed and actual data. However, from comparing series and verification results, it can be seen that our reconstructed series is well able to reflect the long-term trend and interannual precipitation variations in this area.

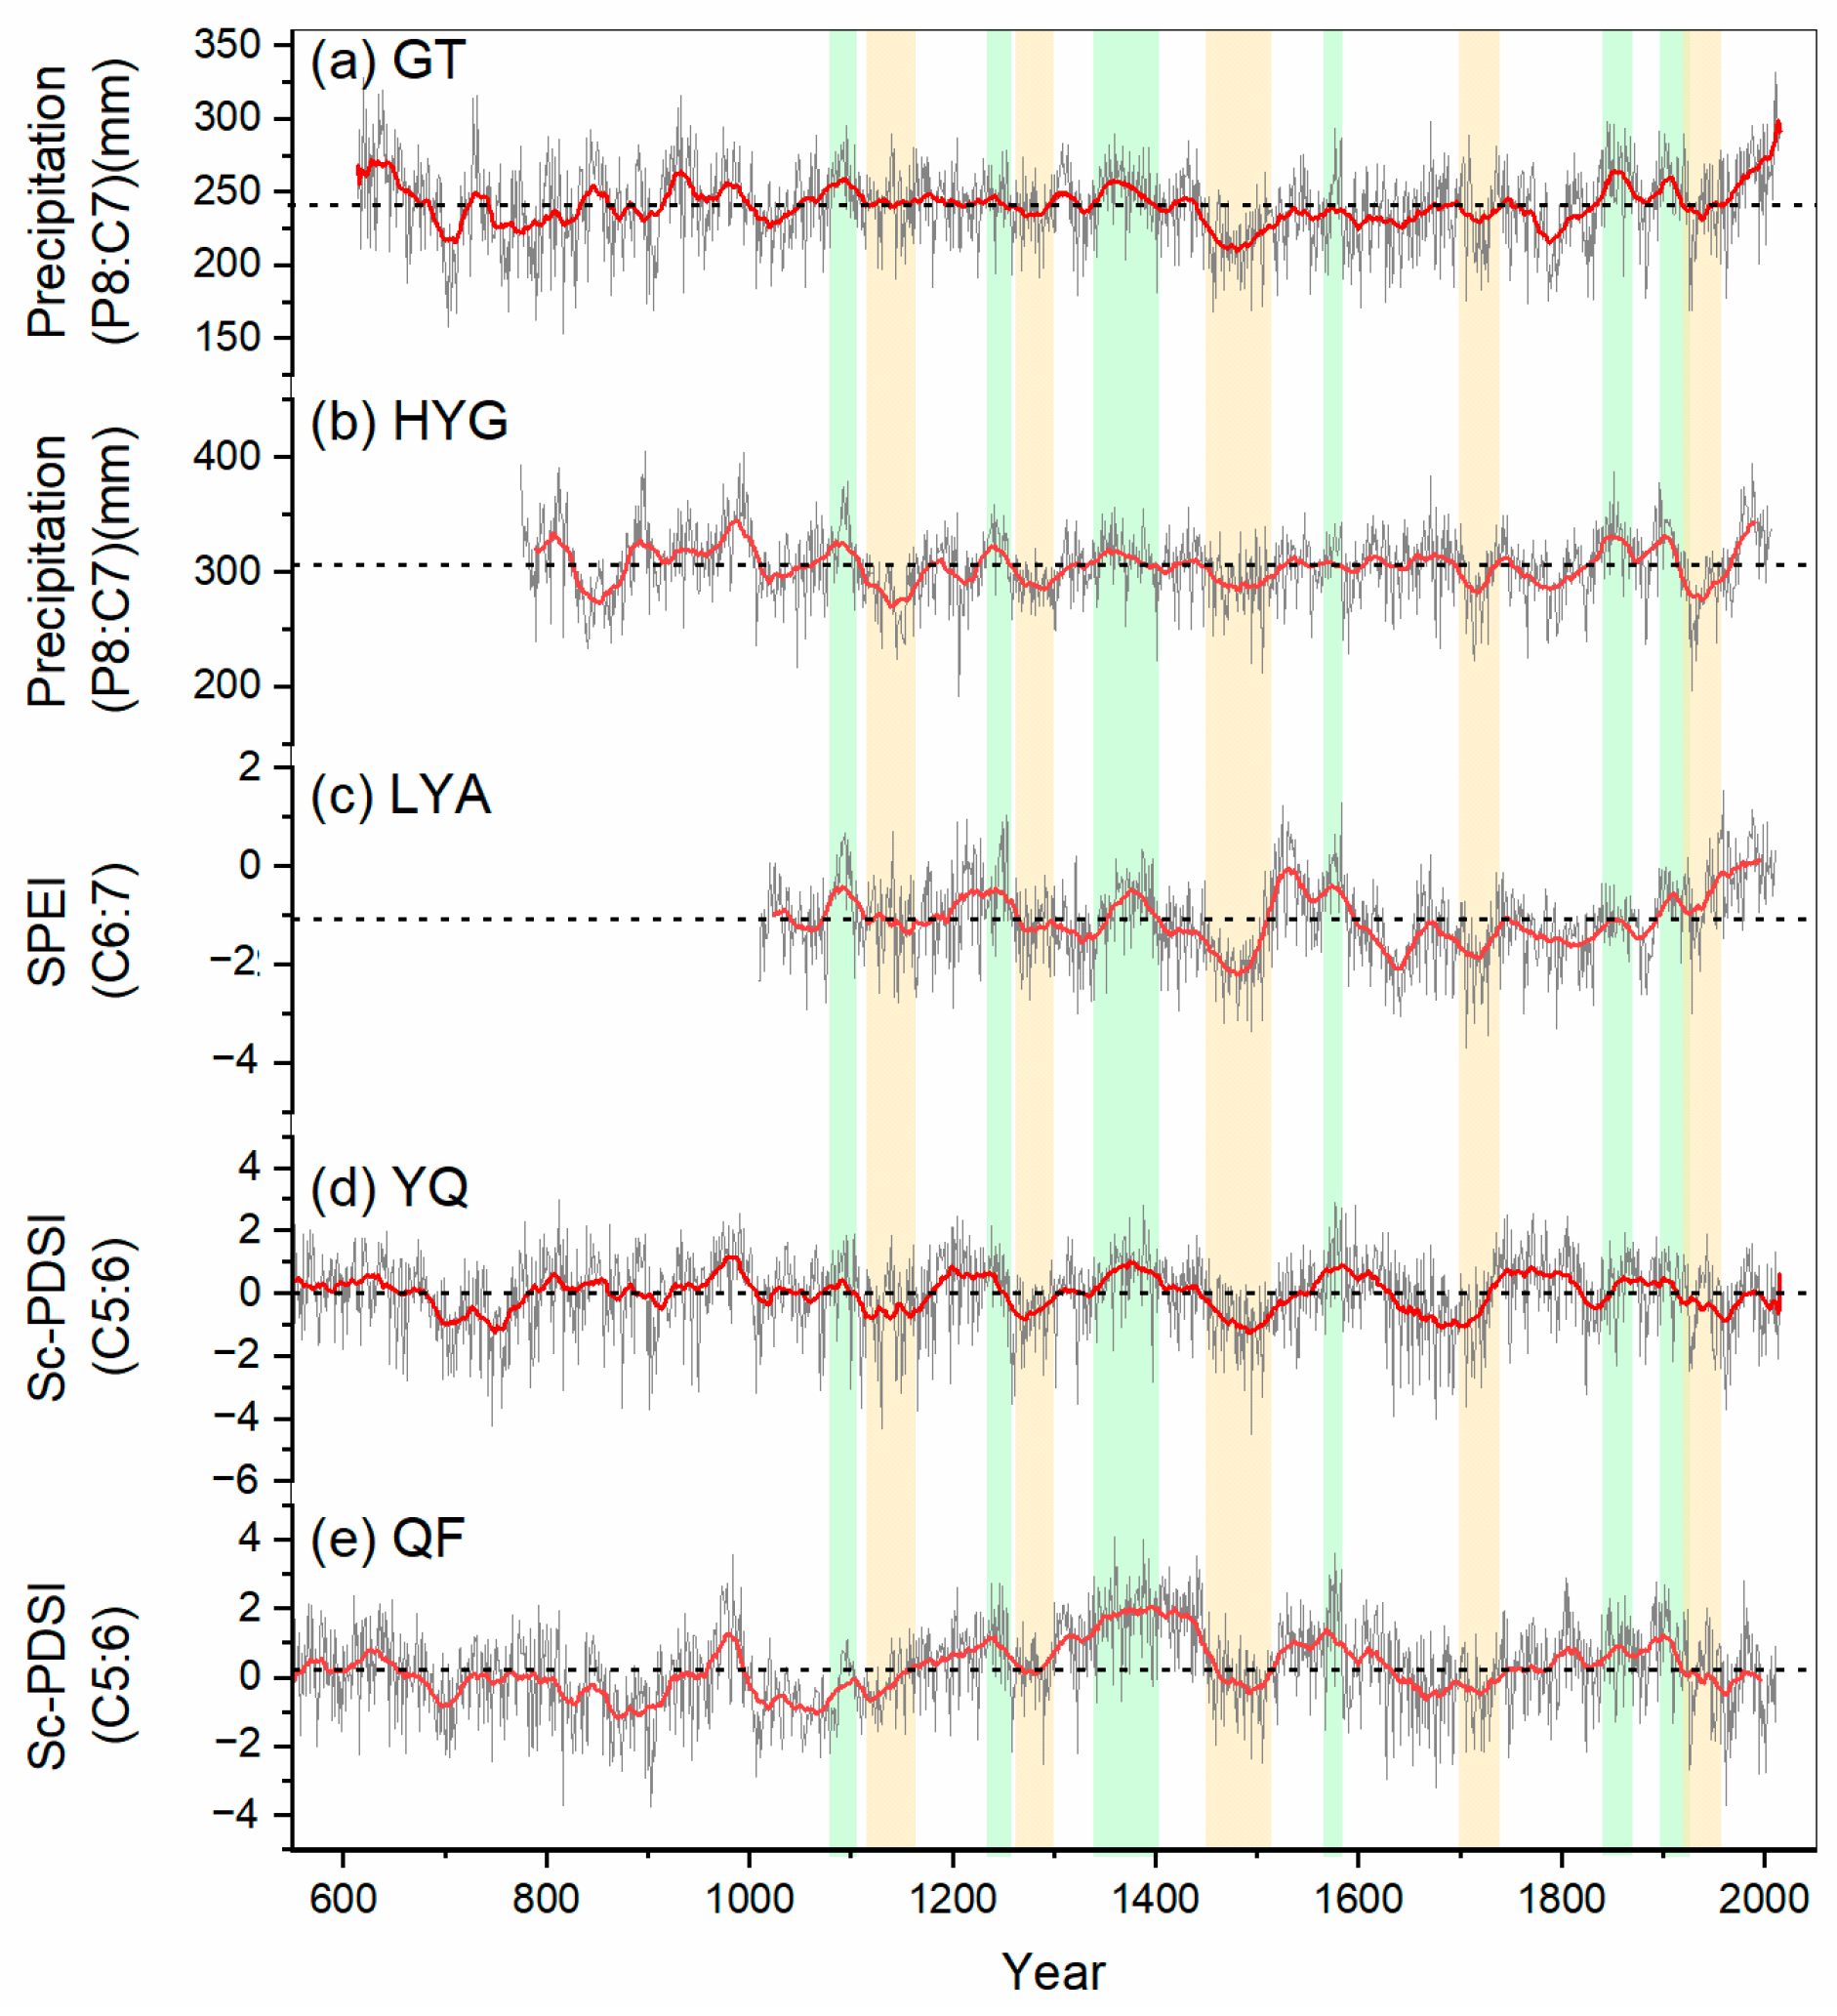
4.2. Regional Differences in Precipitation over the Past Millennium on the Northern Slope of the Qilian Mountains

In comparing dry–wet reconstructions from different sites (Figure 7), it becomes evident that the closer the sample sites are to each other, the more similar the variations in the reconstructed series. Both the GT series in this study and the HYG series provide reconstructions of annual precipitation from August of the previous year to July of the current year. There is good consistency in interannual and decade variations, evidenced by a significant correlation coefficient of 0.63 between the two reconstructions (AD 775–2006). However, some differences emerge in long-term fluctuations during the 8th–9th centuries, and different methods used to fit tree growth trends may contribute to this phenomenon [41,42,43]. Additionally, this may stem from the smaller sample size of the HYG series during this period, resulting in a larger variance in the series. A similar situation is observed during the earlier period of the YQ and QF series [15], which emphasizes the importance of maximizing the sample size in chronology development.
Comparing the LYA, YQ, and QF series over longer distances reveals a certain consistency in decadal variations over the past millennium. Consistent decadal periods of drought and wetness, such as significant droughts around the 1480s, 1700s, and 1920s, as well as significant wet periods around the 1380s, 1850s, and 1900s, are observed. However, significant regional differences exist. For example, over the past 100 years, the LYA, HYG, and GT series showed a trend of becoming drier and then gradually wetter, while the two series in the western part (YQ and QF) have continued to become drier. Additionally, significant multi-decadal dry–wet fluctuations occurred in the LYA series in the east and in the YQ and QF series in the west during the period from 1100 AD to 1800 AD, while there were smaller fluctuations in the remaining start and end periods, i.e., before 1100 AD and after 1800 AD. However, during this time, the dry–wet fluctuations in the GT and HYG series in the central region were exactly opposite.
The comparison of the five reconstructions above not only demonstrates the reliability of this study but also reveals the complex temporal and spatial variations of the dry–wet characteristics in the Qilian Mountain region. Overall, the decadal to multi-decadal scale drought events in the Qilian Mountains over the past millennium are more regional in nature and longer in duration compared to wet events, while low-frequency trends at multi-decadal scales often exhibit significant differences across the different parts of the Qilian Mountains. The distinct characteristics of low-frequency dry–wet fluctuations at central sites compared to those on the eastern and western sides reflect the climatic changes in areas influenced by both westerly winds and monsoons. Due to the interaction of signals from different circulation systems, precipitation patterns in this region are often more complex and require additional data to decipher.

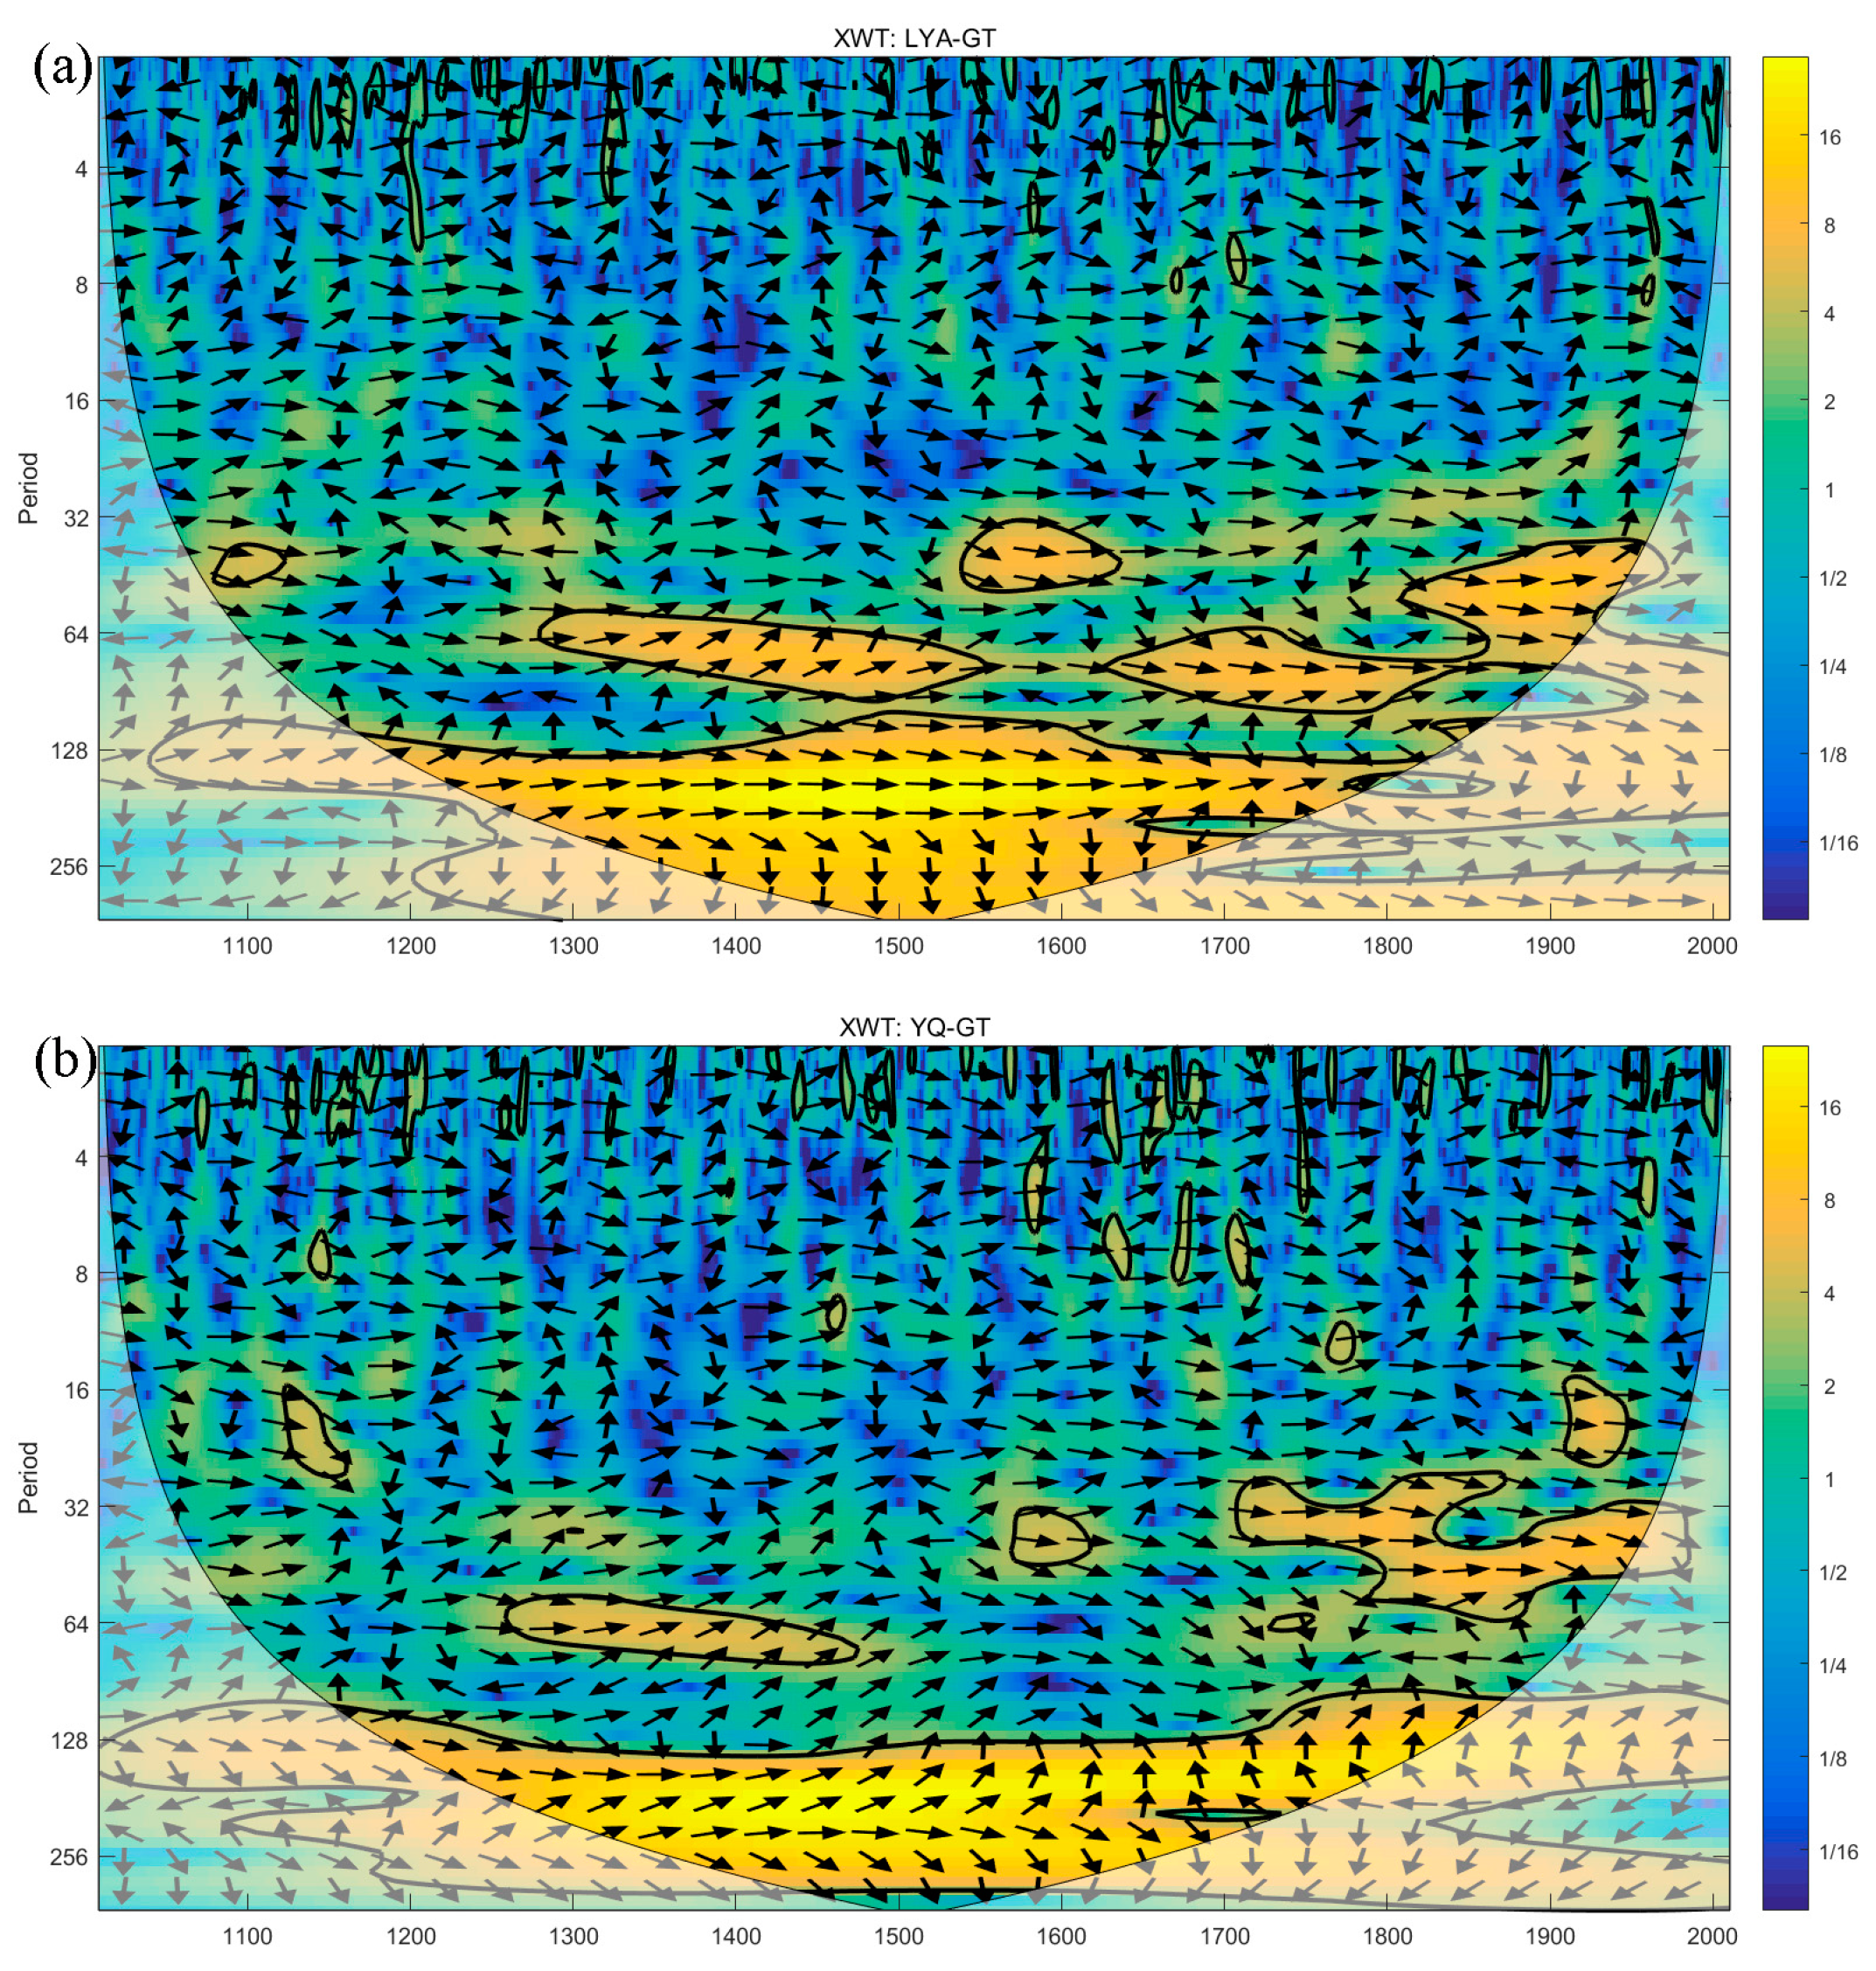
4.3. Similarities and Differences in Periodic Fluctuations

As mentioned above, the Qilian Mountains are influenced by various climate systems such as mid-latitude westerlies and Asian monsoons due to their location deep inland. The precipitation variations in this area contain mixed signals from multiple climate systems, as evidenced by the multi-scale periodic variations reflected in our reconstructed series (Figure 6). To further investigate the similarities and differences in cycle fluctuations between the GT series and the YQ and LYA series in the eastern, middle, and western Qilian Mountains, respectively, we employed cross-spectral analysis.
Figure 8 illustrates obvious similarities and differences in common cycles between the LYA-GT and YQ-GT. In general, they exhibit common cycles on different scales. For example, they share century-scale cycles in the 12th–19th centuries, a 50–80-year cycle in the 14th–15th centuries and a 40–60-year cycle around the 16th and 19th centuries. Significant common cycles of 4–8 years (mainly in the 17th century) and 20–30 years (mainly in the 1140s and around the 1930s) in YQ-GT occur less frequently in LYA-GT. Moreover, the common cycle of LYA-GT in the 18th century was likely about 60–80 years, whereas the common cycle of YQ-GT in this period was likely about 30–40 years. Additionally, significant cycles of 2–3 years are scattered throughout the past millennium, but the periods of occurrence are not consistent.
The consistency of the common cycles in the past millennium between the central site (GT) and the eastern (LYA) and western sites (YQ) may indicate that external forcings on different time scales, such as solar activity and different types of atmospheric oscillations, have had a wide range of impacts on the different parts of the Qilian Mountains at different times. For instance, significant century-scale cycles may imply that solar activity had a wide range of impacts on the dryness and wetness of the region [44,45], while a significant multi-decade-scale cycle in a certain period is close to the cycles of some multi-decadal oscillations, such as the Atlantic Multidecadal Oscillation (AMO) [46] and the Pacific Decadal Oscillation (PDO) [47]. This may indicate that the circulation systems associated with them are in a dominant state over the Qilian Mountains at that time.
The inconsistent common period characteristics of the eastern, central, and western Qilian Mountains, especially the differences in short-medium time scales, indicate that precipitation in the different areas of the Qilian Mountains is influenced by mid-latitude westerlies and Asian monsoons, and that the relationship between regional precipitation and circulation systems changes with time. Gou et al. (2014) [48] found that the regional principal component time series of some millennium-long dry–wet reconstructions on the northeastern Tibetan Plateau (NETP) showed coherent patterns with solar radiation variations, while the precipitation regimes of the NETP may have a linkage to the decadal variation of PDO. However, the relationship was not stable during the last millennium, indicating that the influence of the Asian monsoon system on the Qilian Mountains region is variable. This aligns with our results and those of Zhang et al. (2009) [49], who note that tree rings in the Qilian Mountains can preserve information regarding the advance and retreat of the westerlies and the East Asian summer monsoon. Our results also reveal a complex interaction between the Asian monsoon system and the westerly system in the Qilian Mountains. In order to better understand the mechanisms and effects of such interactions, more high-resolution, long-term series are still very much needed.

5. Conclusions

We utilized Qilian juniper samples from the north slope of the central Qilian Mountains to establish a 1743-year tree-ring-width chronology. This allowed us to reconstruct annual precipitation changes from August of the previous year to July of the current year since 614 AD. Our findings reveal clear inter-annual and multi-decadal fluctuations in precipitation over the past 1400 years. Notably, the mid-to-late 15th century was the longest and driest period, while both the early 6th century and the recent 50 years were notably wet.
Comparing the dry–wet reconstruction series across the northern slope of the Qilian Mountains revealed good consistency in decadal-scale dry–wet variations in this region. Drought events in particular displayed regional consistency. However, multi-decadal dry–wet fluctuations in the central part of the Qilian mountains demonstrated temporal differences from those in the eastern and western areas. These similarities and differences are strongly driven by interactions between solar activity, the Asian monsoon system and the mid-latitude westerly system. Therefore, it remains important to supplement the precipitation reconstruction series with high-resolution data and sufficient sample sizes in more areas to address the challenges of local variability and complexity.

Supplementary Materials

The following supporting information can be downloaded at: https://www.mdpi.com/article/10.3390/f15040624/s1. Table S1. Calibration and verification statistics of the reconstruction model. Figure S1. Locations of tree-ring based series and other proxy-based dry-wet series. Figure S2. Comparison among our reconstruction presented in this paper (a) and other moisture-related series from the Jiuquan area (b. Zhang et al. 2018 [37]), northern China (c. Zheng et al. 2006 [38]), and Huangye Cave in central China (d. Tan et al. 2010 [39]). Red columns indicate spatially extensive drought periods; green columns indicate spatially extensive pluvial periods.

Author Contributions

Conceptualization, Y.Z. and X.S.; data curation, Y.Z., T.Z. and X.S.; writing—original draft preparation, Y.Z. and T.Z.; writing—review and editing, Y.Z., X.F. and X.S.; supervision, Y.Z., X.F. and X.S.; project administration, Y.Z.; funding acquisition, Y.Z. All authors have read and agreed to the published version of the manuscript.

Funding

This research was funded by the National Key R&D Program of China (No. 2019YFA0606602), the National Natural Science Foundation of China (No. 41977392), and the Basic Science Center for Tibetan Plateau Earth System (BSCTPES, NSFC project No. 41988101).

Institutional Review Board Statement

Not applicable.

Data Availability Statement

The raw data supporting the conclusions of this article will be made available by the authors without undue reservation.

Acknowledgments

We thank Xiaohua Gou for providing LYA data. We are also sincerely grateful to the valuable comments of four reviewers and to Erin Gleeson for her help with polishing the language of this manuscript.

Conflicts of Interest

The authors declare no conflicts of interest.

References

  1. Li, D.; Liu, D. The Climate in Gansu; China Meteorological Press: Beijing, China, 2000. [Google Scholar]
  2. IPCC. Climate Change 2021: The Physical Science Basis. Contribution of Working Group I to the Sixth Assessment Report of the Intergovernmental Panel on Climate Change; Masson-Delmotte, V., Zhai, P., Pirani, A., Connors, S.L., Péan, C., Chen, Y., Goldfarb, L., Gomis, M.I., Matthews, J.B.R., Berger, S., et al., Eds.; IPCC: Cambridge, UK; New York, NY, USA, 2021. [Google Scholar]
  3. Ljungqvist, F.C.; Krusic, P.J.; Sundqvist, H.S.; Zorita, E.; Brattström, G.; Frank, D. Northern Hemisphere Hydroclimate Variability over the Past Twelve Centuries. Nature 2016, 532, 94–98. [Google Scholar] [CrossRef] [PubMed]
  4. Chen, F.; Man, W.; Wang, S.; Esper, J.; Meko, D.; Büntgen, U.; Yuan, Y.; Hadad, M.; Hu, M.; Zhao, X.; et al. Southeast Asian Ecological Dependency on Tibetan Plateau Streamflow over the Last Millennium. Nat. Geosci. 2023, 16, 1151–1158. [Google Scholar] [CrossRef]
  5. Büntgen, U.; Urban, O.; Krusic, P.J.; Rybníček, M.; Kolář, T.; Kyncl, T.; Ač, A.; Koňasová, E.; Čáslavský, J.; Esper, J.; et al. Recent European Drought Extremes beyond Common Era Background Variability. Nat. Geosci. 2021, 14, 190–196. [Google Scholar] [CrossRef]
  6. Routson, C.C.; Woodhouse, C.A.; Overpeck, J.T.; Betancourt, J.L.; McKay, N.P. Teleconnected ocean forcing of Western North American Droughts and Pluvials during the Last Millennium. Quat. Sci. Rev. 2016, 146, 238–250. [Google Scholar] [CrossRef]
  7. Trancoso, R.; Syktus, J.; Allan, R.P.; Croke, J.; Hoegh-Guldberg, O.; Chadwick, R. Significantly Wetter or Drier Future Conditions for One to Two Thirds of the World’s Population. Nat. Commun. 2024, 15, 483. [Google Scholar] [CrossRef] [PubMed]
  8. Wang, Z.; Qi, W.; Bai, L.; Li, Q.; Yan, Y. Reanalysis of Climate Change Characterstics in Qilian Mountain Area. Qinghai Prataculture 2018, 27, 42–48. [Google Scholar]
  9. Zhang, J.; Li, D. Analysis on Distribution Character of Rainfal l over Qilian Mountain and Heihe Valley. Plateau Meteorol. 2004, 23, 81–88. [Google Scholar]
  10. Gou, X.; Deng, Y.; Gao, L.; Chen, F.; Cook, E.; Yang, M.; Zhang, F. Millennium Tree-Ring Reconstruction of Drought Variability in the Eastern Qilian Mountains, Northwest China. Clim. Dynam. 2015, 45, 1761–1770. [Google Scholar] [CrossRef]
  11. Sun, J.; Liu, Y. Drought Variations in the Middle Qilian Mountains, Northeast Tibetan Plateau, over the Last 450 Years as Reconstructed from Tree Rings. Dendrochronologia 2013, 31, 279–285. [Google Scholar] [CrossRef]
  12. Yang, B.; Qin, C.; Bräuning, A.; Burchardt, I.; Liu, J. Rainfall History for the Hexi Corridor in the Arid Northwest China during the Past 620 Years Derived from Tree Rings. Int. J. Climatol. 2011, 31, 1166–1176. [Google Scholar] [CrossRef]
  13. Liang, E.; Shao, X.; Liu, X. Annual Precipitation Variation Inferred from Tree Rings since A.D. 1770 for the Western Qilian Mts., Northern Tibetan Plateau. Tree-Ring Res. 2009, 65, 95–103. [Google Scholar] [CrossRef]
  14. Liu, X.; Shao, X.; Liang, E.; Chen, T.; Qin, D.; An, W.; Xu, G.; Sun, W.; Wang, Y. Climatic Significance of Tree-Ring δ18O in the Qilian Mountains, Northwestern China and Its Relationship to Atmospheric Circulation Patterns. Chem. Geol. 2009, 268, 147–154. [Google Scholar] [CrossRef]
  15. Zhang, Y.; Han, L.; Shao, X.; Yang, Q.; Yin, Z.Y. Moisture Variations during the First Millennium CE and Their Linkage with Social Developments along the Silk Road in Northwestern China. Clim. Chang. 2021, 168, 13. [Google Scholar] [CrossRef]
  16. Zhang, Y.; Tian, Q.; Gou, X.; Chen, F.; Leavitt, S.W.; Wang, Y. Annual Precipitation Reconstruction since AD 775 Based on Tree Rings from the Qilian Mountains, Northwestern China. Int. J. Climatol. 2011, 31, 371–381. [Google Scholar] [CrossRef]
  17. Yang, B.; Wang, J.; Liu, J. A 1556 Year-Long Early Summer Moisture Reconstruction for the Hexi Corridor, Northwestern China. Sci. China Earth Sci. 2019, 62, 953–963. [Google Scholar] [CrossRef]
  18. Yang, B.; Qin, C.; Shi, F.; Sonechkin, D.M. Tree Ring-Based Annual Streamflow Reconstruction for the Heihe River in Arid Northwestern China from AD 575 and Its Implications for Water Resource Management. Holocene 2012, 22, 773–784. [Google Scholar] [CrossRef]
  19. Sun, J.; Liu, Y. Tree Ring Based Precipitation Reconstruction in the South Slope of the Middle Qilian Mountains Northeastern Tibetan Plateau, over the Last Millennium. J. Geophys. Res 2012, 117, D08108. [Google Scholar] [CrossRef]
  20. Qie, J.; Tian, Q.; Zhang, Y. Moisture Changes over the Past 467 Years in the Central Hexi Corridor, Northwestern China. Dendrochronologia 2020, 63, 125725. [Google Scholar] [CrossRef]
  21. Fritts, H.C. Tree Rings and Climate; Academic Press: London, UK; New York, NY, USA; San Francisco, CA, USA, 1976. [Google Scholar]
  22. Stokes, M.A.; Smiley, T.L. An Introduction to Tree Ring Dating; The University of Arizona Press: Tucson, AZ, USA, 1996. [Google Scholar]
  23. Holmes, R.L. Computer-Assisted Quality Control in Tree-Ring Dating and Measurement. Tree-Ring Bull. 1983, 43, 69–95. [Google Scholar]
  24. Cook, E.R.; Holmes, R.L. Guide for computer program Arstan. In Tree-Ring Chronologies of Western North America: California, Eastern Oregon and Northern Great Basin; Holmes, R.L., Adams, R.K., Fritts, H.C., Eds.; University of Arizona Press: Tucson, AZ, USA, 1986; pp. 50–65. [Google Scholar]
  25. Melvin, T.M.; Briffa, K.R. A “Signal-Free” Approach to Dendroclimatic Standardisation. Dendrochronologia 2008, 26, 71–86. [Google Scholar] [CrossRef]
  26. Cook, E.R.; Peters, K. Calculating Unbiased Tree-Ring Indices for the Study of Climatic and Environmental Change. Holocene 1997, 7, 361–370. [Google Scholar] [CrossRef]
  27. Cook, E.R.; Kairiukstis, L.A. Methods of Dendrochronology: Applications in the Environmental Sciences; Kluwer Academic Publishers: Dorefrecht, The Netherlands, 1990. [Google Scholar]
  28. Fritts, H.C.; Blasing, T.J.; Hayden, B.P.; Kutzbach, J.E. Multivariate Techniques for Specifying Tree-Growth and Climate Relationships and for Reconstructing Anomalies in Paleoclimate. J. Appl. Meteorol. 1971, 10, 845–864. [Google Scholar] [CrossRef]
  29. Biondi, F.; Waikul, K. Dendroclim2002: A C++ Program for Statistical Calibration of Climate Signals in Tree-Ring Chronologies. Comput. Geosci. 2004, 30, 303–311. [Google Scholar] [CrossRef]
  30. Meko, D.; Graybill, D.A. Tree-Ring Reconstruction of Upper Gila River Discharge. Water Resour. Bull. 1995, 31, 605–616. [Google Scholar] [CrossRef]
  31. Grinsted, A.; Moore, J.C.; Jevrejeva, S. Application of the cross Wavelet Transform and Wavelet Coherence to Geophysical Time Series. Nonlinear Process. Geophys. 2004, 11, 561–566. [Google Scholar] [CrossRef]
  32. Cook, E.R.; Meko, D.M.; Stahle, D.W.; Cleaveland, M.K. Drought Reconstructions for the Continental United States. J. Clim. 1999, 12, 1145–1162. [Google Scholar] [CrossRef]
  33. Shao, X.; Huang, L.; Liu, H.; Liang, E.; Fang, X.; Wang, L. Reconstruction of Precipitation Variation from Tree Rings in Recent 1000 Years in Delingha, Qinghai. Sci. China Earth Sci. 2005, 48, 939–949. [Google Scholar] [CrossRef]
  34. Zhang, Q.-B.; Cheng, G.; Yao, T.; Kang, X.; Huang, J. A 2,326-Year Tree-Ring Record of Climate Variability on the Northeastern Qinghai-Tibetan Plateau. Geophys. Res. Lett. 2003, 30, 1739. [Google Scholar] [CrossRef]
  35. Yang, B.; Qin, C.; Wang, J.; He, M.; Melvin, T.M.; Osborn, T.J.; Briffa, K.R. A 3,500-Year Tree-Ring Record of Annual Precipitation on the Northeastern Tibetan Plateau. Proc. Natl. Acad. Sci. USA 2014, 111, 2903–2908. [Google Scholar] [CrossRef]
  36. Wang, H.; Shao, X.; Li, M. A 2917-Year Tree-Ring-Based Reconstruction of Precipitation for the Buerhanbuda Mts., Southeastern Qaidam Basin, China. Dendrochronologia 2019, 55, 80–92. [Google Scholar] [CrossRef]
  37. Zhang, J.; Huang, X.; Wang, Z.; Yan, T.; Zhang, E.Y. A late-Holocene Pollen Record from the Western Qilian Mountains and Its Implications for Climate Change and Human Activity along the Silk Road, Northwestern China. Holocene 2018, 28, 1141–1150. [Google Scholar] [CrossRef]
  38. Zheng, J.; Wang, W.-C.; Ge, Q.; Man, Z.; Zhang, P. Precipitation Variability and Extreme Events in Eastern China during the Past 1500 Years. Terr. Atmos. Ocean. Sci. 2006, 17, 579–592. [Google Scholar] [CrossRef] [PubMed]
  39. Tan, L.; Cai, Y.; An, Z.; Edwards, R.L.; Cheng, H.; Shen, C.-C.; Zhang, H. Centennial- to Decadal-Scale Monsoon Precipitation Variability in the Semi-Humid Region, Northern China during the Last 1860 Years: Records from Stalagmites in Huangye Cave. Holocene 2010, 21, 287–296. [Google Scholar]
  40. Sun, Y.; Bekker, M.F.; DeRose, R.J.; Kjelgren, R.; Wang, S.-Y.S. Statistical Treatment for the Wet Bias in Tree-Ring Chronologies: A Case Study from the Interior West, USA. Environ. Ecol. Stat. 2017, 24, 131–150. [Google Scholar] [CrossRef]
  41. Fang, K.Y.; Gou, X.H.; Peters, K.; Li, J.B.; Zhang, F. Removing Biological Trends from Tree-Ring Series: Testing Modified Hugershoff Curves. Tree-Ring Res. 2010, 66, 51–59. [Google Scholar] [CrossRef]
  42. Briffa, K.R.; Melvin, T.M. A Closer Look at Regional Curve Standardization of Tree-Ring Records: Justification of the Need, a Warning of Some Pitfalls, and Suggested Improvements in Its Application. In Dendroclimatology: Progress and Prospects; Springer: Dordrecht, The Netherlands, 2011. [Google Scholar]
  43. Cook, E.R.; Briffa, K.R.; Meko, D.M.; Graybill, D.A.; Funkhouser, G. The Segment Length Curse in Long Tree-Ring Chronology Development for Paleoclimatic Studies. Holocene 1995, 5, 229–237. [Google Scholar] [CrossRef]
  44. Breitenmoser, P.; Beer, J.; Brönnimann, S.; Frank, D.; Steinhilber, F.; Wanner, H. Solar and Volcanic Fingerprints In Tree-Ring Chronologies over the Past 2000 Years. Palaeogeogr. Palaeoclimatol. Palaeoecol. 2012, 313–314, 127–139. [Google Scholar] [CrossRef]
  45. Wagner, G.; Beer, J.; Masarik, J.; Muscheler, R.; Kubik, P.W.; Mende, W.; Laj, C.; Raisbeck, G.M.; Yiou, F. Presence of the Solar de Vries Cycle (Similar to 205 Years) during the Last Ice Age. Geophys. Res. Lett. 2001, 28, 303–306. [Google Scholar] [CrossRef]
  46. Gray, S.T.; Graumlich, L.J.; Betancourt, J.L.; Pederson, G.T. A Tree-Ring Based Reconstruction of the Atlantic Multidecadal Oscillation since 1567 AD. Geophys. Res. Lett. 2004, 31, L12205. [Google Scholar] [CrossRef]
  47. MacDonald, G.M.; Case, R.A. Variations in the Pacific Decadal Oscillation over the Past Millennium. Geophys. Res. Lett. 2005, 32, L08703. [Google Scholar] [CrossRef]
  48. Gou, X.; Deng, Y.; Chen, F.; Yang, M.; Gao, L.; Nesje, A.; Fang, K. Precipitation Variations and Possible Forcing Factors on the Northeastern Tibetan Plateau during the Last Millennium. Quatern. Res. 2014, 81, 508–512. [Google Scholar] [CrossRef]
  49. Zhang, Y.; Gou, X.; Chen, F.; Tian, Q.; Yang, M.; Peng, J.; Fang, K. A 1232-Year Tree-Ring Record of Climate Variability in the Qilian Mountains, Northwestern China. IAWA J. 2009, 30, 407–420. [Google Scholar] [CrossRef]
Figure 1. Location of tree ring sites and meteorological stations in this study. (GT: this study; HYG: reconstructed precipitation series in the central part of the Qilian Mountains over the past 1232 years [16]; LYA: reconstructed 1002-year Standardized Precipitation Evapotranspiration index (SPEI) for the eastern part of the Qilian Mountains [10]; YQ and QF: two millennium-long reconstructions of the self-calibrated Palmer Drought Severity Index (sc-PDSI) in the western part of the Qilian Mountains [15,17]).
Forests 15 00624 g001
Figure 2. Monthly mean temperatures and precipitation at the Sunan station.
Forests 15 00624 g002
Figure 3. (a) Ring-width chronology (GT) with a 31-year running mean (red line) and changing sample size over time (dark line); (b) cumulative sample numbers at different time points (horizontal grey bars); (c) EPS and Rbar values, with the statistics of GT chronology. The dashed vertical line denotes the year 614 AD, when the EPS value exceeds the 0.85 threshold.
Forests 15 00624 g003
Figure 4. The correlation (a) and response function (b) and the moving 31-year correlation (c) coefficients of the tree-ring index with instrumental data from Sunan station from 1958 to 2016. “P” refers to the previous year and “C” refers to the current year. The years indicate the last years of 31-year time windows; for instance, 1988 means 1858–1988. The filled bars and red grids represent a significance level of p < 0.01.
Forests 15 00624 g004
Figure 5. (a) Scatter plot of the tree-ring index and precipitation. (b) Comparison of actual (black line) and reconstructed (red line) precipitation from prior August to current July.
Forests 15 00624 g005
Figure 6. (a) Annual precipitation reconstruction (green line) during the period of 614–2016 AD and its 30 years running smoothing line (blue line), The thin gray line represents the 95% confidence interval; (b) wavelet power spectrum of the reconstructed series; and (c) global wavelet spectrum. The thick black contours indicate significant modes of variance with a 95% significance level.
Forests 15 00624 g006
Figure 7. Comparison between our reconstructed precipitation series and other series. (a) Our reconstructed precipitation series. (b) Reconstructed precipitation series in the central part of the Qilian Mountains over the past 1232 years (annual precipitation from previous August to current July) [16]. (c) Reconstructed 1002-year SPEI index for the eastern part of the Qilian Mountains (June–July with a 5-month scale) [10]. Two millennium-long reconstructions of the sc-PDSI in the western part of the Qilian Mountains (May–June) ((d) YQ, [15]; (e) QF, [17]). Light yellow columns indicate spatially extensive drought periods; light green columns indicate spatially extensive pluvial periods.
Forests 15 00624 g007
Figure 8. Cross-wavelet transforms of the GT series with the LYA (a) and YQ (b) series in the common period (1009–2010 AD). The 5% significance level against red noise is shown as a thick contour. The relative phase relationship is shown as arrows (with in-phase pointing right, anti-phase pointing left).
Forests 15 00624 g008
Table 1. Tree-ring site and nearby meteorological stations.
SitesNameLongitudeLatitudeElevation (m)Time IntervalDistance to GT (km)
Meteorological stationsGaotai99.8339.3613331953–201872
Jiuquan98.4839.7714781951–201894
Sunan99.6238.8323131957–201851
Tuole98.4238.833681957–201866
Tree-ring siteGT99.0839.073364–3574274–2016-
Table 2. Basic information about the GT chronology.
StatisticsGT
Segment length (mean/max)366/1428
Mean sensitivity 0.356
First-order autocorrelation 0.319
Average correlation among series 0.367
Average correlation among trees0.860
Average correlation among series in a tree 0.357
Signal-to-noise ratio25.47
Expressed population signal (EPS)0.962
Explained variance of the first principal component39.6%
Common period1800–2010
Length of main series274–2016
EPS > 0.85614–2016
Table 3. Calibration and verification statistics of the reconstruction model.
Calibration Period Verification Period
Time SpanrR2FTime SpanrR2STFSTPMTRECE
1958–20160.590.34530.01958–20160.5645+/14− **42+/16− **2.760.300.30
1958–19880.590.34415.381989–20160.570.3321+/7− *21+/6− **2.550.340.26
989–20160.570.3312.81958–19880.590.3422+/9− *21+/9− *2.640.370.32
r: correlation coefficient. F: significance test indicators for regression equations. ST: sign test. FST: first-order sign test. RE: error reduction. CE: effective coefficient. PMT: product mean test. ** p < 0.01, * p < 0.05.
Disclaimer/Publisher’s Note: The statements, opinions and data contained in all publications are solely those of the individual author(s) and contributor(s) and not of MDPI and/or the editor(s). MDPI and/or the editor(s) disclaim responsibility for any injury to people or property resulting from any ideas, methods, instructions or products referred to in the content.

