Article

Two Centuries of Winter Temperature Variability Inferred from Betula ermanii Ring Widths near the Forests/Tundra Ecotone in the Changbai Mountain, China

1
College of Forestry, Northeast Forestry University, Harbin 150040, China
2
Experimental Teaching Center, Shenyang Normal University, Shenyang 110034, China
*
Author to whom correspondence should be addressed.
Forests 2024, 15(1), 220; https://doi.org/10.3390/f15010220
Submission received: 25 December 2023 / Revised: 17 January 2024 / Accepted: 18 January 2024 / Published: 22 January 2024

Abstract

:
In this study, we constructed a ring-width chronology derived from Betula ermanii (BE) near the transitional zone between forests and tundra within the Changbai Mountain (CBM) region. This chronology was established utilizing 55 cores obtained from 30 trees. Our analysis of growth/climate responses underscores the pivotal role of the mean maximum winter temperature in influencing radial growth. Drawing upon these growth/climate associations, we reconstructed the mean maximum temperature series for December of the preceding year through January of the current year for the years 1787 and 2005 CE, employing a standardized chronology. During the calibration period (1960–2005), the reconstructed series exhibited an explained variance of 36%. This reconstruction provides crucial insights into historical temperature fluctuations within the study area. Our findings indicate that year-to-year temperature variations did not manifest synchronously along the altitude gradient of Changbai Mountain. Notably, the response to recent winter warming exhibited disparities with the altitude on Changbai Mountain. Specifically, the higher altitude range (1950–2000 m a.s.l.) displayed a response to warming around 1960, the mid-altitude range (765–1188 m a.s.l.) responded around 1975, and the lowest altitude (650 m a.s.l.) responded by 1977. Consequently, the paleotemperature research outcomes from Changbai Mountain alone may not adequately characterize climate change in this region. We recommend future high-resolution temperature records be obtained through sampling at various altitudes to enhance the comprehensiveness of our understanding.

1. Introduction

Global warming is exerting a substantial influence on high-altitude mountain ecosystems within the mid-high latitudes of the Northern Hemisphere [1]. This phenomenon has precipitated noteworthy alterations in species distribution [2,3,4,5], abundance [6,7,8,9], and biomass [10], with particular emphasis on the transformations occurring at the tree line in this geographical expanse [11,12,13]. Notably, the alpine transition zone bridging the realms of forest and tundra stands out as one of the most susceptible regions for monitoring environmental shifts [11,12].
The Changbai Mountain (CBM) National Nature Reserve (127°90′–128°55′ E, 41°31′–42°28′ N) is situated in the central region of temperate forests in northeastern China and stands out as one of the most environmentally sensitive areas within the Chinese forest ecosystem, particularly in response to climate change [9,14]. Dating back to the establishment of the Qing Dynasty in AD 1636, a mountain closure policy was enforced in CBM, considering it the ancestral birthplace of the Dynasty. In the 1980s, CBM attained the status of a nature reserve, solidifying its position as one of the most rigorously protected regions for forest vegetation in China. The Betula ermanii (BE) forest, positioned at elevations between 1700 and 2000 m above sea level (a.s.l.), marks the tree-line, serves as a transitional zone linking forested areas with alpine tundra [15]. Despite lacking significant economic value, BE trees play a crucial role in mitigating the impact of harsh winter winds on the CBM ecosystem. Previous investigations have underscored shifts in the alpine climate of CBM attributed to the global rise in temperatures, with the most pronounced temperature increase occurring during winter months [16]. Jia et al. reported an ascending trend in the annual average temperature of Changbai Mountain, revealing an increase at a rate of 0.39 °C per decade in recent years, with winter experiencing the most accelerated warming at a rate of 0.57 °C per decade [17]. This winter warming trend is correlated with a reduction in snowpack at higher elevations [18]. To discern the uniqueness of this climate warming and forecast potential repercussions on the region’s trees in the face of future temperature changes, it becomes imperative to gain a detailed understanding of temperature variations and trends spanning the past few centuries. This necessity arises from the fact that the majority of archived meteorological records only extend to 1949, and the absence of more extended historical records has impeded a comprehensive study and comprehension of the processes and mechanisms governing past climatic changes in the CBM tree-line region.
The capacity of tree ring widths to accurately document climatic conditions is well-established, particularly in environments constrained by temperature factors [19]. Leveraging their annual resolution and precise dating, tree-ring samples from locales where the temperature serves as the primary growth-limiting factor have been widely employed to reconstruct historical temperature variability globally [20,21,22,23,24,25,26,27,28,29,30,31]. These tree ring records have proven instrumental in advancing our comprehension of temperature fluctuations, spanning from local to hemispheric scales.
This study reconstructed prior December (T12) to current January (T1) maximum temperatures (1787–2005). The primary goals of this study are two-fold: (1) to reconstruct and scrutinize temperature variability in the tree-line area of the Changbai Mountain region and (2) to investigate potential connections between the reconstructed temperature series and large-scale climate changes.

2. Materials and Methods

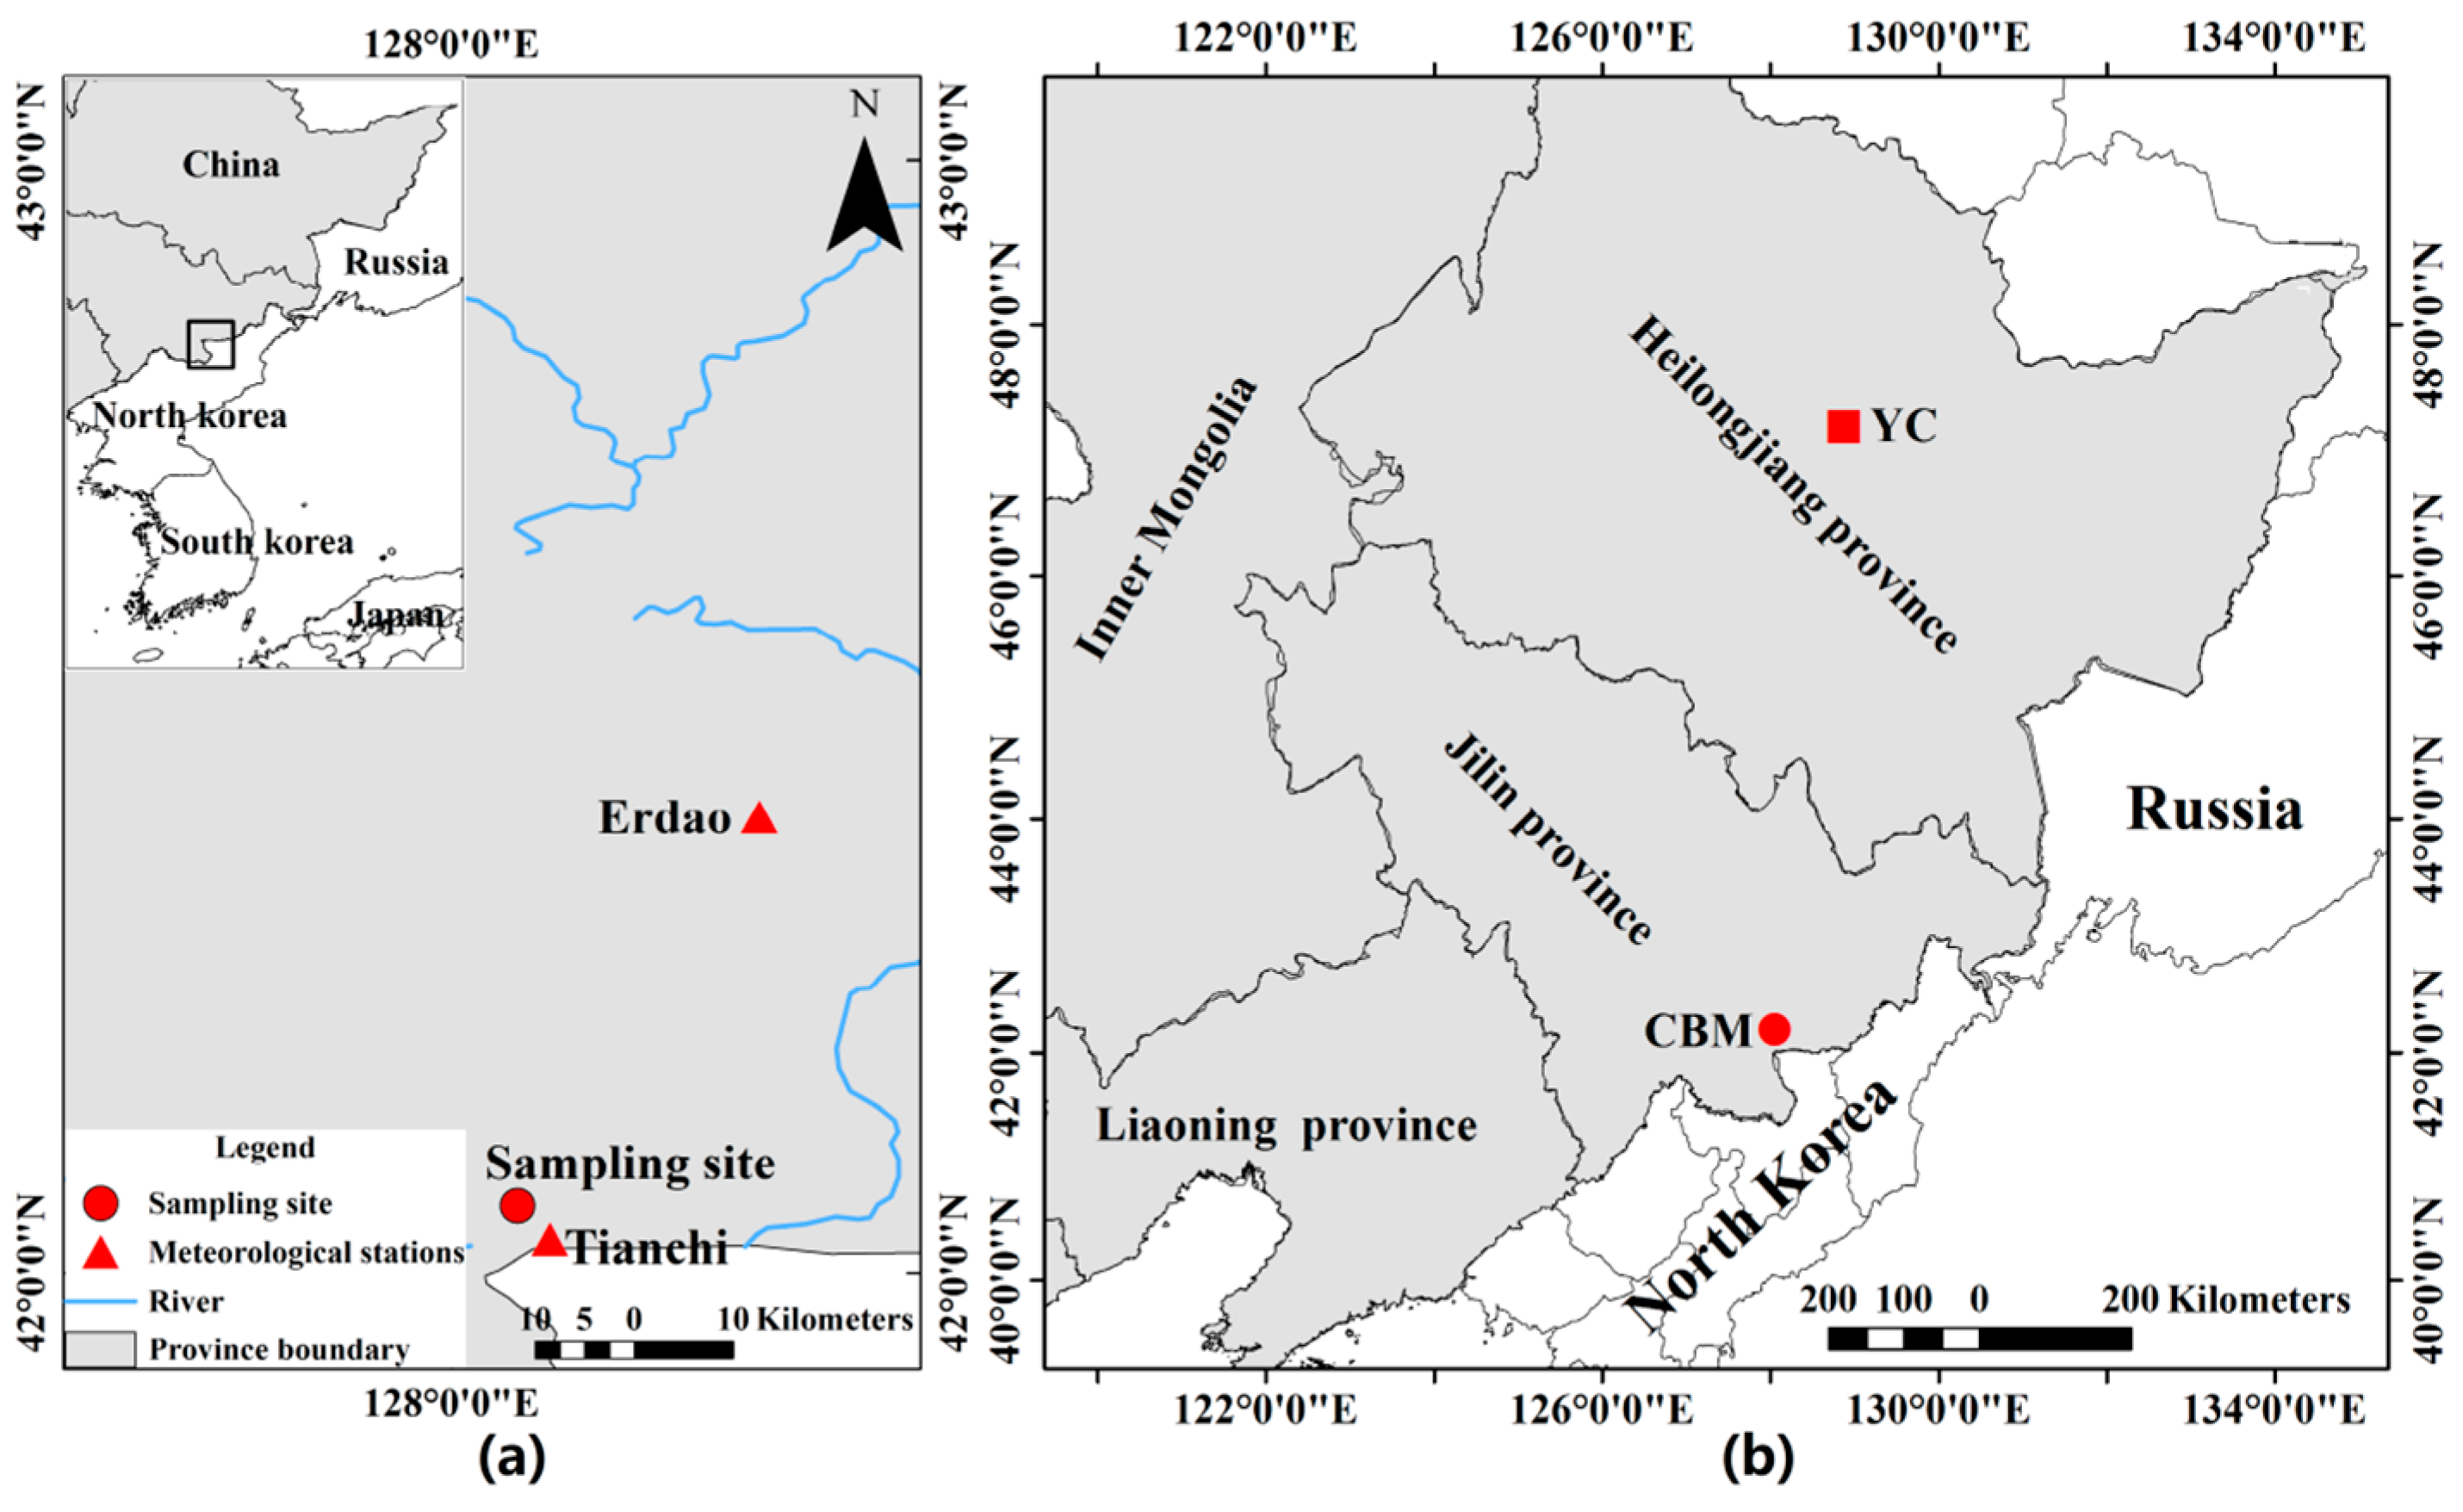
2.1. Study Area and Sample Collection

The study area is situated within the Changbai Mountain Nature Reserve in northeastern China (Figure 1). The local climate is influenced by the temperate continental monsoon, characterized by warm and humid conditions in summer and cold, windy weather in winter [32]. Monthly average temperatures fluctuate annually, ranging from −7 °C in January to 3 °C in July, with annual precipitation spanning from 700 mm to 1400 mm (Figure 2). Nearly 90% of the annual precipitation is concentrated between April and September during the period from 1960 to 2005.
To mitigate the influence of non-climatic factors on tree radial growth, sampling focused on undisturbed natural forests unaffected by fire or human intervention. Selection criteria included choosing the healthiest trees, from which one (when a tree was partially rotten, only one core was taken) or two increment cores in south and north were extracted at approximately 1.3 m above ground level. In October 2005, a total of 55 cores (5.15 mm diameter) were collected from 30 BE trees in the study area, situated between 1950–2000 m a.s.l. at coordinates 42°12′ N and 128°03′ E (Figure 1). The slope of the sampled area ranged from 0 to 15 degrees.

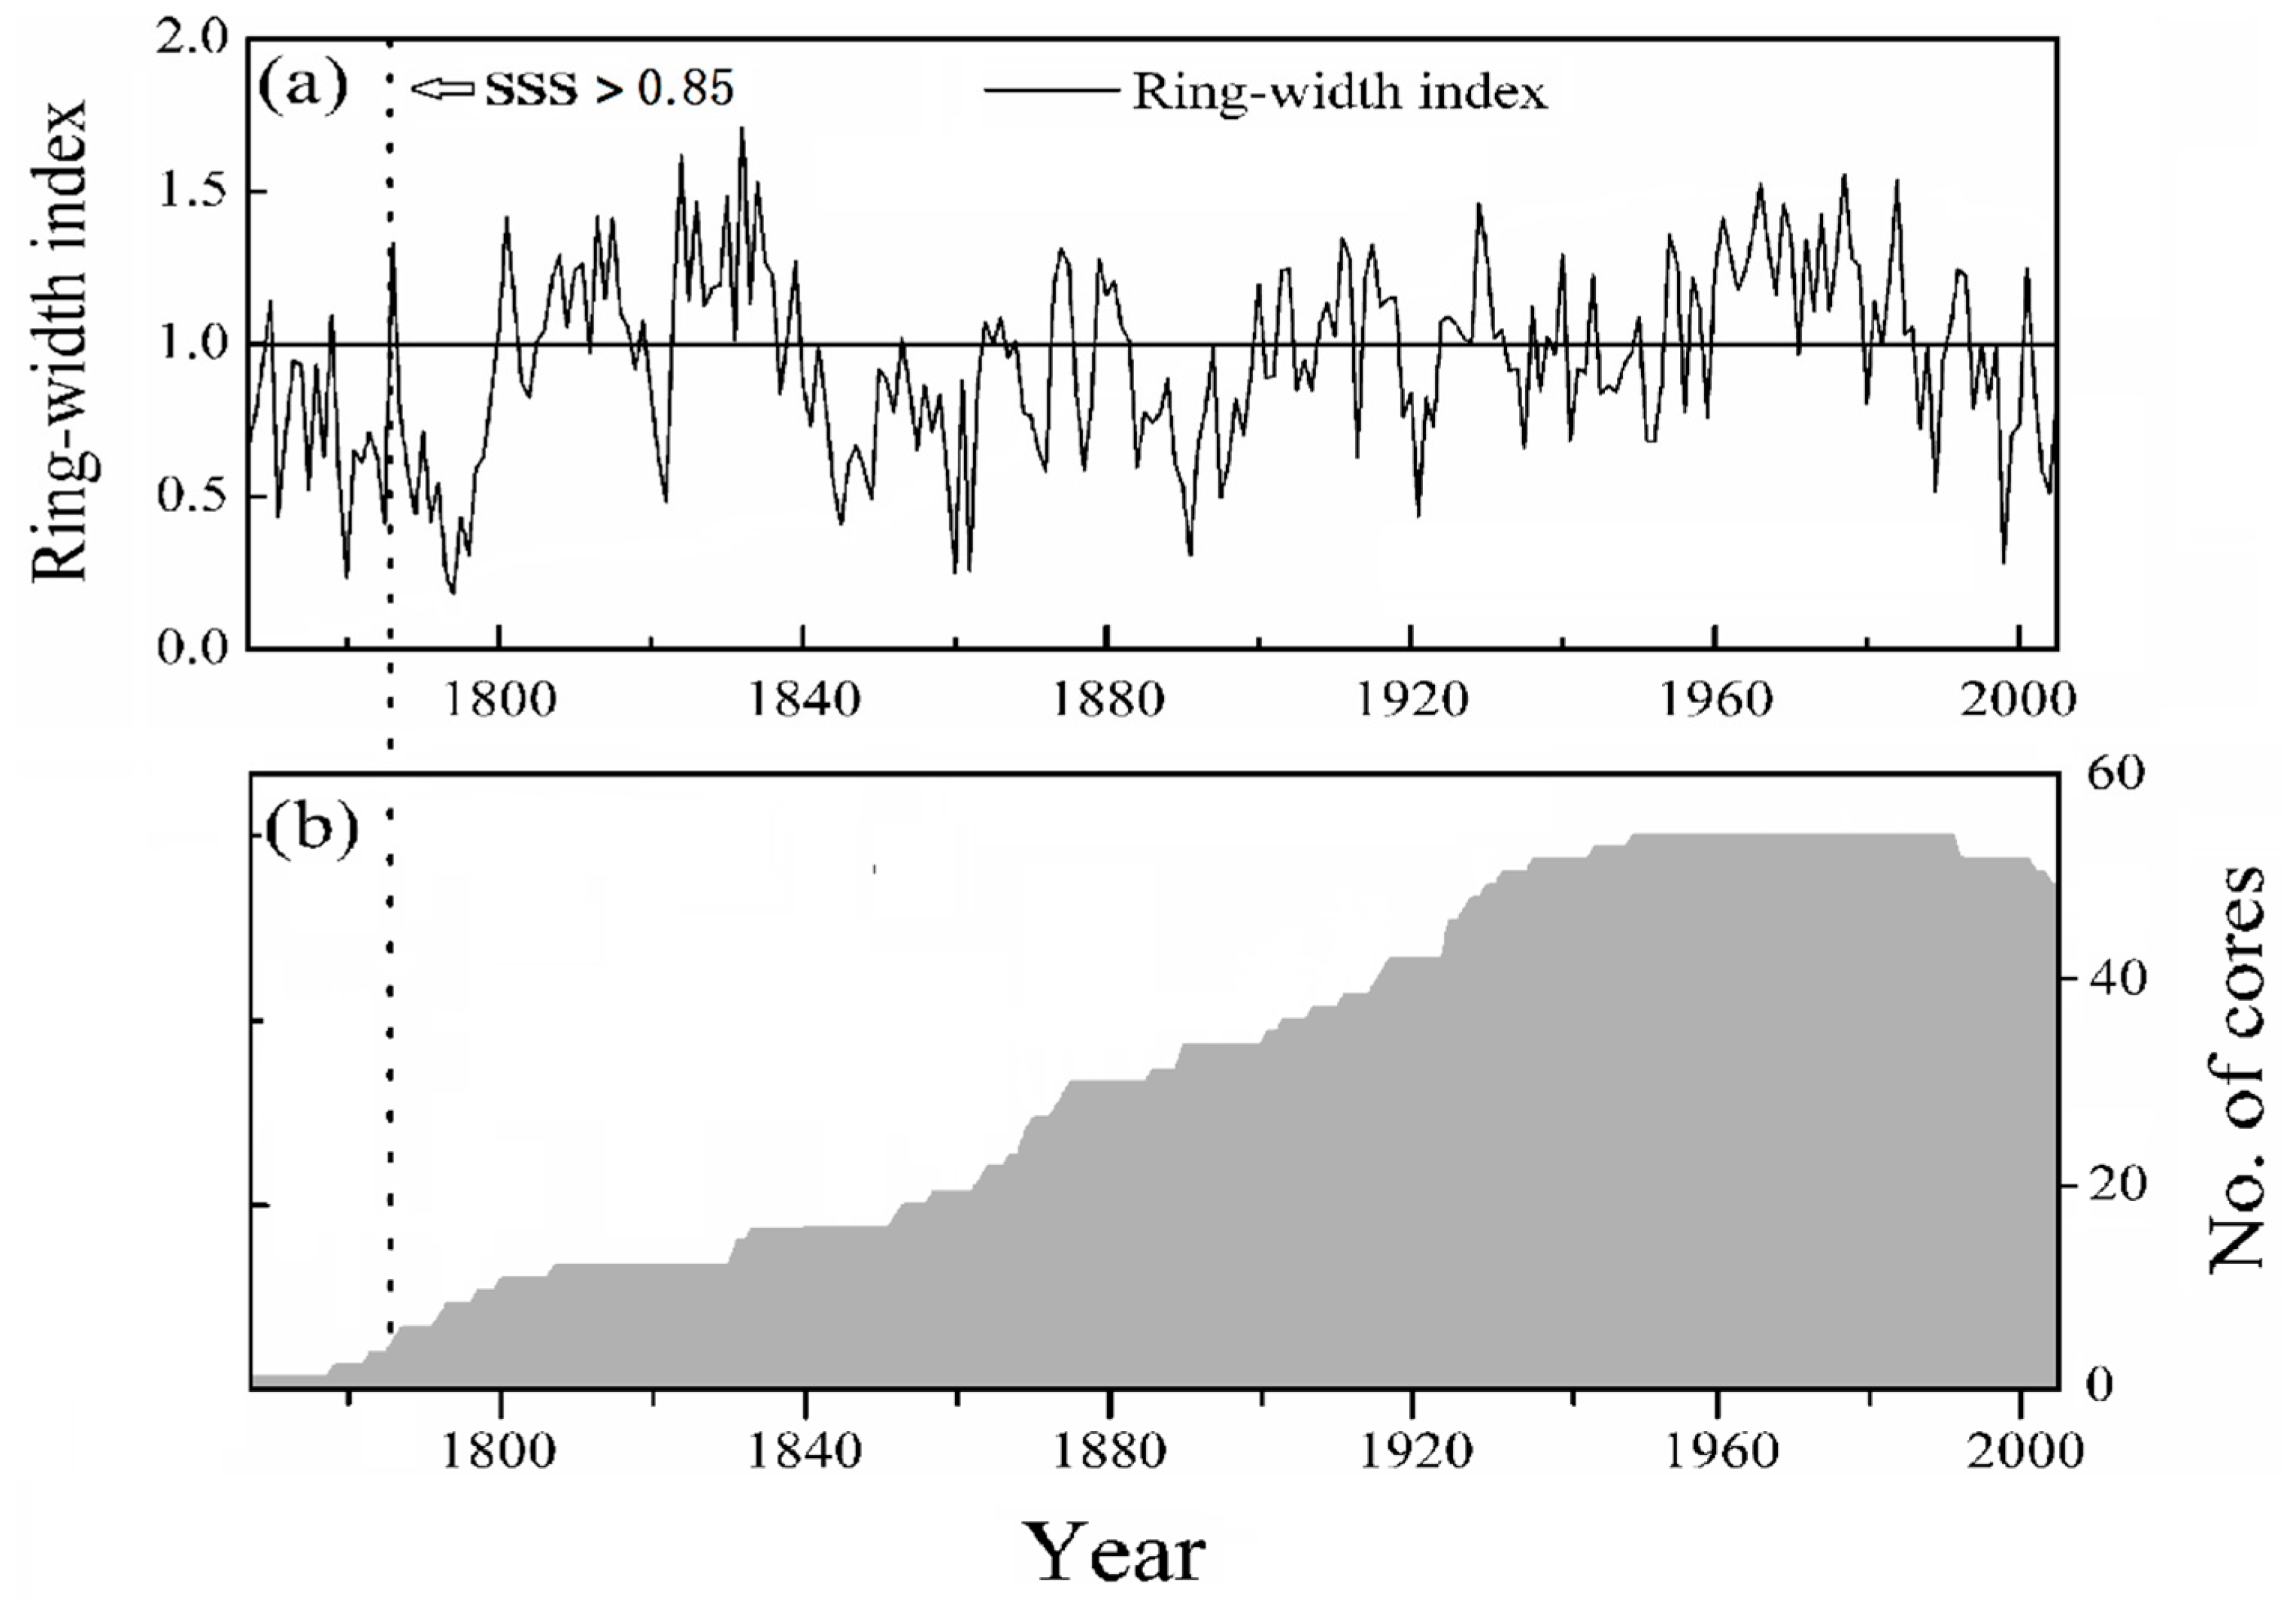
2.2. Development of Ring-Width Chronologies
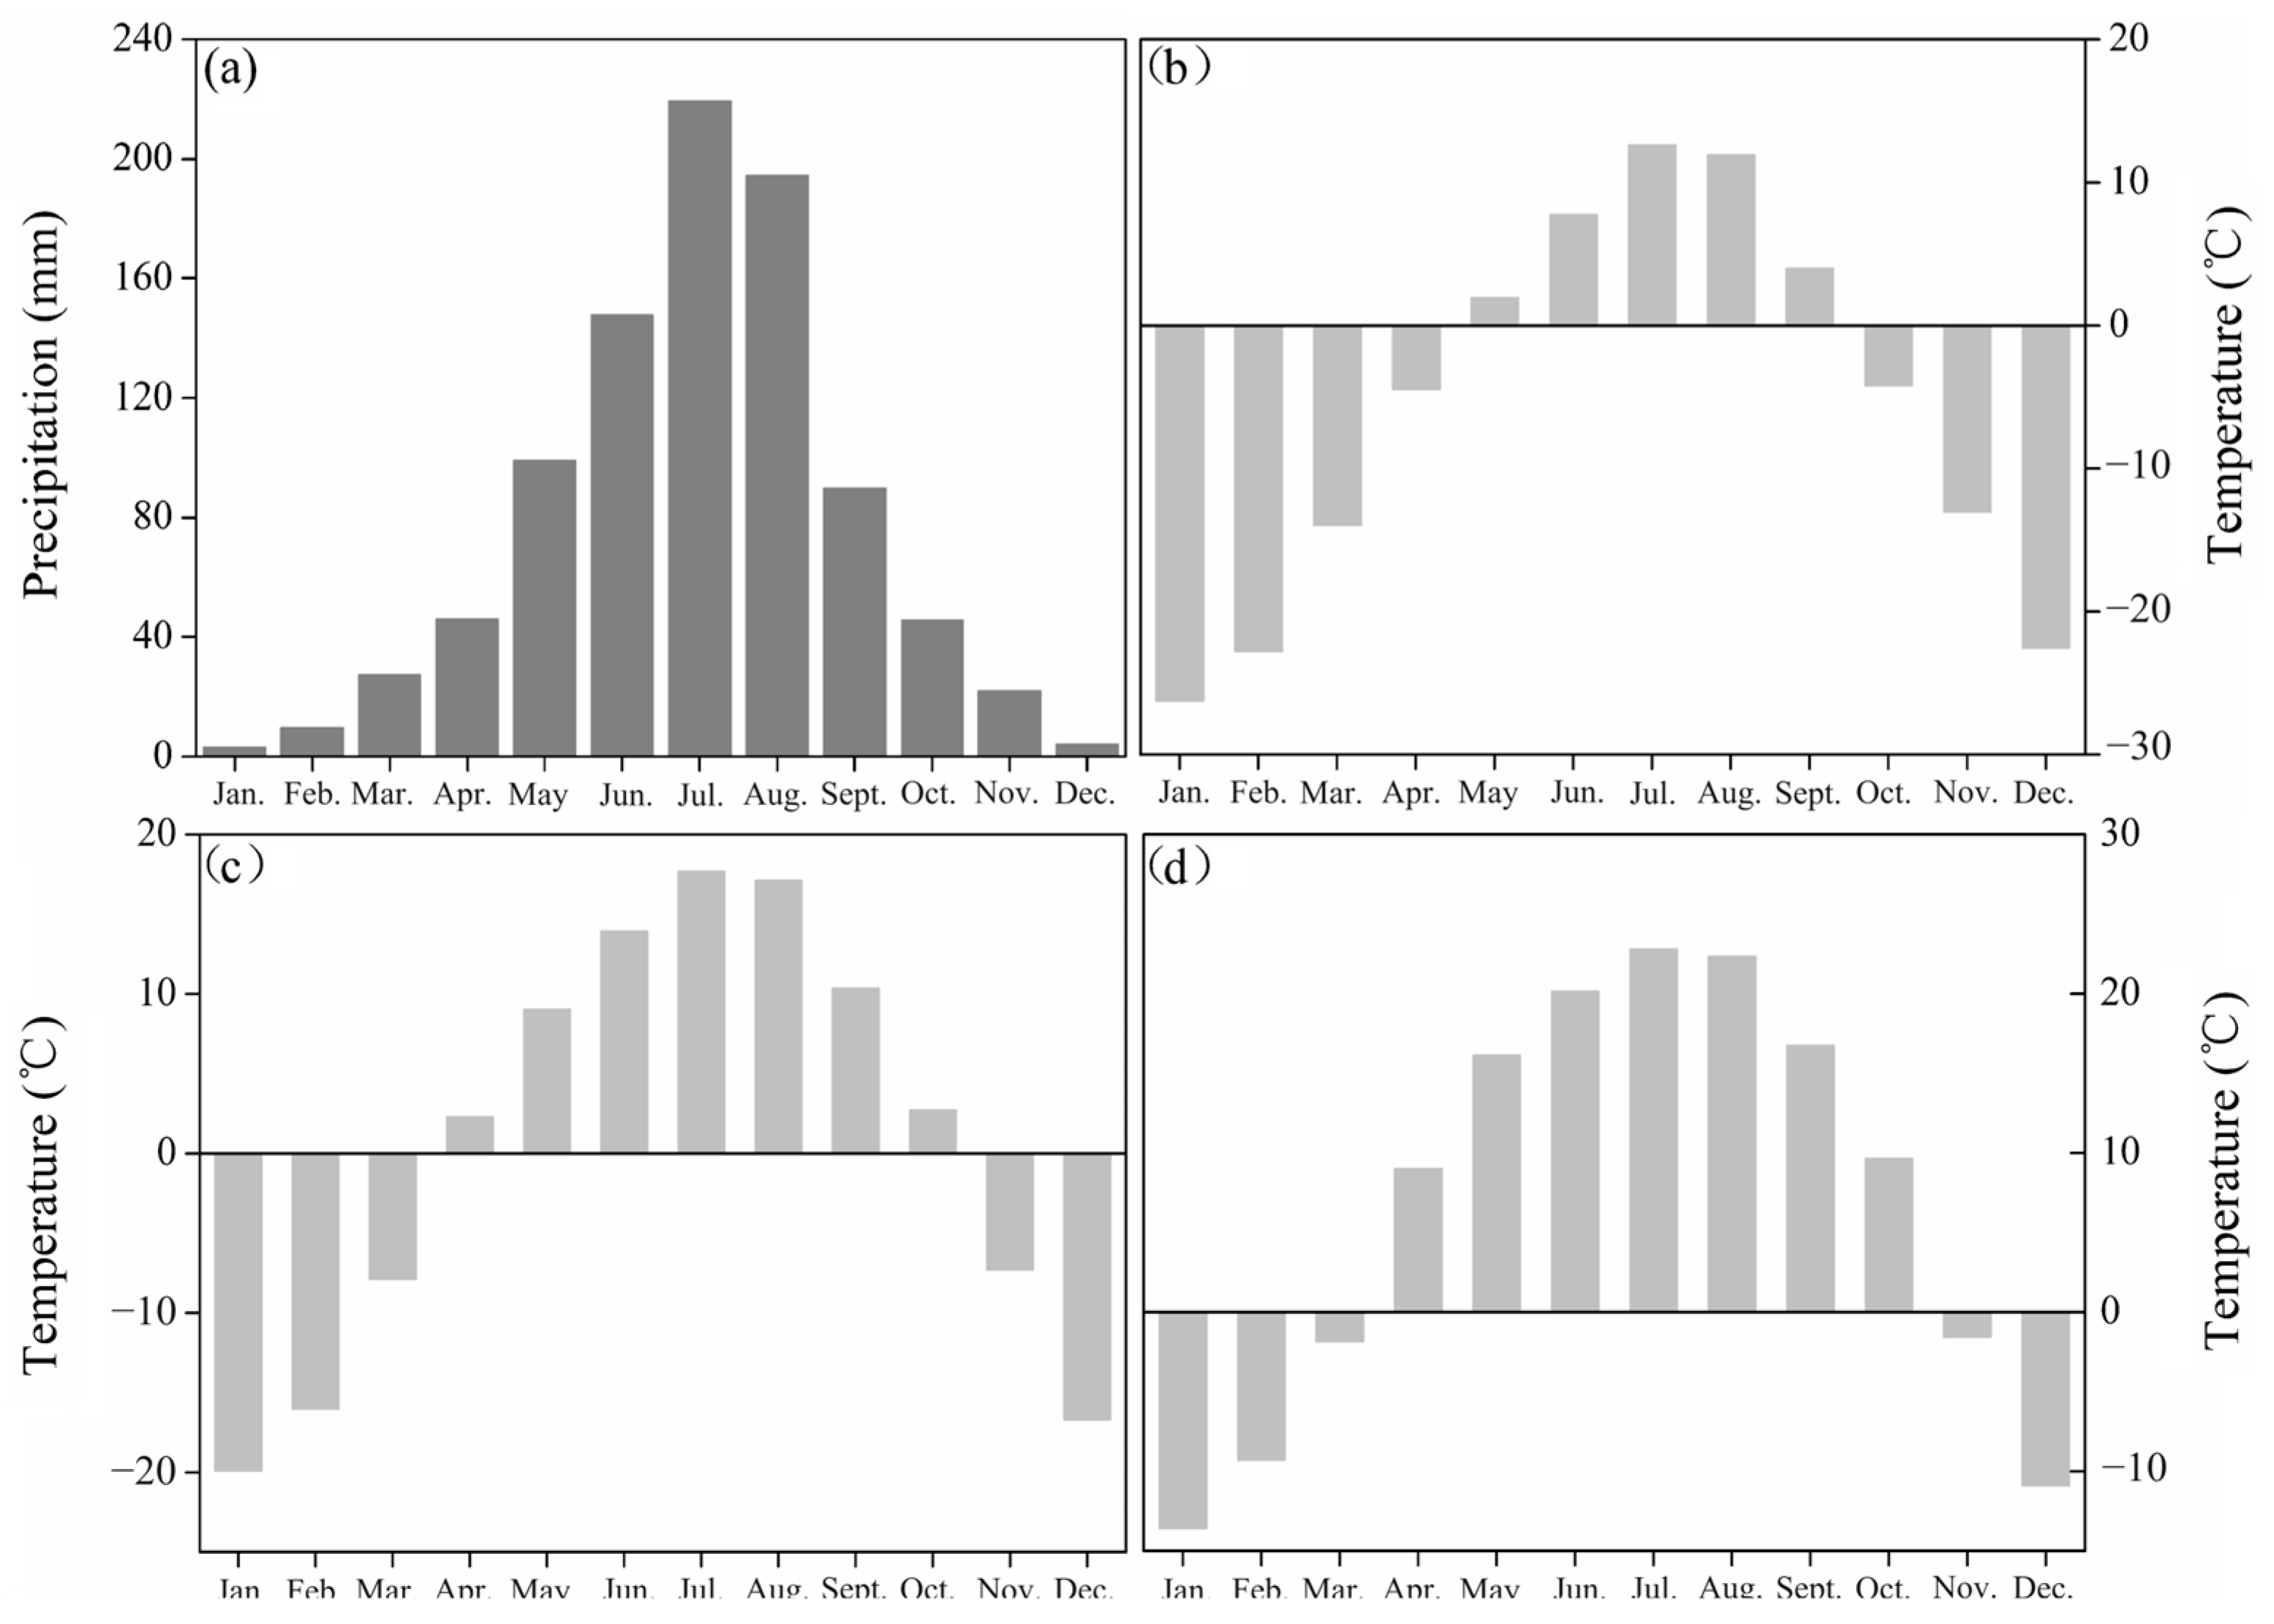
In the laboratory, cores underwent a series of procedures including air-drying, mounting, surfacing, and cross-dating using established dendrochronological methods [19,34,35]. Subsequent to these processes, each ring width was meticulously measured with a Velmex measuring system, achieving a resolution precision of 0.001 mm. The COFECHA software (version 6.06P) was employed to evaluate the quality of cross-dating and measurements [34]. Given the predominant presence of BE in the study area and the negligible impact of competitive factors on the sampled trees, a negative exponential curve was applied to standardize the raw tree-ring data [35]. The resulting individual standardized index series were then amalgamated into a unified site chronology using the bi-weight robust mean method [35]. After all these processes, three kinds of chronologies were obtained: autoregressive (ARS) chronology, residual (RES), and standard (STD) chronology. The STD chronology with an EXP detrending was the best chronology because it contained more low frequency signals. For the subsequent analysis, the Standard (STD) chronology was selected (Figure 3a). To ensure the reliability of the chronology, analyses were confined to the period with a sub-sample signal strength (SSS) exceeding 0.85. This criterion was crucial for preserving the chronology’s maximum length while maintaining a representative sample depth [36]. The chosen threshold corresponds to a sample size of seven cores, enabling the reconstruction of the period spanning from 1787 to 2005 (Figure 3). The statistical characteristics of the STD chronology are detailed in Table 1.

2.3. Climate Data

Climate data were sourced from meteorological stations situated at Erdao (42°24′ N, 128°16′ E, 591 m a.s.l.) and Tianchi (42°10′ N, 128°50′ E, 2623 m a.s.l.) within the CBM region (Figure 1a). Four key climate parameters were selected for dendroclimatological analyses: monthly mean minimum temperature (Tmin), monthly mean temperature (Tm), monthly mean maximum temperature (Tmax), and monthly total precipitation (Prec) (Figure 2). To assess the presence of a drought signal in the CBM, the Palmer Drought Severity Index (PDSI) was compared with the ring-width series. Data for the period 1960–2005 were procured using a self-calibrated PDSI (scPDSI) grid box from the 0.5° × 0.5° climatic research unit (CRU).

2.4. Statistical Analyses

The stationarity or non-stationarity of the data was assessed using the Unit Root Tests-augmented Dickey–Fuller test (ADF) and Kwiatkowski–Phillips–Schmidt–Shin (KPSS) test [37]. The climate time series and tree ring sequences demonstrated stationarity, as confirmed by the results of the Kwiatkowski–Phillips–Schmidt–Shin (KPSS) test (p = 0.1) and augmented Dickey–Fuller test (p = 0.01). A unit root test was performed using the t series package within the R environment. Following the establishment of stationarity, growth/climate relationships were examined using response functions and correlation analysis to identify potential models for climatic reconstruction [38]. To assess the stability of correlation coefficients, a moving correlation analysis was conducted. Subsequently, a linear regression equation between the tree-ring index chronology and climate data was computed for the calibration period spanning 1960–2005. Model evaluation was performed using the split-sample method [39], involving the calculation of various statistics such as Pearson’s correlation coefficient (r), explained variance (r2), sign test (ST), coefficient of efficiency (CE), reduction of error (RE), product means test (PMT), root mean squared error (RMSE) and Durbin–Watson test (DW). To explore potential mechanisms influencing climate variability in the region, the Multi-Taper Method (MTM) spectral analysis was employed to examine the frequency domain in the tree-ring series. The software and operation utilized for this analysis can be accessed at http://www.ldeo.columbia.edu/res/fac/trl/ (accessed on 13 October 2020) [40]. Additionally, spatial correlations between the reconstructed temperature patterns from December–January in the present study and the December–January averaged HadlSST11° SST from KNMI during the period from 1870–2005 were estimated (http://climexp.knmi.nl (accessed on 4 March 2021)).

3. Results

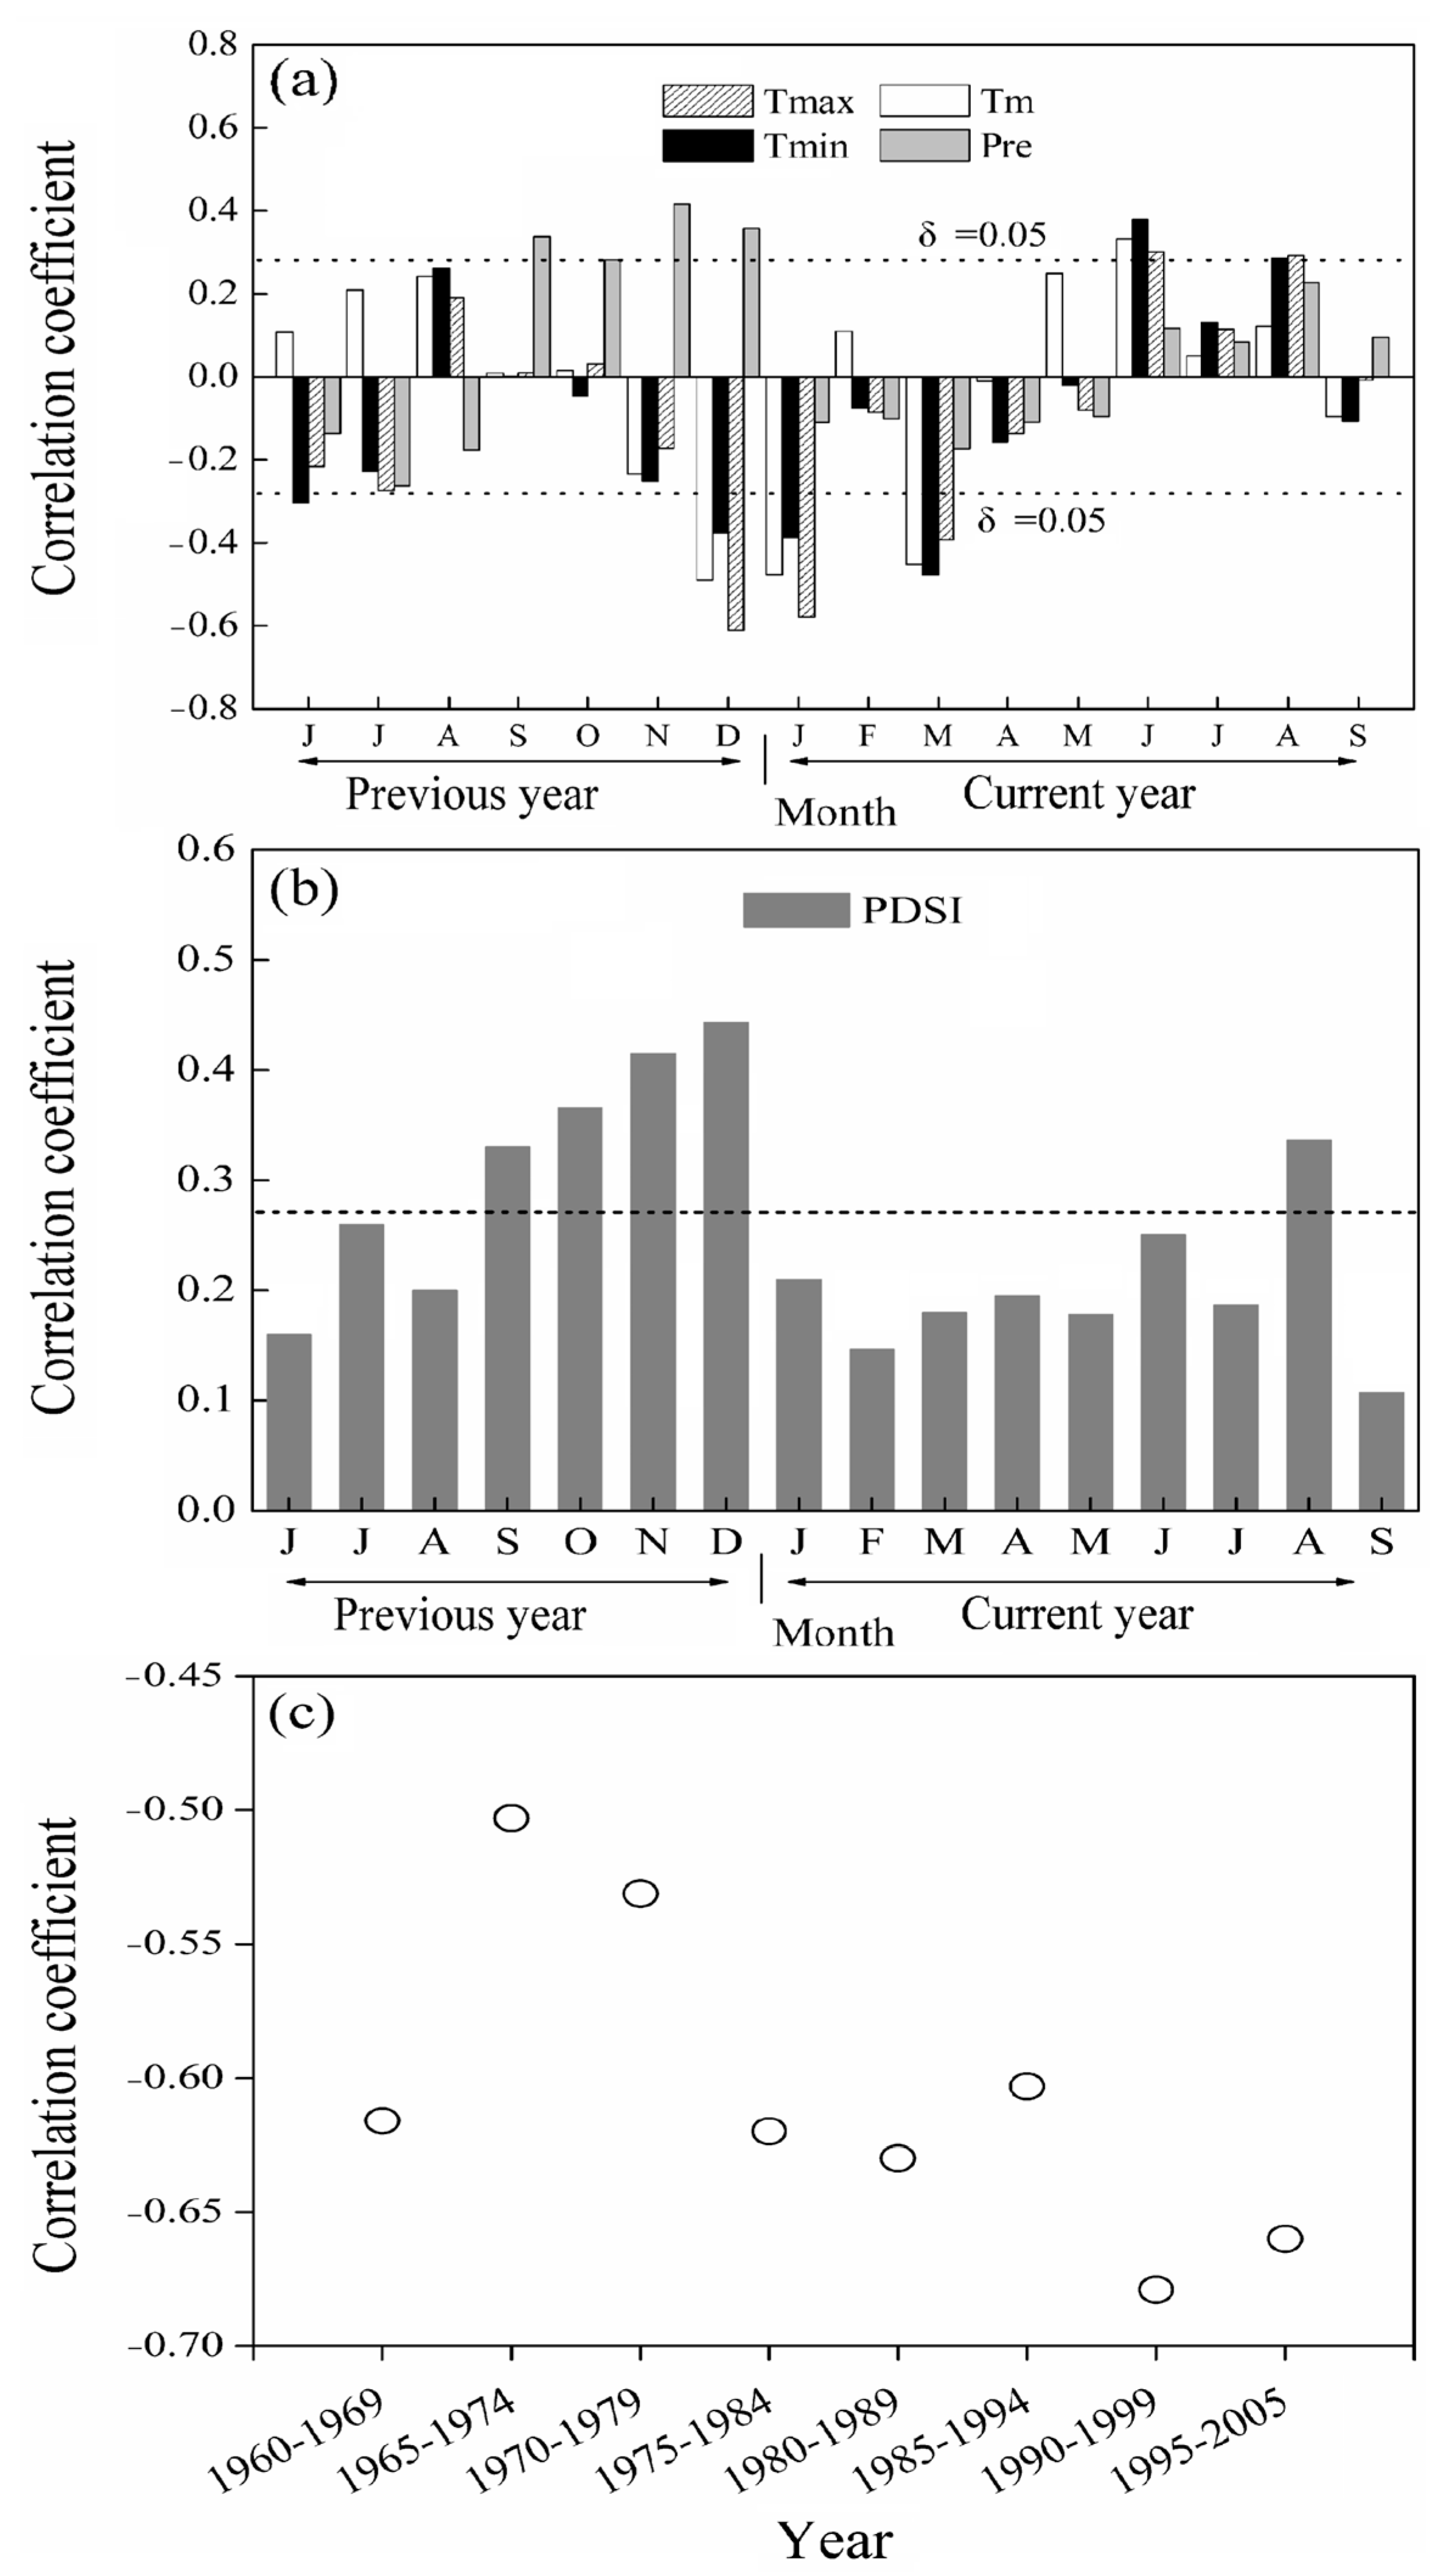
3.1. Relationship between Climate and Tree-Ring Width

The tree-ring width index displayed a significant negative correlation with certain climatic factors from the previous year, including Tmin in June, Tmax in July, and all temperature data (Tm, Tmin, Tmax) in December. Additionally, the tree-ring width index exhibited a significant negative correlation with all temperature data in January and March of the current year (p < 0.05) (Figure 4a). Conversely, the radial growth of BE trees demonstrated a significant positive correlation with all temperature data in June (p < 0.05) and Tmax and Tmin in August of the current year (p < 0.05), as well as precipitation in September, November and December of the previous year (p < 0.05) (Figure 4a). Furthermore, BE trees growth displayed a significant positive correlation with the Palmer Drought Severity Index (PDSI) in September and December of the previous year, as well as August of the current year (Figure 4b). Upon examining various combinations of months, it was determined that the correlation between the ring-width index and the average Tmax from December of the previous year to January of the current year was the strongest (r = −0.60; Table 2). The moving correlation analysis revealed a relatively stable correlation coefficient over time, with all correlations proving statistically significant (p < 0.05) (Figure 4c). Consequently, the reconstruction focused on the average Tmax from the months of December and January.

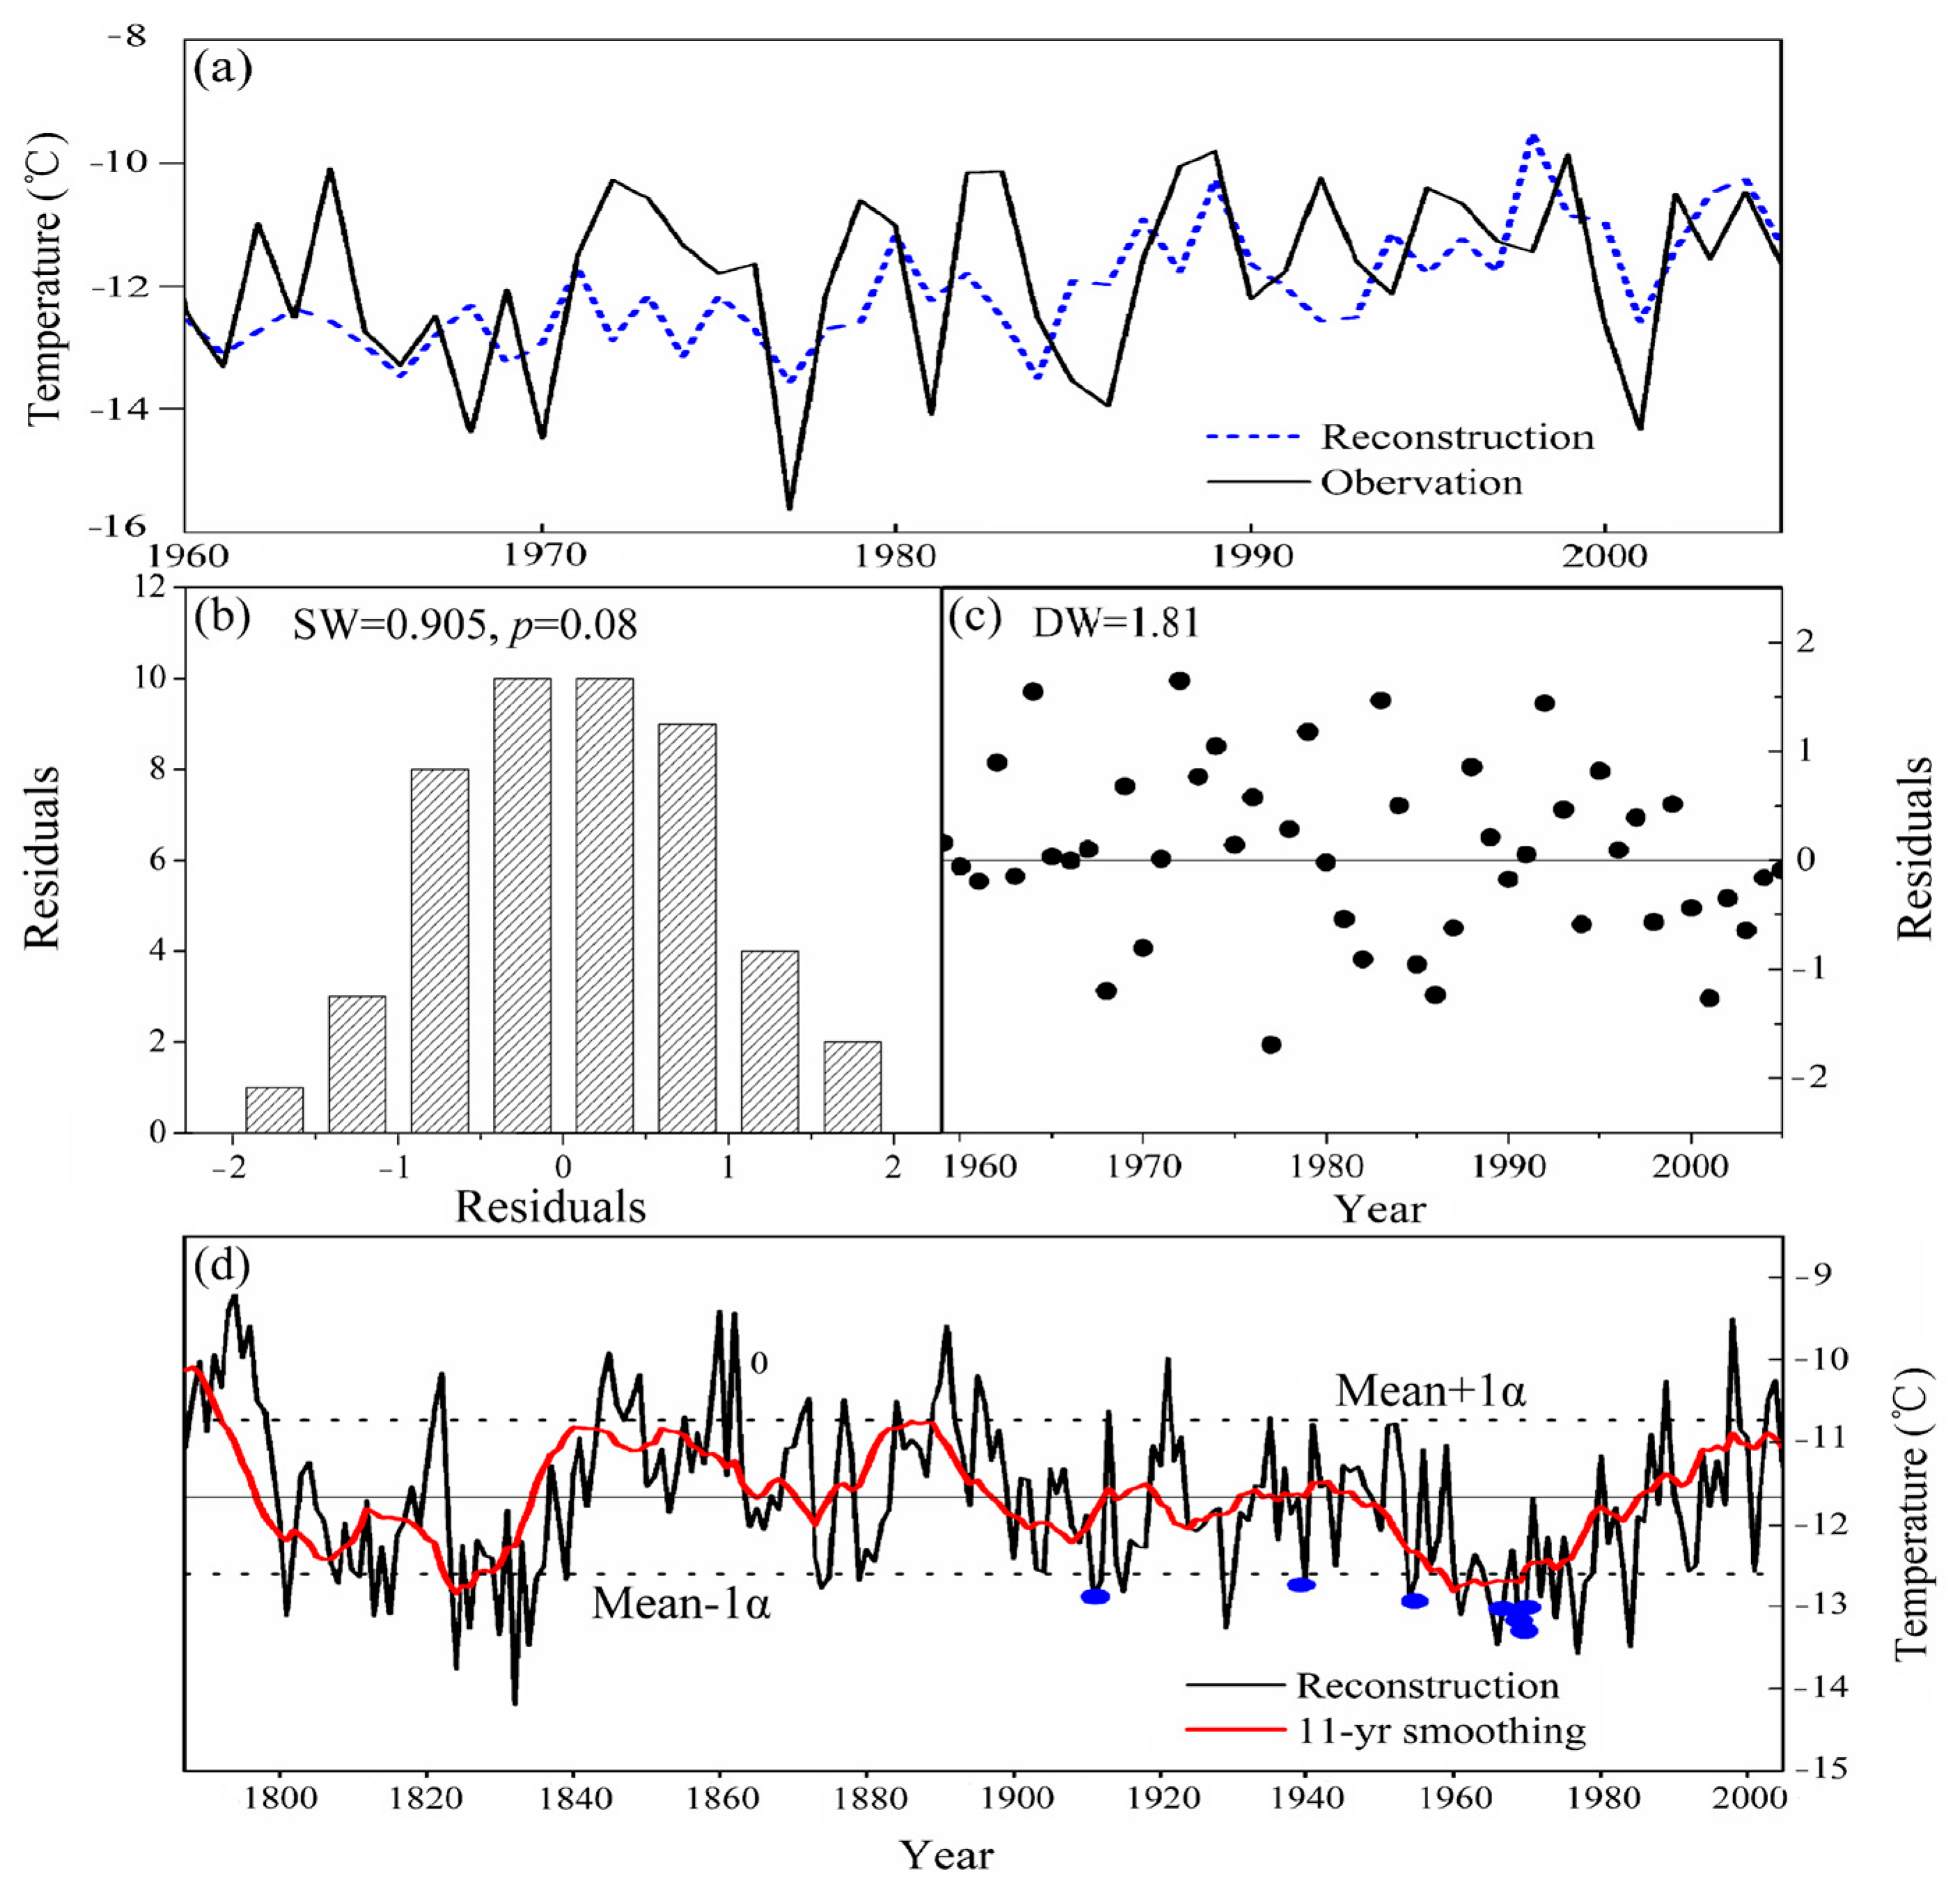
3.2. Development of the Regression Model

Based on the climate-growth response analyses, the pattern of monthly mean maximum temperature from December of the previous year to January of the current year was reconstructed using the following linear regression model:
Y = 3.19 × Xt 8.6
(N = 46; r = −0.60; R2 = 0.36; R2adj = 0.35; F = 32.07; p < 0.0001)
where Y is the temperature and X is the ring-width indices of the BE chronology of year t.
For the calibration period in the present study (1960–2005), the reconstruction accounted for 36% of the actual December–January temperatures (T12-1). After adjusting for the loss of degrees of freedom, the explained variance of the reconstruction was 35%. Calibration and verification were exhibited in Table 3, where all parameters were statistically significant (p < 0.05). In addition, the residuals of the reconstruction were analyzed by using the Durbin–Watson (DW) test, where the range was 1.82 to 1.90, indicating no significant autocorrelation or linear trend in the residuals (Figure 5b,c; Table 3). In addition, the positive reduction of error (RE) and coefficient of efficiency (CE) values (Table 3) revealed that the regression model was stable and suitable for further temperature reconstruction [39]. Significant results for the sign test (ST) and product mean test (PMT) (Table 3) revealed good agreement between the reconstructed and actual data. These analyses demonstrate that this regression model was stable and reliable for temperature reconstruction. Based on the model, T12-1 could be reconstructed for the CBM region from 1787–2005 (Figure 5d). The reconstruction has a mean of −11.7 °C and varies from −14.2 to −9.1 °C with a standard deviation of 1.0 °C (α).

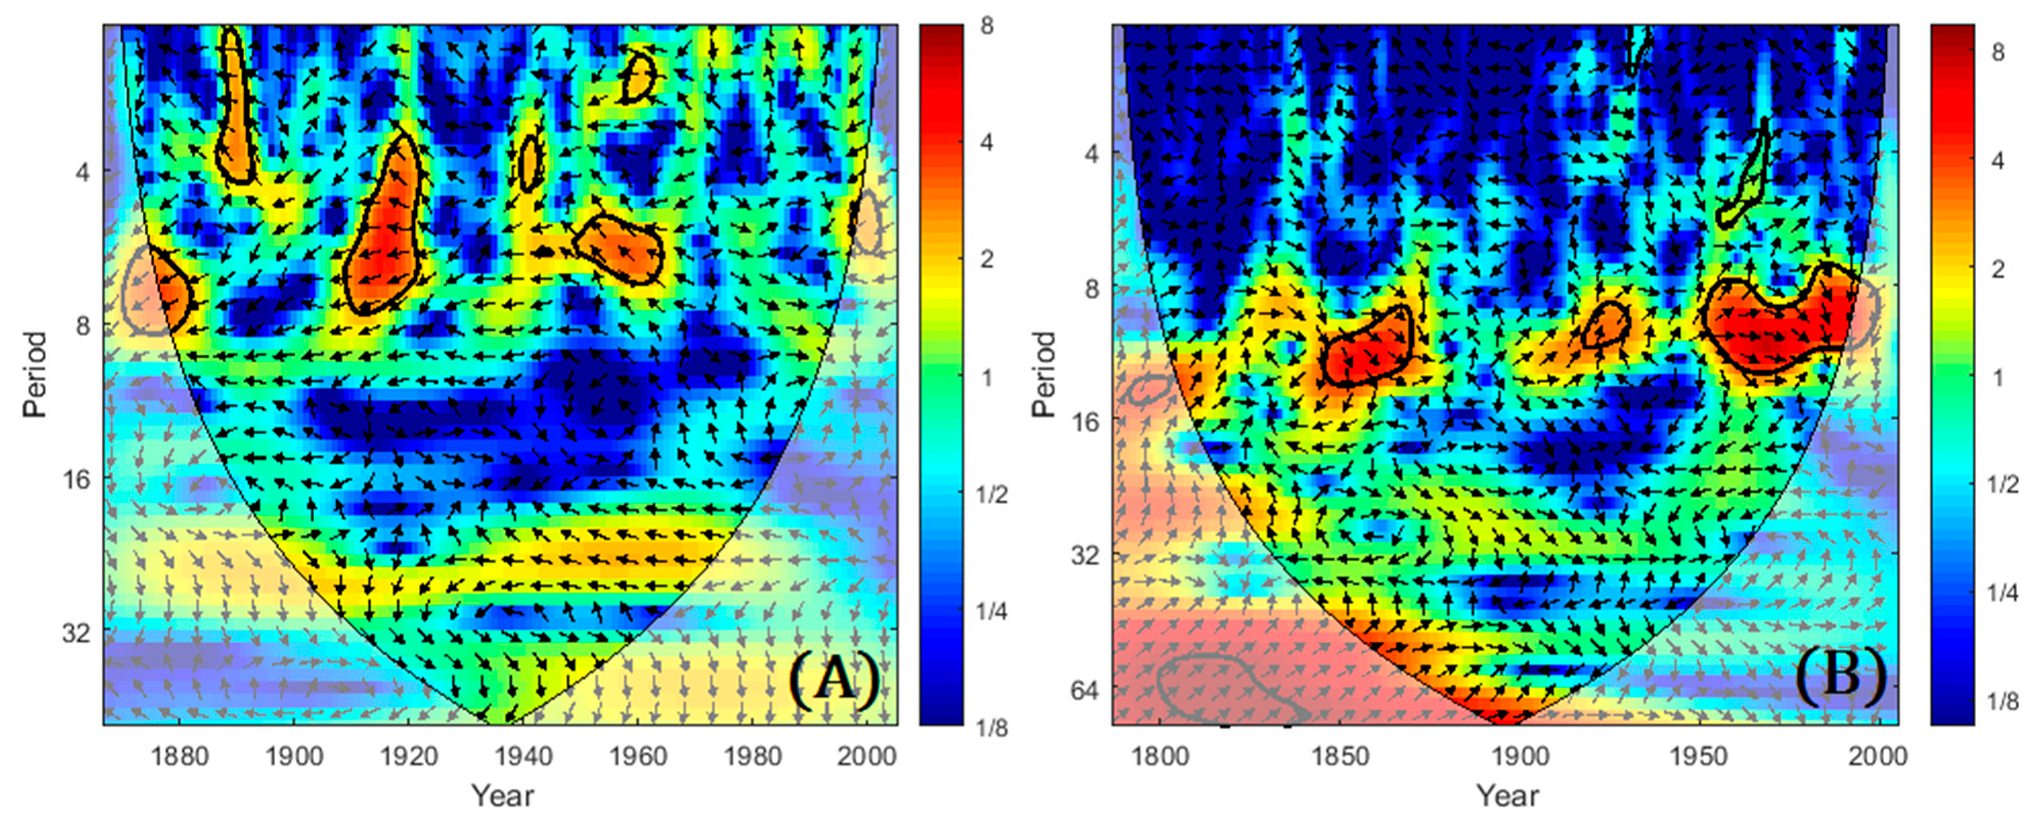
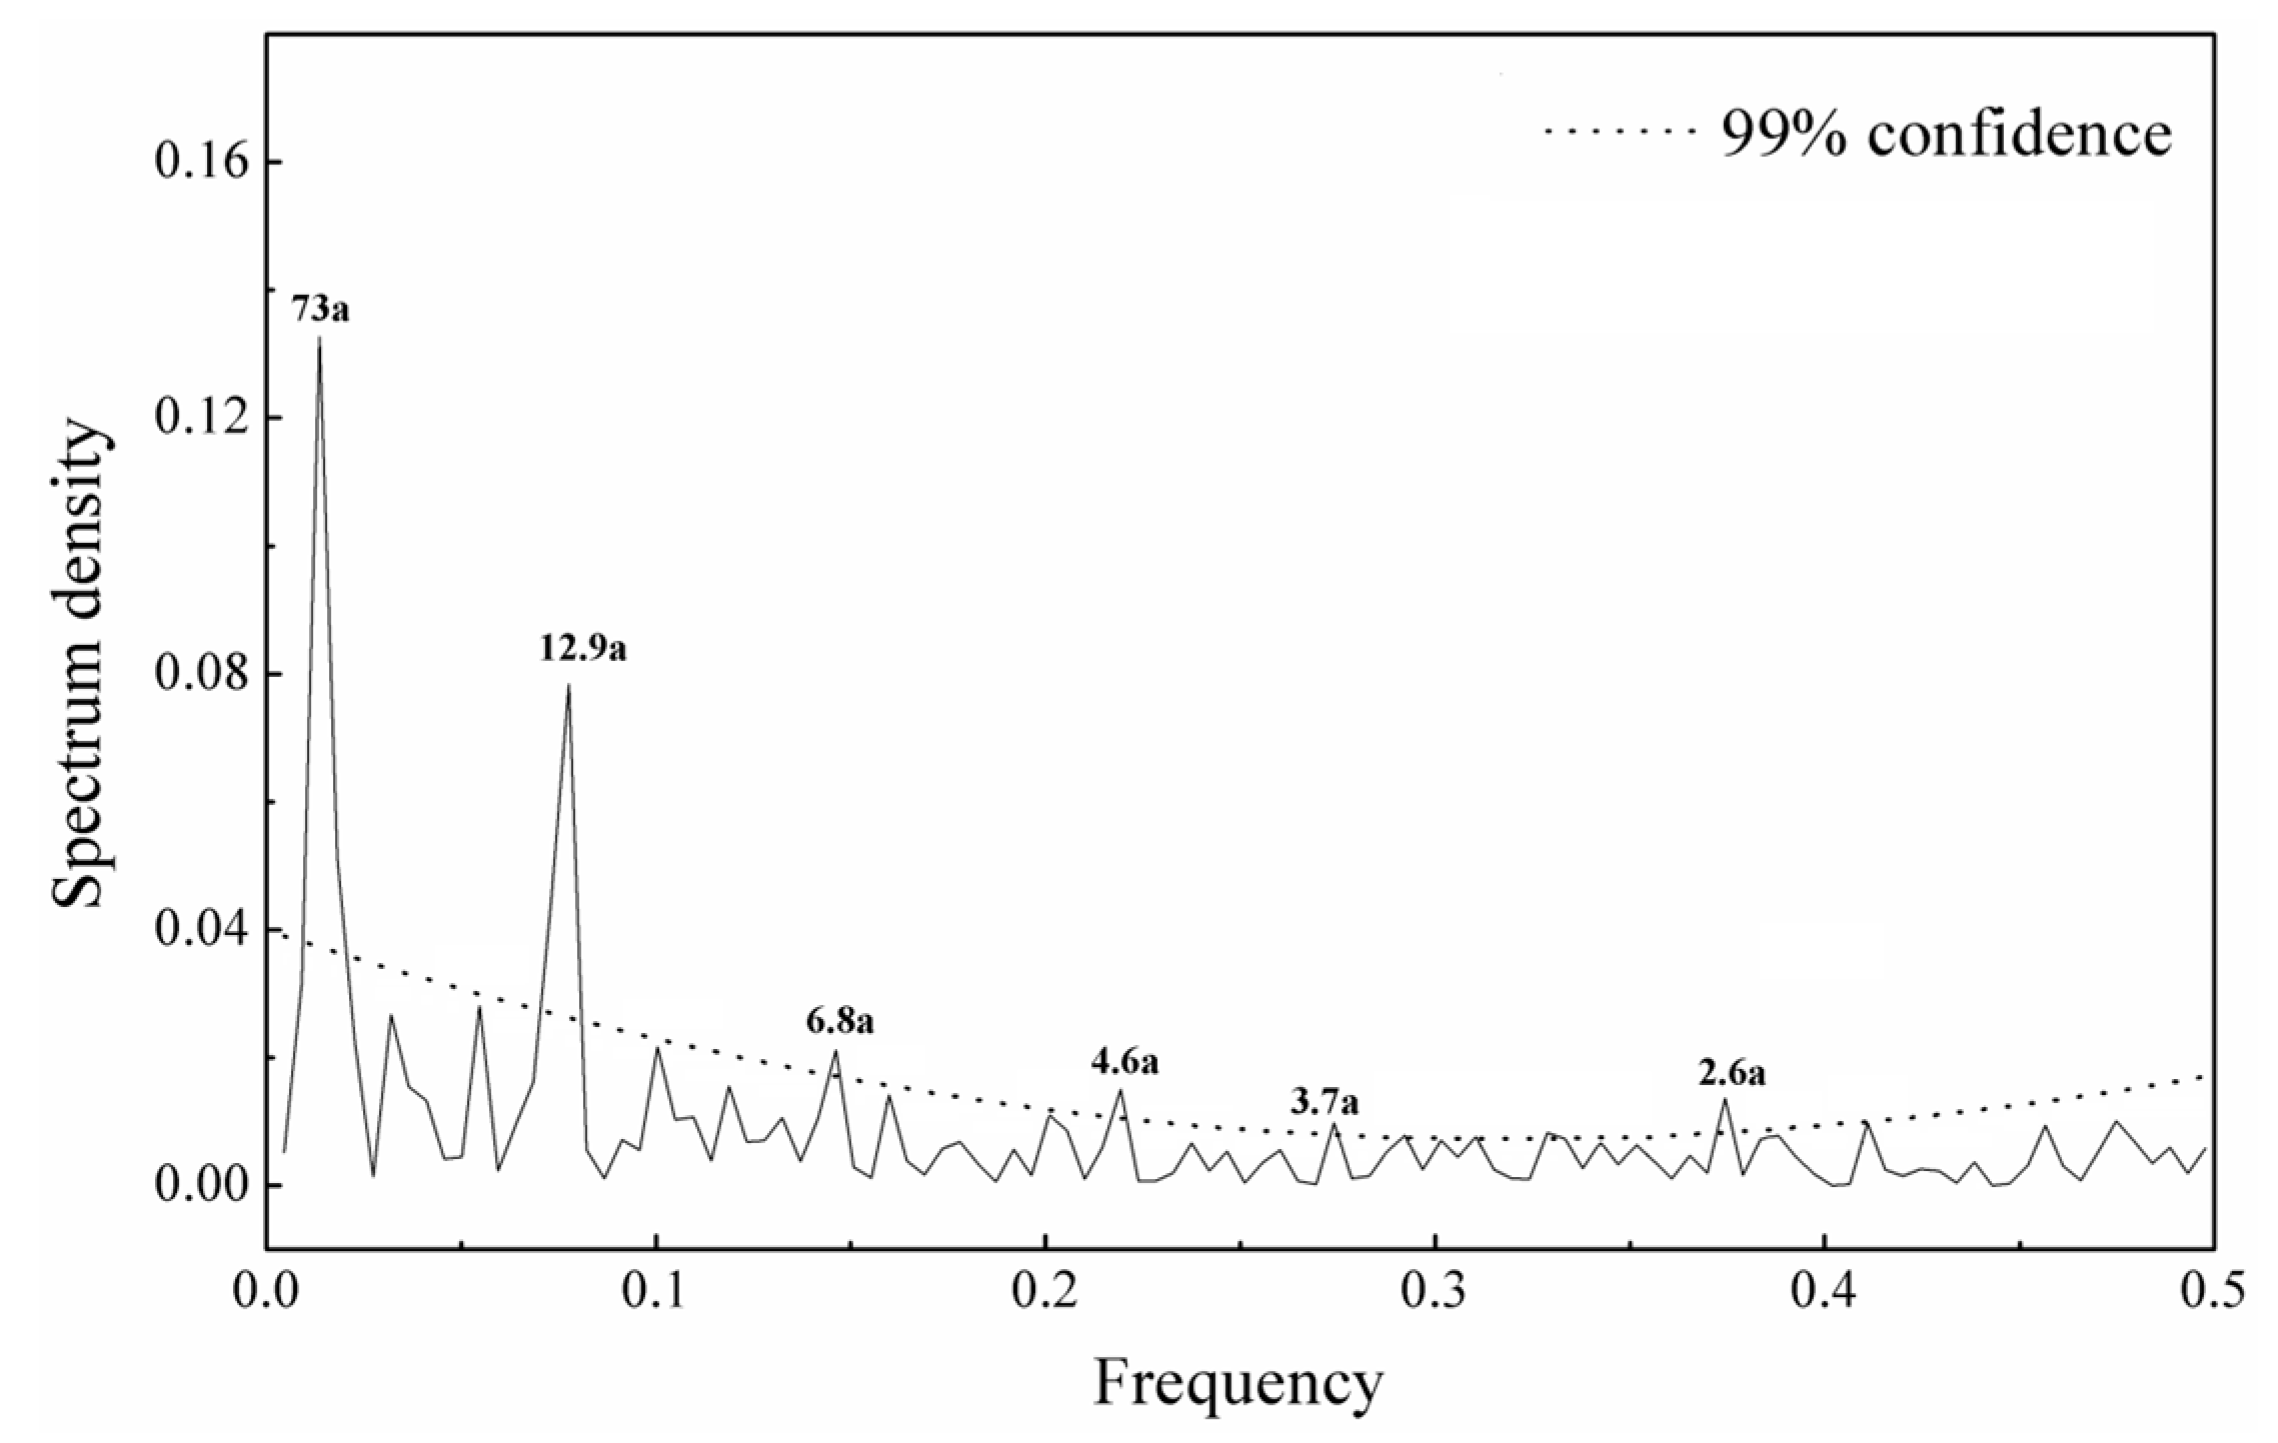
3.3. The Result of Periodicity Analyses

The Multi-Taper Method (MTM) spectral analysis showed that the T12-1 annual reconstruction had 73-, 12.9-, 6.8-, 4.6-, 3.7-, and 2.6-year quasi-cycles over the past 219 years all of which were significant at the 99% confidence level (Figure 6).

4. Discussion

4.1. Climate–Growth Relationships

This study found that winter temperature has a significant effect on the radial growth of Betula ermanii (BE). Temperatures from the previous December and current January were the key limiting factors in radial growth, which were significantly negatively correlated with the increase in radial growth of BE in the Changbai Mountain (CBM) area. The negative effects of warmer temperatures during the dormant season at high altitudes have also been reported by other authors [42,43,44]. The general explanation for this was that tree-ring radial growth was influenced by the amount of nutrients stored [45]. Increased temperatures in the previous winter would increase evapotranspiration and respiration, the consequent carbohydrate-losses are not replaced by photosynthesis and water uptake, which increases the loss of carbohydrates stored for growth in the following summer [46]. In addition, Buma et al. showed that as snows are melting earlier, or there is a transition of snow to rain, certain species of trees are becoming vulnerable to frost in their root zones that are no longer protected by snow [47]. The negative correlation with winter temperature in the Changbai record is consistent with this, the positive correlation with winter PDSI and precipitation is consistent with this as is the stronger negative correlation in recent decades (stronger with warming). This mechanism of the effects of increased winter temperatures in the previous year on the radial growth of trees needs to be studied in more detail in order to gain a deeper understanding of the relationship between radial growth and climate change.

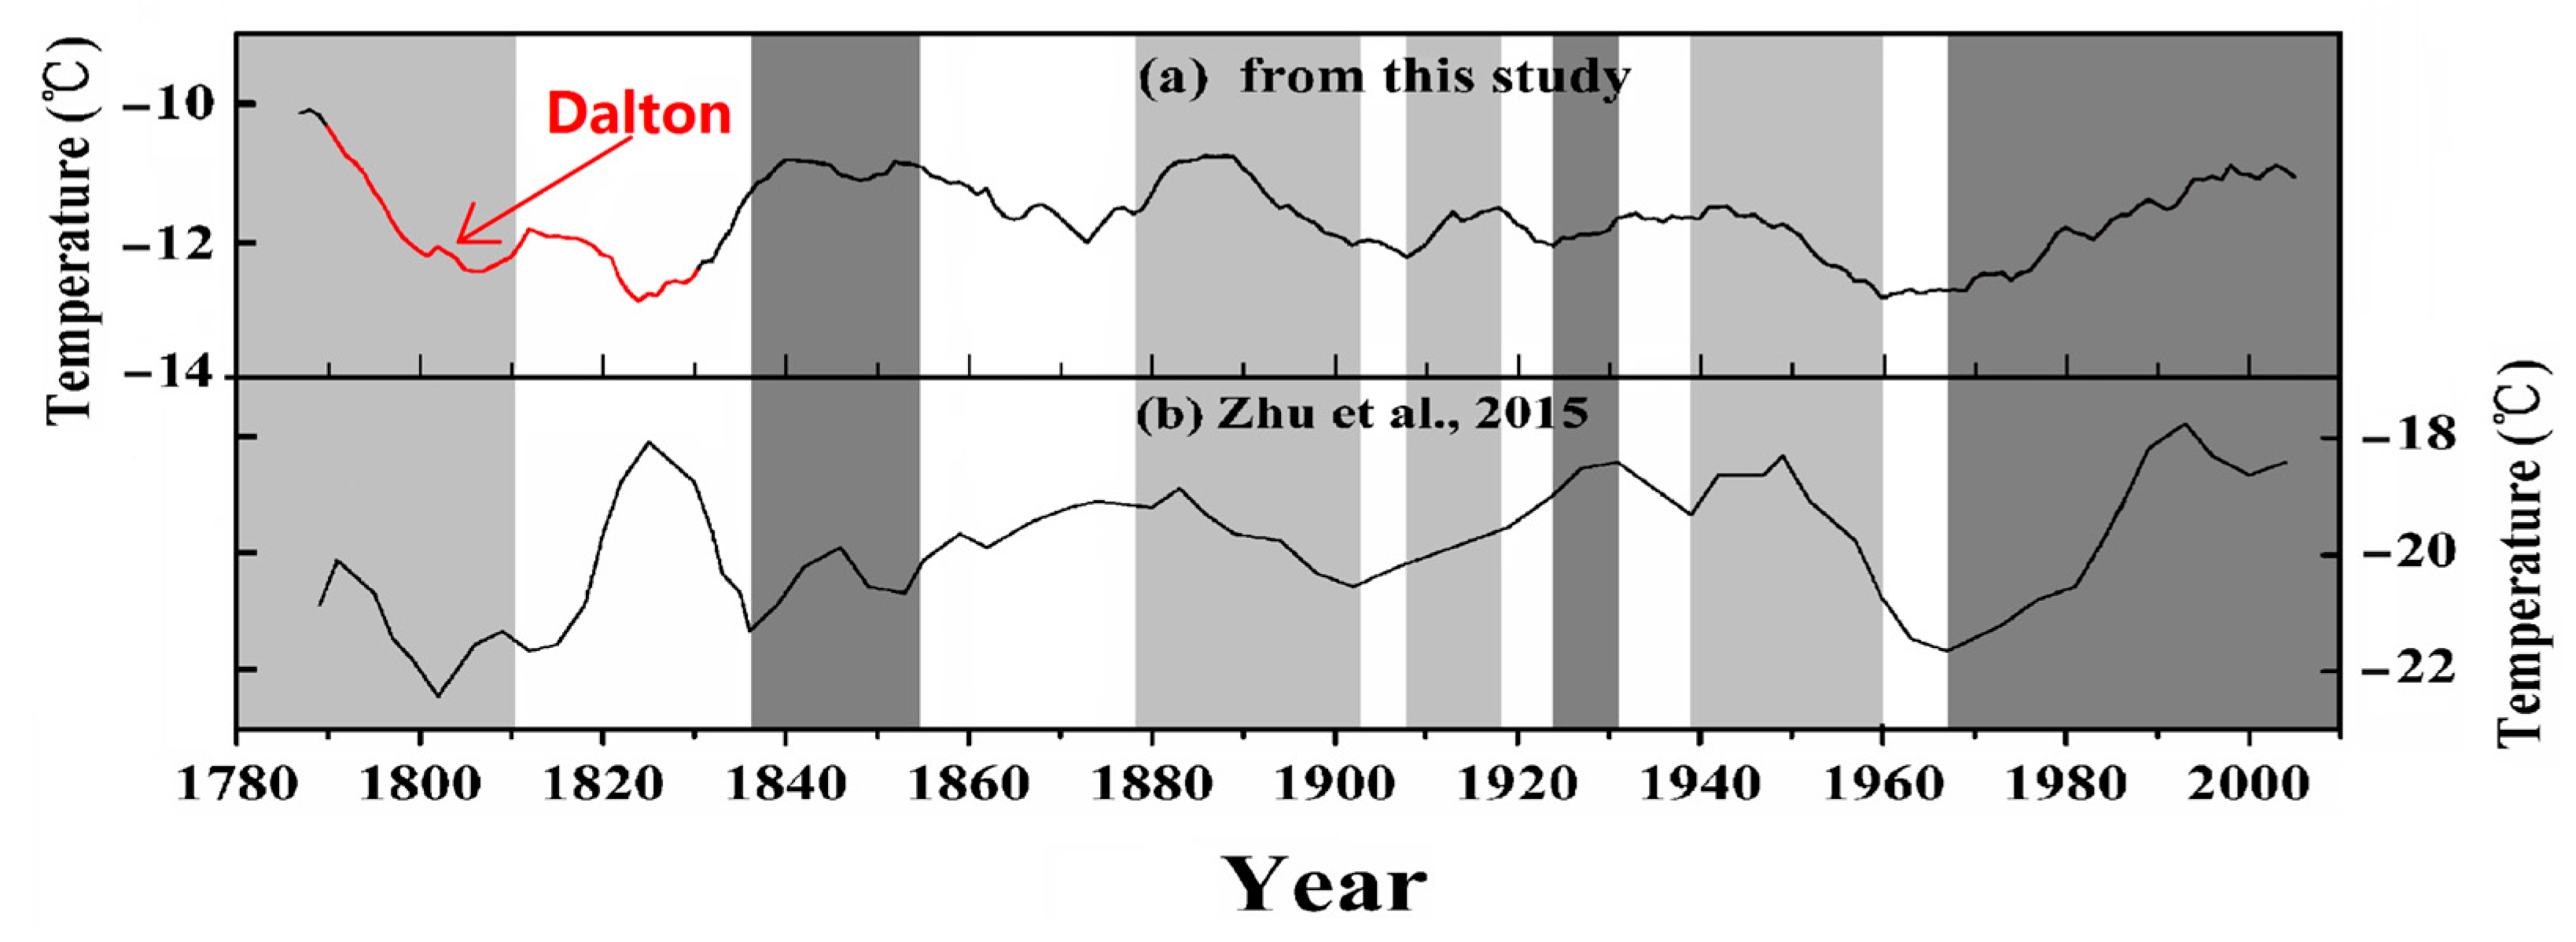
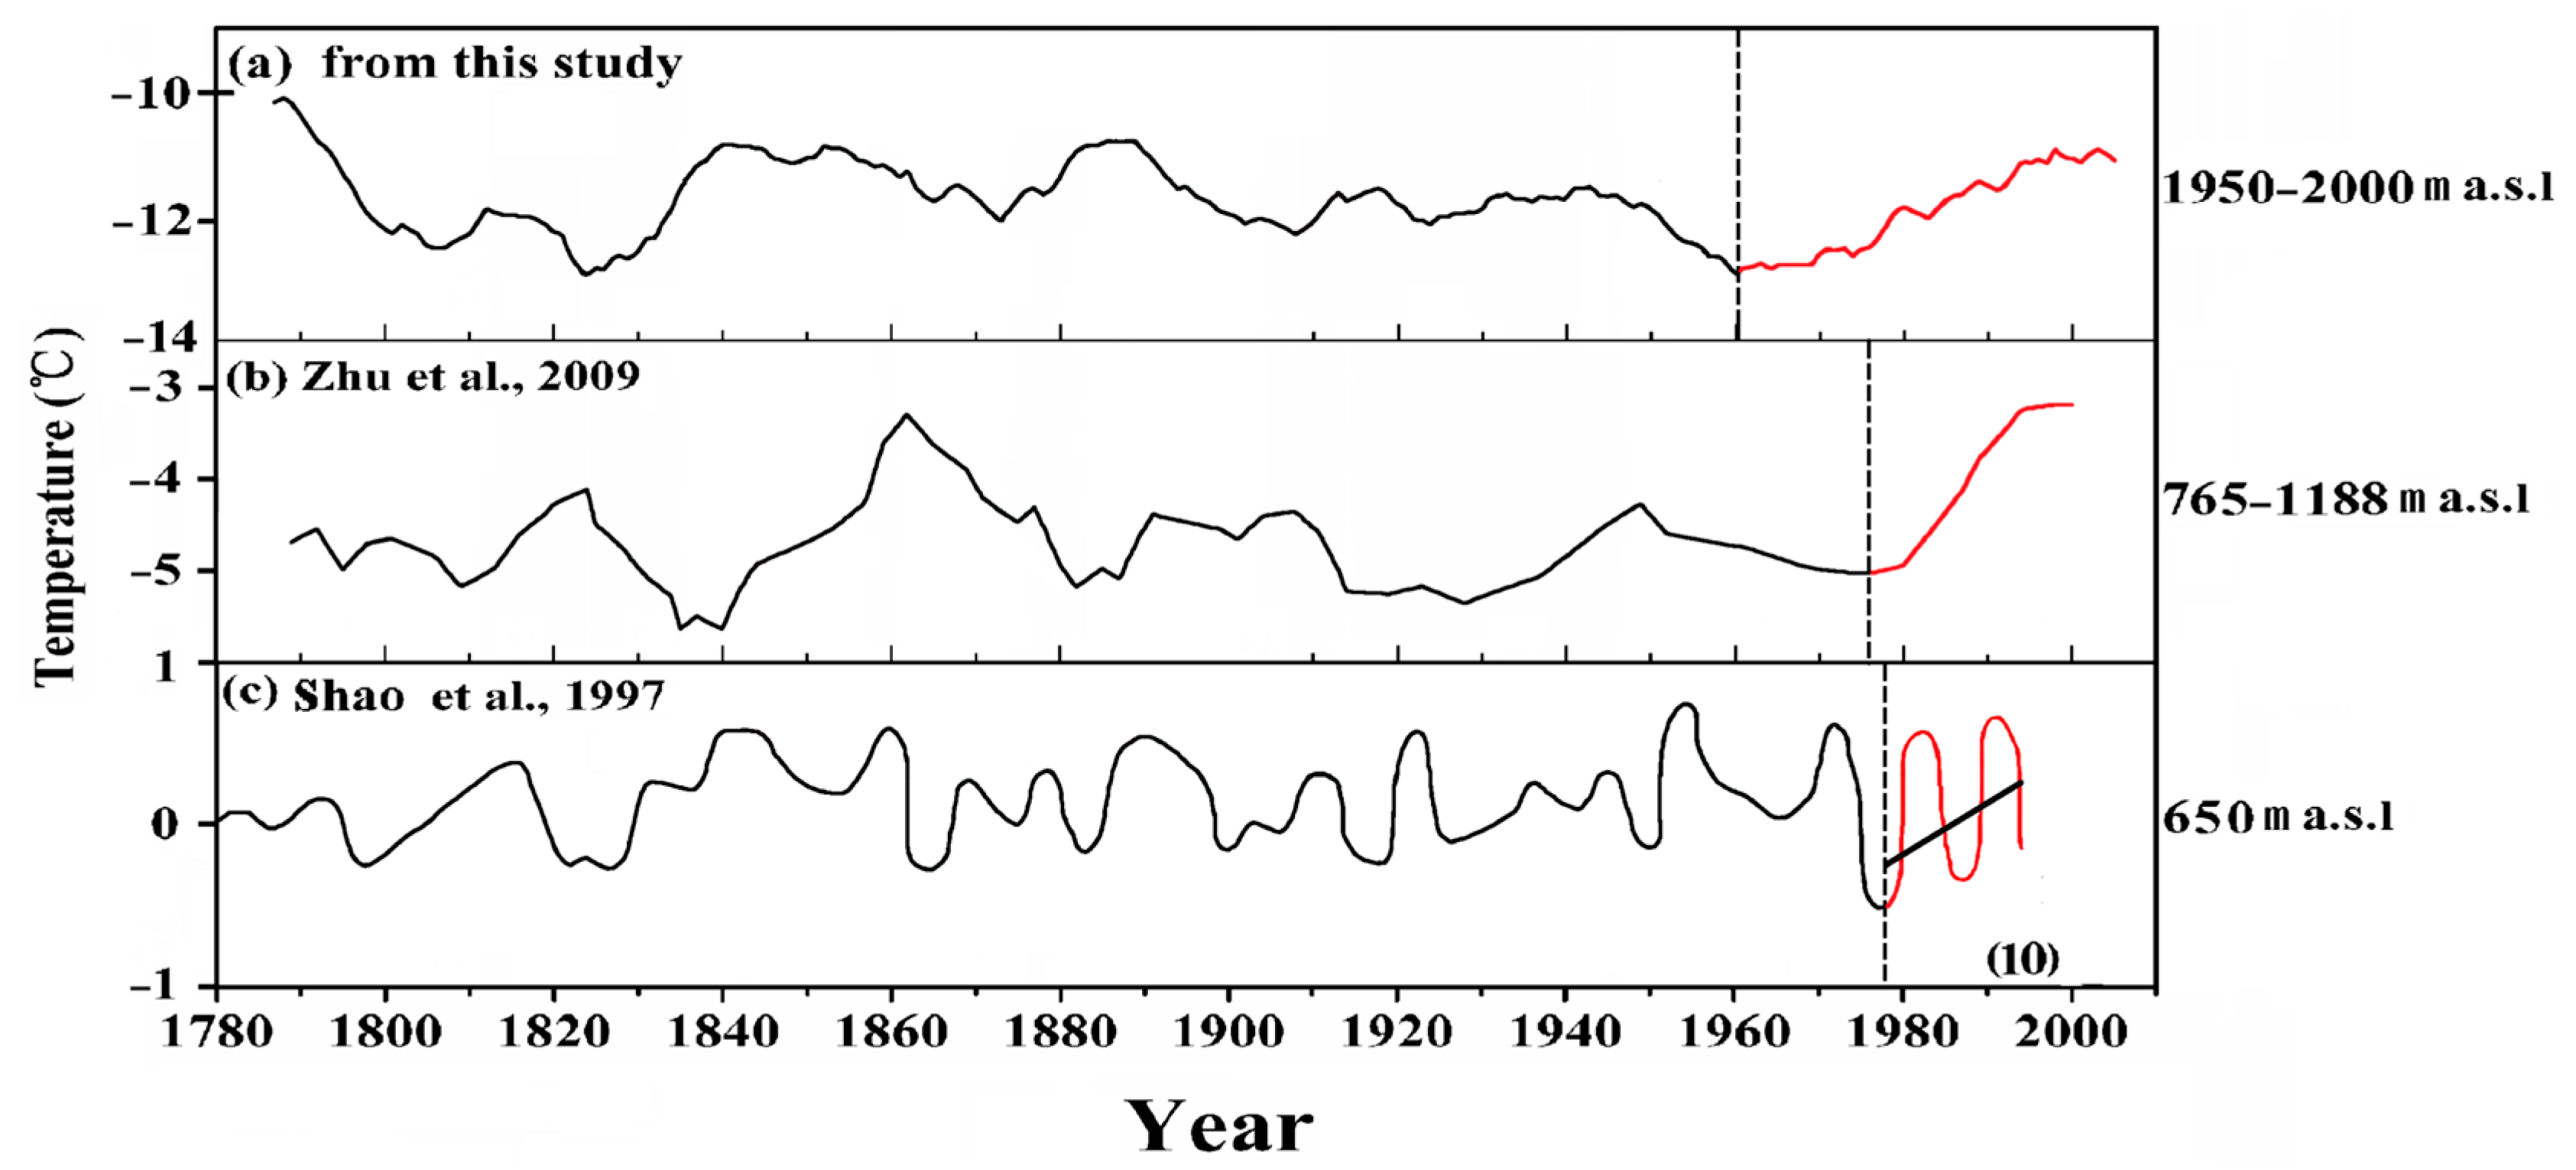
4.2. Temperature Variability through Time and Comparison with Historical Document Records

Compared with single years, in general, high or low temperatures that persist for many years will more significantly affect the growth of trees [30]. When we defined years with T12-1 ≥ −10.73 °C (Mean + 1σ) and T12-1 ≤ −12.61 °C (Mean − 1σ) as extreme warm years and cold years, respectively, the reconstruction for the period of 1787–2005 contained 31 cold years and 36 warm years (Table 4). The extreme cold/warm events lasting for three or more consecutive years were discovered in 1965–1967 and 1976–1978/1791–1798, 1844–1849 and 1889–1891. An 11-year smoothing average of the reconstructed T12-1 series was performed to reveal multi-year and interdecadal variations and to detect the several prolonged cold and warm periods (Figure 5d). After smoothing with an 11-yr moving average, cold periods occurred in 1822–1830 (mean T12-1 = −12.7 °C) and 1957–1970 (mean T12-1 = −12.7 °C), while a warm period occurred in 1787–1793 (mean T12-1 = −10.4 °C) (Figure 5d). Rapid and sustained cooling was observed in the reconstructed series in the years 1790–1826 (T12-1 range −10.3 °C to −12.8 °C, mean = −12.0 °C) and 1939–1969 (T12-1 range −11.6 °C to −12.7 °C, mean = −12.1 °C), where the rates of cooling were about 0.067 °C/year and 0.035 °C/year, respectively (Figure 5d). The two cooling events may be due to the decrease in solar activity [48,49,50]. Using a 50-year time scale, the highest temperature occurring during 1787–2005 was from 1844 to 1893 (T12-1 range −12.79 °C to −9.41 °C, mean = −11.15 °C), similar results were also obtained by Zhu et al. and Jiang et al., while the lowest temperature was from 1940–1993 (T12-1 range −13.57 °C to −10.26 °C, mean = −12.13 °C) (Figure 5d) [33].
This is consistent with the results from several studies [25,33,45]. Meanwhile, a rapid warming since 1960 AD was found in our winter temperature series (elevation from 1950 to 2000 m a.s.l.; T12-1 range −12.52 °C to −11.05 °C) (Figure 5d).

4.3. Comparison with Historical Records and Regional Comparison

Historical documents provide compelling evidence indicating numerous occurrences of snow disasters or exceptionally low temperatures in Jilin Province since 1787 [41]. The instances of extreme snowfall or cold wave events align notably well with seven years characterized by remarkably low temperatures (1911, 1940, 1954, 1965, 1969, 1970, 1972) in the reconstructed T12-1 series (Table 4) [41].
To further validate the reliability of our reconstruction, we conducted a comparative analysis with the tree-ring-based winter temperature series from Yichun (YC) in northeastern China (Figure 7), as illustrated in Figure 1. This comparison revealed that our reconstructed T12-1 series (Figure 7) exhibited similar variations to the February–March mean minimum temperature reconstruction by Zhu et al. (Figure 7) [33]. Notably, the temperature trends during specific time intervals (1787–1810, 1836–1854, 1878–1903, 1908–1918, 1924–1931, 1939–1960, 1967–2005) in both series displayed a consistent pattern (Figure 7), indicating a coherent regional-scale climate change.

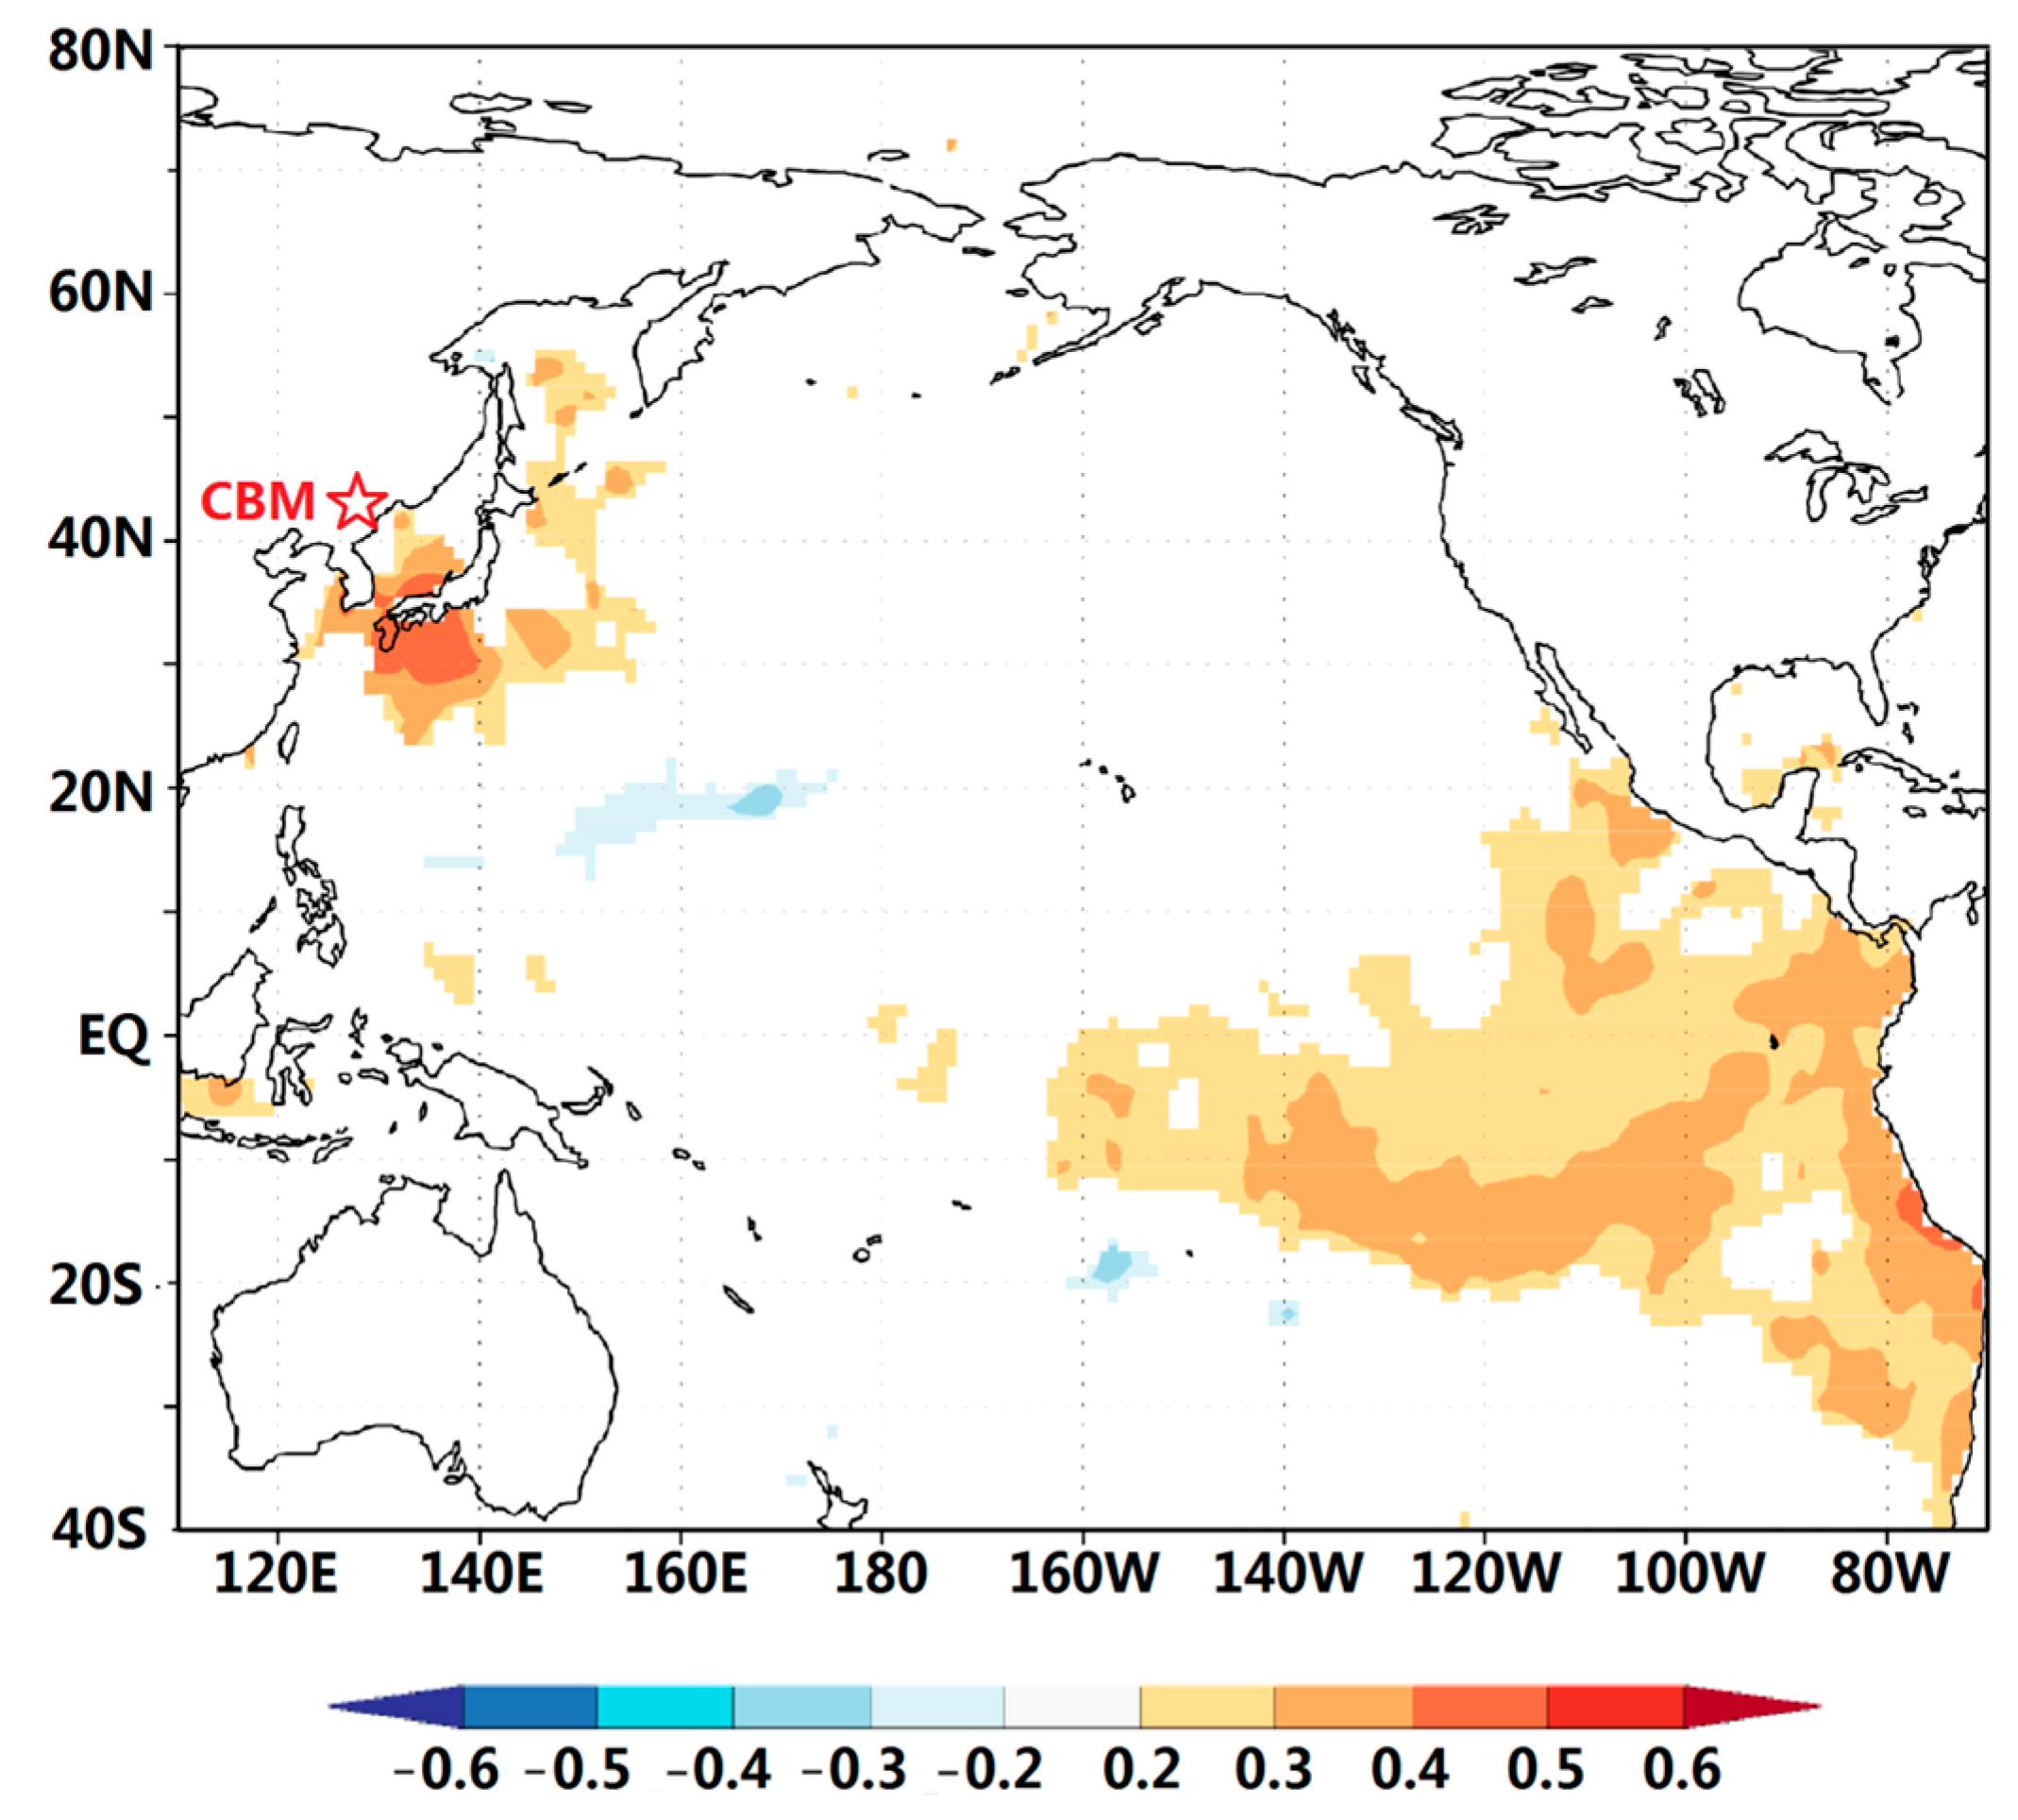
4.4. Linkage with the Solar Activity and El Niño Southern Oscillation

Recent studies have underscored the strong correlation between changes in Earth’s climate and solar activity. The prevailing belief is that during periods of lower solar activity, such as the Dalton Minimum (c. AD 1790–1830) [51,52,53], Earth’s temperature is expected to decrease. Our reconstruction reflects these expectations, displaying low values from AD 1790 to 1830 that coincide with the Dalton Minimum of diminished solar activity (Figure 7a). Conversely, during periods of heightened solar activity, the climate tends to warm, as observed during the Roman warm period (400–10 BC) and the medieval warm period (900–1200 AD) [53]. It was found that the upper temperature of the troposphere and stratosphere was synchronous with the 10–12 years cycle of solar activity [54]. The 12.9 years cycle correspond with the sun spot cycle [55,56,57,58]. Correlation analyses revealed a significant positive correlation between the annual reconstructed T12-1 and the number of sunspots (http://www.sidc.be/silso/datafiles (accessed on 8 September 2021)) from the previous December to the current January, with r = 0.22 (N = 188 years, 1818–2005, p = 0.011). The 73-year cycle may be linked to the 50–80 years Lower Gleissberg cycle [31], reflecting changes in solar radiation intensity [57]. A noteworthy relationship between the reconstructed series and sunspot numbers was identified during specific periods, including the 1790s–1840s, 1850s–1870s, 1920s–1930s, and 1950s–2000s (Figure 8B). Additionally, other studies in northern China have also detected cycles of approximately 10 years [25,58,59] and approximately 70 years [45], suggesting potential effects of solar activity in the region.
The cycles identified at 6.8, 4.6, 3.7, and 2.6 years (Figure 6) fall within the range of 2–7 years El Niño Southern Oscillation (ENSO) cycles [60,61,62]. Positive correlations between sea surface temperatures (SSTs) in the southern equatorial Pacific and the reconstructed T12-1 (Figure 9) showed a potential linkage between T12-1 changes and ENSO. Additionally, our reconstructed T12-1 exhibited a significant negative correlation with the Southern Oscillation Index (SOI, http://www.cru.uea.ac.uk/cru/data/soi (accessed on 11 September 2021)) for the previous December to the current January, with r = −0.24 (1866–2005 AD, p < 0.05). Wavelet coherence analysis revealed an antiphase relationship between the temperature reconstruction and the SOI index during the 1870s–1890s, 1910s, 1940s–1960s, and 2000s (Figure 8A). El Niño exerts an indirect influence on temperature changes in monsoon-affected areas by impacting the East Asian monsoon [63,64]. Previous studies have demonstrated a connection between El Niño events and warmer winter temperatures in China [65,66,67]. According to data from the China Meteorological Administration, over the past 50 years, 80% of El Niño years in China have witnessed warm winters [68]. In the winter, the Asian continent is dominated by strong Siberian cold high pressure, while the air temperature in the ocean is relatively warm and the air pressure relatively low [69]. Air flows from a high to low pressure area when flowing from the mainland to the ocean. As a result, the northwesterly airflow from high latitudes covers most of China, and is often accompanied by cold waves and cold air, resulting in a cold and dry climate. Studies have shown that in the winters of El Niño years, the location of the East Asian polar front jet was often northerly than usual, and cold air activity was also northerly and weaker, while the Southern warm-wet air mass was relatively strong.
The prominent periodicity observed suggests that T12-1 in the Changbai Mountain region may be influenced by both solar activity and widespread atmosphere-sea interactions.

4.5. The Altitude Differences of Start Time of the Recent Warming in Changbai Mountain

Two winter temperature variability studies have been carried out in the CBM area using tree rings for reconstruction based on Korean pine chronology by Shao and Wu (January–April; 650 m a.s.l.) [70] and Zhu et al. (February–April; 765–1188 m a.s.l.) [32]. However, comparing the two aforementioned temperature reconstruction series with this reconstructed T12-1 series, it was found that the starting time of Changbai Mountain’s recent warming varies with altitude, which showed an evident low-to-high delay. It started around 1977 at an altitude of 650 m a.s.l. (Figure 10c). At an altitude of 765–1188 m a.s.l., it started around 1975 AD (Figure 10b). However, it started relatively early at an altitude of 1950–2000 m a.s.l., roughly around 1960 AD (Figure 10a). Our results suggested that the differences in altitude may lead to changes in sensitivity to global warming. A similar study has been reported by Cai et al. [30], who found that the start time of recent warming showed a systematic delay from the North to the South of eastern China.
As mentioned earlier, the spatial variations in year-to-year temperature changes remain unclear, necessitating further scientific investigation to elucidate the underlying mechanisms. Additionally, previous studies on paleo-temperature changes have predominantly focused on constructing large-scale temperature variations, assuming that such changes are regionally representative. However, this approach has overlooked the spatial nuances in temperature changes, leading to an insufficient understanding of regional and global climate dynamics.

5. Conclusions

The monthly mean maximum temperatures from the previous December to January, spanning the period 1787–2005 AD, were reconstructed utilizing tree-ring data obtained from Changbai Mountain (CBM) in northeastern China. The reconstructed temperature series demonstrated notable coherence with instrumental temperature records across common periods. Comparison with historical records revealed that warm and cold periods in the reconstructed record generally aligned with documented temperature variations. Furthermore, the reconstruction exhibited consistency with several other temperature series reconstructed within the environmentally sensitive zone of northeastern China and with regional gridded temperature data. This alignment suggests that the reconstructed temperature series captures both local and large-scale regional temperature variability. Power spectrum analysis exposed significant cycles in temperature variability, hinting at potential connections between regional temperature variations and phenomena such as the ENSO and solar activity. Our results showed that temperature changes were not synchronous along a latitude gradient. The temperature comparison showed that there was an altitude difference in the beginning of the recent winter warming in Changbai Mountain. It started around 1977 CE at an altitude of 650 m a.s.l., around 1975 CE at an altitude of 765–1188 m a.s.l. and around 1960 CE at an altitude of 1950–2000 m a.s.l. Therefore, in order to obtain high resolution temperature change data, the paleotemperature research results that have been obtained in Changbai Mountain are not enough, as they are far from able to clarify the characteristics of climate change in this region. A large amount of temperature change data at different altitudes needs to be supplemented in the future.

Author Contributions

Conceptualization, S.L. and Y.J.; Methodology, S.L. and Y.J.; Software, Y.J.; Validation, S.L. and Y.J.; Formal Analysis, Y.J.; Investigation, S.L. and Y.J.; Resources, S.L. and Y.J.; Data Curation, Y.J.; Writing—Original Draft Preparation, S.L.; Writing—Review and Editing, X.C. and Y.J.; Visualization, S.L.; Supervision, Y.J.; Project Administration, X.C.; Funding Acquisition, X.C. All authors have read and agreed to the published version of the manuscript.

Funding

The research was funded by the National Key Research and Development Program of China (2016YFA0600800), Academy of Changbai Mountain Science (Grant No. 2017-03) and the Educational Department of Liaoning Province (Nos. LQN 201905).

Data Availability Statement

Data presented in this study are available upon request from the corresponding author.

Acknowledgments

We would like to thank Northeast Forestry University and Shenyang Normal University for providing the research facilities and resources for this study.

Conflicts of Interest

The authors declare no conflicts of interest.

References

  1. IPCC (Intergovernmental Panel on Climate Change). Climate Change 2014: Mitigation of Climate Change; Cambridge University Press: Cambridge, UK, 2014; Available online: http://www.ipcc.ch/report/ar5/wg3 (accessed on 10 September 2014).
  2. Lloyd, A.H.; Bunn, A.G.; Berner, L. A latitudinal gradient in tree growth response to climate warming in the Siberian taiga. Glob. Chang. Biol. 2011, 17, 1935–1945. [Google Scholar] [CrossRef]
  3. Yu, D.; Wang, Q.; Wang, Y.; Zhou, W.; Ding, H.; Fang, X.; Jiang, S.; Dai, L. Climatic effects on radial growth of major tree species on Changbai Mountain. Ann. For. Sci. 2011, 68, 921–933. [Google Scholar] [CrossRef]
  4. Yu, D.; Liu, J.; Lewis, B.J.; Zhou, L.; Zhou, W.; Fang, X.; Wei, Y.; Jiang, S.; Dai, L. Spatial variation and temporal instability in the climate–growth relationship of Korean pine in the Changbai Mountain region of Northeast China. For. Ecol. Manag. 2013, 300, 96–105. [Google Scholar] [CrossRef]
  5. Zhang, X.; Bai, X.; Chang, Y.; Chen, Z. Increased sensitivity of Dahurian larch radial growth to summer temperature with the rapid warming in Northeast China. Trees 2016, 30, 1799–1806. [Google Scholar] [CrossRef]
  6. Lin, D.; Xia, J.; Wan, X.S. Climate warming and biomass accumulation of terrestrial plants: A meta-analysis. New Phytol. 2010, 188, 187–198. [Google Scholar] [CrossRef]
  7. Chen, P.Y.; Welsh, C.; Hamann, A. Geographic variation in growth response of Douglas-fir to interannual climate variability and projected climate change. Glob. Chang. Biol. 2010, 16, 3374–3385. [Google Scholar] [CrossRef]
  8. Huang, J.; Tardif, J.C.; Bergeron, Y.; Denneler, B.; Berninger, F.; Girardin, M.P. Radial growth response of four dominant boreal tree species to climate along a latitudinal gradient in the eastern Canadian boreal forest. Glob. Chang. Biol. 2010, 16, 711–731. [Google Scholar] [CrossRef]
  9. Sano, M.; Furuta, F.; Sweda, T. Summer temperature variations in southern Kamchatka as reconstructed from a 247-year tree-ring chronology of Betula ermanii. J. For. Res. 2010, 15, 234–240. [Google Scholar] [CrossRef]
  10. Li, C.; Wu, S.; Tao, P. Variability of climate–growth relationships along an elevation gradient in the Changbai Mountain, northeastern China. Trees 2011, 25, 1133–1139. [Google Scholar] [CrossRef]
  11. Camarero, J.J.; Gutiérrez, E. Pace and Pattern of Recent Tree line Dynamics: Response of Ecotones to Climatic Variability in the Spanish Pyrenees. Clim. Chang. 2004, 63, 181–200. [Google Scholar] [CrossRef]
  12. Handa, I.T.; Körner, C.; Hättenschwiler, S. Conifer stem growth at the altitudinal tree line in response to four years of CO2 enrichment. Glob. Chang. Biol. 2010, 12, 2417–2430. [Google Scholar] [CrossRef]
  13. Tomback, D.F.; Resler, L.M.; Keane, R.E.; Pansing, E.; Andrade, A.; Wagner, A. Community structure, biodiversity, and ecosystem services in treeline whitebark pine communities: Potential impacts from a non-native pathogen. Forests 2016, 7, 21. [Google Scholar] [CrossRef]
  14. Wang, H.; Shao, X.; Jiang, Y.; Fang, X.; Wu, S. The impacts of climate change on the radial growth of Pinus koraiensis along elevations of Changbai Mountain in northeastern China. For. Ecol. Manag. 2013, 289, 333–340. [Google Scholar] [CrossRef]
  15. Hao, Z.; Yu, D.; Yang, X.; Ding, Z. Analysis of plant community diversities and their gradient patterns on the northern slope of Changbai Mountain. Chin. J. Appl. Ecol. 2002, 7, 35–47. [Google Scholar]
  16. Zhang, J.; Chen, S.; Zhao, W. Regional Differences of Temperature Change in China in the Past 50 Years and Its Relationship with Global Climate Change. J. Arid Land Resour. Environ. 2006, 20, 1–6. (In Chinese) [Google Scholar]
  17. Jia, X.; Jin, H.; Zhao, Y.; Yin, H.; Liu, L.; Wang, C.; Cui, K.; Gu, X. Characteristics of Climate Change in Changbai Mountain from 1958 to 2015. J. Beihua Univ. (Nat. Sci.) 2017, 18, 727–731. [Google Scholar]
  18. Zhang, Y.J.; Dai, L.M.; Pan, J. The trend of tree line on the northern slope of Changbai Mountain. J. For. Res. 2001, 12, 97–100. (In Chinese) [Google Scholar]
  19. Fritts, H.C. Tree Rings and Climate; Academic Press: New York, NY, USA, 1976. [Google Scholar] [CrossRef]
  20. Wilson, R.; Wiles, G.; D’Arrigo, R.; Zweck, C. Cycles and Shifts: 1300 Years of Multi-Decadal Temperature Variability in the Gulf of Alaska. Clim. Dyn. 2007, 28, 425–440. [Google Scholar] [CrossRef]
  21. Mann, M.E.; Zhang, Z.; Rutherford, S. Global signatures and dynamical origins of the Little Ice Age and Medieval Climate Anomaly. Science 2009, 326, 1256. [Google Scholar] [CrossRef]
  22. Tian, Q.; Gou, X.H.; Zhang, Y.; Wang, Y.S.; Fan, Z. May–June mean temperature reconstruction over the past 300 years based on tree rings in the Qilian Mountains of the northeastern Tibetan plateau. IAWA J. 2009, 30, 421–434. [Google Scholar] [CrossRef]
  23. Cook, E.R.; Anchukaitis, K.J.; Buckley, B.M. Asian monsoon failure and mega drought during the last millennium. Science 2010, 328, 486–489. [Google Scholar] [CrossRef] [PubMed]
  24. Davi, N.; Jacoby, G.; Fang, K. Reconstructing drought variability for Mongolia based on a large-scale tree ring network: 1520–1993. J. Geophys. Res. Atmos. 2010, 115, 1842–1851. [Google Scholar] [CrossRef]
  25. Bao, G.Y.; Liu, Y.; Linderholm, H.W. April–September mean maximum temperature inferred from Hailar pine (Pinus sylvestris var. mongolica) tree rings in the Hulunbuir region, Inner Mongolia, back to 1868 AD. Palaeogeogr. Palaeoclimatol. Palaeoecol. 2012, 313, 162–172. [Google Scholar] [CrossRef]
  26. Wang, W.W.; Zhang, J.H.; Dai, G.H. Tree-ring based temperature variability in autumn over the past 240 years in Changbai Mountain. Chin. J. Ecol. 2012, 31, 787–793. (In Chinese) [Google Scholar]
  27. Wiles, G.C.; Solomina, O.; D’Arrigo, R.; Anchukaitis, K.J.; Gensiarovsky, Y.V.; Wiesenberg, N. Reconstructed summer temperatures over the last 400 years based on larch ring widths: Sakhalin Island, Russian Far East. Clim. Dyn. 2015, 45, 397–405. [Google Scholar] [CrossRef]
  28. Shi, S.; Li, J.; Shi, J.; Zhao, Y.; Huang, G. Three centuries of winter temperature change on the southeastern Tibetan Plateau and its relationship with the Atlantic Multidecadal Oscillation. Clim. Dyn. 2016, 52, 1533–1545. [Google Scholar] [CrossRef]
  29. Cai, Q.; Liu, Y. Two centuries temperature variations over subtrop-ical southeast China inferred from Pinus taiwanensis Hayata tree-ring width. Clim. Dyn. 2017, 48, 1813–1825. [Google Scholar] [CrossRef]
  30. Cai, Q.; Liu, Y.; Duan, B.; Sun, C. Regional difference of the start time of the recent warming in Eastern China: Prompted by a 165-year temperature record deduced from tree rings in the Dabie Mountains. Clim. Dyn. 2018, 50, 2157–2168. [Google Scholar] [CrossRef]
  31. Wang, Y.; Liu, Y.; Zhang, H.; Wang, H.; Guo, J. Temperature variability inferred from tree-ring records in Weichang region, China, and its teleconnection with large-scale climate forcing. Clim. Dyn. 2019, 52, 1533–1545. [Google Scholar] [CrossRef]
  32. Zhu, H.F.; Fang, X.Q.; Shao, X.M. Tree ring-based February–April temperature reconstruction for Changbai Mountain in Northeast China and its implication for East Asian winter monsoon. Clim. Past Discuss. 2009, 5, 661–666. [Google Scholar] [CrossRef]
  33. Zhu, L.; Li, S.; Wang, X. Tree-ring reconstruction of February-March mean minimum temperature back to 1790 AD in Yichun, Northeast China. Quat. Sci. 2015, 35, 1175–1184. (In Chinese) [Google Scholar]
  34. Holmes, R.L. Computer-Assisted Quality Control in Tree-Ring Dating and Measurement. Tree-Ring Bull. 1983, 44, 69–75. [Google Scholar] [CrossRef]
  35. Cook, E.R.; Kairiukstis, L.A. (Eds.) Methods of Dendrochronology: Applications in the Environmental Science; Kluwer Academic Publishers: Dordrecht, The Netherlands; International Institute for Applied Systems Analysis: Dordrecht, The Netherlands, 1990. [Google Scholar]
  36. Buras, A.; Zang, C.; Menzel, A. Testing the stability of transfer functions. Dendrochronologia 2017, 42, 56–62. [Google Scholar] [CrossRef]
  37. Trapletti, A.; Hornik, K. T Series: Time Series Analysis and Computational Finance, R package version 0.10-46; R Foundation for Statistical Computer: Vienna, Austria, 2018. [Google Scholar]
  38. Biondi, F.; Waikul, K. DENDROCLIM2002: A C++ program for statistical calibration of climate signals in tree-ring chronologies. Comput. Geosci. 2004, 30, 303–311. [Google Scholar] [CrossRef]
  39. Cook, E.R.; Meko, D.M.; Stahle, D.W.; Cleavel, M.K. Drought reconstructions for the continental United States. J. Clim. 1999, 12, 1145–1162. [Google Scholar] [CrossRef]
  40. Mann, M.E.; Lees, J.M. Robust estimation of background noise and signal detection in climatic time series. Clim. Chang. 1996, 33, 409–445. [Google Scholar] [CrossRef]
  41. Wen, K.G. China Meteorological Disaster in Jilin Province; China Meteorological Press: Beijing, China, 2008. (In Chinese) [Google Scholar]
  42. Oberhuber, W.; Kofler, W.; Pfeifer, K.; Seeber, A.; Gruber, A.; Wieser, G. Long-term changes in tree-ring–climate relationships at Mt. Patscherkofel (Tyrol, Austria) since the mid-1980s. Trees 2008, 22, 31–40. [Google Scholar] [CrossRef] [PubMed]
  43. Carrer, M.; Nola, P.; Motta, R. Contrasting tree-ring growth to climate responses of Abies alba toward the southern limit of its distribution area. Oikos 2010, 119, 1515–1525. [Google Scholar] [CrossRef]
  44. Wang, X.M.; Zhao, X.H.; Gao, L.S. Climatic response of Betula ermanii along an altitudinal gradient in the northern slope of Changbai Mountain, China. Dendrobiology 2013, 70, 99–107. [Google Scholar] [CrossRef]
  45. Zhang, T.; Yuan, Y.; Wei, W.; Yu, S.; Zhang, R.; Shang, H.; Chen, F.; Fan, Z.; Qin, L. Tree-ring-based temperature reconstruction for the northern Greater Higgnan Mountains, China, since A.D. 1717. Int. J. Climatol. 2013, 33, 422–429. [Google Scholar] [CrossRef]
  46. Su, H.; Axmacher, J.C.; Yang, B.; Sang, W. Differential radial growth response of three coexisting dominant tree species to local and large-scale climate variability in a subtropical evergreen broad-leaved forest of China. Ecol. Res. 2015, 30, 745–754. [Google Scholar] [CrossRef]
  47. Buma, B.; Hennon, P.E.; Harrington, C.A.; Popkin, J.R.; Krapek, J.; Lamb, M.S.; Oakes, L.E.; Saunders, S.; Zeglen, S. Emerging climate-driven disturbance processes: Widespread mortality associated with snow-to-rain transitions across 10° of latitude and half the range of a climate-threatened conifer. Glob. Chang. Biol. 2017, 23, 2903–2914. [Google Scholar] [CrossRef] [PubMed]
  48. Lean, J.; Rind, D. Evaluating sun–climate relationships since the Little Ice Age. J. Atmos. Sol. Terr. Phys. 1999, 61, 25–36. [Google Scholar] [CrossRef]
  49. Beer, J.; Mende, W.; Stellmacher, R. The role of the sun in climatic forcing. Quat. Sci. Rev. 2000, 19, 403–415. [Google Scholar] [CrossRef]
  50. Christiansen, B.; Ljungqvist, F.C. The extra-tropical Northern Hemisphere temperature in the last two millennia: Reconstructions of low-frequency variability. Clim. Past 2012, 8, 765–786. [Google Scholar] [CrossRef]
  51. Wagner, S.; Zorita, E. The influence of volcanic, solar and CO2 forcing on the temperatures in the Dalton Minimum (1790–1830): A model study. Clim. Dyn. 2005, 25, 205–218. [Google Scholar] [CrossRef]
  52. Ljungqvist, F.C. A new reconstruction of temperature variability in the extra-tropical northern hemisphere during the last two millennia. Geogr. Ann. Ser. A Phys. Geogr. 2010, 92, 339–351. [Google Scholar] [CrossRef]
  53. Zharkova, V.V.; Shepherd, S.J.; Popova, E.; Zharkov, S. Reinforcing a Double Dynamo Model with Solar-Terrestrial Activity in the Past Three Millennia. Proc. Int. Astron. Union 2017, 13, 211–215. [Google Scholar] [CrossRef]
  54. Friis-Christensen, E. Solar activity variations and global temperature. Energy 1993, 18, 1273–1284. [Google Scholar] [CrossRef]
  55. Ogurtsov, M.G.; Nagovitsyn, Y.A.; Kocharov, G.E.; Jungner, H. Long-period cycles of the Sun’s activity recorded in direct solar data and proxies. Sol. Phys. 2002, 211, 371–394. [Google Scholar] [CrossRef]
  56. Yi, L.; Yu, H.; Ge, J.; Lai, Z.; Xu, X.; Qin, L.; Peng, S. Reconstructions of annual summer precipitation and temperature in north-central China since 1470 AD based on drought/flood index and tree-ring records. Clim. Chang. 2012, 110, 469–498. [Google Scholar] [CrossRef]
  57. Auer, G.; Piller, W.E.; Harzhauser, M. Two distinct decadal and centennial cyclicities forced marine upwelling intensity and precipitation during the late Early Miocene in central Europe. Clim. Past Discuss. 2014, 10, 1223–1264. [Google Scholar] [CrossRef]
  58. Wang, Y.; Liu, Y. Reconstruction of March–June precipitation from tree rings in central Liaoning, China. Clim. Dyn. 2016, 49, 3111–3121. [Google Scholar] [CrossRef]
  59. Herrera, V.M.V.; Mendoza, B.; Herrera, G.V. Reconstruction and prediction of the total solar irradiance: From the Medieval Warm Period to the 21st century. New Astron. 2015, 34, 221–233. [Google Scholar] [CrossRef]
  60. Su, M.F.; Wang, H.J. Relationship and its instability of ENSO—Chinese variations in droughts and wet spells. Sci. China Ser. D 2007, 50, 145–152. [Google Scholar] [CrossRef]
  61. Hocke, K. QBO in solar wind speed and its relation to ENSO. J. Atmos. Sol.-Terr. Phys. 2009, 71, 216–220. [Google Scholar] [CrossRef]
  62. Gergis, J.L.; Fowler, A.M. A history of ENSO events since A.D. 1525: Implications for future climate change. Clim. Chang. 2009, 92, 343–387. [Google Scholar] [CrossRef]
  63. Wu, R.; Wang, B.A. Contrast of the East Asian Summer Monsoon-ENSO Relationship between 1962–77 and 1978–93. J. Clim. 2002, 15, 3266–3279. [Google Scholar] [CrossRef]
  64. Lu, R.Y. Interannual variation of North China rainfall in rainy season and SSTs in the equatorial eastern Pacific. Chin. Sci. Bull. 2005, 50, 2069–2073. [Google Scholar] [CrossRef]
  65. Li, C.Y. Interaction between anomalous winter monsoon in East Asia and El Nio events. Adv. Atmos. Sci. 1990, 7, 36–46. [Google Scholar] [CrossRef]
  66. Wen, C.; Lan, X.Q.; Lin, W.; Yin, M. The combined effects of the ENSO and the Arctic Oscillation on the winter climate anomalies in East Asia. Sci. Bull. 2013, 58, 1355–1362. [Google Scholar]
  67. Lu, R.; Jia, F.; Gao, S.; Shang, Y.; Chen, Y. Tree-ring reconstruction of January–March minimum temperatures since 1804 on Hasi Mountain, northwestern China. J. Arid Environ. 2016, 127, 66–73. [Google Scholar] [CrossRef]
  68. Sun, L.H.; Zhao, Z.G. China’s warm winter and its causes. Meteorological 2004, 30, 57–60. (In Chinese) [Google Scholar]
  69. Chen, W. The impacts of El Niño and La Niña on the cycle of East Asian winter and summer monsoon. Chin. J. Atmos. Sci. 2002, 26, 595–610. [Google Scholar] [CrossRef]
  70. Shao, X.; Wu, X. Reconstruction of climate change on Changbai Mountain, Northeast China using tree-ring data. Quat. Sci. 1997, 1, 76–85. (In Chinese) [Google Scholar]
Figure 1. (a) Map showing the sampling site and meteorological stations in the Changbai Mountain (CBM) region; (b) Map showing the sampling site of Changbai Mountain (CBM), and February–March temperature (Zhu et al., 2015 [33]) in Yichun (YC).
Forests 15 00220 g001
Figure 2. (a) Monthly total precipitation (in mm); (b) Monthly mean minimum temperature (Tmin); (c) Monthly mean temperature (Tm) and (d) Monthly mean maximum temperature (Tmax) during AD 1960–2005.
Forests 15 00220 g002
Figure 3. Variations of the STD chronology (a) and sample depth (b) of the STD from AD 1767 to 2005.
Forests 15 00220 g003
Figure 4. Correlations between the tree ring-width index and (a) monthly mean maximum temperature, mean temperature, mean minimum temperature, total precipitation and (b) Palmer Drought Severity Index (PDSI) from CBM during 1960–2005. The dashed horizontal line represents the 95% confidence limit; (c) Moving correlation function coefficients calculated between the tree-ring width indices and monthly mean maximum temperature from December of the previous year to January of the current year (T12-1).
Forests 15 00220 g004
Figure 5. (a) Observed (black line) and reconstructed (blue line)monthly mean maximum temperature from December of the previous year to January of the current year (T12-1) for the common period of 1960–2005; (b) SW: Shapiro–Wilk residuals are normally distributed; (c) DW: Durbin–Watson test for residuals autocorrelation; (d) reconstruction of temperature in CBM for the last 219 years, the smoothed redline is the 11-year moving average, and blue dots represent the cold years which were recorded in historical archives in Jilin Province and Inner Mongolia (Wen, 2008 [41]).
Forests 15 00220 g005
Figure 6. The power spectrum analyses of reconstructed previous December–January mean maximum temperature. The 99% confidence limits for peaks in the power spectrum are indicated by the dash lines. The letter “a” stands for year.
Forests 15 00220 g006
Figure 7. Comparison of December–January maximum temperature (T12-1) reconstruction between (a) this study and (b) February–March mean minimum temperature reconstruction by Zhu et al., 2015 [33]. The light/dark grey shaded areas represent years with the same temperature; trend between different series. The red line shows the period of the Dalton Minimum.
Forests 15 00220 g007
Figure 8. Cross-wavelet transform of the reconstructed series of the Changbai Mountain region with (A) SOI index, (B) sunspot number. The 95% confidence is shown as a thick contour. The relative phase relationship is shown as arrows (with antiphase pointing left, in-phase pointing right).
Forests 15 00220 g008
Figure 9. Spatial correlation for the reconstruction with previous December–January averaged HadlSST11° SST during the period of 1870–2005. The red asterisk is the sampling position.
Forests 15 00220 g009
Figure 10. Comparison of December–January maximum temperature (T12-1) reconstruction between (a) this study (Elevation: 1950–2000 m a.s.l.); (b) February–April temperature reconstruction by Zhu et al., 2009 [32] (Elevation: 765–1188 m a.s.l.) and (c) January–April temperature reconstruction by Shao and Wu, 1997 [70] (Elevation: 650 m a.s.l.).
Forests 15 00220 g010
Table 1. Major statistical characteristics for the standard (STD) chronology of Betula ermanii (BE) in the Changbai Mountain (CBM) region.
StatisticSTD
Mean sensitivity0.33
First-order autocorrelation0.68
Standard deviation0.21
Mean ring width (mm)0.67
Number of trees/cores30/55
% Missing rings0.25
Mean correlation within trees0.70
Signal-to-noise ratio (SNR)10.3
Mean ring width (mm)0.66
First year where SSS > 0.85 (number of trees)1787 (7)
Table 2. Correlation coefficients between the standard chronology and the climate data of different month combinations during the common period of 1960–2005. Months are given as follows: p12–c1: previous December to current January; p9–p12: previous September to December; p9–p10: previous September to October; p9–p11: previous September to November; p10–p11: previous October to November; p11–p12: previous November to December.
MonthsTmaxTmeanTminPrePDSI
p12–c1−0.60 *−0.52 *−0.40 *0.16 *0.39 *
p9–p12−0.17−0.18−0.170.37 *0.49 *
p9–p10−0.020.010.020.33 *0.25
p9–p11−0.10−0.07−0.040.36 *0.42 *
p10–p11−0.15−0.11−0.070.37 *0.44 *
p11–p12−0.31 *−0.36 *−0.37 *0.41 *0.53 *
* Statistically significant at the p < 0.05 level.
Table 3. Statistics of calibration and verification tests for the common period of 1960–2005.
CalibrationVerification
Time SpanrR2Time SpanrRECESTPMTDWRMSE
1960–1982−0.57 a0.32 a1983–2005−0.64 a0.30 a0.19 a(17+/6−) a2.6 a1.90.75
1983–2005−0.64 a0.41 a1960–1982−0.57 a0.23 a0.26 a(17+/5−) a3.3 a1.820.72
1960–2005−0.60 a0.36 a 0.27 a 3.5 a1.810.70
a Statistically significant at the p < 0.05 level.
Table 4. Years of extremely high (−10.73 °C) and low (−12.61 °C) reconstructed mean maximum temperatures from December of the previous year to January of the current year (T12-1) from most extreme to least and cold damage events recorded in historical archives in Jilin Province and Inner Mongolia since 1787 (Wen, 2008 [41]).
Recorded Events in Historical DocumentsCold YearTemperature (°C)Warm YearTemperature (°C)
1840−14.381794−9.19
1832−14.201860−9.41
1824−13.771862−9.43
1977−13.571793−9.44
1984−13.501998−9.51
1834−13.481891−9.58
1966−13.471796−9.59
1830−13.351845−9.91
1837−13.281791−9.94
1826−13.271795−9.98
1929−13.271921−9.98
(1969 AD) Jilin Province: Severe low temperatures occurred throughout the province in this year1969−13.261789−10.02
1974−13.151822−10.16
1813−13.121849−10.18
1801−13.121895−10.19
1961−13.112004−10.24
1815−13.101989−10.26
(1965 AD) Inner Mongolia: snow occurred in eastern Inner Mongolia in winter, such as Hulunbuir, Hinggan League, Tongliao, etc.1965−12.961890−10.31
1841−12.941844−10.32
(1954 AD) Jilin Province: Severe low temperatures occurred throughout the province in this year1954−12.941792−10.34
(1970 AD) Jilin Province: Heavy snow occurred in the Hailong area in December1970−12.931859−10.42
(1911 AD) Jilin Province: Severe low temperatures occurred throughout the province in this year1911−12.901788−10.46
(1972 AD) Jilin Province: Severe low temperatures occurred throughout the province in this year1972−12.891872−10.47
1915−12.831877−10.48
1967−12.802003−10.49
1842−12.791797−10.49
1874−12.791848−10.49
1962−12.731884−10.50
(1940 AD) Jilin Province: Heavy snow occurred in the Baicheng area in December1940−12.731896−10.53
1808−12.721846−10.54
1930−12.711889−10.55
1798−10.62
1913−10.62
1821−10.62
1871−10.69
1935−10.71
Disclaimer/Publisher’s Note: The statements, opinions and data contained in all publications are solely those of the individual author(s) and contributor(s) and not of MDPI and/or the editor(s). MDPI and/or the editor(s) disclaim responsibility for any injury to people or property resulting from any ideas, methods, instructions or products referred to in the content.

