Article

Growth Response of Pinus tabuliformis and Abies fargesii to Climate Factors in Southern Slope of Central Qinling Mountains of China

1
Shaanxi Experimental Center of Geological Survey, Shaanxi Institute of Geological Survey, Xi’an 710065, China
2
Shaanxi Key Laboratory of Disaster Monitoring and Mechanism Simulating, College of Geography and Environment, Baoji University of Arts and Sciences, Baoji 721013, China
3
State Key Laboratory of Loess and Quaternary Geology, Institute of Earth Environment, Chinese Academy of Sciences, Xi’an 710061, China
4
College of Bioscience and Engineering, Xingtai University, Xingtai 054001, China
*
Author to whom correspondence should be addressed.
Forests 2025, 16(2), 232; https://doi.org/10.3390/f16020232
Submission received: 18 December 2024 / Revised: 20 January 2025 / Accepted: 23 January 2025 / Published: 25 January 2025

Abstract

:
The response of trees to climate is crucial for the health assessment and protection of forests in alpine regions. Based on samples of Pinus tabuliformis and Abies fargesii, two typical evergreen coniferous species with distinct elevation differences in the vertical vegetation zones of the Qinling Mountains, we have developed two tree-ring width chronologies for the southern slope of the central Qinling Mountains in central China. The correlation analysis results showed that the radial growth of P. tabuliformis and A. fargesii responded to different climatic factors. Water stress caused by temperature in May of the current year was the main limiting factor for radial growth of P. tabuliformis, while precipitation in September of the previous year and the current year had a negative impact on A. fargesii, with lag effects of temperature and precipitation during the previous growing season. Spatial correlation and comparative analysis indicated that the P. tabuliformis chronology responded to extreme dry and wet events on a regional scale. Interannual and multidecadal periodic signals recorded by tree rings suggested that the hydrological and climatic changes on the southern slope of the central Qinling Mountains were teleconnected with the Pacific and Atlantic Oceans, including El Niño-Southern Oscillation (ENSO), Pacific Decadal Oscillation (PDO), and North Atlantic Oscillation (NAO). Our results provide new evidence for a hydroclimatical response study inferred from tree rings on the southern slope of the central Qinling Mountains.

1. Introduction

The Qinling Mountains are located in the central part of China, serving as the geographical dividing line between the north and south of China, as well as the boundary between the subtropical and warm temperate zones and the humid and semi-humid climate zones [1,2]; they are highly sensitive to climate change [3,4]. Amidst the background of global warming in the 21st century, climate changes and their potential impacts on the Qinling Mountains and surrounding areas have attracted much attention [5,6]. As a primary research method for global change, tree rings play a significant role in historical climate change due to their precise high-resolution dating, extensive geographical distribution, and sampling collection [7]. Studies of climate change in the Qinling Mountains using tree rings have yielded valuable results. For instance, research results from the eastern part of the Qinling Mountains, Mount Hua, indicate that temperature in April and precipitation from April to July are the main limiting factors for the radial growth of Pinus armandii and are closely related to the temperature in June [8]. Then, the precipitation from April to July for Mount Hua was reconstructed, and the results were comparatively analyzed [9,10]. Studies on the differences in the response of tree growth of P. tabuliformis to climatic factors over the Qinling Mountains show that the radial growth of trees on the north slope record temperature changes during the early summer growing season, i.e., from May to July, while trees on the south slope significantly respond to temperature changes in the winter half-year, i.e., from the previous September to the current April [11]. Previous studies have found differences in the radial growth of A. fargesii at different altitudes on the southern and northern slopes of the Qinling Mountains [12,13]. Early spring to summer temperatures are the main limiting factors for the radial growth of A. fargesii at middle and low altitudes, while summer precipitation affects the growth of trees at high altitudes [12]. The responses of A. fargesii to climatic factors are also related to the ages of trees [14].
Therefore, the history of the average temperature variability from January to July in the central watershed area of the Qinling Mountains over the past 200 years was reconstructed [15]. The responses of trees growing at high altitudes in the Qinling Mountains to temperature and precipitation could cover the Guanzhong area of Shaanxi Province and have the ability to represent climate changes over a larger area [16,17]. Based on tree-ring width and density indicators, the streamflow of the Weihe River on the north slope of the Qinling Mountains over the past 400 years was reconstructed, revealing the interannual and interdecadal hydrological variability and its teleconnections with remote oceans such as the Pacific, Indian, and Atlantic Oceans [18,19]. The above studies indicate that tree-ring data are an effective way to study and restore the environmental evolution and climate change in the Qinling Mountains. However, the Qinling Mountains span a large area from east to west, and the terrain from north to south is complex and diverse [20,21]. Especially in the central part of the Qinling Mountains, where the highest peak of Mount Taibai is located, there are obviously local climate conditions [22].
P. tabuliformis [23] and A. fargesii [24,25] are dominant tree species in the Qinling region, playing an important role in regional water conservation and biodiversity protection. They are also the main tree species for dendrochronological research in the Qinling region [11,12,13,14,18,19,23].
The patterns of tree radial growth to climatic factors in different tree species and different site environments are of great significance for the construction of the Qinling National Park and the management and protection of forests [26,27].
The objectives of this work are (1) to establish the tree-ring width chronologies of P. tabulaeformis and A. fargesii on the southern slope of the central Qinling Mountains; (2) to determine the response characteristics of the radial growth of the two tree species to climatic factors; and (3) to explore the regional representativeness of the new chronologies and possible atmospheric teleconnections. Our results could provide new evidence for the comprehensive multi-temporal and multi-spatial scale study of tree rings over the entire Qinling Mountains.

2. Materials and Methods
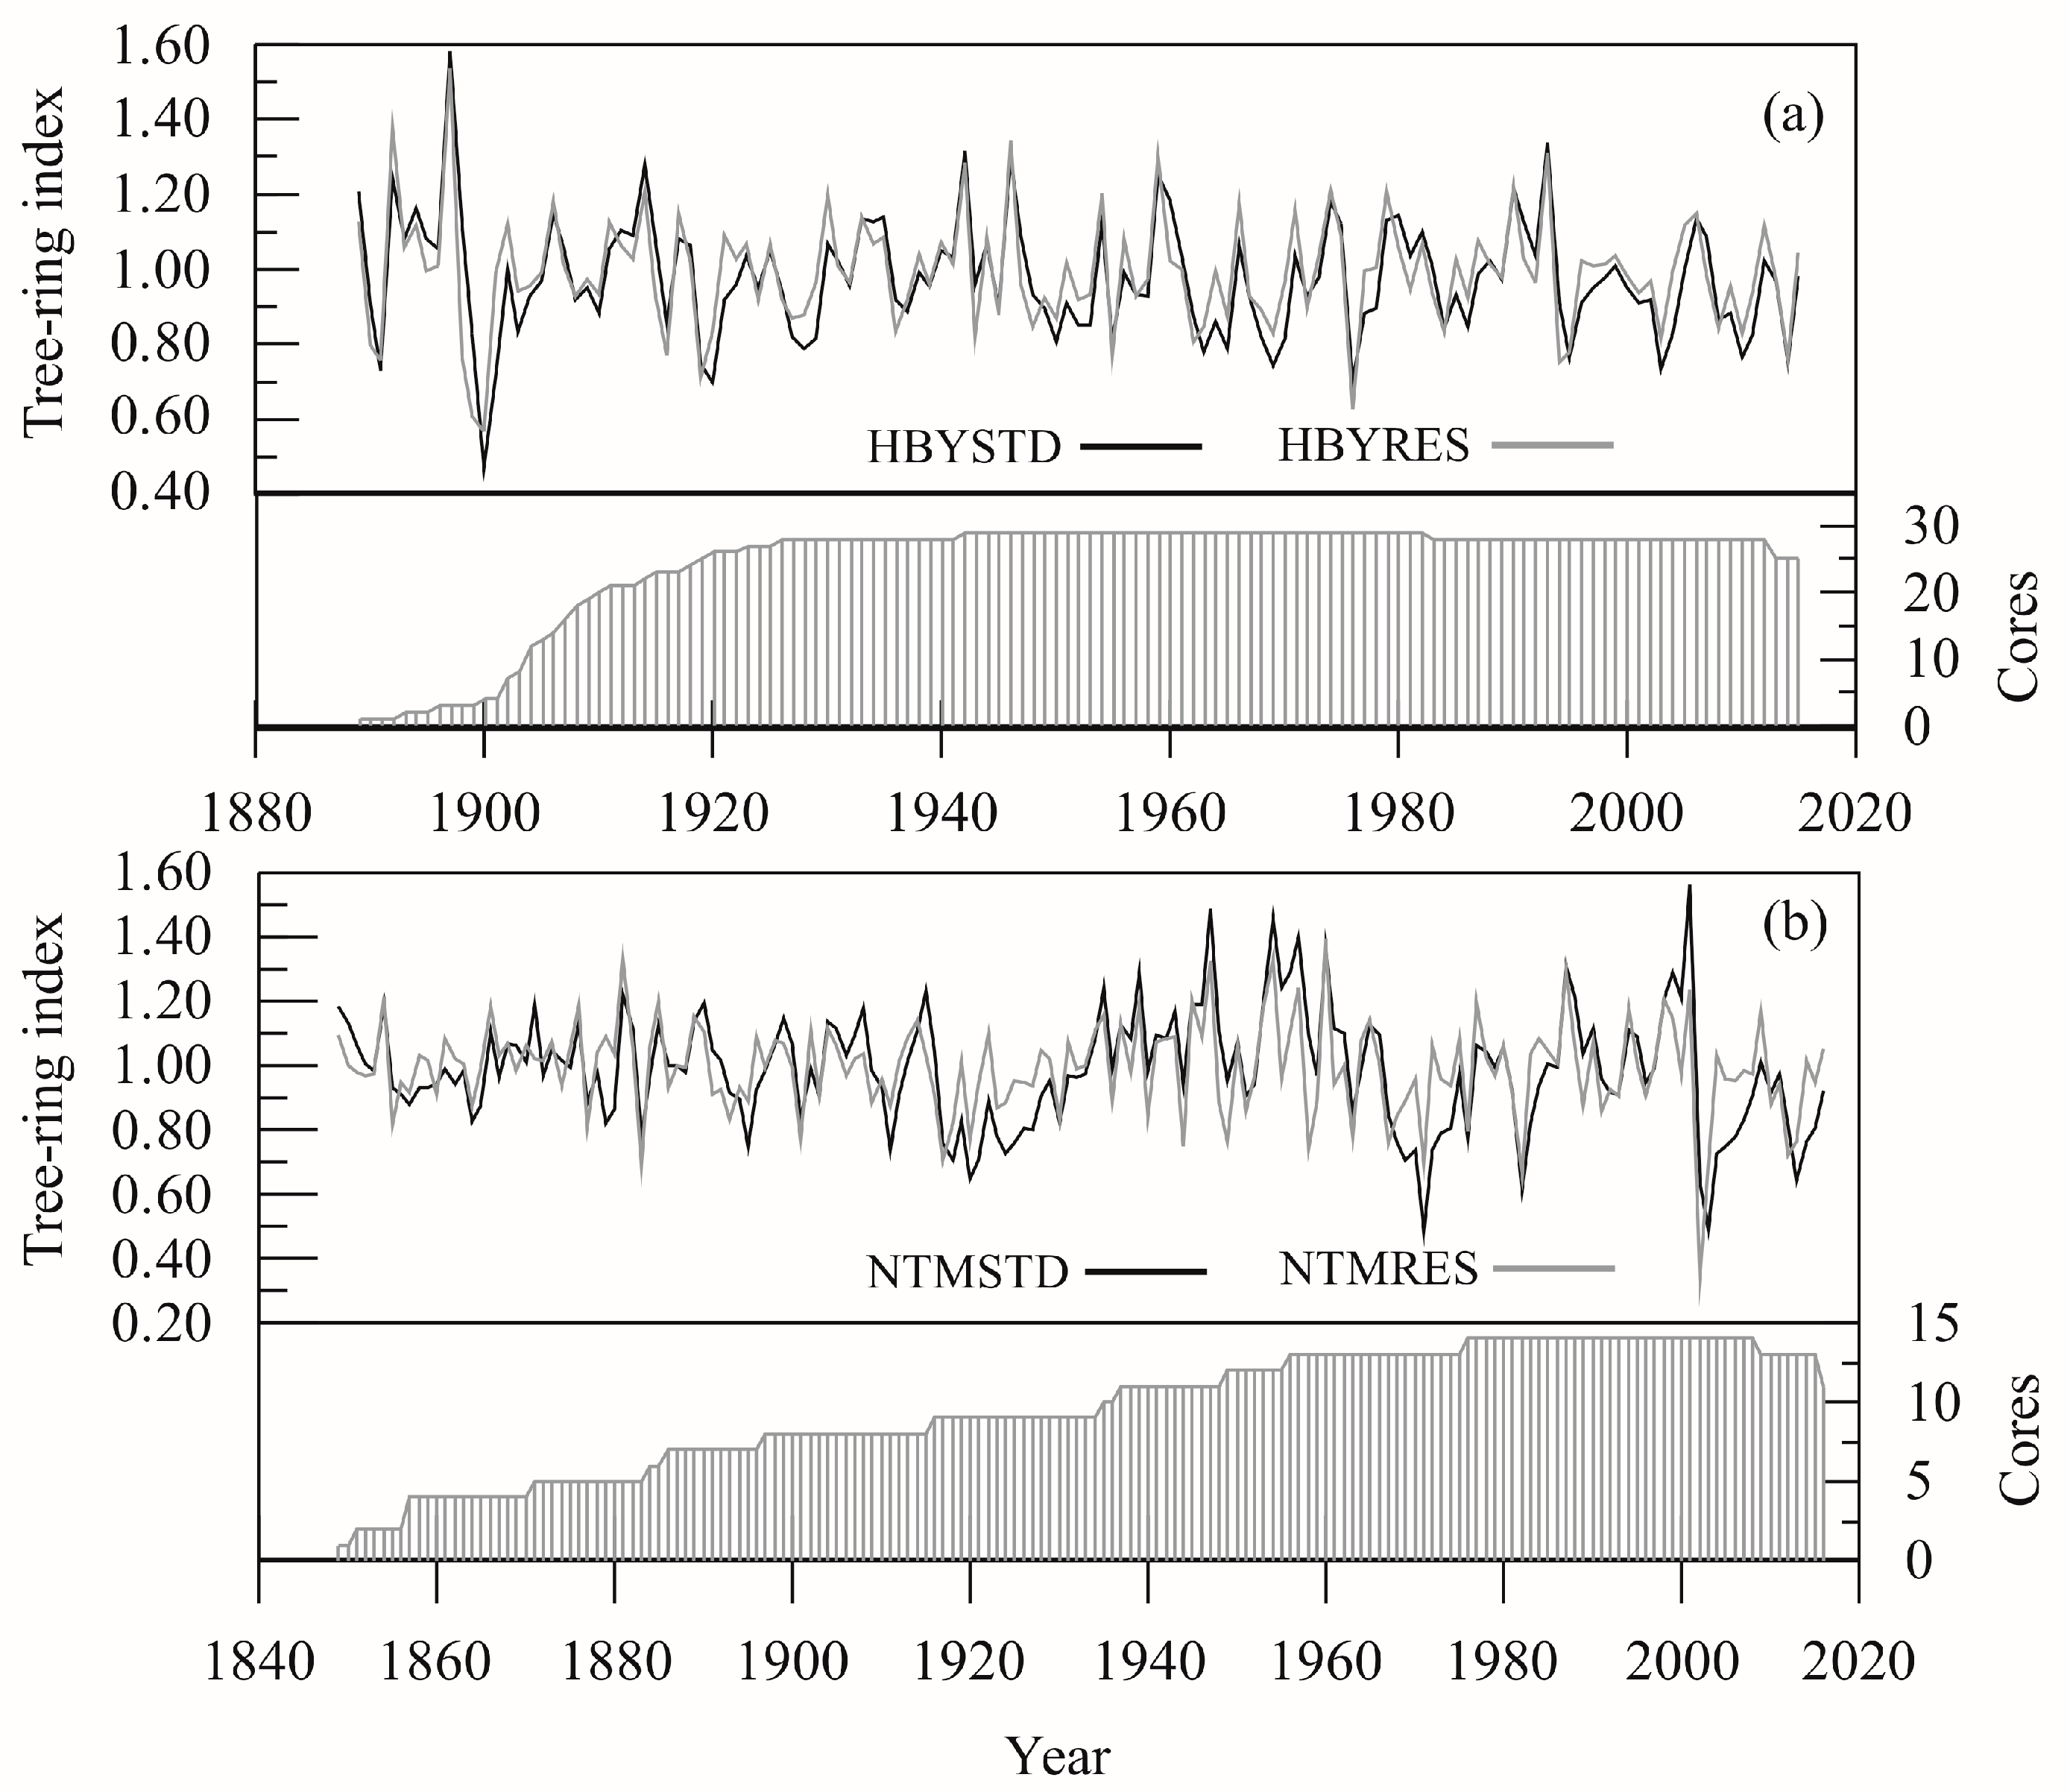
2.1. Tree-Ring Data

Sampling sites are located on the southern slope of the central Qinling Mountains at Huangbaiyuan (HBY, 107°40′ E, 33°48′ N, 1602 m above sea level) and Nantianmen on the southern slope of Taibai Mountain (NTM, 107°46′47.59″ E, 33°54′55.88″ N, 3063 m above sea level) (Figure 1). The former is P. tabuliformis, while the latter is A. fargesii. Both tree-ring sampling sites are located on flat slopes near cliffs and are pure forests. Tree-ring samples were collected using increment borers, and they were treated with fixation, air drying, and sandpaper polishing in the laboratory [28]. The Lintab 6 tree-ring station was used for measuring ring widths with a precision of 0.01 mm (www.rinntech.de) (Rinntech-Metriwerk GmbH & Co. KG, Heidelberg, Germany). The original data were cross-dated using COFECHA (Version 6.06) [29], and the ARSTAN (Arstan_41xp software program) [30] program was utilized to standardize ring-width series, thereby establishing a tree-ring chronology. This study employed negative exponential and linear fitting methods to remove growth trends caused by the genetic factors of the trees themselves and non-climatic growth trends caused by inter-tree competition. Each tree-ring series was divided by the dimensionless index obtained from the fitted curve, and a chronology was established using the biweight robust mean method; ultimately, two types of chronologies were established, i.e., standard chronology (STD) and residual chronology (RES) [30]. The HBY chronology includes 29 cores from 28 trees, while the NTM chronology includes 14 cores from 11 trees. The STD chronology retains a greater amount of low-frequency climatic signals after removing the growth trend-related tree ages, whereas the RES chronology retains a higher proportion of high-frequency signals after removing local environment impacts near trees and lagged effects from previous periods on current growth [30]. Studies have indicated that comparative analysis of multiple chronologies in semi-humid regions can provide more information on climate-growth responses [31]. The STD and RES chronologies were used for climate growth response analysis, and the tree-ring width index curves and sample depth are shown in Figure 2.
The HBY chronology spans 127 years, covering the period from 1889 to 2015, while the NTM chronology is 168 years, covering the interval from 1849 to 2016. The ranges of mean values and mean sensitivities of the chronologies are 0.976–0.993 and 0.133–0.180, respectively (Table 1). The values of the signal-to-noise ratio (SNR), the expressed population signal (EPS), and the variance of the first principal component are all lower in the standard chronology than in the residual chronology (Table 1) [30]. The EPS value 0.744 of HBYSTD is relatively low, but there is a significant correlation (r = 0.84, p < 0.01) between the HBYSTD and HBYRES chronologies (with an EPS 0.896 for HBYRES). Especially during the period from 1902 to 2014, both HBYSTD and HBYRES show a highly consistent pattern of variation (Figure 2). The subsequent correlation analysis is also based on a sufficient sample size. Therefore, to ensure the reliability of the analysis, a minimum of 5 cores was selected as the threshold [32], resulting in effective chronologies for HBY from 1902 to 2015 and for NTM from 1871 to 2016.

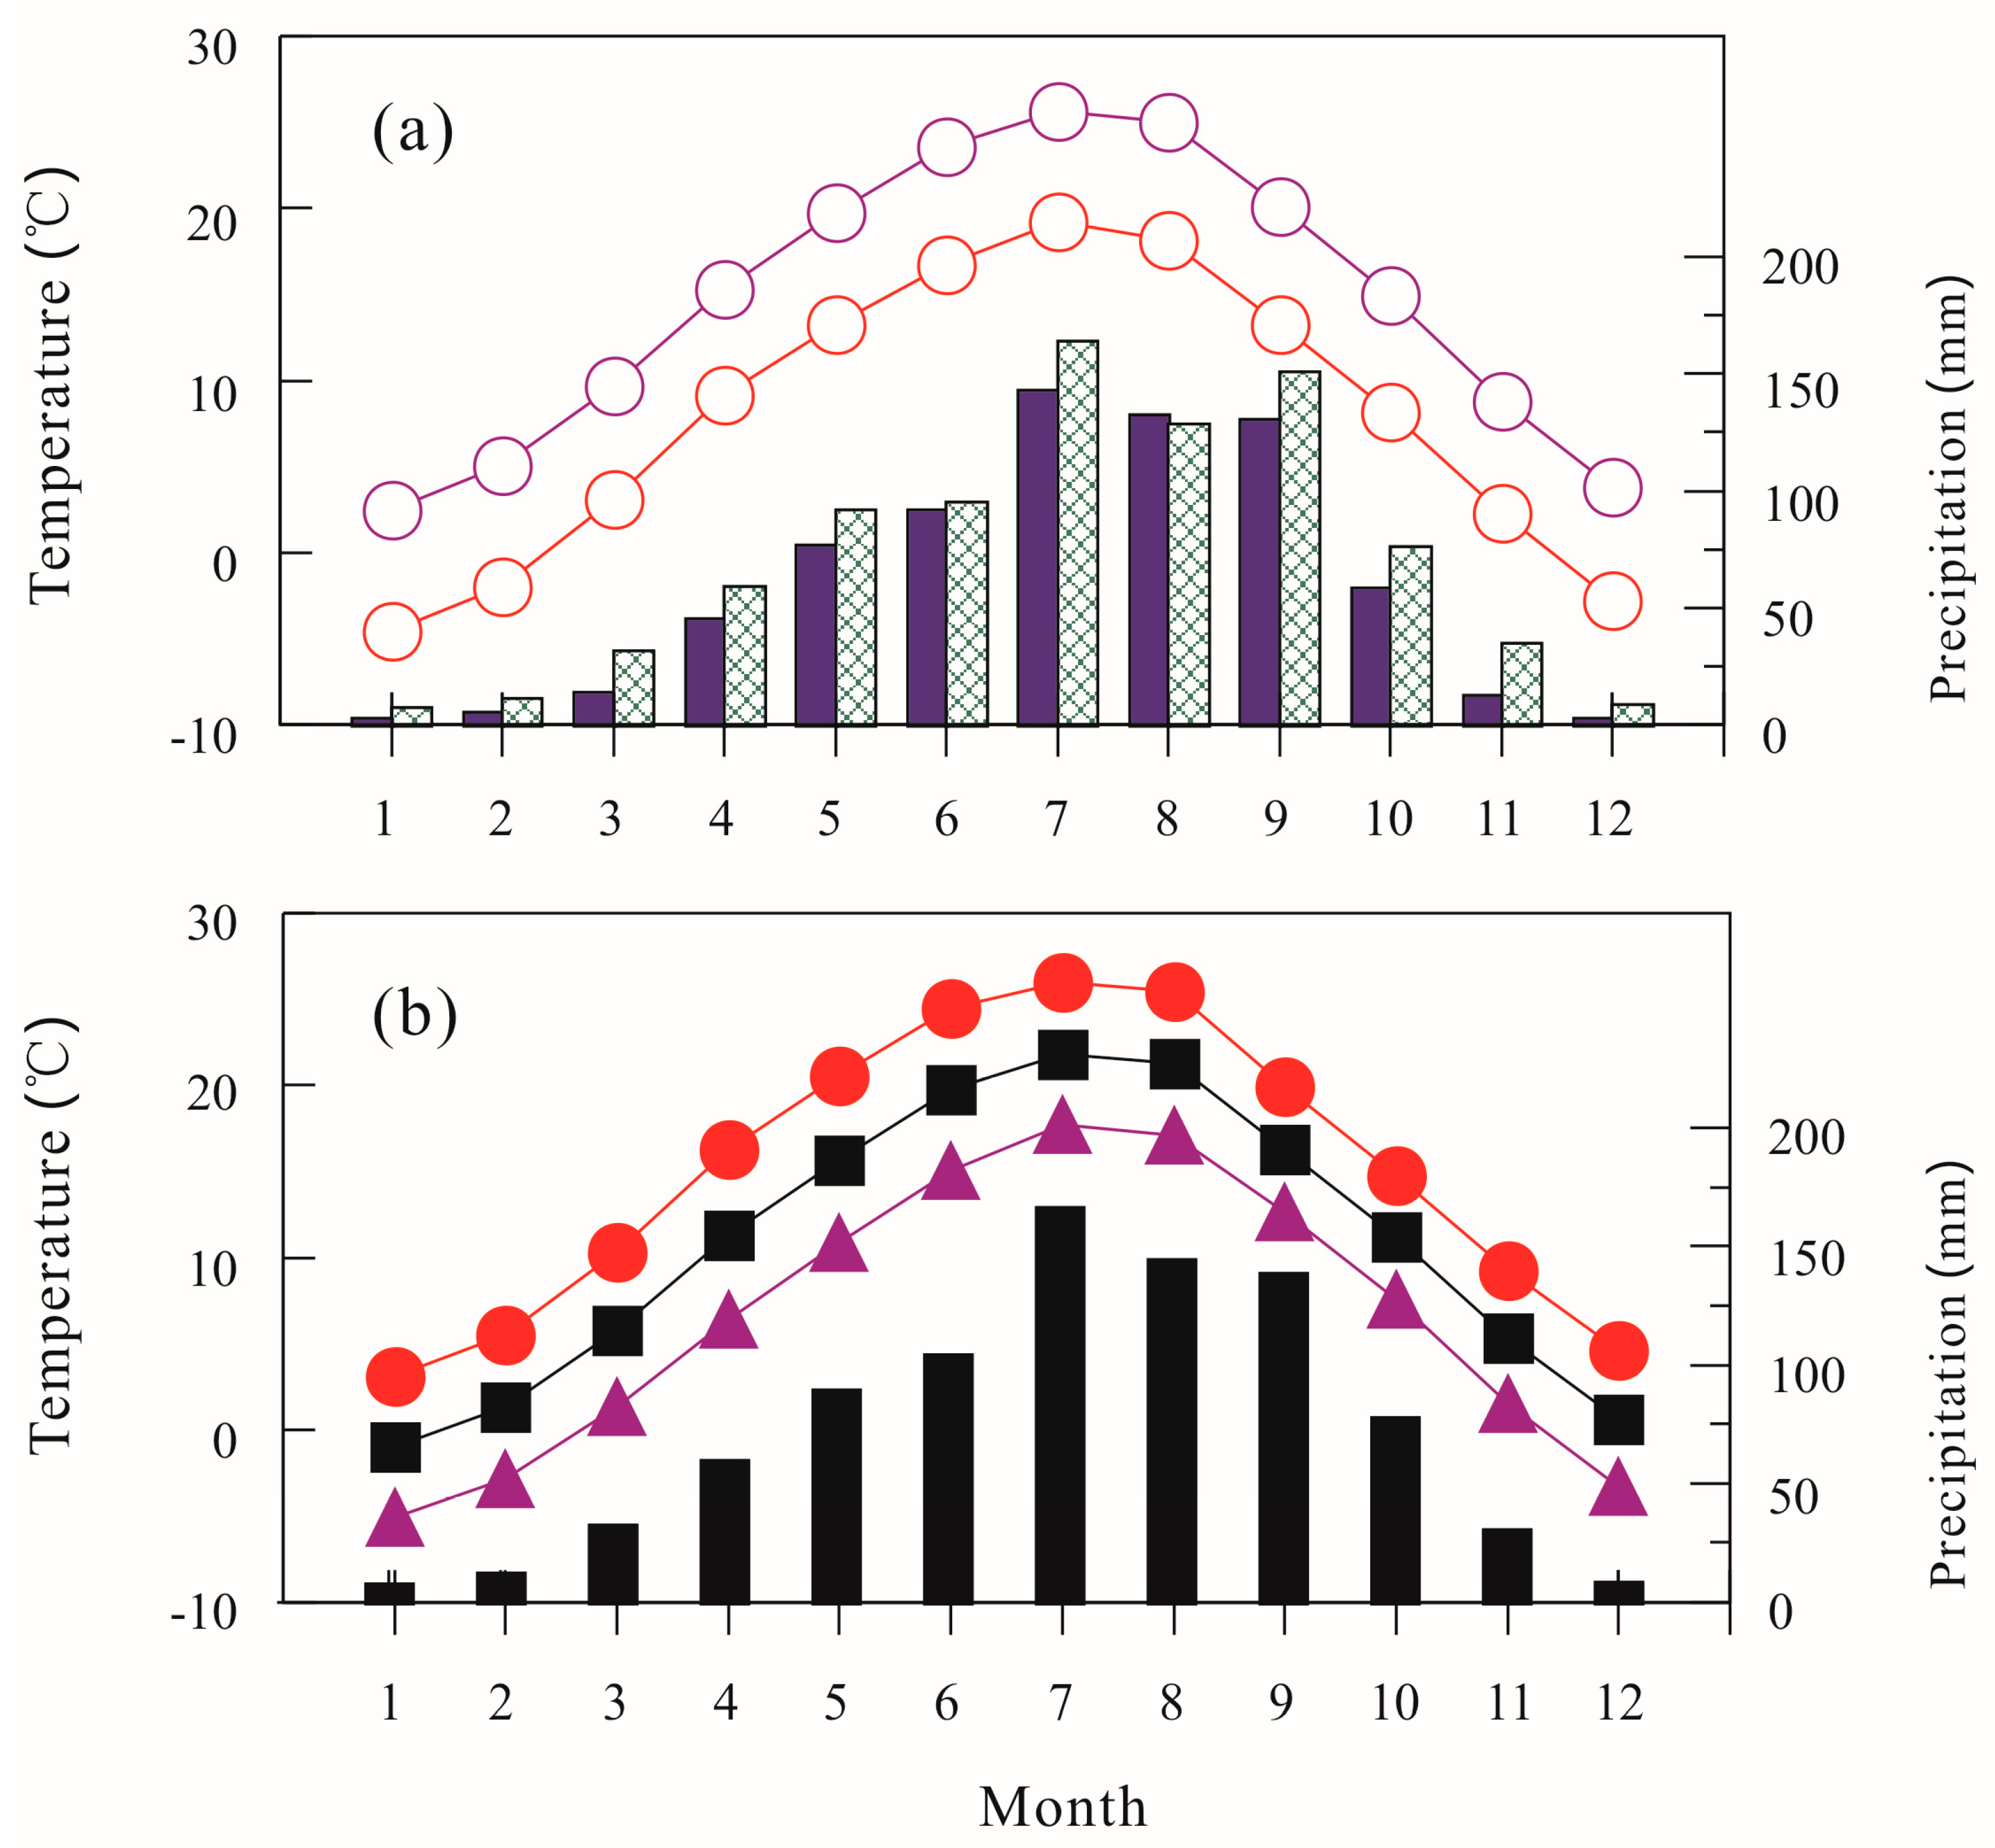
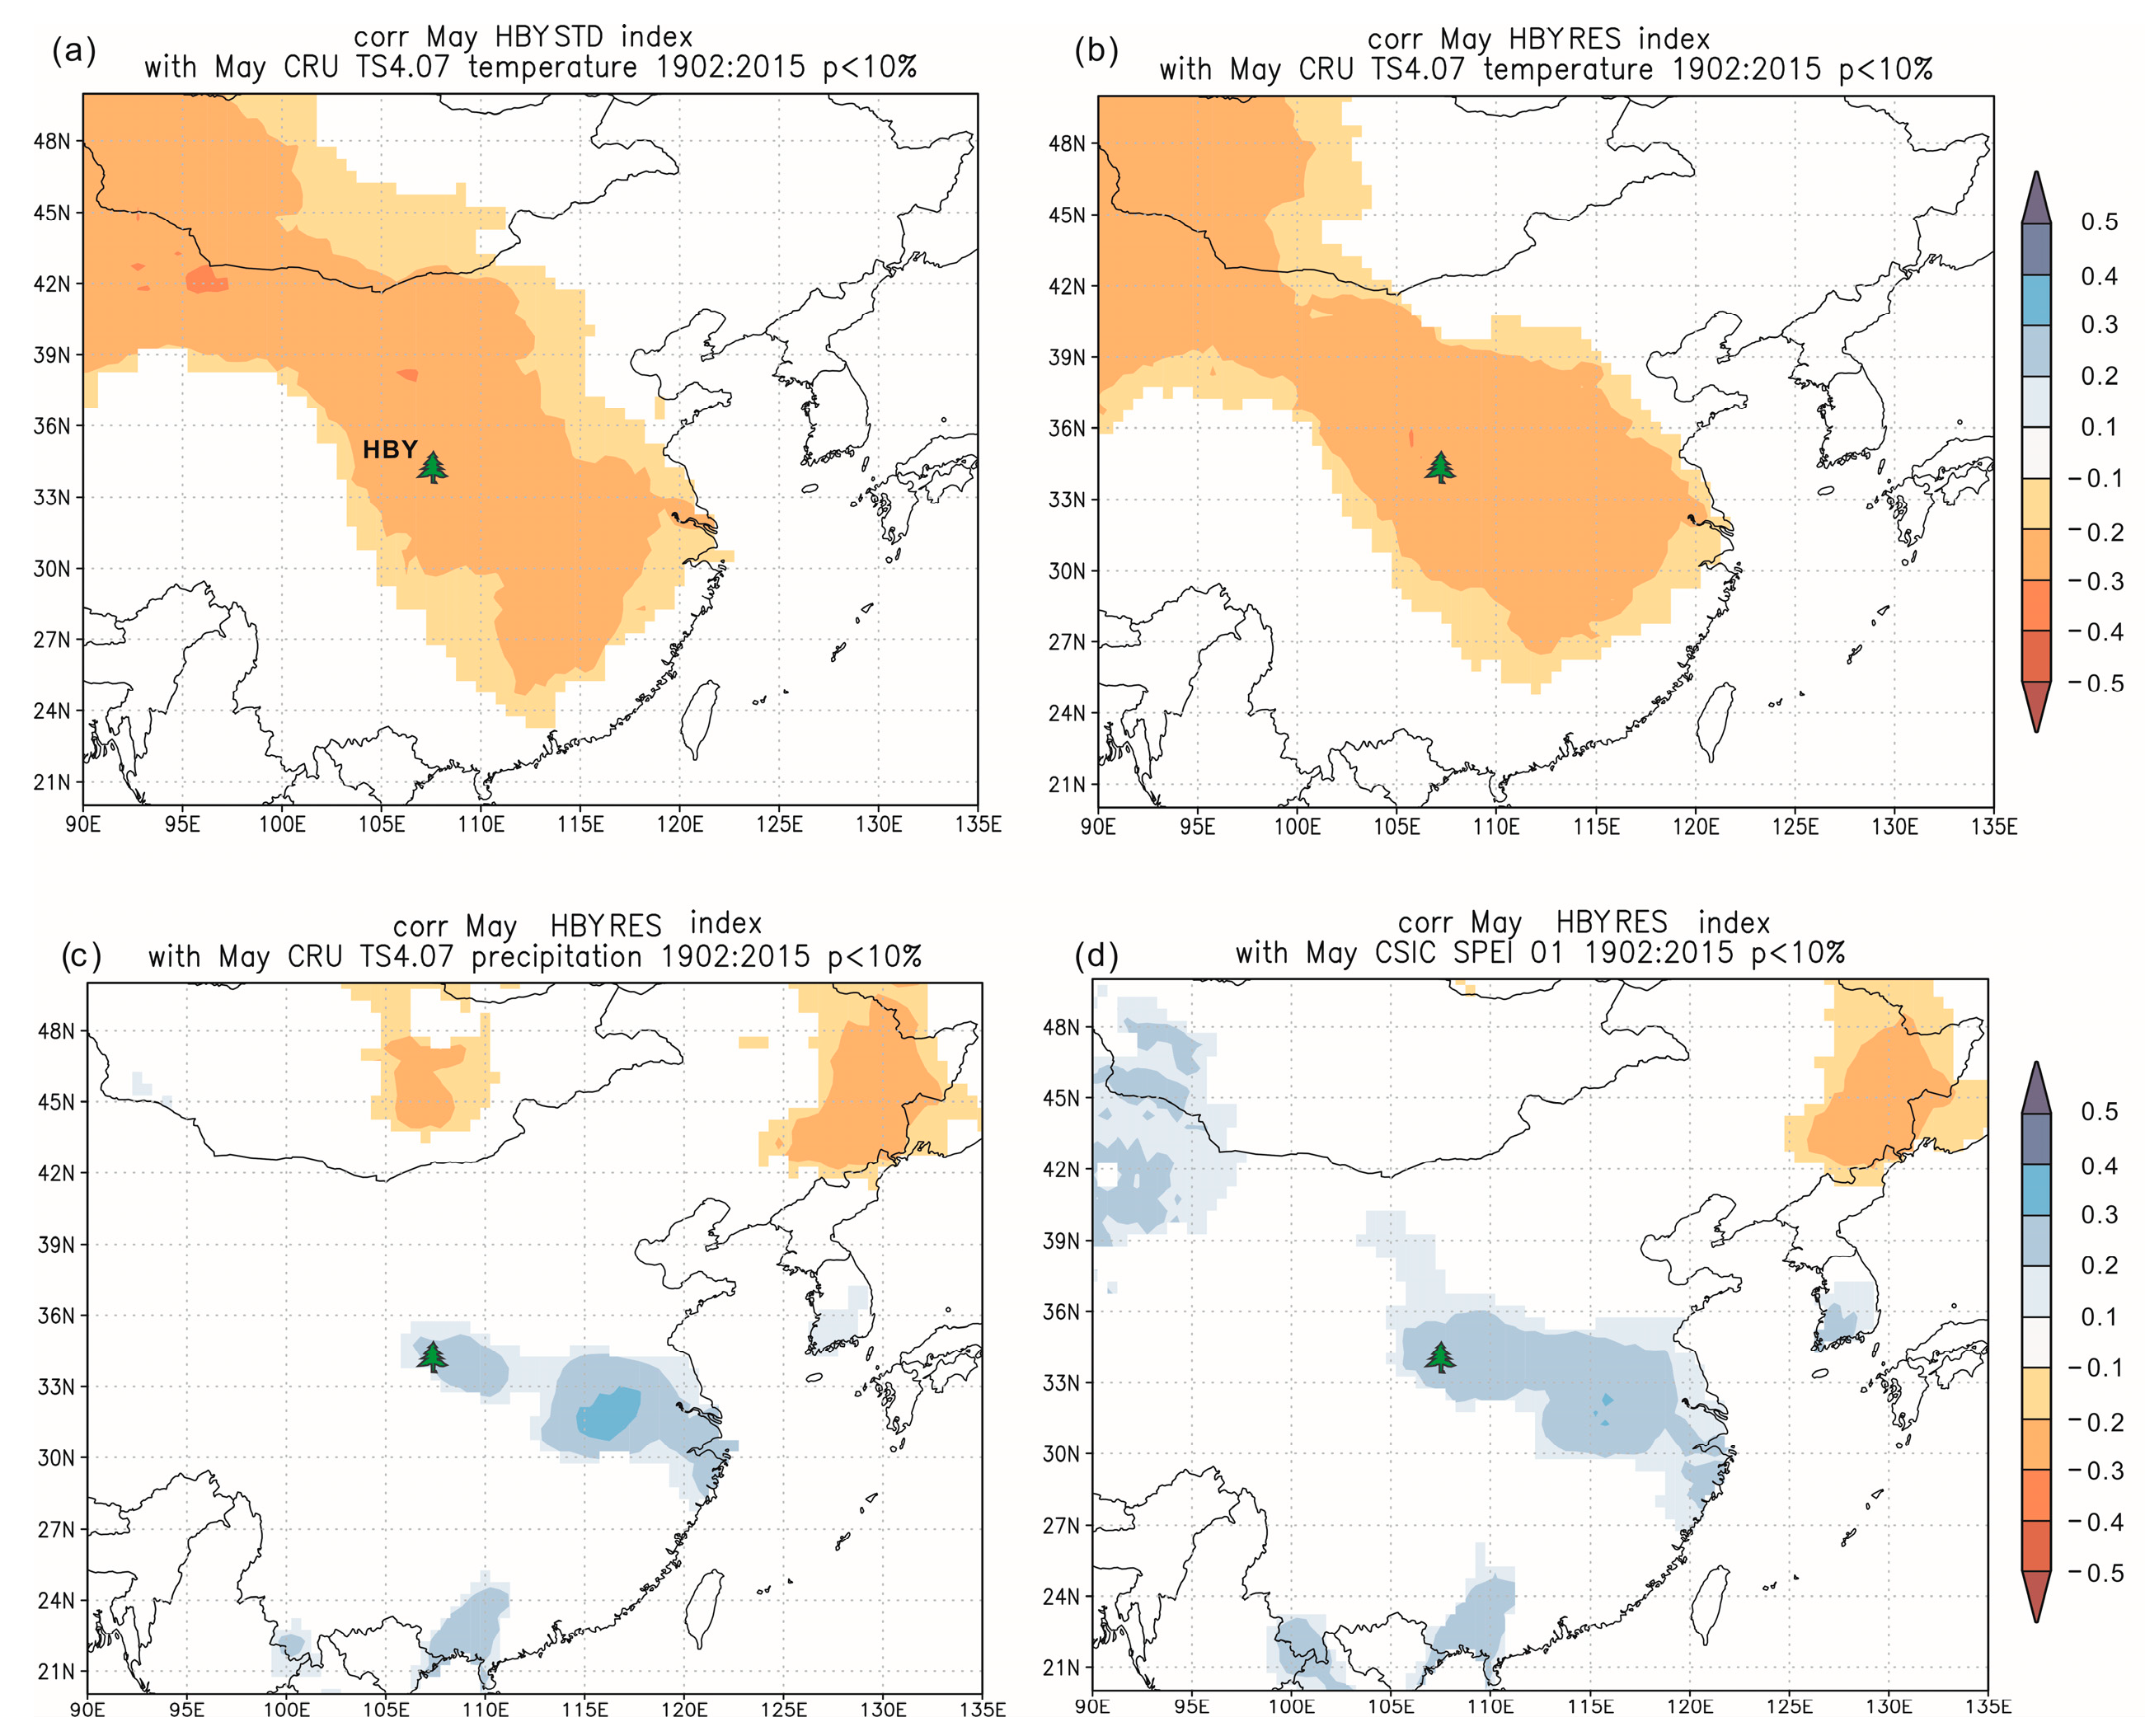
2.2. Meteorological Data and Statistical Methods

Meteorological data were obtained from the China Meteorological Science Data Sharing Service Network (http://data.cma.cn/site/index.html) (accessed on 1 August 2024). Monthly data from the Taibai Meteorological Station (107°19′ E, 34°02′ N, 1543 m above sea level) and the Hanzhong Meteorological Station (107°02′ E, 33°04′ N, 509.5 m above sea level), which are closer to the sampling sites, were selected to represent the climatic characteristics of the southern slope of the central Qinling Mountains, covering the period from 1958 to 2011. Monthly average temperature and precipitation distributions show that the climatic elements of the southern slope of the central Qinling Mountains have similar characteristics of heat and rain in summer (June–August) and cold and dry conditions in winter (December, January–February). July has the highest temperature and precipitation throughout the year, and high temperatures and precipitation concentrate from July to September (Figure 3a). It should be noted that there is a significant difference in elevation between the Hanzhong meteorological station and the NTM site, which may influence the response results between tree rings at NTM and climatic factors. Although similar elevation differences in the climatic response of tree radial growth have been reported on Mountain Taibai [33], that is, by analyzing the temperature and precipitation at the Taibai meteorological station with Larix chinensis at an elevation of 3400–3500 at the top of the Qinling Mountains, the warmth index over the past 300 years have been reconstructed. In this study, we used the average gridded climate data from CRU for the growth climate response analysis for NTM chronology, with a grid range of 107° E–108° E, 33° N–34° N; a resolution of 0.5° × 0.5°; and a period from 1958 to 2011. The selected area covered two meteorological stations and tree-ring sampling sites, including monthly average temperature, maximum temperature, minimum temperature, and monthly precipitation. The characteristics of the gridded climate data changes were almost completely consistent with the meteorological stations (Figure 3b). A previous study on the climate response of A. fargesii near the Qinling South Slope in the study area [14] indicated that CRU data can be used for NTM tree ring analysis. The drought and flood index (DFI) determined by the historical literature reflects the characteristics of hydrological changes in the region under the influence of the East Asian summer monsoon in eastern China [34]. This study selects the drought and flood index from the Xi’an station on the northern slope of the Qinling Mountains and the Hanzhong station on the southern slope for comparative analysis of the dry and wet conditions in extreme years of tree-ring width index. Pearson correlation analysis is used to identify the correlation between climatic factors and tree-ring width index [18]. Since climatic factors from the previous year could have a lagged effect on the growth of trees in the current year, the climate–growth response analysis is conducted for the period from May of the previous year to October of the current year, covering the period from 1958 to 2011. To explore the regional climate change reflected by the current tree rings on the southern slope of the Qinling Mountains, spatial correlation analysis is performed between the HBY chronology and grid data (http://climexp.knmi.nl), including temperature [35], precipitation [35], and the Standardized Precipitation Evapotranspiration Index (SPEI) [36], covering the period from 1902 to 2015. The main oscillation signals in the tree-ring chronology are extracted using the multi-taper method (MTM) [37].

3. Results

The radial growth responses of HBY and NTM to climatic factors are shown in Table 2 and Table 3. Specifically, HBYSTD was significantly negatively correlated with the average temperature in May at the Hanzhong and Taibai stations, with correlation coefficients of −0.348 (p < 0.01) and −0.404 (p < 0.01), respectively. NTMSTD was negatively correlated with the mean maximum temperature in June of the previous year (−0.269, p < 0.05) while positively correlated with maximum temperatures in September (0.368, p < 0.01) and December (0.293, p < 0.05) of the previous year and current September (0.275, p < 0.05), as well as the mean minimum temperature in the current June (0.297, p < 0.05). Significant negative correlations existed between NTMSTD and precipitation in September of the previous and current year (−0.375, p < 0.01; −0.288, p < 0.05), respectively. NTMRES was negatively correlated with the mean temperature (−0.290, p < 0.05) and maximum temperature in July of the previous year (−0.270, p < 0.05). During the current growing season, NTMSTD and NTMRES did not show significant responses to temperature, while the HBYSTD and HBYRES chronologies were significantly negatively correlated with the average temperature from May to June of the current year, especially with the highest correlation at the Taibai meteorological station (−0.358, p < 0.01). The combinations of temperature during the growing season at the Taibai station were all significantly negatively correlated with the HBYSTD chronology (Table 4), while the precipitation combinations generally showed positive correlations, with the highest correlation coefficient 0.267 (p < 0.05) of the total precipitation from May to July of the current year.
Both HBY chronologies were used to perform spatial analysis and extreme value determination. The results showed that the HBYSTD and HBYRES chronologies were significantly negatively correlated with the average temperature in May in most areas of the eastern monsoon region of China (Figure 4a,b), and the NTMRES chronology is significantly positively correlated with the precipitation in May and the Standardized Precipitation Evapotranspiration Index (SPEI) in the Qinling and surrounding areas (Figure 4c,d). Extreme high and low ring-width years could reveal the amplitude and frequency of changes in tree radial growth. In this study, the threshold for determining extreme growth conditions recorded by the HBYSTD chronology is set as the mean ring-width index plus or minus one standard deviation (Mean ± 1SD) (Table 5). From 1902 to 2015, the mean of the HBYSTD chronology width index is 0.971, with a standard deviation of 0.136, and the extreme value ratio is 1.917. The range of extreme high-value years (>1.107) is 1.124–1.338, accounting for 20 years, and the range of extreme low-value years (<0.835) is 0.698–0.831, accounting for 18 years, accounting for 17.5% and 15.8% of the total years, respectively. The drought and flood index (DFI) showed 10 extreme drought years occurred in the low-value years and 7 extreme flood years occurred in the high-value years, accounting for 50% and 39%, respectively (Table 5).
The results of spectral analysis of the multitaper method (MTM) showed that the tree radial growth variation on the southern slope of the central Qinling Mountains had interannual and interdecadal scale fluctuations (Figure 5). The HBYSTD chronology had quasi-periodic signals at 8.33–8.53 years (p < 0.05), 6.13–6.44 years (p < 0.05), 3.89–4.02 years (p < 0.05), and 2.64–2.73 years (p < 0.05); the NTMSTD chronology had signals at 31.95–72.99 years (p < 0.05), 9.84–11.38 years (p < 0.05), 3.50–3.54 years (p < 0.05), 2.59–2.61 years (p < 0.05), and 2.04–2.11 years (p < 0.05).

4. Discussion

4.1. Climate and Tree-Ring Growth Relationship

P. tabuliformis and A. fargesii are typical evergreen coniferous species in the vertical vegetation zones of the Qinling Mountains [11,14]. P. tabuliformis is a widely distributed coniferous species in the low to mid-altitude regions of the Qinling Mountains, primarily growing at elevations ranging from 1000 to 2200 m on the southern slopes. At approximately 1500 m, the vegetation is dominated by P. tabuliformis and Quercus aliena forests, with associated species including Abies chensiensis, Betula albosinensis, and Quercus variabilis [23]. The P. tabuliformis in Huangbaiyuan is mainly distributed in the pine-oak forest belt below 2200 m, characterized by deep soil layer and good drainage, belonging to the montane deciduous broad-leaved forest zone [23]. A. fargesii on the southern slope of Mount Taibai is primarily found on slopes and ridges at elevations of 2500 to 3300 m, often forming pure or mixed forests with Betula albosinensis and Betula platyphylla, belonging to the subalpine coniferous forest zone [24]. The distribution area of A. fargesii forests is predominantly characterized by granite bedrock, with the understory soil mainly consisting of thin layers of dark brown soil. The climatic conditions in this region are cold, humid, and frequently foggy [13]. The radial growth climate response results of these two dominant species could support the scientific management and sustainable utilization of natural forests on the southern slope of the Qinling Mountains [22].
The HBY chronology had a significantly negative correlation with the temperature in May of the growing season (p < 0.05) and a positive correlation with the same period’s precipitation (not significant), indicating that the moisture condition in May was a main factor in the early stage of radial growth of P. tabuliformis. Studies on P. tabuliformis in the northern slope of the Qinling Mountains and the Loess Plateau in northern China showed that precipitation in May of the current year was one of the main factors affecting tree growth, although these studies had different time windows for growth response relationships (Figure 1) [38,39,40,41,42,43]. For example, the TL tree ring chronology from Tianlong Mountain on the eastern Loess Plateau is significantly negatively correlated with the temperature from October of the previous year to September of the current year (p < 0.05), with the highest correlation in May (−0.649, p < 0.01) [42]; the WQ tree ring chronology from Wuqi on the northern Loess Plateau is negatively correlated with the temperature during the growing season, with the highest value appearing in May (p < 0.05) [43]. Similar monthly response patterns are observed in KT from Mount Kongtong on the western Loess Plateau [38], Mount Quiqing (GQ) [39], Mount Xiaolong (XL) [40], and Mount Nanwutai (NWT) [41] on the northern slope of the Qinling Mountains (Figure 1). The growth response of P. tabuliformis at these sites is mainly characterized by a positive response to changes in water conditions during the early stage of the East Asian summer monsoon and the non-monsoon season. The HBY site in this study is located further south and belongs to the subtropical climate. As a non-monsoon period, less precipitation and rapidly rising temperatures in May tend to lead to water deficit; therefore, the drought in May becomes the main limiting factor for P. tabuliformis (Figure 3). The lack of significant response in the HBY chronology to the precipitation during the rainy season from July to September indicates that the abundant water supply during the rainy season fully meets the growth needs of P. tabuliformis (Table 2). However, the NTM A. fargesii chronology shows different response characteristics (Table 3). Figure 3 shows that the precipitation in September is the second-highest monthly precipitation of the year, and this period of precipitation is known as the “Huaxi autumn rain” [44,45], a stable rainfall span appearing in the Qinling Mountains and nearby related to southward movement of the subtropical high in the northwest Pacific in autumn [46,47]. The lower temperature in September leads to reduced evaporation and transpiration, resulting in saturated soil moisture, and this, in turn, restricts root respiratory activity, causing the radial growth of trees to be inhibited. Therefore, the significant negative (positive) correlation of the high-altitude NTMSTD chronology with the precipitation (max temperature) in September of the previous year and the current year supports the strong limiting effect of September precipitation on tree growth (Table 3). The negative correlations between the A. fargesii ring-width chronology and September precipitation have also been reported in the southern slope of the Qinling Mountains [12,13,14]. In the Shennongjia area, the precipitation of the previous September and the current September significantly inhibits the radial growth of A. fargesii [13], while in the Niubeiliang area, the radial growth of A. fargesii is significantly negatively correlated with the precipitation of the current September [14]. This indicates that excessive autumn precipitation has a common limiting effect on the radial growth of A. fargesii on the southern slope of the Qinling Mountains. The significant negative correlations with the max temperature in the previous June (−0.269 for NTMSTD) and mean/max temperature in July of the previous year (−0.290 and −0.270 for NTMRES, Table 3) indicate the influence of insufficient water during the same period. A significant positive correlation between NTMSTD and the minimum temperature in June of the current year (0.297, p < 0.05) suggested that warm nighttime temperatures in the early growing season are beneficial to the radial growth of trees in alpine areas above 3000 m in elevation.
The current results indicate that the response relationship between tree radial growth and climate factors is different in the two sampling sites, but the related effects of more local environmental variables on the growth response model still need in situ monitoring and exploration in the future [48].

4.2. Extreme Events and Regional Hydroclimate

High temperature leads to increased evaporation and transpiration, which in turn causes soil moisture deficits and droughts, especially against the backdrop of the continuous rise in global temperatures [49]. The HBY chronology shows a significant negative correlation with the temperature during the growing season and a positive correlation with precipitation (Table 4), indicating that droughts caused by water stress inhibit tree radial growth, resulting in narrow rings, and conversely, wide rings are produced. Therefore, the extremely wide and narrow years listed in Table 5 could indicate the dry and wet conditions of the growing season in the study area [18]. The extremely narrow year corresponding to the drought-flood index of DF_5, 1927 (<1SD), 1928 (<1SD), and 1929 (<1SD), responded to the historically extreme drought events that occurred in Shaanxi and the surrounding Loess Plateau region [19,50]. This large-scale, persistent, severe drought covered most of the eastern part of northwestern China, resulting in the deaths of millions of people [18,50]. In comparison, the severe drought that occurred around 1928 in Gansu Province, where the tree-ring sites KT, GQ, and XL are located, led to the death of nearly half of the population due to food shortages [18]. This regional extreme drought period in the 1920s was recorded and responded to in the HBY, GQ, XL, and NWT chronologies (Figure 6). Previous tree-ring studies in the central watershed area of the Qinling Mountains, which are sensitive to temperature variations, have shown that the extremely high ring-width index (>1 SD) strongly recorded the regional high-temperature drought events represented by 1927, 1928, and 1929 [16]. The other two dry periods of the 1900s and 1990s–2000s recorded in the tree-ring studies on the northern slope of the Qinling Mountains are also captured by the HBYSTD chronology, reflecting the indicative ability of the HBY P. tabuliformis on the southern slope of the central Qinling Mountains for regional hydroclimatic signals, thereby proving the reliability of the spatial response results of temperature, precipitation, and the Standardized Precipitation Evapotranspiration Index (Figure 4).

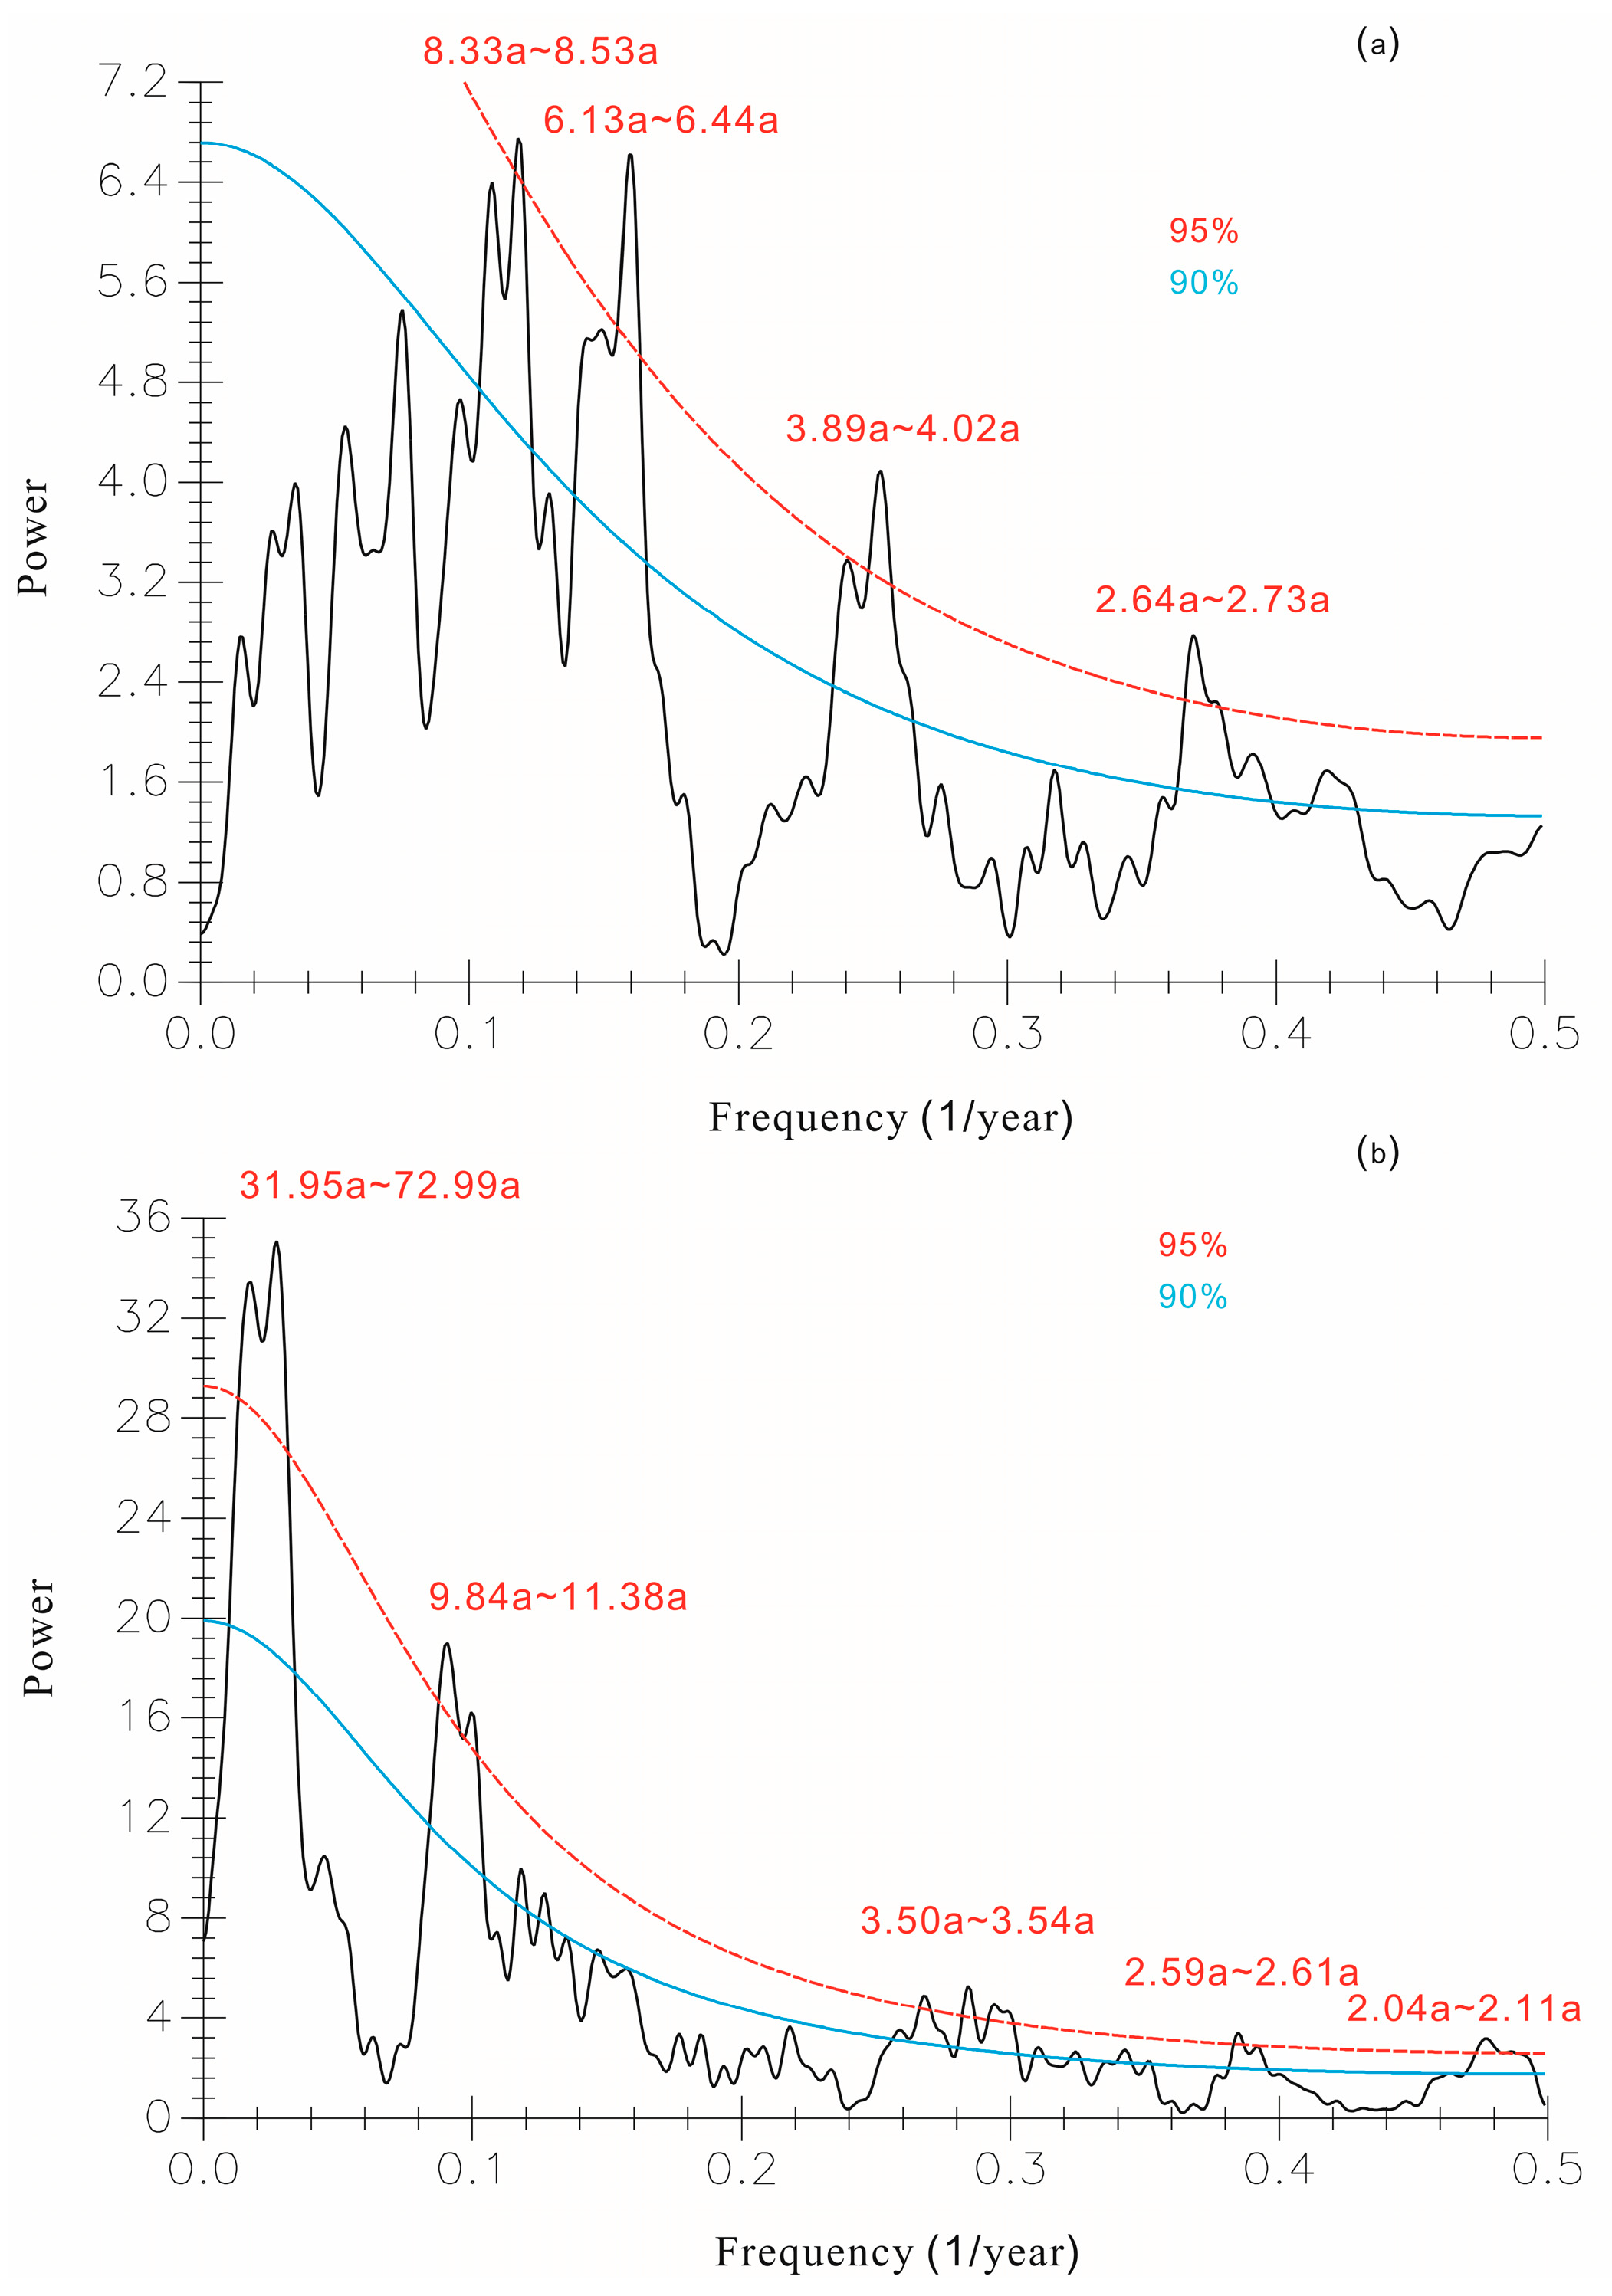
4.3. Periodicity and Large-Scale Climate Forcing

The interannual and multidecadal periodic signals indicate (Figure 5) that the radial growth of trees on the southern slope of the central Qinling Mountains has been influenced by large-scale climate forcing factors. Tree ring studies at comparative sites TL, LT, GQ, XL, and NWT on the northern slope of the Qinling Mountains and the Loess Plateau have all found similar periodic signals. Among them, the 2–8 year signals may reflect the teleconnection influence of ENSO on the hydrological climate of the study area [17,18,19,51]. The signals at frequencies of 31.95 years and 72.99 years may reflect the influence of ocean-atmosphere coupling in key maritime areas of the Pacific and Atlantic, such as the PDO and Atlantic Multidecadal Oscillation (AMO). Recent streamflow reconstruction based on tree-ring width and density in the Wei River basin on the northern slope of the Qinling Mountains for the past 400 years also captures the same periodic signals [18]. Previous research has reported that during the positive phases of ENSO and PDO, North China and surrounding areas tend to have high temperatures, less rainfall, and drought weather, while the opposite phases tend to be wetter conditions [52,53]. There are 7 years of El Niño and La Niña occurring in the years of extreme low and extreme high index years, respectively (Table 5), which to some extent reflects the impact of ENSO variations on the dry and wet conditions of the study area [18,41]. The tripole sea surface temperature mode in the North Atlantic could affect the hydrological and climatic conditions of the northern and southern regions of China by exciting the Eurasian teleconnection pattern [54,55]. Correlation analysis shows that the HBYSTD and NTMSTD chronologies are significantly correlated with the NAO index of the previous November–December and the previous October, with correlation coefficients of 0.220 and 0.202, respectively (n = 116, p < 0.05, 1900–2015), suggesting that the changes in hydrological and climatic elements reflected by the tree growth in central Qinling Mountains have a teleconnection response with the North Atlantic [56].

5. Conclusions

Two new tree-ring width chronologies based on P. tabuliformis and A. fargesii were developed for the southern slope over the central Qinling Mountains. There were differences in the climate-growth response patterns between both two tree species. The P. tabuliformis chronology responded to the climatic factors at the beginning of the growing season (May), while the A. fargesii chronology responded to the precipitation at the end of the previous year and the current year’s growing season (September), as well as the hydrological and climatic factors of the previous growing season. The radial growth of P. tabuliformis could reflect regional extreme dry and wet events and had a certain representativeness of regional climate change. Both chronologies contained interannual and multidecadal periodic signals, indicating that the hydrological and climatic changes in the central Qinling Mountains were teleconnected with the atmospheric drivers of key oceanic areas, such as ENSO, PDO, and NAO.

Author Contributions

Conceptualization, Q.C., G.B. and N.L.; data curation, Q.C., G.B., N.L., X.C., Y.W., K.H., W.Z. and G.W.; formal analysis, Q.C., G.B., N.L., X.C., Y.W., K.H., W.Z. and G.W.; funding acquisition, Q.C., G.B., N.L., X.C., Y.W. and N.L.; investigation, Q.C., G.B., N.L., X.C., Y.W., K.H., W.Z. and G.W.; methodology, G.B., N.L., Y.W. and Q.C.; project administration, Q.C. and G.B.; supervision, X.C., Y.W., K.H., W.Z. and G.W.; writing—original draft, Q.C., G.B. and N.L.; writing—review and editing, Q.C., G.B., N.L., X.C., Y.W., K.H., W.Z. and G.W. All authors have read and agreed to the published version of the manuscript.

Funding

This work was supported by Commonweal Geological Survey Project of Shaanxi Province (202310 to Q.C.; 202519 to X.C.); Shaanxi Provincial Key Research and Development Plan General Project-Social Development Field (2024SF-YBXM-561 to Q.C.); the Shaanxi High-Level Talents Special Support Program: Regional Development Talent to G.B.; the Shaanxi Province Natural Science Basic Research Program-Youth Project (2023-JC-QN-0298 to X.C.); the Opening Fund of State Key Laboratory of Loess and Quaternary Geology (SKLLQG2209 to X.C.; SKLLQG2420, 2109 to G.B.; SKLLQG 2031 to N.L.); as well as supported by Hebei Natural Science Foundation (D2024108002 to Y.W.). This work is a contribution of the Innovation Team of Hydroclimatic Change and Ecological Environment of Weihe River Basin (No. 05).

Data Availability Statement

The data that support the findings on this study are not openly available and are available from the corresponding author upon reasonable request.

Acknowledgments

We thank Keyan Fang, Feng Chen, Yafei Hu, Yong Qu, and Shuangxi Li for their great help and support. We acknowledge the reviewers for their constructive comments to improve the manuscript.

Conflicts of Interest

The authors declare no conflicts of interest.

References

  1. Physical Geography in China Editorial Board of Chinese Academy of Sciences. Physical Geography in China: Introduction; Science Press: Beijing, China, 1985. [Google Scholar]
  2. Kang, M.Y.; Zhu, Y. Discussion and analysis on the geo-ecological boundary in Qinling Range. Acta Ecol. Sin. 2007, 27, 2774–2784. [Google Scholar]
  3. Miao, Q.L.; Ding, Y.Y.; Wang, Y. Impact of climate warming on the northern boundary of subtropical zone of China. Geogr. Res. 2009, 28, 634–642. [Google Scholar]
  4. Zhou, Q.; Dian, J.J.; Zhen, J.Y. Variation of Air Temperature and Thermal Resources in the Northern and Southern Regions of the Qinling Mountains from 1951 to 2009. Acta Geogr. Sin. 2011, 66, 1211–1218. [Google Scholar]
  5. Ding, M.; Huang, C.C. The influence of climatic warming on fruit produce in northern foot of Qinling Mountain. J. Nat. Resour. 2003, 18, 235–239. [Google Scholar]
  6. Ji, L.; Duan, K.Q. What is themain driving force of hydrological cycle variations in the semiarid and semi-humid Weihe River Basin, China? Sci. Total Environ. 2019, 684, 254–264. [Google Scholar] [CrossRef]
  7. Bradley, R.S. High-Resolution Paleoclimatology; Hughes, M.K., Swetnam, T.W., Diaz, H.F., Eds.; Springer: Dordrecht/Heidelberg, Germany; London, UK; New York, NY, USA, 2010. [Google Scholar]
  8. Shao, X.M.; Wu, X.D. Tree-ring chronologies for Pinus Armandi Franch from Huanshan, China. Acta Geogr. Sin. 1994, 49, 174–181. [Google Scholar]
  9. Hughes, M.K.; Wu, X.D.; Shao, X.M.; Garfin, G.M. A preliminary reconstruction of rainfall in North-Central China since AD1600 from tree-ring density and width. Quat. Res. 1994, 42, 88–99. [Google Scholar] [CrossRef]
  10. Chen, F.; Zhang, R.; Wang, H.; Qin, L.; Yuan, Y. Updated precipitation reconstruction (AD 1482–2012) for Huashan, north-Central China. Theor. Appl. Climatol. 2016, 123, 723–732. [Google Scholar] [CrossRef]
  11. Liu, Y.; Linderholm, H.W.; Song, H.; Cai, Q.; Tian, Q.; Sun, J.; Chen, D.; Simelton, E.; Seftigen, K.; Tian, H.; et al. Temperature variations recorded in Pinus tabulaeformis tree rings from the southern and northern slopes of the central Qinling Mountains, central China. Boreas 2009, 38, 285–291. [Google Scholar] [CrossRef]
  12. Dang, H.; Jiang, M.; Zhang, Q.; Zhang, Y. Growth responses of subalpine fir (Abies fargesii) to climate variability in the Qinling Mountain, China. For. Ecol. Manag. 2007, 240, 143–150. [Google Scholar] [CrossRef]
  13. Hu, Z.S.; Zheng, Y.H.; Lu, C.Y.; Su, Q.H. Effect of Window Width on Relationship between Tree Radial Growth and Climatic Elements. J. Northeast For. Univ. 2023, 51, 40–42, 49. [Google Scholar]
  14. Qin, J.; Bai, H.Y.; Zhao, P.; Yang, N.J.; Yue, J.W. Age-dependent response of Abies fargesii tree radial growth to climatic factors in the Qinling Mountains. Acta Ecol. Sin. 2022, 42, 7167–7176. [Google Scholar]
  15. Liu, Y.; Liu, N.; Song, H.M.; Cai, Q.F.; Bao, G.; Wang, W.P. Reconstructed mean air temperature from January to July at the divide sampling site in the Mid-Qinling Mountains with tree-ring widths. Adv. Clim. Change Res. 2009, 5, 260–265. [Google Scholar]
  16. Liu, N.; Liu, Y.; Zhou, Q.; Bao, G. Droughts and broad-scale climate variability reflected by temperature-sensitive tree growth in the Qinling Mountains, central China. Int. J. Biometeorol. 2013, 57, 169–177. [Google Scholar] [CrossRef]
  17. Hu, Y.F.; Bao, G.; Liu, N.; Qu, Y. May–July mean minimum temperature variability in the mid-Qinling Mountains, central China, since 1814 CE. Quat. Int. 2018, 476, 102–109. [Google Scholar] [CrossRef]
  18. Bao, G.; Liu, N.; Wu, M.; Liu, Z. Streamflow variability in the past four centuries for the largest tributary of the Yellow River and its teleconnection with large-scale climate forcing. Int. J. Climatol. 2022, 42, 4460–4476. [Google Scholar] [CrossRef]
  19. Sun, C.F.; Liu, Y. Tree-ring-based drought variability in the eastern region of the Silk Road and its linkages to the Pacific Ocean. Ecol. Indic. 2019, 96, 421–429. [Google Scholar] [CrossRef]
  20. Li, J.Y.; Fu, B.J.; Sun, J.L.; Hong, Z.L.; Zhang, B.P.; Wang, X.F.; Bai, H.Y.; Wang, F.; Zhao, Z.B.; Cao, X.S. Ecological civilization construction at Qinling Mountains in the New Era. J. Nat. Resour. 2021, 36, 2449–2463. [Google Scholar] [CrossRef]
  21. Zhang, B.P. Ten major scientific concerning the study of China’s north-south transitional zone. Prog. Geogr. 2019, 38, 305–311. [Google Scholar]
  22. Ma, X.P.; Bai, H.Y.; Guo, S.; Deng, C.H.; Han, S.S. Verification of temperature vertical lapse rate and mountain climate characteristics of Taibai Mountains in Qinling Mountains. J. Arid Land Resour. Environ. 2017, 31, 139–144. [Google Scholar]
  23. Yang, Y.R.; Zhang, M.S.; Zhang, L.N.; Lu, Q.Q.; Hong, Y.X.; Liu, X.H. Different responses of radial growth of Pinus tabuliformis to climate in the middle and western Qinling Mountains. Acta Ecologica Sinica 2022, 42, 1474–1486. [Google Scholar]
  24. Yang, Z.R.; Zhang, J.P. Species Diversity of Abies fargesii Natural Forest Community in Mt. Taibai of Qinling. J. Northwest For. Univ. 2023, 38, 140–146. [Google Scholar]
  25. Li, G.C.; Song, H.D.; Li, Q.; Bu, S.H. Spatial point pattern analysis of main trees and flowering Fargesia qinlingensis in Abies fargesii forests in Mt. Taibai of the Qinling Mountains, China. Chin. J. Appl. Ecol. 2017, 28, 3487–3493. [Google Scholar]
  26. Chen, Y.P. Significance and strategies on the ecological civilization construction at Qinling Mountains. J. Earth Environ. 2019, 10, 1–11. [Google Scholar]
  27. Li, K.F.; Gong, B.; Wu, Y. Ecological protection and ecological civilization construction in Qinling Mountains. China Ecol. Civiliz. 2021, 3, 40–42. [Google Scholar]
  28. Fritts, H.C. Tree-Rings and Climate; Academic Press: London, UK, 1976. [Google Scholar]
  29. Holmes, R.L. Computer-assisted quality control in tree-ring dating and measurement. Tree Ring Bull. 1983, 43, 69–95. [Google Scholar]
  30. Cook, E.R.; Kairiukstis, L.A. Methods of Dendrochronology: Applications in the Environmental Sciences; Kluwer Academic Publishers: Boston, MA, USA, 1990. [Google Scholar]
  31. Wu, X.D.; Shao, X.M. A study on the reliability of tree-ring data-an example of Huashan Pine from Shaanxi. Prog. Geogr. 1997, 16, 51–56. [Google Scholar]
  32. Linderholm, H.W.; Seima, A.; Ou, T.H.; Jeong, J.H.; Liu, Y.; Wang, X.C.; Bao, G.; Folland, C. Exploring teleconnections between the summer NAO (SNAO) and climate in East Asia over the last four centuries—A tree-ring perspective. Dendrochronologia 2013, 13, 297–310. [Google Scholar] [CrossRef]
  33. Dai, J.H.; Shao, X.M.; Cui, H.T.; Ge, Q.S.; Liu, H.Y.; Tang, Z.Y. Reconstruction of past eco-climate by tree-ring width index of Larix Chinensis on Mt. Taibai. Quat. Sci. 2003, 23, 428–435. [Google Scholar]
  34. Chinese Academy of Meteorological Sciences. Yearly Charts of Dryness/Wetness in China for the Last 500-Year Period; SinoMaps Press: Beijing, China, 1981. [Google Scholar]
  35. Mitchell, T.D.; Jones, P.D. An improved method of constructing a database of monthly climate observations and associated high resolution grids. Int. J. Climatol. 2005, 25, 693–712. [Google Scholar] [CrossRef]
  36. Vicente-Serrano, S.M.; Beguería, S.; Lopez-Moreno, J.I. A multiscalar drought index sensitive to global warming: The standardized precipitation evapotranspiration index-SPEI. J. Clim. 2010, 23, 1696–1718. [Google Scholar] [CrossRef]
  37. Mann, M.E.; Lees, J. Robust estimation of background noise and signal detection in climatic time series. Clim. Change 1996, 33, 409–445. [Google Scholar] [CrossRef]
  38. Fang, K.Y.; Gou, X.H.; Chen, F.H.; Liu, C.Z.; Davi, N.; Li, J.B.; Zhao, Z.Q.; Li, Y.J. Tree-ring based reconstruction of drought variability (1615–2009) in the Kongtong Mountain area, northern China. Glob. Planet. Change 2012, 80–81, 190–197. [Google Scholar] [CrossRef]
  39. Fang, K.Y.; Gou, X.H.; Chen, F.H.; D’Arrigo, R.; Li, J.B. Tree-ring based droughtreconstruction for the Guiqing Mountain (China): Linkages to the Indian and Pacific Oceans. Int. J. Climatol. 2010, 30, 1137–1145. [Google Scholar] [CrossRef]
  40. Fang, K.Y.; Gou, X.H.; Chen, F.H.; David, F.; Liu, C.Z.; Li, J.B.; Miklos, K. Precipitation variability during the past 400 years in the Xiaolong Mountain(central China) inferred from tree rings. Clim. Dyn. 2012, 39, 1697–1707. [Google Scholar] [CrossRef]
  41. Liu, N.; Bao, G.; Liu, Y.; Linderholm, H.W. Two centuries-long streamflow reconstruction inferred from tree rings for the middle reaches of the Weihe River in Central China. Forests 2019, 10, 208. [Google Scholar] [CrossRef]
  42. Li, Y.J.; Wang, S.Y.; Niu, J.J.; Fang, K.Y.; Chao, Y.; Li, X.L.; Li, Y.H. Tree-ring-based reconstruction of drought variability (1792–2011) in the middle reaches of the Fen River, North China. Dendrochronologia 2016, 40, 1–11. [Google Scholar] [CrossRef]
  43. Liang, F.F.; Zhu, Q.K.; Wang, L.L.; Li, P.; Zheng, X.L.; Zhao, Y.M. Influence of climate factors on radial growth of Pinus tabulaeformis in loess area of Northern Shaanxi. J. Northwest AF Univ. (Nat. Sci. Ed.) 2015, 43, 33–41. [Google Scholar]
  44. Tang, M.L.; Xiao, C.; Yuan, W.H. Comparative analysis of hourly features of precipitation in the north and south areas of Qinling Mountains. Torrential Rain Disasters 2022, 41, 24–32. [Google Scholar]
  45. Zhang, C.; Wang, Z.Y.; Zhou, B.T.; Li, Y.H.; Tang, H.Y.; Xiang, B. Trends in autumn rain of West China from 1961 to 2014. Theor. Appl. Climatol. 2019, 135, 533–544. [Google Scholar] [CrossRef]
  46. Wei, T.; He, S.P.; Yan, Q.; Dong, W.J.; Wen, X.H. Decadal shift in West China autumn precipitation and its association with sea surface temperature. J. Geophys. Res. Atmos. 2018, 123, 835–847. [Google Scholar] [CrossRef]
  47. Liu, X.D.; Fang, J.G.; Yang, X.C.; Li, X.Z. Climatology of dekadly precipitation around the Qinling mountains and characteristics of its atmospheric circulation. Arid Meteorol. 2023, 21, 8–13. [Google Scholar]
  48. Gao, J.; Yang, B.; He, M.; Shishov, V. Intra-annual stem radial increment patterns of Chinese pine, Helan Mountains, northern central China. Trees 2019, 33, 751–763. [Google Scholar] [CrossRef]
  49. Yi, L.; Yu, H.J.; Ge, J.Y.; Lai, Z.P.; Xu, X.Y.; Qin, L.; Peng, S.Z. Reconstructions of annual summer precipitation and temperature in north-Central China since 1470 AD based on drought/flood index and tree-ring records. Clim. Change 2012, 110, 469–498. [Google Scholar] [CrossRef]
  50. Liang, E.; Liu, X.; Yuan, Y.; Qin, N.; Fang, X.; Huang, L.; Zhu, H.; Wang, L.; Shao, X. The 1920s drought reconstructed by tree rings and historical documents in the semi-arid and arid areas of northern China. Clim. Change 2006, 79, 403–432. [Google Scholar] [CrossRef]
  51. Liu, Z.; Menzel, L.; Dong, C.; Fang, R. Temporal dynamics and spatial patterns of drought and the relation to ENSO: A case study in Northwest China. Int. J. Climatol. 2016, 36, 2886–2898. [Google Scholar] [CrossRef]
  52. Zhang, R.H.; Min, Q.Y.; Su, J.Z. Impact of El Niño on atmospheric circulations over East Asia and rainfall in China: Role of the anomalous western North Pacific anticyclone. Sci. China Earth Sci. 2017, 60, 1124–1132. [Google Scholar] [CrossRef]
  53. Qian, C.; Zhou, T. Multidecadal variability of North China aridity and its relationship to PDO during 1900–2010. J. Clim. 2014, 27, 1210–1222. [Google Scholar] [CrossRef]
  54. Peng, Y. Simulated interannual teleconnection between the summer North Atlantic oscillation and summer precipitation in eastern China during the last millennium. Geophys. Res. Lett. 2018, 45, 7741–7747. [Google Scholar] [CrossRef]
  55. Li, J.P.; Ruan, C.Q. The North Atlantic–Eurasian teleconnection in summer and its effects on Eurasian climates. Environ. Res. Lett. 2018, 13, 024007. [Google Scholar] [CrossRef]
  56. Li, J.P.; Wang, J.X. A new North Atlantic oscillation index and its variability. Adv. Atmos. Sci. 2003, 20, 661–676. [Google Scholar]
Figure 1. Tree-ring sites (HBY: white tree; NTM: grey tree used in this study, yellow tree for comparison and discussion), stations of meteorology (yellow star), and drought and flood index (red cycle).
Forests 16 00232 g001
Figure 2. Tree-ring width standard chronology and residual chronology of (a) Huangbaiyuan (HBY) and (b) Nantianmen (NTM) and sample depth.
Forests 16 00232 g002
Figure 3. (a) Monthly mean temperature (circles) and precipitation (bars) from Taibai (red circle, blue bar) and Hanzhong (purple circle, green cross bar) meteorological station (1958–2011). (b) The same for CRU grid data (red dot: the max temperature; black square: the average temperature; purple triangle: the minimum temperature; black bar: monthly precipitation).
Forests 16 00232 g003
Figure 4. Spatial correlations between Huangbaiyuan chronology and the grid dataset of (a) temperature vs. HBYSRD, (b) temperature vs. HBYRES, (c) May precipitation vs. HBYRES, and (d) SPEI vs. HBYRES on the 1 month scale during the period 1902–2015 (p < 0.1). (HBY marked by a green tree).
Forests 16 00232 g004
Figure 5. Cycles for (a) Huangbaiyuan standard chronology (HBYSTD) and (b) Nantianme standard chronology (NTMSTD).
Forests 16 00232 g005
Figure 6. Comparisons of tree-ring records in the central Qinling Mountains (a) GQSTD [39], (b) XLSTD [40], (c) NWTSTD [41], and (d) HBYSTD (this study). The bold line represents the 20-year low pass data. The grey-shaded areas represent severe dry intervals discussed in text.
Forests 16 00232 g006
Table 1. Statistical characteristics of the Huangbaiyuan (HBY) and Nantianmen (NTM) chronologies.
StatisticsTree-Ring Width Chronology
HBYSTDHBYRESNTMSTDNTMRES
Mean value0.9760.9910.9850.993
Standard deviation (SD)0.1570.1540.1790.145
Mean sensitivity (MS)0.1470.1800.1330.170
Serial correlation0.323−0.1420.548−0.061
Signal-to-noise ratio (SNR)2.8998.6215.7078.127
Expressed population signal (EPS)0.7440.8960.8510.890
Variance of the first eigenvector (%)22.50030.70047.40051.800
Length of chronology127127168168
Table 2. Correlations between Huangbaiyuan (HBY) chronologies and climatic factors.
MonthHBYSTD vs. ThzHBYSTD vs. PhzHBYSTD vs. TtbHBYSTD vs. PtbHBYRES vs. ThzHBYRES vs. PhzHBYRES vs. TtbHBYRES vs. Ptb
P5−0.1770.065−0.2210.0940.0050.0630.0060.085
P6−0.086−0.033−0.2470.069−0.058−0.155−0.164−0.079
P7−0.0300.009−0.068−0.001−0.007−0.012−0.070−0.151
P8−0.2150.168−0.2710.187−0.2010.143−0.1980.180
P9−0.107−0.100−0.136−0.089−0.0600.006−0.015−0.096
P10−0.151−0.170−0.218−0.164−0.182−0.155−0.142−0.211
P110.086−0.1110.033−0.058−0.012−0.133−0.039−0.075
P120.031−0.0050.119−0.1490.0930.0710.194−0.126
C10.1010.293 *0.063−0.0570.1980.2560.063−0.095
C20.0770.1260.0990.0380.0460.0640.1060.100
C3−0.0430.118−0.0380.123−0.0120.0610.0150.056
C40.147−0.204−0.009−0.1440.253−0.1030.170−0.052
C5−0.348 **0.043−0.404 **0.034−0.369 **0.075−0.402 **0.116
C6−0.0320.103−0.1360.199−0.0060.026−0.1080.194
C7−0.040−0.027−0.0120.2360.061−0.0660.1460.101
C8−0.0650.012−0.1320.001−0.024−0.108−0.030−0.178
C9−0.047−0.206−0.224−0.0460.002−0.126−0.1620.046
C10−0.005−0.050−0.2070.0890.138−0.061−0.0430.066
Note: * p< 0.05, ** p< 0.01; P indicates previous year, C indicates current year; Thz and Phz are the mean monthly temperature and the sum of monthly precipitation for Hanzhong meteorological station, while Ttb and Ptb for Taibai meteorological station (1958–2011).
Table 3. Correlations between Nantianmen (NTM) chronologies and CRU climatic factors.
MonthNTMSTDNTMRES
TTmaxTminPTTmaxTminP
P5−0.025−0.015−0.0350.0590.004−0.0400.0800.141
P6−0.120−0.269 *0.226−0.002−0.222−0.251−0.015−0.017
P7−0.121−0.1760.0200.028−0.290 *−0.270 *−0.176−0.098
P8−0.0770.005−0.190−0.079−0.0310.044−0.158−0.103
P90.1990.368 **−0.162−0.375 **0.0600.219−0.184−0.173
P100.1580.1360.1060.0480.1340.195−0.0020.015
P11−0.020−0.1040.094−0.057−0.044−0.1530.1100.104
P120.2580.293 *0.175−0.0140.1870.1910.163−0.060
C10.1150.0530.158−0.0730.055−0.0320.157−0.174
C20.1760.2390.047−0.1180.0800.1050.026−0.090
C30.0330.075−0.0450.010−0.048−0.031−0.063−0.008
C40.0390.0330.031−0.0680.1480.1550.0830.005
C5−0.0740.004−0.182−0.0780.0380.081−0.064−0.036
C60.094−0.0600.297 *−0.051−0.054−0.1000.064−0.226
C70.1560.0800.1910.133−0.063−0.0990.0130.150
C8−0.106−0.064−0.128−0.0080.0610.0680.014−0.120
C90.2320.275 *0.002−0.288 *0.2490.2110.113−0.126
C100.1230.0060.1940.0300.111−0.0320.2200.124
Note: * p< 0.05, ** p< 0.01; P indicates previous year, C indicates current year; T: the average temperature; Tmax: the max temperature; Tmin: the minimum temperature; P: monthly precipitation (1958–2011).
Table 4. Correlations between chronologies of Huangbaiyuan (HBY) and climatic factors on seasonal scales.
Climate FactorHBYSTDClimate FactorHBYRES
MonthThzPhzTtbPtbMonthThzPhzTtbPtb
C5C6−0.275 *0.098−0.358 **0.162C5C6−0.275 *0.065−0.343 *0.206
C5C7−0.2160.045−0.290 *0.267 *C5C7−0.170−0.003−0.2180.198
C5C8−0.2030.041−0.281 *0.199C5C8−0.148−0.057−0.1860.032
C5C9−0.197−0.056−0.314 *0.149C5C9−0.132−0.105−0.2120.047
C5C10−0.176−0.066−0.328 *0.157C5C10−0.072−0.117−0.1920.057
Note: * p < 0.05, ** p < 0.01; C5C6 indicates the average value of May and June in the current year; Thz and Phz for Hanzhong meteorological station, while Ttb and Ptb for Taibai meteorological station (1958–2011).
Table 5. Extreme events inferred from Huangbaiyuan standard chronology (HBYSTD) and drought and flood index (DF index).
RankYearExtreme Low IndexDeviationDF IndexYearExtreme High IndexDeviationDF Index
11903 a0.831−0.004 19061.1480.041DF_2
21919 a0.748−0.087DF_419141.2780.171DF_2
31920 a0.698−0.137DF_419331.1370.03DF_1
419270.82−0.015DF_51934 b1.1270.02DF_1
519280.788−0.047DF_519351.140.033DF_2
619290.814−0.021DF_519421.3170.21
719500.807−0.028DF_41946 b1.2990.192
819550.81−0.025 19541.1260.019
919630.778−0.057 1959 b1.2540.147
101965 a0.79−0.045 1960 b1.1860.079
111968 a0.821−0.014 1974 b1.180.073
121969 a0.743−0.092DF_41975 b1.1240.017
1319700.814−0.021DF_419791.1290.022
141976 a0.702−0.133DF_419801.1440.037DF_1
1519950.766−0.069DF_51990 b1.2170.11
1620030.733−0.102 19911.1270.02DF_2
1720040.829−0.006 19931.3380.231
1820100.767−0.068 20061.1370.03
1920110.824−0.011
2020140.753−0.082
Note: Five grades of DF_1: very wet, DF_2: wet, DF_3: normal, DF_4: dry, and DF_5: very dry. a The El Niño year. b The La Nina year.
Disclaimer/Publisher’s Note: The statements, opinions and data contained in all publications are solely those of the individual author(s) and contributor(s) and not of MDPI and/or the editor(s). MDPI and/or the editor(s) disclaim responsibility for any injury to people or property resulting from any ideas, methods, instructions or products referred to in the content.

